Article

Estimating Ecological Responses to Climatic Variability on Reclaimed and Unmined Lands Using Enhanced Vegetation Index

1
School of Water Resources and Environment, China University of Geosciences (Beijing), 29 Xueyuan Road, Haidian District, Beijing 100083, China
2
School of Design and the Built Environment, Curtin University, Perth 6102, Australia
3
School of Land Science and Technology, China University of Geosciences (Beijing), 29 Xueyuan Road, Haidian District, Beijing 100083, China
4
Centre for Landscape and Climate Research, School of Geography, Geology and the Environment, University of Leicester, University Road, Leicester LE1 7RH, UK
5
National Centre for Earth Observation, University of Leicester, University Road, Leicester LE1 7RH, UK
6
Key Laboratory of Land Consolidation and Land Rehabilitation, Ministry of Natural Resources, Beijing 100035, China
7
Technology Innovation Centre for Ecological Restoration in Mining Areas, Ministry of Natural Resources, Beijing 100083, China
*
Author to whom correspondence should be addressed.
Remote Sens. 2021, 13(6), 1100; https://doi.org/10.3390/rs13061100
Submission received: 28 January 2021 / Revised: 24 February 2021 / Accepted: 11 March 2021 / Published: 13 March 2021

Abstract

:
Climatic impact on re-established ecosystems at reclaimed mined lands may have changed. However, little knowledge is available about the difference in vegetation–climate relationships between reclaimed and unmined lands. In this study, ecological responses to climatic variability on reclaimed and neighbouring unmined lands were estimated using remote-sensing data at the Pingshuo Mega coal mine, one of the largest coal mines with long-term reclamation history in China. Time-series MODIS enhanced vegetation index (EVI) data and meteorological data from 1997 to 2017 were collected. Results show significantly different vegetation–climate relationships between reclaimed and unmined lands. First, the accumulation periods of all climatic variables were much longer on reclaimed mining lands. Second, vegetation on reclaimed lands responded to variabilities in temperature, rainfall, air humidity, and wind speed, while undisturbed vegetation only responded to variabilities of temperature and air humidity. Third, climatic variability made a much higher contribution to EVI variation on reclaimed land (20.0–46.5%) than on unmined land (0.7–1.7%). These differences were primarily caused by limited ecosystem resilience, and changed site hydrology and microclimate on reclaimed land. Thus, this study demonstrates that the legacy effects of surface mining can critically change on-site vegetation–climate relationships, which impacts the structure, functions, and stability of reclaimed ecosystems. Vegetation–climate relationships of reclaimed ecosystems deserve further research, and remote-sensing vegetation data are an effective source for relevant studies.

1. Introduction

Surface mining is an unstoppable anthropogenic force for global land-use change driven by modern society’s dependence on mineral resources [1]. It destroys or disturbs biotic communities, and soil and rock strata overlying mineral deposits, leaving profound adverse impacts on the local and surrounding ecosystems. A vast global area is thus destroyed, and this anthropogenic footprint is growing. Taking mainland China as an example, the cumulative area disturbed by mining activities was 3.48 × 10⁴ km2 by the end of 2016, and this number grew to 3.90 × 10⁴ km2 by the end of 2017 [2], which was equivalent to 69.4% of all built-up areas in China in the same year [3]. To restore these destructed lands, land reclamation or rehabilitation measures are legally compulsory in many countries, and re-establishing or restoring stable and self-sustaining ecosystems on postmining lands is a common requirement [4,5,6].
With the accumulated evidence from remote-sensing data and the knowledge of the impact of climate change on terrestrial ecosystems [7,8,9,10], there has been growing concern about the uncertain impact of future climatic conditions on re-established ecosystems by land reclamation or rehabilitation (reclaimed ecosystems; e.g., [11,12,13]). Increasingly, reclamationists realise that future climatic impacts should be taken into account in reclamation planning [14,15,16,17,18]. A key step towards predicting future climatic impacts on reclaimed ecosystems and designing stable reclaimed ecosystems under future climatic conditions is to identify and quantify climatic drivers of these ecosystems. In recent decades, studies using remote-sensing data explored the vegetation–climate relationships of natural ecosystems at different regions and scales [19,20,21,22,23]. However, those reclaimed ecosystems have scarcely been studied.
Considering the drastically changed site biotic and abiotic components, reclaimed ecosystems may respond differently to climatic variability compared to their undisturbed analogues. Existing studies on natural ecosystems revealed that vegetation–climate relationships vary between different species combinations [24,25,26,27], vegetation types [21,28,29,30], soil properties [20,31,32,33], topography [24,26,34,35], and bedrock lithology and groundwater levels [36,37,38,39]. In mineral-extraction processes, these elements are inevitably disturbed and changed despite reclamation measures. First, re-established vegetation may differ from its adjacent undisturbed analogues in terms of species combination and community structure due to the radical changes in biotic and abiotic environment on mine sites [40,41]. Second, a reclaimed mine soil (RMS) layer is inferior to the original soil profile in terms of soil-water-holding capacity. During mining and reclamation processes, only the topsoil is salvaged and reused, and it usually suffers from considerable loss [42,43,44]. Moreover, soil properties related to hydrological characteristics decline during topsoil handling processes, e.g., soil porosity [45,46,47,48], soil fauna and organic matter [43,49,50,51], and these properties remain inferior to those of natural soil even decades after reclamation [43,45,46,49]. The RMS thus dries more rapidly after rain events [43], which may make reclaimed ecosystems more sensitive to rainfall variability. Third, apart from the topsoil, other vadose zone structures (i.e., subsoil, bedrock lithology) and aquifers overlying mineral deposits are also disturbed and permanently changed, which alters subsurface hydrological processes [52,53,54,55], and influences plant water availability [56,57]. Fourth, surface mining activities permanently change the original topography, further altering microclimatic [58,59] and hydrological processes [53,60,61]. All four aspects of biotic and abiotic changes arising from surface mining may make reclaimed ecosystems respond differently to regional climatic variability from their adjacent remnant analogues.
However, climatic impacts on reclaimed ecosystems are generally assumed to be identical with adjacent undisturbed ecosystems. This assumption may lead to a biased estimation of the ecological response to climate. Quantitative studies are also limited in identifying whether a reclaimed ecosystem and its adjacent remnant analogue have similar vegetation–climate relationships.
This paper presents a case study at a large coal mine with long-term observations of reclaimed vegetation. Seven reclaimed plots and two adjacent unmined plots were used for comparison. For each plot, vegetation responses to six climatic variables (namely, rainfall, temperature, relative humidity, sunshine hours, wind speed, and vapor pressure variabilities) were explored by a generalised additive model (GAM) with time-series remote-sensing data (135 periods, 1997–2017) of vegetation dynamics (MODIS enhanced vegetation index (EVI)) and corresponding meteorological data. Distinctly different ecological responses to climatic variability were found between reclaimed and unmined plots. Further, we propose possible causes of this phenomenon, i.e., changed site hydrological and microclimatic regimes on reclaimed mine land, and the limited resilience of reclaimed ecosystems. Some of these causes are ubiquitous on reclaimed mine lands, which means that the vegetation–climate relationships of reclaimed ecosystems are commonly changed. This change impacts the community structure and ecological processes of reclaimed ecosystems, and threatens their long-term stability and sustainability. Lastly, implications for mine-land reclamation research are discussed.

2. Materials and Methods
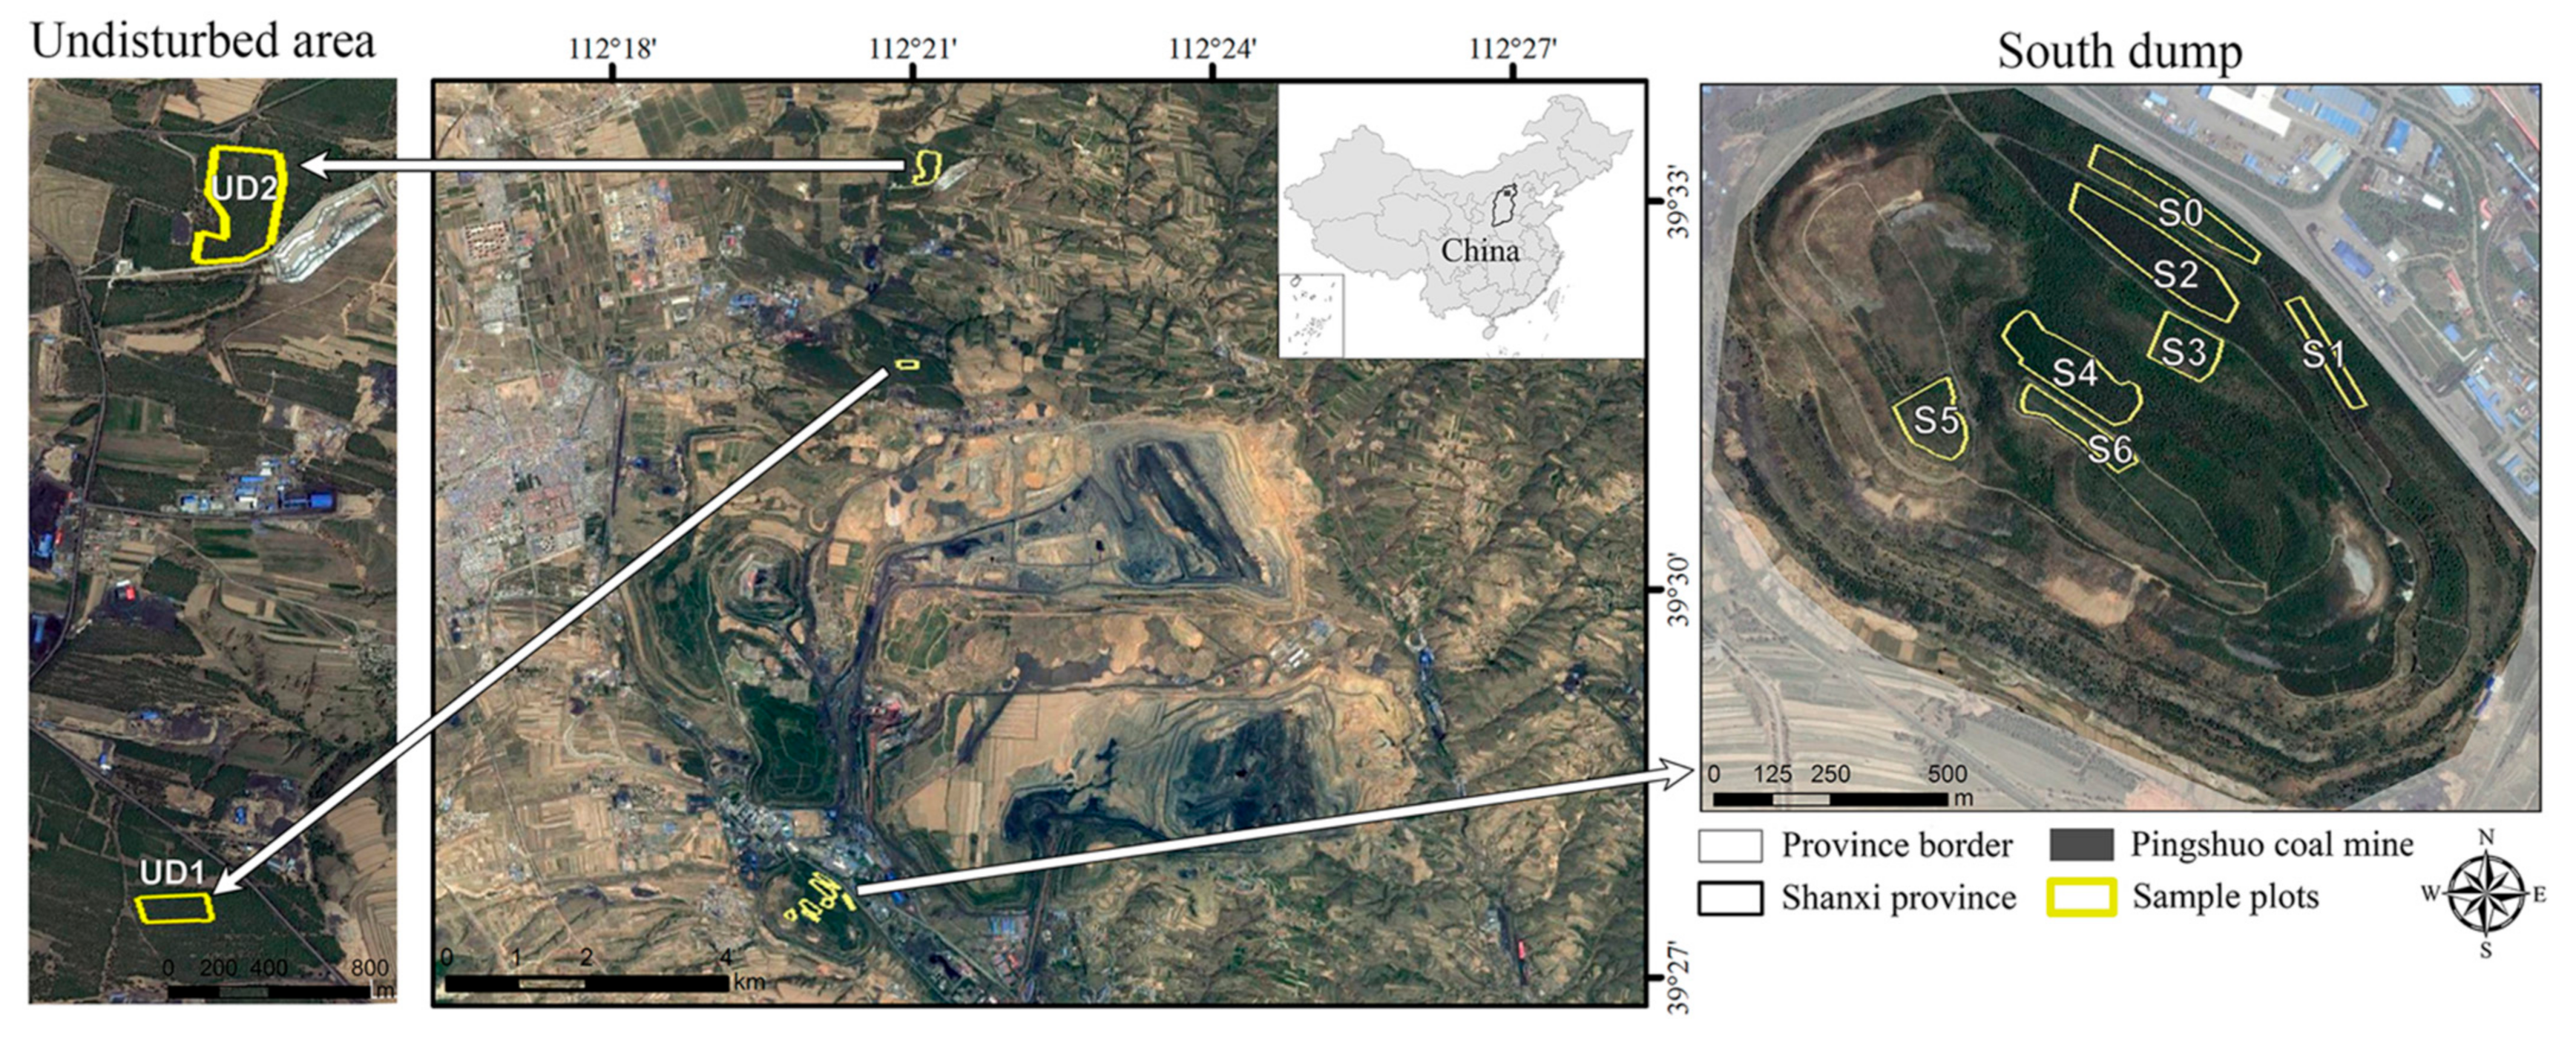
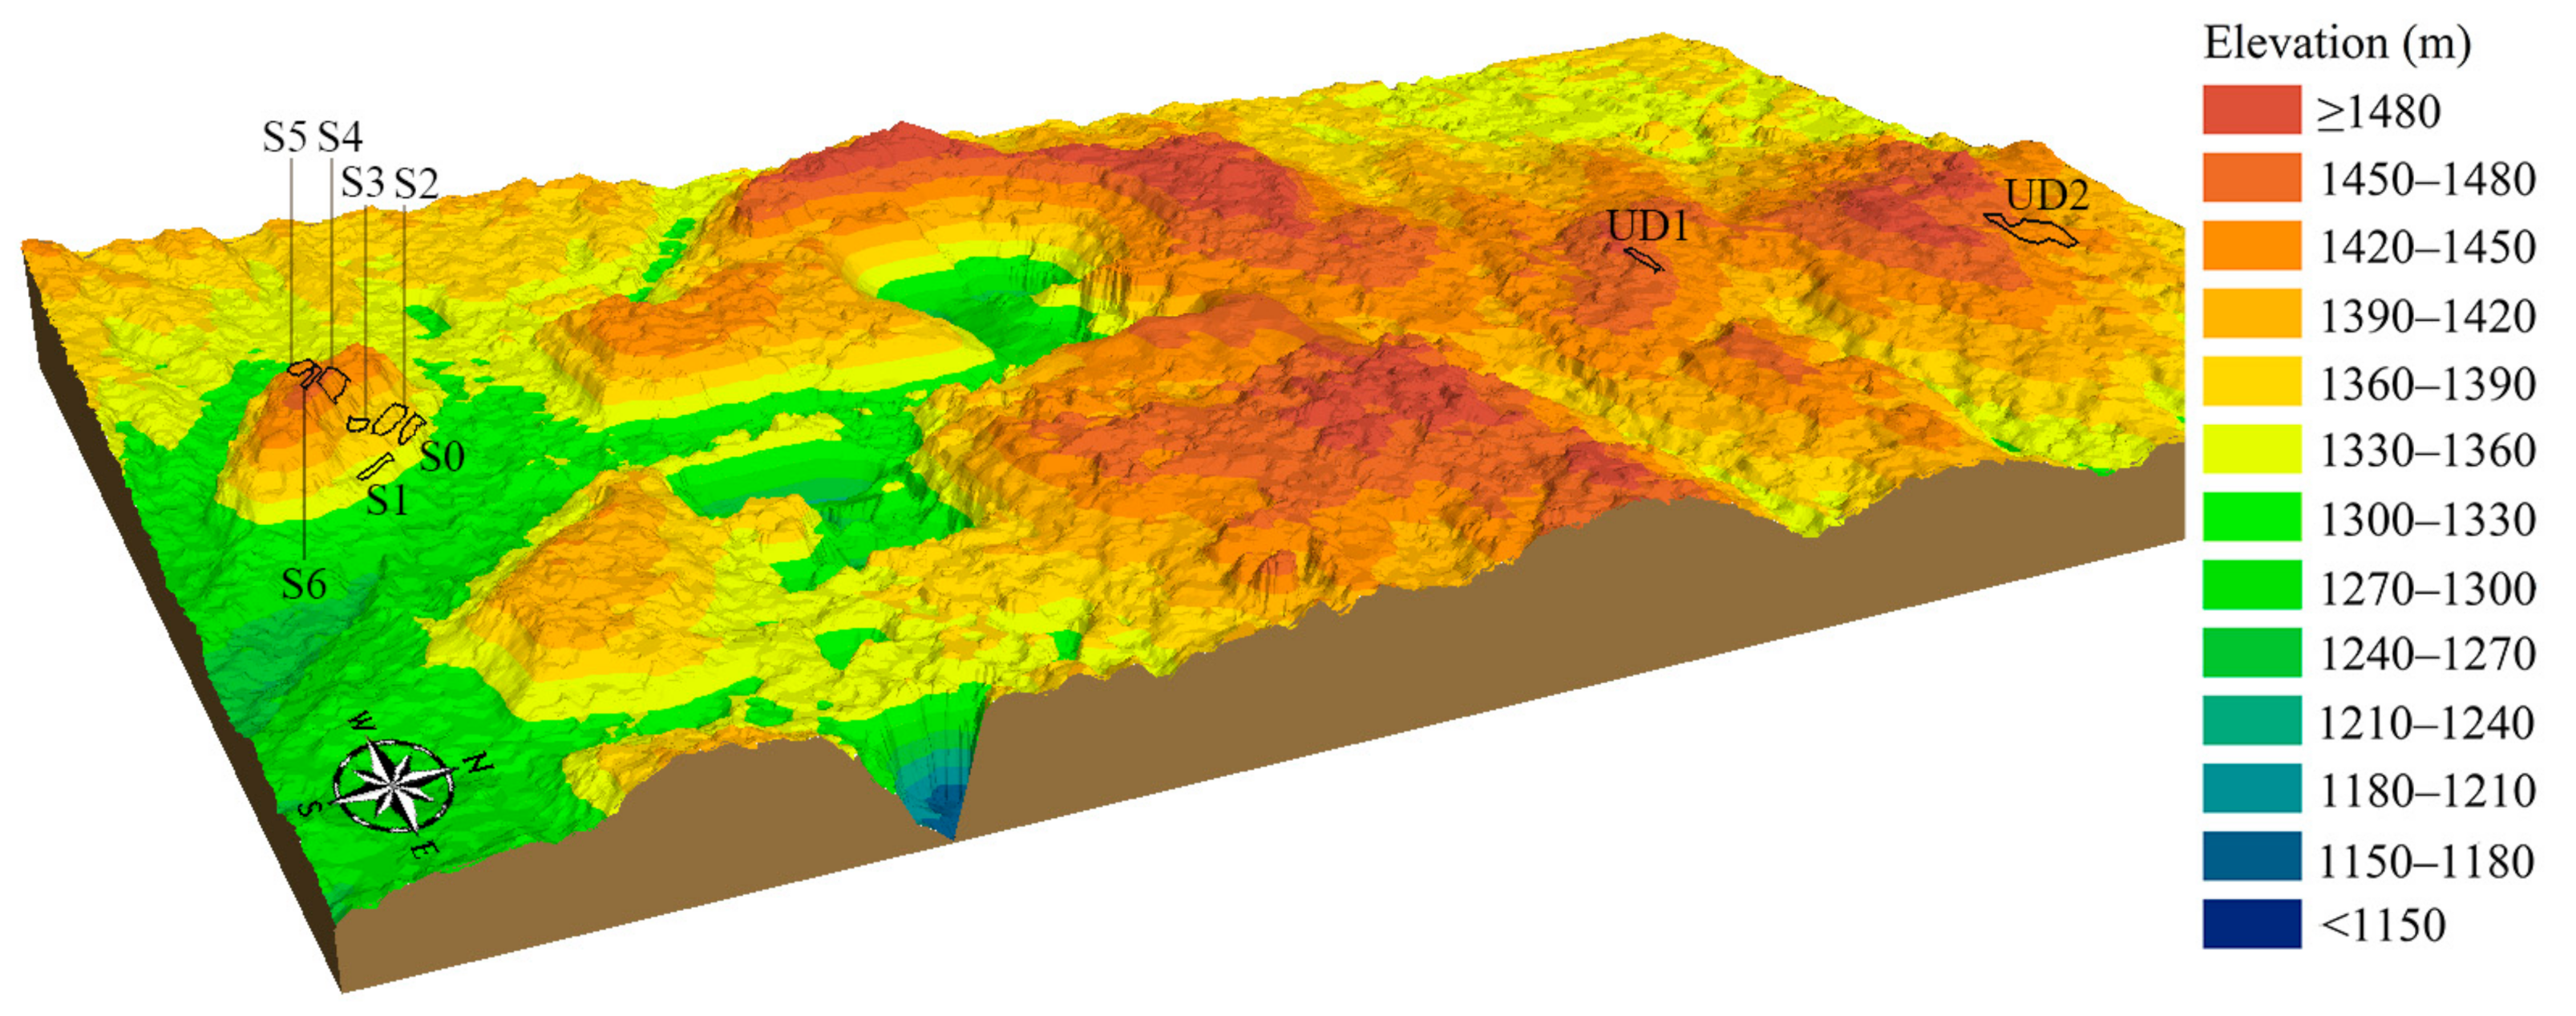
2.1. Study Area

The Pingshuo open-pit coal mine is a typical mega mining site with extensive mining and reclamation activities. It is the earliest modern open-pit coal mine of China, where reclamation practices began in 1992, providing long-sequence time-series remote-sensing dataset of reclaimed vegetation. This coal mine is located in Pinglu district, Shuozhou city, Shanxi province, China (112°11′–112°30′E, 39°23′–39°37′N, Figure 1). It covers an area of 340 km2, and it is on the ecotone influenced by agriculture and animal husbandry on the Loess Plateau of the region. This region is subject to a semiarid continental monsoon climate [62]. Average annual precipitation is 400–450 mm (50–70% of which falls in July to September and often in the form of heavy rainstorms), while annual potential evaporation is more than 2000 mm. Average annual temperature is approximately 6.2 °C. The depth of the groundwater table is 20 m, and atmospheric precipitation is the main water source for vegetation. The altitude is 1000–2000 m, and the major soil type is Kastanozems according to the World Reference Base for Soil Resources [63]. Zonal vegetation is temperate forest (meadow) steppe (Resource and Environment Data Cloud Platform), but natural vegetation in the whole region (Northwest Shanxi province) was destroyed by intensive human activities (cultivation, logging, and war) persisting for millennia since the Qin dynasty (221–207 BCE) [64,65]. In 1978, Pinglu was incorporated into the Three-North Shelter Forest Program [66]. A large area of artificial forests was built for the purpose of water and soil conservation in this district [66], and forest coverage increased from 0.01% in the 1950s to 38% in 2015 [67].
Pingshuo was constructed in 1985, and its proposed area mainly consists of farmland, the aforementioned artificial forests, and several villages. From 1985 to 1989, a southern dump (an outer dump) was formed in a terraced shape with 1.16 × 10⁸ m3 mineral waste (including coal gangue), covered with 1 meter thick loess as soil substitute on the surface. Its platforms and 30 m high steps alternate, with a total height of 150 m and an area of 1.81 km2. The dump was revegetated in the early 1990s. After decades of recovery, the vegetation cover is well-developed, with 207 wild plant species colonising this reclaimed area [68]. Soil properties improve with reclamation time, including soil bulk density [69], soil porosity [45], soil organic matter [70], soil nutrient levels [69], soil enzyme activity, and microbial diversity [71].
Seven reclaimed plots (coded S0 to S6) were selected on the southern dump (Figure 1). Species combination and topography were homogeneous within each plot and different between plots. These plots were revegetated with shrub and arbour species (Table 1) in 1993, and the planted woody species remain dominant after decades of recovery. Two unmined plots (UD1 and UD2) were selected on the adjacent remnant land laying to the north of the mining pit. They are monoculture stands of Populus simonii built in the early 1980s, and the stand structure and site conditions were also homogeneous within each plot. Plot boundaries were delineated by field survey with GPS.

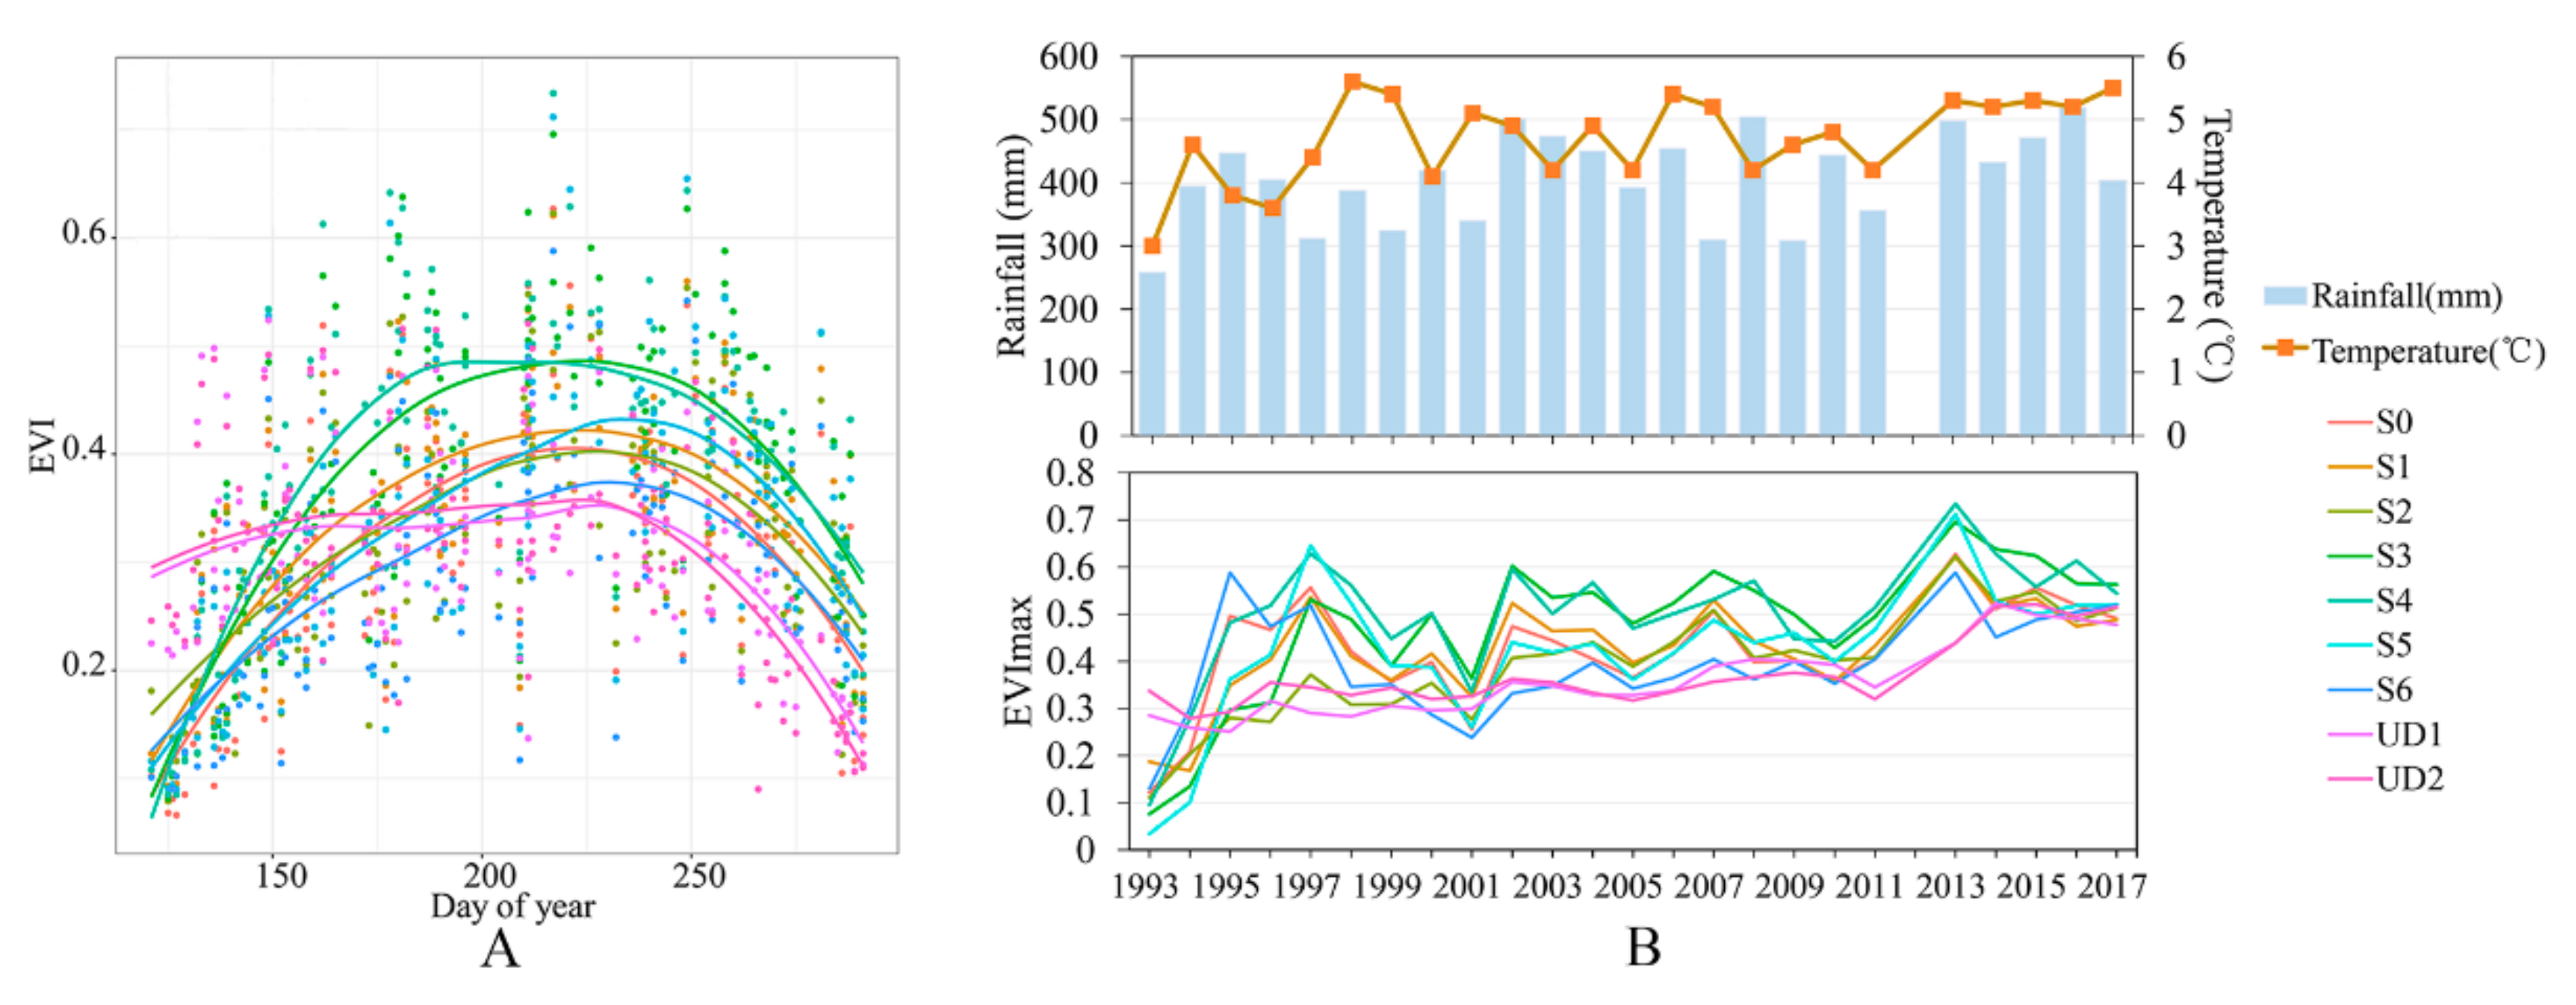
2.2. Vegetation and Meteorological Data

The MODIS enhanced vegetation index (EVI) was analysed as an indicator of vegetation activity. The index is strongly correlated with chlorophyll content and photosynthetic activity [72], and is a normalised ratio of the red, near-infrared, and blue spectral reflectance bands. EVI can have values from −1 to +1. The EVI equation is as follows:
EVI = 2.5 ρ N I R ρ R e d ρ N I R + 6 ρ R e d 7.5 ρ B l u e + 1 ,
where ρNIR, ρRed, and ρBlue are reflectance in the near-infrared, red, and blue bands, respectively. We chose EVI to measure vegetation dynamics because most plots were covered with thick vegetation, and this vegetation index is sensitive over high-biomass regions [73].
Calibrated top-of-atmosphere reflectance data from Landsat 5 and 8 were used to calculate the EVI in the Google Earth Engine (2012). We selected images without cloud cover during the growing season (May to September) from 1993 to 2017 (except for 2012), and 152 EVI images were obtained (Appendix A shows four examples). For each image, the EVI of a given plot was calculated by averaging the pixel values in that plot. EVI variation with the day of year and reclaimed year over each plot is depicted in Figure 2. In the first 4 years following reclamation (1993 to 1996), EVI increased quickly due to the rapid seedling growth after transplant, which is distinct from the following trend of fluctuating with climatic variability. EVI data during this period were thus removed from analysis to reduce the potential impact of noisy data, and 135 EVI records (1997 to 2017) remained.
Regional daily meteorological data (Youyu weather station, 112°27′ E, 40°00′ N) from 1997 to 2017 were collected from China’s Meteorological Data Sharing Service System [74]. The data included six meteorological elements, namely, precipitation, temperature, relative humidity, sunshine hours, wind speed, and vapor pressure. The raw data were used to calculate the values of the climatic variables listed in Table 2.

2.3. Methods

Vegetation responses to climatic variability on both reclaimed and undisturbed plots were explored using a three-step approach (Figure 3A): (i) evaluating the temporal (accumulated and lagged) effects of climatic variables on vegetation, (ii) selecting variables (correlation and multicollinearity analyses), and (iii) investigating contributions of explanatory variables.
The explanatory variables of EVI variations consisted of main explanatory and auxiliary variables (Table 2). Main explanatory variables were climatic in six categories: variabilities of rainfall, temperature, relative humidity, sunshine hours, wind speed, and vapor pressure. Auxiliary variables were the year of reclamation or restoration (to measure the contribution of vegetation development with time) and the day of year (to measure seasonal vegetation rhythms).

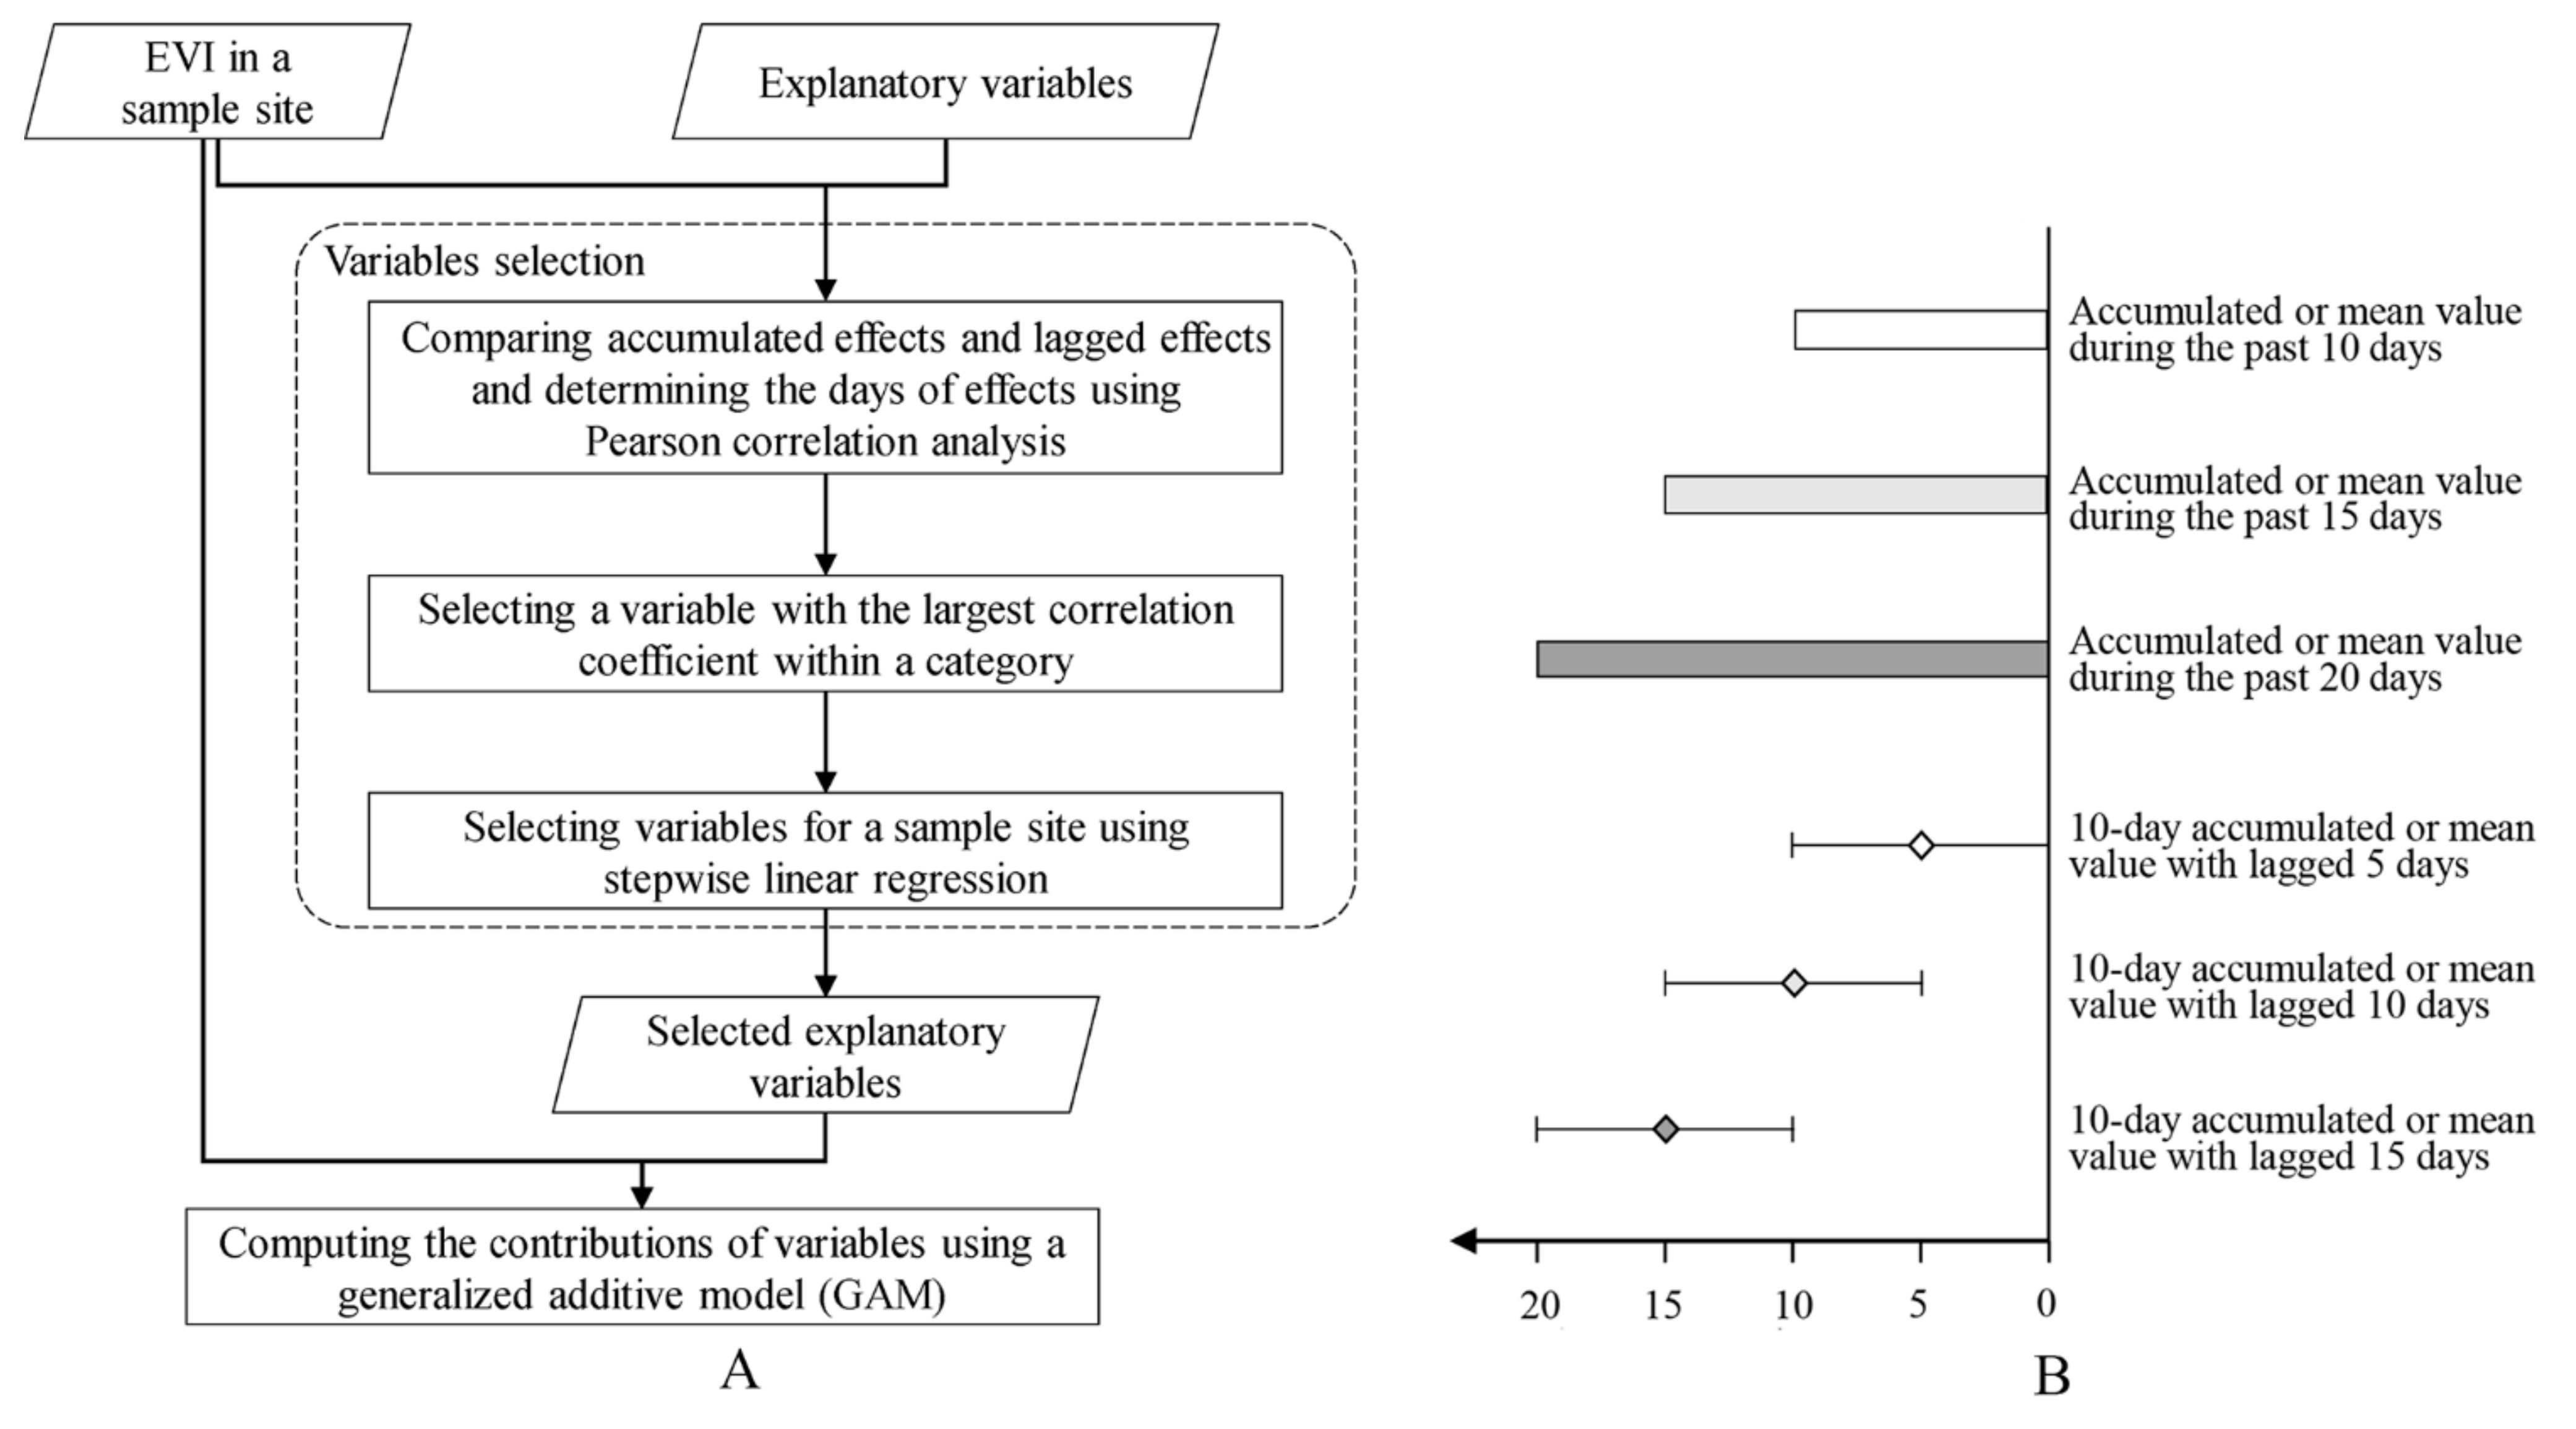
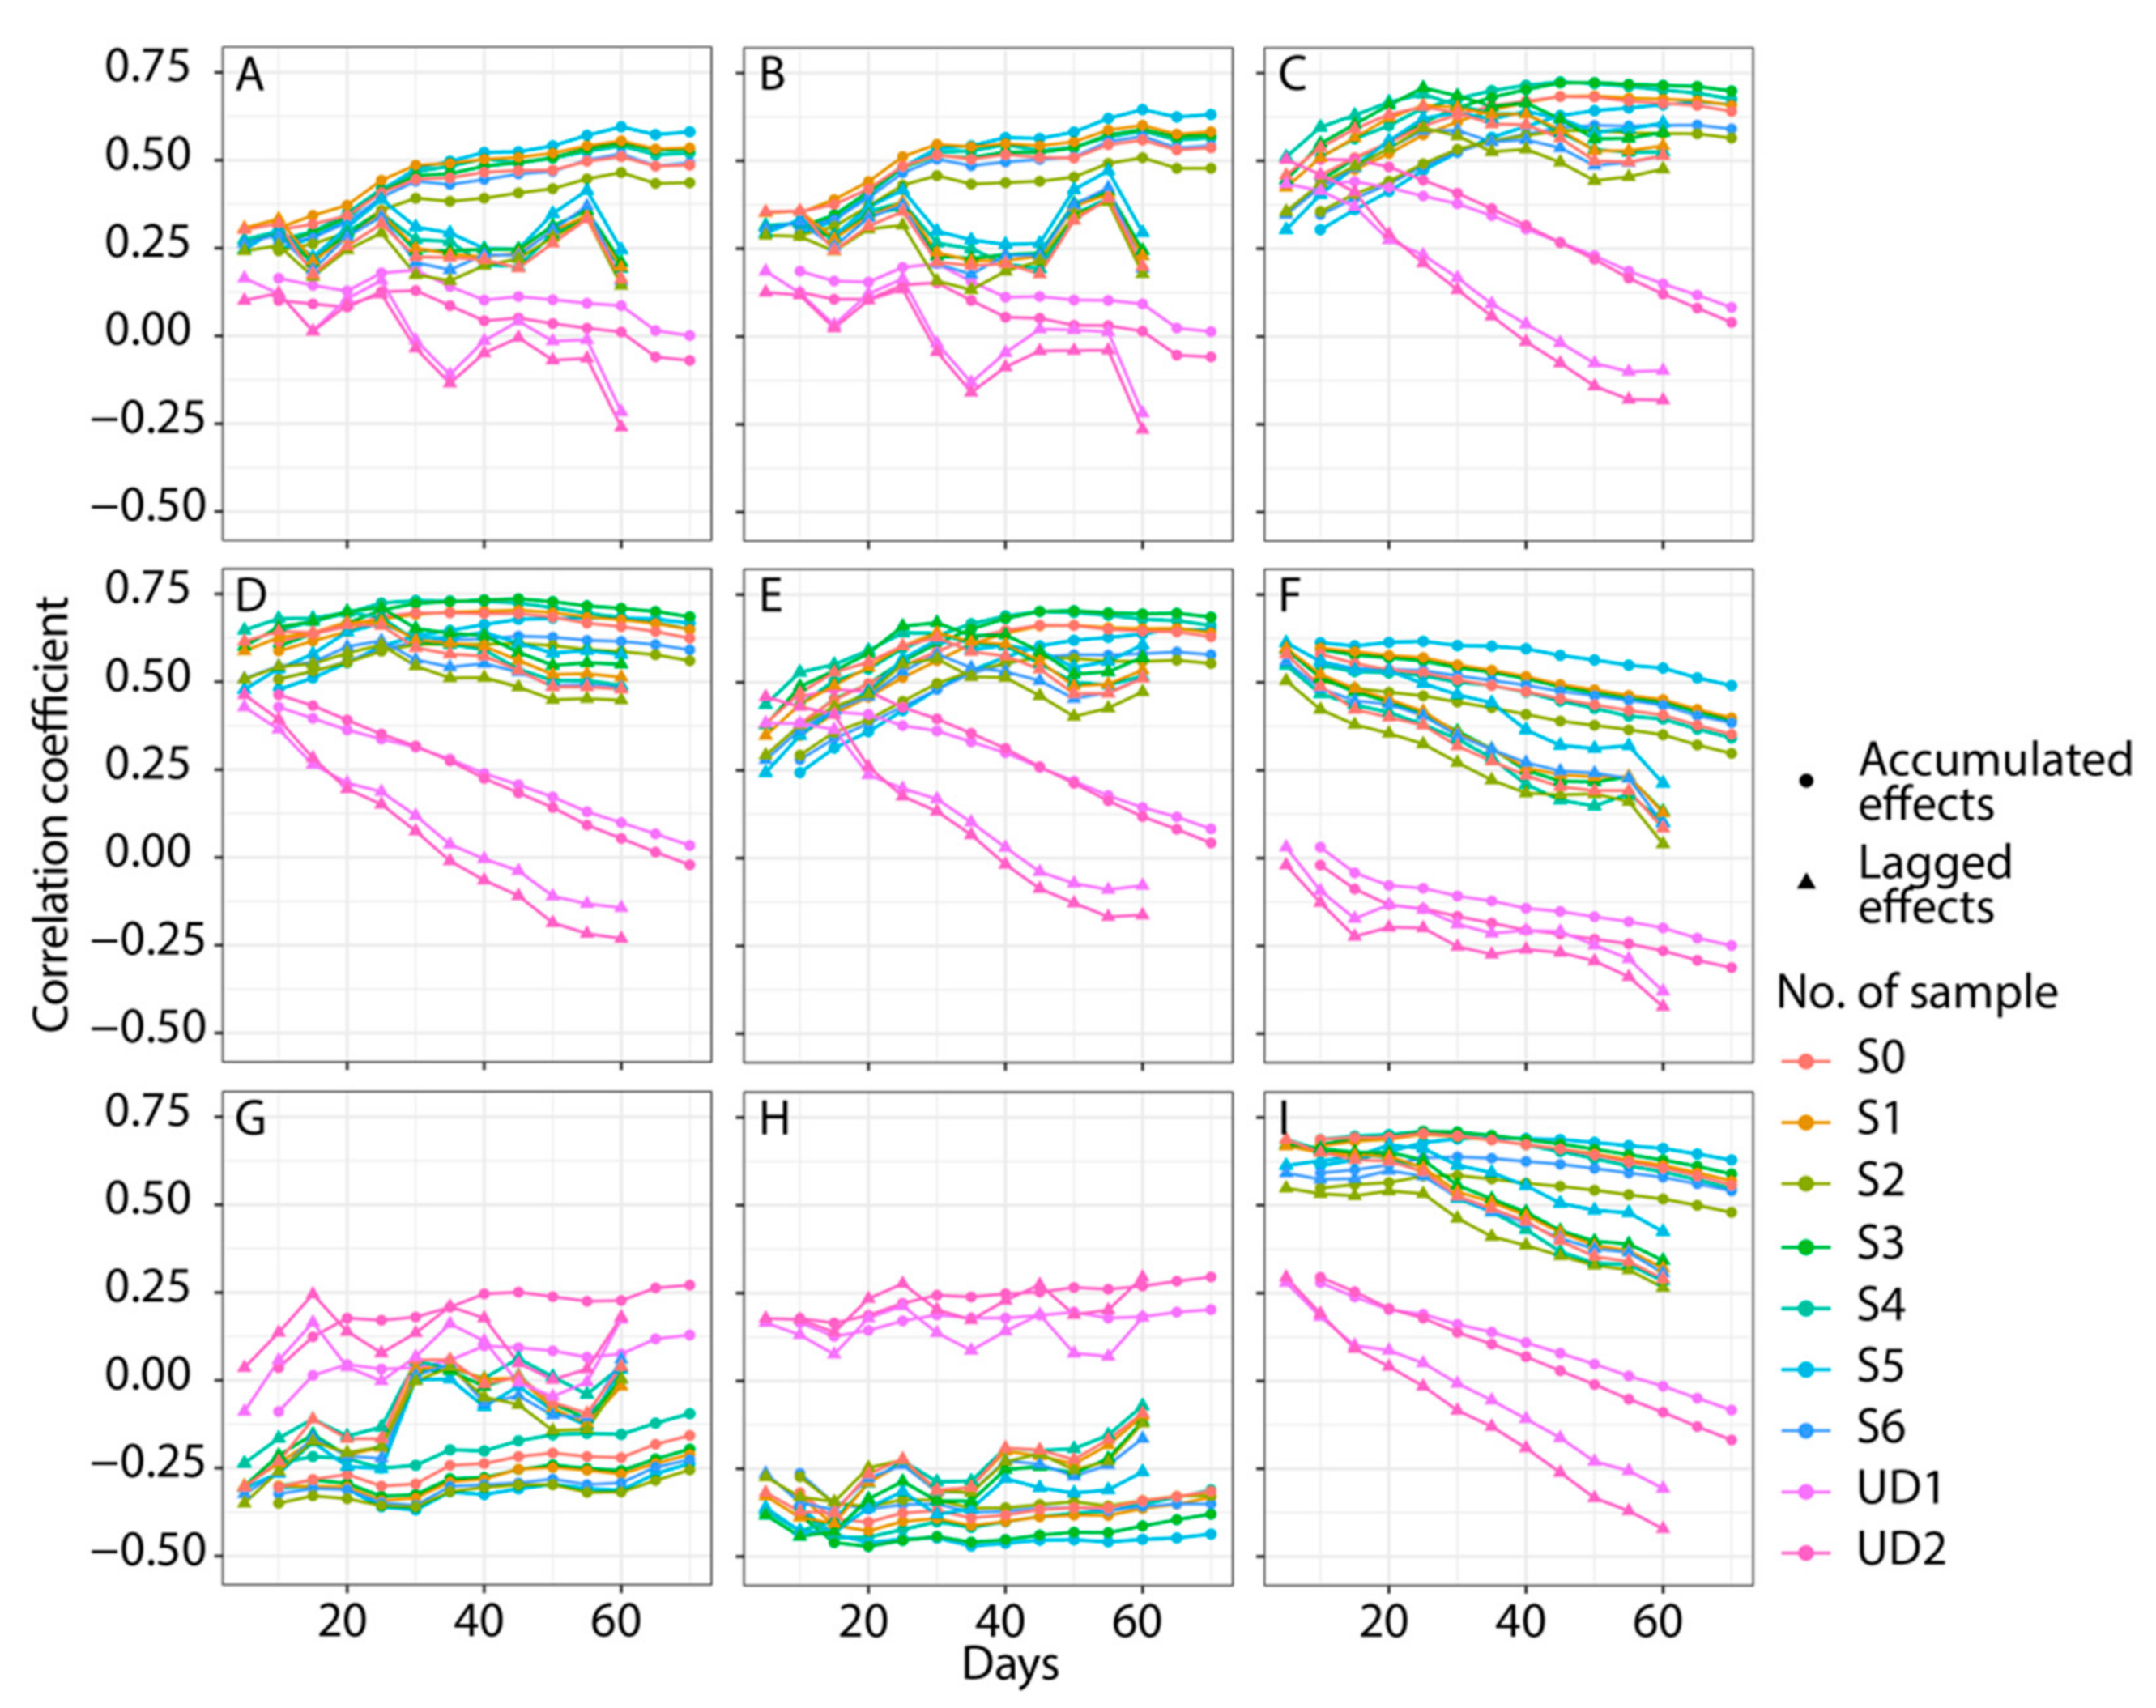
2.3.1. Evaluating Temporal Effects of Climatic Variables on Vegetation

Climatic influences on vegetation are often with temporal effects (i.e., lagged and accumulated effects) that should be considered when exploring vegetation–climate relationships [28,30]. In this study, correlation analysis was used to assess the period over which each climatic variable was best correlated with EVI [20,53,75] in each plot. Specifically, correlation coefficients between the EVI of each plot and a climatic variable with different accumulation periods (varying from 0 to 70 days with a 5 day increment, illustrated in Figure 3B) and different time lags (varying from 5 to 60 days with a 5 day increment) were compared to identify the effective period of the climatic variable, i.e., the temporal effect and corresponding value of the parameters (mR, nR … and nV in Table 2). For example, correlations between rainfall accumulated over various periods and EVI were analysed, and the period over which rainfall had the highest correlation with EVI was selected.
Table 2. Summary of explanatory variables of the EVI variations.
CategoryVariableUnit
Day of yearDay of year/
Year of reclamation or restorationYear of reclamation or restoration/
RainfallAccumulated rainfall during past mR days *0.1 mm
nR days lagged 10 day accumulated rainfall0.1 mm
Accumulated nonrunoff rainfall (≤20 mm) during past mR1 days **0.1 mm
nR1 days lagged 10 day accumulated nonrunoff rainfall (≤20 mm)0.1 mm
TemperatureMean temperature during past mT days0.1 °C
nT days lagged 10 day mean temperature0.1 °C
Mean minimal temperature during past mT1 days0.1 °C
nT1 days lagged 10 day mean minimal temperature0.1 °C
Mean maximal temperature during past mT2 days0.1 °C
nT2 days lagged 10 day mean maximal temperature0.1 °C
Relative humidityMean relative humidity during past mH days1%
nH days lagged 10 day mean relative humidity1%
Sunshine hoursMean sunshine hours during past mS days0.1 h
nS days lagged 10 day mean sunshine hours0.1 h
Wind speedMean wind speed during past mW days0.1 m/s
nW days lagged 10 day mean wind speed0.1 m/s
Maximal wind speed during past mW1 days0.1 m/s
nW1 days lagged 10 day maximal wind speed0.1 m/s
Vapour pressureMean vapour pressure during past mV days0.1 hPa
nV days lagged 10 day mean vapour pressure0.1 hPa
* mR determined using steps in Section 2.3.1, as are nR, mR1, nR1 … and nV in the following. ** In this mining area, runoff is generated when rainfall exceeds 20 mm in a single rainfall event [76]. This variable was to test the effect of nonrunoff rainfall.

2.3.2. Selecting Variables

Climatic variables of which the correlations with the EVI were significant (p < 0.05) and two auxiliary variables (year of reclamation or restoration and day of year) were taken as the initial variables. Variable selection consisted of two steps. First, for each plot, the variable with the highest correlation coefficient within a variable category was selected. For instance, temperature-related variables were significantly correlated with each other; then, the variable having the highest correlation coefficient with EVI variations was selected among the temperature variables. Second, multicollinearity analysis was performed to remove closely correlated variables of which the variance inflation factors (VIF) were higher than 10, and to determine those explanatory variables that had relatively weak collinearities. The selected variables were used in the final modelling.

2.3.3. Exploring Contributions of Explanatory Variables

In the last step, the generalised additive model (GAM) was used to investigate the contributions of explanatory variables to EVI variability. It is a widely used nonparametric statistical model that can describe both linear and nonlinear associations between response and explanatory variables.

3. Result

3.1. Temporal Effects of Climatic Variables

Pearson correlation analysis showed that the accumulated effects of all climatic variables were dominant (Figure 4). For each climatic variable of which the correlation with EVI was significant (p < 0.05), the period over which its accumulated values had the highest correlation with EVI of each plot was selected as its accumulation period (Table 3). For example, rainfall over the past 60 days had the strongest correlation coefficient with the EVI of S0 (0.510, Figure 4), so the accumulation period of rainfall for plot S0 was 60 days (Table 3).
Figure 4 shows distinct differences between reclaimed and undisturbed plots in the aspects of correlation coefficients and temporal effects, while the plots within each group showed similarity: (1) Rainfall, temperature, and vapor pressure showed positive correlation with EVI in both reclaimed and undisturbed plots, but correlation coefficients in the reclaimed plots were much higher. Relative humidity variability had positive correlations with EVI in the reclaimed plots, but no significant correlations in undisturbed plots. Sunshine hours and wind speed were negatively correlated with EVI in the reclaimed plots, but showed no significant correlation with EVI in the undisturbed plots. (2) Reclaimed and undisturbed plots had very different temporal-effect patterns. The accumulation periods of all climatic variables in the reclaimed plots were especially significantly longer than those in the unmined plots. For example, the accumulation period of mean temperature was as long as 45–65 days in the reclaimed plots, but only 10–15 days in the unmined plots.

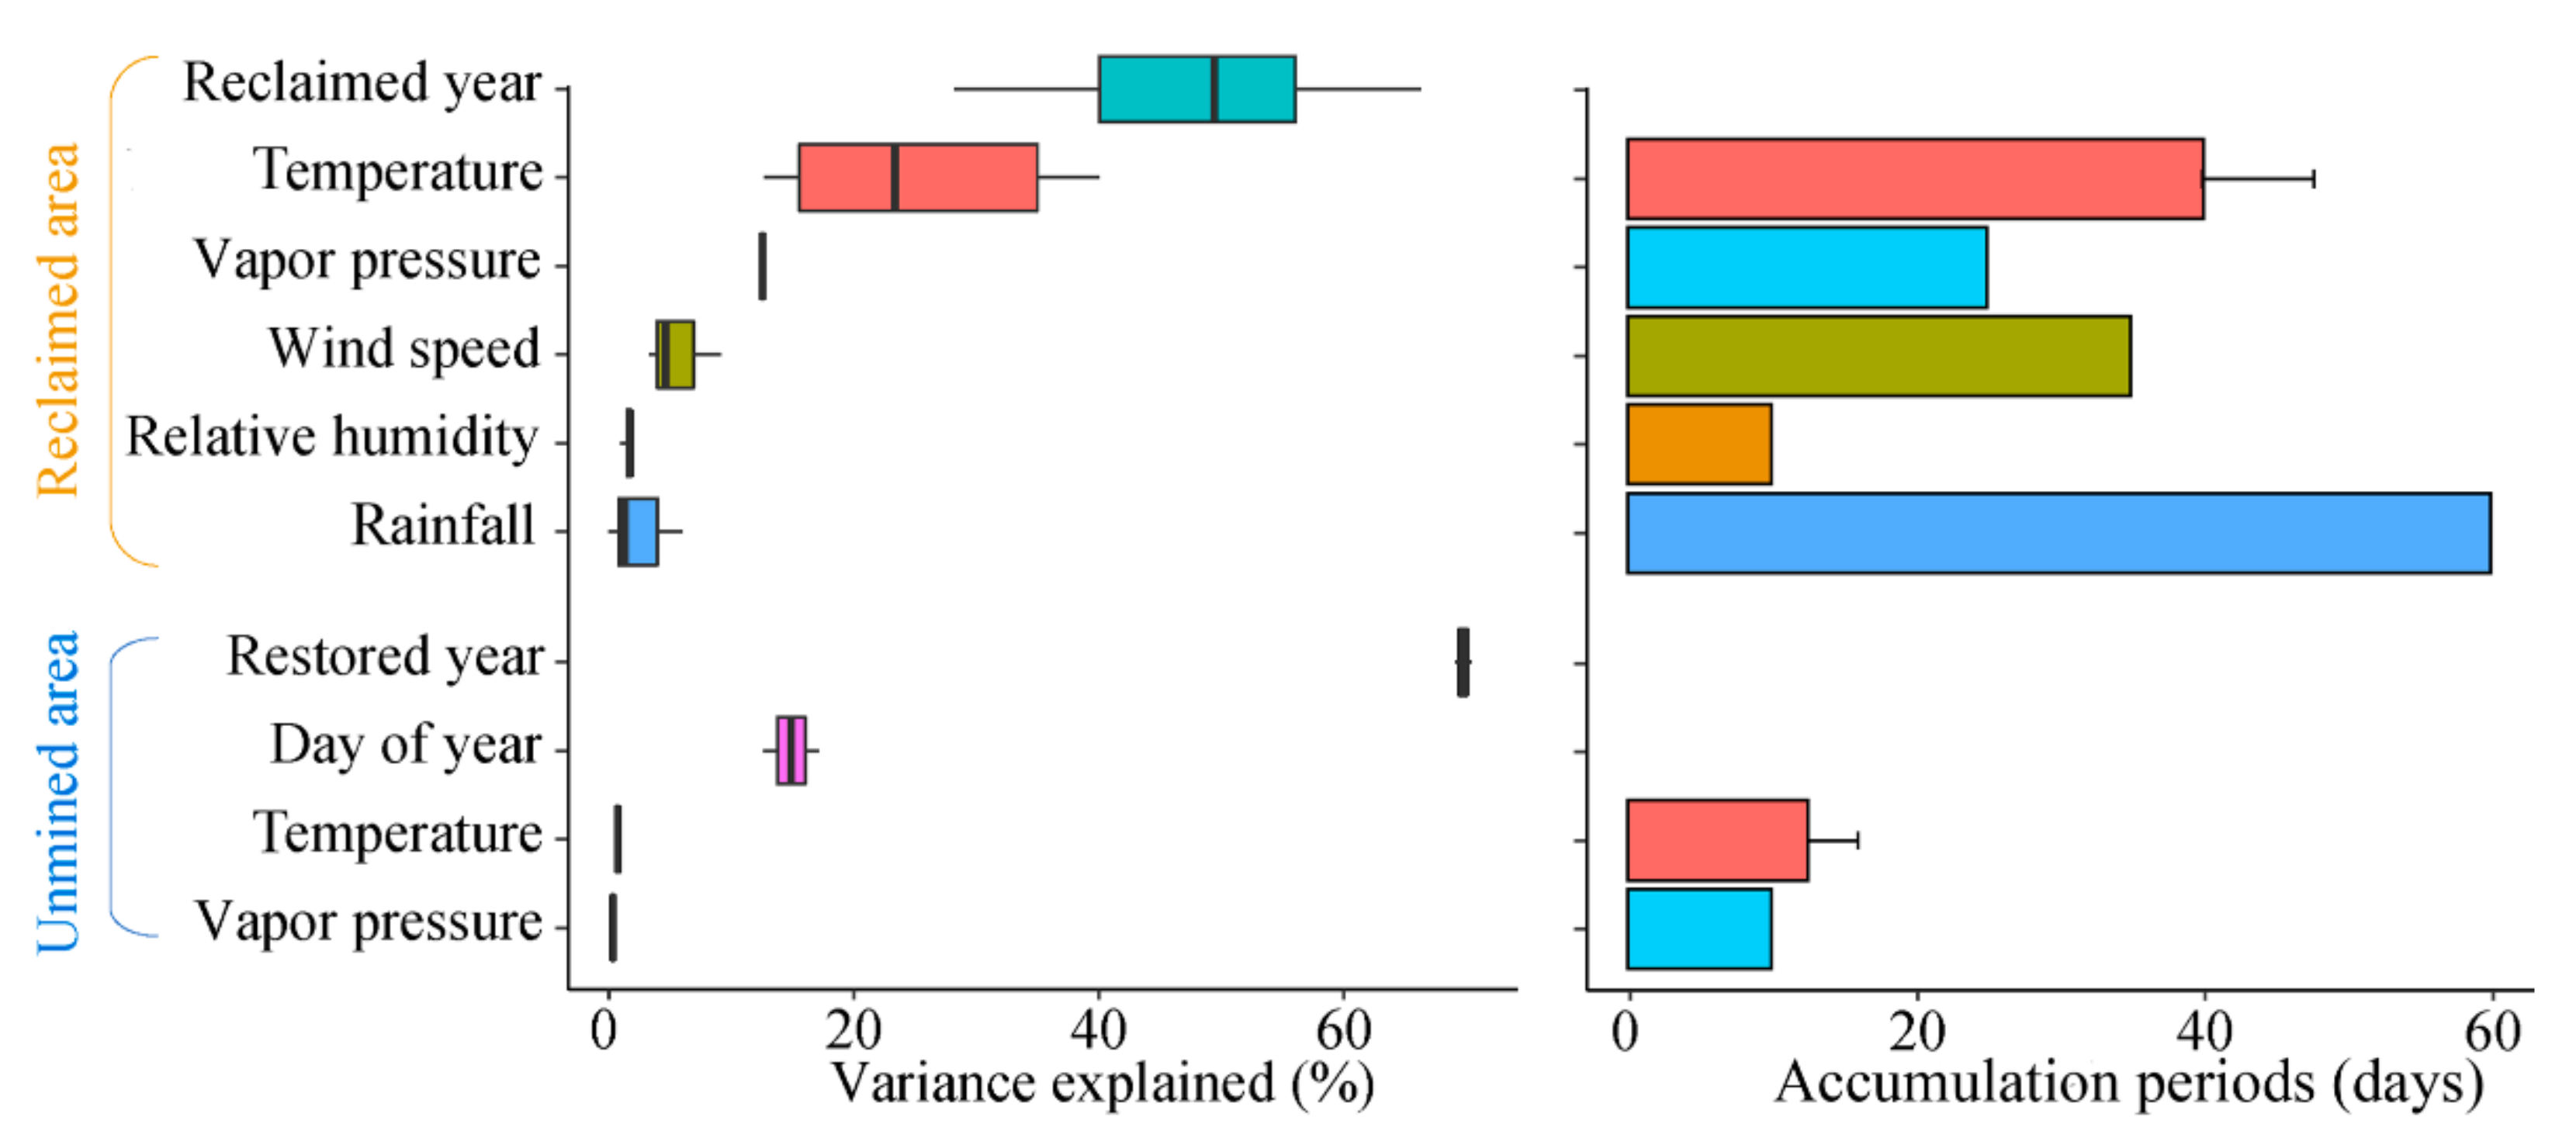
3.2. Climatic Drivers and Contributions to EVI Variation

The selected variables following the steps in Section 2.3.2 and their relative contributions explored by GAM are shown in Table 4. Again, reclaimed and unmined plots distinctly differed in terms of climatic drivers and their relative contributions, while the plots within each group were similar. There were mainly two differences. First, reclaimed and remnant vegetation responded to different climatic variables. The former responded to variabilities in temperature, rainfall, air humidity, and wind speed, while the latter only responded to variability in two climatic factors, namely, temperature and air humidity. Rainfall variability especially constrained vegetation variation in all reclaimed plots, but not that in unmined plots. Second, climatic variability made a greatly higher relative contribution to EVI variation in reclaimed plots (19.95% to 46.46%) than that in unmined plots (0.7% to 1.74%). In particular, temperature variability explained as much as 12.89–40.26% EVI variation in the reclaimed plots (except S5), while the number was only 0.7–1.17% in the unmined plots. Another common climatic driver for reclaimed plots, rainfall variability, explained 0.21–6.20% variation of reclaimed vegetation, but exerted no significant influence on unmined plots.

4. Discussion

This study presents quantitative analysis about a reclaimed ecosystem response to climatic variability compared with its adjacent remnant analogue. Results showed distinct vegetation responses to climatic variabilities between reclaimed and unmined lands (Figure 5). First, reclaimed and unmined ecosystems were subject to different climatic drivers. The former responded to variability in temperature, rainfall, air humidity, and wind speed, while the latter only responded to variability in temperature and air humidity. Second, reclaimed vegetation was much more sensitive to climatic variability than that on adjacent unmined land (climatic variability contributed as much as 19.95–46.46% EVI variation to the former and only 0.70% to 1.74% to the latter). Third, the temporal-effect patterns of all climatic variables were markedly different between reclaimed and unmined lands (Figure 4), and the accumulation periods of all climatic variables were much longer on reclaimed mining land (Table 3). Vegetation responses to climatic variability were similar between the two land categories (i.e., reclaimed and unmined lands) in all three of the above-mentioned aspects regardless of species combinations, vegetation types (including shrub, and coniferous, broad-leaved, and mixed broadleaf-conifer stands), and topography.

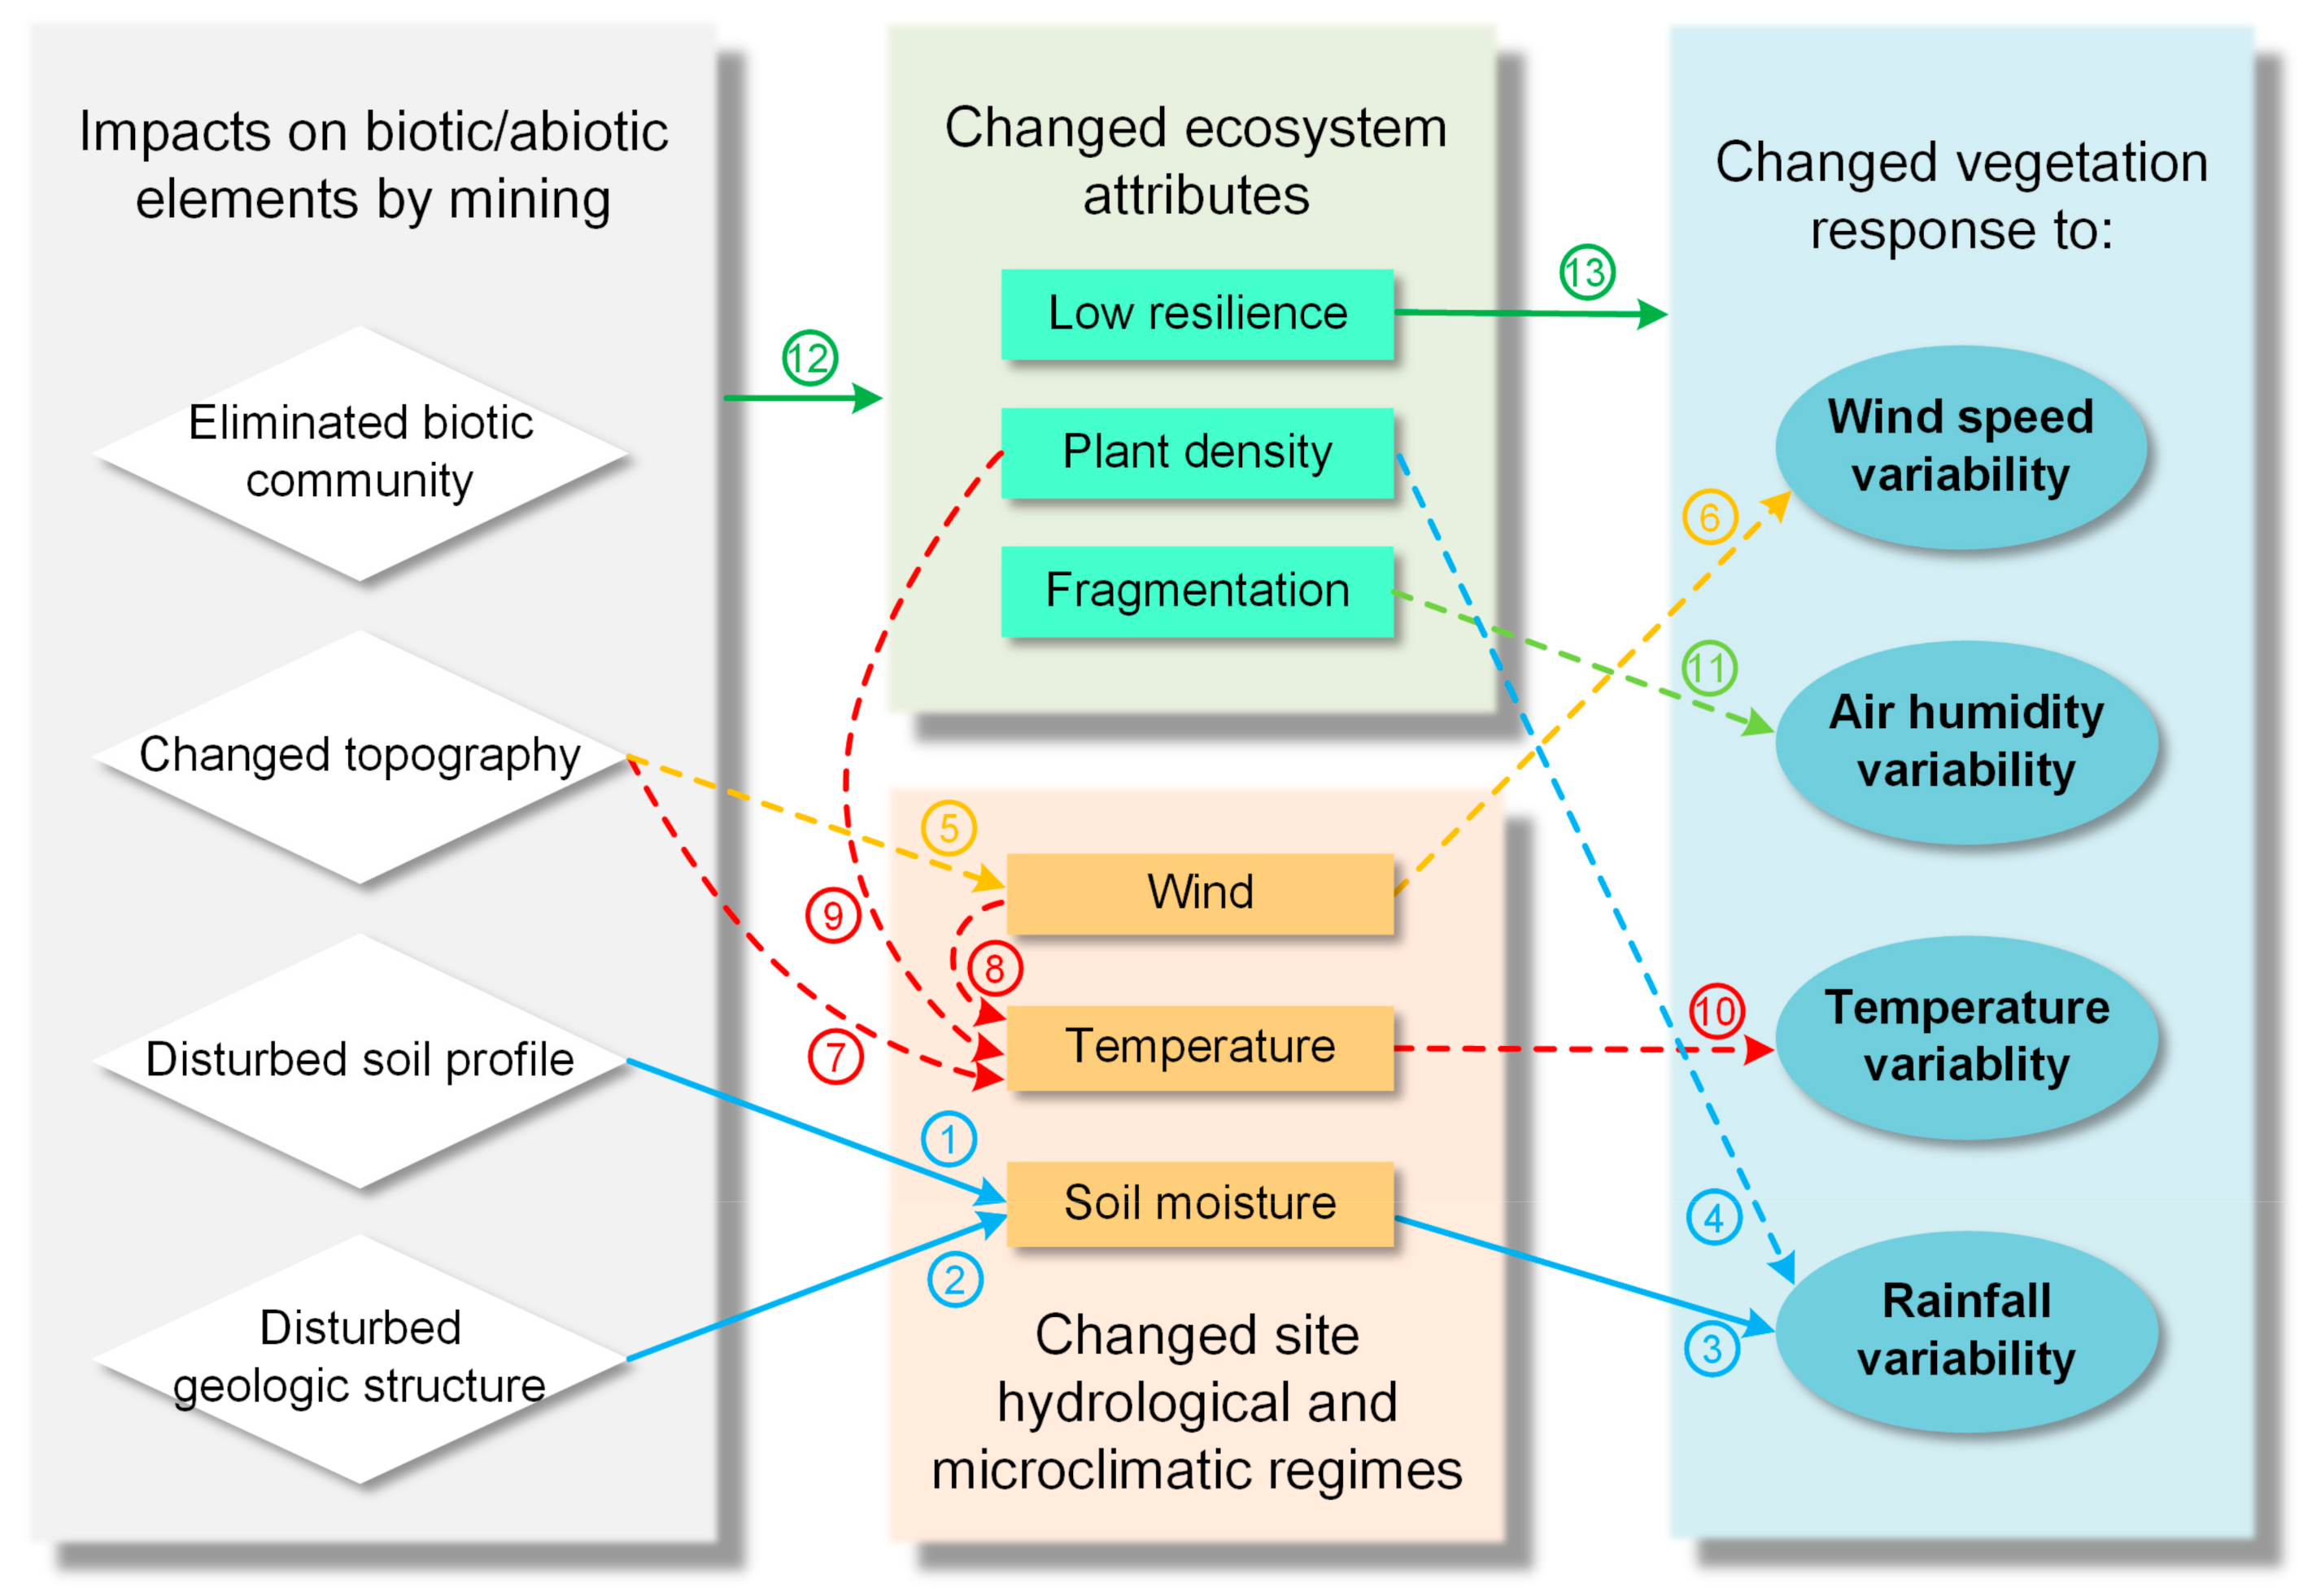
4.1. Factors of Changed Vegetation Responses

The wide differences between groups and similarity within each group indicate that mining disturbances significantly changed vegetation–climate relationships, overwhelming other influencing factors found in natural ecosystems (i.e., species combinations, vegetation types, and topography). This was caused by multiple legacy effects of mining activities, mainly changed hydrological and microclimatic site regimes, and impaired ecosystem resilience. In the following, possible causes are proposed.

4.1.1. Rainfall

Unmined plots did not exhibit a response to rainfall variability; however, all reclaimed plots were more or less constrained by this climatic variable (0.21–6.20%), even including plots covered with species of low transpiration and high drought tolerance (S2 and S6), and the plot receiving baseflow runoff from its upper slop (S4). There are mainly three possible causes. First, reclaimed land was covered with only a 1 meter thick loess layer on overburden materials (mainly coal gangue and rocks), while unmined land had several meters’ thick loess beneath a well-developed soil profile. As tree root systems can stretch to several meters’ depth, the limited thickness of RMS layer may restrict available water for trees. Second, the interface between soil substitute layer and coal gangue might act as a capillary barrier and restrict upward water movement into the soil layer [54] in dry days. Third, reclaimed mining land had higher overall plant biomass and consumed more water than unmined land did.

4.1.2. Wind Speed

Vegetation in unmined plots did not respond to variability in wind speed, while vegetation in three reclaimed plots (namely, S2, S5, and S6) did. The main cause was that wind speed is accelerated by the prominent terrain of the dump (Figure 6), especially in these three reclaimed plots. Wind can be sped up along the windward slope and reaches its maximum at the ridge [77,78,79,80]. In that area, westerly winds are dominant throughout the year [81] except for August, when southeasterly winds blow. The dump is 120–150 m higher than the surrounding area, which accelerates airflow. This was particularly pronounced on platform plots S2, S5, and S6.

4.1.3. Temperature

Low temperature is a regional climatic constraint, and temperature variability was positively correlated with EVI in all plots (Figure 4). However, it made a much higher relative contribution in reclaimed plots (12.89–40.26%, except S5) than in unmined plots (0.7–1.17%), indicating that the temperature in reclaimed plots was lower than that on unmined ones. This was confirmed by the retrieval of land-surface temperature (see Appendix B, Figure A2). There may have been two causes. First, the hill-like terrain of the dump accelerated wind speed on the platform and reduced net radiation reaching the plots on the shady slope. More specifically, the shady slope of the dump where S0, S1, S3, and S4 are located received lower solar irradiation than unmined plots did. Although S2 and S6 received similar levels of solar irradiation as those of the undisturbed plots, high winds increased heat loss by turbulent heat flux in these two plots. Second, reclaimed land had higher plant density, which led to a larger amount of evapotranspiration and latent heat flux. As an exception, S5 was the only plot that did not exhibit a response to temperature variability, probably due to warming up by the spontaneous combustion of the nearby coal gangue (Figure A2).

4.1.4. Air Humidity

Overall, variability in air humidity (relative humidity or vapor pressure) made a higher relative contribution on reclaimed vegetation (1.17–12.75%, except S3 and S4) than that on unmined vegetation (0% and 0.57%, respectively). This may have mainly been due to a higher fragmentation of reclaimed vegetation, which led to lower air humidity in the microclimate of the reclaimed sites. Many studies showed that a forest edge has lower relative humidity [82,83,84] and higher vapor pressure deficit [85,86] than those of the interior. Reclaimed plots had smaller fragments and were surrounded by built-up land or land with sparse vegetation (Figure 1), and were thus exposed to a microenvironment with lower air humidity.

4.1.5. Impaired Resilience of Reclaimed Ecosystem

Another important cause of the high sensitivity of reclaimed vegetation to climatic variability was the limited resilience of the reclaimed ecosystem, which further amplified climatic constraints. The temporal pattern widely varied between reclaimed and unmined plots, while it was highly similar within each of these two groups (Figure 4). More specifically, the accumulation periods of all climatic variables in the reclaimed plots were significantly longer than those in the unmined plots (Table 3), which could be interpreted that reclaimed vegetation recovered much slower from climatic perturbations (unfavourable climatic and weather events) than vegetation on unmined land did. For example, unmined vegetation was influenced by mean temperature over the past 10–15 days; however, reclaimed vegetation was constrained by mean minimal temperature over the past 30–45 days. This indicates that the influence of temperature fluctuation over the past 16–45 days had subsided in undisturbed plots, while it still existed in reclaimed plots. This slow recovery rate from environmental perturbations is a sign of the low resilience of an ecosystem, in the sense that small disturbances could easily tip the ecosystem through a critical transition into a contrasting state [87,88,89,90]. The low resilience of the reclaimed ecosystem may be due to an unsuitable biotic or abiotic environment on reclaimed land, which changed the ecophysiological traits of plants. This led to the accumulation of negative impacts of climatic perturbations, thereby aggravating climatic constraints on reclaimed vegetation.
In summary, the changed vegetation response to climatic variability on reclaimed mining land was caused by the multiple negative impacts of mining activities, mainly including changed hydrological and microclimatic site regimes, and impaired ecosystem resilience (Figure 7). First, the available water for reclaimed vegetation may have been limited due to the thin RMS layer and capillary barrier between the RMS layer and the overburden materials below. Reclaimed vegetation had higher plant density and hence higher water consumption. These factors made the reclaimed vegetation more dependent on rainfall. Second, the on-site microclimate was altered due to the changed terrain, vegetation biomass and fragmentation. Third, the low resilience of the reclaimed ecosystem made the reclaimed vegetation recover more slowly from climatic perturbations, which amplified the climatic constraints on reclaimed vegetation.

4.2. Changed Ecological Response to Regional Climatic Pattern—A Common Phenomenon on Reclaimed Mining Lands

Among the aforementioned causes, some are not common on reclaimed mining lands. For example, not always are there such huge topographic differences between reclaimed and original landforms like the Pingshuo mining area, which means that surface mining did not necessarily lead to big changes in on-site wind speed and solar irradiation. Especially when geomorphic reclamation is applied, which mimics the geomorphic function of the natural landscape [60,61,91], the topography is similar with that of the natural landscape.
However, other factors, such as the changed site hydrology and low ecosystem resilience, are ubiquitous on reclaimed mining lands. In general, mining activities can bring about multiple permanent changes to the local biotic and abiotic environment that alter on-site vegetation–climate relationships (Figure 7). Mineral extraction processes eliminate original biotic communities, permanently change the topography, and drastically and permanently disturb natural soil profiles and geological structures [40,41,92]. These disturbances cause multiple impacts on hydrological site functions, including altered surface runoff and infiltration rate due to changed topography and soil properties, decreased soil water holding capacity due to a reduced soil layer, disturbance to vadose zones, and destruction of aquifers [52,53] Given that many terrestrial ecosystems are water-limited [93,94], deteriorated site surface and subsurface hydrological conditions on reclaimed mine lands commonly exacerbate water stress and vegetation sensitivity to rainfall pattern. Moreover, the radically changed biotic and abiotic environment by mining activities inevitably limits the resilience of reclaimed ecosystems, which amplifies their response to climatic perturbations. Therefore, reclaimed ecosystems commonly respond to climatic variability differently than how their adjacent undisturbed analogues do.

4.3. Negative Impacts on Reclaimed Ecosystems

The legacy effects of mining overwhelmed the influence of species combinations, vegetation types, and topography, and made reclaimed vegetation suffer from much greater constraints by climatic variability than unmined vegetation did. First, climatic variability made a much higher relative contribution to variation in reclaimed vegetation (collectively 19.95% to 46.46%) than to unmined vegetation (collectively 0.7% to 1.74%). Second, unmined vegetation was only constrained by temperature and air-humidity variability; however, reclaimed vegetation was subjected to variability in four climatic factors, namely, wind, temperature, rainfall and air humidity. In particular, temperature variability made much greater constraints on the reclaimed vegetation (12.89–40.26%) than on the unmined vegetation (0.7–1.17%). In addition to impact on ecosystem productivity, spring phenology on reclaimed land was markedly delayed, leading to a shortened growing season (Figure 2A). Moreover, reclaimed vegetation had an additional constraint by rainfall variability (0.21–6.20%), which exerted evident influence on unmined vegetation, and the EVI of the former greatly fluctuated with annual rainfall (Figure 2B), indicating that reclaimed vegetation suffers much greater drought stress than its adjacent unmined analogue does.
Generally, as stated in Section 4.2, due to the deteriorated site hydrology and impaired ecological resilience, reclaimed ecosystems are expected to suffer from greater climatic constraints. These constraints both constrain ecosystem productivity and have other ecological impacts. First, it may be a long-neglected cause for differences in species composition and community structure between reclaimed and undisturbed ecosystems. Aggravated climatic constraints may limit some species’ development or even exclude reclaimed mining land from its bioclimatic envelope, and turn reclaimed vegetation into intrazonal vegetation (i.e., bearing the imprint of the zone in which it is located, but distinguished from zonal vegetation [95,96,97]). Second, it may impact ecological processes that underpin ecosystem health and integrity. For example, deteriorated site hydrology and changed temperature regimes may influence microbial activity, and further influence decomposition and nutrient cycling. Third, the high sensitivity and low resilience of reclaimed vegetation to climatic variability raise doubts about the long-term stability and self-sustainability of reclaimed ecosystems under both current and future climatic regimes.

4.4. Implications

This study demonstrated that vegetation–climate relationships can widely differ between a reclaimed ecosystem and its adjacent unmined analogue. This has important research implications.
First, future climatic impact on a reclaimed ecosystem should be simulated with its own response to climatic patterns instead of that of adjacent unmined analogues. Currently, the vegetation–climate relationships of reclaimed ecosystems have been studied little, and the future climatic impacts on these ecosystems are generally simulated using vegetation–climate relationships derived from natural ecosystems. Some studies calibrated the influence of the limited water hold capacity of RMS (e.g., Welham and Seely [15]). However, this still cannot ensure the reliability of the prediction results because our results showed that the low resilience of reclaimed ecosystems is another ineligible influencer of vegetation–climate relationships, and it was not considered. As calibrating its influence may be laborious and time-consuming, and there could be other factors altering climate–vegetation relationships on reclaimed lands, the most reliable method is directly deriving the vegetation–climate relationships of reclaimed ecosystems.
Second, attention should be paid to the vegetation–climate relationships of reclaimed ecosystems, and these relationships can be effectively revealed with remote-sensing vegetation data and meteorological data. Identifying and quantifying climatic drivers of ecosystem productivity is the basis for predicting the impact of climatic changes. Climatic drivers are not limited to the climatic variability on which this study focused, but also include climatic mean and extreme events, which have important influence on ecosystem structure and functioning [98,99,100,101]. In addition to ecosystem productivity, the changed hydrological and microclimatic site regimes may also impact species composition, community structure, ecological processes, and ecosystem stability. Understanding all these ecological consequences allows for understanding both current and future climatic impacts on reclaimed ecosystems.
Lastly, efforts are required on revealing the mechanisms of how surface mining or reclamation processes change climatic constraints or drivers on reclaimed lands. Although we analysed possible causes in this study, i.e., changed hydrological and microclimatic site regimes, and impaired ecological resilience, these causes require further confirmation, and their mechanisms need to be revealed. Relevant research would enable us to minimise changes in vegetation–climate relationships through optimising surface mining or reclamation technologies.

5. Conclusions

This study demonstrated that the legacy effects of surface mining can significantly change on-site vegetation–climate relationships, and their influence can overwhelm general influencing factors for vegetation–climate relationships found in natural ecosystems (namely, species combination, vegetation type, and topography). These legacy effects are complex, mainly including changed hydrological and microclimatic regimes, and impaired on-site ecosystem resilience. These factors are expected to aggravate climatic constraints on reclaimed ecosystems, which may impact ecosystem structure and functioning, and threaten long-term ecosystem stability and self-sustainability. Our findings suggest that future climatic impacts on a reclaimed ecosystem should be projected with its own vegetation–climate relationships instead of those derived from the natural ecosystem. Further research should be conducted on the extent, causes, and ecological impacts of changed vegetation–climatic relationships on reclaimed mining lands. Understanding these issues is the basis for predicting climate-change impact on re-established ecosystems, and designing stable and self-sustainable reclaimed ecosystems under both current and future climatic regimes.

Author Contributions

Conceptualisation, X.F.; methodology, Y.S. and H.B.; software, Y.S.; validation, X.F. and Y.S.; formal analysis, Y.S.; investigation, X.F. and C.Z.; resources, C.Z.; data curation, X.F. and C.Z.; writing—original-draft preparation, X.F.; writing—review and editing, Y.S., H.B. and C.Z.; supervision, Z.B.; project administration, Z.B.; funding acquisition, Z.B. All authors have read and agreed to the published version of the manuscript.

Funding

This research was funded by the National Key Research and Development Program of China, grant number 2017YFF0206800.

Conflicts of Interest

The authors declare no conflict of interest.

Appendix A

Figure A1. EVI data sample.
Remotesensing 13 01100 g0a1

Appendix B

Figure A2. Land-surface temperature (LST, °C) in May and August 1993, 2005, and 2016. LST in 1993 and 2005 calculated using the land-surface-temperature retrieval method by Sobrino et al. [102]. LST in 2016 calculated with Bands 10 and 11 in Landsat 8 using split-window algorithm [103,104].
Remotesensing 13 01100 g0a2

References

  1. Kalyvas, G.; Gasparatos, D.; Papassiopi, N.; Massas, I. Topsoil pollution as ecological footprint of historical mining activities in Greece. Land Degrad. Dev. 2018, 29, 2025–2035. [Google Scholar] [CrossRef]
  2. Yang, J.Z. Remote Sensing Monitoring of Mine Geological Environment in China; Geological Publishing House: Beijing, China, 2016. (In Chinese) [Google Scholar]
  3. Ministry of Housing and Urban-rural Development of the People’s Republic of China. China Urban-Rural Construction Statistical Yearbook 2017; China Planning Press: Beijing, China, 2017; p. 89. (In Chinese)
  4. Whitehorse Mining Initiative (WMI). The Whitehorse Mining Initiative Leadership Council Accord—Final Report; WMI: Ottawa, ON, Canada, 1994. [Google Scholar]
  5. Grant, C.; Loch, R.; McCaffrey, N.; Anstee, S.; Doley, D. Mine Rehabilitation: Leading Practice Sustainable Development Program for the Mining Industry; Commonwealth of Australia: Canberra, ACT, Australia, 2016.
  6. Office of Surface Mining Reclamation and Enforcement (OSMRE). Public Law 95-87, Surface Mining Control and Reclamation Act of 1977; U.S. Department of the Interior: Washington, DC, USA, 2012.
  7. Walther, G.-R.; Post, E.; Convey, P.; Menzel, A.; Parmesan, C.; Beebee, T.J.C.; Fromentin, J.-M.; Hoegh-Guldberg, O.; Bairlein, F. Ecological responses to recent climate change. Nat. Cell Biol. 2002, 416, 389–395. [Google Scholar] [CrossRef] [PubMed]
  8. Thomas, C.D.; Cameron, A.; Green, R.E.; Bakkenes, M.; Beaumont, L.J.; Collingham, Y.C.; Erasmus, B.F.N.; De Siqueira, M.F.; Grainger, A.; Hannah, L.; et al. Extinction risk from climate change. Nature 2004, 427, 145–148. [Google Scholar] [CrossRef]
  9. Parmesan, C.; Yohe, G. A globally coherent fingerprint of climate change impacts across natural systems. Nat. Cell Biol. 2003, 421, 37–42. [Google Scholar] [CrossRef]
  10. IPCC Climate Change 2007: Impacts, Adaptation and Vulnerability. Contributionof Working Group II to the Fourth Assessment Report of the Intergovernmental Panel on Climate Change; Cambridge University Press: Cambridge, UK, 2007; p. 976. [Google Scholar]
  11. Welham, C.; Seely, B. Oil Sands Terrestrial Habitat and Risk Modelling for Disturbance and Reclamation—Phase II Report; OSRIN Report No. TR-15; University of Alberta’s Education & Research Archive: Edmonton, AB, Canada, 2011; p. 93. [Google Scholar]
  12. Hodgkinson, J.; Littleboy, A.; Howden, S.; Moffat, K.; Loechel, B. Climate Adaptation in the Australian Mining and Exploration Industries; Climate Adaptation Flagship Working Paper #5; CSIRO: Kenmore, QLD, Australia, 2010. [Google Scholar]
  13. Audet, P.; Pinno, B.D.; Thiffault, E. Reclamation of boreal forest after oil sands mining: Anticipating novel challenges in novel environments. Can. J. For. Res. 2015, 45, 364–371. [Google Scholar] [CrossRef] [Green Version]
  14. Sklenicka, P.; Prikryl, I.; Svoboda, I.; Lhota, T. Non-productive principles of landscape rehabilitation after long-term open-cast mining in north-west Bohemia. J. S. Afr. Inst. Min. Metall. 2004, 104, 83–88. [Google Scholar]
  15. Welham, C.; Seely, B. Oil Sands Terrestrial Habitat and Risk Modelling for Disturbance and Reclamation: The Impact of Climate Change on Tree Regeneration and Productivity—Phase III Report; OSRIN Report No. TR-36; University of Alberta’s Education & Research Archive: Edmonton, AB, Canada, 2013; p. 65. [Google Scholar]
  16. Rooney, R.C.; Robinson, D.T.; Petrone, R. Megaproject reclamation and climate change. Nat. Clim. Chang. 2015, 5, 963–966. [Google Scholar] [CrossRef]
  17. Mason, L.M.; Unger, C.; Lederwasch, A.J.; Razian, H.; Wynne, L.E.; Giurco, D. Adapting to Climate Risks and Extreme Weather: A Guide for Mining and Minerals Industry Professionals; National Climate Change Adaptation Research Facility: Gold Coast, Australia, 2013; p. 76. [Google Scholar]
  18. Alam, M.; Barbour, S.; Elshorbagy, A.; Huang, M. The Impact of Climate Change on the Performance of Oil Sands Reclama-tion Covers: A Comparison of Multiple General Circulation Models and Representative Concentration Pathways. In Proceedings of the 70th Canadian Geotechnical Conference (GeoOttawa 2017), Ottawa, ON, Canada, 1–4 October 2017. [Google Scholar]
  19. Zheng, Y.; Han, J.; Huang, Y.; Fassnacht, S.R.; Xie, S.; Lv, E.; Chen, M. Vegetation response to climate conditions based on NDVI simulations using stepwise cluster analysis for the Three-River Headwaters region of China. Ecol. Indic. 2018, 92, 18–29. [Google Scholar] [CrossRef]
  20. Wang, J.; Rich, P.M.; Price, K.P. Temporal responses of NDVI to precipitation and temperature in the central Great Plains, USA. Int. J. Remote Sens. 2003, 24, 2345–2364. [Google Scholar] [CrossRef]
  21. Piao, S.; Mohammat, A.; Fang, J.; Qiang, C.; Feng, J. NDVI-based increase in growth of temperate grasslands and its responses to climate changes in China. Glob. Environ. Chang. 2006, 16, 340–348. [Google Scholar] [CrossRef]
  22. Herrmann, S.M.; Anyamba, A.; Tucker, C.J. Recent trends in vegetation dynamics in the African Sahel and their relationship to climate. Glob. Environ. Chang. 2017, 15, 394–404. [Google Scholar] [CrossRef]
  23. De Jong, R.; Schaepman, M.E.; Furrer, R.; De Bruin, S.; Verburg, P.H. Spatial relationship between climatologies and changes in global vegetation activity. Glob. Chang. Biol. 2013, 19, 1953–1964. [Google Scholar] [CrossRef]
  24. Munson, S.M.; Webb, R.H.; Housman, D.C.; Veblen, K.E.; Nussear, K.E.; Beever, E.A.; Hartney, K.B.; Miriti, M.N.; Phillips, S.L.; Fulton, R.E.; et al. Long-term plant responses to climate are moderated by biophysical attributes in a North American desert. J. Ecol. 2015, 103, 657–668. [Google Scholar] [CrossRef]
  25. Witwicki, D.L.; Munson, S.M.; Thoma, D.P. Effects of climate and water balance across grasslands of varying C 3 and C 4 grass cover. Ecosphere 2016, 7. [Google Scholar] [CrossRef]
  26. Liancourt, P.; Spence, L.A.; Song, D.S.; Lkhagva, A.; Sharkhuu, A.; Boldgiv, B.; Helliker, B.R.; Casper, P.B.B. Plant re-sponse to climate change varies with topography, interactions with neighbors, and ecotype. Ecology 2013, 94, 444–453. [Google Scholar] [CrossRef] [PubMed] [Green Version]
  27. Gremer, J.R.; Andrews, C.; Norris, J.R.; Thomas, L.P.; Munson, S.M.; Duniway, M.C.; Bradford, J.B. Increasing tempera-ture seasonality may overwhelm shifts in soil moisture to favor shrub over grass dominance in Colorado Plateau drylands. Oecologia 2018, 188, 1195–1207. [Google Scholar] [CrossRef]
  28. Wu, D.H.; Zhao, X.; Liang, S.L.; Zhou, T.; Huang, K.C.; Tang, B.J.; Zhao, W.Q. Time-lag effects of global vegetation responses to climate change. Glob. Chang. Biol. 2015, 21, 3520–3531. [Google Scholar] [CrossRef]
  29. Horion, S.; Cornet, Y.; Erpicum, M.; Tychon, B. Studying interactions between climate variability and vegetation dynamic using a phenology based approach. Int. J. Appl. Earth Obs. Geoinf. 2013, 20, 20–32. [Google Scholar] [CrossRef]
  30. Ding, Y.; Li, Z.; Peng, S. Global analysis of time-lag and -accumulation effects of climate on vegetation growth. Int. J. Appl. Earth Obs. Geoinf. 2020, 92, 102179. [Google Scholar] [CrossRef]
  31. Nicholson, S.; Farrar, T. The influence of soil type on the relationships between NDVI, rainfall, and soil moisture in semiarid Botswana. I. NDVI response to rainfall. Remote Sens. Environ. 1994, 50, 107–120. [Google Scholar] [CrossRef]
  32. Lei, J.; Peters, A.J. Assessing vegetation response to drought in the northern Great Plains using vegetation and drought indices. Remote Sens. Environ. 2003, 87, 85–98. [Google Scholar]
  33. Gremer, J.R.; Bradford, J.B.; Munson, S.M.; Duniway, M.C. Desert grassland responses to climate and soil moisture suggest divergent vulnerabilities across the southwestern United States. Glob. Chang. Biol. 2015, 21, 4049–4062. [Google Scholar] [CrossRef] [PubMed] [Green Version]
  34. White, A.B.; Kumar, P.; Tcheng, D. A data mining approach for understanding topographic control on climate-induced inter-annual vegetation variability over the United States. Remote Sens. Environ. 2005, 98, 1–20. [Google Scholar] [CrossRef]
  35. Smith, S.D.; Herr, C.A.; Leary, K.L.; Piorkowski, J.M. Soil-plant water relations in a Mojave Desert mixed shrubcommuni-ty: A comparison of three geomorphic surfaces. J. Arid. Environ. 1995, 29, 339–351. [Google Scholar] [CrossRef]
  36. McLaughlin, B.C.; Blakey, R.; Weitz, A.P.; Feng, X.; Brown, B.J.; Ackerly, D.D.; Dawson, T.E.; Thompson, S.E. Weather underground: Subsurface hydrologic processes mediate tree vulnerability to extreme climatic drought. Glob. Chang. Biol. 2020, 26, 3091–3107. [Google Scholar] [CrossRef]
  37. Singh, C.; Lan, W.E.; Fetzer, I.; Rockstrm, J.; Ent, R.V.D. Rootzone storage capacity reveals drought coping strategies along rainforest-savanna transitions. Environ. Res. Lett. 2020, 15, 124021. [Google Scholar] [CrossRef]
  38. Froend, R.; Sommer, B. Phreatophytic vegetation response to climatic and abstraction-induced groundwater drawdown: Examples of long-term spatial and temporal variability in community response. Ecol. Eng. 2010, 36, 1191–1200. [Google Scholar] [CrossRef]
  39. Ciruzzi, D.M. Tree Growth Response to Drought along a Depth to Groundwater Gradient in Northern Wisconsin. In Proceedings of the AGU Fall Meeting, New Orleans, LA, USA, 11–15 December 2017. [Google Scholar]
  40. Doley, D.; Audet, P.; Mulligan, D. Examining the Australian context for post-mined land rehabilitation: Reconciling a paradigm for the development of natural and novel ecosystems among post-disturbance landscapes. Agric. Ecosyst. Environ. 2012, 163, 85–93. [Google Scholar] [CrossRef]
  41. Doley, D.; Audet, P. Adopting novel ecosystems as suitable rehabilitation alternatives for former mine sites. Ecol. Process. 2013, 2, 22. [Google Scholar] [CrossRef] [Green Version]
  42. Welham, C.; Seely, B. Oil Sands Terrestrial Habitat and Risk Modeling for Disturbance and Reclamation—Phase I Report; OSRIN Report No. TR-8; University of Alberta’s Education & Research Archive: Edmonton, AB, Canada, 2010; p. 109. [Google Scholar]
  43. Ngugi, M.R.; Neldner, V.J.; Doley, D.; Kusy, B.; Moore, D.; Richter, C. Soil moisture dynamics and restoration of self-sustaining native vegetation ecosystem on an open-cut coal mine. Restor. Ecol. 2015, 23, 615–624. [Google Scholar] [CrossRef]
  44. Bateman, A.; Lewandrowski, W.; Stevens, J.C.; Muñoz-Rojas, M. Ecophysiological Indicators to Assess Drought Responses of Arid Zone Native Seedlings in Reconstructed Soils. Land Degrad. Dev. 2016, 29, 984–993. [Google Scholar] [CrossRef]
  45. Wang, J.; Guo, L.; Bai, Z.; Yang, L. Using computed tomography (CT) images and multi-fractal theory to quantify the pore distribution of reconstructed soils during ecological restoration in opencast coal-mine. Ecol. Eng. 2016, 92, 148–157. [Google Scholar] [CrossRef]
  46. Shukla, M.K.; Lal, R.; Underwood, J.; Ebinger, M. Physical and hydrological characteristics of reclaimed minesoils in south-eastern Ohio. Soil Sci. Soc. Am. J. 2004, 68, 1352–1359. [Google Scholar] [CrossRef]
  47. Moffat, A.J.; McNeill, J.D. During mineral extraction. In Reclaiming Disturbed Land for Forestry; HMSO: London, UK, 1994; pp. 28–29. [Google Scholar]
  48. Marashi, A.R.A.; Scullion, J. In Porosity and hydrological changes in surface mine soils. In Proceedings of the ISCO 2004—13th International Soil Conservation Organisation Conference “Conserving Soil and Water for Society”, Brisban, Australia, 4–9 July 2004. [Google Scholar]
  49. Acton, P.M.; Fox, J.F.; Campbell, J.E.; Jones, A.L.; Rowe, H.; Martin, D.; Bryson, S. Role of Soil Health in Maintaining En-vironmental Sustainability of Surface Coal Mining. Environ. Sci. Technol. 2011, 45, 10265–10272. [Google Scholar] [CrossRef]
  50. Rushton, S. Development of earthworm populations on pasture land reclaimed from open-cast coal mining. Pedobiologia 1986, 29, 27–32. [Google Scholar]
  51. Zipper, C.E.; Burger, J.A.; Barton, C.D.; Skousen, J.G. Rebuilding Soils on Mined Land for Native Forests in Appalachia. Soil Sci. Soc. Am. J. 2013, 77, 337–349. [Google Scholar] [CrossRef] [Green Version]
  52. Starnes, L.B.; Gasper, D.C. Effects of surface mining on aquatic resources in North America. Fisheries 1995, 20, 90904. [Google Scholar]
  53. Evans, D.M.; Zipper, C.E.; Hester, E.T.; Schoenholtz, S.H. Hydrologic Effects of Surface Coal Mining in Appalachia (U.S.). JAWRA J. Am. Water Resour. Assoc. 2015, 51, 1436–1452. [Google Scholar] [CrossRef]
  54. Naeth, M.A.; Chanasyk, D.; Burgers, T. Vegetation and soil water interactions on a tailings sand storage facility in the athabasca oil sands region of Alberta Canada. Phys. Chem. Earth Parts A/B/C 2011, 36, 19–30. [Google Scholar] [CrossRef]
  55. Hawkins, J.W. Predictability of surface mine spoil hydrologic properties in the Appalachian Plateau. Ground Water 2004, 42, 119–125. [Google Scholar] [CrossRef]
  56. Duan, M.; House, J.; Chang, S.X. Limiting factors for lodgepole pine (Pinus contorta) and white spruce (Picea glauca) growth differ in some reconstructed sites in the Athabasca oil sands region. Ecol. Eng. 2015, 75, 323–331. [Google Scholar] [CrossRef]
  57. Jung, K.; Duan, M.; House, J.; Chang, S.X. Textural interfaces affected the distribution of roots, water, and nutrients in some reconstructed forest soils in the Athabasca oil sands region. Ecol. Eng. 2014, 64, 240–249. [Google Scholar] [CrossRef]
  58. A Maigret, T.; Cox, J.J.; Yang, J. Persistent geophysical effects of mining threaten ridgetop biota of Appalachian forests. Front. Ecol. Environ. 2019, 17, 85–91. [Google Scholar] [CrossRef]
  59. Wickham, J.; Wood, P.B.; Nicholson, M.C.; Jenkins, W.; Druckenbrod, D.; Suter, G.W.; Strager, M.P.; Mazzarella, C.; Galloway, W.; Amos, J. The Overlooked Terrestrial Impacts of Mountaintop Mining. Bioscience 2013, 63, 335–348. [Google Scholar] [CrossRef]
  60. Toy, T.J.; Chuse, W.R. Topographic reconstruction: A geomorphic approach. Ecol. Eng. 2005, 24, 29–35. [Google Scholar] [CrossRef]
  61. Sears, A.E. Hydrologic Response and Erosion Modeling of Geomorphic Landform Reclamation in Mountainous Terrain; West Virginia University Libraries: Morgantown, WV, USA, 2019. [Google Scholar]
  62. Zhao, Z.; Bai, Z.; Zhang, Z.; Guo, D.; Li, J.; Xu, Z.; Pan, Z. Population structure and spatial distributions patterns of 17 years old plantation in a reclaimed spoil of Pingshuo opencast mine, China. Ecol. Eng. 2012, 44, 147–151. [Google Scholar] [CrossRef]
  63. IUSS Working Group WRB. World Reference Base for Soil Resources 2014, Update 2015. In International Soil Classification System for Naming Soils and Creating Legends for Soil Maps; World Soil Resources Reports No. 106; FAO: Rome, Italy, 2015. [Google Scholar]
  64. Zhu, S. Study on the forest distribution and ecological environment history period of the Loess Plateau in China. Yellow River Civiliz. Sustain. Dev. 2013, 3, 85–104, (In Chinese with English Abstract). [Google Scholar]
  65. Zhang, J.T.; Shangguan, T.L. Something about the Boundary between the Forest Region and the Steppe Region and the Distribution of the Forst-Steppe Zone in the Northwest of Shanxi Province. J. Shanxi Univ. 1988, 2, 68–73, (In Chinese with English Abstract). [Google Scholar]
  66. National Forestry and Grassland Administration. Northwest, North and Northeast Shelter Forest Construction; Ningxia Press: Yinchuan, China, 1993. (In Chinese)
  67. The Promotion of Ecological Civilization in Pinglu. Available online: http://sxsz.wenming.cn/qxwm/201501/t20150114_1545193.html (accessed on 10 December 2020). (In Chinese).
  68. Yue, J.Y.; Guo, C.Y.; Li, J.C.; Lu, N.; Wang, X.; Li, J.R. Colonized wild plants in the reclamation area of the Antaibao Opencast Coal Mine. Arid Zone Res. 2016, 33, 399–409, (In Chinese with English abstract). [Google Scholar]
  69. Yuan, Y.; Zhao, Z.; Niu, S.; Li, X.; Wang, Y.; Bai, Z. Reclamation promotes the succession of the soil and vegetation in opencast coal mine: A case study from Robinia pseudoacacia reclaimed forests, Pingshuo mine, China. Catena 2018, 165, 72–79. [Google Scholar] [CrossRef]
  70. Zhao, Z.; Shahrour, I.; Bai, Z.; Fan, W.; Feng, L.; Li, H. Soils development in opencast coal mine spoils reclaimed for 1–13 years in the West-Northern Loess Plateau of China. Eur. J. Soil Biol. 2013, 55, 40–46. [Google Scholar] [CrossRef]
  71. Bai, W.X. Ecological Effects of Typical Vegetation-Soil System on Reclaimed Dumps in Antaibao Surface Mining Area of Shanxi; Shanxi University: Taiyuan, China, 2018; (In Chinese with English Abstract). [Google Scholar]
  72. Huete, A.; Didan, K.; Miura, T.; Rodriguez, E.P.; Gao, X.; Ferreira, L.G. Overview of the radiometric and biophysical per-formance of the MODIS vegetation indices. Remote Sens. Environ. 2002, 83, 195–213. [Google Scholar] [CrossRef]
  73. Didan, K.; Munoz, A.B.; Solano, R.; Huete, A. MODIS Vegetation Index User’s Guide (MOD13 Series); Vegetation Index and Phenology Lab, The University of Arizona: Tucson, AZ, USA, 2015; pp. 1–38. [Google Scholar]
  74. Resource and Environment Data Cloud Platform, C. Available online: http://www.resdc.cn (accessed on 5 May 2019).
  75. Buyantuyev, A.; Wu, J. Urbanization diversifies land surface phenology in arid environments: Interactions among vegeta-tion, climatic variation, and land use pattern in the Phoenix metropolitan region, USA. Landsc. Urban Plan. 2012, 105, 149–159. [Google Scholar] [CrossRef]
  76. Bai, Z.K.; Lv, C.J.; Wang, J.M.; Wu, X.; Xu, N.X. Soil Erosion Control and Water Resources Utilization in Mining Area; China Dadi Press: Bejing, China, 2012. (In Chinese) [Google Scholar]
  77. Standards Association of Australia. Structural Design Actions, Part 2: Wind Actions (Vol. AS/NZS 1170.2:2002); Standards Australia Limited/Standards New Zealand: Sydney, Australia, 2002. [Google Scholar]
  78. National Research Council of Canada. National Building Code of Canada; Canadian Commission on Building and Fire Codes: Ottawa, ON, Canada, 2005.
  79. European Commission. European Standard, (Vol. CEN TC 250). In Eurocode 1: Actions on Structures-Part 1–4: General Actions-Wind Actions; ASCE Press: Reston, VA, USA, 2005. [Google Scholar]
  80. American Society of Civil Engineers. Minimum Design Loads for Buildings and Other Structures; American Society of Civil Engineers: Fort Collins, CO, USA, 2010. [Google Scholar]
  81. Li, J.C.; Bai, Z.K. Land Reclamation and Ecological Restoration of Openpit Coal Mine; China Science Press: Beijing, China, 2000. (In Chinese) [Google Scholar]
  82. Magnago, L.F.S.; Rocha, M.F.; Meyer, L.; Martins, S.V.; Meira-Neto, J.A.A. Microclimatic conditions at forest edges have significant impacts on vegetation structure in large Atlantic forest fragments. Biodivers. Conserv. 2015, 24, 2305–2318. [Google Scholar] [CrossRef]
  83. Godefroid, S.; Rucquoij, S.; Koedam, N. Spatial variability of summer microclimates and plant species response along tran-sects within clearcuts in a beech forest. Plant Ecol. 2006, 185, 107. [Google Scholar] [CrossRef]
  84. Gehlhausen, S.M.; Schwartz, M.W.; Augspurger, C.K. Vegetation and microclimatic edge effects in two mixed-mesophytic forest fragments. Plant Ecol. 2000, 147, 21–35. [Google Scholar] [CrossRef]
  85. Young, A.; Mitchell, N. Microclimate and vegetation edge effects in a fragmented podocarp-broadleaf forest in New Zealand. Biol. Conserv. 1994, 67, 63–72. [Google Scholar] [CrossRef]
  86. Davies-Colley, R.J.; Payne, G.W.; Elswijk, M.V. Microclimate gradients across a forest edge. N. Z. J. Ecol. 2000, 24, 111–121. [Google Scholar]
  87. Veraart, A.J.; Faassen, E.J.; Dakos, V.; Van Nes, E.H.; Lürling, M.; Scheffer, M. Recovery rates reflect distance to a tipping point in a living system. Nat. Cell Biol. 2012, 481, 357–359. [Google Scholar] [CrossRef]
  88. Van Nes, E.H.; Scheffer, M. Slow recovery from perturbations as a generic indicator of a nearby catastrophic shift. Am. Nat. 2007, 169, 738–747. [Google Scholar] [CrossRef] [PubMed]
  89. Dakos, V.; Carpenter, S.R.; Van Nes, E.H.; Scheffer, M. Resilience indicators: Prospects and limitations for early warnings of regime shifts. Philos. Trans. R. Soc. B Biol. Sci. 2015, 370, 20130263. [Google Scholar] [CrossRef] [Green Version]
  90. Hu, Z.; Guo, Q.; Li, S.; Piao, S.; Knapp, A.K.; Ciais, P.; Li, X.; Yu, G. Shifts in the dynamics of productivity signal ecosystem state transitions at the biome-scale. Ecol. Lett. 2018, 21, 1457–1466. [Google Scholar] [CrossRef] [PubMed]
  91. Martín-Duque, J.F.; Sanz, M.A.; Bodoque, J.M.; Lucía, A.; Martín-Moreno, C. Restoring earth surface processes through landform design. A 13-year monitoring of a geomorphic reclamation model for quarries on slopes. Earth Surf. Process. Landf. 2010, 35, 531–548. [Google Scholar] [CrossRef] [Green Version]
  92. Shrestha, R.K.; Lal, R. Ecosystem carbon budgeting and soil carbon sequestration in reclaimed mine soil. Environ. Int. 2006, 32, 781–796. [Google Scholar] [CrossRef] [PubMed]
  93. Bernacchi, C.J.; Vanloocke, A. Terrestrial Ecosystems in a Changing Environment: A Dominant Role for Water. Annu. Rev. Plant Biol. 2015, 66, 599–622. [Google Scholar] [CrossRef] [Green Version]
  94. Seddon, A.W.R.; Macias-Fauria, M.; Long, P.R.; Benz, D.; Willis, P.R.L.D.B.K.J. Sensitivity of global terrestrial ecosystems to climate variability. Nat. Cell Biol. 2016, 531, 229–232. [Google Scholar] [CrossRef] [Green Version]
  95. Pedrotti, F. Vegetation Series along Climatic Gradients in the Central Southern Alps (Trentino- Alto Adige Region). In Geobotany Studies; Springer International Publishing: Berlin/Heidelberg, Germany, 2017; pp. 51–81. [Google Scholar]
  96. Mucina, L.; Rutherford, M.C.; Powrie, L.W. Inland azonal vegetation. Strelitzia 2006, 19, 617–657. [Google Scholar]
  97. Prokhorov, A.M. Great Soviet Encyclopedia, 3rd ed.; Collier Macmillan: London, UK; Available online: https://encyclopedia2.thefreedictionary.com/Intrazonal+Vegetation (accessed on 20 December 2019).
  98. Shukla, P.R.; Skea, J.; Slade, R.; van Diemen, R.; Haughey, E.; Malley, J.; Pathak, M.; Portugal Pereira, J.E. Technical Summary. In Climate Change and Land: An IPCC Special Report on Climate Change, Desertification, Land Degradation, Sustainable Land Management, Food Security, and Greenhouse Gas Fluxes in Terrestrial Ecosystems; IPCC: Geneva, Switzerland, 2019. [Google Scholar]
  99. IPCC. IPCC Climate Change 2014: Impacts. Adaptation, and Vulnerability. In Part A: Global and Sectoral Aspects. Contribution of Working Group II to the Fifth Assessment Report of the Intergovernmental Panel on Climate Change; Cambridge University Press: Cambridge, UK; New York, NY, USA, 2014; p. 1132. [Google Scholar]
  100. Hoegh-Guldberg, O.; Jacob, D.; Bindi, M.; Brown, S.; Camilloni, I.; Diedhiou, A.; Djalante, R.; Ebi, K.; Engelbrecht, F.; Guiot, J.; et al. Impacts of 1.5 °C Global Warming on Natural and Human Systems; Intergovernmental Panel on Climate Change: Geneva, Switzerland, 2018. [Google Scholar]
  101. Frank, D.A.; Reichstein, M.; Bahn, M.; Thonicke, K.; Frank, D.; Mahecha, M.D.; Smith, P.; Van Der Velde, M.; Vicca, S.; Babst, F.; et al. Effects of climate extremes on the terrestrial carbon cycle: Concepts, processes and potential future impacts. Glob. Chang. Biol. 2015, 21, 2861–2880. [Google Scholar] [CrossRef] [PubMed] [Green Version]
  102. Sobrino, J.A.; Jiménez-Muñoz, J.C.; Paolini, L. Land surface temperature retrieval from LANDSAT TM 5. Remote Sens. Environ. 2004, 90, 434–440. [Google Scholar] [CrossRef]
  103. Du, H.; Xue, X.; Wang, T.; Deng, X. Assessment of wind-erosion risk in the watershed of the Ningxia-Inner Mongolia Reach of the Yellow River, northern China. Aeolian Res. 2015, 17, 193–204. [Google Scholar] [CrossRef]
  104. Ren, H.; Du, C.; Liu, R.; Qin, Q.; Yan, G.; Li, Z.-L.; Meng, J. Atmospheric water vapor retrieval from Landsat 8 thermal infrared images. J. Geophys. Res. Atmos. 2015, 120, 1723–1738. [Google Scholar] [CrossRef]
Figure 1. Study area and sample plots.
Remotesensing 13 01100 g001
Figure 2. (A) MODIS enhanced vegetation index (EVI) variation with day of year over field plots; (B) annual maximal MODIS EVI over field plots, and average annual temperature and annual rainfall from meteorological stations.
Remotesensing 13 01100 g002
Figure 3. (A) Exploration processes of potential variables and their contributions on vegetation variations; (B) illustration of accumulation periods (climatic variables) and time lags (climatic variables vs. EVI).
Remotesensing 13 01100 g003
Figure 4. Comparison between accumulated and lagged effects for climatic variables. Correlation was significant at p < 0.05. (A) Accumulated rainfall; (B) accumulated nonrunoff rainfall (≤20 mm); (C) mean temperature; (D) mean minimal temperature; (E) mean maximal temperature; (F) mean relative humidity during the past days; (G) mean sunshine hours; (H) mean wind speed; (I) mean vapor pressure.
Remotesensing 13 01100 g004
Figure 5. Comparison of vegetation response to climatic variables between reclaimed and unmined lands.
Remotesensing 13 01100 g005
Figure 6. Terrain of study area (2003; generated from image ASTGTM2-N39E112. Terrain of southern dump and unmined plots has been unchanged since late 1990s).
Remotesensing 13 01100 g006
Figure 7. How surface-mining impacts changed ecological site response to climatic variability. ① Limited soil layer on reclaimed land restricted water availability of plants; ② reconstructed geologic structure changed subsurface hydrological processes; ③ deteriorated hydrological site function made vegetation rely more on regular rainfall; ④ higher plant density led to quicker water depletion; ⑤ greatly changed topography altered wind regime on sites; ⑥ ecological response to regional wind variability was changed due to changed wind speed in site microclimate; ⑦ changed topography altered site temperature regime by influencing solar irradiation reaching the site surface; ⑧ accelerated air flow increased heat loss by turbulent heat flux; ⑨ higher plant density led to greater evapotranspiration and hence latent heat flux; ⑩ ecological response to regional temperature regime was changed due to altered temperature regime on sites;⑪ high fragmentation led to lower air humidity in the microclimate; ⑫ attributes of re-established ecosystem were different from those of the original ecosystem due to drastically and permanently changed biotic and abiotic elements by mining; ⑬ low ecosystem resilience reduced recovery rates from climatic perturbations. Note: Dashed arrow, factors not common for other reclaimed areas.
Remotesensing 13 01100 g007
Table 1. Detailed information for sample plots.
Sample PlotAverage
Elevation (m)
Average Slope (°)Terrain TypeSpecies Code *TypeRevegetation Year
S0136213SlopeROPSArbour1993
ULPU
S1134513SlopeROPSArbour1993
PITA
S213748PlatformPITAArbour1993
S313834PlatformROPSArbour1993
ULPU
AIAL
S4143919SlopeROPSArbour1993
PITA
S514362PlatformROPSArbour1993
S614563PlatformC.KShrub1993
UD11479.123Flat GroundPOSIArbour1980s
UD21439.205Flat GroundPOSIArbour1980s
* Species codes: Robinia pseudoacacia (ROPS), Ulmus pumila (ULPU), Pinus tabuliformis (PITA), Ailanthus altissima (AIAL), Caragana korshinskii (C.K), Populus simonii (POSI). Robinia pseudoacacia, an introduced species from North America, is wildly used in reclamation in North China. Other species are local.
Table 3. Accumulation periods of each variable in each plot.
VariableUnitDays of Accumulated or Mean Values for Each Sample Plot
S0S1S2S3S4S5S6UD1UD2
Accumulated rainfall0.1 mm6060606060606030/ *
Accumulated nonrunoff rainfall (≤20 mm)0.1 mm6060606060606030/
Mean temperature 0.1 °C455045504565651510
Mean minimum temperature 0.1 °C304545453060451010
Mean maximum temperature 0.1 °C455045504565651515
Mean relative humidity 1%10101010102510//
Mean sunshine hours 0.1 h10253025253030//
Mean wind speed 0.1 m/s20203520153535//
Mean vapour pressure 0.1 hPa252525252535301010
* Slash: correlation between variable and EVI was not significant (p < 0.05).
Table 4. Selected explanatory variables for EVI variations in each sample plot, their correlation coefficients with EVI, and contributions quantified by variance explained by variables.
Number of Sample PlotsVariableCorrelation CoefficientExplained Variance (%)
S0Reclaimed years0.35149.66
Accumulated nonrunoff rainfall (≤20 mm) during past 60 days0.5591.26
Mean minimal temperature during past 30 days0.69623.99
Mean relative humidity during past 10 days0.5812.10
Total variance explained by variables (%) 77.02
S1Reclaimed years0.28543.72
Accumulated nonrunoff rainfall (≤20 mm) during past 60 days0.6012.37
Mean minimal temperature during past 45 days0.70423.18
Mean relative humidity during past 10 days0.5981.84
Total variance explained by variables (%) 71.12
S2Reclaimed years0.62966.45
Accumulated nonrunoff rainfall (≤20 mm) during past 60 days0.5091.53
Mean minimal temperature during past 45 days0.60912.89
Mean relative humidity during past 10 days0.5052.00
Mean wind speed during past 35 days–0.3653.53
Total variance explained by variables (%) 86.40
S3Reclaimed years0.36836.81
Accumulated nonrunoff rainfall (≤20 mm) during past 60 days0.5890.21
Mean minimal temperature during past 45 days0.73638.92
Total variance explained by variables (%) 75.94
S4Reclaimed years0.25228.47
Accumulated nonrunoff rainfall (≤20 mm) during the past 60 days0.5856.20
Mean minimal temperature during past 30 days0.73140.26
Total variance explained by variables (%) 74.94
S5Reclaimed years0.25950.56
Accumulated nonrunoff rainfall (≤20 mm) during past 60 days0.6466.01
Mean wind speed during past 35 days–0.4719.38
Mean vapour pressure during past 25 days0.67712.75
Total variance explained by variables (%) 78.71
S6Reclaimed years0.47861.92
Accumulated nonrunoff rainfall (≤20 mm) during past 60 days0.5700.81
Mean minimal temperature during past 45 days0.63013.32
Mean relative humidity during past 10 days0.5591.17
Mean wind speed during past 35 days–0.3764.84
Total variance explained by variables (%) 82.07
UD1Day of year–0.32412.84
Restored years0.66070.60
Mean temperature during past 15 days0.4410.70
Total variance explained by variables (%) 84.13
UD2Day of year–0.41817.36
Restored years0.53269.28
Mean temperature during past 10 days0.5041.17
Mean vapor pressure during past 10 days0.2650.57
Total variance explained by variables (%) 88.37
Publisher’s Note: MDPI stays neutral with regard to jurisdictional claims in published maps and institutional affiliations.

