Abstract
The Tehran basin has been increasingly affected by subsidence during the last few decades due to groundwater withdrawal. Hence, the study of the strength of the power towers (PTs) of transmission lines, as vital structures, is an important subject. In this paper, the persistent scatterer interferometry (PSI) method was applied on data stacks from two satellites (i.e., X-band COSMO-SkyMed (CSK) and C-band Sentinel-1A (S-1A)) obtained between 2014 and 2016 to investigate the deformation and the exact amount of displacement in each PT of the area of interest. Based on the results, during the same time interval (between October 2014 and February 2016), the vertical velocities calculated using CSK and S-1A were about −86 and −79 mm/y, respectively. Although the CSK data analysis resulted in a better displacement interpretation of PTs, due to its high resolution and shorter wavelength, the S-1 data analysis also demonstrated sufficient persistent scatterer (PS) points. The research proves that most of the PTs along a transmission line are affected by high land subsidence, which puts them in a serious jeopardy. They must be constantly monitored to ensure their safety and accurate operation. The results are in complete agreement with information of the existing global positioning system (GPS) station in our study area and also the observations of two piezometric wells with declining trends in the groundwater reservoir, which has the greatest effect on the subsidence rate in this area. The analysis revealed that the strength of PTs is at a high risk.
1. Introduction
During the past 40 years, the Tehran province area has suffered from high subsidence rates [1]. These rates have had big effects on the stability of the most vital and technical infrastructures such as roads, railways, and power transmission lines [2], so that increment in the rates of subsidence has become a big concern. The first attempt from the National Cartographic Centre of Iran (NCC) at the estimation of the amount of deformation in the southwest of Tehran found 20 cm/y from 1995 to 2002 based on precise leveling [3]. However, Mahmoudpour, Khamehchiyan [4] predicted an increase for this rate. An even higher rate was estimated by Foroughnia, Nemati [5]. After the appearance of some earth fissures around Tehran, it has become more important to assess the tolerance of vital structures for the displacement of the Earth’s surface [6]. A high rate of subsidence can cause hazards in power transmission lines such as increasing the tension of cables and the possibility of the breaking of the lines or tilting of power towers (PTs) [7].
To monitor the health of each PT, we need to know the amount of occurred subsidence at each point. Despite the high accuracy of single-point measurement methods, such as direct leveling and using the global positioning system (GPS) in estimating the subsidence rate, these methods are time-consuming and expensive, with a low spatial resolution output [5]. Today, remote sensing brings affordable and specific technology, capable of providing repetitious and precise observations of the changes in the Earth’s surface. At first, for monitoring over wide areas, the method of differential interferometric synthetic aperture radar (DInSAR) was presented [8]. This method has some limitations due to spatiotemporal decorrelation [9] and also atmospheric disturbance [10]. In order to overcome these limitations, the persistent scatterer interferometry (PSI) technique was introduced for deformation monitoring with millimetric precision [11,12]. After that, many studies were conducted to introduce new methods for the selecting and processing of persistent scatterers (PSs) to improve the accuracy [13,14,15,16,17,18,19,20].
There are lots of studies related to detecting power transmission lines using synthetic aperture radar (SAR) data based on backscattering SAR images and polarimetric features [21,22]. Although the unique imaging geometry of SAR images has caused some distortions such as layover and foreshortening, the side-looking geometry has benefits for detecting vertical features such as power transmission lines [23].
The PSI method has the ability to monitor point-like features such as power transmission towers [24]. Based on Carande, Marra [25] power line poles can be extracted from X-band SAR interferometry (InSAR) data. Ge, Chang [26] mentioned that power lines are under threat due to underground mining using multi-sensor imagery in the southwest of Sydney. Iasio, Novali [27] worked on Alpine landslides using COSMO-SkyMed (CSK) data and the PSI technique. They reported that power lines are one of the structures that can be under threat. Another study was conducted by Luo, Perissin [2] about the capability of PSI techniques for power line monitoring. It was shown that the power lines can be exactly detectable using TerraSAR-X (TSX) data and PSI in the subsided area.
Matikainen, Lehtomäki [28] showed that most of the power line detection methods are based on polarimetric information from SAR images and others rely on interferometric information. Other studies also indicated that satellite images (e.g., TSX and CSK) with a high resolution have the ability to allow the extraction of three-dimensional (3D) information of PTs [23,29].
Although many studies have reported estimating and predicting the rate of subsidence in Tehran, none of them are related to the control and analysis of PTs. To the best of our knowledge, this is the first attempt to investigate the displacement of PTs, as vital infrastructure, based on the results of PS-InSAR time series analysis. The paper most importantly aimed to monitor the deformation rate of PTs based on the PSI analysis of two different datasets, X and C bands, to help in understanding how much they are affected by land subsidence and at risk of destruction. For this, both the spatial and temporal evolutions of the towers’ deformation were analyzed. The second objective of the research was to investigate the effectiveness of C-band data, with a lower spatial resolution, compared to X-band data, in the monitoring of such point-like targets. Since commercial high-resolution X-band data are not available in many cases, a comparison between the efficiencies of both kind of datasets in land subsidence monitoring could be worthwhile in such point-wise applications. As proved, CSK high-resolution data provide a high potential for detecting PTs and monitoring their deformation patterns. Hence, we applied the PSI technique to the Tehran basin area using CSK time series data stacks to monitor the land subsidence. On the other hand, Sentinel-1A (S-1A) free C-band data provide an excellent opportunity to monitor the total rate of subsidence over wide areas. This assists in evaluating S-1A SAR data in PT deformation monitoring applications as well. Meanwhile, we aimed to present a brief analysis of water extraction observations as the main cause of the land subsidence in the study area. In order to validate the results, GPS observations were also used, which were highly compatible with the PSI estimates.
The remainder of the paper is organized as follows: Section 2 provides a brief description of the used methodology. The region of interest and datasets are presented in Section 3. Section 4 is dedicated to the results, followed by a discussion. The validation of the results based on in situ measurements is explained in Section 5. The concluding remarks are finally presented in Section 6.
2. Methodology
The main objective of SAR interferometric time series analysis techniques is to detect image pixels with coherent phase behavior and strong backscatter to the satellite, over the data acquisition time period [11,12]. In a long time interval, some features can be found with a relatively constant scattering in images. They can be used as PSs and in carefully measuring relative displacements. The density of these PS points is related to their coherency, so bright structures or man-made structures are identified as good PSs. Thus, in urban areas, there are always many more PSs than agricultural ones. The density of these points will be lower in agricultural areas.
PS algorithms use a baseline configuration, which determines the set of interferometric pairs (interferograms) in the time series analysis [12,17,30]. The PSI method presented in this research tries to find a single master configuration that minimizes the noise level in the dataset (spatiotemporal decorrelation). The master image is chosen in the middle of the 2D spatiotemporal space in a way that minimizes the decorrelations and guarantees high coherence for all the formed interferograms [9,17]. Based on the single master configuration, all single look complex (SLC) images (slave images) are interferometrically connected to the unique image (master image).
The interferometric phase for a single pixel is composed of some distinct contributions, i.e., orbital errors, deformation, and topographic and other noise effects. To extract the deformation phase component, the removal of all the other, unwanted, effects from the interferometric phase is necessary. Orbital errors and topographic effects can be removed using orbital information and also an external digital elevation model (DEM). Because of the inaccuracy of the external DEM, a residual topographic phase remains, further estimated as an unknown parameter, called the DEM error.
In the next step, to determine coherent pixels, it is necessary to select a primary set of points as PS candidates (PSCs). In doing so, the amplitude stability index (ASI), which represents the phase stability of the pixels based on Equation (1), is used. A point can be selected as a PSC if it always has an amplitude stability value higher than a suitable threshold (e.g., 0.8).
where is the standard deviation and is the average amplitude value of each pixel over time.
The PSCs are connected using Delaunay triangulation to generate a spatial network [11]. According to Hanssen [31], atmosphere effects are spatially correlated so that their phase contribution between two adjacent pixels, along with the connections, can be neglected [31]. Then, the unknown parameters, which are now the DEM error () and the deformation rate () of each connection, can be initially estimated through the maximization of the periodogram according to Equation (2) [32].
where demonstrates the connection between the adjacent PSCs and . N is the number of interferograms, and . refers to the incidence angle of the SAR signal. The term is the double difference interferometric phase in the image pairs s and k, while and are the temporal and interferometric normal baselines, respectively.
Before the removal of atmospheric effects, a stable reference point should be chosen between PSCs that is not affected by subsidence, and it is better if it is on the ground surface. The estimated unknowns for each connection are then integrated using the selected reference point to obtain the absolute values at each PS candidate. The atmospheric phase ambiguities are resolved based on the spatial and temporal phase differences. At the same time, the atmospheric phase for the PSCs can be resampled on the uniform image grid as the atmospheric phase screen (APS). After APS removal, to increase the points’ density, the second set of PSs are selected using a lower threshold for the ASI criterion. The unknown parameters are estimated again for all pixels based on another maximization of the periodogram concerning the selected reference point [11]. The variance of the deformation trend () depends on the phase noise dispersion (), and the temporal baseline dispersion (), which can be approximated with the Equation (3) [20]:
As SAR images have a side-looking geometry, the detected velocity is along the line of sight (LOS) direction. The LOS consists of three-dimensional deformations: the north–south (N–S), east–west (E–W), and vertical directions. With access to ascending and descending paths, LOS decomposition can be performed by solving Equation (4) [31,33].
where represents the velocities in each direction, and is the heading angle. In order to estimate the N–S component, on one hand, right look and left look images are needed, which were not available in this study. It can also be ignored, on the other hand, since SAR systems are not so sensitive to this component due to the near-polar orbit of the satellites.
In the current research, SARPROZ software was used to implement time series processing. Detailed information can be found in Perissin and Wang [20].
3. The Datasets and Area of Interest
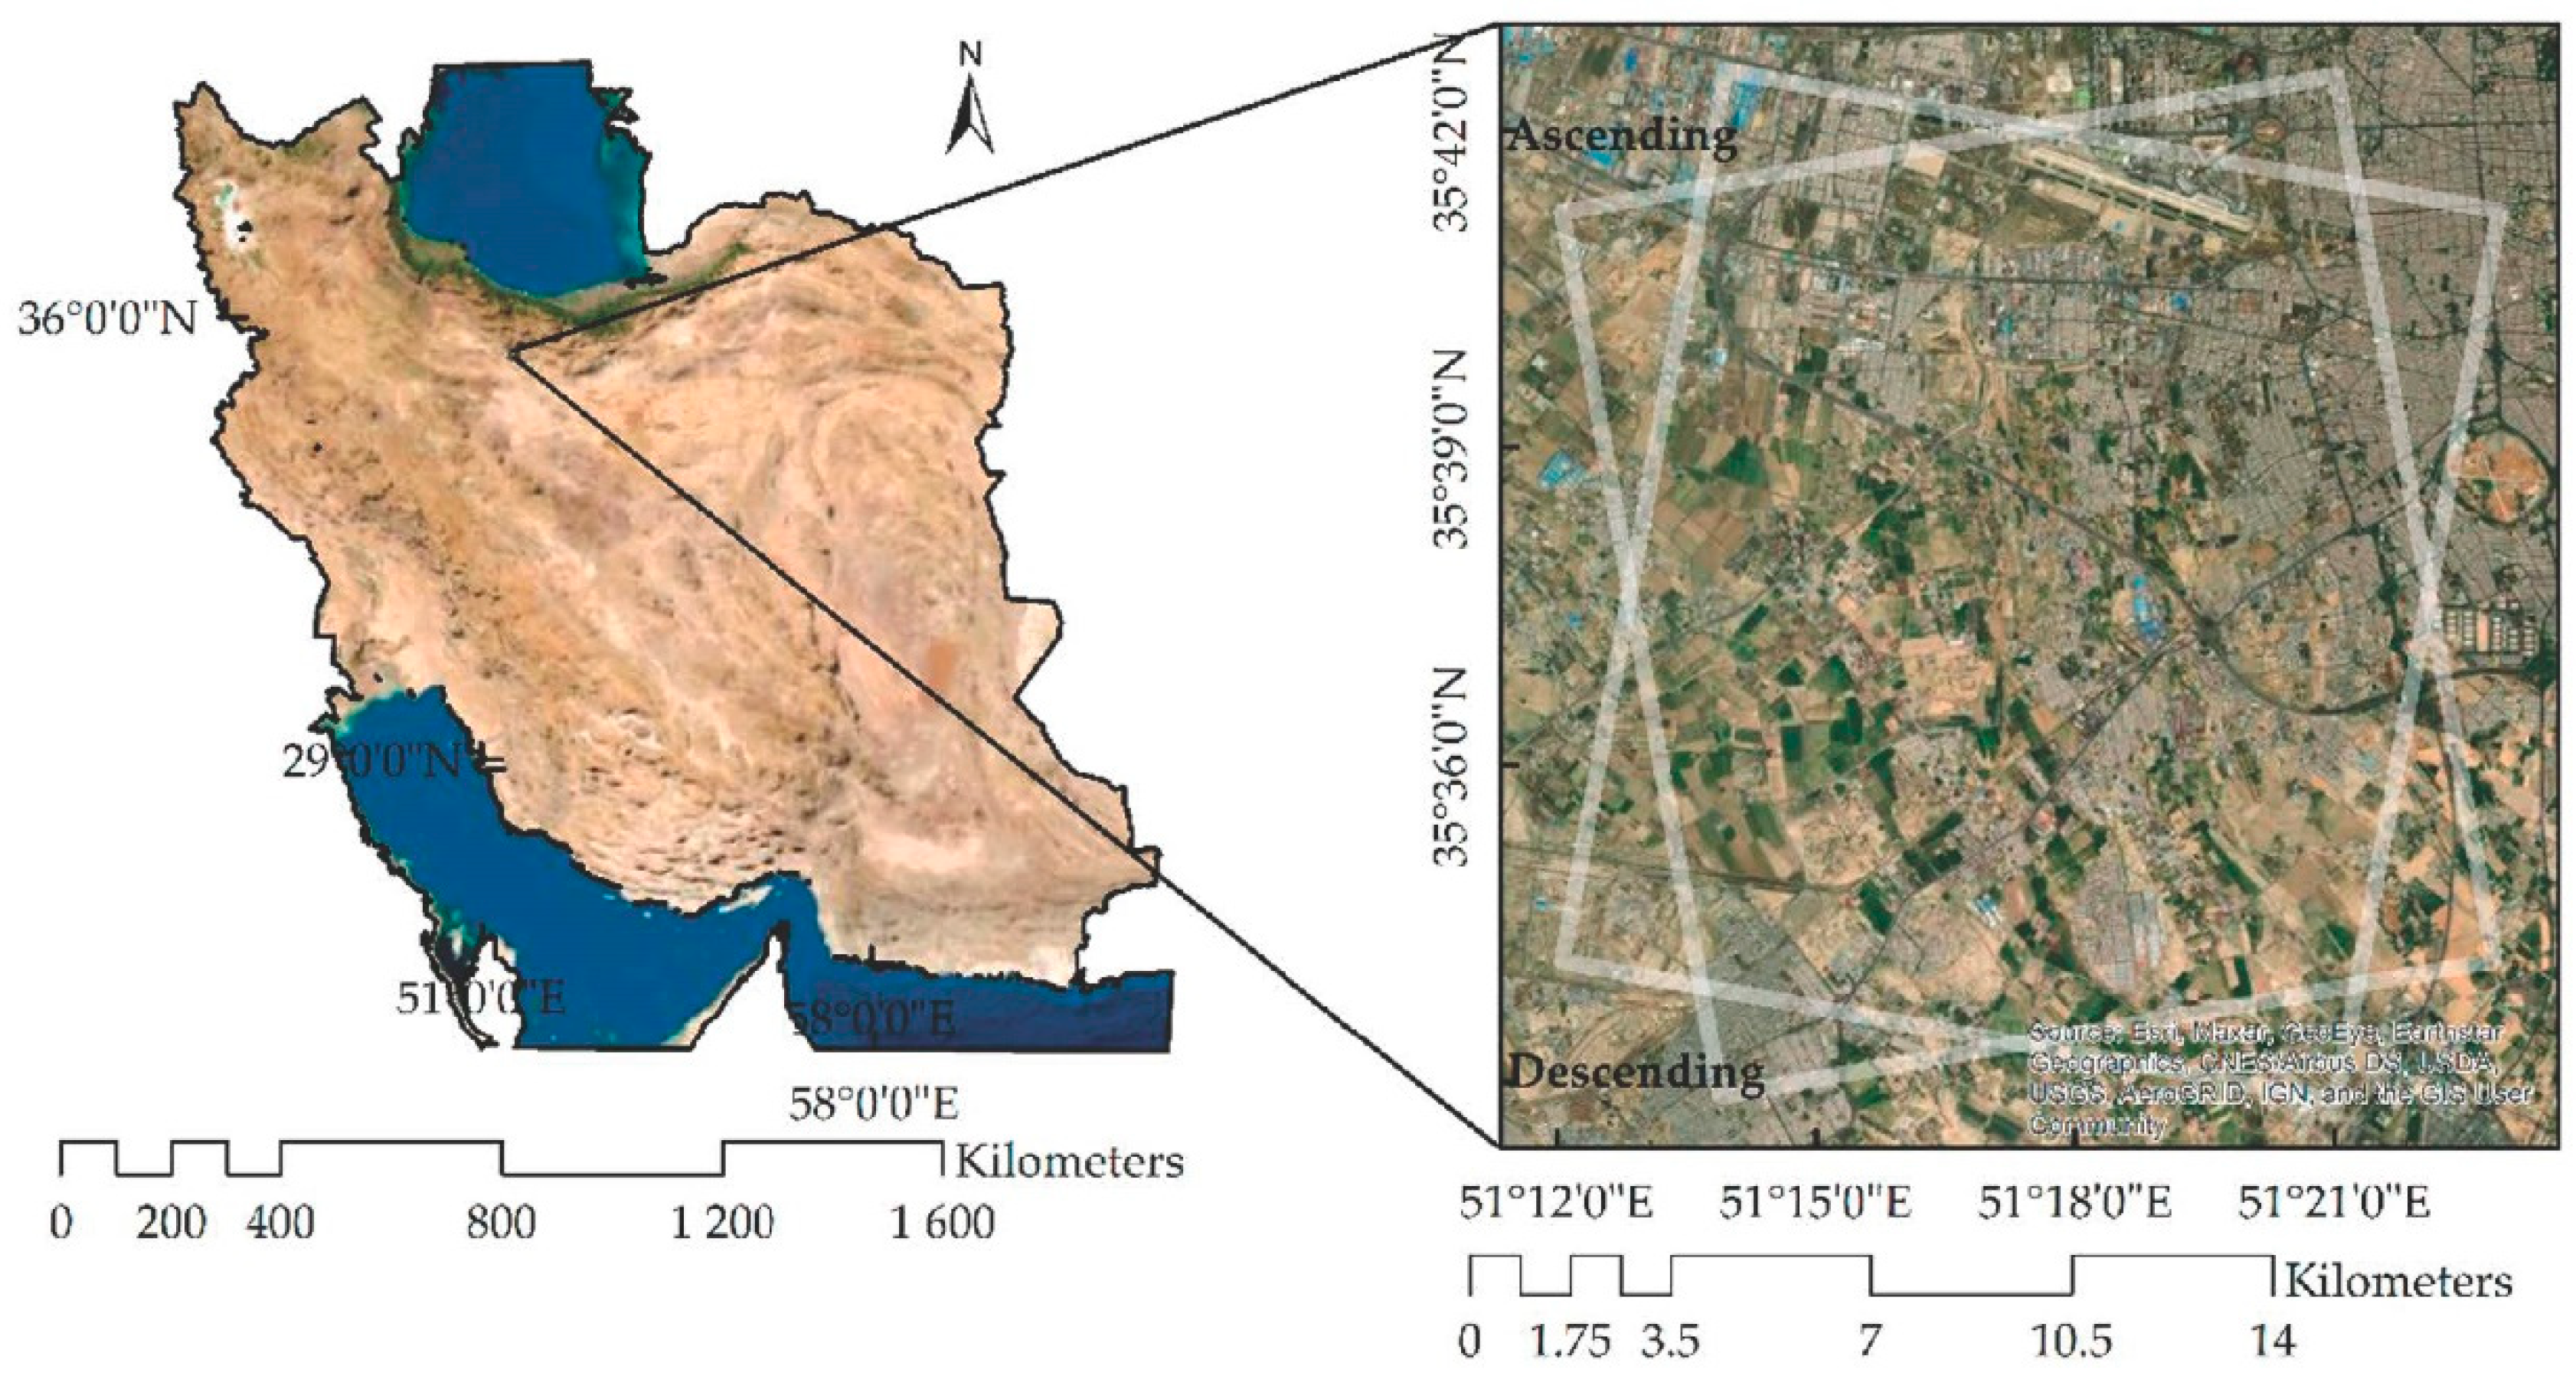
The Tehran basin is located in the north of Iran. It is surrounded by the Alborz mountain to the north and Arad and Fashapouyeh to the south. Based on previous studies, this area suffers from a high rate of subsidence caused by the withdrawal of groundwater [5,34,35]. This can cause many problems for PTs. To apply the PSI technique, a region with a center of 35.6281° latitude and 51.2915° longitude and a radius of 10 km in the south west of the Tehran metropolitan area, which consists of both urban and rural areas, was considered (see Figure 1).
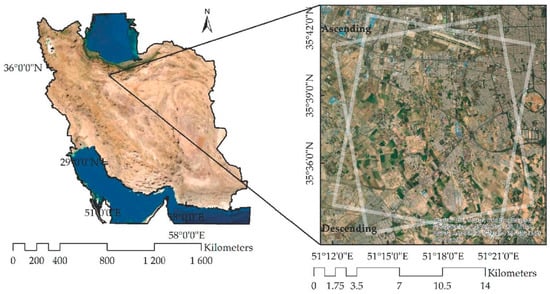
Figure 1.
Study area. The white rectangles indicate the footprints of the data stacks.
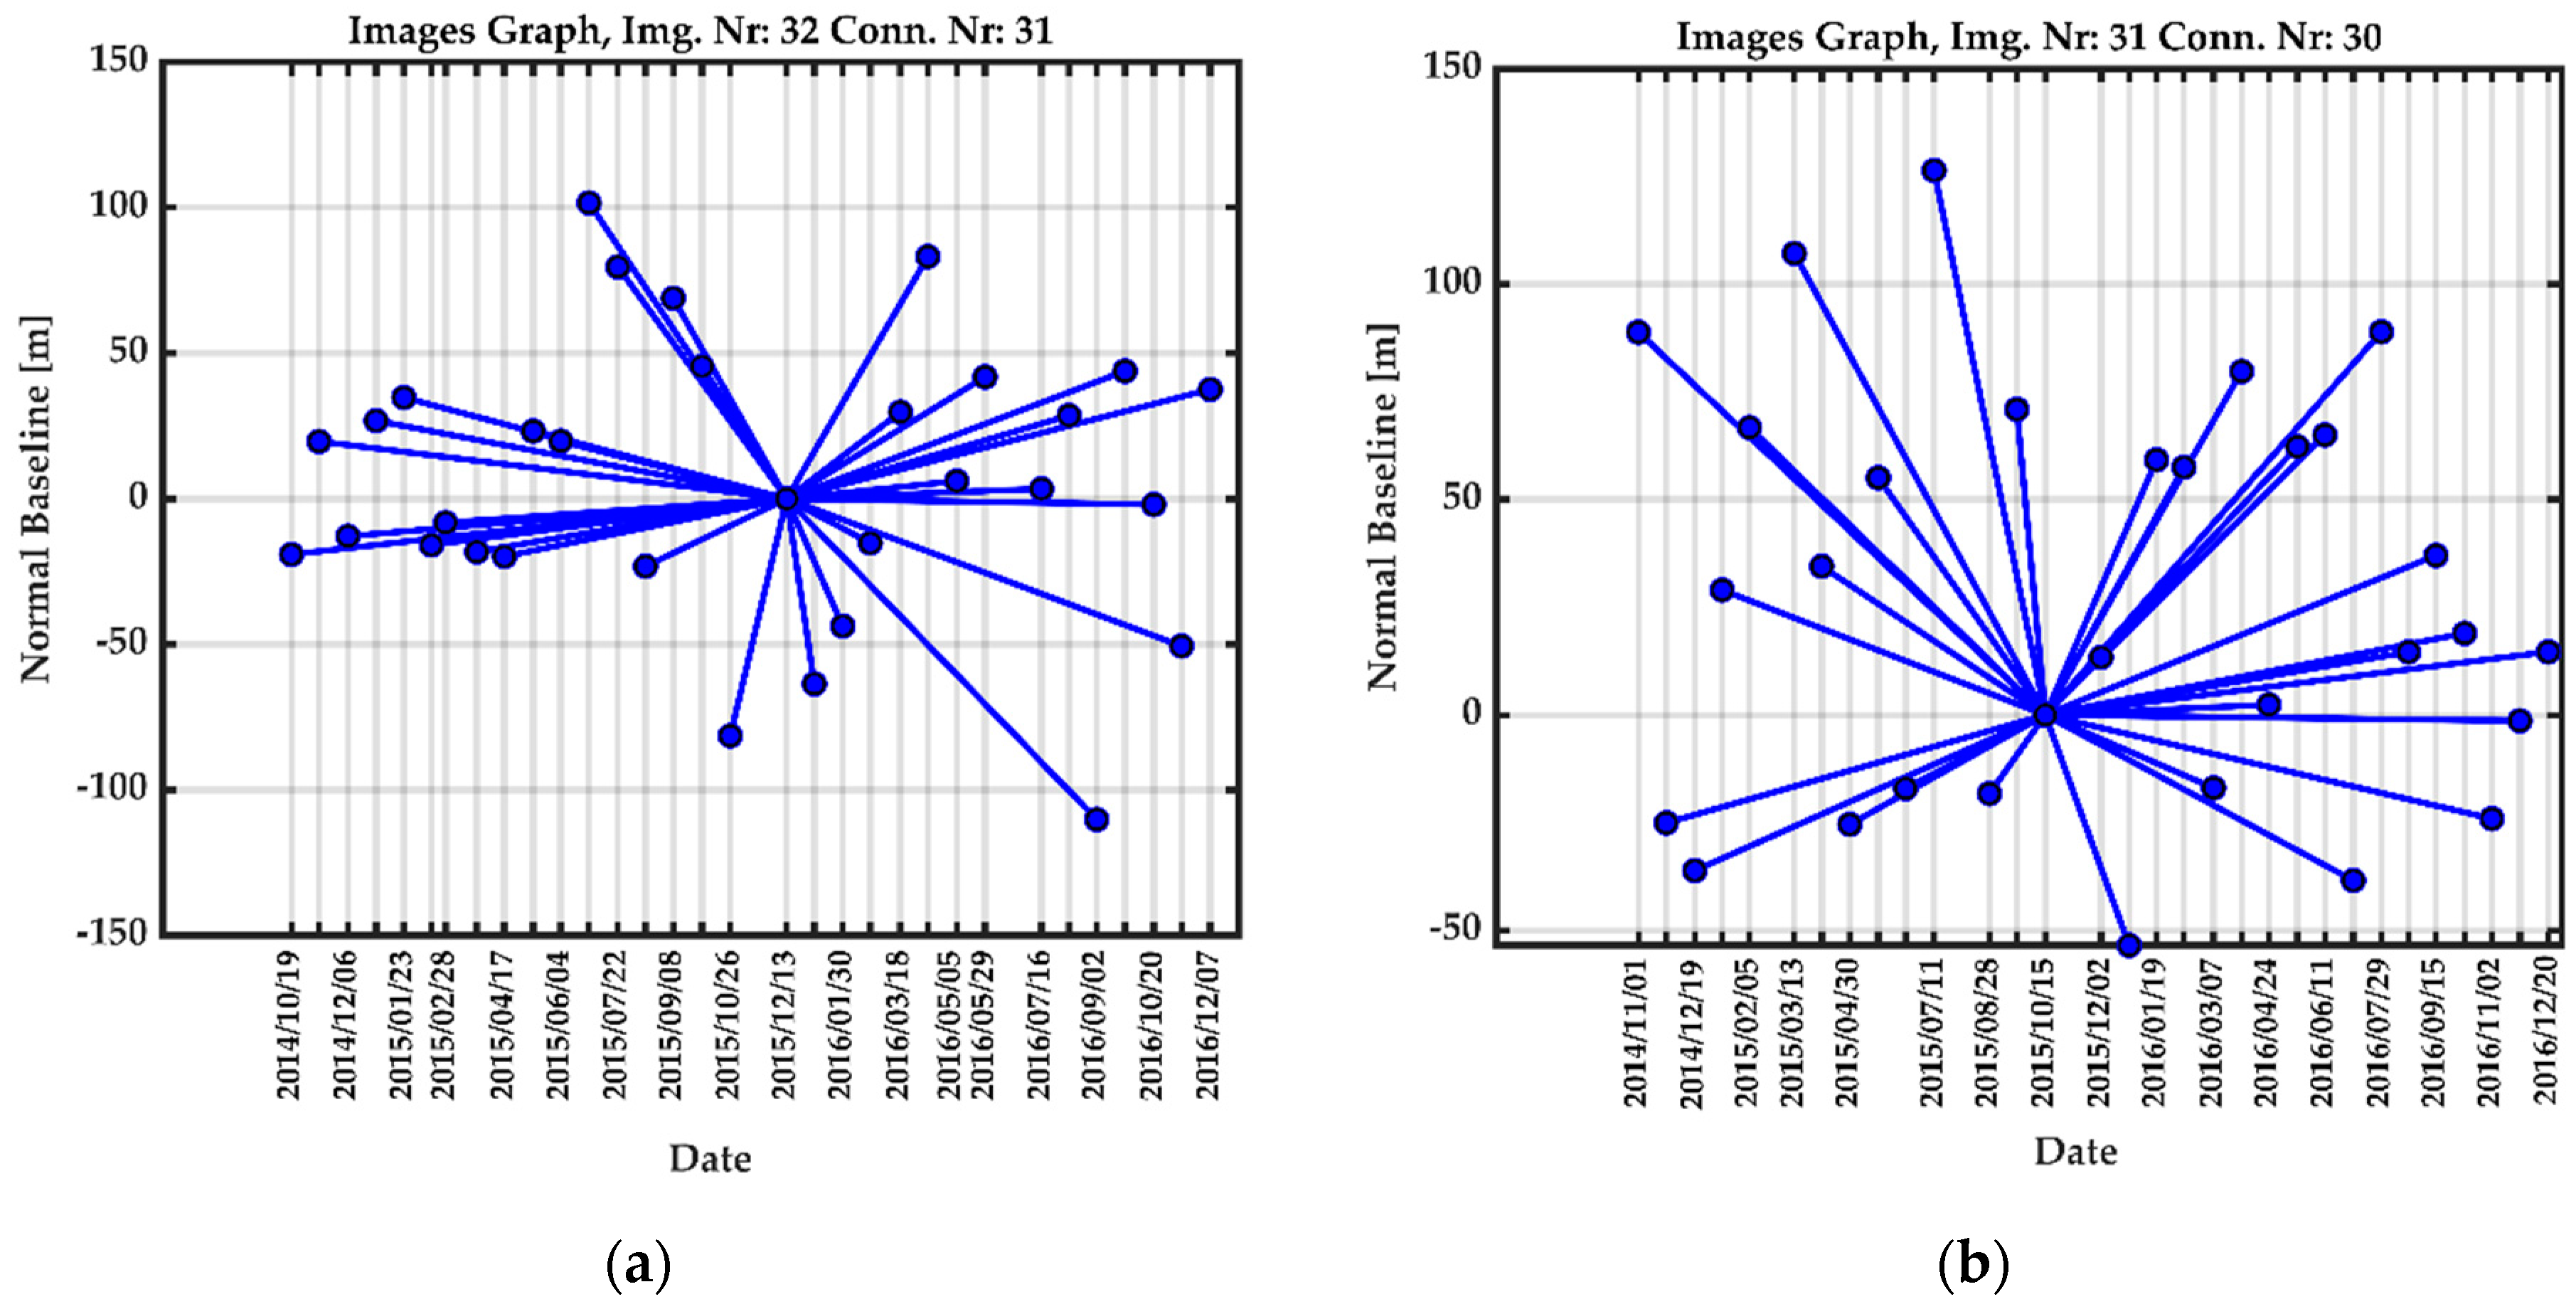
Four data stacks covering the area were used. The first two stacks were scenes from the S-1A satellite in the IW imaging mode with just VV polarization and with a resolution of approximately 5 × 20 m and minimum interval of 23 days. One stack consisted of thirty-two images along the ascending orbit (relative orbit 28) from 19 October 2014 to 7 December 2016, and the other one consisted of thirty-one images along the descending orbit (relative orbit 35) from 1 November 2014 to 20 December 2016 (see Figure 2).
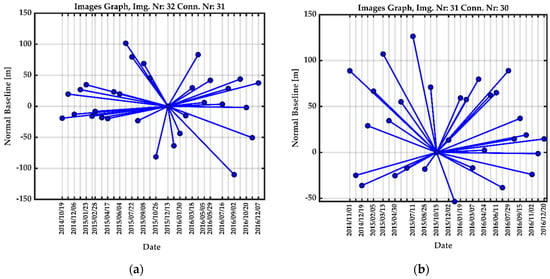
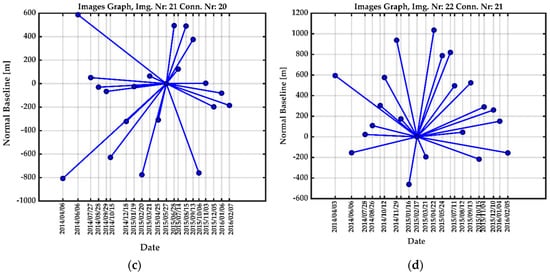
Figure 2.
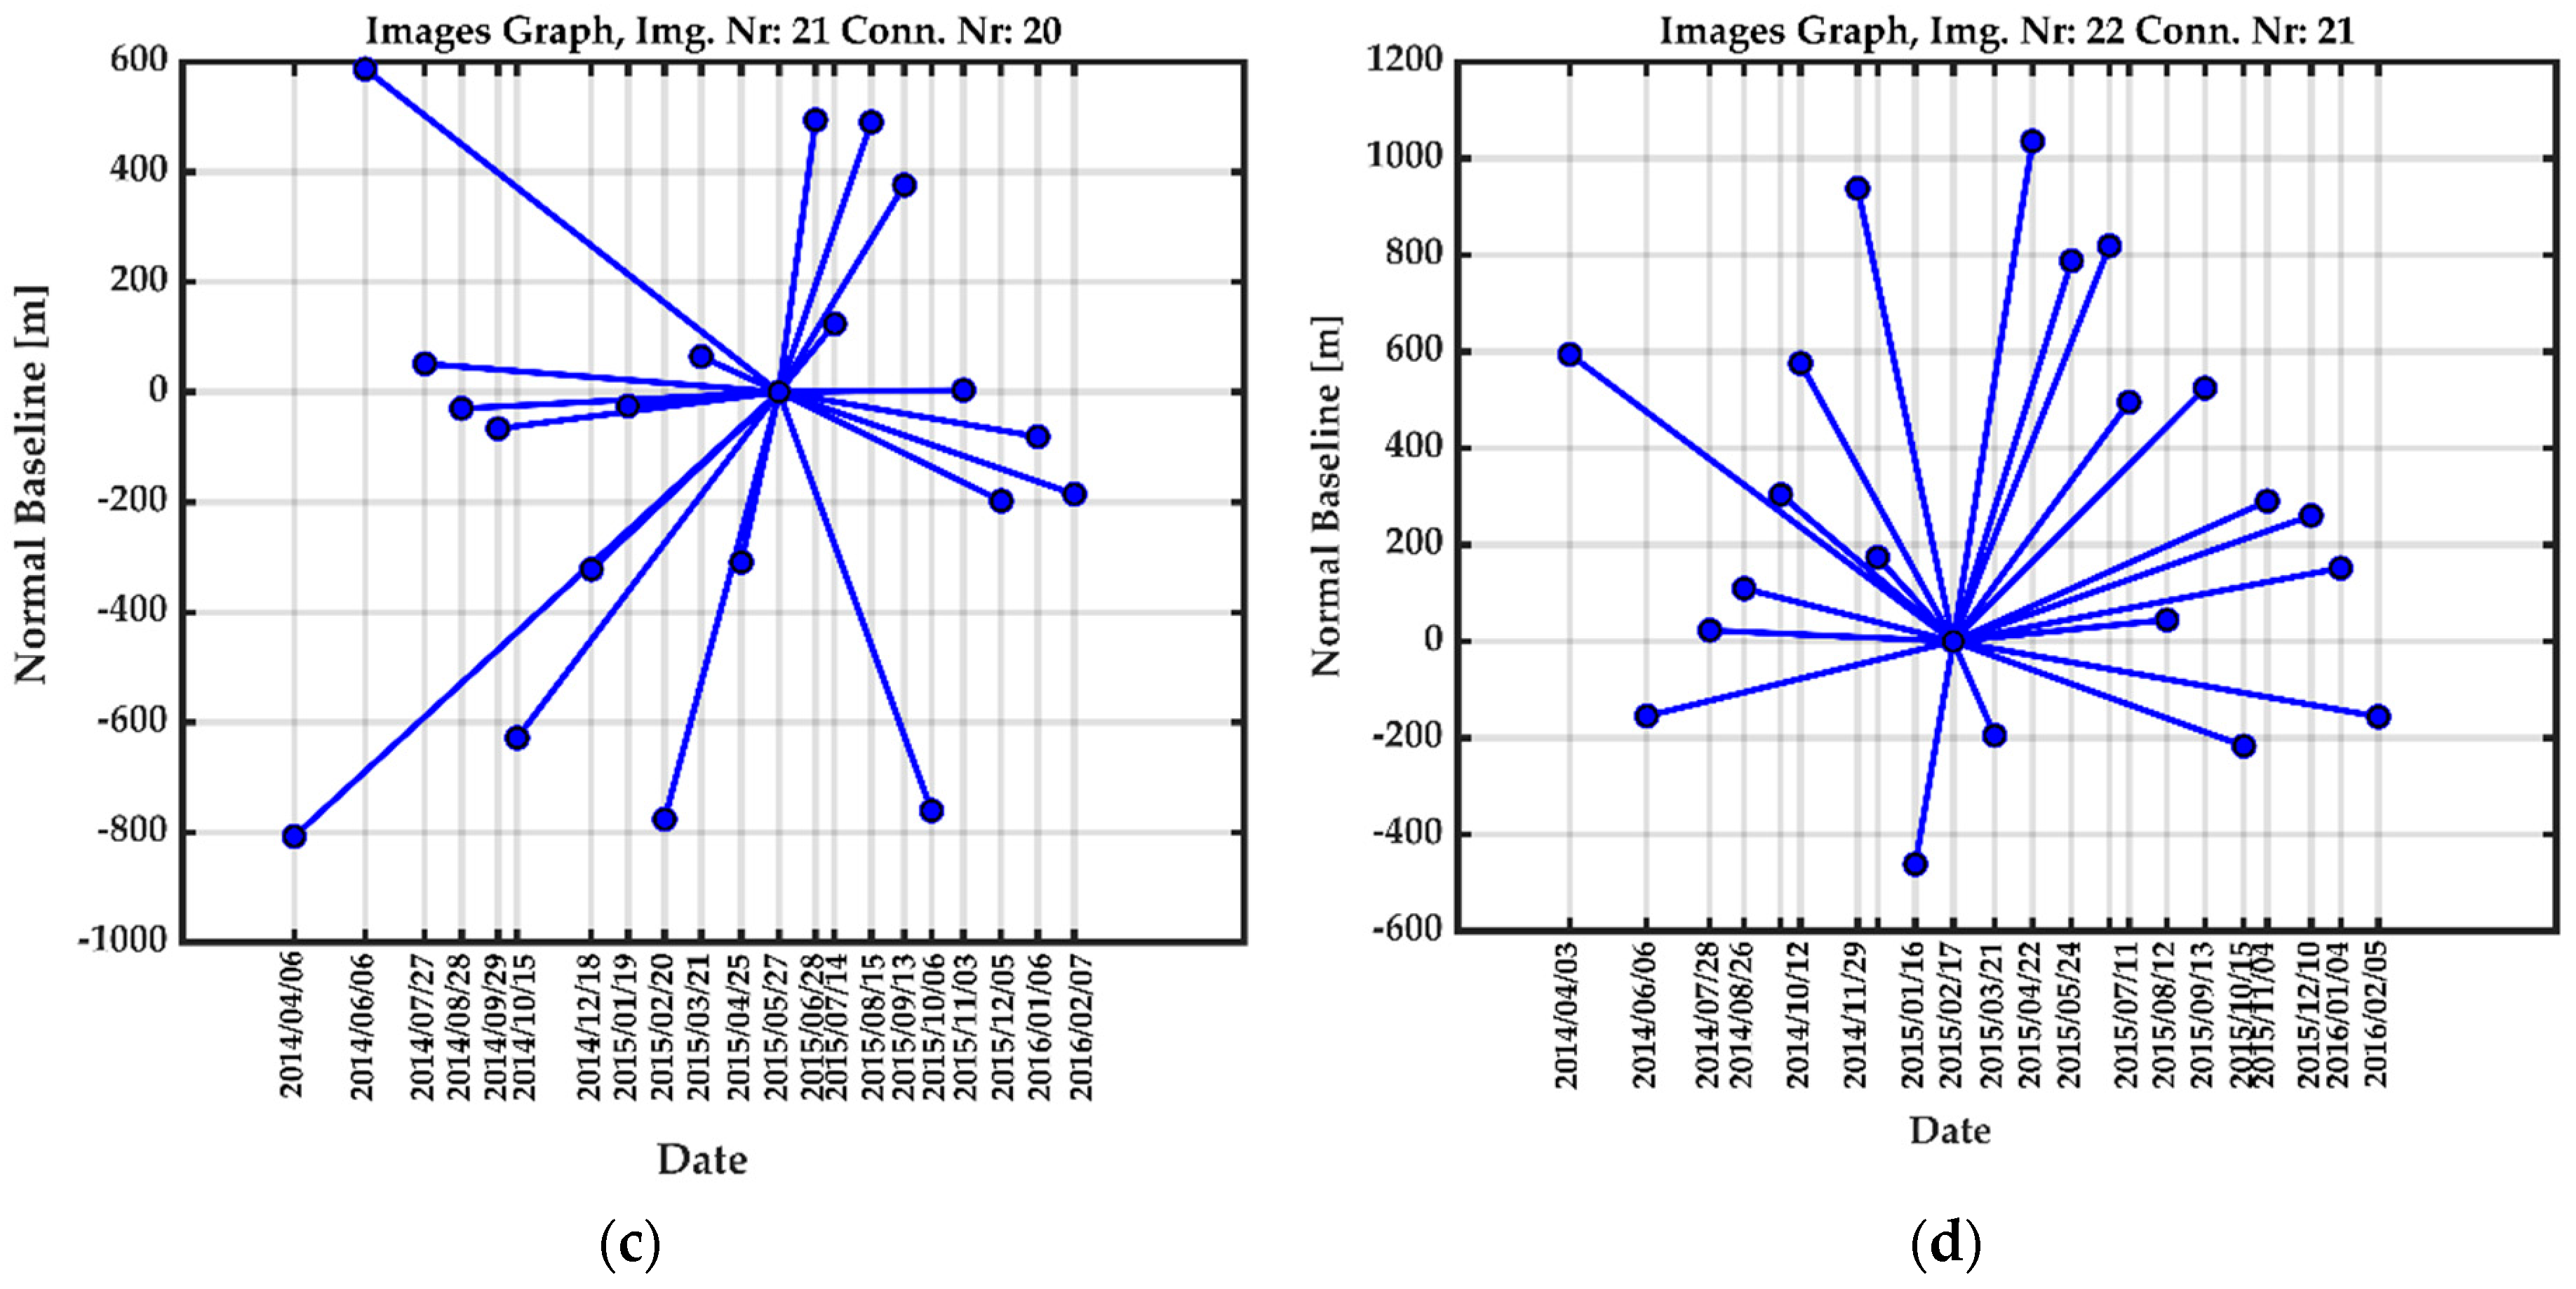
Image graphs for each time series data stack of (a) S-1A ascending (Track 28); (b) S-1A descending (Track 35); and (c) CSK ascending; (d) CSK descending, which show the 2D spatiotemporal baseline spaces. Each point displays a scene, and each line displays an interferogram with respect to a single master.
The last two stacks were scenes from CSK satellites in StripMap (HIMAGE) imaging mode with just HH polarization and with a resolution of 3 meters and average interval of 16 days. One stack consisted of twenty-one images along the ascending orbit from 6 April 2014 to 27 February 2016, and the other one consisted of twenty-two images along the descending orbit from 3 April 2014 to 5 February 2016 (see Figure 2).
In order to remove the topographic phase contribution, a TanDEM-X (TDM) Digital Elevation Model (DEM) tile with a resolution of 12 m (pixel spacing, 0.4 arcsec) was used as an external DEM. This DEM was processed by the German Aerospace Center (DLR) using images from 2010 to 2016 [36]. The use of a more accurate elevation model helps to accurately calculate the topographic phase contribution, and a better estimation of the atmospheric effects can be made. Moreover, daily GPS observations at only one GPS station in the study area were used to validate the PSI analyses. The measurements were acquired between 3 April 2014 and 20 December 2016, which matches our data stacks. The station is located at 35°38′45.38′N latitude and 51°17′53.53′′E longitude (see Figure 3). The raw data were provided in meters as absolute height values at the station.
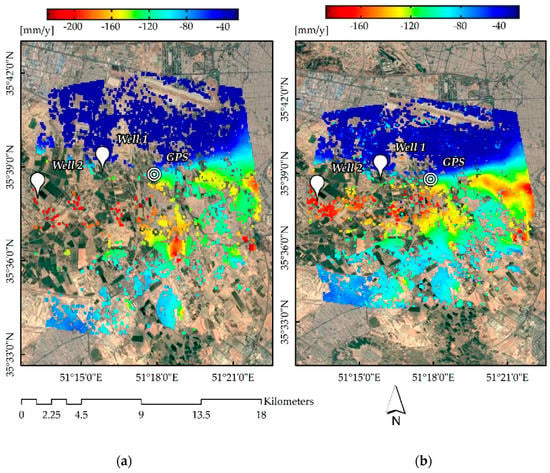
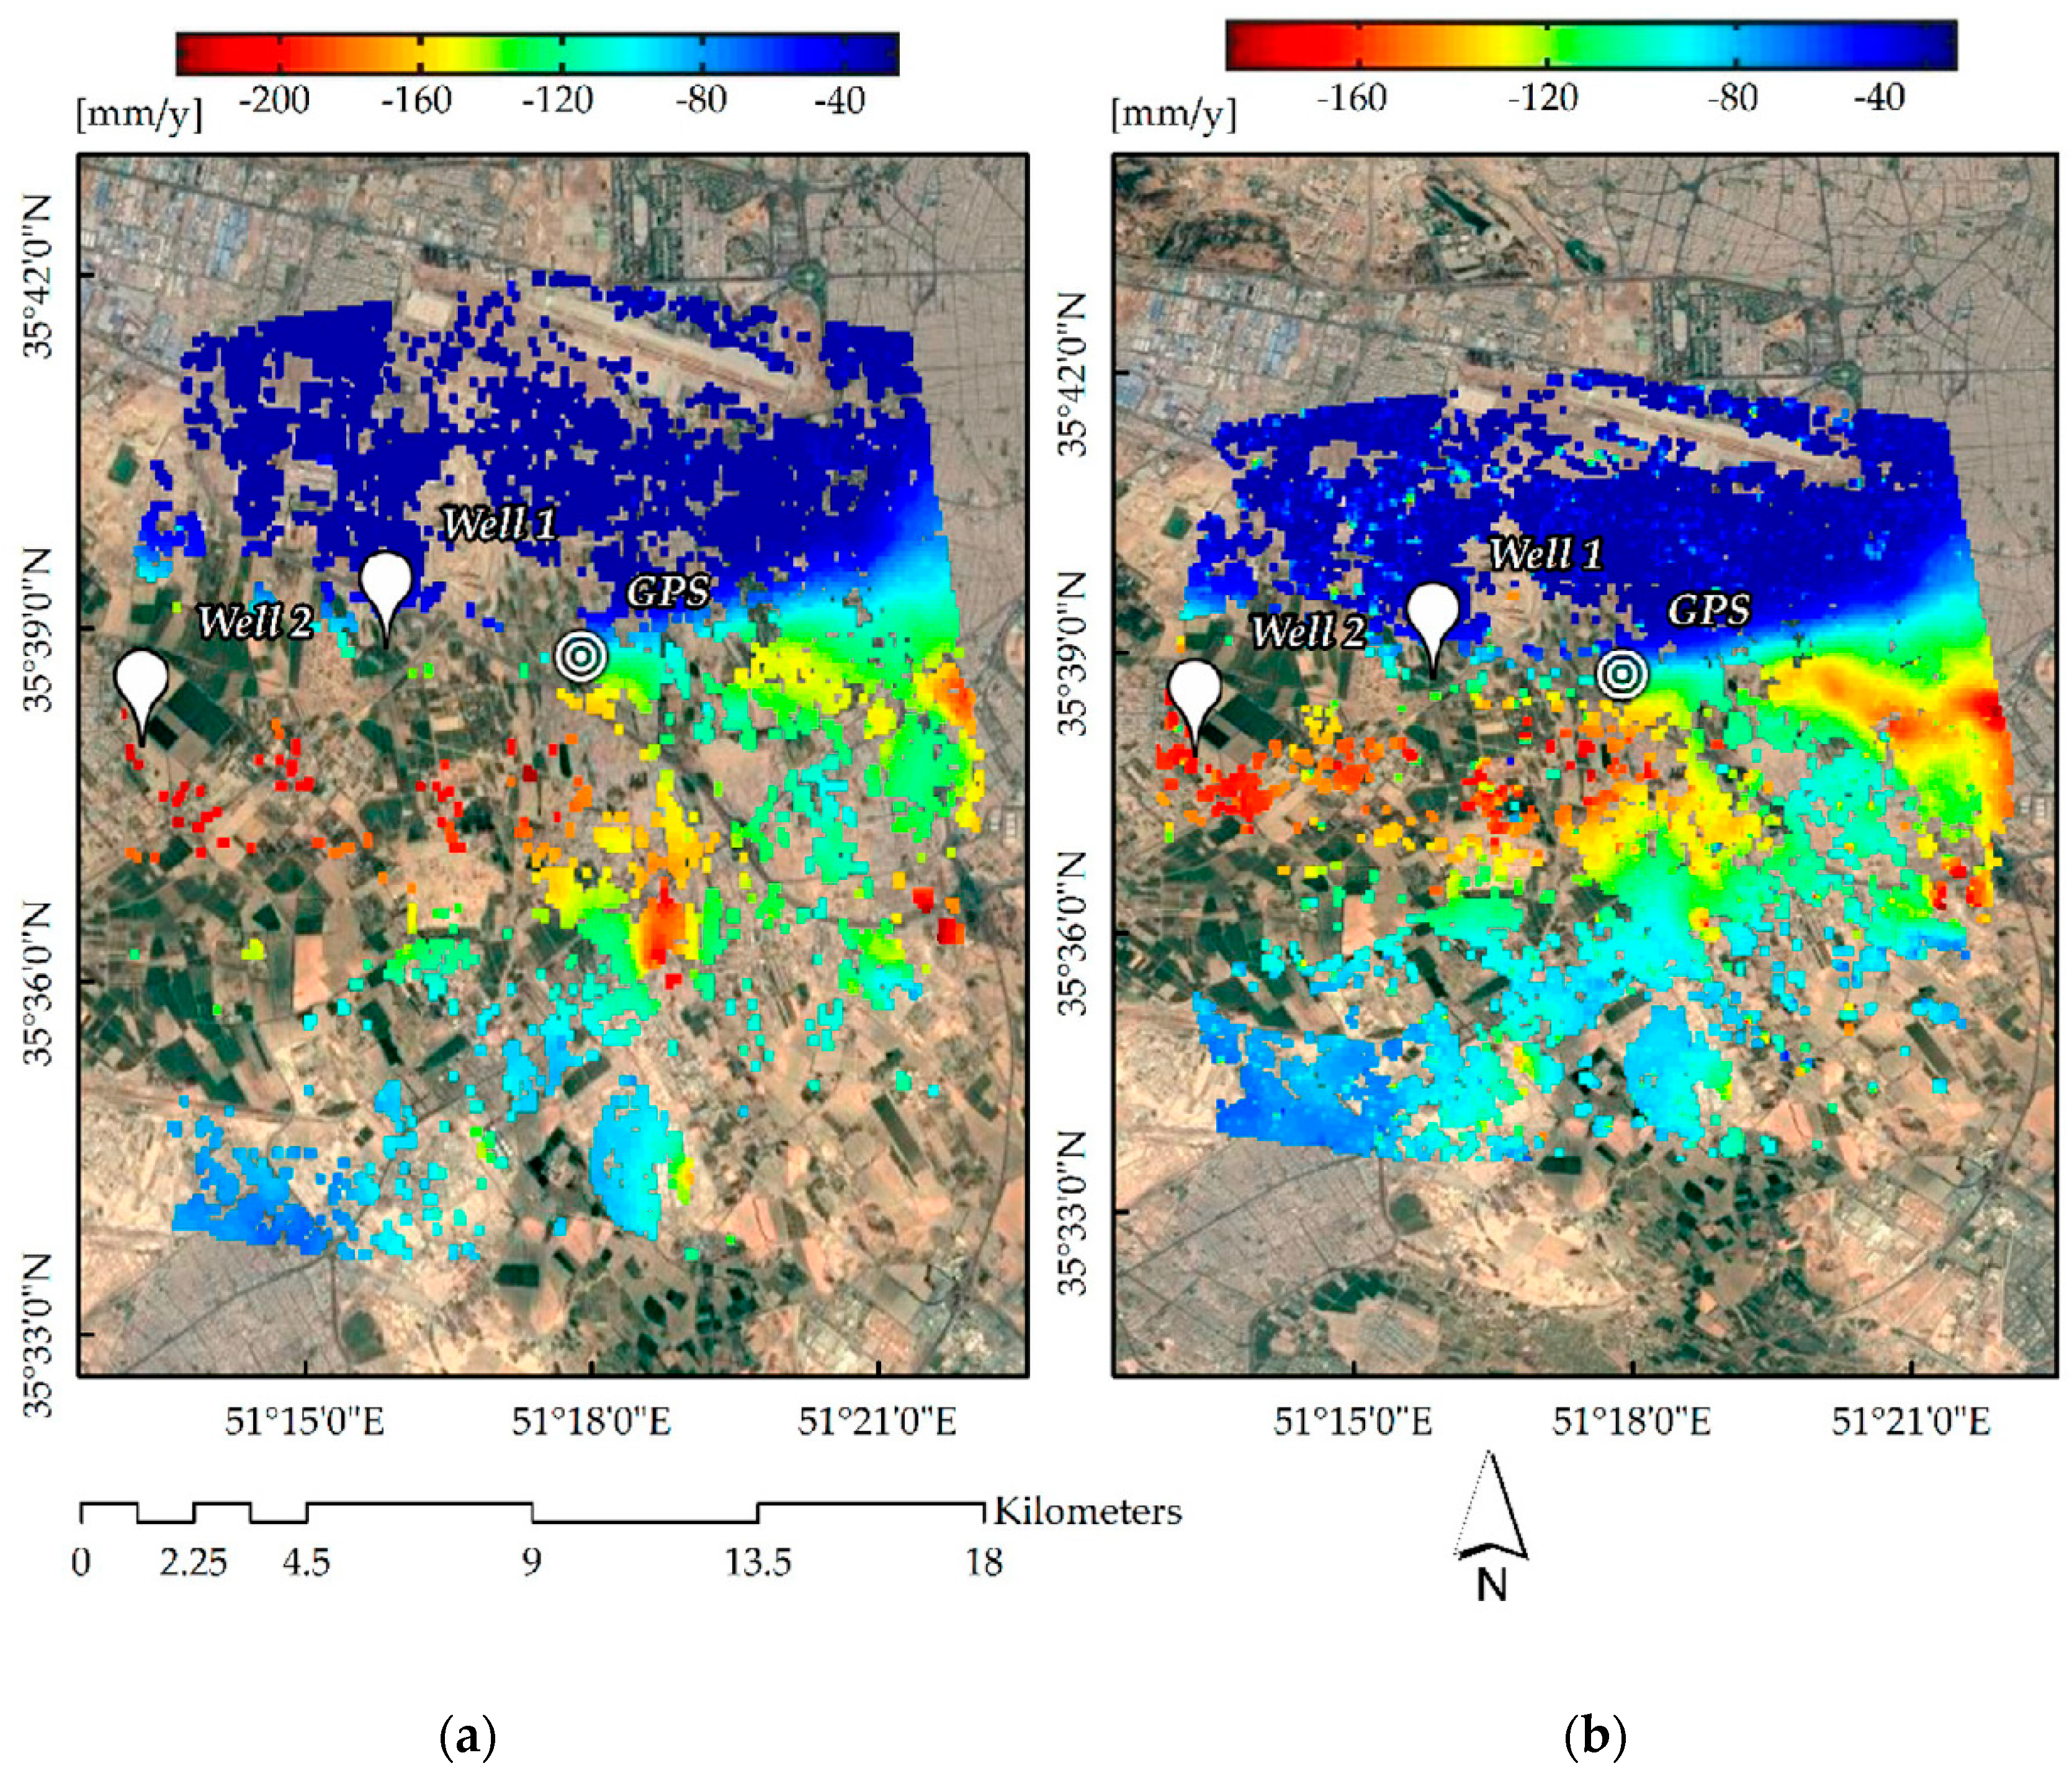
Figure 3.
Resampled vertical velocity maps, (a) S-1A; (b) CSK, generated by SARPROZ superimposed on Google Earth (GE) image.
4. Results and Discussion
For the processing of each dataset, a single master based on minimizing the spatiotemporal decorrelation criterion was selected. Figure 2 indicates the configuration of the interferometric image datasets, where each point shows an image and each line between two points represents an interferogram. Figure 2a,b show a selected single master image on 13 December 2015, and 15 October 2015, in ascending and descending paths for the S-1A datasets, respectively. Additionally, Figure 2c,d show a selected single master image on 27 May 2015, and 17 February 2015, in ascending and descending paths, respectively, for the CSK datasets.
The geocoded deformation rates of all the PS points for both the CSK and S-1A data stack analyses, which were estimated along the vertical direction, are presented in Figure 3. In our case, the E–W component had small values, so its impact was neglected. Moreover, according to the S-1A data stacks analysis, it can be concluded that the vertical velocity rates have a range between 0 and −220 mm/y with respect to the reference point, while the vertical rates according to the CSK analysis ranged from 0 to −260 mm/y. This difference is related to the different wavelengths of the data used. S-1A with C bands has fewer estimates of subsidence since it is less sensitive to deformation signals due to having a shorter wavelength. Additionally, CSK with the higher-resolution cell can identify more PSs, which might have a higher deformation rate. It should be mentioned that during the same time interval (between October 2014 and February 2016), the vertical velocity shown by the CSK data is about −86 mm/y and that shown by the S-1A data is about −79 mm/y.
According to the results, the land subsidence in the non-urban areas is obviously much higher than in the urban regions. The significant rates from both results are related to Firuz Bahram village in the middle-left side of the subset, where there is farmland with an over-extraction of groundwater. Hence, water level information for some piezometric wells was used to investigate this issue.
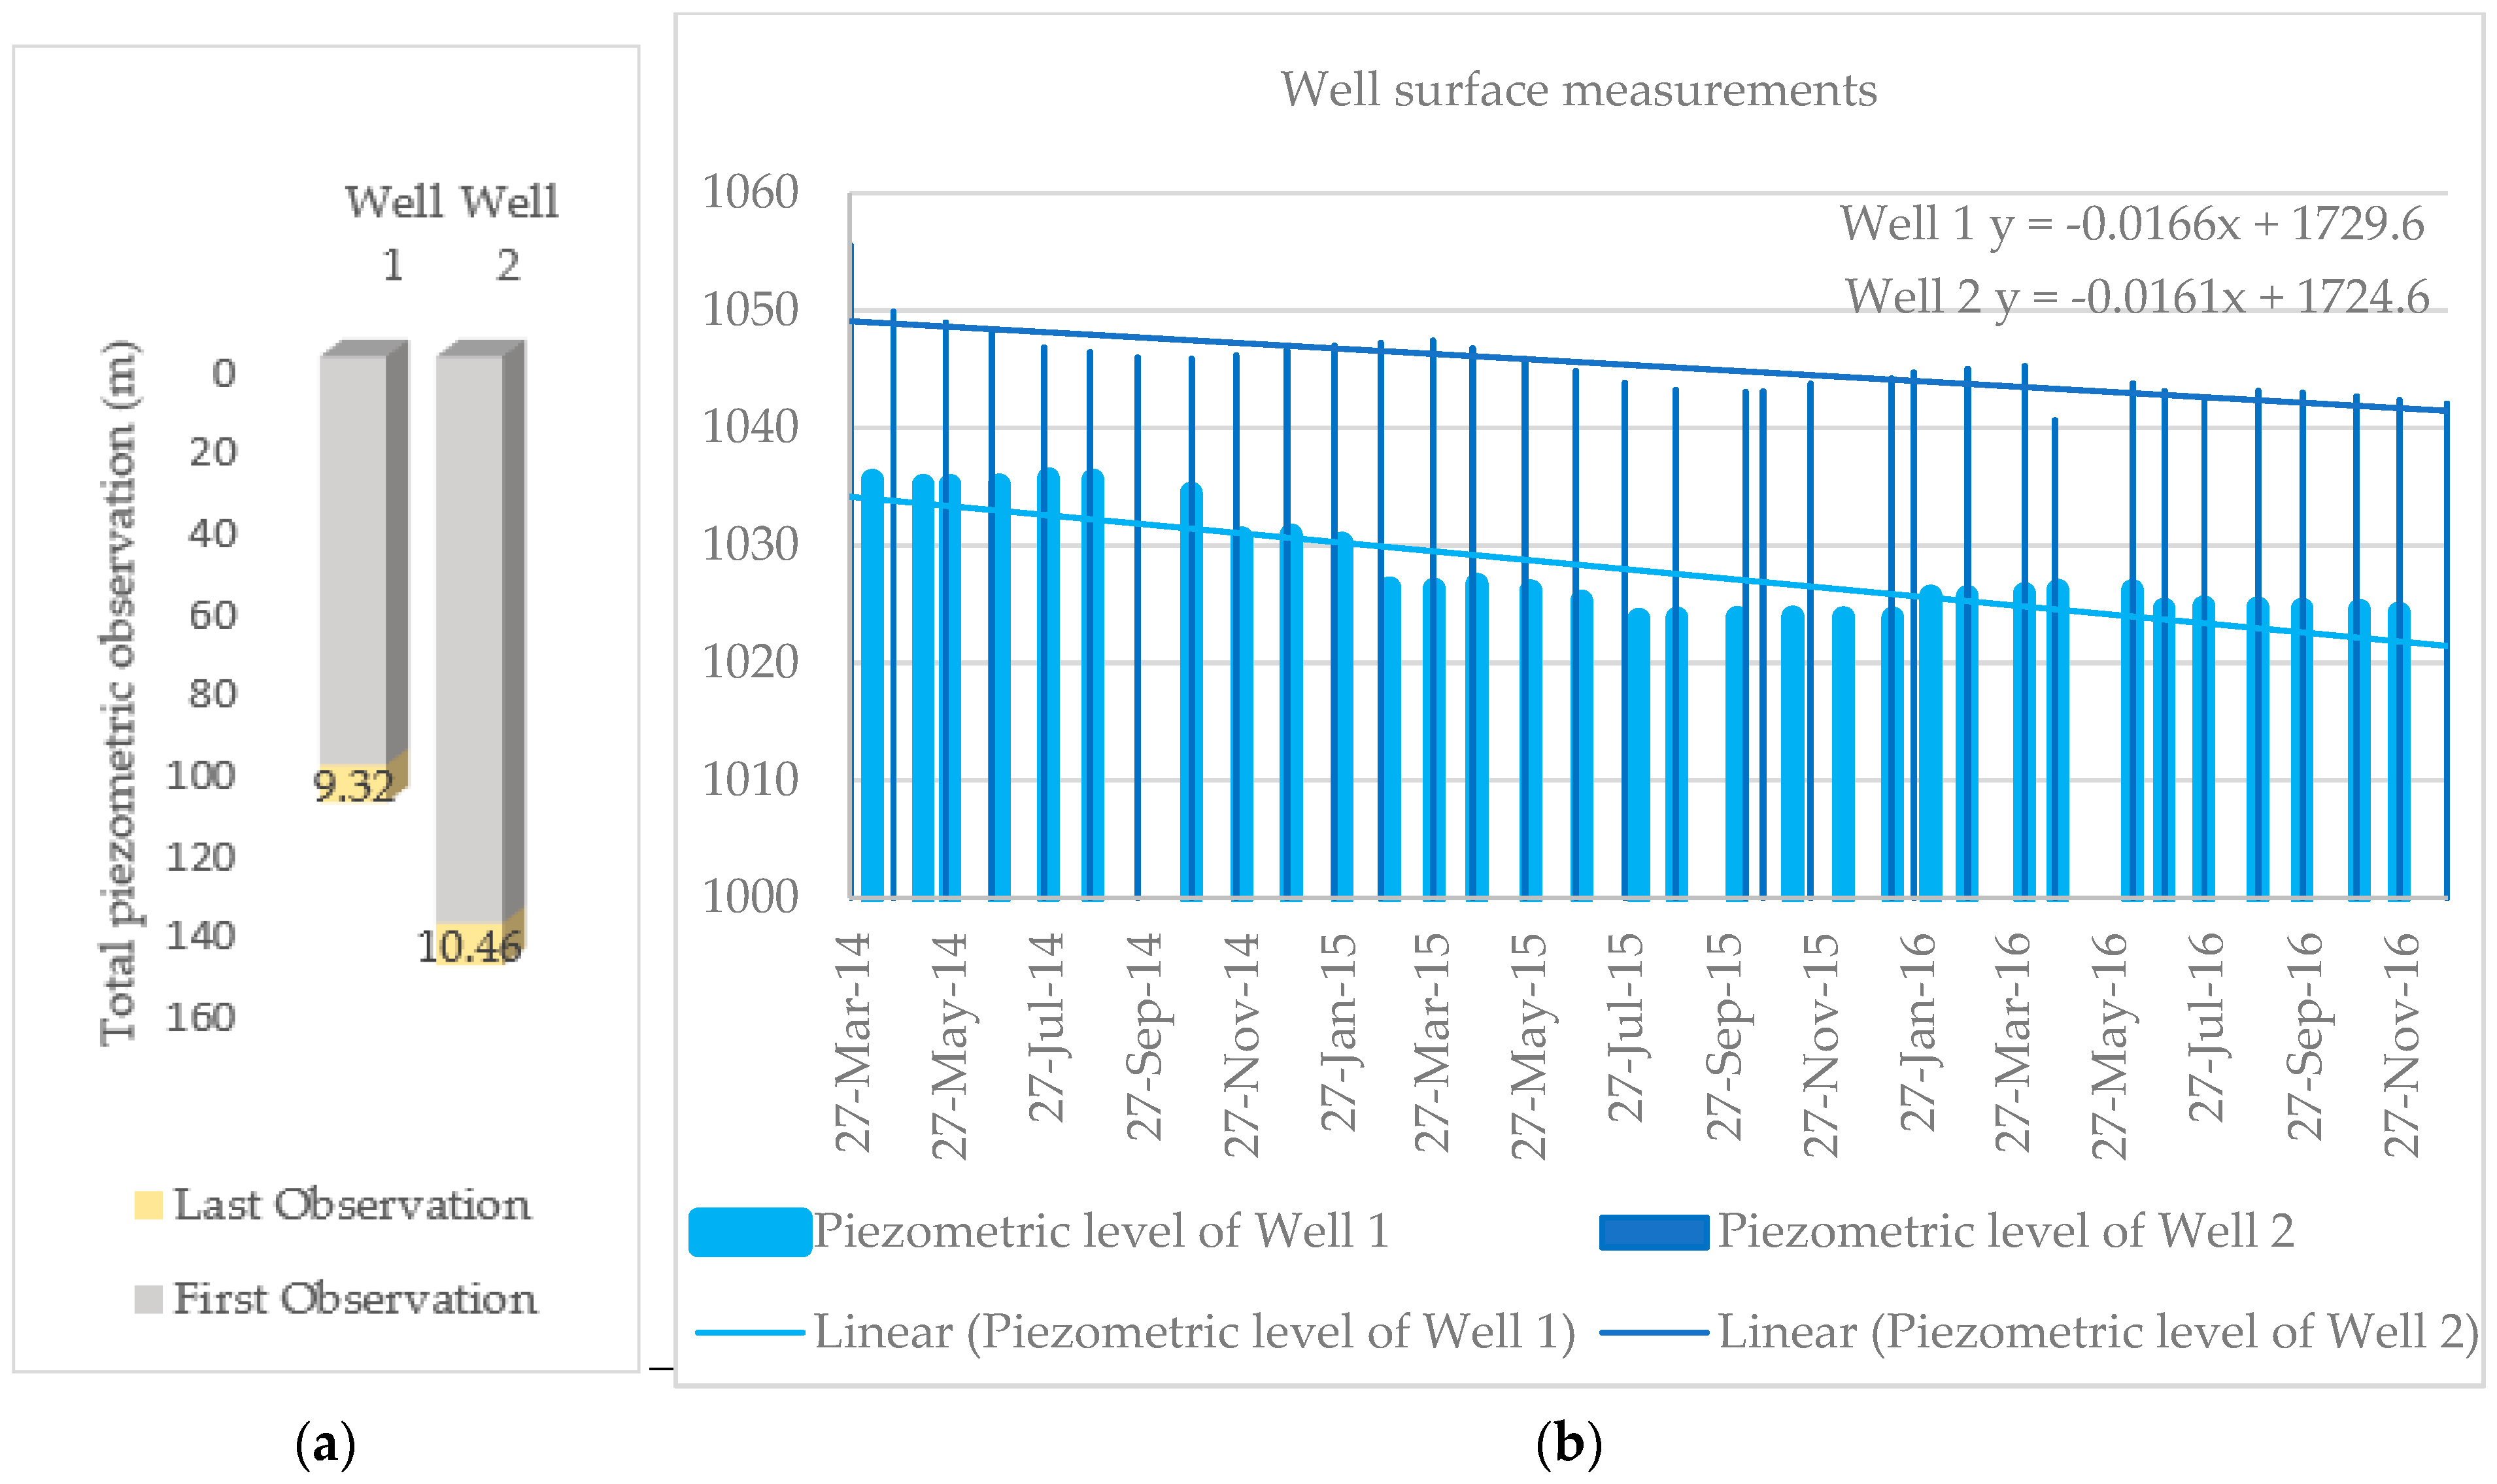
There are two piezometric wells, which were spatially located in our selected subset (see Figure 3) and temporally matched with the dataset time intervals. Well 1 is located at 35°39′14.62′′N latitude and 51°15′50.87′′E longitude. In addition, Well 2, with the most withdrawal, is located at 35°38′24.55′′N latitude and 51°13′17.26′′E longitude. The time series observation of the wells is illustrated in Figure 4. Figure 4a shows the observation of the water level depth in each well in the first and last observation timeslots. The yellow part of each column shows how much the water level depth has decreased in meters. The maximum decrease in the depth of the water level was for Well 2, which was more than 10 m from April 2014 to December 2016. There was also the highest deformation rate in that location, induced by groundwater over-extraction.
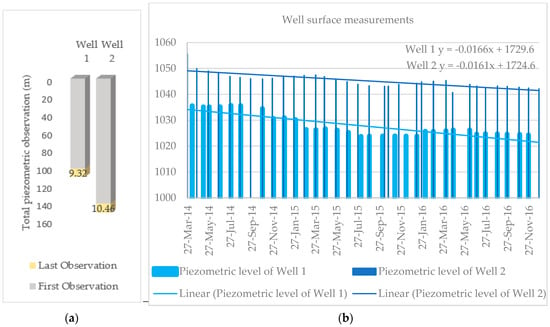
Figure 4.
Piezometric measurements. (a) The first (27 March 2014) and last (27 December 2016) observations of piezometric depth; (b) Piezometric time series observations over about three years (early 2014 to late 2016).
The results of the bimestrial piezometric measurements according to Figure 4b show that the water levels of the wells are constantly decreasing with seasonal changes. It proves that a decrease in the groundwater reservoir has a big effect on the amount of subsidence. The most important factor in the formation of this phenomenon is the sharp drop in groundwater in fine-grained alluvial sediments, which have a high compressibility. The existence of a higher amount of fine-grained sediments in the aquifer system causes such a big effect [5,37]. At the same time, soil types and reductions of the other factors can definitely affect the formation of the subsidence phenomenon [37], which is out of the scope of this research.
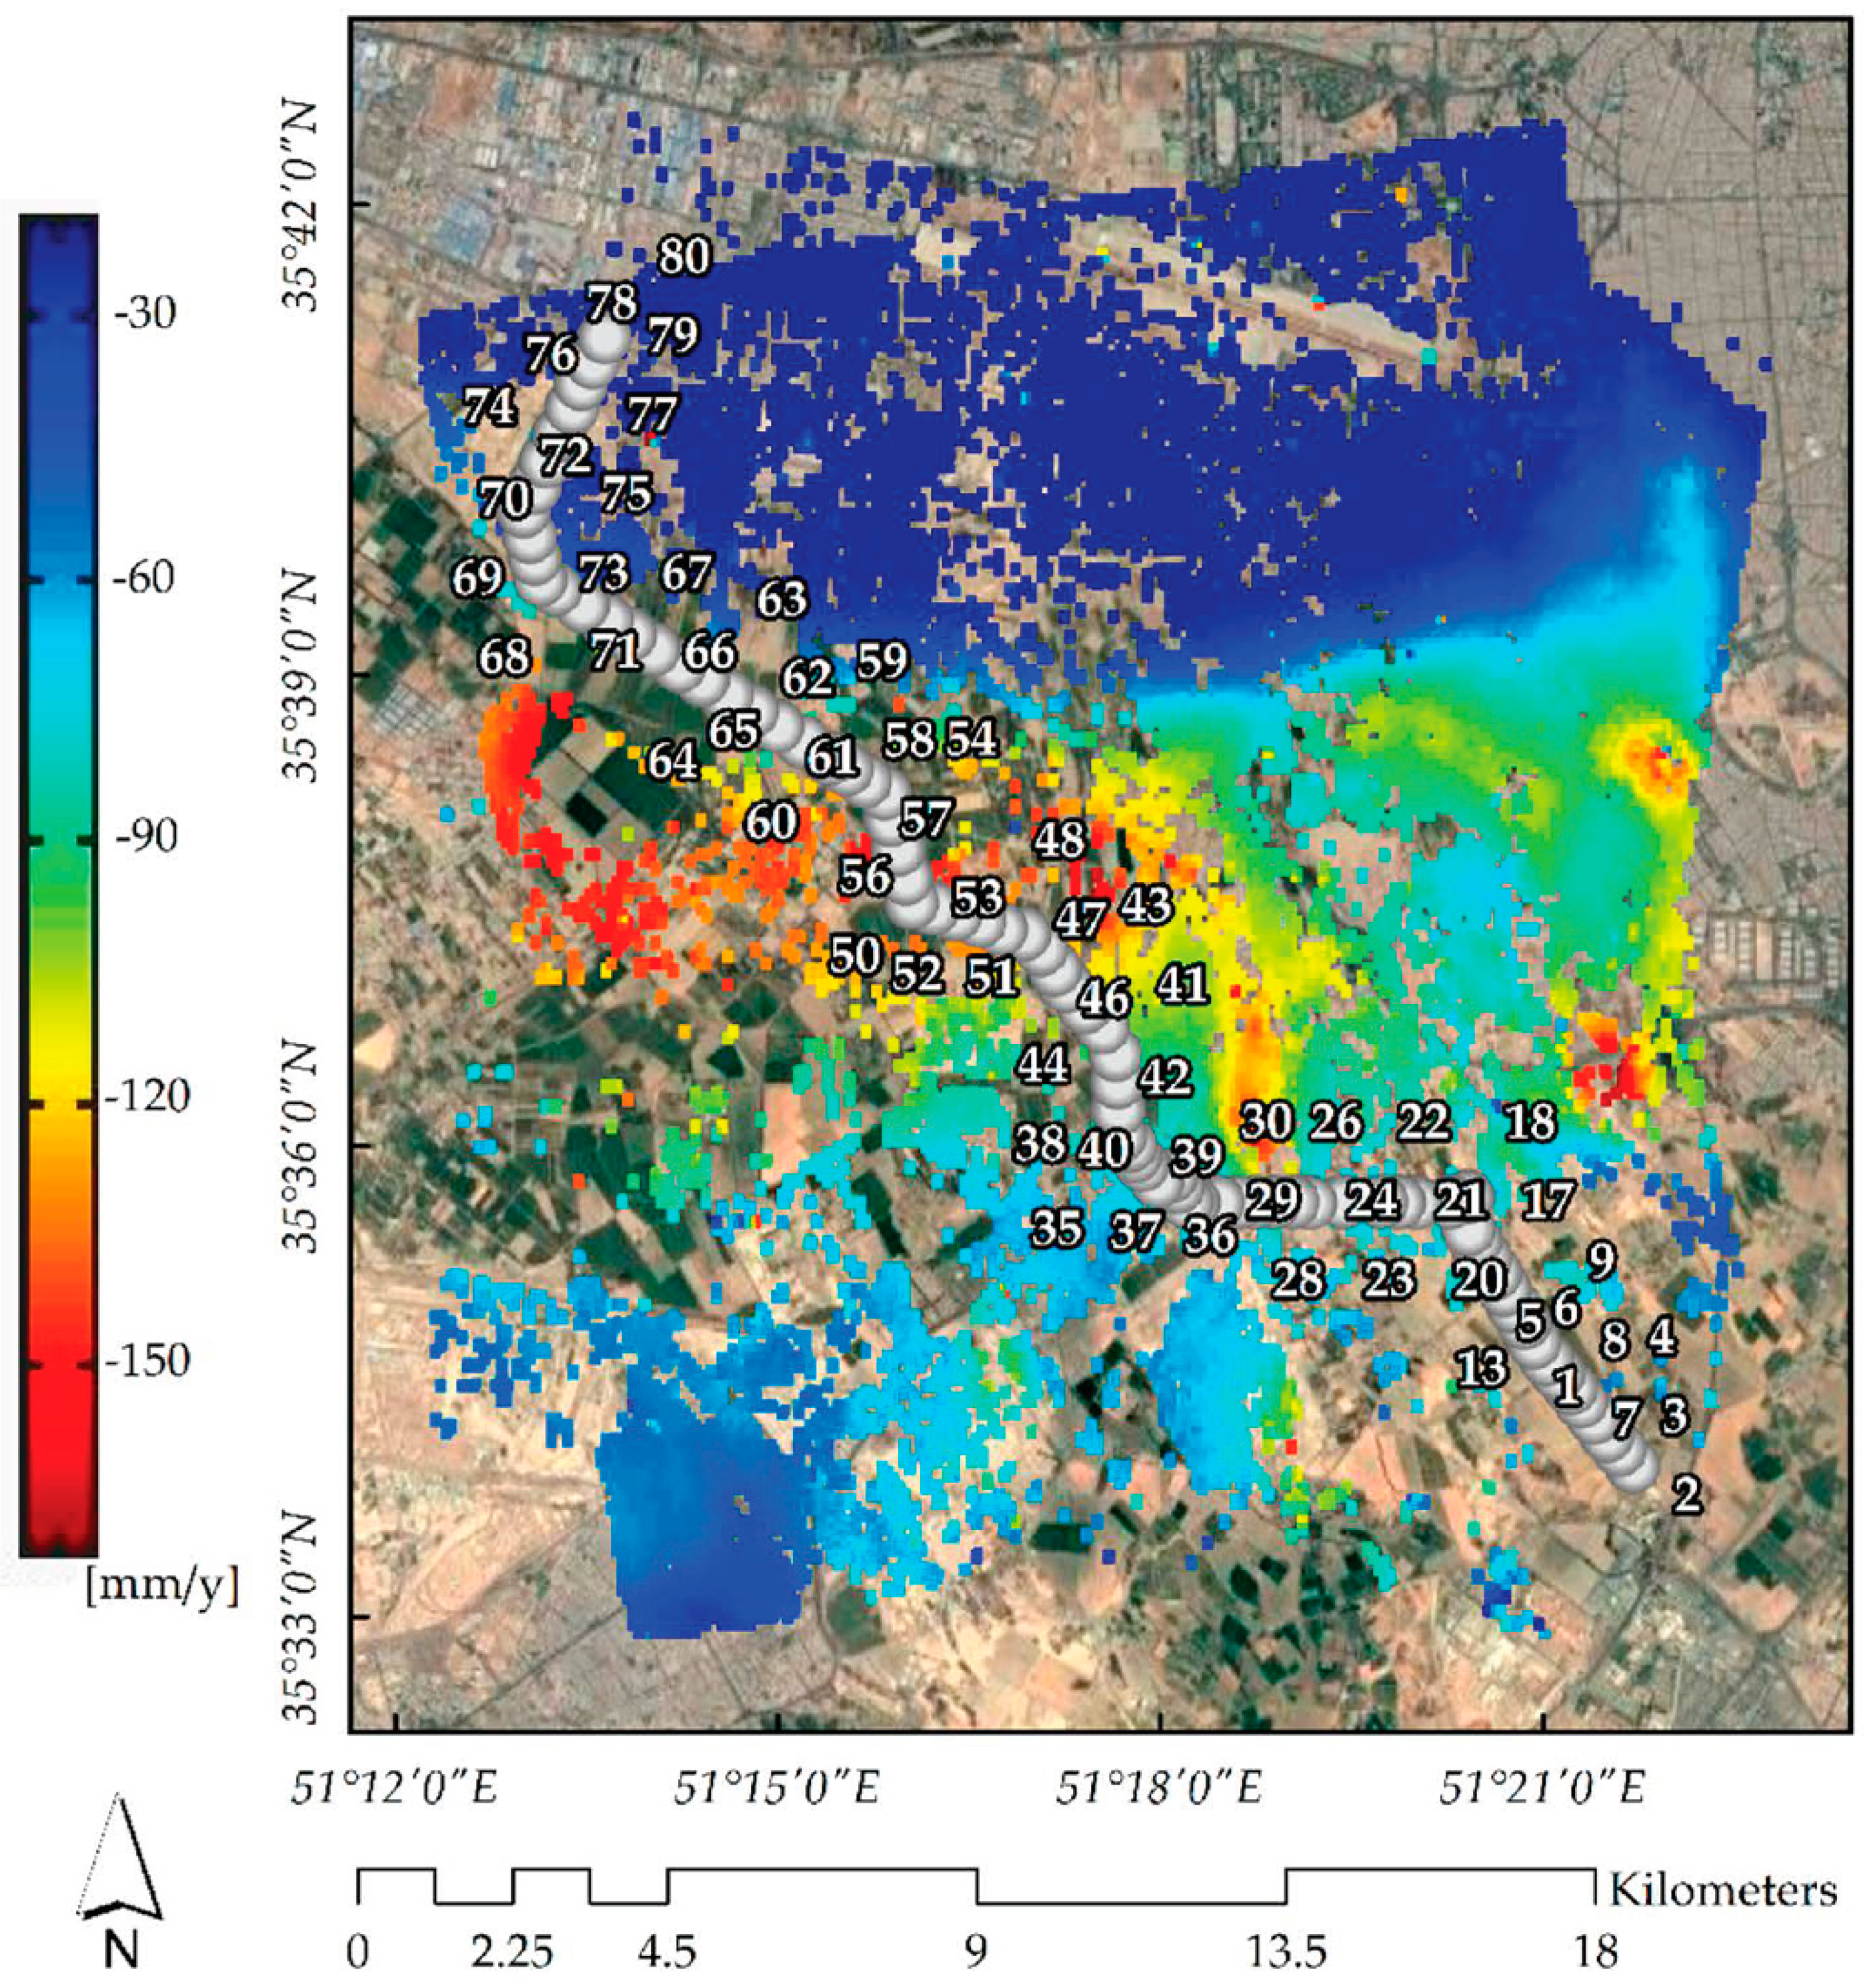
Increasing land subsidence in vegetated areas leading to urban areas would be a future concern for urban infrastructures. In the next experiment of the research, the impact of the subsidence on the power transmission line and towers was analyzed rigorously. Among the transmission lines that are located in the region of interest, only the information for one power line was available for this research. Figure 5 shows the location of the transmission line and PTs as gray pins. This line has the benefit of covering a long route, starting from somewhere in the vegetation-covered region to somewhere near the urban area, which includes all the subsidence patterns.
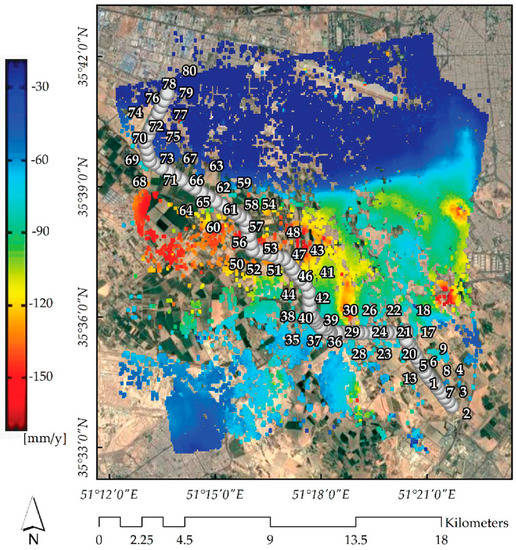
Figure 5.
Location of the power transmission line in the study area superimposed on resampled vertical velocity of S-1A. Each numbered gray point shows the detected PTs along the line.
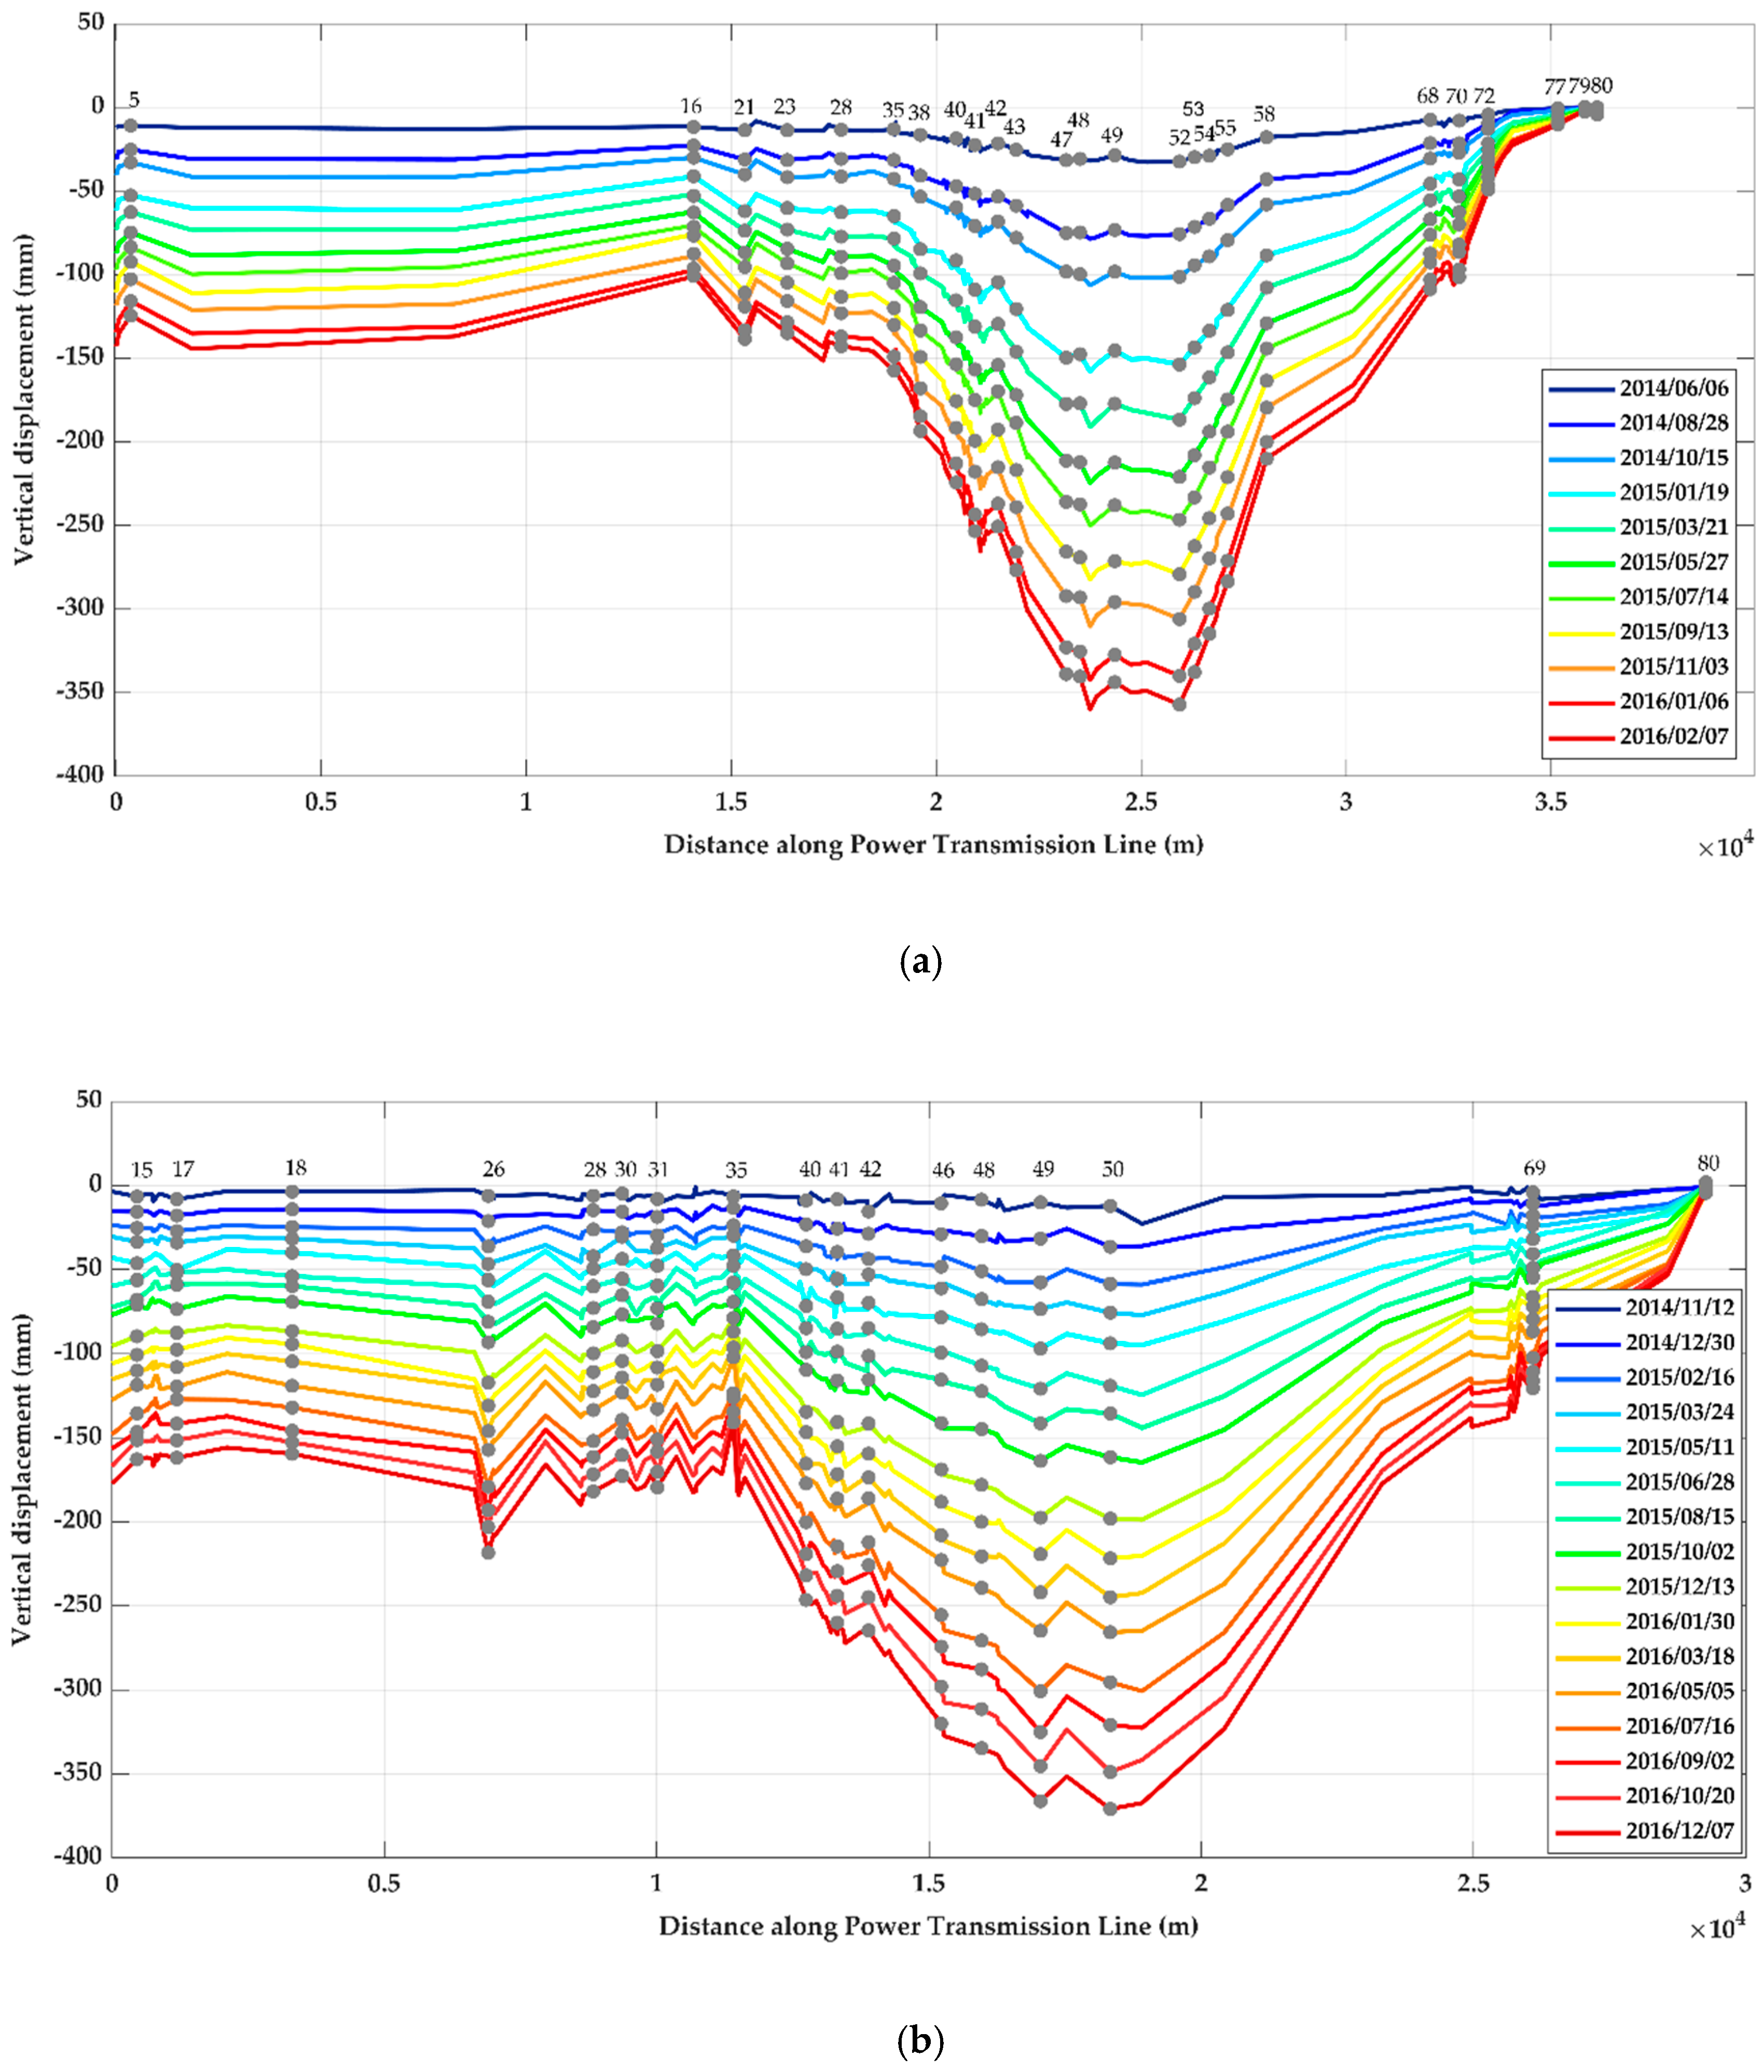
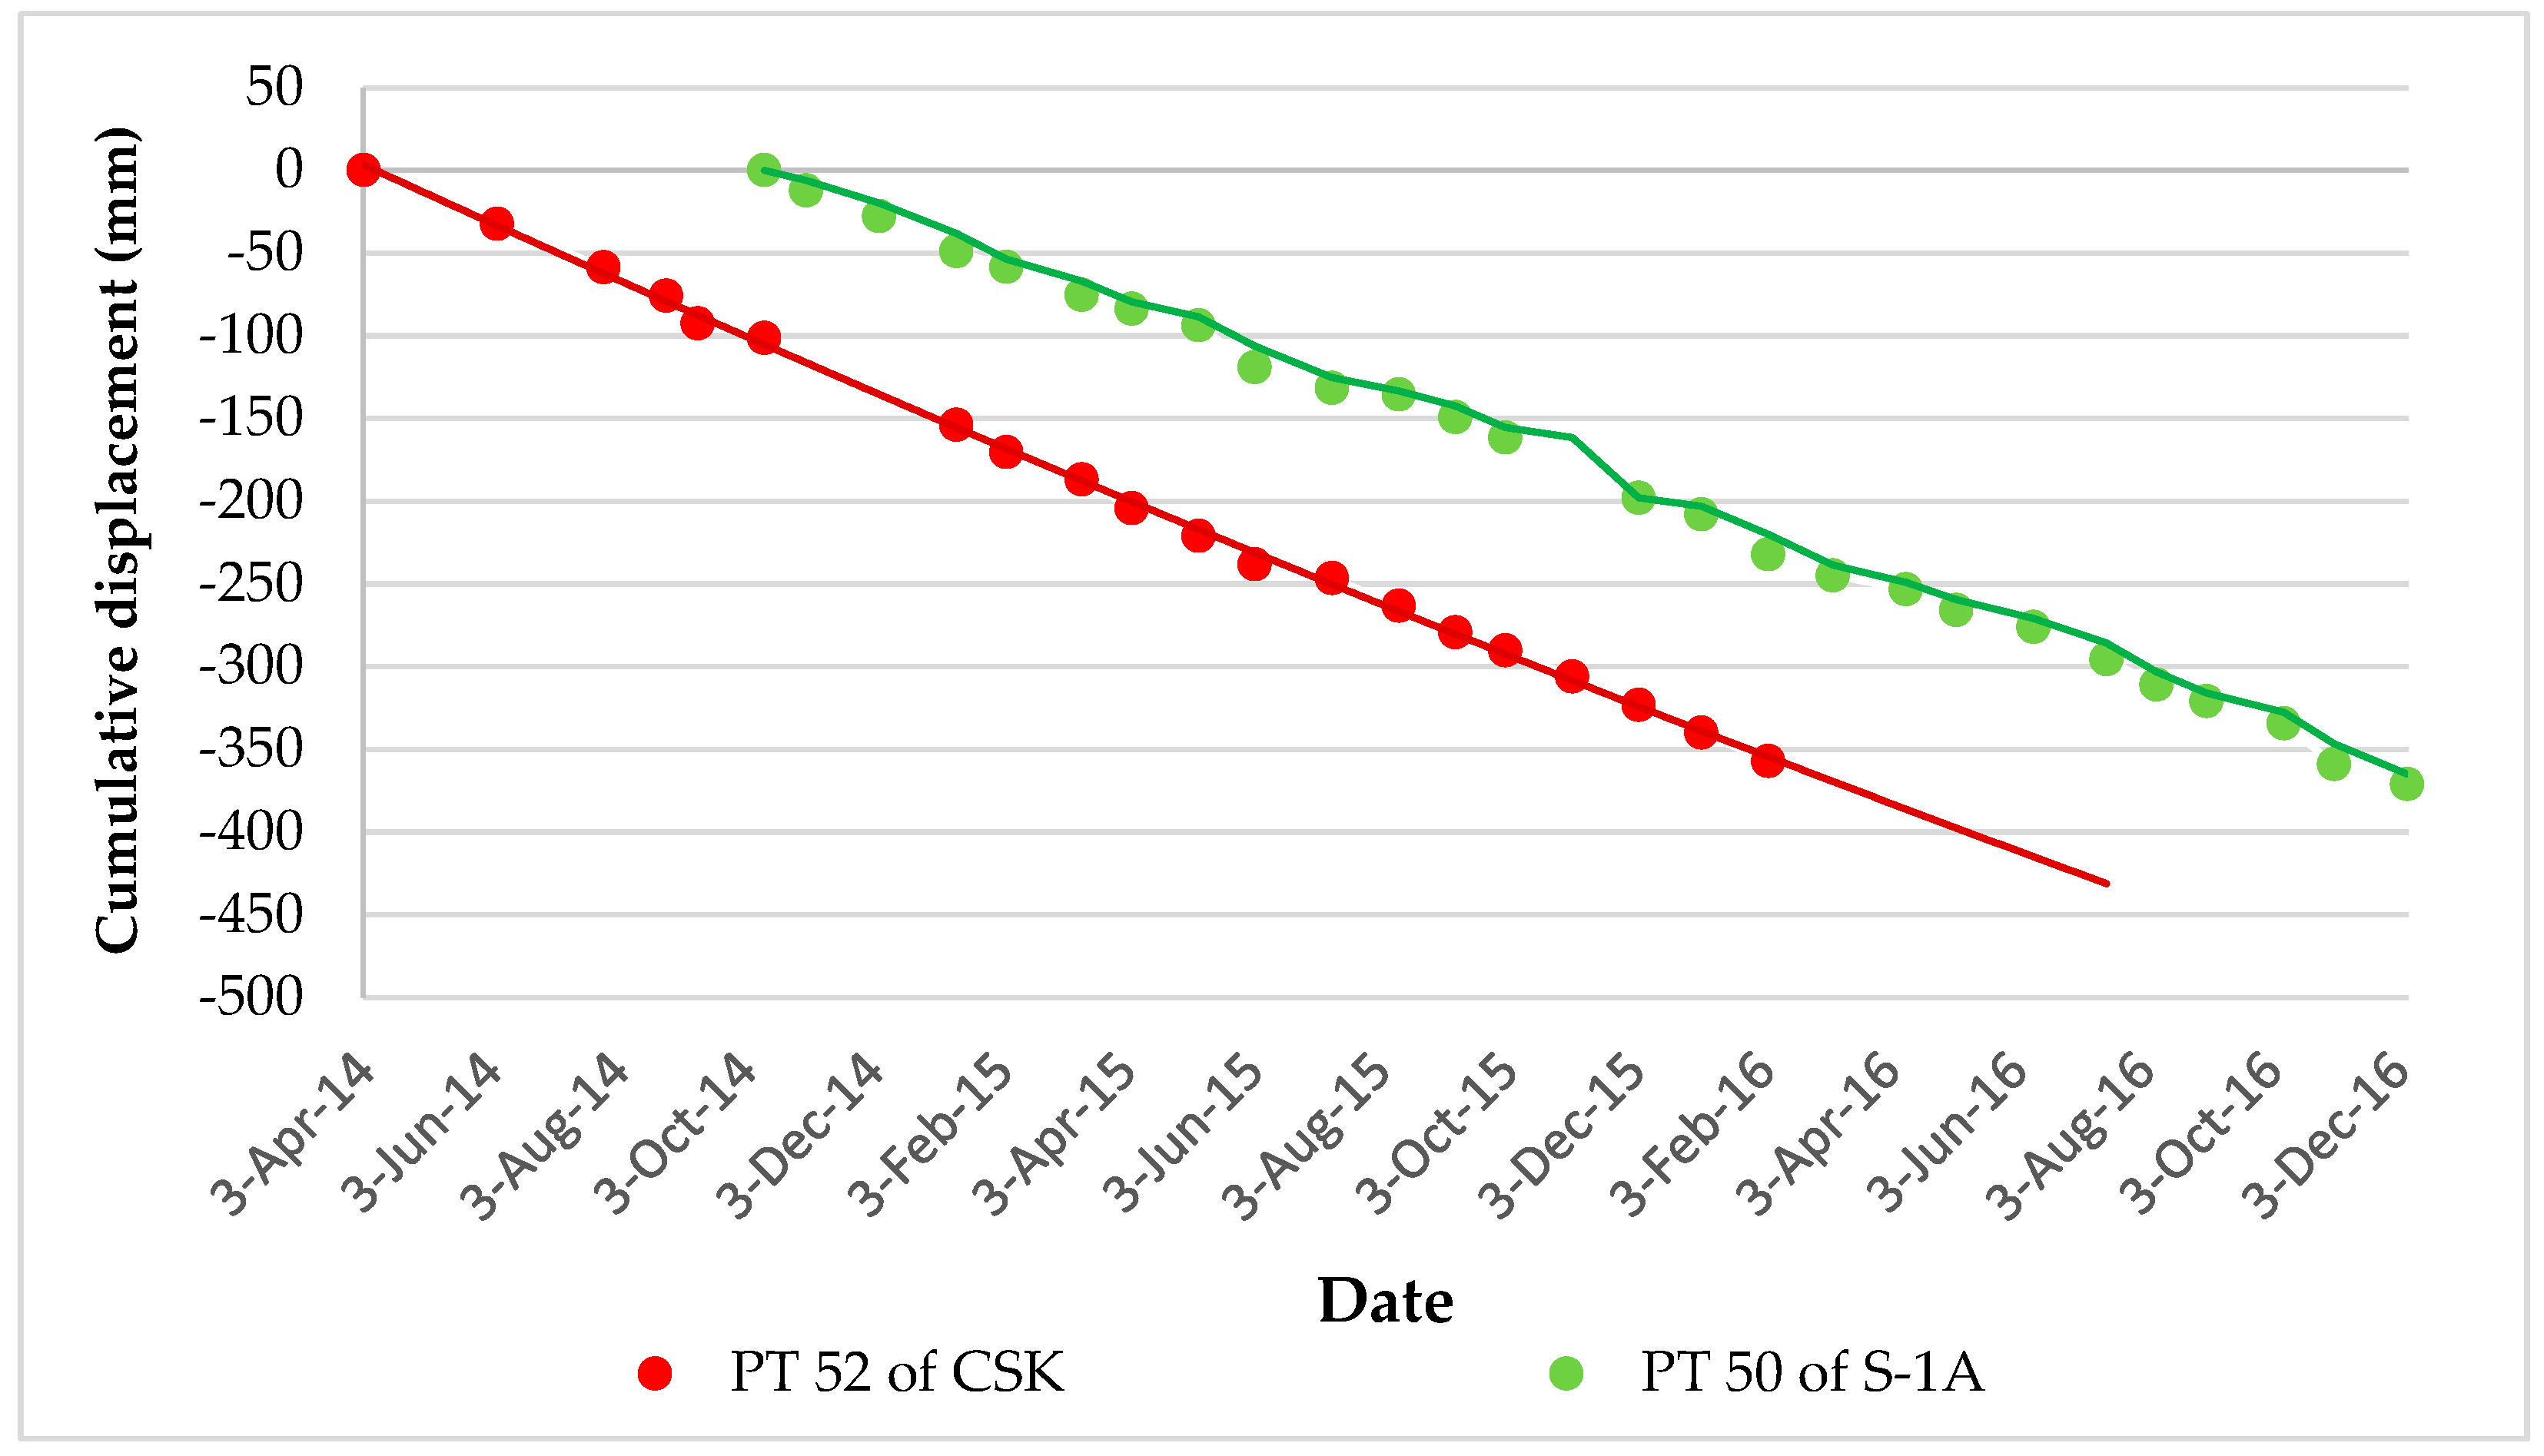
The time series deformation rates based on CSK and S-1A data analysis, for their own time acquisitions, for the PTs detected along the line are presented separately in Figure 6. Additionally, only the results of every second image relative to the first image were considered for plotting Figure 6a,b, in which the trends show the different time series results and the colors indicate the strength levels of the occurred subsidence. As demonstrated in the figures, a complete dynamic development of one subsidence bowl can be observed. Clearly, among a total of 80 PTs, 25 and 17 PTs were detected as PS points, leaving PTs number 52 and 50 situated in the maximum range of the bowl, with maximum vertical deformation estimates of −357 and −370 mm from the CSK and S-1A analyses, respectively. This does not mean that the estimates of the CSK analysis provided lower values than the S-1A data analysis, but these values came from different locations in the bowl zone and also different time intervals. It should also be noted that these maximum estimates are not the maximum in the whole area because they were only estimated along the transmission line. Vertical cumulative time series estimates of these two PTs over their processing time periods are also shown in Figure 7. The subsidence trends declined over time, leading the PTs into a dangerous situation. This behavior is the same for most PTs, especially those located in the subsidence areas. Therefore, subsidence has had a severe impact on PTs that are located in farmland with the overexploitation of groundwater, and it is necessary to strengthen the protection of them.
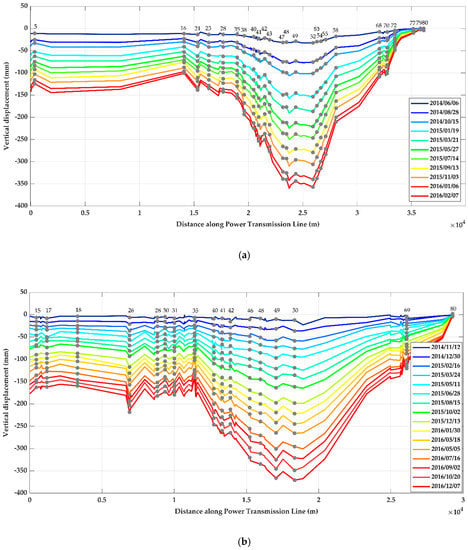
Figure 6.
Spatial subsidence profiles of power towers (PTs) along the selected transmission line based on (a) CSK and (b) S-1A vertical time series results. The gray points show the detected PTs, and the numbers indicate the numbers of them along the line, which show different profiles in different time series.
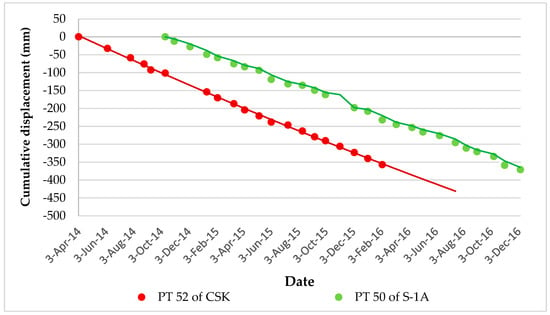
Figure 7.
Synthetic aperture radar interferometry (InSAR) vertical time series results for the PTs located in the center of the subsidence bowl.
Generally, it could be argued that X-band data are more sensitive to small rates of deformation as a result of their short wavelength. Here, higher deformation rates were determined from the CSK time series results. Considering the same time interval of the acquisitions, from October 2014 to February 2016, and also the same PT (e.g., nr. 49), the vertical displacement based on the CSK analysis was −245 mm, while the same value from the S-1A analysis was −231 mm. It is obvious that there were more PTs detected by the CSK time series analysis in the subsidence bowl zone, than the S-1A analysis. This implies that fewer PSs were determined due to the lower resolution of the S-1A data. By increasing the spatial extent between each PS and the reference point, an unsuccessful derivation of the absolute phase can result in second estimates of the unknown parameters. This causes unreliable estimates and low temporal coherence for points, which would be lost in the final deformation map.
In general, although CSK data benefit from a high spatial resolution and are capable of revealing more displacement detail, free S-1A data are more accessible than this commercial dataset. They lead to an estimate of an almost dense deformation map, making the S-1A data useful for conducting a general assessment of PTs.
5. Validation
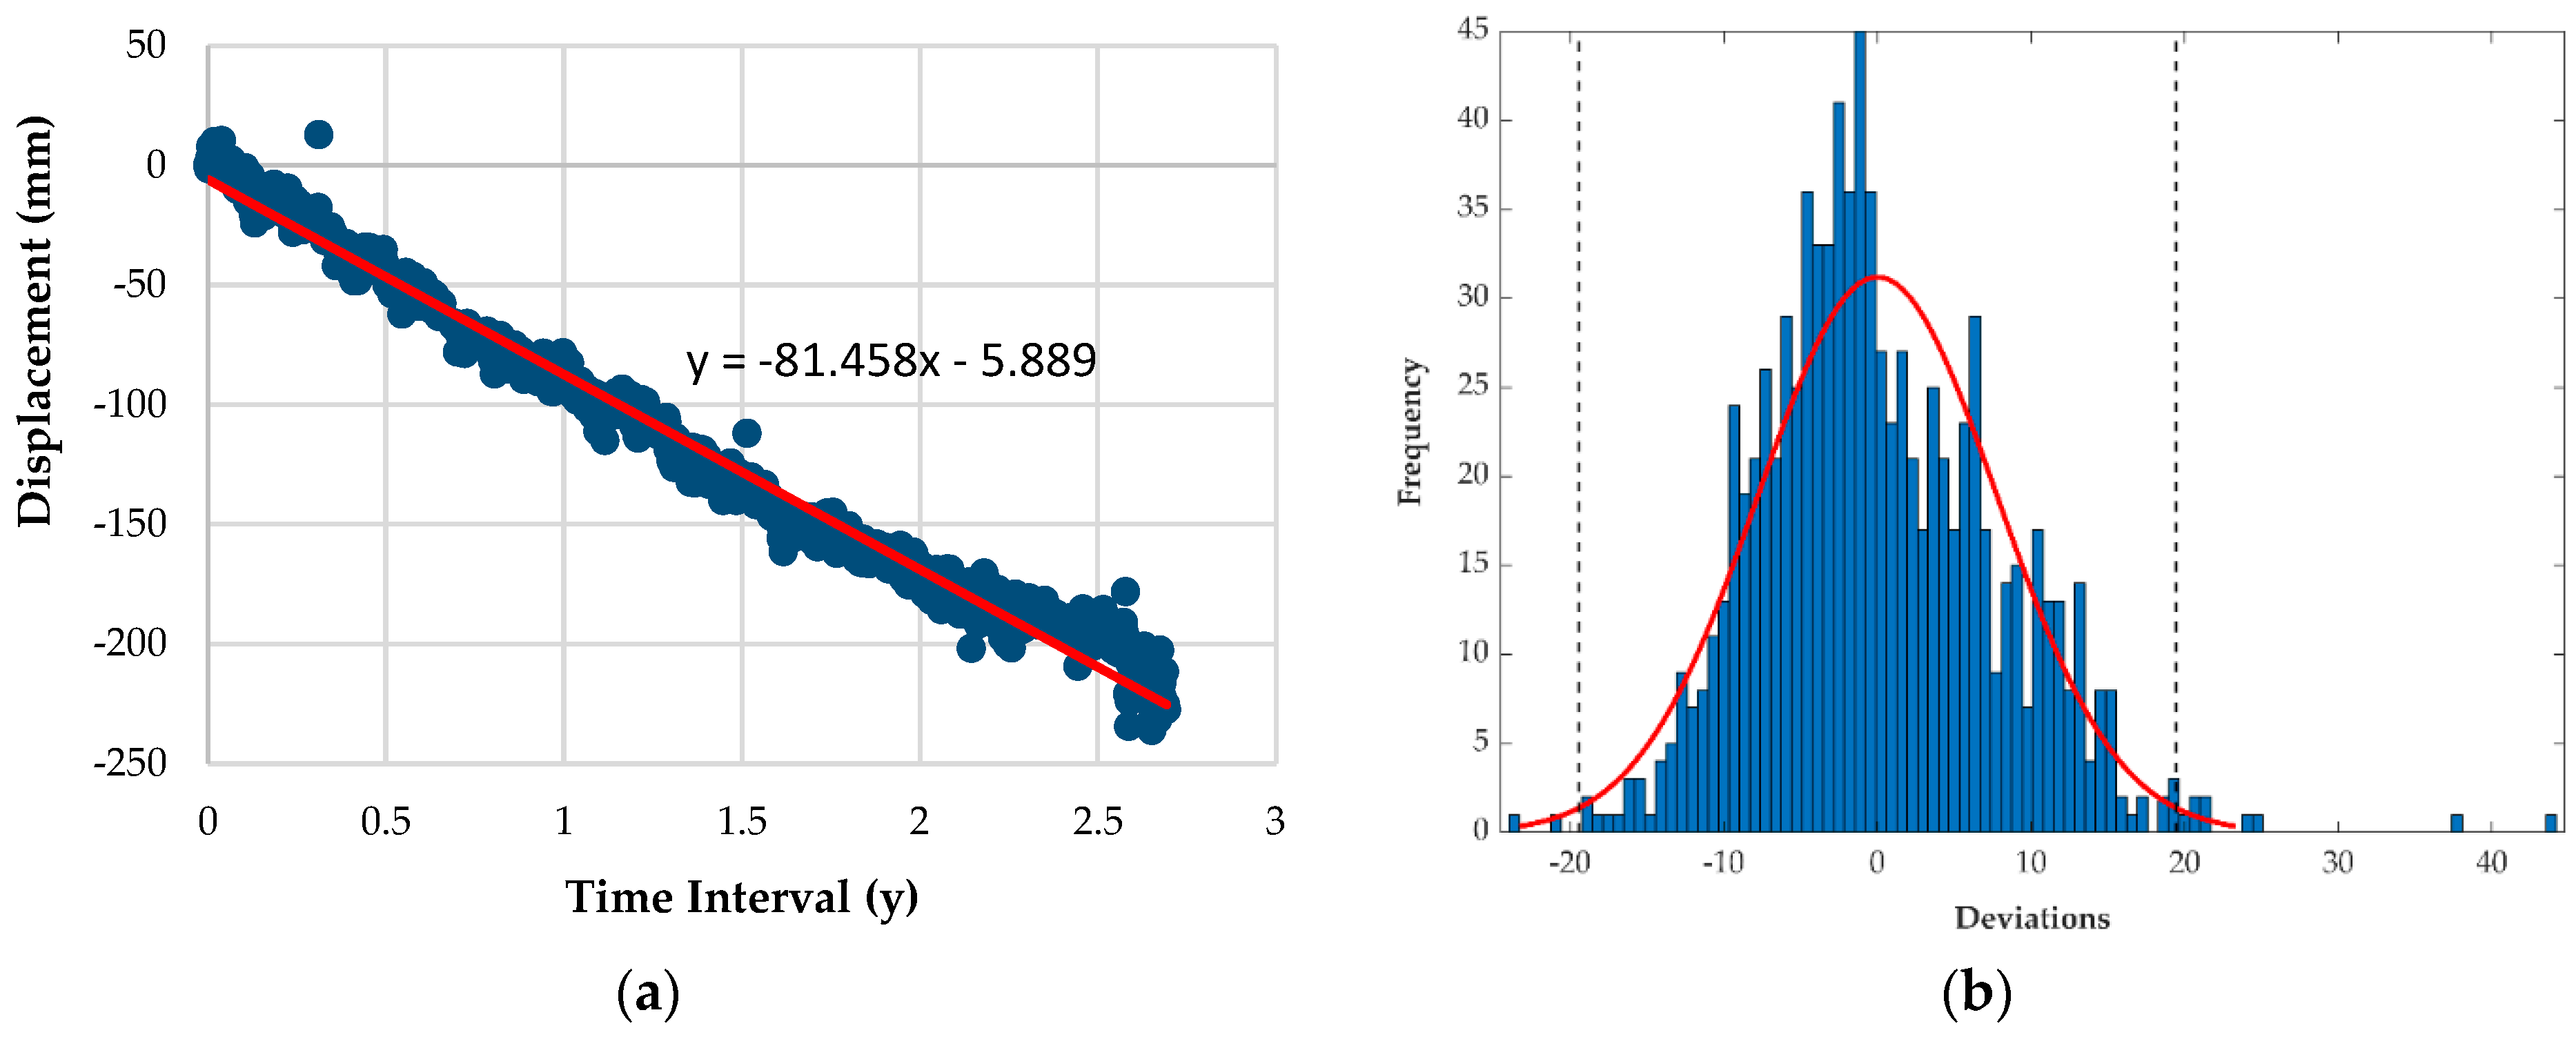
To validate the PSI analyses, daily GPS observations at the station in our subsided area were considered. To remove outliers from the observations, the frequency distribution of the deviations of the GPS observations from a linear fit on the same observations was estimated (Figure 8). Next, the outliers deviating by more than 2.5*sigma (standard deviation) from the linear fit were identified. Figure 8 shows the frequency distribution of the deviations. A total of 22 outliers were detected and removed out of a total of 892 daily GPS observations. It should be noted that the fact that the distribution of the deviations was clearly normal (Figure 8b) implies that the displacement is a function of time, since the deviations were randomly distributed with zero means.
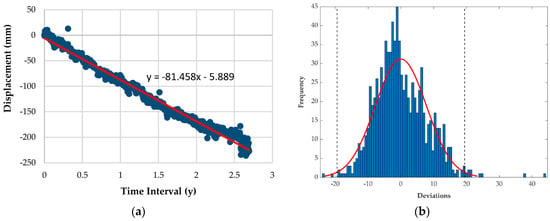
Figure 8.
(a) Daily GPS observations over the whole time interval (from April 2014 to December 2016). (b) Distribution of the derived GPS deviations from the linear fit (red trend line in Figure 8 (a)). The black dashed lines in (b) show the 2.5*sigma tails of the distribution.
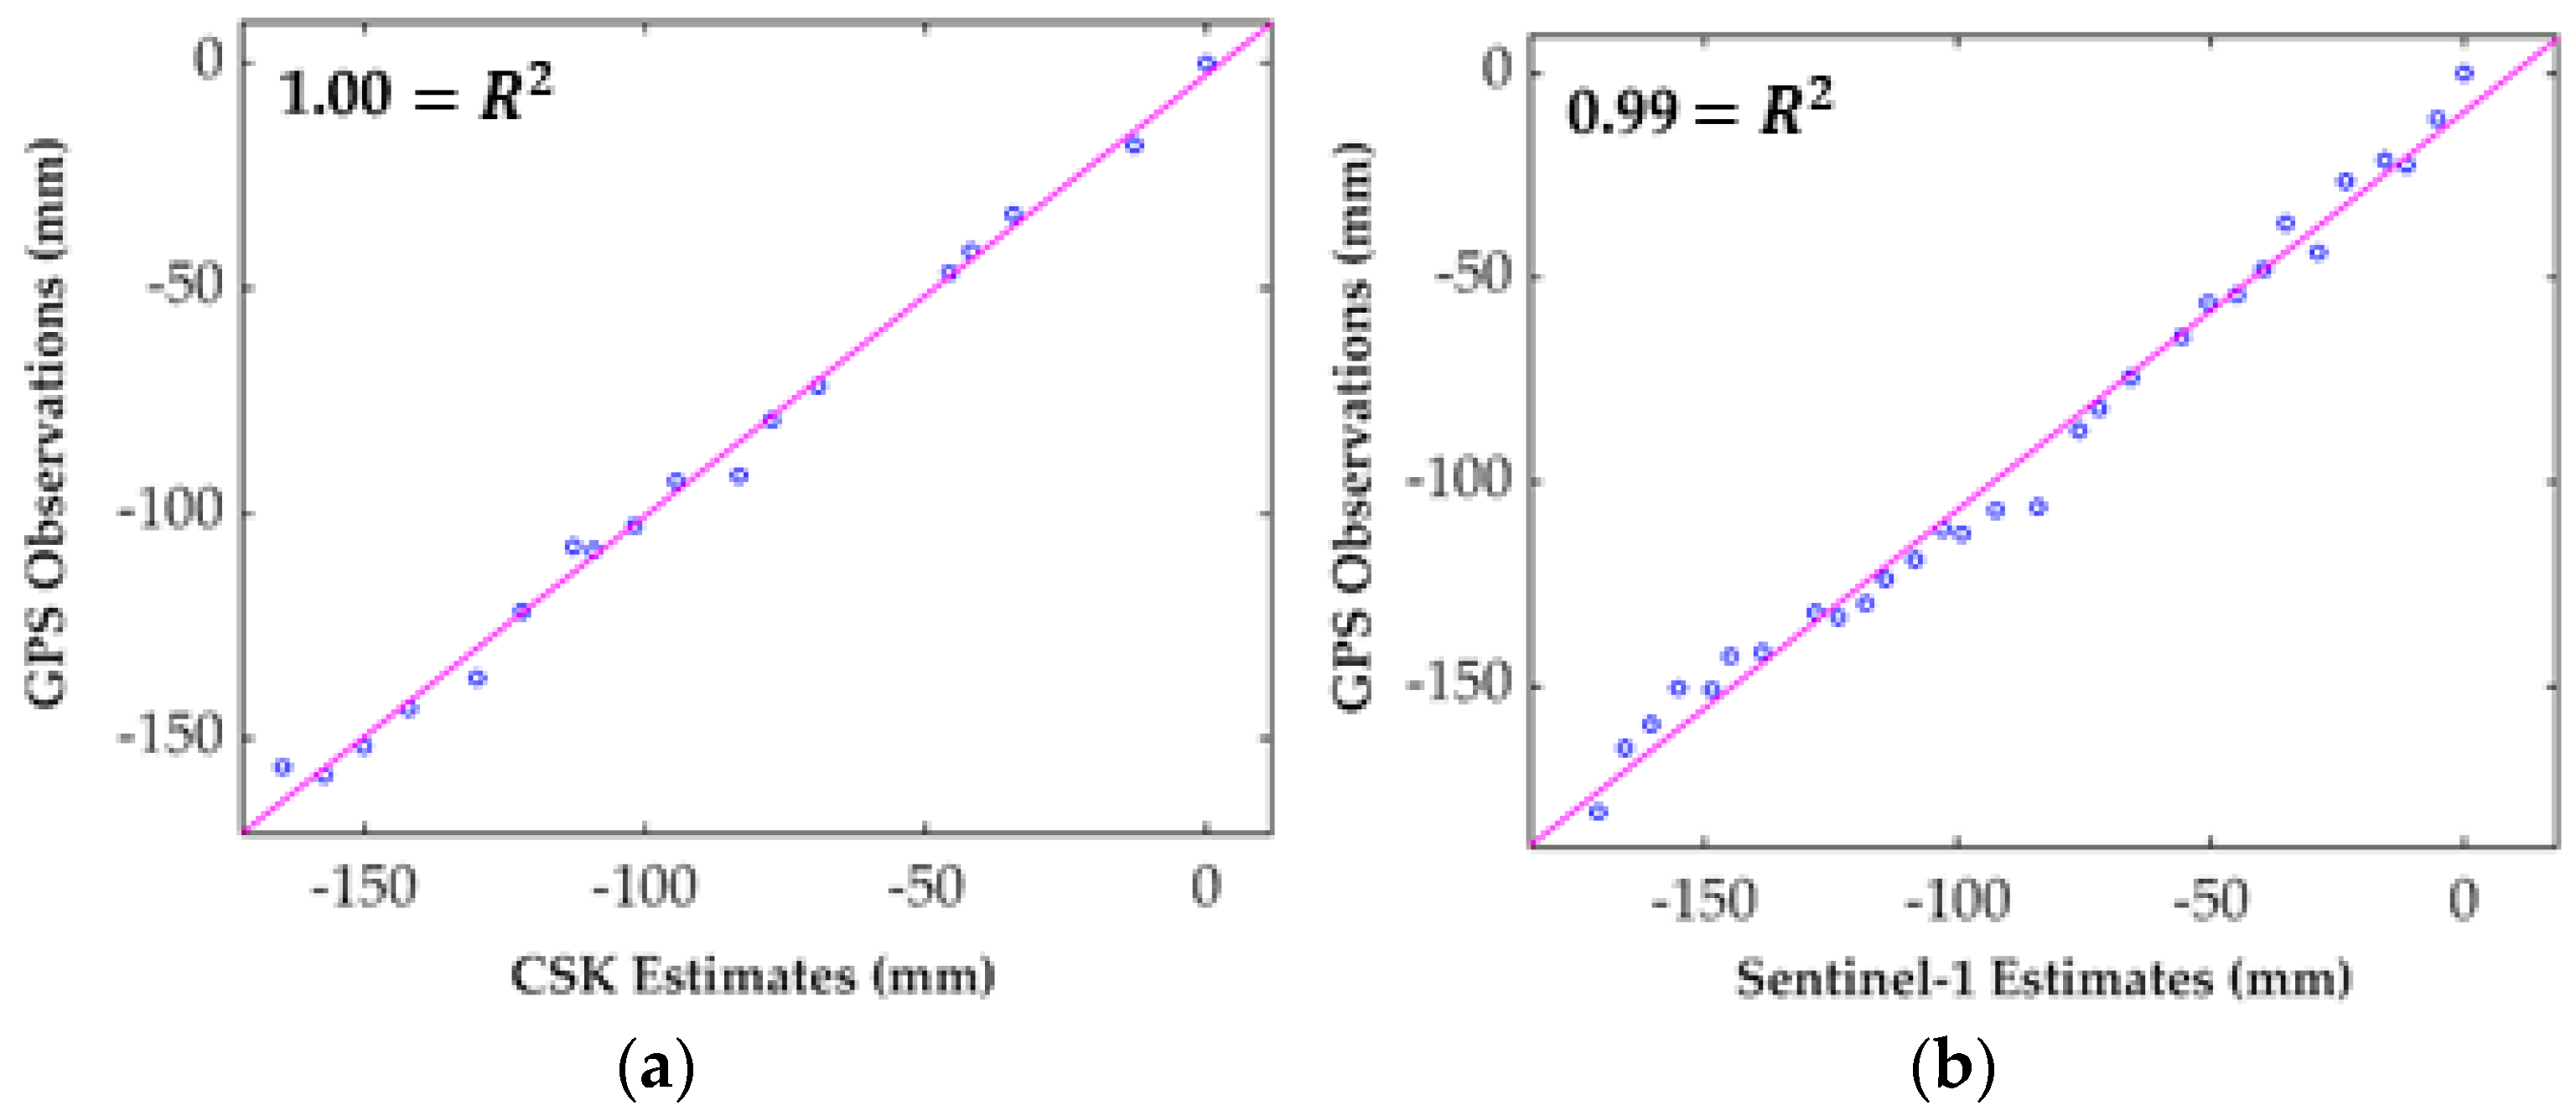
Finally, we compared the InSAR estimates with the valid GPS observations for both the Sentinel-1 and CSK analyses separately. The estimates obtained with the CSK and S-1A data were evaluated against the vertical displacements measured by GPS. The root mean square error (RMSE) statistics were calculated based on 18 and 30 paired observations of CSK and S-1A vs. GPS, respectively. RMSE values of 9.11 mm for S-1A and 3.8 mm for CSK analyses were obtained. The larger RMSE of the S-1A analysis is probably due to its lower spatial resolution as well as longer wavelength. The scatter plots of the vertical displacement of CSK vs. GPS estimates of the total vertical displacement (from April 2014 to February 2016) and S-1 vs. GPS (from October 2014 to December 2016) are shown in Figure 9. Only InSAR and GPS measurements on the same dates are considered. According to Figure 9, a high correlation between the two PSI time series results and the corresponding GPS observations is observable.
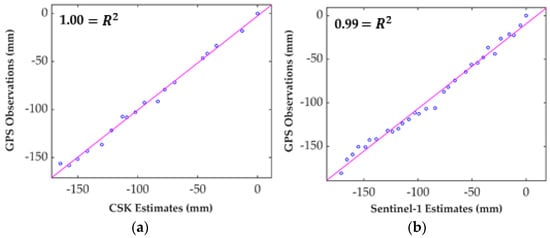
Figure 9.
Scatter plots of vertical displacements. (a) CSK and (b) S-1 estimates vs. GPS.
Uncertainity Assesment
Apart from the error propagation of the velocities according to Equation (3), the spatial statistical uncertainty of the velocities was also calculated to assess the error of the estimates (Equation (5)). Assuming the subsidence rate of a stable target is zero, the error of the velocity estimates in an arbitrary non-subsided area is [38]:
where is the mean velocity value in the selected area. represents the standard deviation of the velocities, and is the number of PS points in that region.
The estimates of both the total vertical displacements over time and of the subsidence rates obtained from the three data sources are rather similar (see Table 1). According to Table 1, the subsidence rates were calculated at the GPS location, and the GPS rates were estimated for both the InSAR datasets’ time intervals. The estimates of the subsidence rate are generally consistent, although the differences between the InSAR retrievals and the GPS observations are larger than the estimated error, i.e., they are significant. On the other hand, the InSAR retrievals and the GPS observations relate to different locations; thus, such differences may simply be explained by spatial variability.

Table 1.
Evaluation of CSK and S-1A estimates vs. GPS observations.
It should be noted that the CSK estimation has a better agreement with the field observations due to its high spatial resolution and capability of determining more PS points, even those around the GPS station, which cannot be detected with the S-1A data. As we discussed, the CSK data are also able to allow the detection of small deformation rates since they have a shorter wavelength compared to the S-1A data. Thus, the CSK estimates are closer to the real-world ground deformation.
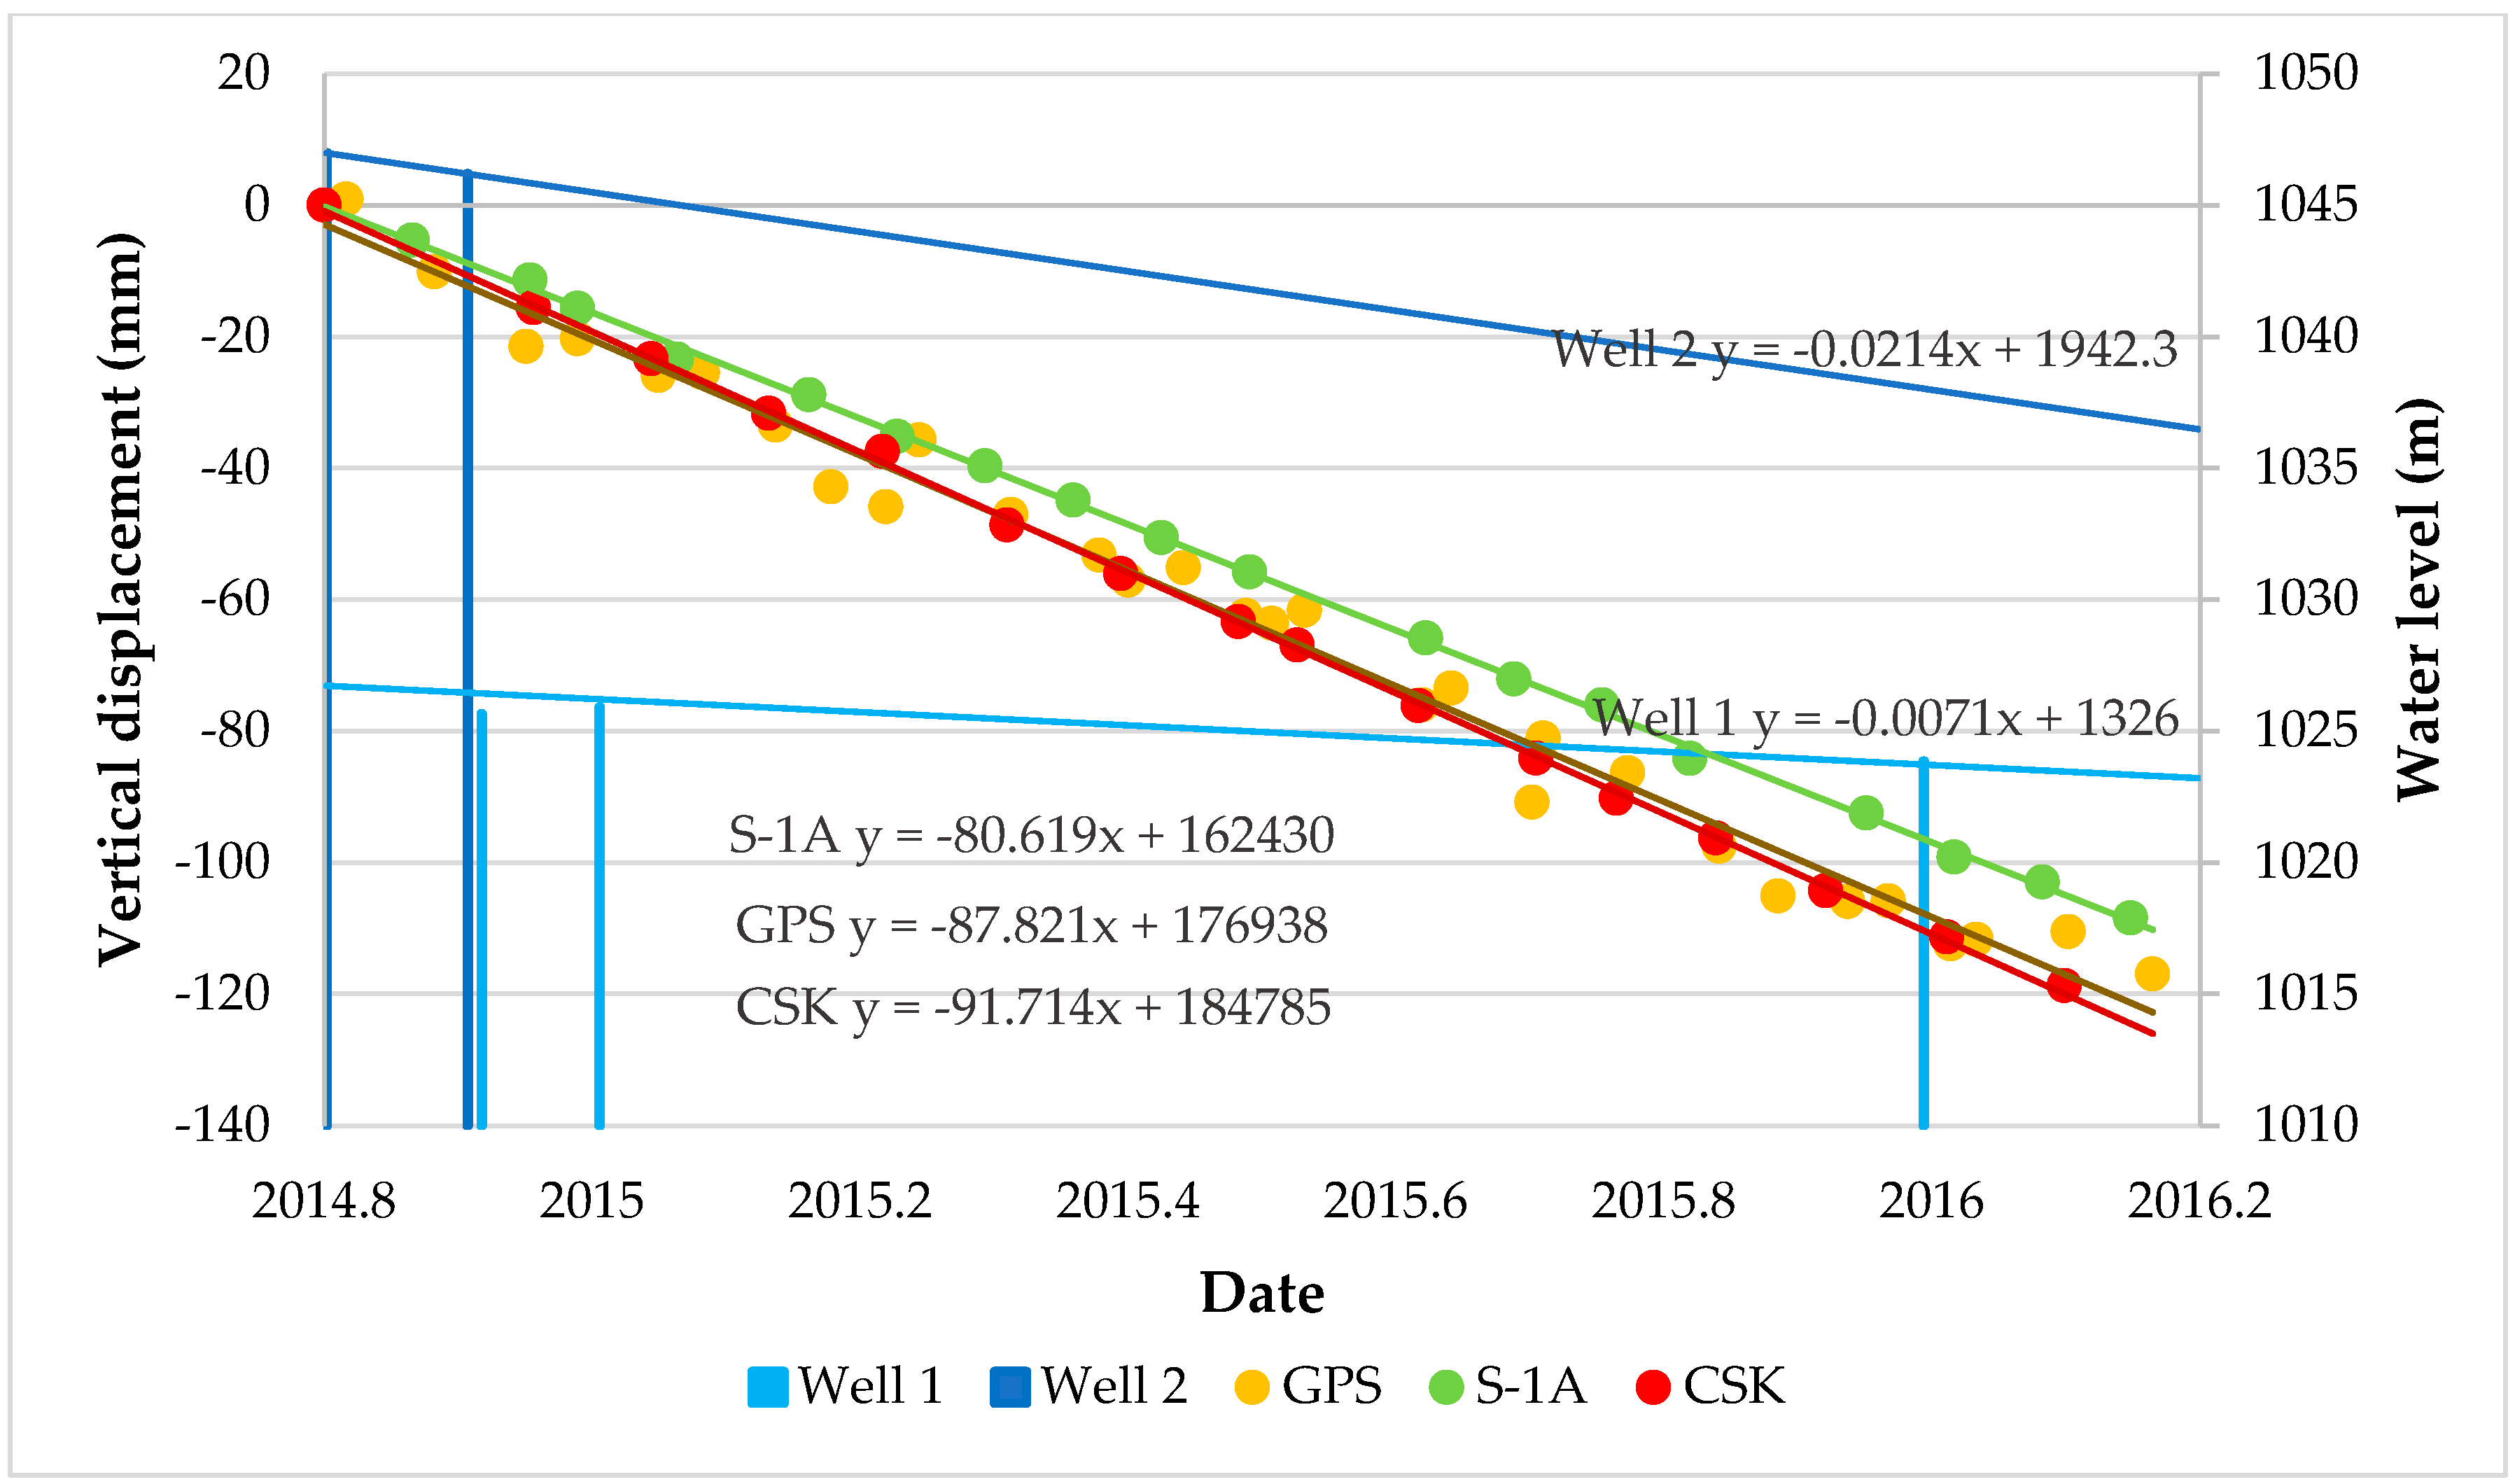
All the time series trends are presented through a comparative chart in Figure 10, where the vertical components of the InSAR analyses are compared to the GPS vertical measurements. The trend lines for CSK and S-1 are rather similar to the linear trend of the whole GPS observations (see Figure 8). Information for all the piezometric observations during the same time interval for both wells is shown as light and dark blue bars. Each bar shows the water level height from the entire well depth. The seasonal changes in water level have a decreasing trend, which also proves the PSI results.
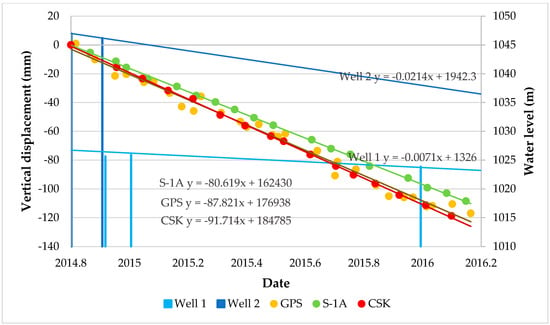
Figure 10.
Comparative chart of global positioning system (GPS) vs. InSAR vertical measurement and water level changes during a common time interval. Only the GPS observations on the same dates as the S-1 and CSK data are visualized. InSAR time series results for CSK, S-1A and GPS are shown as red, green and yellow points, respectively.
6. Conclusions
The main purpose of this research was simply to apply two different datasets, C and X bands, in a unique application of the PSI technique in determining the effects of the land subsidence phenomenon on PTs. Great performance of the PS technique for monitoring the power transmission line was shown, which had not been done before in the area of interest. Four data stacks from the S-1A and CSK satellites collected between 2014 and 2016 over the Tehran basin area (affected by subsidence due to groundwater withdrawal) and a linear model helped us to investigate the displacement of PTs around the subsidence bowl. The results indicate that the maximum subsidence velocity reached −86 and −79 mm/y using the CSK and S-1A data during the common time interval, respectively. Compared to the GPS data, RMSE values of 0.3 and 0.9 cm were obtained for the CSK and S-1A data, respectively. The trend of subsidence was in complete agreement with the piezometric observations of two wells in the area. One long power transmission line, consisting of all the subsidence patterns in the study area, was selected. Among 80 PTs, 25 and 17 were detected by the CSK and S-1A, respectively. Moreover, PT number 49 showed maximum displacements of −245 and −231 mm along the vertical direction according to the CSK and S-1A analyses, respectively. The strength of transmission PTs is in serious jeopardy; thus, they need to be constantly monitored to ensure safety and accurate operation. On the other hand, a comparison between the CSK and S-1A analyses was conducted. The results showed that in spite of the low resolution and long wavelength of the C-band data, they have shown reasonably good performance for detecting PTs and estimating the amount of subsidence in comparison with X-band data, which are obviously more accurate. C bands, with free access, would be a good choice for evaluating areas of interest. However, for obtaining detailed information about displacements and also a high number of detected PTs, X-band data are more suitable. For future studies, it is suggested to apply more accurate and up-to-date PS techniques for finding more vertical structures as PSs.
Author Contributions
Conceptualization, F.T. and F.F.; methodology, D.P.; software, D.P.; validation, F.T. and F.F.; formal analysis, F.T.; investigation, F.T. and F.F.; resources, F.T.; data curation, F.T.; writing—original draft preparation, F.T.; writing—review and editing, F.F.; visualization, F.T.; supervision, F.F.; project administration, F.F.; funding acquisition. All authors have read and agreed to the published version of the manuscript.
Funding
This research received no external funding.
Informed Consent Statement
Not applicable.
Data Availability Statement
Not applicable.
Acknowledgments
The authors would like to express sincere thanks to the German Aerospace Center (DLR, Germany) for providing the WorldDEM tile of Tehran for this study. We are deeply grateful to the European Space Agency (ESA) for providing, free of charge, Sentinel data and also to © ASI (Italian Space Agency) for providing CSK® Products under an ASI license to use.
Conflicts of Interest
The authors declare no conflict of interest.
References
- Montazeriun, M.; Aslani, F. Evaluation of land subsidence using GIS technique (Case study: Tehran and Alborz provinces). Disaster Prev. Manag. Knowl. 2019, 9, 35–47. [Google Scholar]
- Luo, Q.; Perissin, D.; Zhang, Y.; Jia, Y. L- and X-Band Multi-Temporal InSAR Analysis of Tianjin Subsidence. Remote Sens. 2014, 6, 7933–7951. [Google Scholar] [CrossRef]
- Arabi, S.; Montazerian, A.R.; Maleki, E.; Talebi, A. Study of land subsidence in south west of Tehran. J. Eng. Surv. 2005, 69, 14–24. [Google Scholar]
- Mahmoudpour, M.; Khamehchiyan, M.; Nikudel, M.R.; Ghassemi, M.R. Numerical simulation and prediction of regional land subsidence caused by groundwater exploitation in the southwest plain of Tehran, Iran. Eng. Geol. 2016, 201, 6–28. [Google Scholar] [CrossRef]
- Foroughnia, F.; Nemati, S.; Maghsoudi, Y.; Perissin, D. An iterative PS-InSAR method for the analysis of large spatio-temporal baseline data stacks for land subsidence estimation. Int. J. Appl. Earth Obs. Geoinf. 2019, 74, 248–258. [Google Scholar] [CrossRef]
- Land Subsidence in Varamin and Its Effect. Available online: https://civilica.com/doc/898466/ (accessed on 29 November 2020).
- Boron, S. Forecasting of stresses in overhead power lines running through area affected by the mining damage. In IOP Conference Series: Earth and Environmental Science; IOP Publishing: Bristol, UK, 2018; Volume 174, p. 012002. [Google Scholar]
- Gabriel, A.K.; Goldstein, R.M.; Zebker, H.A. Mapping small elevation changes over large areas: Differential radar interferometry. J. Geophys. Res. Space Phys. 1989, 94, 9183–9191. [Google Scholar] [CrossRef]
- Zebker, H.; Villasenor, J. Decorrelation in interferometric radar echoes. IEEE Trans. Geosci. Remote Sens. 1992, 30, 950–959. [Google Scholar] [CrossRef]
- Zebker, H.A.; Rosen, P.A.; Hensley, S. Atmospheric effects in interferometric synthetic aperture radar surface deformation and topographic maps. J. Geophys. Res. Space Phys. 1997, 102, 7547–7563. [Google Scholar] [CrossRef]
- Ferretti, A.; Prati, C.; Rocca, F. Permanent scatterers in SAR interferometry. IEEE Trans. Geosci. Remote Sens. 2001, 39, 8–20. [Google Scholar] [CrossRef]
- Ferretti, A.; Prati, C.; Rocca, F. Nonlinear subsidence rate estimation using permanent scatterers in differential SAR inter-ferometry. IEEE Trans. Geosci. Remote Sens. 2000, 38, 2202–2212. [Google Scholar] [CrossRef]
- Zhu, X.X.; Wang, Y.; Montazeri, S.; Ge, N. A review of ten-year advances of multi-baseline SAR interferometry using TerraSAR-X data. Remote Sens. 2018, 10, 1374. [Google Scholar] [CrossRef]
- Crosetto, M.; Monserrat, O.; Cuevas-González, M.; Devanthéry, N.; Crippa, B. Persistent Scatterer Interferometry: A review. ISPRS J. Photogramm. Remote Sens. 2016, 115, 78–89. [Google Scholar] [CrossRef]
- Werner, C.; Wegmuller, U.; Strozzi, T.; Wiesmann, A. Interferometric point target analysis for deformation mapping. In Proceedings of the International Geoscience and Remote Sensing Symposium (IGARSS), Toulouse, France, 21–25 July 2003; Volume 7, pp. 4362–4364. [Google Scholar]
- Crosetto, M.; Arnaud, A.; Duro, J.; Biescas, E.; Agudo, M. Deformation monitoring using remotely sensed radar interferometric data. In Proceedings of the 11th International Symposium on Deformation Measurements, Santorini Island, Greece, 25–28 May 2003. [Google Scholar]
- Kampes, B.M. Displacement Parameter Estimation Using Permanent Scatterer Interferometry. Ph.D. Thesis, Delft University of Technology, Delft, The Netherlands, 2005. [Google Scholar]
- Hooper, A.; Zebker, H.; Segall, P.; Kampes, B. A new method for measuring deformation on volcanoes and other natural terrains using InSAR persistent scatterers. Geophys. Res. Lett. 2004, 31. [Google Scholar] [CrossRef]
- Ferretti, A.; Fumagalli, A.; Novali, F.; Prati, C.; Rocca, F.; Rucci, A. A New Algorithm for Processing Interferometric Data-Stacks: SqueeSAR. IEEE Trans. Geosci. Remote Sens. 2011, 49, 3460–3470. [Google Scholar] [CrossRef]
- Perissin, D.; Wang, T. Repeat-pass SAR interferometry with partially coherent targets. IEEE Trans. Geosci. Remote Sens. 2011, 50, 271–280. [Google Scholar] [CrossRef]
- Deng, S.; Zhang, J.; Li, P.; Yang, J. Power line detection from synthetic aperture radar imagery using coherence of co-polarisation and cross-polarisation estimated in the Hough domain. IET Radar Sonar Navig. 2012, 6, 873–880. [Google Scholar] [CrossRef]
- Yang, W.; Zhang, H.; Chen, J.; Sun, H. Automatic Detection of Power Transmission Series in Full Polarimetric SAR Imagery. In Proceedings of the 2007 IEEE Radar Conference, Boston, MA, USA, 17–20 April 2007; pp. 789–793. [Google Scholar]
- Yan, L.; Wu, W.; Li, T. Power transmission tower monitoring technology based on TerraSAR-X products. In International Symposium on Lidar and Radar Mapping 2011: Technologies and Applications; International Society for Optics and Photonics: Bellingham, WA, USA, 2011. [Google Scholar]
- Luo, Q.; Perissin, D.; Lin, H.; Zhang, Y.; Wang, W. Subsidence monitoring of Tianjin suburbs by TerraSAR-X persistent scatterers interferometry. IEEE J. Sel. Topics Appl. Earth Obs. Remote Sens. 2013, 7, 1642–1650. [Google Scholar] [CrossRef]
- Carande, R.; Marra, M.; Cronin, D.; Nagy, P. Automated mapping using airborne IFSAR data. In Proceedings of the 1998 IEEE International Geoscience and Remote Sensing, Seattle, WA, USA, 6–10 July 1998. [Google Scholar]
- Ge, L.; Chang, H.-C.; Rizos, C. Mine Subsidence Monitoring Using Multi-source Satellite SAR Images. Photogramm. Eng. Remote Sens. 2007, 73, 259–266. [Google Scholar] [CrossRef]
- Iasio, C.; Novali, F.; Corsini, A.; Mulas, M.; Branzanti, M.; Benedetti, E.; Giannico, C.; Tamburini, A.; Mair, V. COSMO SkyMed high frequency—High resolution monitoring of an alpine slow landslide, corvara in Badia, Northern Italy. In Proceedings of the 2012 IEEE International Geoscience and Remote Sensing Symposium, Munich, Germany, 22–27 July 2012. [Google Scholar]
- Matikainen, L.; Lehtomäki, M.; Ahokas, E.; Hyyppä, J.; Karjalainen, M.; Jaakkola, A.; Kukko, A.; Heinonen, T. Remote sensing methods for power line corridor surveys. ISPRS J. Photogramm. Remote Sens. 2016, 119, 10–31. [Google Scholar] [CrossRef]
- Yan, L.; Ailing, H.; Sha, L.; Xingkai, L.; Wenhao, W.; Tao, L. High voltage power line scattering feature analysis in multi SAR sensors and dual polarization. In Proceedings of the 2012 Second International Workshop on Earth Observation and Remote Sensing Applications, Shanghai, China, 8–11 June 2012. [Google Scholar]
- Hooper, A.; Segall, P.; Zebker, H. Persistent scatterer interferometric synthetic aperture radar for crustal deformation analysis, with application to Volcán Alcedo, Galápagos. J. Geophys. Res. Space Phys. 2007, 112. [Google Scholar] [CrossRef]
- Hanssen, R. Radar Interferometry: Data Interpretation and Error Analysis; Kluwer Academic Publishers: Dordrecht, The Netherlands, 2001. [Google Scholar]
- Perissin, D.; Wang, Z.; Lin, H. Shanghai subway tunnels and highways monitoring through Cosmo-SkyMed Persistent Scatterers. ISPRS J. Photogramm. Remote Sens. 2012, 73, 58–67. [Google Scholar] [CrossRef]
- Ketelaar, V.G. Satellite Radar Interferometry: Subsidence Monitoring Techniques; Springer Science & Business Media: Berlin, Germany, 2009; Volume 14. [Google Scholar]
- Dehghani, M.; Zoej, M.J.V.; Hooper, A.J.; Hanssen, R.F.; Entezam, I.; Saatchi, S. Hybrid conventional and Persistent Scatterer SAR interferometry for land subsidence monitoring in the Tehran Basin, Iran. ISPRS J. Photogramm. Remote Sens. 2013, 79, 157–170. [Google Scholar] [CrossRef]
- Sadeghi, Z.; Zoej, M.J.V.; Dehghani, M. Improvement in Persistent Scatterer Interferometry Method (StaMPS) to Estimate Deformation Using Periodogram Approach. J. Geospat. Inf. Technol. 2014, 2, 37–49. [Google Scholar]
- TanDEM-X Ground Segment DEM Products Specification Document. Available online: https://tandemx-science.dlr.de/ (accessed on 29 November 2020).
- Earth Subsidence Review at Tehran Plain-Shahriar (First Report). Available online: http://gsi.ir/General/Lang_en/Page_27/GroupId_01-01/TypeId_All/Start_20/Action_ListView/WebsiteId_13/3.html (accessed on 29 November 2020).
- Zhang, J.; Jia, L.; Menenti, M.; Ren, S. Interannual and Seasonal Variability of Glacier Surface Velocity in the Parlung Zangbo Basin, Tibetan Plateau. Remote Sens. 2020, 13, 80. [Google Scholar] [CrossRef]
Publisher’s Note: MDPI stays neutral with regard to jurisdictional claims in published maps and institutional affiliations. |
© 2021 by the authors. Licensee MDPI, Basel, Switzerland. This article is an open access article distributed under the terms and conditions of the Creative Commons Attribution (CC BY) license (http://creativecommons.org/licenses/by/4.0/).

