Extended D-TomoSAR Displacement Monitoring for Nanjing (China) City Built Structure Using High-Resolution TerraSAR/TanDEM-X and Cosmo SkyMed SAR Data


Abstract
1. Introduction
2. Study Site and Data
3. Methods
3.1. Rationale and Procedures of the Applied Extended D-TomoSAR
3.2. Projection LOS Motions into the Longitudial Direction
4. Experimental Results and Analysis
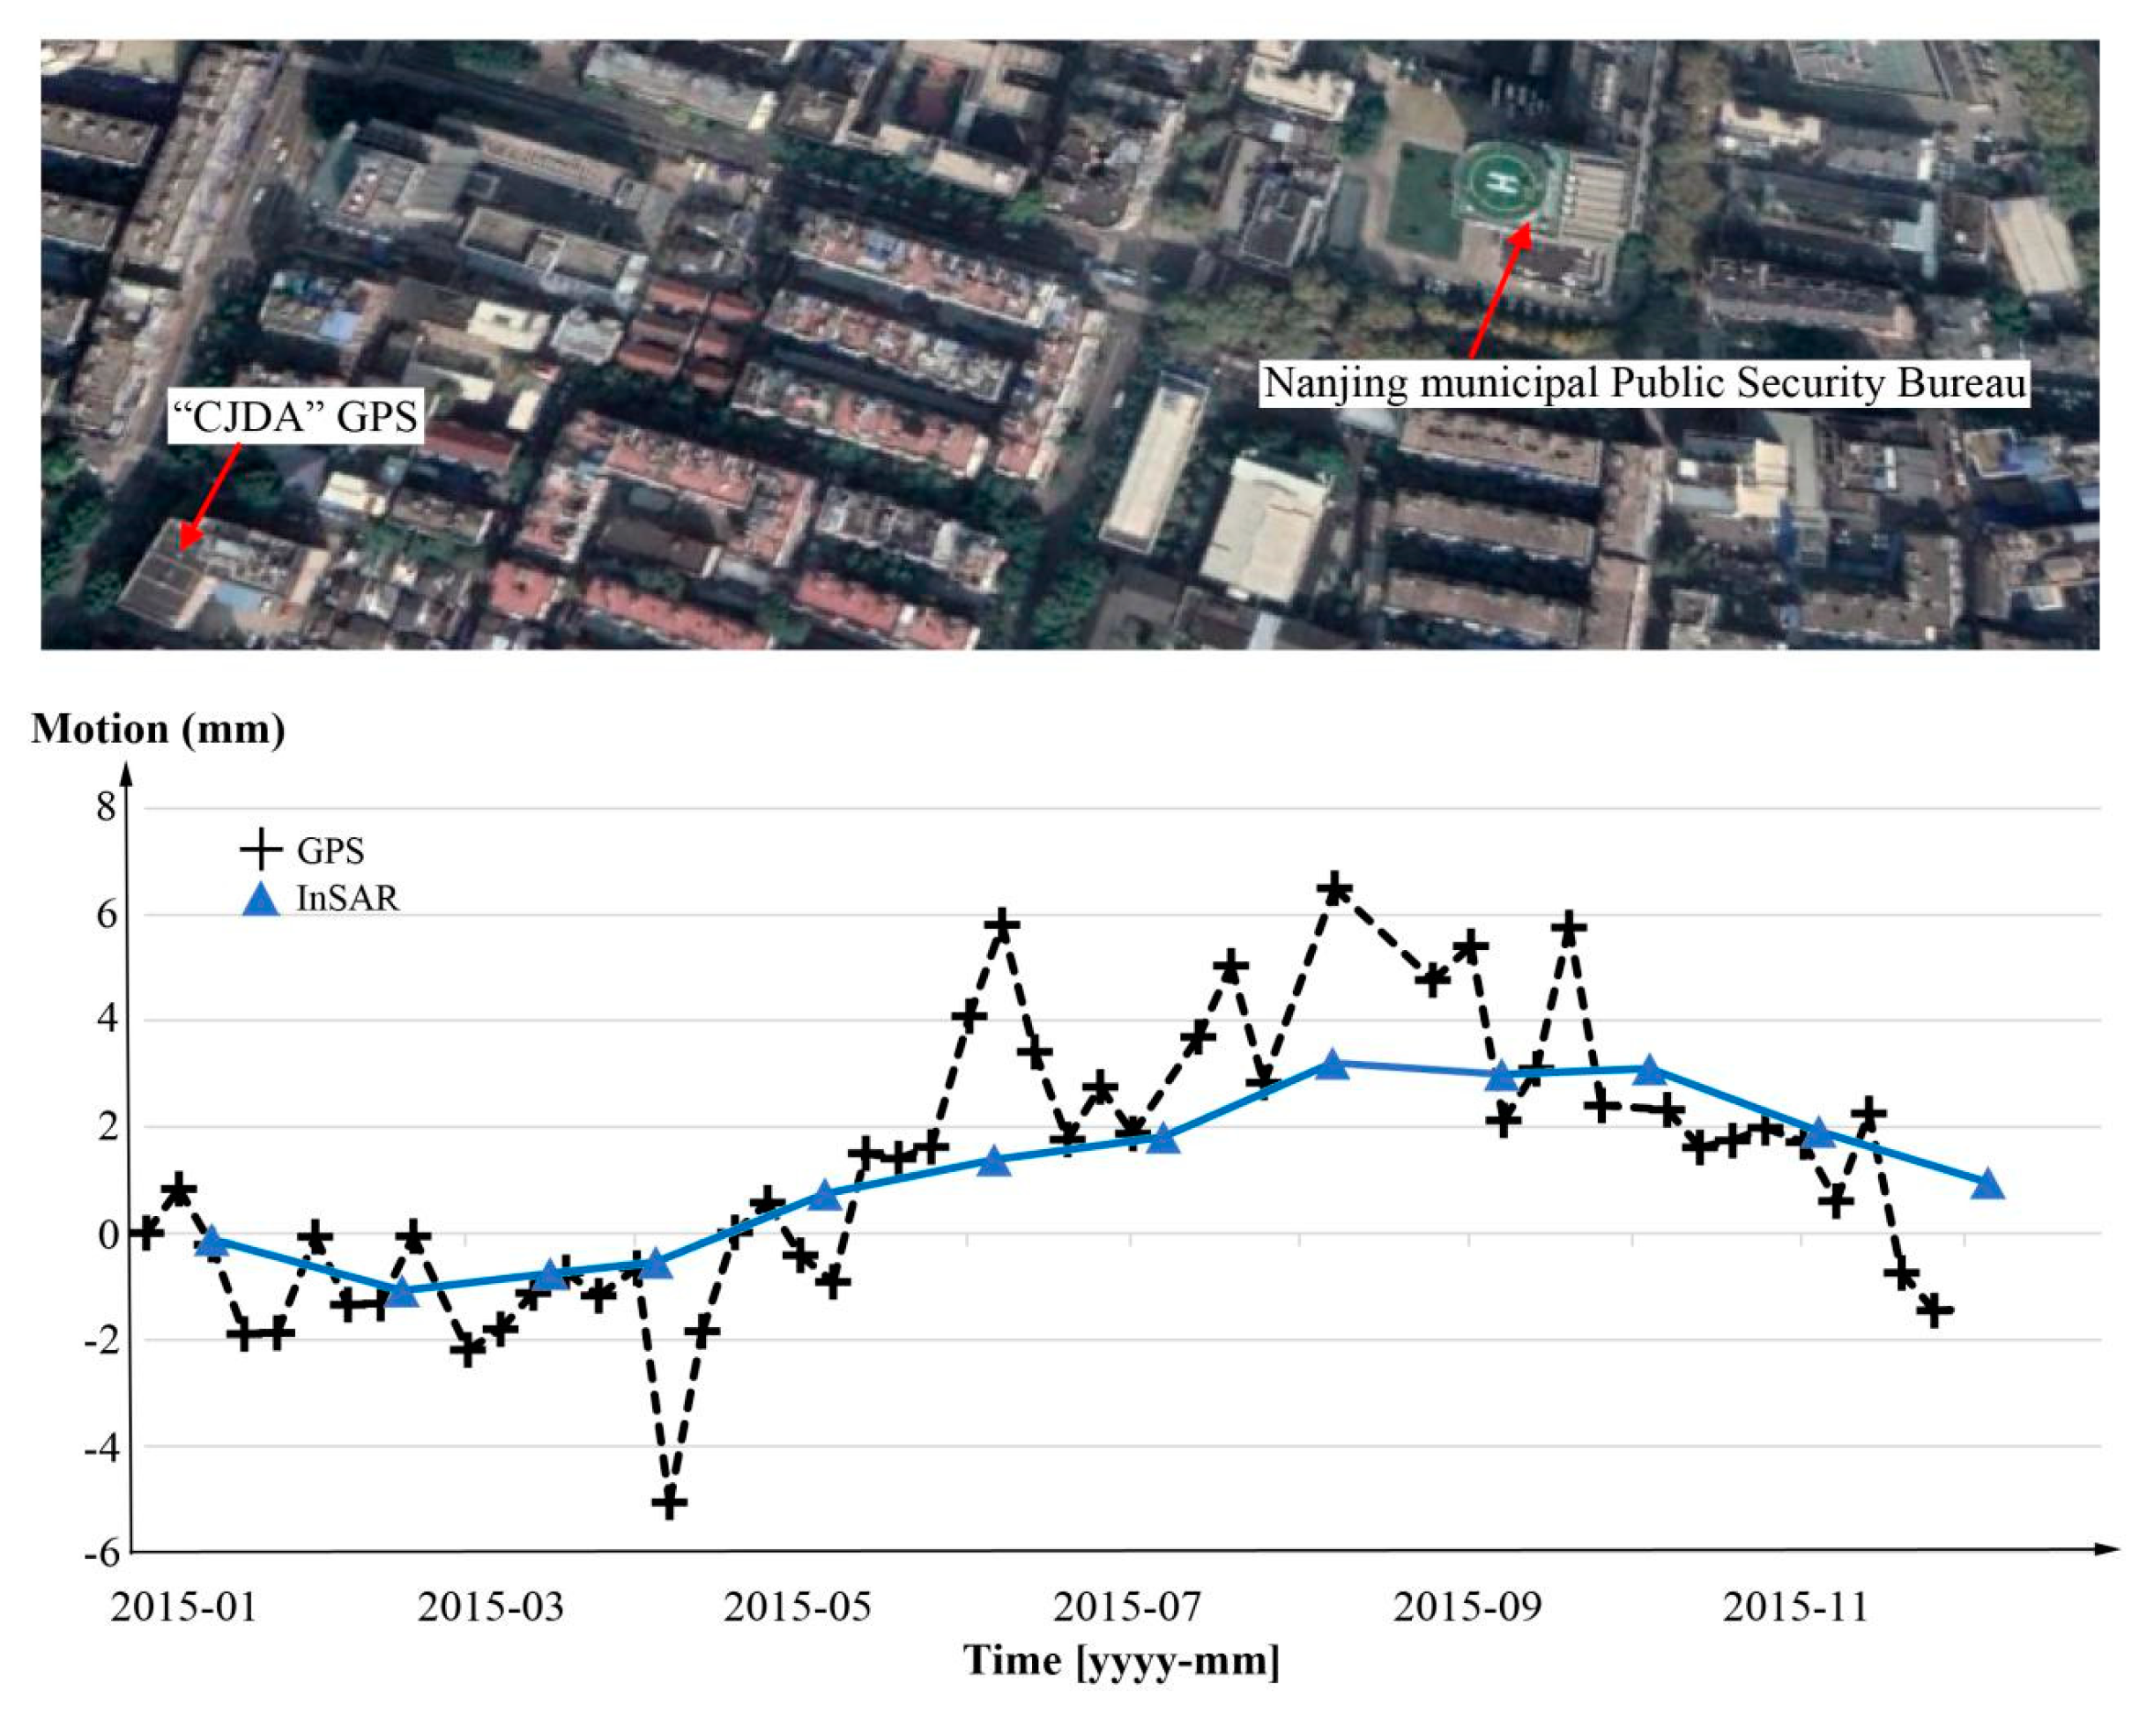
4.1. NPSB Building
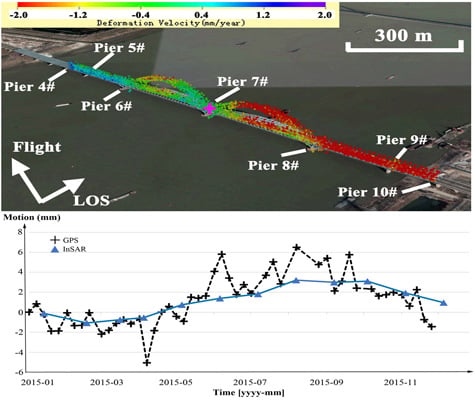
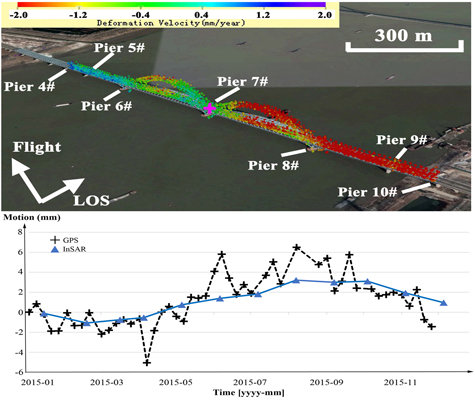
4.2. DYR Bridge
4.3. Ming Dynasty City Wall
5. Validation and Discussions
5.1. Validation
5.2. Tentative Performance Testing
5.2.1. Spatial Density of Extracted PSs Using the Amplitude Indicator
5.2.2. Motion Precision Using the Phase Indicator
6. Conclusions
Author Contributions
Funding
Acknowledgments
Conflicts of Interest
References
- Moschas, F.C.; Psimoulis, P.A.; Stiros, S.C. GPS/RTS data fusion to overcome signal deficiencies in certain bridge dynamic monitoring projects. Smart Struct. Syst. 2013, 12, 251–269. [Google Scholar] [CrossRef]
- Gikas, V.; Sakellariou, M. Settlement analysis of the Mornos earth dam (Greece): Evidence from numerical modeling and geodetic monitoring. Eng. Struct. 2008, 30, 3074–3081. [Google Scholar] [CrossRef]
- Chan, T.H.T.; Yu, L.; Tam, H.Y.; Ni, Y.Q.; Liu, S.Y.; Chung, W.H.; Cheng, L.K. Fiber Bragg grating sensors for structural health monitoring of Tsing Ma bridge: Background and experimental observation. Eng. Struct. 2006, 28, 648–659. [Google Scholar] [CrossRef]
- Chang, L.; Dollevoet, R.P.B.J.; Hanssen, R.F. Nationwide railway monitoring using satellite SAR interferometry. IEEE J-STARS 2017, 10, 596–604. [Google Scholar] [CrossRef]
- Ferretti, A.; Prati, C.; Rocca, F. Nonlinear subsidence rate estimation using permanent scatterers in differential SAR interferometry. IEEE T Geosci. Remote. 2000, 38, 2202–2212. [Google Scholar] [CrossRef]
- Tapete, D.; Fanti, R.; Cecchi, R.; Petrangeli, P.; Casagli, N. Satellite radar interferometry for monitoring and early-stage warning of structural instability in archaeological sites. J. Geophys. Eng. 2012, 9, S10–S25. [Google Scholar] [CrossRef]
- Parcharidis, I.; Foumelis, M.; Benekos, G.; Kourkouli, P.; Stamatopoulos, C.; Stramondo, S. Time series synthetic aperture radar interferometry over the multispan cable-stayed Rio-Antirio Bridge (central Greece): Achievements and constraints. J. Appl. Remote. Sens. 2015, 9, 096082. [Google Scholar] [CrossRef]
- Neokosmidis, S.; Elias, P.; Parcharidis, I.; Briole, P. Deformation estimation of an earth dam and its relation with local earthquakes, by exploiting multitemporal synthetic aperture radar interferometry: Mornos dam case (central Greece). J. Appl. Remote Sens. 2016, 10, 026010. [Google Scholar] [CrossRef]
- Chang, L.; Hanssen, R.F. Detection of cavity migration and sinkhole risk using radar interferometric time series. Remote Sens. Environ. 2014, 147, 56–64. [Google Scholar] [CrossRef]
- Tapete, D.; Morelli, S.; Fanti, R.; Casagli, N. Localising deformation along the elevation of linear structures: An experiment with space-borne InSAR and RTK GPS on the Roman Aqueducts in Rome, Italy. Appl. Geogr. 2015, 58, 65–83. [Google Scholar] [CrossRef]
- Fornaro, G.; Serafino, F.; Reale, D. 4-D SAR imaging: The case study of Rome. IEEE Geosci. Remote Sen. 2010, 7, 236–240. [Google Scholar] [CrossRef]
- Reale, D.; Fornaro, G.; Pauciullo, A.; Zhu, X.; Bamler, R. Tomographic imaging and monitoring of buildings with very high resolution SAR data. IEEE Geosci. Remote. Sen. 2011, 8, 661–665. [Google Scholar] [CrossRef]
- Ma, P.; Lin, H.; Lan, H.; Chen, F. Multi-dimensional SAR tomography for monitoring the deformation of newly built concrete buildings. ISPRS J. Photogramm. 2015, 106, 118–128. [Google Scholar] [CrossRef]
- Reale, D.; Fornaro, G.; Pauciullo, A. Extension of 4-D SAR imaging to the monitoring of thermally dilating scatterers. IEEE T Geosci. Remote 2013, 51, 5296–5306. [Google Scholar] [CrossRef]
- Chen, F.; Wu, Y.; Zhang, Y.; Parcharidis, I.; Ma, P.; Xiao, R.; Xu, J.; Zhou, W.; Tang, P.; Foumelis, M. Surface motion and structural instability monitoring of Ming Dynasty City Walls by two-step Tomo-PSInSAR approach in Nanjing City, China. Remote Sens. 2017, 9, 371. [Google Scholar] [CrossRef]
- Chen, F.; Guo, H.; Ma, P.; Lin, H.; Wang, C.; Ishwaran, N.; Hang, P. Radar interferometry offers new insights into threats to the Angkor site. Sci. Adv. 2017, 3, e1601284. [Google Scholar] [CrossRef]
- Kang, J.; Wang, Y.; Körner, M.; Zhu, X.X. Robust object-based multipass InSAR deformation reconstruction. IEEE T Geosci. Remote 2017, 55, 4239–4251. [Google Scholar] [CrossRef]
- Wang, Y.; Zhu, X.; Zeisl, B.; Pollefeys, M. Fusing meter-resolution 4-D InSAR point clouds and optical images for semantic urban infrastructure monitoring. IEEE T Geosci. Remote. 2017, 55, 14–26. [Google Scholar] [CrossRef]
- Budillon, A.; Crosetto, M.; Johnsy, A.; Monserrat, O.; Krishnakumar, V.; Schirinzi, G. Comparison of Persistent Scatterer Interferometry and SAR Tomography Using Sentinel-1 in Urban Environment. Remote Sens. 2018, 10, 1986. [Google Scholar] [CrossRef]
- Ma, P.; Lin, H. Robust detection of single and double persistent scatterers in urban built environments. IEEE T Geosc. Remote 2016, 54, 2124–2139. [Google Scholar] [CrossRef]
- Lazecky, M.; Hlavacova, I.; Bakon, M.; Sousa, J.J.; Perissin, D.; Patricio, G. Bridge displacements monitoring using space-borne X-band SAR interferometry. IEEE J-STARS 2017, 10, 205–210. [Google Scholar] [CrossRef]
- Huang, Q.; Crosetto, M.; Monserrat, O.; Crippa, B. Displacement monitoring and modelling of a high-speed railway bridge using C-band Sentinel-1 data. ISPRS J. Photogramm. 2017, 128, 204–211. [Google Scholar] [CrossRef]
- Huang, Q.; Monserrat, O.; Crosetto, M.; Crippa, B.; Wang, Y.; Jiang, J.; Ding, Y. Displacement monitoring and health evaluation of two bridges using Sentinel-1 SAR images. Remote Sens. 2018, 10, 1714. [Google Scholar] [CrossRef]
- Qin, X.; Liao, M.; Zhang, L.; Yang, M. Structural health and stability assessment of high-speed railways via thermal dilation mapping with time-series InSAR analysis. IEEE J-STARS 2017, 10, 2999–3010. [Google Scholar] [CrossRef]
- Viviani, F.; Pulella, A.; Lombardini, F. Multidimensional tomography with new generation VHR SAR data for urban monitoring. In Proceedings of the IEEE International Geoscience and Remote Sensing Symposium, Melbourne, Australia, 21–26 July 2013; pp. 81–84. [Google Scholar]
- De Maio, A.; Fornaro, G.; Pauciullo, A. Detection of single scatterers in multidimensional SAR imaging. IEEE T Geosci. Remote 2009, 47, 2284–2297. [Google Scholar] [CrossRef]
- Budillon, A.; Johnsy, A.; Schirinzi, G. A Fast support detector for superresolution localization of multiple scatterers in SAR tomography. IEEE J-STARS 2017, 10, 2768–2779. [Google Scholar] [CrossRef]
- Budillon, A.; Johnsy, A.; Schirinzi, G. Extension of a fast GLRT algorithm to 5D SAR tomography of Urban areas. Remote Sens. 2017, 9, 844. [Google Scholar] [CrossRef]
- Colesanti, C.; Ferretti, A.; Novali, F.; Prati, C.; Rocca, F. SAR monitoring of progressive and seasonal ground deformation using the permanent scatterers technique. IEEE T Geosci. Remote 2003, 41, 1685–1701. [Google Scholar] [CrossRef]
- Monserrat, O.; Crosetto, M.; Cuevas, M.; Crippa, B. The thermal expansion component of persistent scatterer interferometry observations. IEEE T Geosci. Remote 2011, 8, 864–868. [Google Scholar] [CrossRef]
- Fornaro, G.; Reale, D.; Serafino, F. Four-dimensional SAR imaging for height estimation and monitoring of single and double scatterers. IEEE T Geosci. Remote 2009, 47, 224–237. [Google Scholar] [CrossRef]
- Baghdadi, N.; Hajj, M.E.; Dubois-Fernandez, P.; Zribi, M.; Belaud, G.; Cheviron, B. Signal level comparison between TerraSAR-X and Cosmo-SkyMed SAR sensors. IEEE Geosci. Remote S 2015, 12, 448–452. [Google Scholar] [CrossRef]
- Crosetto, M.; Monserrat, O.; Cuevas- González, M.; Devanthéry, N.; Luzi, G.; Crippa, B. Measuring thermal expansion using X-band persistent scatterer interferometry. ISPRS J. Photogramm. 2015, 100, 84–91. [Google Scholar] [CrossRef]
- Siddique, M.A.; Wegmüller, U.; Hajnsek, I.; Frey, O. Single-look SAR tomography as an add-on to PSI for improved deformation analysis in urban areas. IEEE T Geosc. Remote 2016, 54, 6119–6137. [Google Scholar] [CrossRef]
- Pratesi, F.; Tapete, D.; Terenzi, G.; Ventisette, C.D.; Moretti, S. Rating health and stability of engineering structures via classification indexes of InSAR Persistent Scatterers. Int. J. Appl. Earth. Obs. 2015, 40, 81–90. [Google Scholar] [CrossRef]


| TSX/TDX Dataset | CSK Dataset | ||||||||
|---|---|---|---|---|---|---|---|---|---|
| No. | Acquisitions | Sensor | Bperp (m) | Temp. (°) | No. | Acquisitions | Sensor | Bperp (m) | Temp. (°) |
| 1 | 31 May 2013 | TDX | 113.8 | 21 | 1 | 17 January 2015 | CSK2 | 542.3 | 5 |
| 2 | 22 June 2013 | TDX | 303.2 | 27 | 2 | 22 February 2015 | CSK4 | −529.9 | 7 |
| 3 | 14 July 2013 | TDX | 254.6 | 29 | 3 | 22 March 2015 | CSK2 | 232.7 | 12 |
| 4 | 5 August 2013 | TDX | 68.8 | 32 | 4 | 11 April 2015 | CSK4 | −664.5 | 15 |
| 5 | 27 August 2013 | TDX | −103.0 | 28 | 5 | 13 May 2015 | CSK4 | 148.3 | 24 |
| 6 | 18 September 2013 | TDX | 23.0 | 24 | 6 | 14 June 2015 | CSK4 | −746.9 | 27 |
| 7 | 10 October 2013 | TDX | 35.2 | 22 | 7 | 16 July 2015 | CSK4 | −902.7 | 25 |
| 8 | 1 November 2013 | TDX | −33.1 | 17 | 8 | 17 August 2015 | CSK4 | −384.9 | 27 |
| 9 | 23 November 2013 | TDX | −125.5 | 13 | 9 | 18 September 2015 | CSK4 | −626.3 | 23 |
| 10 | 15 December 2013 | TDX | 0.7 | 8 | 10 | 16 October 2015 | CSK2 | 325.6 | 21 |
| 11 | 6 January 2014 | TDX | −87.2 | 9 | 11 | 17 November 2015 | CSK2 | 194.5 | 13 |
| 12 | 28 January 2014 * | TDX | 0 | 9 | 12 | 19 December 2015 | CSK2 | −164.6 | 5 |
| 13 | 19 February 2014 | TDX | 140.3 | 1 | 13 | 20 January 2016 | CSK2 | −509.4 | 1 |
| 14 | 18 May 2014 | TSX | −49.2 | 20 | 14 | 12 March 2016 | CSK4 | 479.2 | 9 |
| 15 | 9 June 2014 | TDX | 375.9 | 25 | 15 | 13 April 2016 | CSK4 | 191.8 | 21 |
| 16 | 1 July 2014 | TSX | −10.1 | 23 | 16 | 15 May 2016 | CSK4 | 842.2 | 14 |
| 17 | 23 July 2014 | TSX | −219.3 | 31 | 17 | 16 June 2016 | CSK4 | −1166.1 | 25 |
| 18 | 14 August 2014 | TSX | −28.4 | 22 | 18 | 14 July 2016 | CSK2 | 513.8 | 27 |
| 19 | 5 September 2014 | TDX | 127.4 | 25 | 19 | 15 August 2016 | CSK2 | 74.1 | 31 |
| 20 | 27 September 2014 | TDX | 19.8 | 25 | 20 | 20 September 2016* | CSK4 | 0 | 22 |
| 21 | 19 October 2014 | TDX | 149.9 | 22 | 21 | 7 November 2016 | CSK4 | 960.4 | 14 |
| 22 | 10 November 2014 | TDX | 91.4 | 13 | 22 | 9 December 2016 | CSK4 | −612.2 | 9 |
| 23 | 2 December 2014 | TDX | −154.4 | 2 | 23 | 27 February 2017 | CSK4 | 374.3 | 9 |
| 24 | 24 December 2014 | TDX | 195.4 | 6 | 24 | 16 April 2017 | CSK4 | 36.5 | 23 |
| 25 | 15 January 2015 | TSX | −151.5 | 7 | 25 | 18 May 2017 | CSK4 | 137.4 | 24 |
| 26 | 6 February 2015 | TDX | 76.9 | 4 | 26 | 3 June 2017 | CSK4 | 200.8 | 26 |
| 27 | 21 July 2017 | CSK4 | −149.1 | 33 | |||||
| 28 | 22 August 2017 | CSK4 | −1519.5 | 30 | |||||
| 29 | 19 September 2017 | CSK2 | −754.0 | 25 | |||||
| 30 | 5 October 2017 | CSK2 | −903.6 | 14 | |||||
| 31 | 10 November 2017 | CSK4 | −1096.4 | 13 | |||||
| 32 | 12 December 2017 | CSK4 | −108.0 | 5 | |||||
© 2019 by the authors. Licensee MDPI, Basel, Switzerland. This article is an open access article distributed under the terms and conditions of the Creative Commons Attribution (CC BY) license (http://creativecommons.org/licenses/by/4.0/).
Share and Cite
Chen, F.; Zhou, W.; Chen, C.; Ma, P. Extended D-TomoSAR Displacement Monitoring for Nanjing (China) City Built Structure Using High-Resolution TerraSAR/TanDEM-X and Cosmo SkyMed SAR Data. Remote Sens. 2019, 11, 2623. https://doi.org/10.3390/rs11222623
Chen F, Zhou W, Chen C, Ma P. Extended D-TomoSAR Displacement Monitoring for Nanjing (China) City Built Structure Using High-Resolution TerraSAR/TanDEM-X and Cosmo SkyMed SAR Data. Remote Sensing. 2019; 11(22):2623. https://doi.org/10.3390/rs11222623
Chicago/Turabian StyleChen, Fulong, Wei Zhou, Caifen Chen, and Peifeng Ma. 2019. "Extended D-TomoSAR Displacement Monitoring for Nanjing (China) City Built Structure Using High-Resolution TerraSAR/TanDEM-X and Cosmo SkyMed SAR Data" Remote Sensing 11, no. 22: 2623. https://doi.org/10.3390/rs11222623
APA StyleChen, F., Zhou, W., Chen, C., & Ma, P. (2019). Extended D-TomoSAR Displacement Monitoring for Nanjing (China) City Built Structure Using High-Resolution TerraSAR/TanDEM-X and Cosmo SkyMed SAR Data. Remote Sensing, 11(22), 2623. https://doi.org/10.3390/rs11222623