Abstract
Changes in subsurface water resources might alter the surrounding ground by generating subsidence or uplift, depending on geological and hydrogeological site characteristics. Improved understanding of the relationships between surface water storage and ground deformation is important for design and maintenance of hydraulic facilities and ground stability. Here, we construct one of the longest series of Interferometric Synthetic Aperture Radar (InSAR) to date, over twenty-five years, to study the relationships between water level changes and ground surface deformation in the surroundings of Lake Mead, United States, and at the site of the Hoover Dam. We use the Small Baseline Subset (SBAS) and Permanent scatterer interferometry (PSI) techniques over 177 SAR data, encompassing different SAR sensors including ERS1/2, Envisat, ALOS (PALSAR), and Sentinel-1(S1). We perform a cross-sensor examination of the relationship between water level changes and ground displacement. We found a negative relationship between water level change and ground deformation around the reservoir that was consistent across all sensors. The negative relationship was evident from the long-term changes in water level and deformation occurring from 1995 to 2014, and also from the intra-annual oscillations of the later period, 2014 to 2019, both around the reservoir and at the dam. These results suggest an elastic response of the ground surface to changes in water storage in the reservoir, both at the dam site and around the reservoir. Our study illustrates how InSAR-derived ground deformations can be consistent in time across sensors, showing the potential of detecting longer time-series of ground deformation.
Keywords:
InSAR; Sentinel-1; ERS; Envisat; ALOS; SBAS; PSI; GPS; lake mead; hoover dam; water level change; ground deformation 1. Introduction
At larger scales, temporal mass changes in the Earth system due to terrestrial water storage are known to lead to gravity field variations and deformations at the Earth’s surface [1]. This is why along with tectonics, Holocene sediment compaction, sediment loading, and glacial isostatic adjustment, water exploitation is regarded as a primary driver of ground surface deformation [2]. Fluctuations in water storage due to water management (i.e., withdrawal, storage or use) can sometimes be large enough to induce ground surface deformations of several centimeters [3,4], affecting human settlements and infrastructure stability [5]. Improved understanding of the relationship between water storage and ground deformation is therefore important for the design and maintenance of hydraulic facilities. For instance, groundwater variations can cause land subsidence in urban areas due to groundwater withdrawal, leading to urban infrastructures damages [6,7,8]. Ground deformation resulting from variations in the volume of surface water resources, such as impounded reservoirs, can also trigger landslides and sudden mass movements; if these feed into lakes. Associated large surges of water can lead to dam instability, threatening lives and properties along the shores [9,10,11,12].
Ground deformation can be divided into elastic and inelastic [13]. Elastic deformation occurs with increasing water mass on the Earth’s surface, when the extra weight of the water depresses the ground surface, which deforms elastically, with subsidence in response to the load [4]. During the dry season, when output flows of evaporation and runoff exceed the input flow of precipitation, surface water mass decreases and makes the ground rebound, producing an elastic uplift [14,15]. While inelastic deformation leads to some permanent change that is not fully reversed when the force from the water mass load is removed, poroelastic deformation might occur when water is withdrawn from an aquifer. Pore spaces already supported by pore water pressure are then compacted and the ground surface subsides; conversely, when aquifers are recharged, pores are refilled and the ground surface rises [4,16,17].
Understanding the relationship between water storage variations and ground deformation is necessary for the resolution of the prevalence of (pore) elastic, inelastic, or elastoplastic deformations, and associated water infrastructure management and risk mitigation. Different techniques can be used to study this relationship. At global or large scales, Very Long Baseline Interferometry (VLBI) [18] and Gravity Recovery and Climate Experiment (GRACE) [19] are commonly used, while at more regional and local scales, GPS and InSAR are preferred [20].
InSAR is used in a wide range of different applications, from changes in water surface and connectivity in wetlands [21,22,23] to detection and quantification of displacements at the ground surface, or in hydraulic structures, such as dams [24], to landslides monitoring [25]. InSAR-based techniques encounter several technical limitations and challenges, such as spatiotemporal decorrelation [26] and atmospheric phase delay [27], making it difficult to accurately quantify surface deformations. Several studies reported relationships between water level changes and ground deformation derived by InSAR with different types of SAR products. Water change-related deformation of the ground was related to anthropogenic drivers such as water withdrawal (e.g., [28,29,30,31,32,33,34,35,36]) and to hydroclimatic drivers such as droughts, floods, and changes in surface or groundwater (e.g., [37,38,39,40,41,42,43]).
For instance, InSAR was applied on ERS data to detect short-term deformations occurring before 2002 around Lake Mead, United States [44], complementing previous studies by levelling data [45]. The InSAR technique was also used with Envisat data to identify a possible elastic response of the ground surface, to water level variations around a lake in South-Eastern Tibet [39]. Relationships between water level changes and ground deformation were also studied in a reservoir in the Himalayan region with ALOS PALSAR data [20], and in another reservoir in Kyrgyzstan, Central Asia, using Envisat and S1 data [46].
An accurate, reliable, cost-effective, and fast monitoring system of the structure of dams is also required to ensure dam stability, by measuring the rigid and non-rigid changes of its geometric shape [47]. The use of InSAR in dams monitoring in different parts of the world such as the Pertusillo dam in Italy with COSMO-SkyMed (CSK) and TerraSAR-X (TSX) data [48], the Shuibuya dam in China with ALOS-1 PALSAR data [49], and the Mosul dam in Iraq with CSK and Sentinel-1 data [50], evidence a high potential of this space geodetic tool to achieve millimeter accuracy of dam structure deformation. To date, deformation of the dam is not usually associated with deformations around its impounded reservoir, and we hypothesize that both should be related if deformations depend on changes of water volume in the reservoir.
In this study, we use InSAR to comparatively study the relationships between water storage variations and ground deformation, using ERS, Envisat, ALOS, and S1 data, for longer- and shorter-term variations of water level and associated ground deformation observations. We did the analysis simultaneously at the dam site and in the surroundings, to compare the existence of converging signals of ground deformation, and chose the Hoover Dam and its associated impounded reservoir, Lake Mead, for this purpose. These infrastructures control floods, and supply water for irrigation and electricity to the states of Arizona, California, and Nevada, United States [51]. We aimed to answer the following two main research questions. (1) Is it possible to obtain a consistent long-term relationship between water level variations (as a proxy of change in water storage) and observed ground surface deformation surrounding an impounded reservoir? (2) Is the deformation at the dam site also consistent with the deformations surrounding the reservoir and water level variations? Choosing Lake Mead enables a comparative long-term assessment of ground surface deformation and water level variations throughout twenty-four years and with four different radar sensors.
2. Study Area, Geological Setting, and Datasets
2.1. Study Area
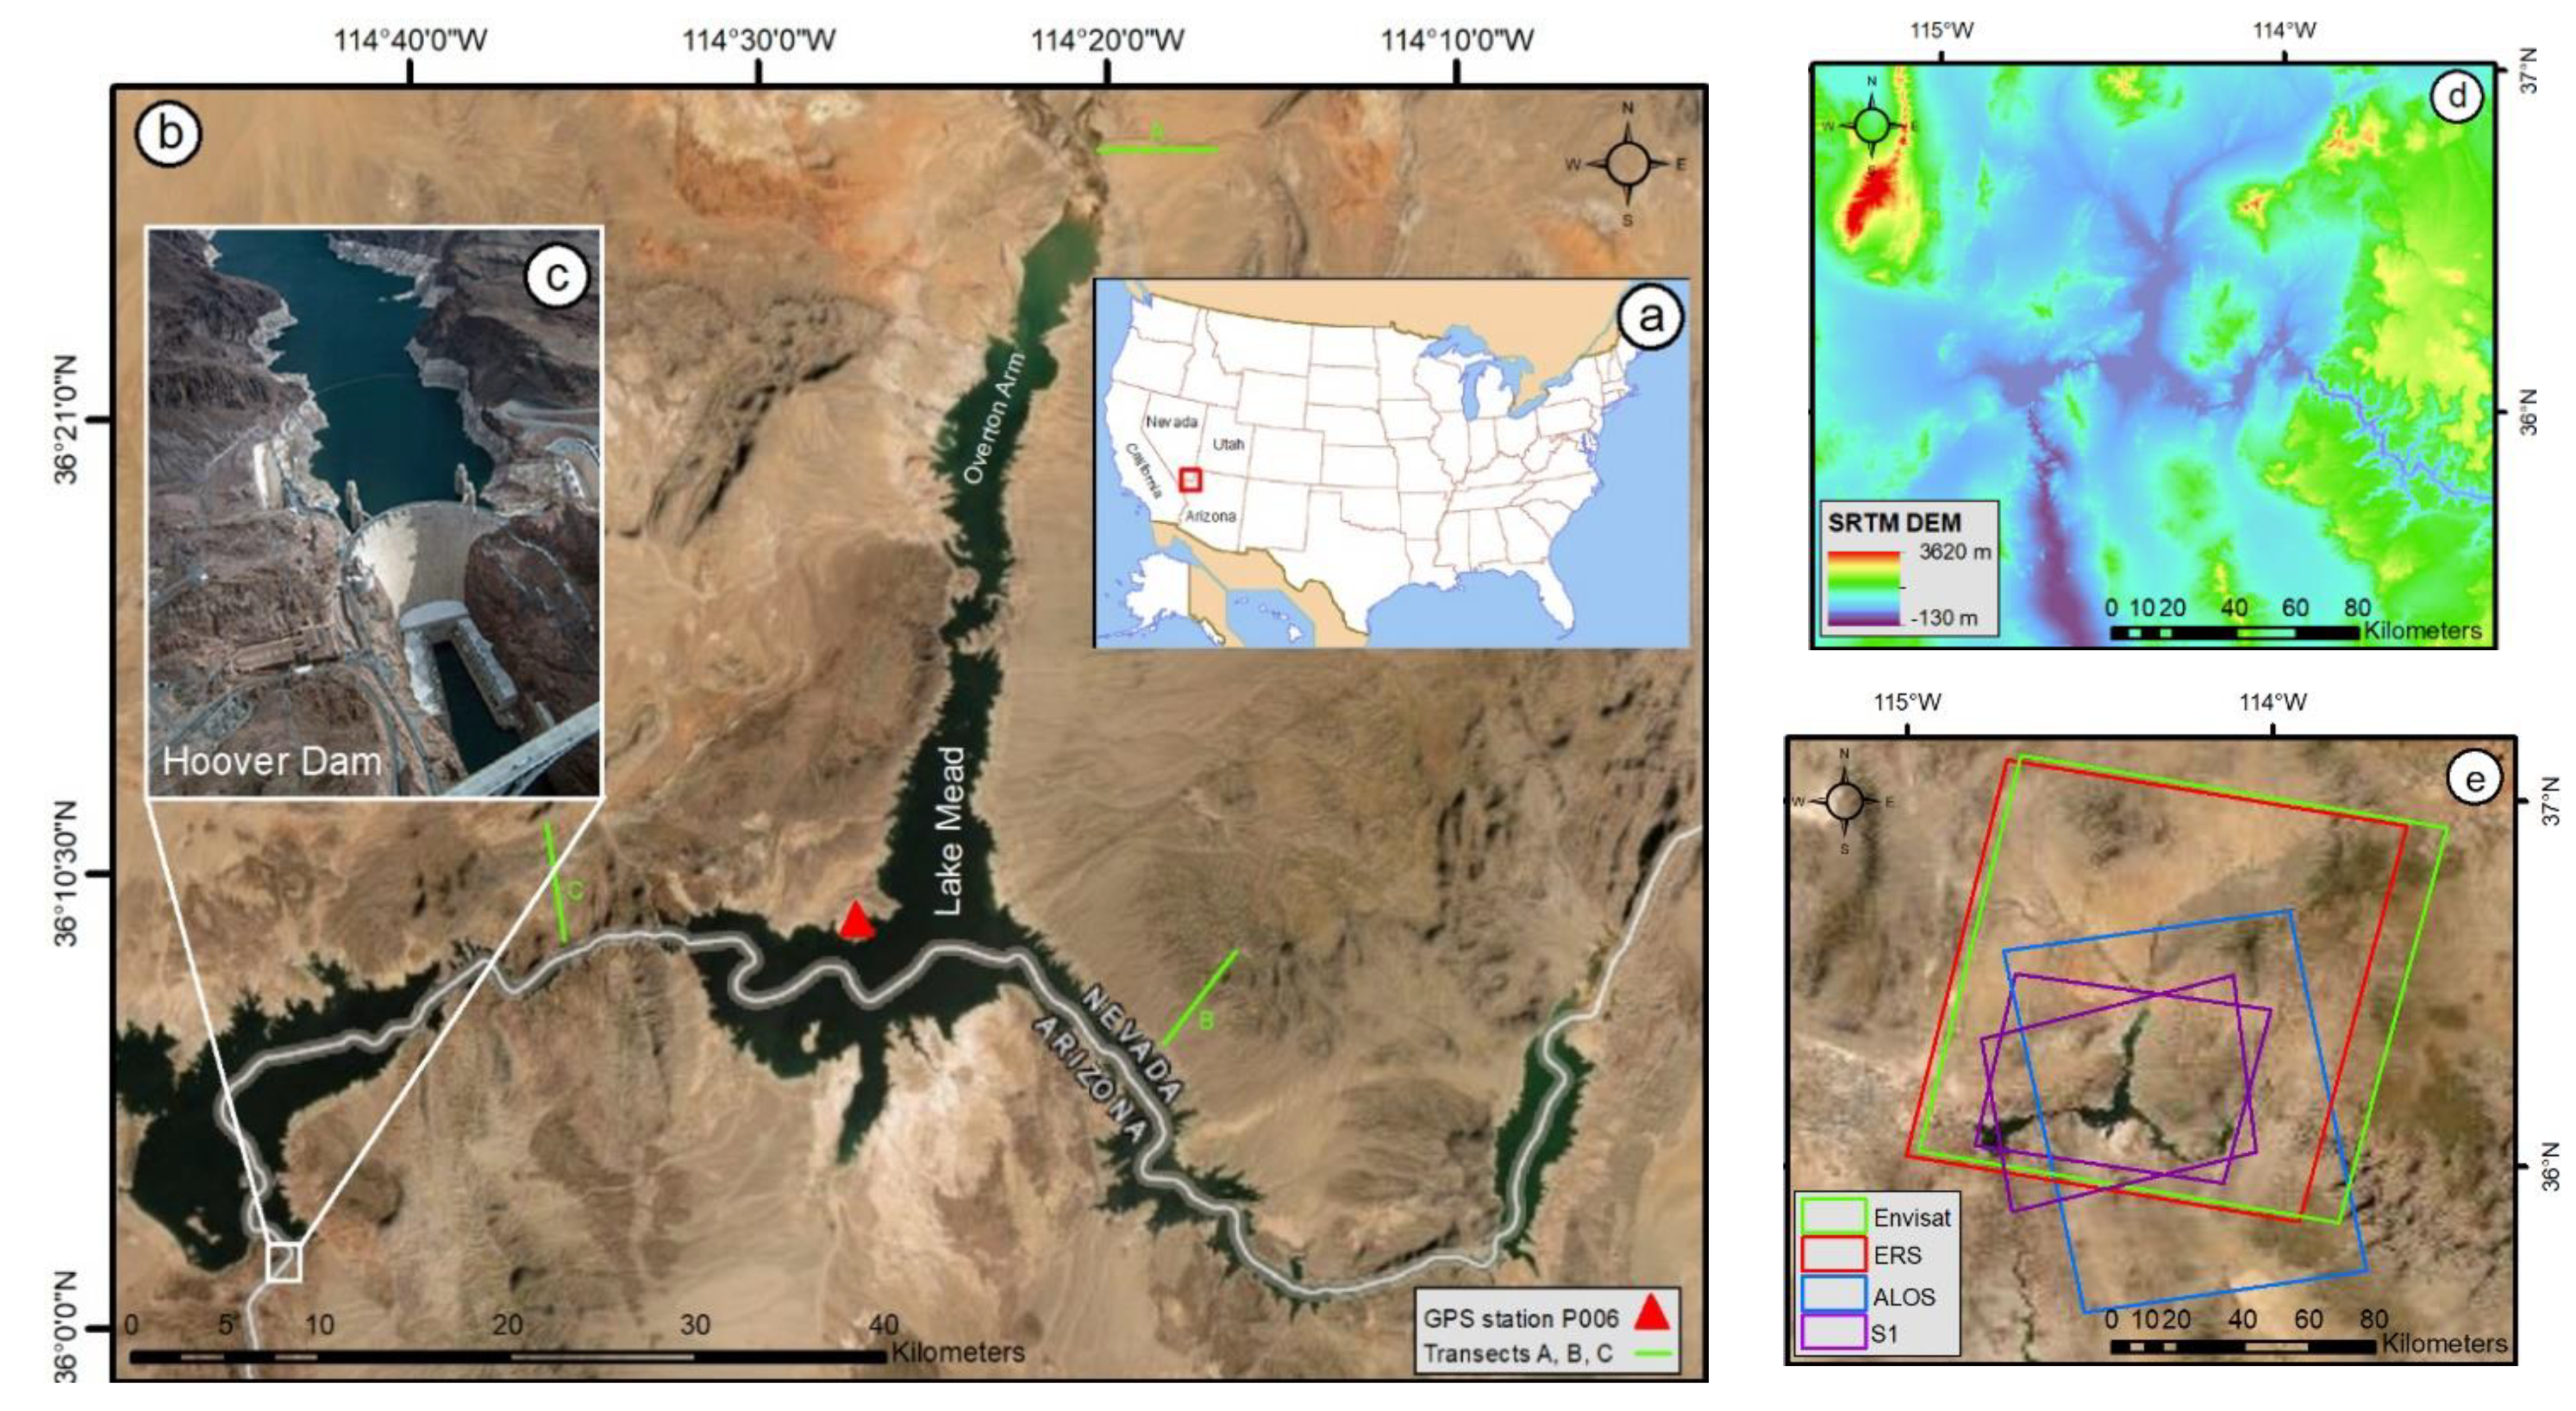
Lake Mead is the largest man-made reservoir in the United States, located between Clark County in Nevada and Mohave County in Arizona (Figure 1a,b). It receives the waters of the Colorado River hydrological basin (630,000 km2) at an average elevation of ~1000 m.a.s.l. (Figure 1d). Average precipitation of the hydrological basin is 40 mm/year and annual minimum, maximum, and mean runoff is estimated to be around 6.5, 29.6, and 18.6 billion cubic meters, respectively, with 70% of Colorado’s runoff originating from snowmelt [52]. The Colorado River Basin experiences temperatures between −6 °C and 27 °C [53]. The Lake Mead was impounded in 1935 with the construction of the Hoover Dam (Figure 1c); a concrete gravity-arch type dam constructed with a height of 221.4 m, length of 379 m, an elevation at crest of 376 m.a.s.l. and a crest width of 14 m.
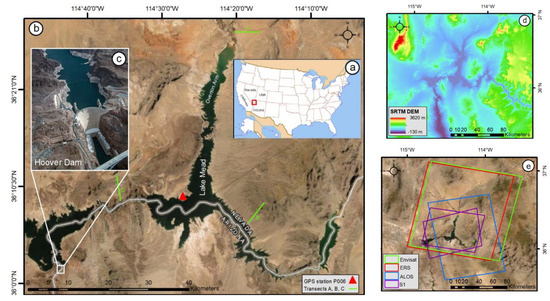
Figure 1.
Location of Lake Mead (a) in the United States, (b) satellite view of Lake Mead and location of the GPS station P006 (red triangle), (c) zoomed view of the Hoover Dam (photo source: [54]), (d) Shuttle Radar Topography Mission (SRTM) Digital Elevation Model (DEM) of the area of interest with 30−m spatial resolution, and (e) extent of the four different SAR scenes used in this study over the Lake Mead area (i.e., ERS1/2−red, Envisat−green, ALOS-blue, and S1−purple), shown over a Google Earth image. The standard full extent of the Envisat, ERS, and ALOS data, and the extent of three selected bursts of S1 (ascending and descending) are displayed in the figure.
2.2. Geological Setting
The geology of the area surrounding Lake Mead was studied by [55]. The Lake Mead region stretches from the valley of Las Vegas on the west to the Colorado River Plateau on the east, and from the Black mountain on the South to the Mormon Mountains–Beaver Dam mountains to the north [55]. The region is predominantly composed of Proterozoic crystalline, Paleozoic and Mesozoic plutonic, Mesozoic sedimentary, Cenozoic volcanic and intrusive rocks, as well as surficial deposits (Figure S1) [55]. Preceding the occurrence of passive margin sedimentation in the Paleozoic and Mesozoic, major folding, reverse faulting, and thrust faulting occur in the basin. The range were produced by Late Mesozoic thrusting and Late Cretaceous and early Tertiary compression, resulting in uplift and monoclinal folding in the region and in the Colorado Plateau. Extensional deformation in the Cenozoic occurring along with sedimentation and volcanism resulted in normal faulting and strike-slip faulting in the Colorado Plateau, producing north-trending high-angle normal faults. In the most recent times, the integration of the Colorado River system is accompanied by dissection, creation of alluvial fans, and faulting. The geological units covered by the lake include the Cenozoic sedimentary rocks and the Cenozoic Volcanic rocks (Figure S1). The first are mainly unconsolidated to partly consolidated alluvium, consisting of silt, sand, and gravel in streams, washes, low terraces, alluvial fans, and piedmont slopes [55]. The second mostly comprise brownish or greenish grey, altered, massive to flow-banded andesite, up to 300-m thick. The lake bed presents a continuous sediment cover along the original Colorado River bed, between 10 to 35 m deed, and a thinner discontinuous sediment layer around Las Vegas Bay and the Northern Virgin River channel [56].
The Hoover Dam is located on the southwest of the reservoir, where the bedrock consists of Precambrian crystalline rocks overlain and intruded by late Cenozoic igneous rocks (Figure S2) [56], deeply downcutting the Colorado River. Miocene rocks in this small area are highly faulted and fractured, and most surfaces contain one or more sets of striae produced during fault movement [57]. The rocks at the dam are lava flows and flow breccias, ash-flow tuffs, volcanogenic sedimentary rocks, clastic sedimentary rocks, and dikes; the volcanic and sedimentary rocks at Hoover Dam are at least 500 m thick (Figure S2) [57].
2.3. Datasets
2.3.1. SAR Data
To monitor the long-term ground deformation around Lake Mead, we analyzed a total of 177 SAR images over a time span of 24 years, from 1995 to 2019 (Table 1). An external DEM with a spatial resolution of 30 m (SRTM) was used in the InSAR processing (Figure 1d). We conducted InSAR processing to obtain ground deformation around the reservoir with the SBAS technique [58] on several SAR missions, including the ERS1/2 (1995–2000), Envisat (2003–2010), ALOS PALSAR (2007–2011), which is hereafter called ALOS, and S1 (2014–2019) (Figure 1e). We also used the PSI technique [59] to monitor ground deformation at the site of the Hoover Dam, using S1 data (2014–2019). The combined data availability allowed us to study the long-term relationship between water lake level variations in the Lake Mead reservoir and ground surface deformations around the reservoir between 1995 and 2019, and at the location of the Hoover Dam between 2014 and 2019.

Table 1.
Specifications of ERS1/2, Envisat, ALOS, and S1A/B SAR data. Acronyms used in the table are descending (D), number of images (No.), Ascending (A), polarization (Po.), and revisiting time (Rt) in days.
As the ascending and descending data were only available for the S1 sensor, we could only simultaneously study the reservoir and the dam with these two acquisition modes, over the period of 2014–2019. It is also worth noting that there is an existing data gap (due to non-existent acquisitions) between May 2017 and August 2018, in the S1 ascending mode.
2.3.2. Geodetic GPS Data
We used data from one geodetic GPS station (P006) located around Lake Mead to validate the InSAR results; operated by the Nevada Geodetic Laboratory, University of Nevada, Reno [60]. The GPS station P006 is the only station located within the extent of the SAR data and with its time span fully covered by the S1 period (Figure 1a). We used the vertical displacements recorded there to validate the vertical displacement derived by the InSAR technique on the S1 data (2014–2019). Although the time span of the GPS station P006 overlaps partly with that of Envisat and fully that of ALOS, we could not use the GPS observations of this station for the result validation of these two sensors, due to the large intervals between data acquisition dates (of several months) (Figure S3).
2.3.3. Water Level Data
Several statistical/empirical [61,62] and climatic models [52,63] showed a decrease in precipitation and runoff in the Colorado River basin since the year 2000. Lake Mead experienced a consistent drop in water level since the year 2000 (Figure 2a). We compared the ground surface deformations around the reservoir obtained by InSAR with the reservoir water level between 1995 and 2019, as obtained from the United States Bureau of Reclamation [64]. A preliminary assessment confirmed that water level in the reservoir correlated well with the associated storage volume (Figure 2b).

Figure 2.
Water level and storage volume in Lake Mead. (a) Mean water level in Lake Mead and storage volume (United States Bureau of Reclamation) along with the periods of availability of the four types of SAR data. (b) The scatter plot shows the linear correlation between the water level and water storage, along with the correlation coefficient.
3. Methods
3.1. InSAR Processing—Lake Mead
The SARscape ® software was used for the InSAR processing of four different SAR dataset (i.e., ERS1/2, Envisat, ALOS, and S1). We used the SBAS technique [58] to obtain ground surface deformation around the lake. InSAR employs the differences in the path length of two satellite acquisitions taken from the same orbit, to generate maps of spatial and temporal changes on ground (e.g., [39,40]) or the wetland surface (e.g., [41,43]). SBAS is an algorithm consisting of the selection of short temporal and spatial baselines and application of space-time filtering, which mitigates atmospheric artefacts and determines ground deformations that are specifically tailored for natural terrains. We first created the connection graph that organizes all interferograms (i.e., maps of ground deformation between acquisition pairs), by defining the temporal and spatial critical baselines for each sensor. We then co-registered all slave images with the master image to generate the interferograms. The critical baseline was the separation between the two satellite passes that once exceeded results in a complete loss of coherence in the interferograms (e.g., 5 km in the case of S1). Please refer to Figure S4 of Supplementary Materials for the connection graphs showing the critical baseline, images, and interferograms obtained for each sensor.
In the co-registration step of the SBAS process, we initially estimated a local nonparametric shift-estimate with the DEM and orbital information. To increase the signal-to-noise ratio of the interferograms for a more reliable coherence estimation, an appropriate multi-looking factor was accordingly set for each sensor (i.e., 1 × 6 for ERS, 1 × 5 for Envisat, 3 × 7 for ALOS and 4 × 1 for S1in range and azimuth, respectively). We used the Goldstein filter on the interferograms and unwrapped them by the Minimum Cost Flow method [65], applying a third-degree polynomial to remove phase ramps and constants from the unwrapped interferograms. After this, we removed the height residual due to the DEM error and estimated the initial velocity (a definite integral of displacement in the last time-point of the interval minus the value of the displacement in the first time-point of the interval normalized (divided) by the interval duration time) of ground deformation in millimeters per year, during the first inversion step. The atmospheric artifacts were also removed by applying a two-dimensional spatial low-pass filter and a temporal high-pass filter on the interferograms. As the topography surrounding the reservoir is sometimes characterized by steep slopes, we initially found a high correlation between topography and the interferometric phase (referring to the stratified tropospheric phase delay), after the atmospheric filtering. Several ancillary data such as weather models, GPS data, and multi-spectral observations, and approaches such as phase-based method could be used to remove or mitigate this stratified phase delay [27]. Here, we used the European Centre for Medium-Range Weather Forecasts (ECMWF) weather models, including ERA-Interim data for ERS, Envisat, and ALOS periods, and ERA5 data for the S1 period, to estimate the stratified phase delay using the TRAIN (Toolbox for Reducing Atmospheric InSAR Noise). For information on the InSAR tropospheric corrections using the ERA-Interim and ERA5 models, please refer to [27]. Finally, we geocoded the velocity and displacement maps representing the series of ground displacement for each of the four sensors.
In order to study the LOS (Line Of Sight) deformations around the lake, we focused the analysis on a 5-km buffer around the reservoir, starting from the border of the shoreline during the ERS period, which had the largest surface water extent to date. We studied ground deformation along three transects located in different areas of the lake (transects A, B, and C; Figure 1b) and specifically at 500 m from the lakeshore along each transect, to quantify the relationship between ground deformation and lake water level at this location. Each of the three transects was located in a different section of the reservoir, and comprised different geological units (Figure S1). This selection was done on purpose in order to study the consistency of the ground deformation signal across space and geological units. In addition, we compared the vertical displacements of the SBAS time-series (the point corresponding to the geographical location of the GPS station P006) to the vertical displacements of the GPS, in order to validate the SBAS results for the S1 period.
3.2. InSAR Processing—Hoover Dam Site
We used both the SBAS and PSI techniques to study ground deformation around the lake and water level changes on the Hoover Dam structure with the S1 data (2014–2019). The PSI is a technique relying on persistent scatterers that have a stable phase history over time, such as man-made structures, to estimate ground deformation. We applied these two techniques to generate the displacement maps along the Line of Sight of the satellite (LOS), both in descending and ascending modes, focusing on the crest of the Hoover Dam.
For the PSI processing, we applied a similar methodology, as for the SBAS encompassing image co-registration, interferogram generation, and tropospheric correction (stratified phase delay) steps. In summary, we generated a star network to create the connection graph (Figure S4e,f) and did not apply spectral filtering to preserve the high resolution of the interferograms. We used a multi-looking factor of 1 × 1 and selected the initial PS pixel-candidates by using the amplitude dispersion index [59]. The residual height and displacement velocity were obtained using the linear model and the phase constant retrieved from the interferograms were removed using the highest coherent pixel selected within a predefined area (5 km2) (Figure S6). Finally, we estimated the atmospheric phase components by using the previous model and the second linear model to fit the final displacement after removing the atmospheric phase (Figure S5). In the SBAS processing, we combined the descending and ascending modes to obtain 2D displacement maps of the dam crest. The displacement vector (dlos) projected on the LOS was extracted for each pixel and decomposed into its three basic components (i.e., east, north, and upward) as follows:
where U is the ground surface deformation field and the subscripts e, n, u stand for the three orthogonal components east, north, and upward, respectively. The φ is the azimuth of the satellite heading vector (positive clockwise from the North), θ is the radar incident angle, and δlos is the measurement error due to the imprecise information of the satellite’s orbits, atmospheric delay, poor phase coherence, and inaccurate DEM [66]. We assumed δlos to be negligible since the orbit information of the S1 satellite was precise [67] and the short revisiting time of the S1A/B satellite led to highly-coherent interferograms. We used an accurate 10–m DEM [68] to increase the geocoding accuracy and parameters θ = 34.06°, φ = 193°, θ = 44.00°, and φ = 347° for the S1-ascending and descending modes, respectively. The local angles values were extracted from each single pixel from the SAR images. According to Equation 1, the east–north–upward projections of the LOS displacement vectors were [0.54, 0.12, 0.82] and [0.67, 0.15, 0.71], for the descending and ascending modes, respectively.
Unsinφsinθ − Ue cosφsinθ + Uu cosθ + δlos = dlos
4. Results
4.1. Ground Deformation around the Reservoir and Water Level
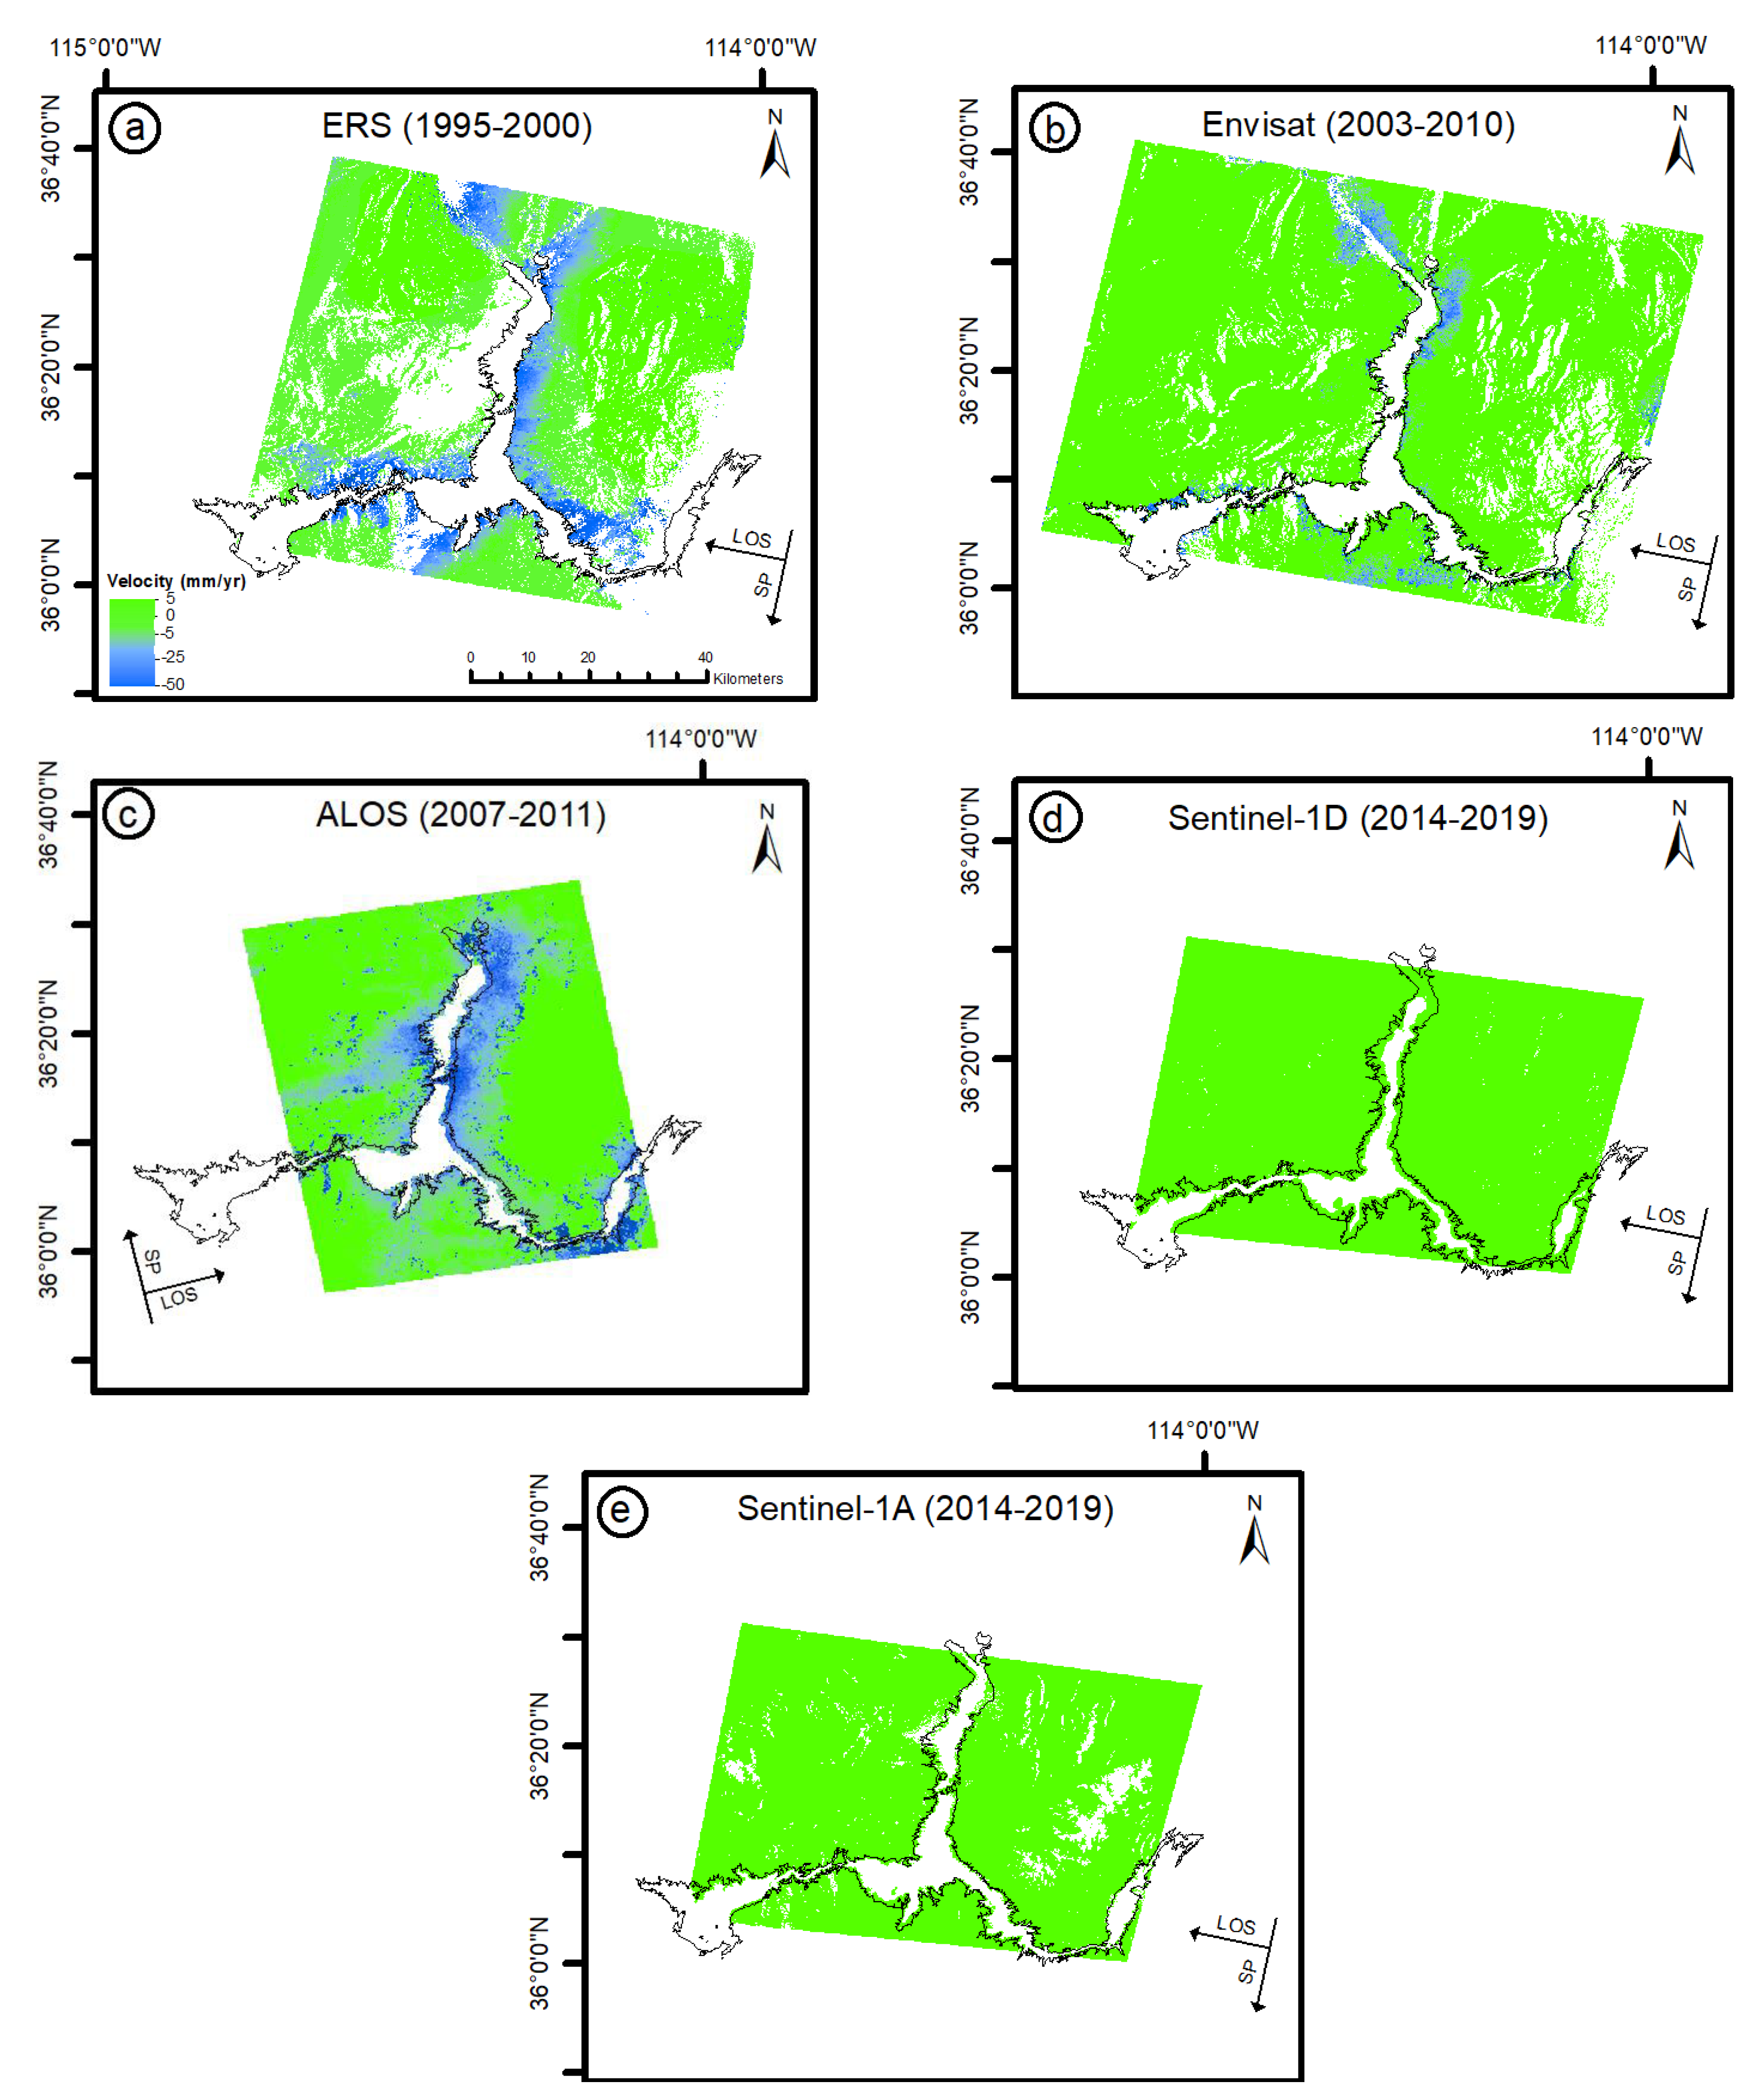
The variations of lake water level between 1995 and 2019 resulted in a decrease in the surface area of Lake Mead, with the north-east area of the lake experiencing a water retreat of up to 1 km (Figure S7). We obtained the velocity maps of ground deformation for the whole area of Lake Mead and for all displayed sensors, using a common color legend for better cross-comparison (Figure 3).
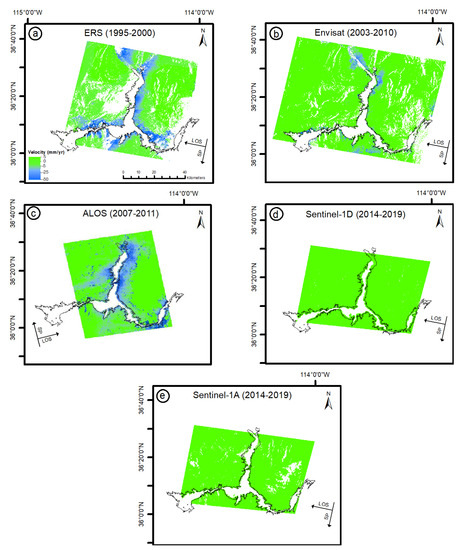
Figure 3.
Sensor−specific velocity maps of ground deformation of Lake Mead. Boundary of Lake Mead during the ERS period (black) and maps for the (a) ERS, (b) Envisat, (c) ALOS, (d) S1D (Descending), and (e) S1A (Ascending), showing the Satellite Pass (SP) and Line of Sight (LOS). Negative values indicate an increase in the distance along the LOS (subsidence) and positive values present a decrease in the distance along the LOS (uplift). The S1A map was clipped based on the S1D extent for better inter-comparison. The pixel corresponding to the GPSP006 station in Figure 1 was used as the reference point.
During the ERS, Envisat, and ALOS periods, the most pronounced deformations occur close to the border of the reservoir and on the Overton arm, along the east and north borders of the reservoir where the water surface had retreated the most. The subsidence occurring closest to the lake might be associated with changes in water loading in the reservoir, and possibly in a smaller degree by the erosion processes of the non-consolidated materials occurring around the lake and washed-off by wind and water erosion. The deformation maps of the ERS and ALOS periods showed a larger spatial extent of subsidence beyond 5 mm than the Envisat sensor (Figure 3a–c), while no considerable deformation was seen in the deformation maps of the S1 descending or ascending modes (Figure 3d,e). It is worth noting that it is in these periods when water level in the reservoir changed the most. A simple scheme of the expected elastic relationship between ground deformation due to water load around the lake (subsidence-uplift) and water level variation is provided in Figure S8. The velocity map of ground deformation during the ERS period (Figure 3a) contains fewer pixels than the other sensors due to the low coherence obtained by the ERS data in the step of the interferogram generation, probably related to the large temporal baselines.
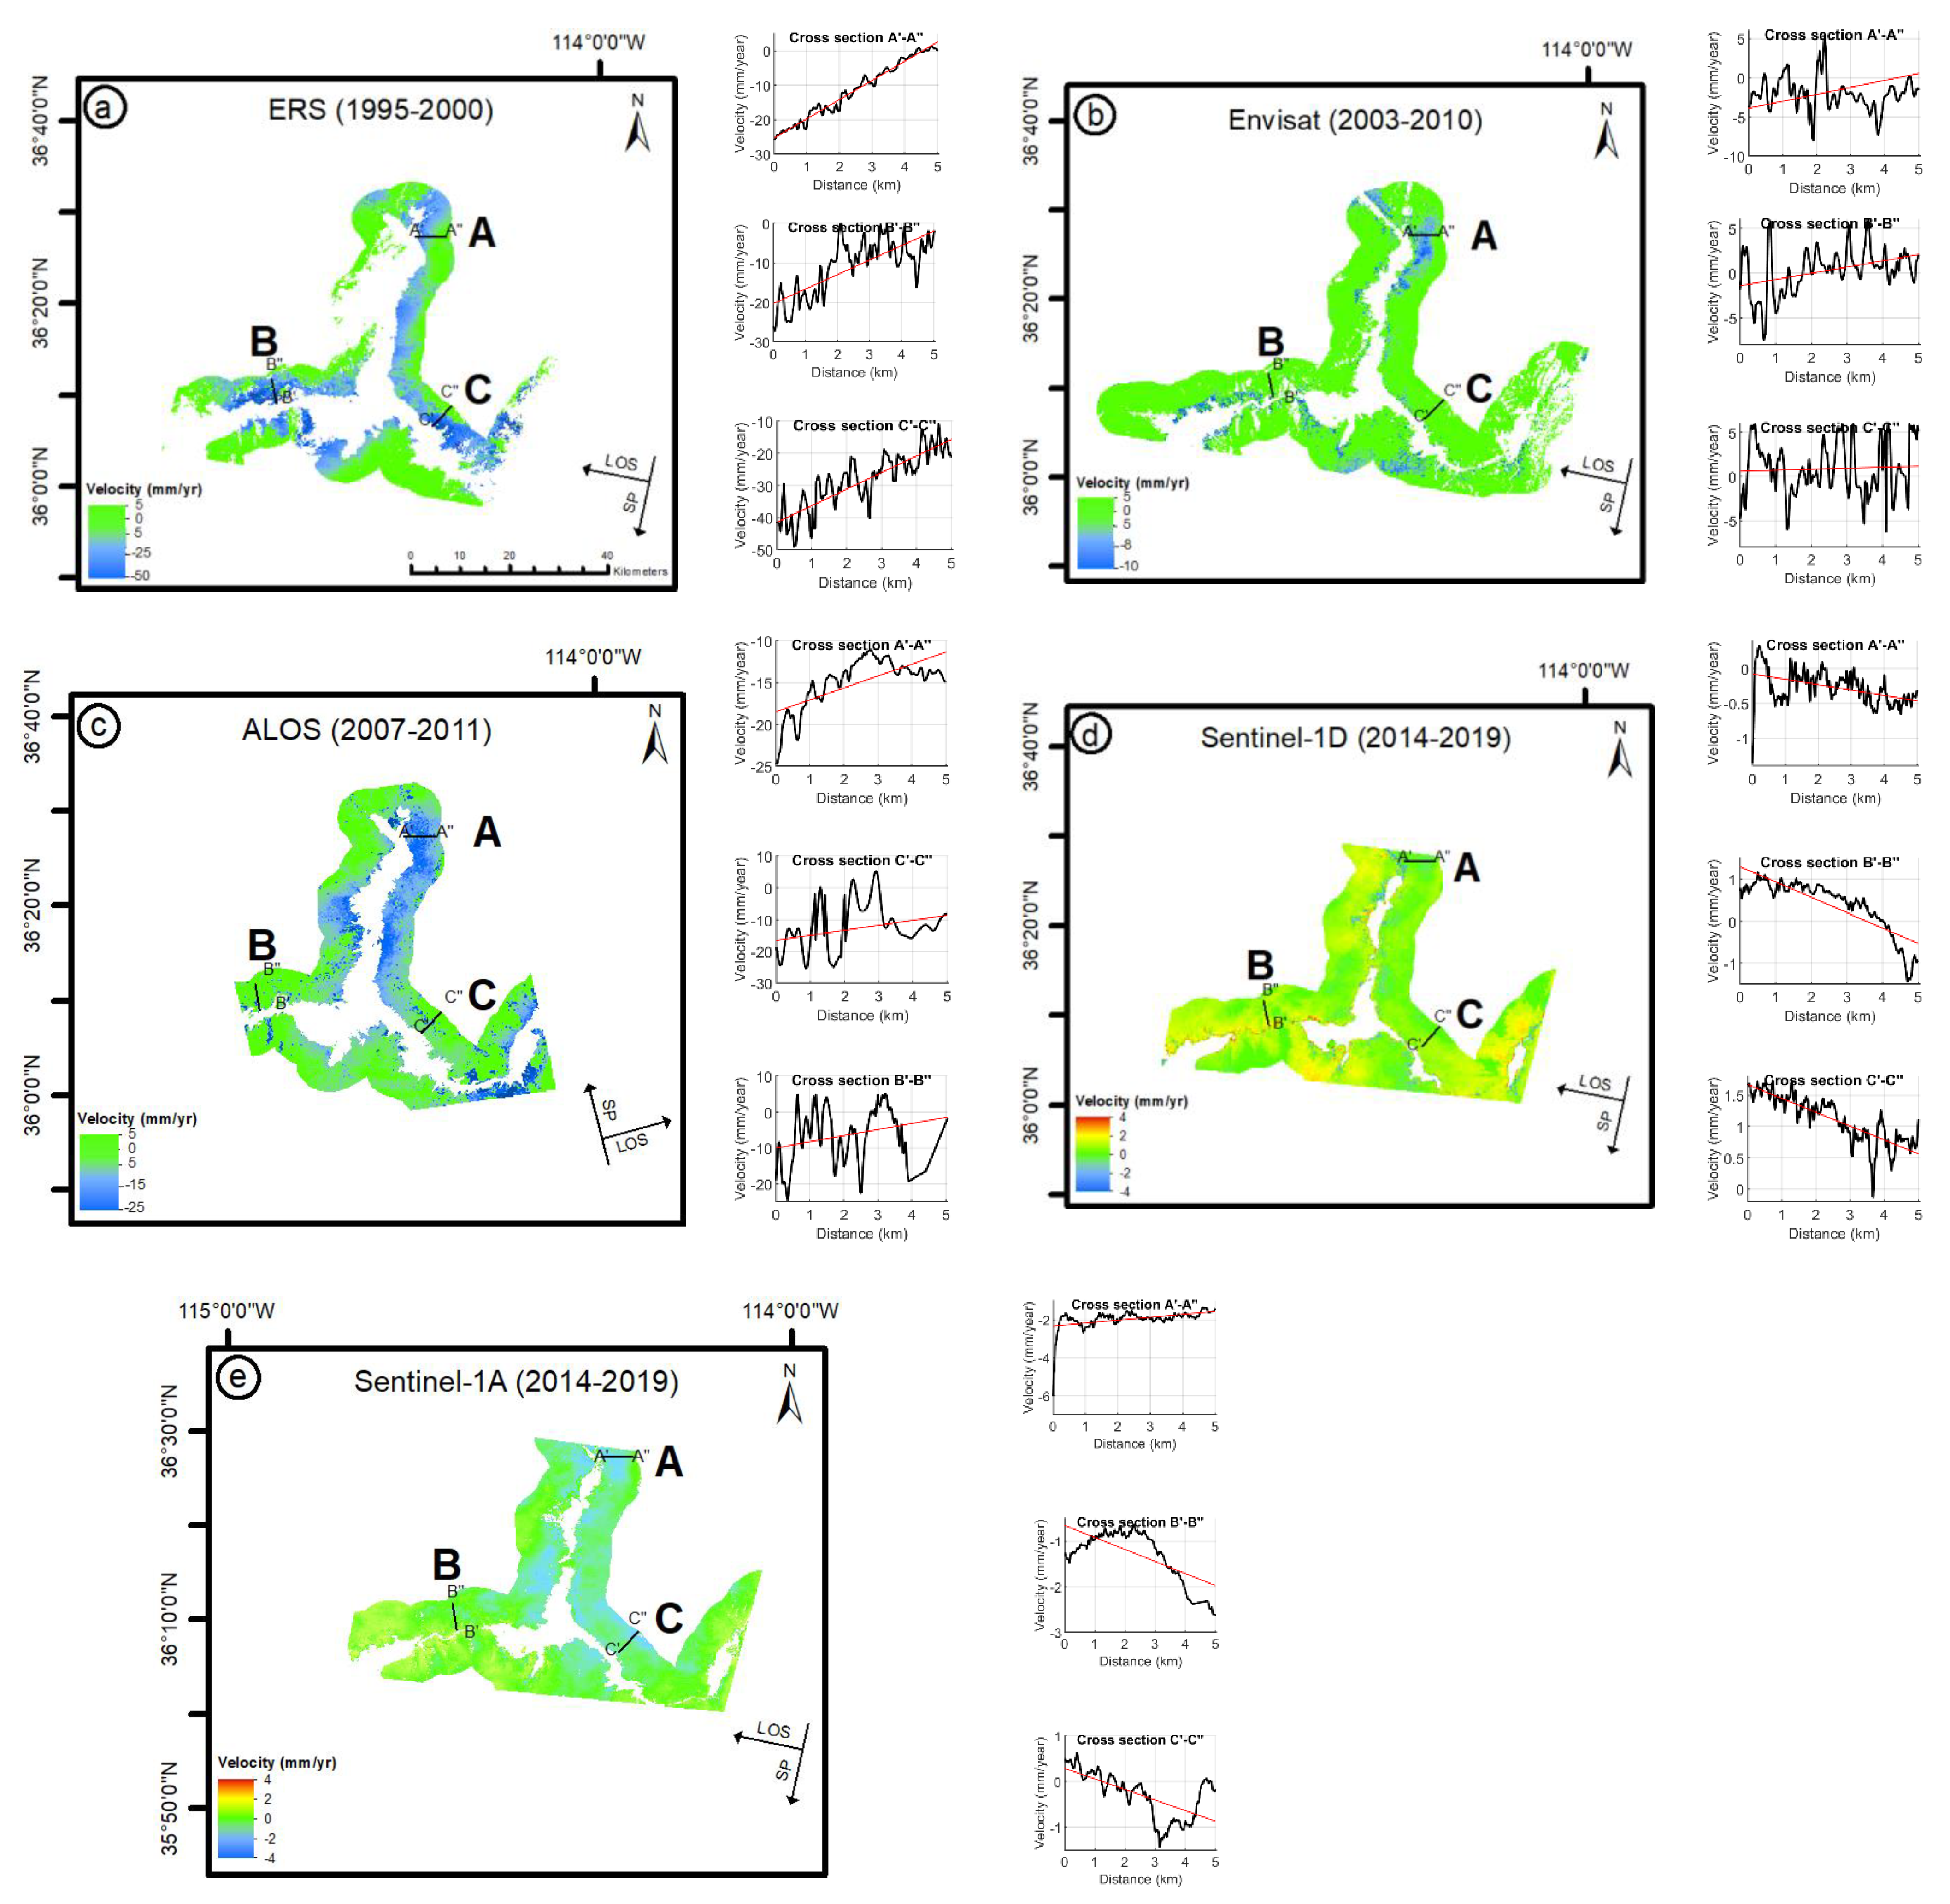
For a better cross-comparison between the velocity maps of all sensors, we masked the velocities of deformation beyond the 5-km buffer zone around the lake and analyzed ground deformation and velocities of deformation along the three transects A, B, and C (Figure 4). We found that the most pronounced subsidence occurred closest to the border of the reservoir during the ERS period 1995–2000 for all three transects A (~−25 mm/yr), B (~−30 mm/yr), and C’-C’’ (~−50 mm/yr), and that the magnitude of the subsidence decreased when moving away from the reservoir. On the contrary, we also found slight uplifts during the S1D period (2014–2019) next to the border of the reservoir, for the transects A’-A’’ (~0.6 mm/yr), B’-B’’ (~1 mm/yr), and C’-C’’ (~1.5 mm/yr). However, the magnitudes of these uplifts were much smaller than the subsidence in the same location during the early ERS period.
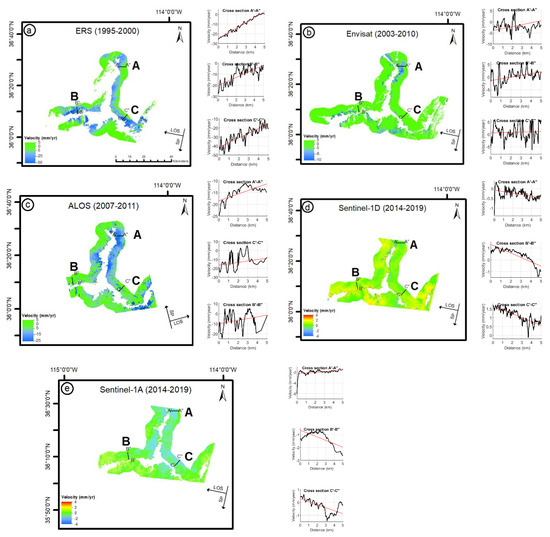
Figure 4.
Velocity maps of ground displacement in the buffer zone. LOS velocity maps for (a) ERS, (b) Envisat, (c) ALOS, (d) S1D, and (e) S1A, each with three small panels on the right showing the ground deformation velocity in mm per year along each transect (i.e., A’−A’’, B’−B’’, and C’−C’’).
Overall, the general trend of ground deformation moving away from the reservoir (represented by the red-dashed fitted-lines in all transects of Figure 4) changed consistently and gradually from a positive slope in the ERS period, to a negligible slope during the Envisat and ALOS periods, ending with a negative slope during the S1 period. The velocity maps of the S1 period for both descending and ascending modes are shown in Figure S9 for a better cross-comparison.
4.2. Relationships between Water Level and Ground Deformation
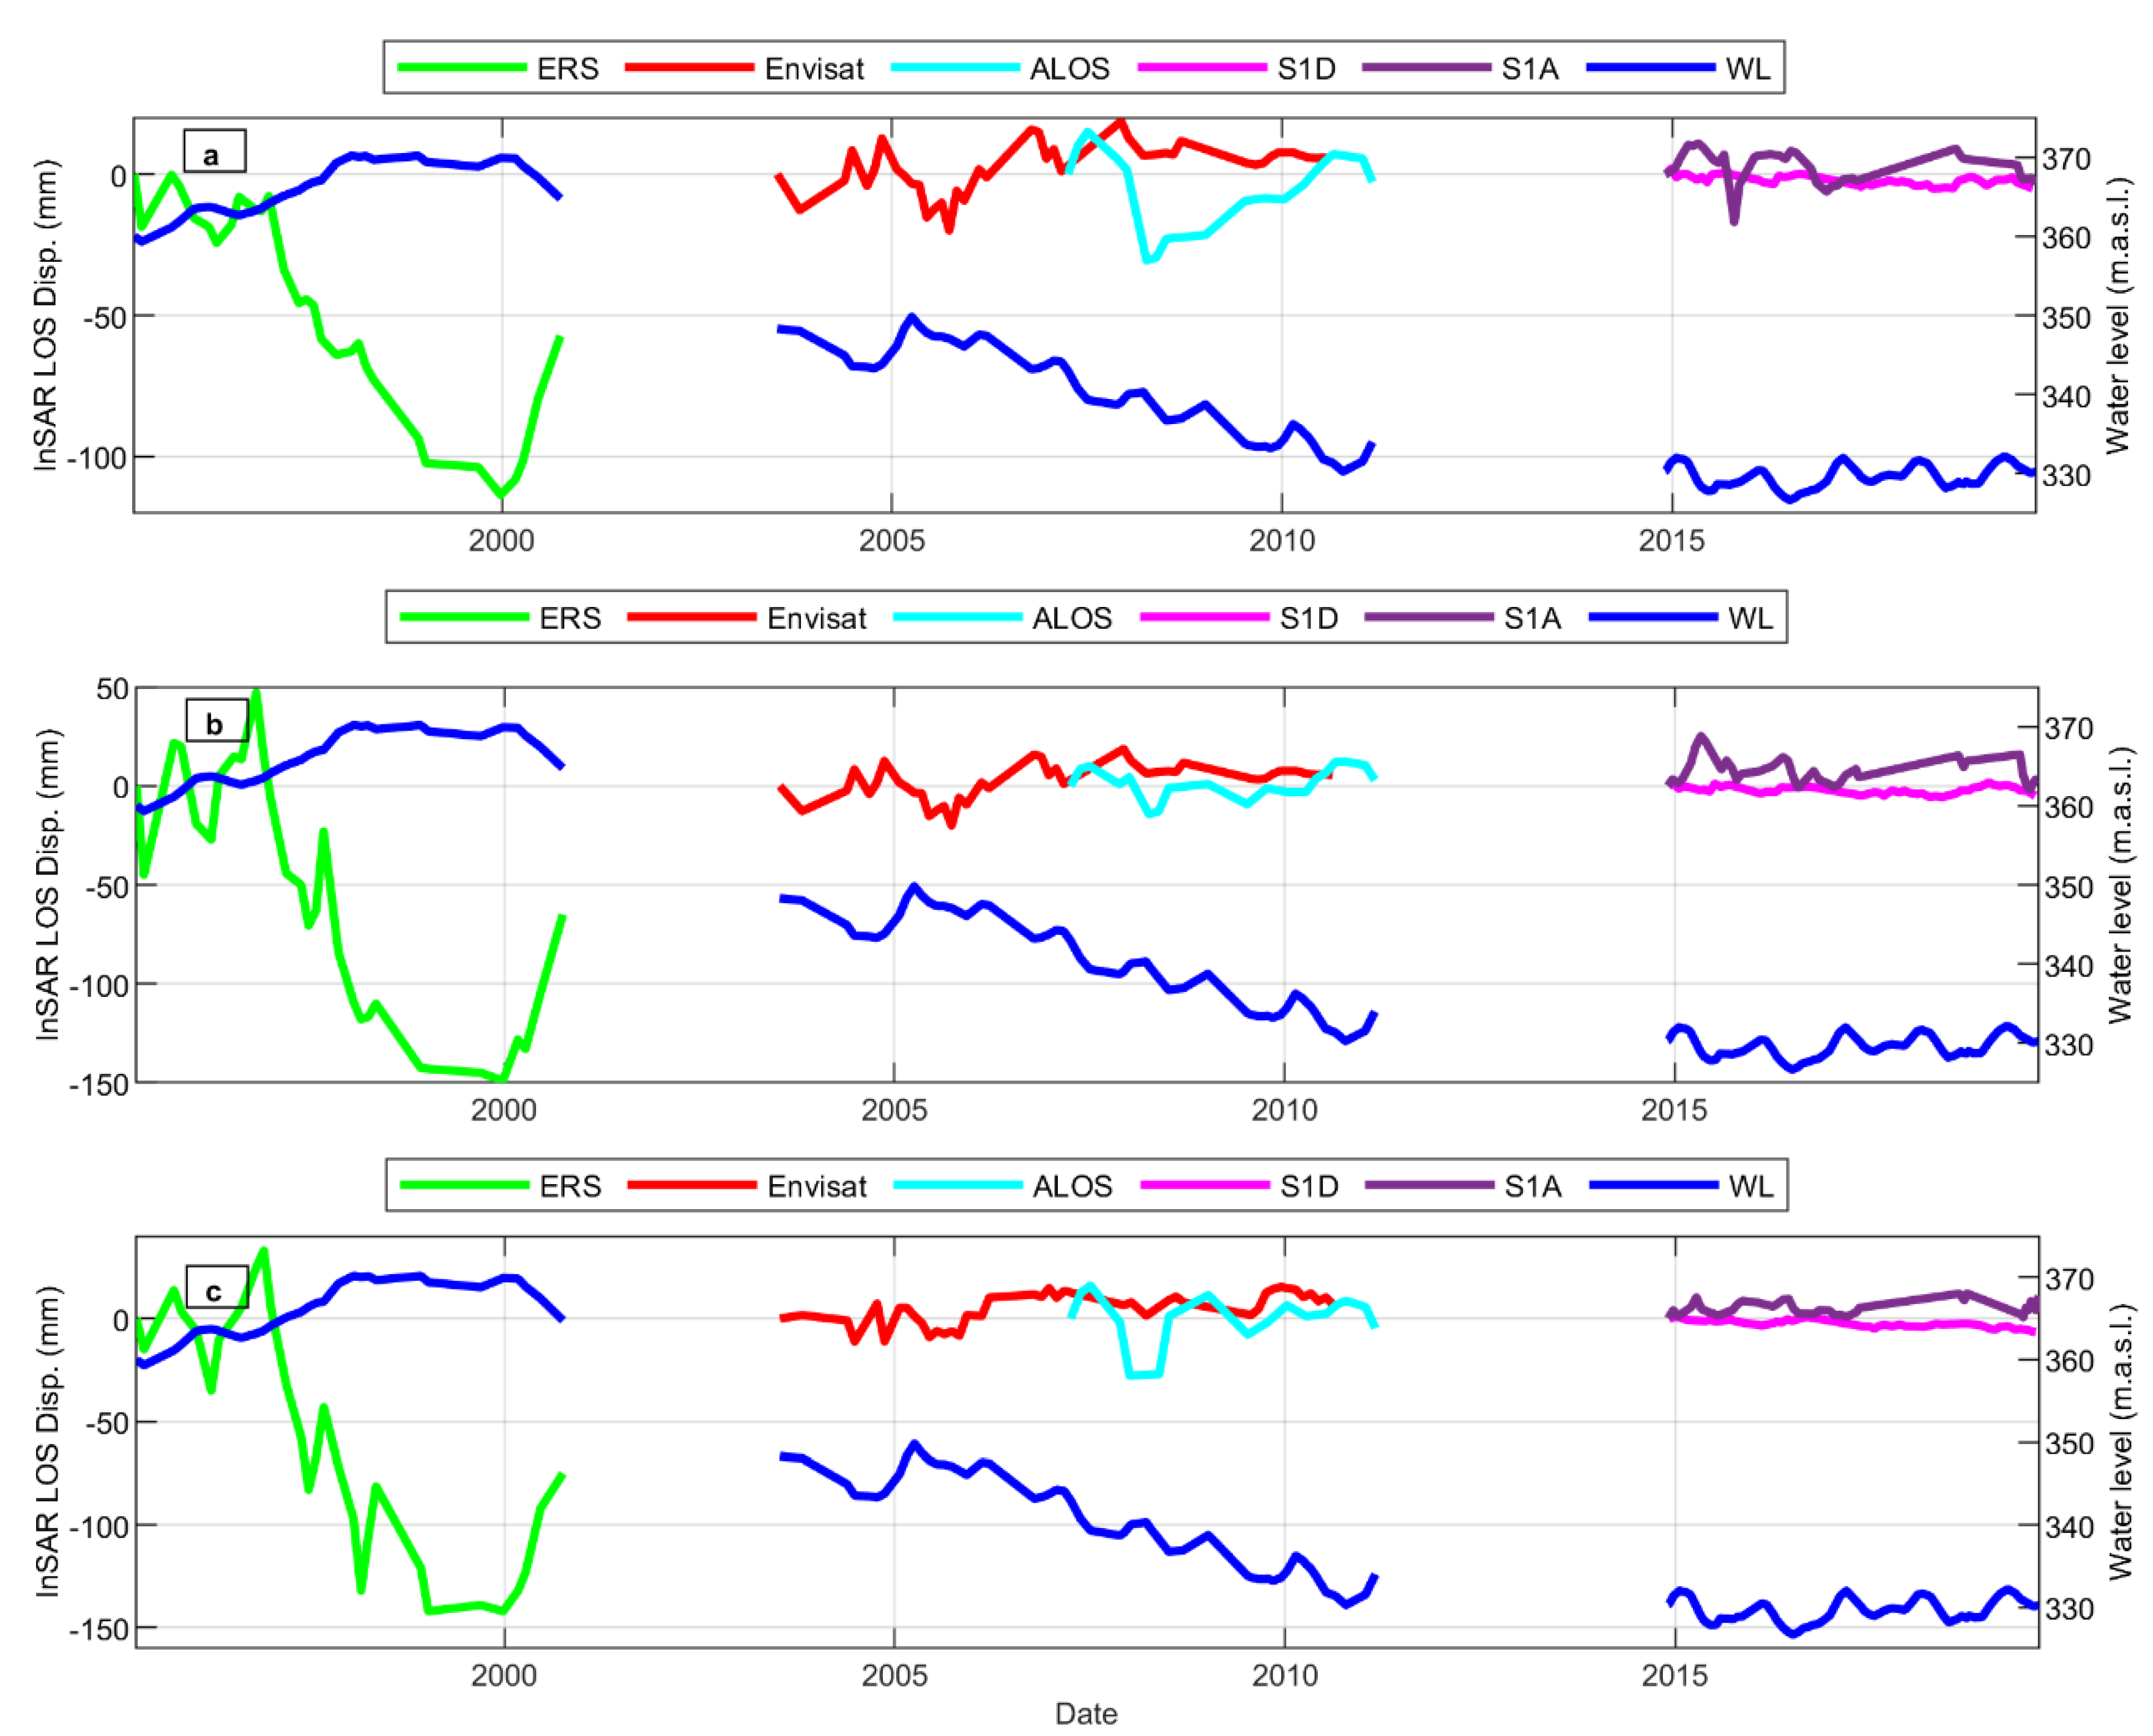
The InSAR ground displacement at 500 m from the lakeshore was similar in the three transects, despite the different location of the transects and the different geological units being covered (Figure 5 and Figure S10). In general, ground surface deformation correlated negatively with water level (Table 2 and Figure S10). During the ERS (1995–2000), a subsidence occurred, while the water level increased to—and stayed at—the highest water level across the entire period of measurement (Figure 5). During the Envisat period (2003–2010), the same negative relationship was found, while the ground rebounded and the water level decreased. The consistent relationship between water level and ground deformation during these periods evidenced a compressibility response from the increasing water load in the reservoir. The ALOS period might be too short to notice this relationship; however, if existing, it was not as evident as the two former sensors. During the Sentinel 1 period (2014–2019), the negative relationship was still present but rather as intra-annual oscillations of water level around a stable water level against small deformations outcropping from otherwise rather stable ground. It appeared that during the three periods and in the long term, water mass loading decreased along with a less compressibility effect from water volume in the reservoir, stabilized the ground (Figure 5 and Figure S10e).
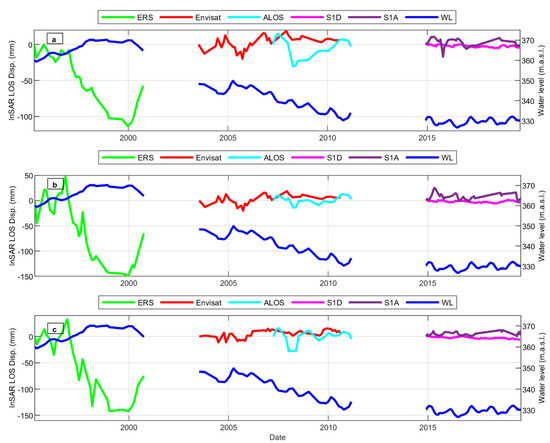
Figure 5.
Water level and InSAR−calculated displacement relative to the initial ground level of each sensor-period. Water level (m.a.s.l, dark blue) and InSAR LOS average displacement of a 3 × 3 pixel−area at 500 m from the shore and along the transects (a) A, (b) B, and (c) C.

Table 2.
Relationship between InSAR deformation displacement and water level. The correlation coefficients (R) between water level (W) and InSAR displacement for each sensor (ERS, Envisat, ALOS, S1D, S1A), 500 m from the shoreline in each transect (PT: PA, PB, and PC, respectively).
To assess the accuracy of the SBAS results, we extracted the SBAS time-series of the vertical ground displacement at the location of the GPS station P006, for both descending and ascending S1 modes (Figure 6). Although the period of availability (Sentinel) is when the smallest displacements occurred, the vertical SBAS displacements of both descending and ascending modes still showed agreement with the GPS data (R = 0.3 and Root Mean Square Error (RMSE) of 3–8 mm), and with the GPS displacement data also presenting a negative relationship with the water level (Table 3).

Figure 6.
Validation with GPS station during the S1 period. Cross−comparison between vertical ground displacements at station P006 from both GPS measurements and SBAS during the S1 period for both (a) descending and (b) ascending modes.

Table 3.
Accuracy assessment of the time-series of the SBAS−S1 displacements. RMSE and R corresponding to results of Figure 6.
4.3. Deformation of the Dam and Water Level Changes
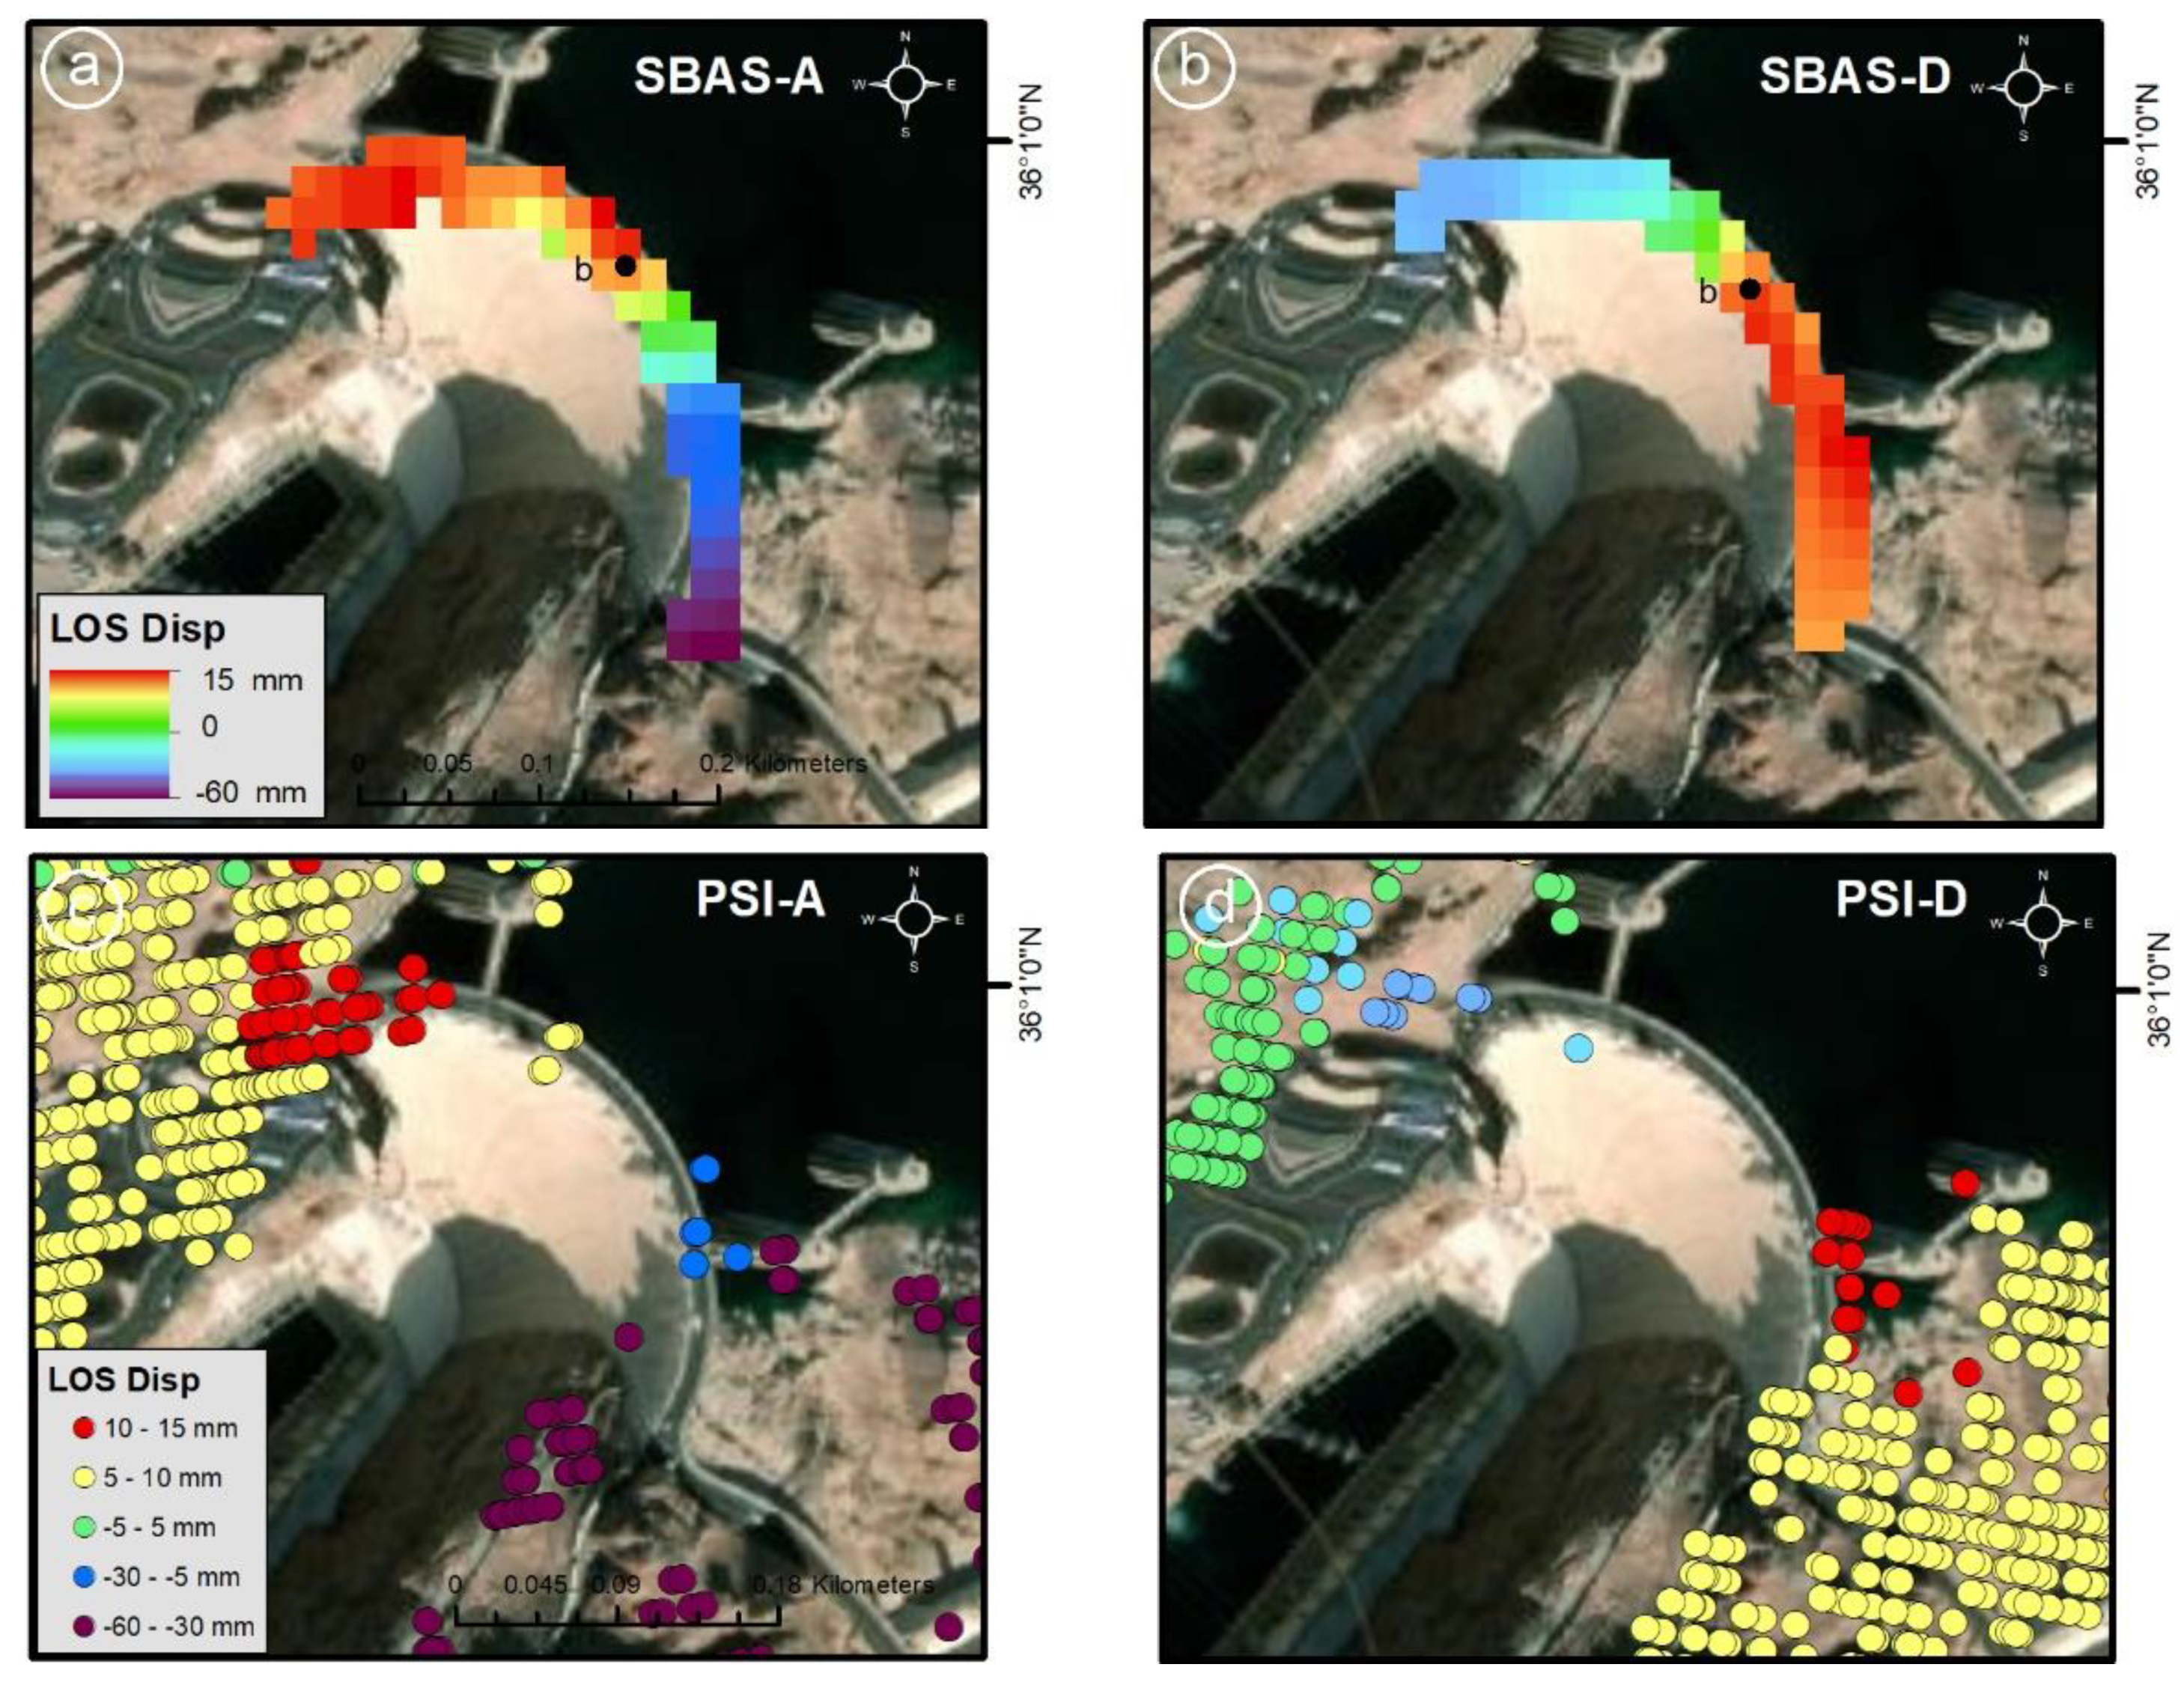
Taking advantage of the resolution given by the S1 sensor, we focused on ground deformations at the Hoover Dam. Both SBAS and PSI techniques were used in both descending and ascending modes to obtain ground deformation around the dam and on the dam itself (Figure S11). The LOS displacement maps derived by the SBAS and PSI techniques showed similar displacement patterns and magnitudes for the crest of the dam (Figure 7a–d). The displacements consisted of a pronounced subsidence at the east and north of the crest, in the ascending mode, and an inverse pattern on the descending mode. The LOS PSI and SBAS time-series displacements of the point “b”, located on the middle of the crest (Figure 7a,b), were constructed for comparison in both descending and ascending modes. In the case of the PSI displacement map in the descending mode (Figure 7d), there was no coherent displacement signal at point “b”, for which we used instead the the nearest point (blue) on the west of the middle of the crest.
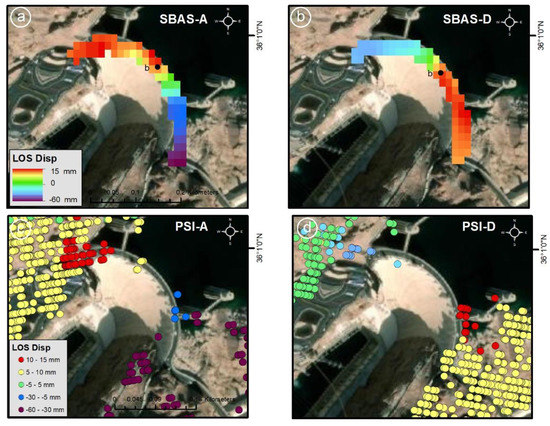
Figure 7.
LOS displacements in Hoover Dam derived by the SBAS and PSI. (a) SBAS displacement along the LOS in ascending (SBAS−A), (b) and descending (SBAS−D) mode, (c) PSI displacement in ascending (PSI−A) and (d) descending (PSI−D) modes. Point “b” indicates the middle of the crest.
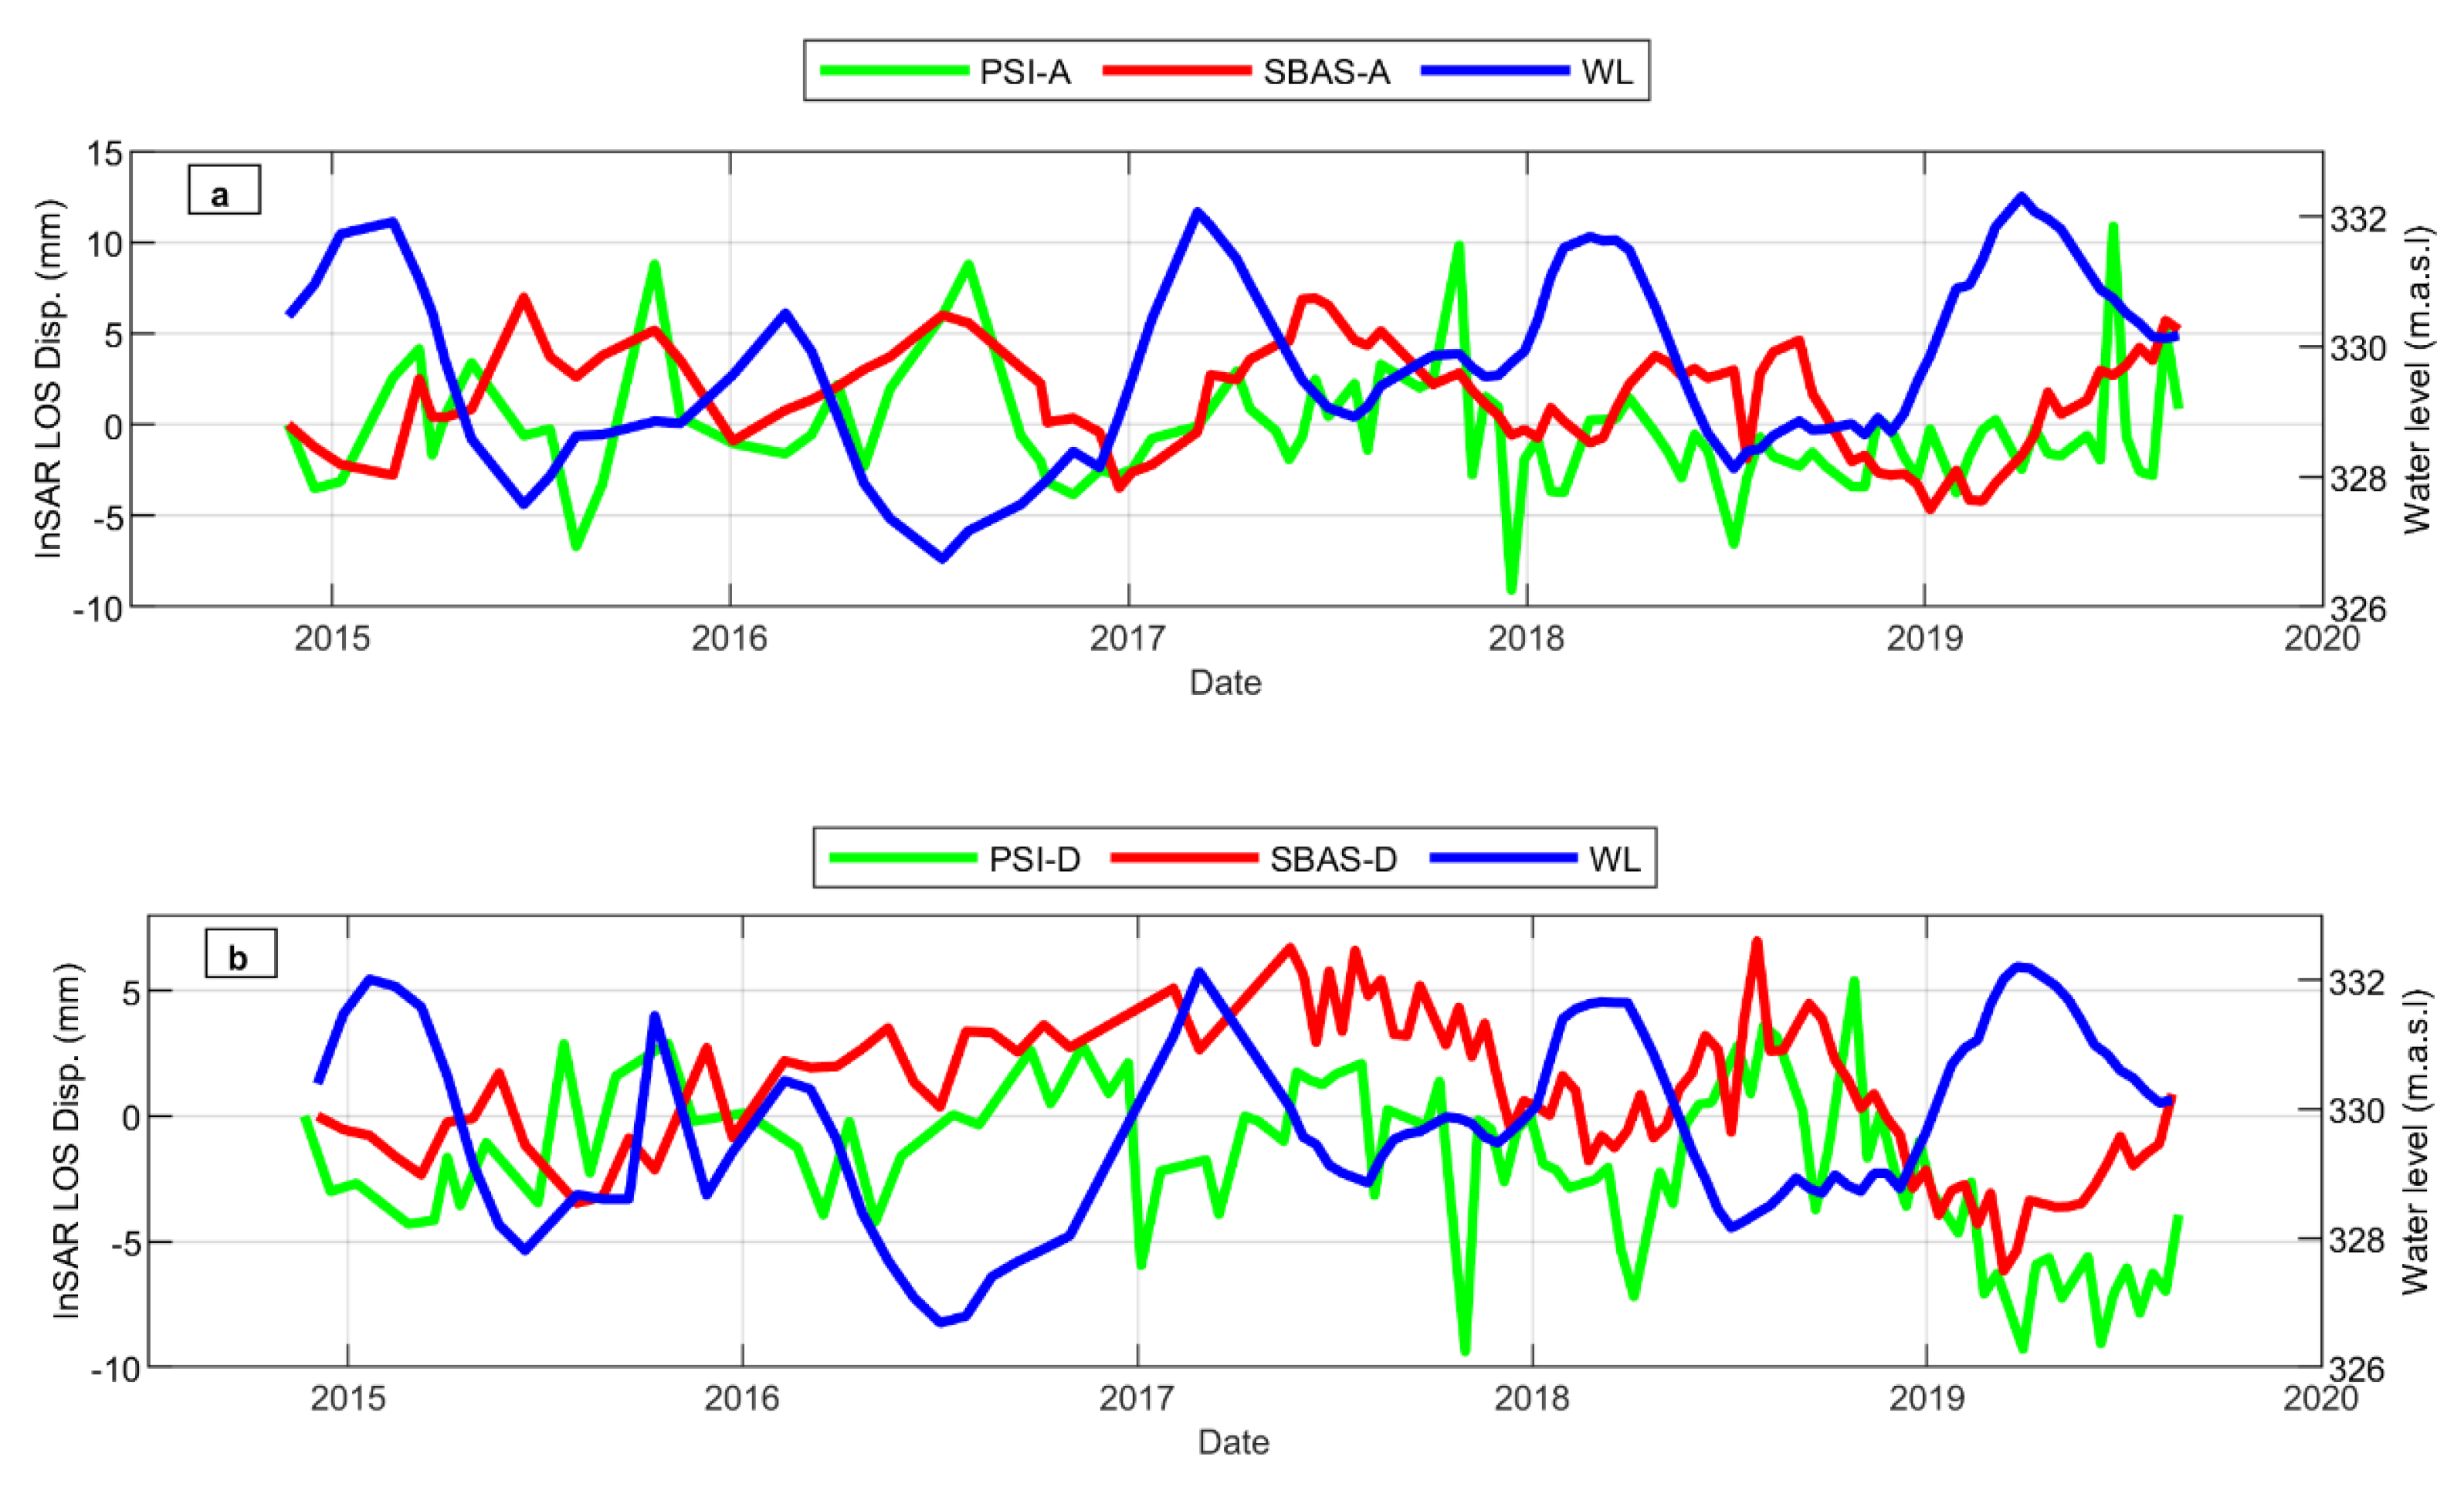
In the middle of the crest of the dam (point b: Figure 7a), the SBAS and PSI time-series of LOS displacements had a good agreement and again a negative relationship with water level, and as for the case of the reservoir’s surroundings during the S1 period, ground displacements were small (Figure 8 and Table 4).
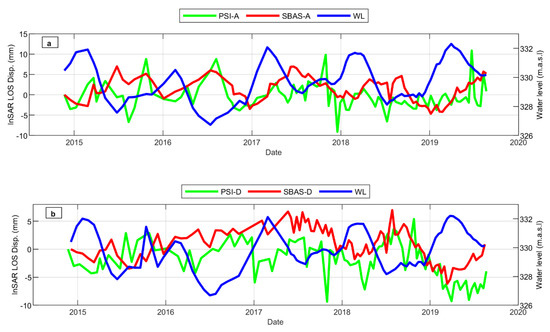
Figure 8.
Displacements in the middle of the crest. Water level and PSI/SBAS ground displacement along the LOS at the middle of the crest (point b in Figure 7a). (a) The ascending mode and (b) the descending modes.

Table 4.
Correlations of displacement on the crest of the dam and water level (see Figure 8).
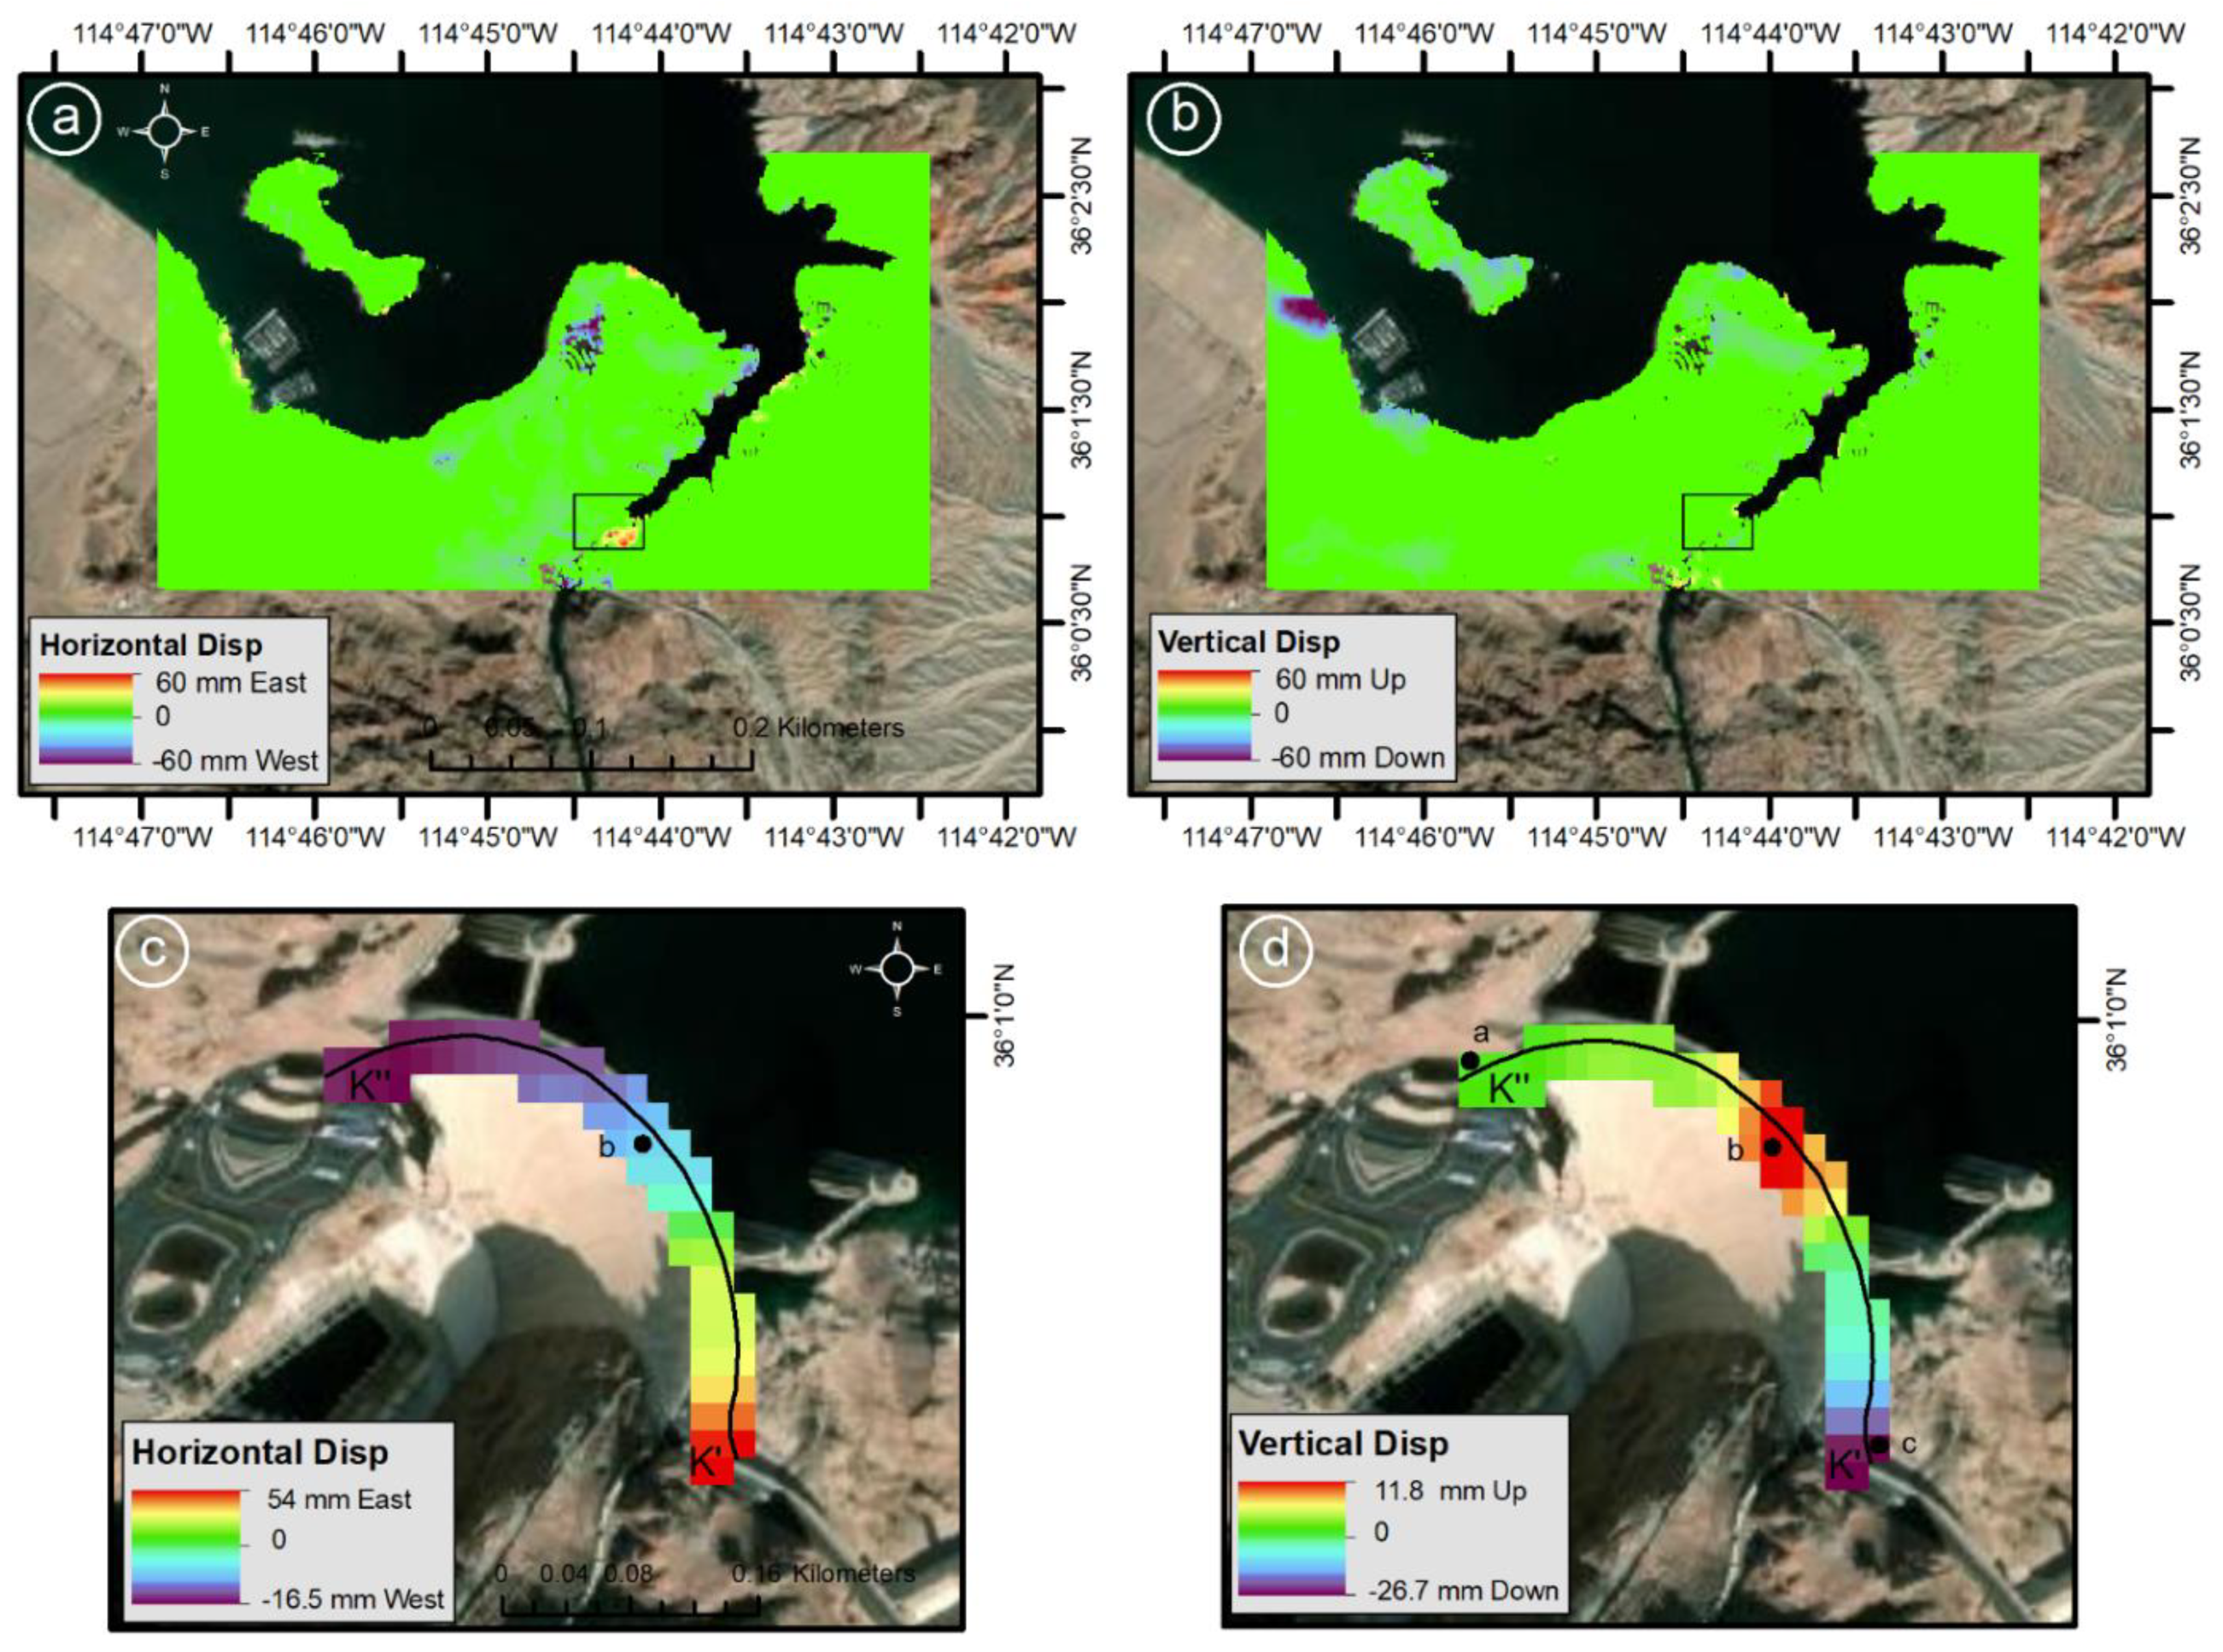
Using the displacement decomposition of the ascending and descending geometries, we calculated the 2D displacement components of deformation around the area of the dam (Figure 9a,b) and at the dam site (Figure 9c,d). The horizontal displacement pattern shows displacements of the dam in the west-east direction and how the buttresses of the dam move away from the middle of the crest (Figure 9c). The western buttress (indicated by A” at the beginning part of the crest profile) moved towards the west by 16.5 mm, while the eastern buttress shifted 54 mm to the east. Regarding the vertical deformation, the water level also showed a negative dependency on ground displacement in the buttresses and the middle of the crest arising from the interannual variability of both water level and ground displacement, even more evident at the middle of the crest (Figure 9d).
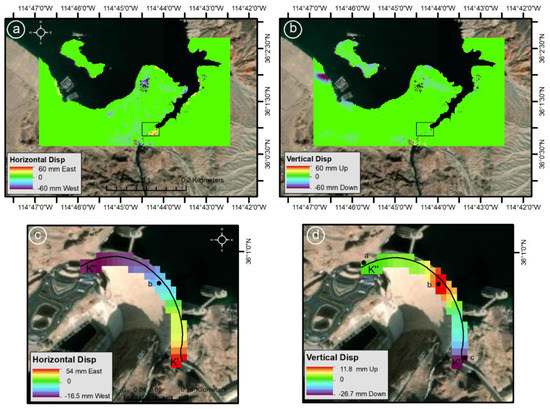

Figure 9.
Horizontal and vertical displacements of the Hoover Dam during the S1 period. Regional (a) horizontal and (b) vertical displacement maps, with focus on the dam site—(c) horizontal and (d) vertical displacements, respectively. (e) Total horizontal and vertical displacements along the crest (from point K’ to K’’) and (f) time-series of water level and the vertical displacements of the buttresses and the points ‘a’, ‘b’, and ‘c’, along and over the crest (Figure 9d).
5. Discussion
We found a negative relationship between ground deformation and water level throughout the period 1995–2019, evident across most radar sensors and present around the reservoir, across different geological units, and even at the dam site. The relationship agreed with previous studies of ground deformation in the area; one using InSAR during the period 1992–2002 [44] and a second one performed with levelling techniques [45]. The latter study found an accumulated subsidence of the ground surface in the central part of the reservoir (relative to the level in 1935) of around 120 mm (in 1941), 218 mm (in 1950), and 200 mm (in 1963), which related to the weight of the impounded water. The higher temporal and spatial resolution of our study showed that the largest ground deformations occurred close to the shores of the reservoir, in comparison to the larger deformations found by [44], even at long distances away from the reservoir. This difference was due to—(i) the current available sensor data, (ii) corresponding stricter spatial and temporal thresholds that we could now apply (i.e., 60% percentage of the critical baseline and 250 days for the temporal baseline), and (iii) the low number of ERS data that we considered usable for the SBAS analysis. The SBAS technique, not yet available at the time of the former studies, is a more powerful technique, as it efficiently reduces the negative effects of decorrelation and atmospheric artifacts. Furthermore, we used the weather model of the ERA-Interim (spatial resolution of approximately 80 km) to mitigate atmospheric artefacts and overcome the stratified phase delay than the ERA40 used by [44], which used a spatial resolution of 125 km.
In general, all sensors analyzed here in ascending and descending modes evidenced a negative relationship between water level and ground deformation around the reservoir, along the three selected transects. The negative relationship was evidenced from the interannual trends of both variables during the ERS1/2 (1995–2000), Envisat (2003–2010) and mildly during the ALOS PALSAR (2007–2011), and from the intra-annual variations of the more stable S1 period (2014–2019) (Figure 5). The negative relationship could be explained by a long-term subsidence due to an increase in water loading, when the water level increased and the smaller intra-annual ground displacements were associated with seasonal variations of water level and storage, and was validated by the GPS station P006 located in the northern shoreline of Lake Mead.
The ALOS sensor deformation represented more subsidence than the other three sensors, possibly due the acquisition mode of the sensor. The ALOS data acquisition was aligned to the LOS of the ascending mode, while the other three sensors were aligned to the descending mode. This was ratified when comparing the velocity maps of the descending and ascending modes of S1 data, especially within the 5-km buffer around the lake (Figure 4d,e and Figure S9), which also showed larger displacements in the ascending mode. Since ALOS was an L-band sensor, it operated with a longer wavelength, providing more capability and sensitivity than the C-band sensors, capturing other trivial and superficial deformations related to surface water or wind erosion.
Despite the geological heterogeneity around the lake, we found that ground displacements in the transects A, B, and C were similar, throughout the entire period of 1995 to 2019. Although transects A and C were located in the areas of Cenozoic sedimentary rock and transect B was located in the Cenozoic volcanic rock, the elastic deformation associated with the changes in water mass loading in Lake Mead went beyond the difference in their geological features, at least within the 5 km-buffer around the lake.
In order to obtain more details about the spatial variability of ground deformation, two independent estimations of the water loading signal for the same period of S1 using the descending and ascending modes, helped us to cross-validate the SBAS results. The comparison showed a stable trend for S1D and more deformation for S1A along transect A, a similar trend for both S1D and S1A along transect B and a general similar trend with an inverse relationship at the several given distances for S1D and S1A, along transect C (Figure S9). The different deformation patterns detected around the lake (mainly uplift in the S1D and subsidence in the S1A periods) suggested that the deformation induced by the water load around the lake did not have a purely vertical displacement component, since if that were the case we would have the same deformation pattern in both geometries.
Regarding the measurements at the site of the Hoover dam, the detected PS pixels provided a good agreement with the SBAS results, especially in the descending mode (Table 4). Generally, a negative relationship was also observed between the water level and dam displacement. However, the deformation pattern was not uniform and constant along the crest of the dam. The displacement values along the crest showed that the second half of the profile experienced the largest deformations (i.e., 26 mm down and 54 mm east) (Figure 9c,d). However, the horizontal displacements occurred at the both ends of the dam crest, where we had the lowest correlation coefficients between the water level and the vertical displacement (i.e., at the points “a” and “c”). This implied that the water load oscillation was not the only key factor of the dam deformation and other factors could have contributed to the deformation. The horizontal force of the water flow behind the dam wall and the local geological and tectonic characteristics of the two buttresses are the main reasons that could explain the variation of horizontal and vertical displacements along the crest.
6. Conclusions
We constructed one of the longest time-series of InSAR to date (1995–2019), to study the relationships between water level changes and ground surface deformation around Lake Mead, United States, and at the site of the Hoover Dam. Our study was novel in a way that it made an examination across sensors of the relationship between water level changes in the reservoir and ground displacement. The study also covers one of the largest periods of observations on the scientific literature covering four radar sensors, besides performing simultaneous analysis of displacements around an impounded reservoir and its dam structure. Based on the new technologies currently available, we increased the spatial and temporal precision of ground displacement analysis of Lake Mead, an iconic reservoir in which pioneering InSAR studies were made almost two decades ago. We found a negative relationship that was evident from the long-term changes in water level and deformation occurring from 1995 to 2014, and also from the intra-annual oscillations of the later and more stable period 2014 to 2019, both around the reservoir and at the dam site. These results suggest an elastic response of the ground surface to changes in water storage in the reservoir. Overall, the results demonstrated a significant role of water load changes for the ground deformation occurring around Mead Lake and Hoover dam, and that InSAR-derived ground deformations could be consistent across sensors.
Supplementary Materials
The following are available online at https://zenodo.org/record/4457904#.YAr-nOhKhPZ.
Author Contributions
Conceptualization, M.D. and F.J.; methodology, M.D.; data processing, M.D.; validation, M.D.; writing—original draft preparation, M.D. and F.J.; writing—review and editing, M.D., F.J., G.D., S.A.; supervision, F.J.; funding acquisition, F.J. All authors have read and agreed to the published version of the manuscript.
Funding
This research was funded by Swedish Research Council (VR), grant number 2015-06503; Swedish Research Council for Environment, Agricultural Sciences and Spatial Planning FORMAS, grant number 942-2015-740; and Swedish Space Agency, grant number 180/18.
Acknowledgments
The Sentinel-1 data are provided by the European Space Agency (ESA) through Sentinels Scientific Data Hub and the rest of the data were downloaded from the ESA archive. We would also like to thank Alessio Cantone from the SARMAP Company for his support.
Conflicts of Interest
The authors declare no conflict of interest.
References
- Dill, R.; Klemann, V.; Martinec, Z.; Tesauro, M. Applying local Green’s functions to study the influence of the crustal structure on hydrological loading displacements. J. Geodyn. 2015, 88, 14–22. [Google Scholar] [CrossRef]
- Yuill, B.; Lavoie, D.; Reed, D.J. Understanding Subsidence Processes in Coastal Louisiana. J. Coast. Res. 2009, 10054, 23–36. [Google Scholar] [CrossRef]
- Herring, T.A.; Melbourne, T.I.; Murray, M.H.; Floyd, M.; Szeliga, W.; King, R.W.; Phillips, D.A.; Puskas, C.; Santillan, M.; Wang, L. Plate Boundary Observatory and related networks: GPS data analysis methods and geodetic products. Rev. Geophys. 2016, 54, 759–808. [Google Scholar] [CrossRef]
- Hydrologic Loading Model Displacements from the National and Global Data Assimilation Systems (NLDAS and GLDAS) 2017. Available online: www.unavco.org/data/displacement-model-readme (accessed on 25 September 2020).
- Castellazzi, P.; Garfias, J.; Martel, R.; Brouard, C.; Rivera, A. InSAR to support sustainable urbanization over compacting aquifers: The case of Toluca Valley, Mexico. Int. J. Appl. Earth Obs. Geoinf. 2017, 63, 33–44. [Google Scholar] [CrossRef]
- Chaussard, E.; Wdowinski, S.; Cabral-Cano, E.; Amelung, F. Land subsidence in central Mexico detected by ALOS InSAR time-series. Remote Sens. Environ. 2014, 140, 94–106. [Google Scholar] [CrossRef]
- Ezquerro, P.; Matteo, D.S.; Solari, P.L.; Tomás, R.; Raspini, F.; Ceccatelli, M.; Fernández-Merodo, J.; Casagli, N.; Herrera, G. Vulnerability Assessment of Buildings due to Land Subsidence Using InSAR Data in the Ancient Historical City of Pistoia (Italy). Sensors 2020, 20, 2749. [Google Scholar] [CrossRef]
- Rezaei, A.; Mousavi, Z. Characterization of land deformation, hydraulic head, and aquifer properties of the Gorgan confined aquifer, Iran, from InSAR observations. J. Hydrol. 2019, 579, 124196. [Google Scholar] [CrossRef]
- Cui, P.; Zhu, X. Surge generation in reservoirs by landslides triggered by the wenchuan earthquake. J. Earthq. Tsunami 2011, 5, 461–474. [Google Scholar] [CrossRef]
- Kaczmarek, H.; Tyszkowski, S.; Banach, M. Landslide development at the shores of a dam reservoir (Włocławek, Poland), based on 40 years of research. Environ. Earth Sci. 2015, 74, 4247–4259. [Google Scholar] [CrossRef]
- Reyes-Carmona, C.; Barra, A.; Galve, J.P.; Monserrat, O.; Pérez-Peña, J.V.; Mateos, R.; Notti, D.; Ruano, P.; Millares, A.; López-Vinielles, J.; et al. Sentinel-1 DInSAR for Monitoring Active Landslides in Critical Infrastructures: The Case of the Rules Reservoir (Southern Spain). Remote Sens. 2020, 12, 809. [Google Scholar] [CrossRef]
- Zhou, C.; Cao, Y.; Yin, K.; Wang, Y.; Shi, X.; Catani, F.; Ahmed, B. Landslide Characterization Applying Sentinel-1 Images and InSAR Technique: The Muyubao Landslide in the Three Gorges Reservoir Area, China. Remote Sens. 2020, 12, 3385. [Google Scholar] [CrossRef]
- Chaussard, E.; Farr, T.G. A New Method for Isolating Elastic From Inelastic Deformation in Aquifer Systems: Application to the San Joaquin Valley, CA. Geophys. Res. Lett. 2019, 46, 10800–10809. [Google Scholar] [CrossRef]
- Van Dam, T.; Wahr, J.; Milly, P.C.; Shmakin, A.B.; Blewitt, G.; Lavallée, D.; Larson, K.M. Crustal displacements due to continental water loading. Geophys. Res. Lett. 2001, 28, 651–654. [Google Scholar] [CrossRef]
- Meertens, C.M.; Puskas, C.M.; Molnar, C.; Phillips, D.A. Analysis of Drought-Related Hydrologic Loading Signals from Plate Boundary Observatory GPS Stations in the Sierra Nevada Mountains; UNAVCO, Inc.: Boulder, CO, USA, 2016. [Google Scholar]
- Galloway, D.L.; Jones, D.R.; Ingebritsen, S.E. Land Subsidence in the United States; US Geological Survey: Denver, CO, USA, 1999; Volume 1182.
- Terzaghi, K.; Peck, R.B.; Mesri, G. Soil Mechanics in Engineering Practice; John Wiley & Sons: Hoboken, NJ, USA, 1996. [Google Scholar]
- Eriksson, D.; Macmillan, D.S. Continental hydrology loading observed by VLBI measurements. J. Geod. 2014, 88, 675–690. [Google Scholar] [CrossRef]
- van Dam, T.; Collieux, X.; Altamimi, Z.; Ray, J. A review of GPS and GRACE estimates of surface mass loading effects. In Proceedings of the European Geosciences Union General Assembly 2011, Vienna, Austria, 3–8 April 2011. [Google Scholar]
- Gahalaut, V.; Yadav, R.K.; Sreejith, K.; Gahalaut, K.; Burgmann, R.; Agrawal, R.; Sati, S.; Kumar, A. InSAR and GPS measurements of crustal deformation due to seasonal loading of Tehri reservoir in Garhwal Himalaya, India. Geophys. J. Int. 2017, 209, 425–433. [Google Scholar] [CrossRef][Green Version]
- Jaramillo, F.; Brown, I.; Castellazzi, P.; Espinosa, L.F.; Guittard, A.; Hong, S.-H.; Rivera-Monroy, V.H.; Wdowinski, S. Assessment of hydrologic connectivity in an ungauged wetland with InSAR observations. Environ. Res. Lett. 2018, 13, 024003. [Google Scholar] [CrossRef]
- Liu, D.; Wang, X.; Jaramillo, F.; Yi, Y.; Li, C.; Yang, Z. A probabilistic conceptual model to attribute runoff variations to human activity. Hydrol. Sci. J. 2020. [Google Scholar] [CrossRef]
- Palomino-Ángel, S.; Anaya, J.A.; Simard, M.; Liao, T.-H.; Jaramillo, F. Analysis of Floodplain Dynamics in the Atrato River Colombia Using SAR Interferometry. Water 2019, 11, 875. [Google Scholar] [CrossRef]
- Ruiz-Armenteros, A.M.; Lazecky, M.; Hlaváčová, I.; Bakoň, M.; Delgado, J.M.; Sousa, J.J.; Lamas-Fernández, F.; Marchamalo, M.; Caro-Cuenca, M.; Papco, J.; et al. Deformation monitoring of dam infrastructures via spaceborne MT-InSAR. The case of La Viñuela (Málaga, southern Spain). Procedia Comput. Sci. 2018, 138, 346–353. [Google Scholar] [CrossRef]
- Darvishi, M.; Schlögel, R.; Bruzzone, L.; Cuozzo, G. Integration of PSI, MAI, and Intensity-Based Sub-Pixel Offset Tracking Results for Landslide Monitoring with X-Band Corner Reflectors—Italian Alps (Corvara). Remote Sens. 2018, 10, 409. [Google Scholar] [CrossRef]
- Hanssen, R.F. Radar Interferometry: Data Interpretation and Error Analysis; Springer Science & Business Media: Dordrecht, The Netherlands, 2001; Volume 1. [Google Scholar]
- Darvishi, M.; Cuozzo, G.; Bruzzone, L.; Nilfouroushan, F. Performance evaluation of phase and weather-based models in atmospheric correction with Sentinel-1data: Corvara landslide in the Alps. IEEE J. Sel. Top. Appl. Earth Obs. Remote Sens. 2020, 13, 1332–1346. [Google Scholar] [CrossRef]
- Solano-Rojas, D.; Wdowinski, S.; Cabral-Cano, E.; Osmanoğlu, B. Detecting differential ground displacements of civil structures in fast-subsiding metropolises with interferometric SAR and band-pass filtering. Sci. Rep. 2020, 10, 1–14. [Google Scholar] [CrossRef] [PubMed]
- Bell, J.W.; Amelung, F.; Ferretti, A.; Bianchi, M.; Novali, F. Permanent scatterer InSAR reveals seasonal and long-term aquifer-system response to groundwater pumping and artificial recharge. Water Resour. Res. 2008, 44. [Google Scholar] [CrossRef]
- Motagh, M.; Walter, T.R.; Sharifi, M.A.; Fielding, E.; Schenk, A.; Anderssohn, J.; Zschau, J. Land subsidence in Iran caused by widespread water reservoir overexploitation. Geophys. Res. Lett. 2008, 35, 16403. [Google Scholar] [CrossRef]
- Calderhead, A.I.; Martel, A.; Alasset, P.-J.; Rivera, A.; Garfias, J. Land subsidence induced by groundwater pumping, monitored by D-InSAR and field data in the Toluca Valley, Mexico. Can. J. Remote Sens. 2010, 36, 9–23. [Google Scholar] [CrossRef]
- Calderhead, A.I.; Therrien, R.; Rivera, A.; Martel, R.; Garfias, J. Simulating pumping-induced regional land subsidence with the use of InSAR and field data in the Toluca Valley, Mexico. Adv. Water Resour. 2011, 34, 83–97. [Google Scholar] [CrossRef]
- Erban, E.L.; Gorelick, S.M.; Zebker, A.H. Groundwater extraction, land subsidence, and sea-level rise in the Mekong Delta, Vietnam. Environ. Res. Lett. 2014, 9, 084010. [Google Scholar] [CrossRef]
- Castellazzi, P.; Martel, R.; Rivera, A.; Huang, J.; Pavlic, G.; Calderhead, A.I.; Chaussard, E.; Garfias, J.; Salas, J. Groundwater depletion in Central Mexico: Use of GRACE and InSAR to support water resources management. Water Resour. Res. 2016, 52, 5985–6003. [Google Scholar] [CrossRef]
- Ruiz-Constán, A.; Ruiz-Armenteros, A.M.; Lamas-Fernández, F.; Martos-Rosillo, S.; Delgado, J.M.; Bekaert, D.P.S.; Sousa, J.J.; Gil, A.J.; Cuenca, M.C.; Hanssen, R.F.; et al. Multi-temporal InSAR evidence of ground subsidence induced by groundwater withdrawal: The Montellano aquifer (SW Spain). Environ. Earth Sci. 2016, 75, 1–16. [Google Scholar] [CrossRef]
- Bejar-Pizarro, M.; Ezquerro, P.; Herrera, G.; Tomás, R.; Guardiola-Albert, C.; Hernández, J.M.R.; Fernández-Merodo, J.; Marchamalo, M.; Martínez, R. Mapping groundwater level and aquifer storage variations from InSAR measurements in the Madrid aquifer, Central Spain. J. Hydrol. 2017, 547, 678–689. [Google Scholar] [CrossRef]
- Siles, G.; Trudel, M.; Peters, D.L.; Leconte, R. Hydrological monitoring of high-latitude shallow water bodies from high-resolution space-borne D-InSAR. Remote Sens. Environ. 2020, 236, 111444. [Google Scholar] [CrossRef]
- Saleh, M.; Masson, F.; Mohamed, A.-M.S.; Boy, J.-P.; Abou-Aly, N.; Rayan, A. Recent ground deformation around lake Nasser using GPS and InSAR, Aswan, Egypt. Tectonophysics 2018, 744, 310–321. [Google Scholar] [CrossRef]
- Zhao, W.; Amelung, F.; Doin, M.-P.; Dixon, T.H.; Wdowinski, S.; Lin, G. InSAR observations of lake loading at Yangzhuoyong Lake, Tibet: Constraints on crustal elasticity. Earth Planet. Sci. Lett. 2016, 449, 240–245. [Google Scholar] [CrossRef]
- Zhou, J.; Li, Z.; He, X.; Tian, B.; Huang, L.; Chen, Q.; Xing, Q. Glacier Thickness Change Mapping Using InSAR Methodology. IEEE Geosci. Remote Sens. Lett. 2013, 11, 44–48. [Google Scholar] [CrossRef]
- Zhao, W.; Amelung, F.; Dixon, T.H.; Wdowinski, S. Sensing the bed-rock movement due to ice unloading from space using InSAR time-series. AGU Fall Meet. Abstr. 2014, 1, 0322. [Google Scholar]
- Liu, L.; Wahr, J.; Howat, I.M.; Khan, S.A.; Joughin, I.; Furuya, M. Constraining ice mass loss from Jakobshavn Isbrae (Greenland) using InSAR-measured crustal uplift. Geophys. J. Int. 2012, 188, 994–1006. [Google Scholar] [CrossRef][Green Version]
- Furuya, M.; Wahr, J.M. Water level changes at an ice-dammed lake in west Greenland inferred from InSAR data. Geophys. Res. Lett. 2005, 32. [Google Scholar] [CrossRef]
- Cavalié, O.; Doin, M.-P.; Lasserre, C.; Briole, P. Ground motion measurement in the Lake Mead area, Nevada, by differential synthetic aperture radar interferometry time series analysis: Probing the lithosphere rheological structure. J. Geophys. Res. Space Phys. 2007, 112, 1–18. [Google Scholar] [CrossRef]
- Kaufmann, G.; Amelung, F. Reservoir-induced deformation and continental rheology in vicinity of Lake Mead, Nevada. J. Geophys. Res. Space Phys. 2000, 105, 16341–16358. [Google Scholar] [CrossRef]
- Neelmeijer, J.; Schöne, T.; Dill, R.; Klemann, V.; Motagh, M. Ground Deformations around the Toktogul Reservoir, Kyrgyzstan, from Envisat ASAR and Sentinel-1 Data—A Case Study about the Impact of Atmospheric Corrections on InSAR Time Series. Remote Sens. 2018, 10, 462. [Google Scholar] [CrossRef]
- Geod, D. Daniel Wujanz Terrestrial Laser Scanning for Geodetic Deformation Monitoring; Technische Universitaet Berlin: Berlin, Germany, 2016; ISBN 9783769651874. [Google Scholar]
- Milillo, P.; Perissin, D.; Salzer, J.T.; Lundgren, P.; Lacava, G.; Milillo, G.; Di Serio, C. Monitoring dam structural health from space: Insights from novel InSAR techniques and multi-parametric modeling applied to the Pertusillo dam Basilicata, Italy. Int. J. Appl. Earth Obs. Geoinf. 2016, 52, 221–229. [Google Scholar] [CrossRef]
- Zhou, W.; Li, S.; Zhou, Z.; Chang, X. InSAR Observation and Numerical Modeling of the Earth-Dam Displacement of Shuibuya Dam (China). Remote Sens. 2016, 8, 877. [Google Scholar] [CrossRef]
- Milillo, P.; Bürgmann, R.; Lundgren, P.; Salzer, J.; Perissin, D.; Fielding, E.; Biondi, F.; Milillo, G. Space geodetic monitoring of engineered structures: The ongoing destabilization of the Mosul dam, Iraq. Sci. Rep. 2016, 6, 37408. [Google Scholar] [CrossRef]
- Turner, K.; Rosen, M.R.; Holdren, G.C.; Goodbred, S.L.; Twichell, D.C. Environmental Setting of Lake Mead National Recreation Area: Chapter 2 in A synthesis of Aquatic Science for Management of Lakes Mead and Mohave; US Geological Survey: Reston, VA, USA, 2012; No. 1381-2; pp. 7–22.
- Christensen, N.S.; Lettenmaier, D.P. A multimodel ensemble approach to assessment of climate change impacts on the hydrology and water resources of the Colorado River Basin. Hydrol. Earth Syst. Sci. 2007, 11, 1417–1434. [Google Scholar] [CrossRef]
- Livneh, B.; Rosenberg, E.A.; Lin, C.; Nijssen, B.; Mishra, V.; Andreadis, K.M.; Maurer, E.P.; Lettenmaier, D.P. A Long-Term Hydrologically Based Dataset of Land Surface Fluxes and States for the Conterminous United States: Update and Extensions. J. Clim. 2013, 26, 9384–9392. [Google Scholar] [CrossRef]
- Hoover-Dam-Photo. Available online: https://www.usbr.gov/lc/hooverdam/ (accessed on 20 September 2020).
- Felger, T.J.; Beard, L.S.; Umhoefer, P.J.; Lamb, M.A. Geologic map of Lake Mead and surrounding regions, southern Nevada, southwestern Utah, and northwestern Arizona. Geol. Soc. Am. Spec. Papers 2010, 463, 29–38. [Google Scholar] [CrossRef]
- Twichell, D.C.; Cross, V.A.; Rudin, M.J.; Parolski, K.F. Surficial Geology and Distribution of Post-Impoundment Sediment of the Western Part of Lake Mead Based on a Sidescan Sonar and High-Resolution Seismic-Reflection Survey (No. 99-581); US Geological Survey: Reston, VA, USA, 1999.
- Angelier, J.; Colletta, B.; Anderson, R.E. Neogene paleostress changes in the Basin and Range: A case study at Hoover Dam, Nevada-Arizona. GSA Bull. 1985, 96, 347–361. [Google Scholar] [CrossRef]
- Berardino, P.; Fornaro, G.; Lanari, R.; Sansosti, E. A new algorithm for surface deformation monitoring based on small baseline differential SAR interferograms. IEEE Trans. Geosci. Remote Sens. 2002, 40, 2375–2383. [Google Scholar] [CrossRef]
- Ferretti, A.; Prati, C.; Rocca, F. Permanent scatterers in SAR interferometry. IEEE Trans. Geosci. Remote Sens. 2001, 39, 8–20. [Google Scholar] [CrossRef]
- Blewitt, G.; Hammond, W.C. Harnessing the GPS Data Explosion for Interdisciplinary Science. Eos 2018, 99, 1–2. [Google Scholar] [CrossRef]
- Revelle, R.; Waggoner, P. Effects of a Carbon Dioxide-Induced Climatic Change on Water Supplies in 7 the Western United States. Month 1983, 419, 432. [Google Scholar]
- Sensitivity_of_streamflow_in_the_Colorado 1991. Available online: https://www.gleick.com/ (accessed on 25 September 2020).
- Seager, R.; Ting, M.; Held, I.; Kushnir, Y.; Lu, J.; Vecchi, G.; Huang, H.-P.; Harnik, N.; Leetmaa, A.; Lau, N.-C.; et al. Model Projections of an Imminent Transition to a More Arid Climate in Southwestern North America. Science 2007, 316, 1181–1184. [Google Scholar] [CrossRef] [PubMed]
- Mead-Lake-Water-Level-Data. Available online: https://lakemead.water-data.com/ (accessed on 25 September 2020).
- Pepe, A.; Lanari, R. On the Extension of the Minimum Cost Flow Algorithm for Phase Unwrapping of Multitemporal Differential SAR Interferograms. IEEE Trans. Geosci. Remote Sens. 2006, 44, 2374–2383. [Google Scholar] [CrossRef]
- Fialko, Y.; Simons, M.; Agnew, D. The complete (3-D) surface displacement field in the epicentral area of the 1999MW7.1 Hector Mine Earthquake, California, from space geodetic observations. Geophys. Res. Lett. 2001, 28, 3063–3066. [Google Scholar] [CrossRef]
- Peter, H.; Jäggi, A.; Fernández, J.; Escobar, D.; Ayuga, F.; Arnold, D.; Wermuth, M.; Hackel, S.; Otten, M.; Simons, W.; et al. Sentinel-1A—First precise orbit determination results. Adv. Space Res. 2017, 60, 879–892. [Google Scholar] [CrossRef]
- DEM(10-m). Available online: https://viewer.nationalmap.gov/basic. (accessed on 25 September 2020).
Publisher’s Note: MDPI stays neutral with regard to jurisdictional claims in published maps and institutional affiliations. |
© 2021 by the authors. Licensee MDPI, Basel, Switzerland. This article is an open access article distributed under the terms and conditions of the Creative Commons Attribution (CC BY) license (http://creativecommons.org/licenses/by/4.0/).

