1. Introduction
Mass movements (i.e., fall, topple, slide, spread, flow and slope deformation [
1]) are abundant and frequent worldwide, threatening human life and properties, with significant socio-economic losses [
2,
3]. Buildings located in unstable slopes are subjected to rigid rotations or angular distortions due to differential displacements [
4,
5]. Identifying and monitoring both building damages and slope movements is crucial for the implementation of effective risk mitigation strategies and urbanization and development plans [
5,
6].
Data collected by space-borne synthetic aperture radar (SAR) sensors and processed through multi-temporal interferometric SAR (MT-InSAR) techniques have become one of the most powerful tools to guarantee a systematic and comprehensive monitoring of surface displacements over large areas for long periods [
2,
7,
8,
9,
10,
11]. These techniques have been developed during the last two decades referring to two main approaches, persistent scatterer (PS, [
12,
13,
14]) and small baseline subset (SBAS, [
15,
16]), and can be used to measure surface displacements due to natural processes and human activities [
17,
18], removing the effects of atmosphere, topography, and signal noise. They have been used to monitor mass movements [
11,
19] and anthropogenic structures and infrastructures (e.g., buildings, dams, roads, bridges, and pipelines) affected by such phenomena [
10,
20,
21].
MT-InSAR techniques have been combined with in situ surveys, such as laser scanner acquisitions, structural analysis, building damage records, and crack pattern surveys, for monitoring landslide movements and their impacts on buildings in Moio della Civitella, Agrigento and San Fratello (Italy) [
5,
22,
23], and Arcos de la Frontera (Spain) [
24]. In situ investigations are very important to integrate and validate the results from remote sensing surveys, but they are not commonly used because costly and time consuming.
Thanks to the free and open dissemination strategy of Sentinel-1 SAR data at high temporal resolution and with global coverage, the long-term behavior of buildings and landslides can be monitored, and the deformation maps can be quickly generated and regularly updated every six days. However, Sentinel-1 data acquired in interferometric wide swath mode have spatial resolution of 5 by 20 m in range and azimuth, so that it is not possible to distinguish the backscattering features inside each image pixel. Therefore, in most cases monitoring deformations affecting single building located in landslide areas and understanding how such deformations are related to mass movements requires the integration of Sentinel-1 interferometry with ground-based data acquired through other monitoring techniques.
The main aim of this work is to propose a methodology to monitor the deformation of anthropic structures and infrastructures and the geological process that induces such deformation. To this end, different techniques are required because of the different size, characteristics and scale of investigation of the elements to monitor. In this paper, we provide an effective integration of the MT-InSAR results with global navigation satellite system (GNSS), topographic, terrestrial laser scanning (TLS) and terrestrial structure from motion photogrammetry (SfM) measurements, to monitor the stability of the buildings located along the unstable slope of Rovegliana village (north-eastern Italian pre-Alps). Sentinel-1 SAR data from 2014 to 2019 were processed through the SBAS technique to identify and monitor both the deformation of the buildings and the evolution of the mass movements. From October 2018 to October 2019, three GNSS surveys were carried out to measure ground displacement both in urban and non-urban areas. In the same period, three TLS and SfM surveys were performed to monitor two cracked buildings. Finally, MT-InSAR results integrated with GNSS, topographic, TLS and SfM measurements allowed the relationships between the kinematic evolution of the landslides and damage to the buildings to be investigated.
2. Study Area
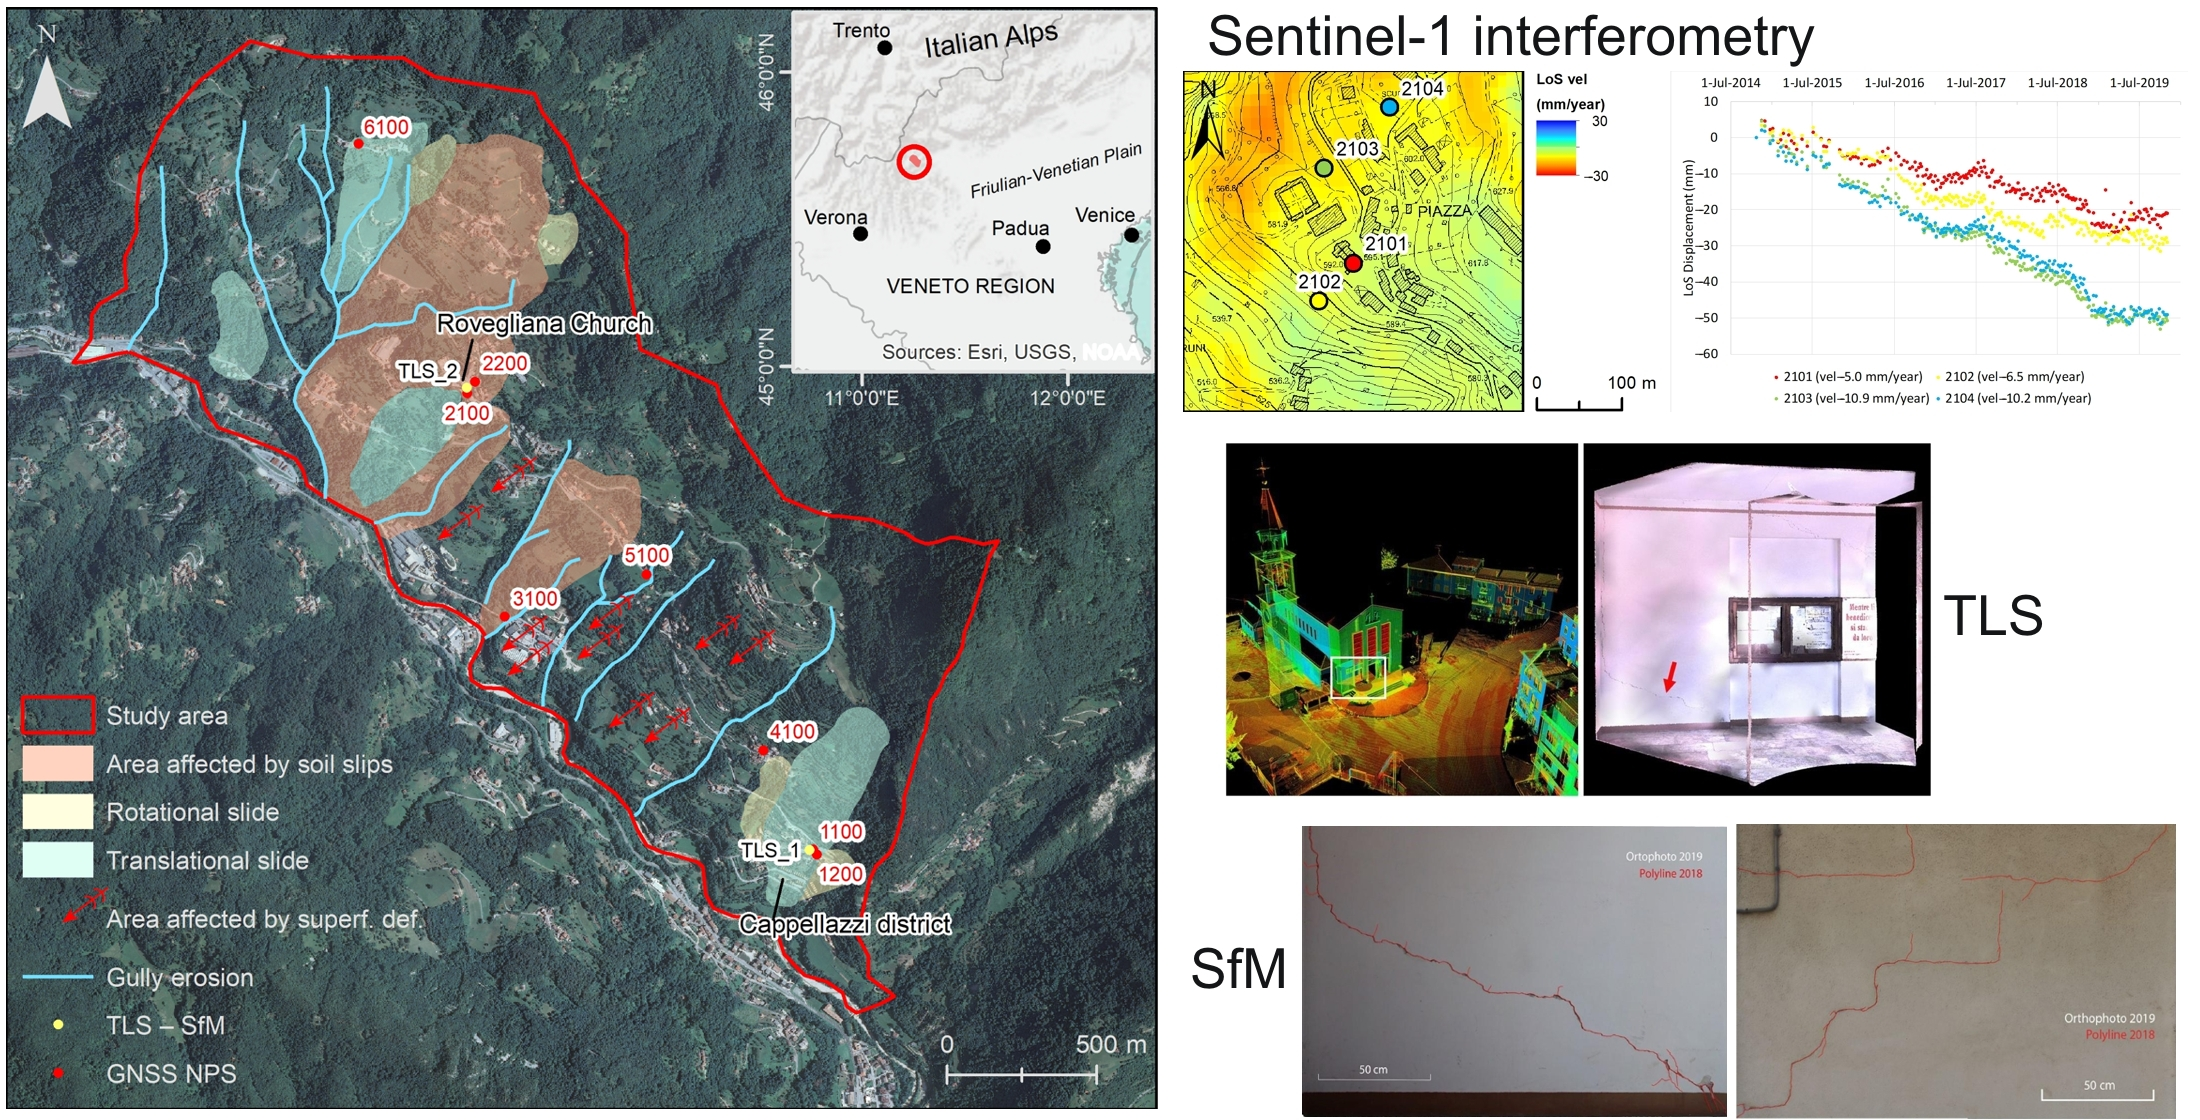
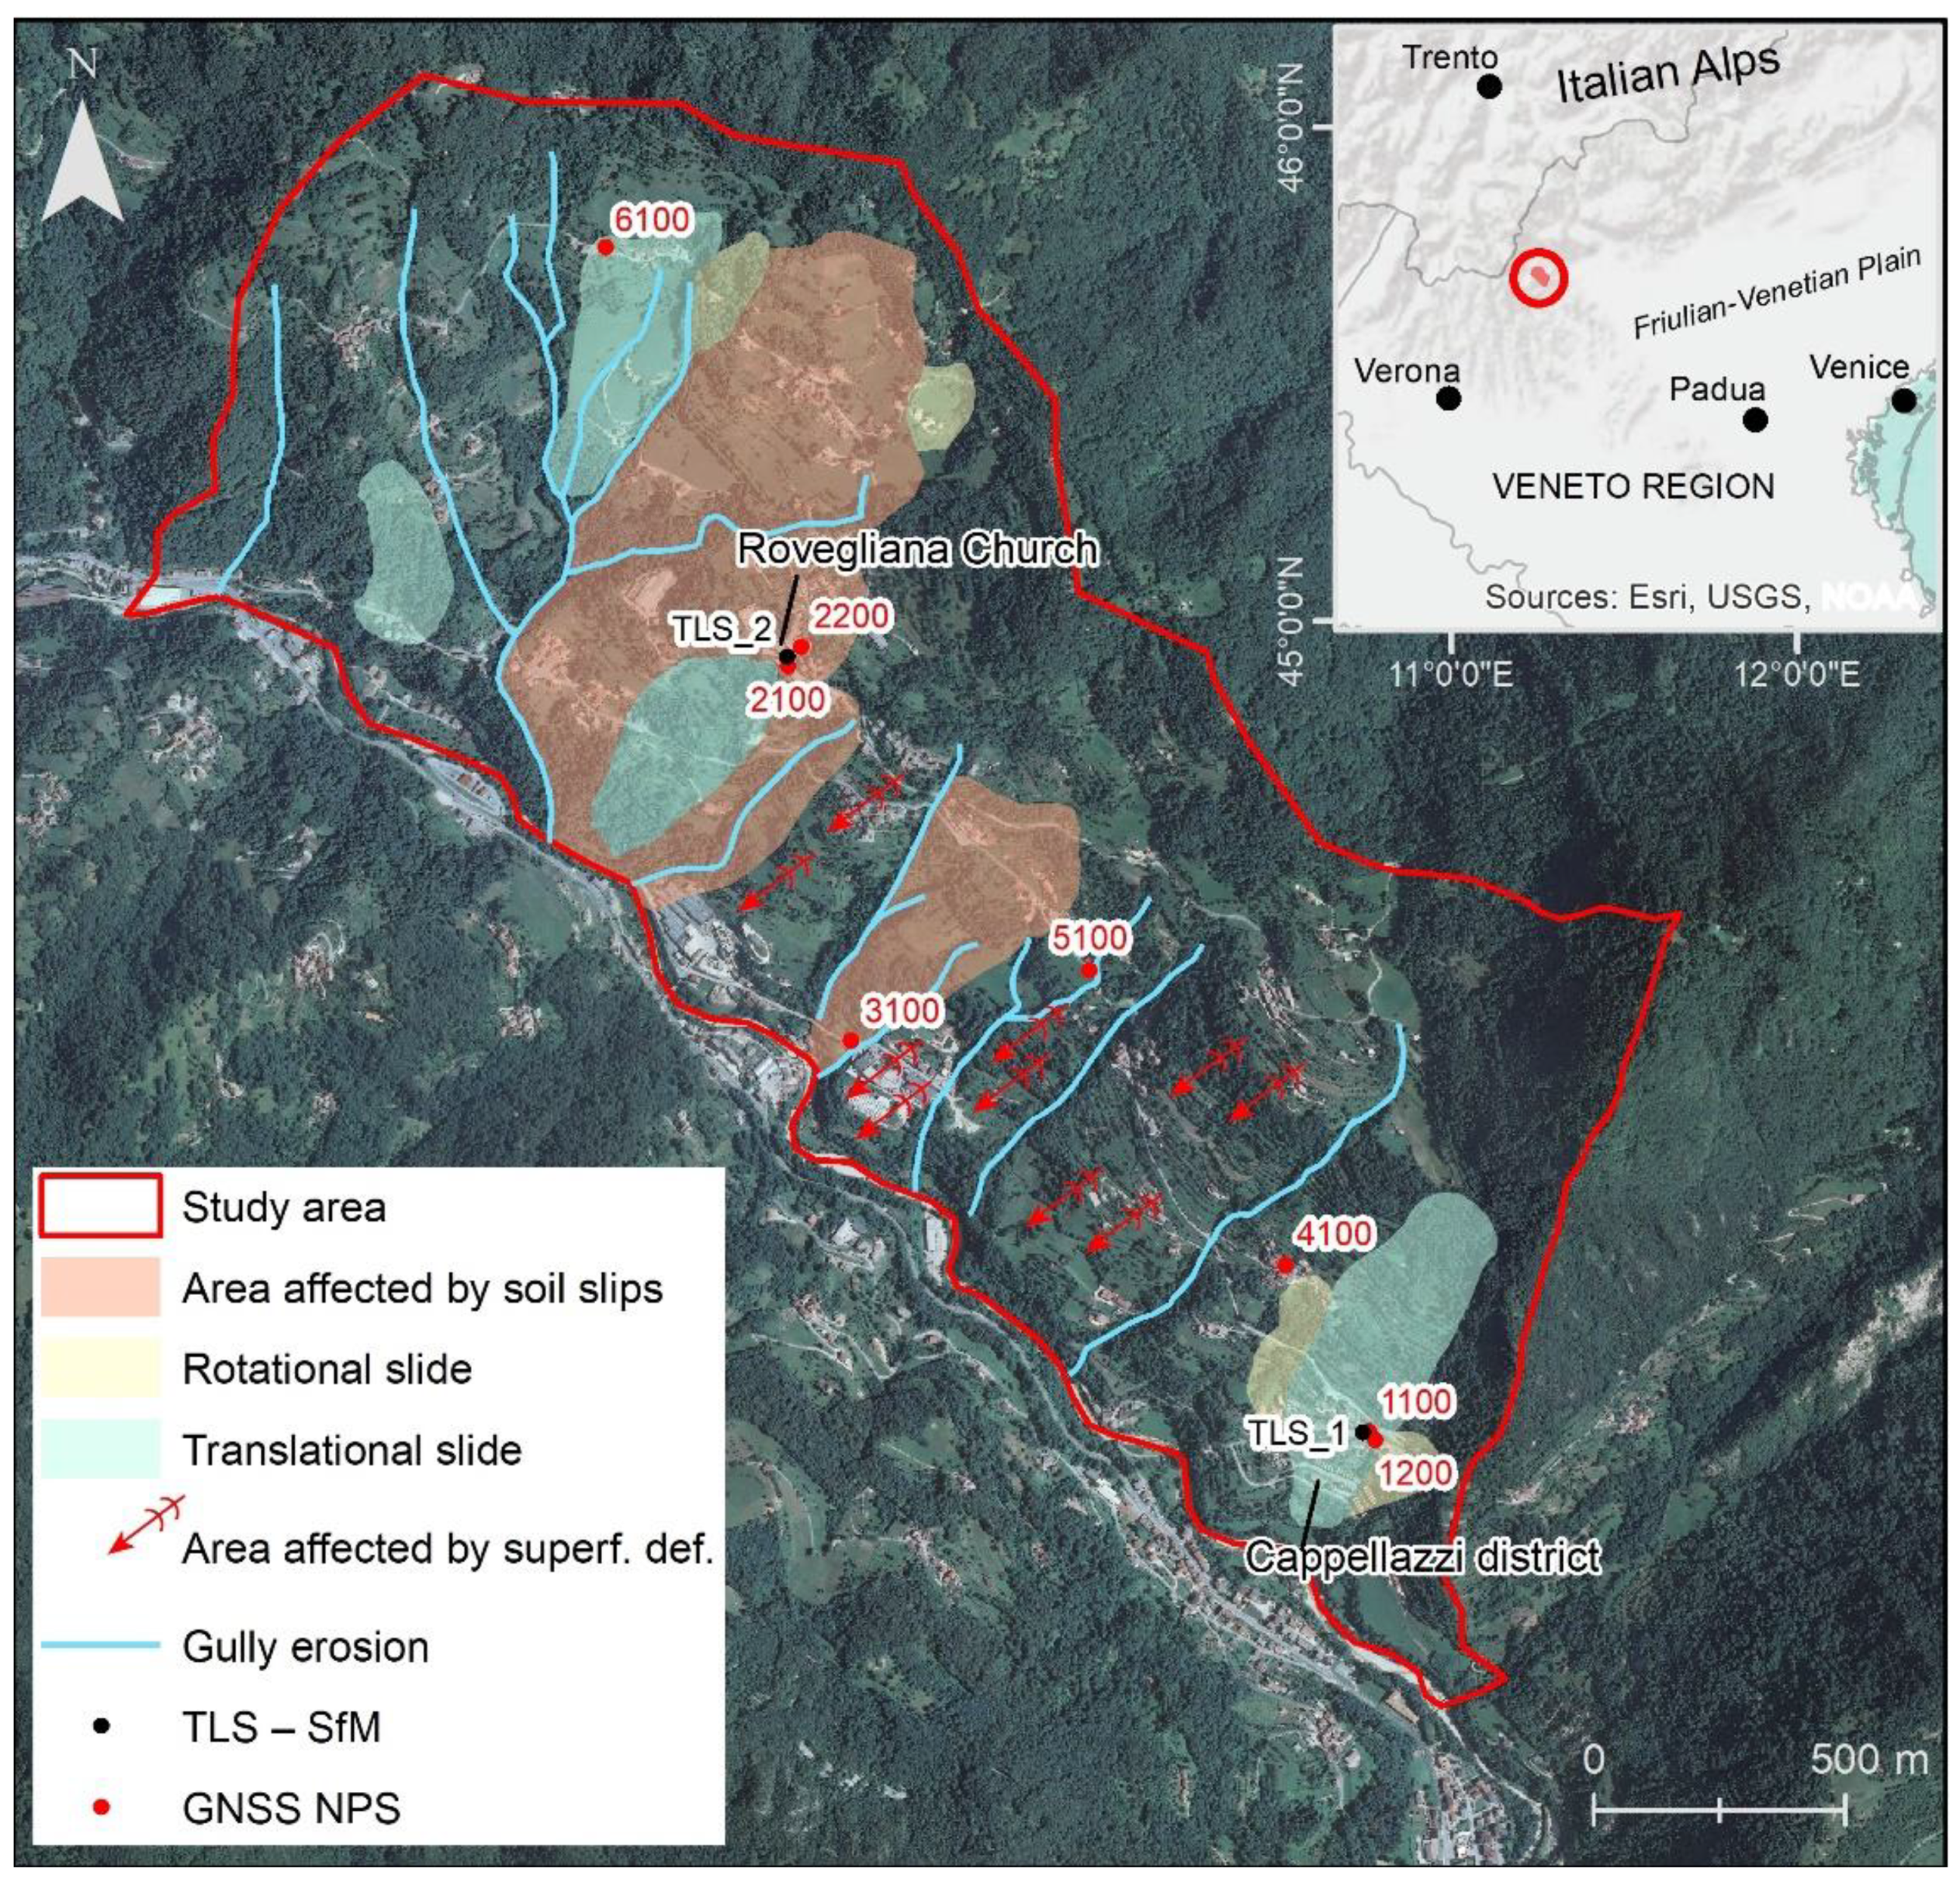
Rovegliana village is located on a slope in the north-eastern Italian pre-Alps (
Figure 1). The area under investigation is 4.2 km
2 wide, elevation ranges from 800–900 m on top to 400–330 m a.s.l. at the bottom of the slope, in correspondence of the Agno torrent, and slope gradient varies from 40° in the upper part to 20° in the lower, depending on the geological setting. The mean annual temperature and rainfall measured in the period 1994–2019 are 10.7 °C and 230 cm, respectively. There are two main wet seasons, from March to June (Spring) and from September to November (Autumn), but short-duration intense rainfall events can occur in summer (July and August). This area is not very urbanized, with several small agglomerates of houses and a minor road network present.
The bedrock of the slope is constituted by two heteropic formations deposited during middle Triassic: Recoaro limestone and Gracilis Formation. The first one outcrops in the upper part of the slope and is composed by limestones, marly and dolomitic limestones. The second one outcrops in the middle and lower part of the slope and consists of an alternance of sandy and marly limestones, interbedded with evaporitic dolomites. These formations have an average dip direction similar to the slope and are highly fractured due to the tectonic events that occurred during the Upper Triassic–Jurassic and the Alpine orogeny.
The whole area is characterized by the extensive outcrop of a debris cover up to 10 m thick, derived from eluvial/colluvial processes and mass movements. The grain size of the debris is very heterogeneous and it ranges from millimetric to decametric clasts immersed in a clayey and silty sand matrix. Locally, morphological evidences, such as bumps, dips, and sudden changes in the slope gradient, reveal the presence of large boulders in the debris, dislocated from the Triassic calcareous formation located at the top of the area.
The slope instabilities were identified through in situ investigations, aerial photos interpretation, GNSS and InSAR surveys [
25,
26]. They consist of translational and rotational slides, soil slips and superficial slow deformations (creep) mainly involving the debris cover (
Figure 1). Slide phenomena and soil slips have a high state of activity and mainly occur in the wet seasons after rainfall events. Superficial deformations have displacement rates of few millimeters per year as measured in our previous GNSS and InSAR surveys [
25,
26] and do not show clear geomorphological evidences, but movements result in damages to buildings, walls and road network, and upward curvature of trees.
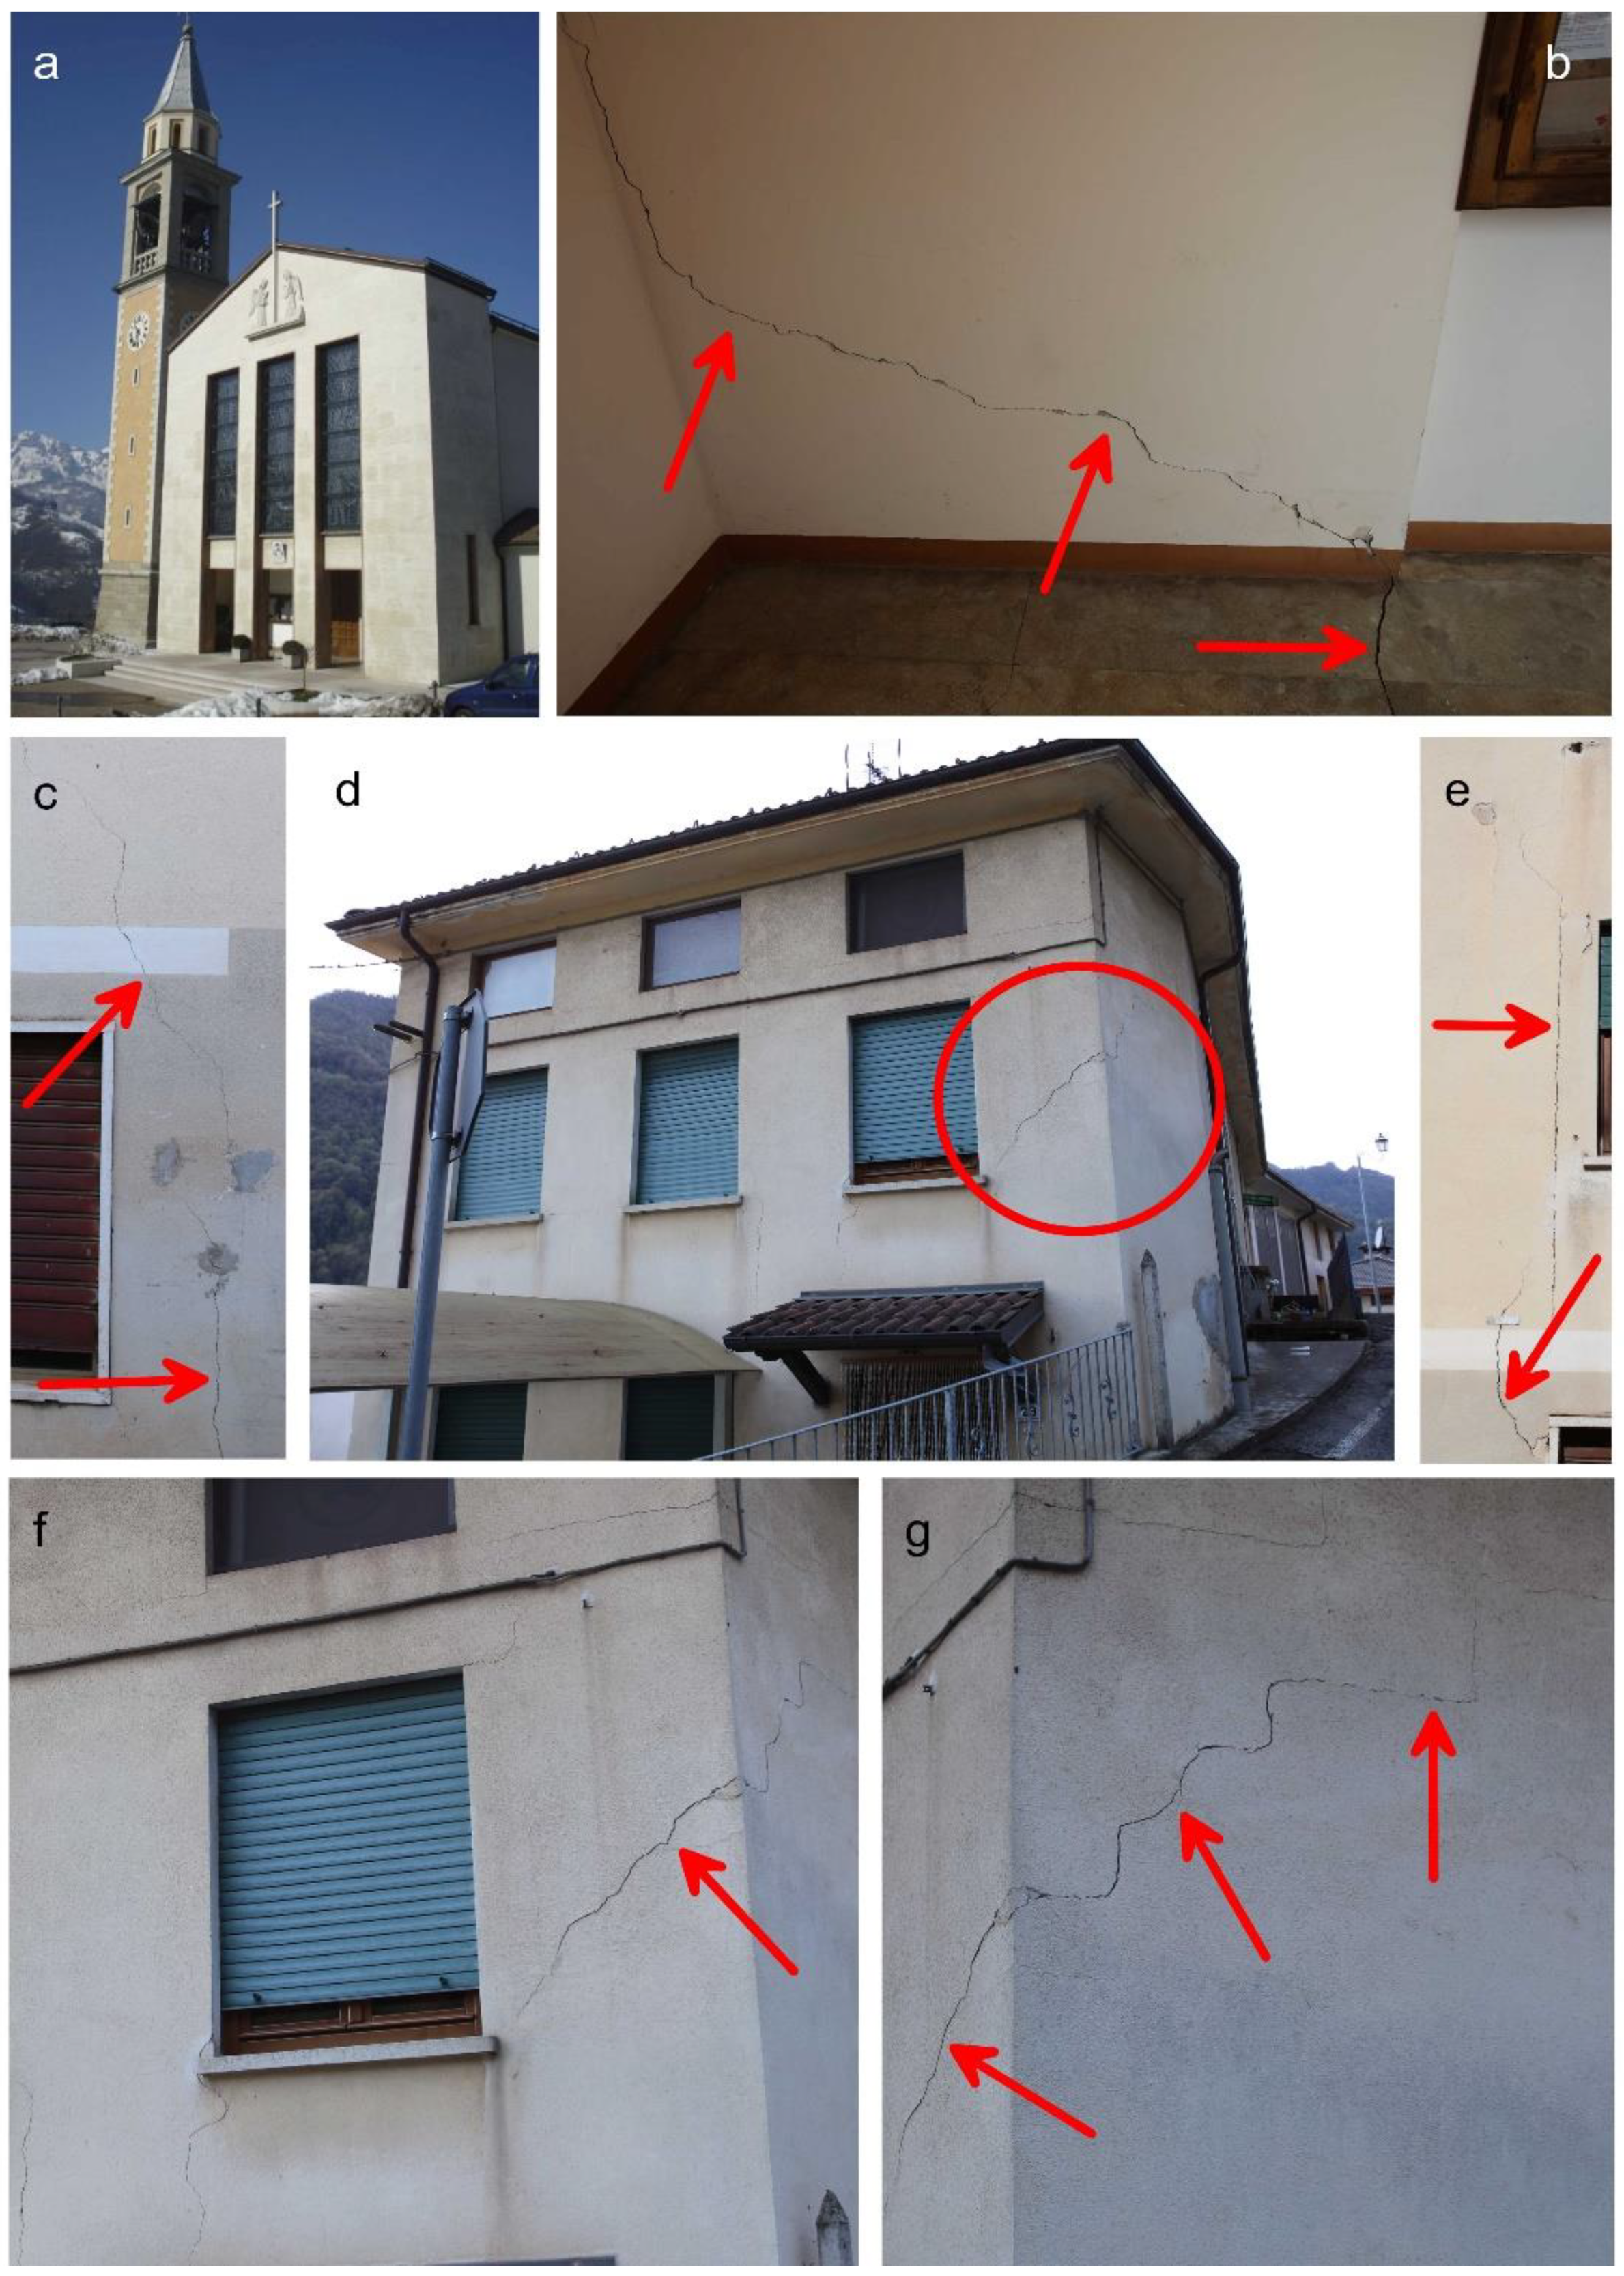
In this work, two masonry structures affected by relevant crack patterns due to mass movements were investigated in detail: Rovegliana Church and a building located in Cappellazzi district (
Figure 1 and
Figure 2). The two structures were built using standard masonry formed by bricks and concrete blocks. Many documents about the history of Rovegliana village and in particular its Church are available, but the current building was built in 1963. It covers an area of about 540 m
2 with a height of 14 m. The building located in Cappellazzi was built in the seventies of the last century; it covers an area of about 130 m
2 with an average height of about 10 m.
3. Material and Methods
The methodologies applied in this work consist of satellite and ground-based measurements of displacements affecting the Rovegliana slope and the two damaged buildings investigated in detail. MT-InSAR techniques were used to monitor and explore the triggering factors of the instability phenomena and the damages to human structures and infrastructures. GNSS surveys were performed to integrate and verify interferometry results and provide a reference system for the multi-temporal TLS and SfM measurements which allowed to monitoring in great detail the behavior of the buildings.
3.1. Multi-Temporal Interferometric Synthetic Aperture Radar (MT-InSAR)
Ground deformation over the study area was measured using both ascending and descending Sentinel-1A and -1B C band images in interferometric wide swath mode, with a 12- or 6-day revisit time and a spatial resolution of 5 by 20 m in range and azimuth. Two hundred sixteen images acquired from ascending track 117 (24 October 2014 to 3 November 2019) and two hundred thirty-three images acquired from descending track 95 (30 March 2015 to 4 November 2019) were processed. The incident and heading angles of ascending orbit are about 39.08° and −10.17°, and those of descending orbit are about 43.77° and −170.87°, respectively.
The two representative classes of MT-InSAR approaches, PS and SBAS, mainly aim at eliminating atmospheric phase contributions, which are spatially correlated within a single SAR scene and temporally uncorrelated. However, above all, these techniques estimate surface motion considering the usually strong temporal correlation of deformation phenomena [
27].
The PS technique, first proposed by Ferretti et al. [
12], generates differential interferograms referred to one common master identifying persistent point-wise reflectors, such as manmade structures and rocks. In general, PS InSAR performs better in urban and nearby areas, where the number of persistent scatters is higher than in natural terrain [
27].
The SBAS technique, first proposed by Berardino et al. [
15], relies on an appropriate combination of image pairs with small spatial and temporal baseline, overcoming some of the limitations of atmospheric effects and detecting the temporal evolution of the surface deformations. This approach is more effective in the case of spatially correlated deformations. Moreover, it increases the spatial coverage, especially in non-urban areas [
28].
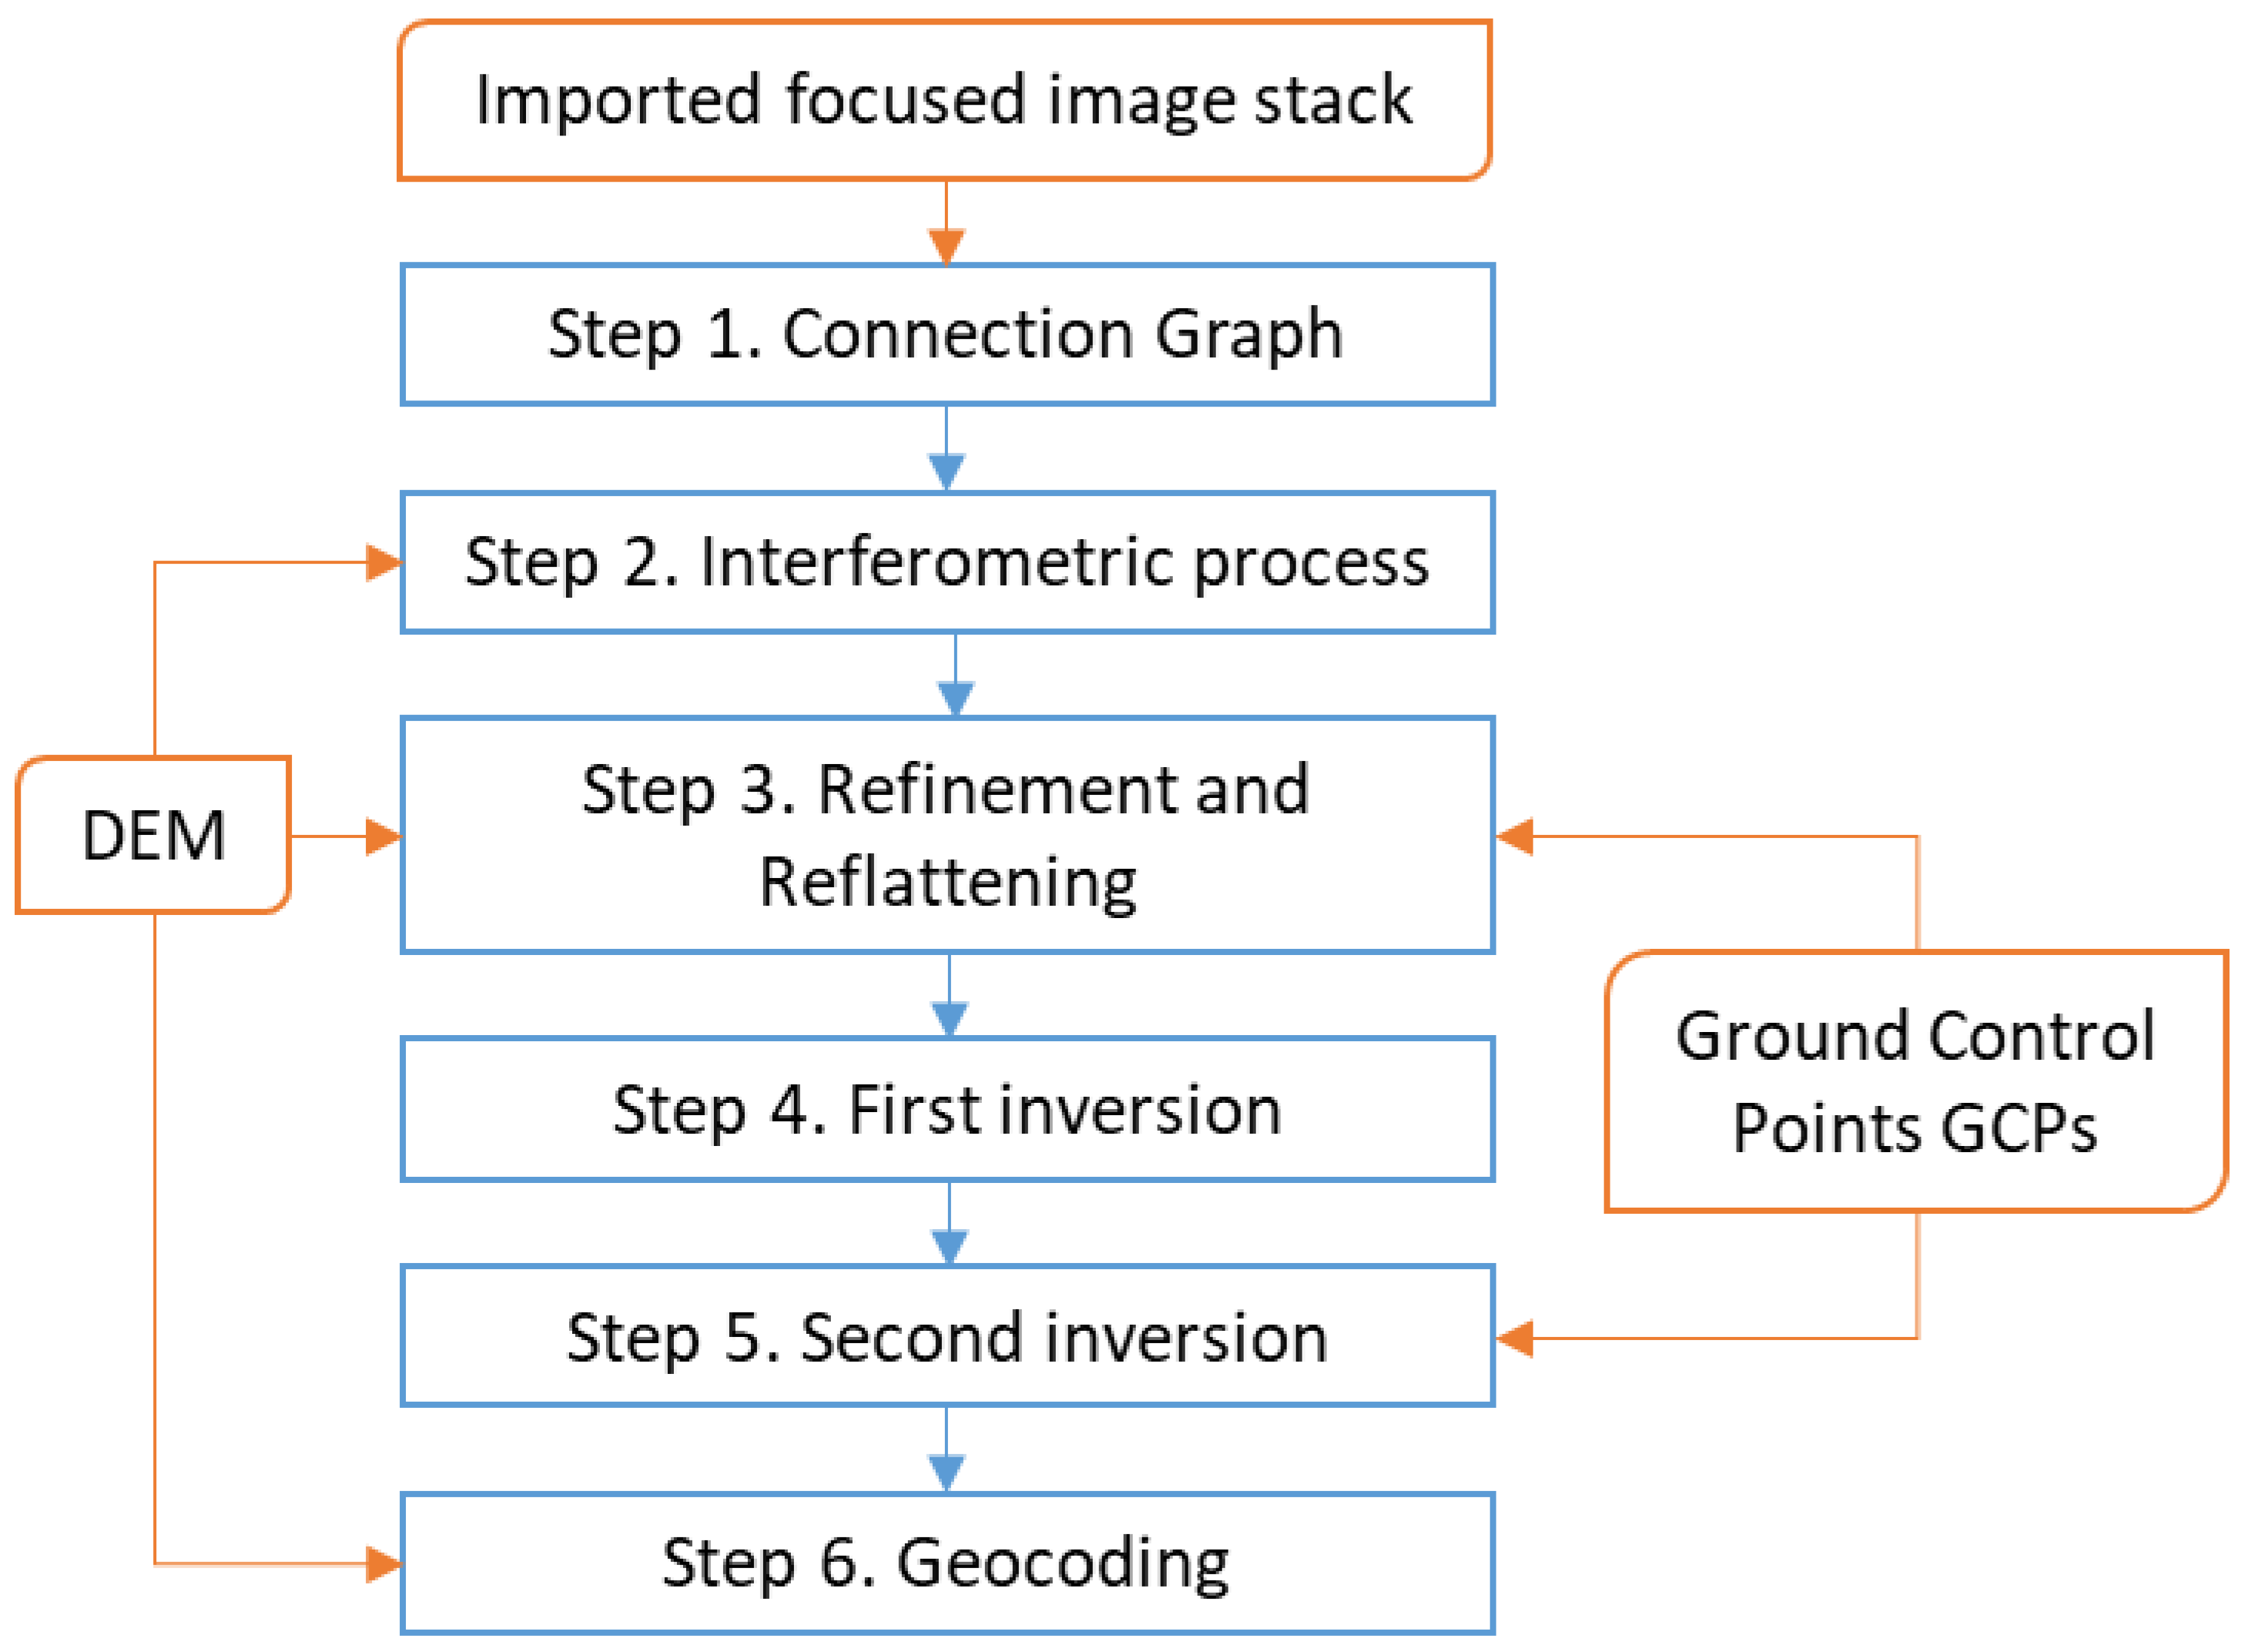
In this study, SBAS technique was applied to get information both on urban and non-urban areas to better monitor mass movements and observe the behavior of most of the slope. The SBAS processing workflow adopted in SARscape was used (
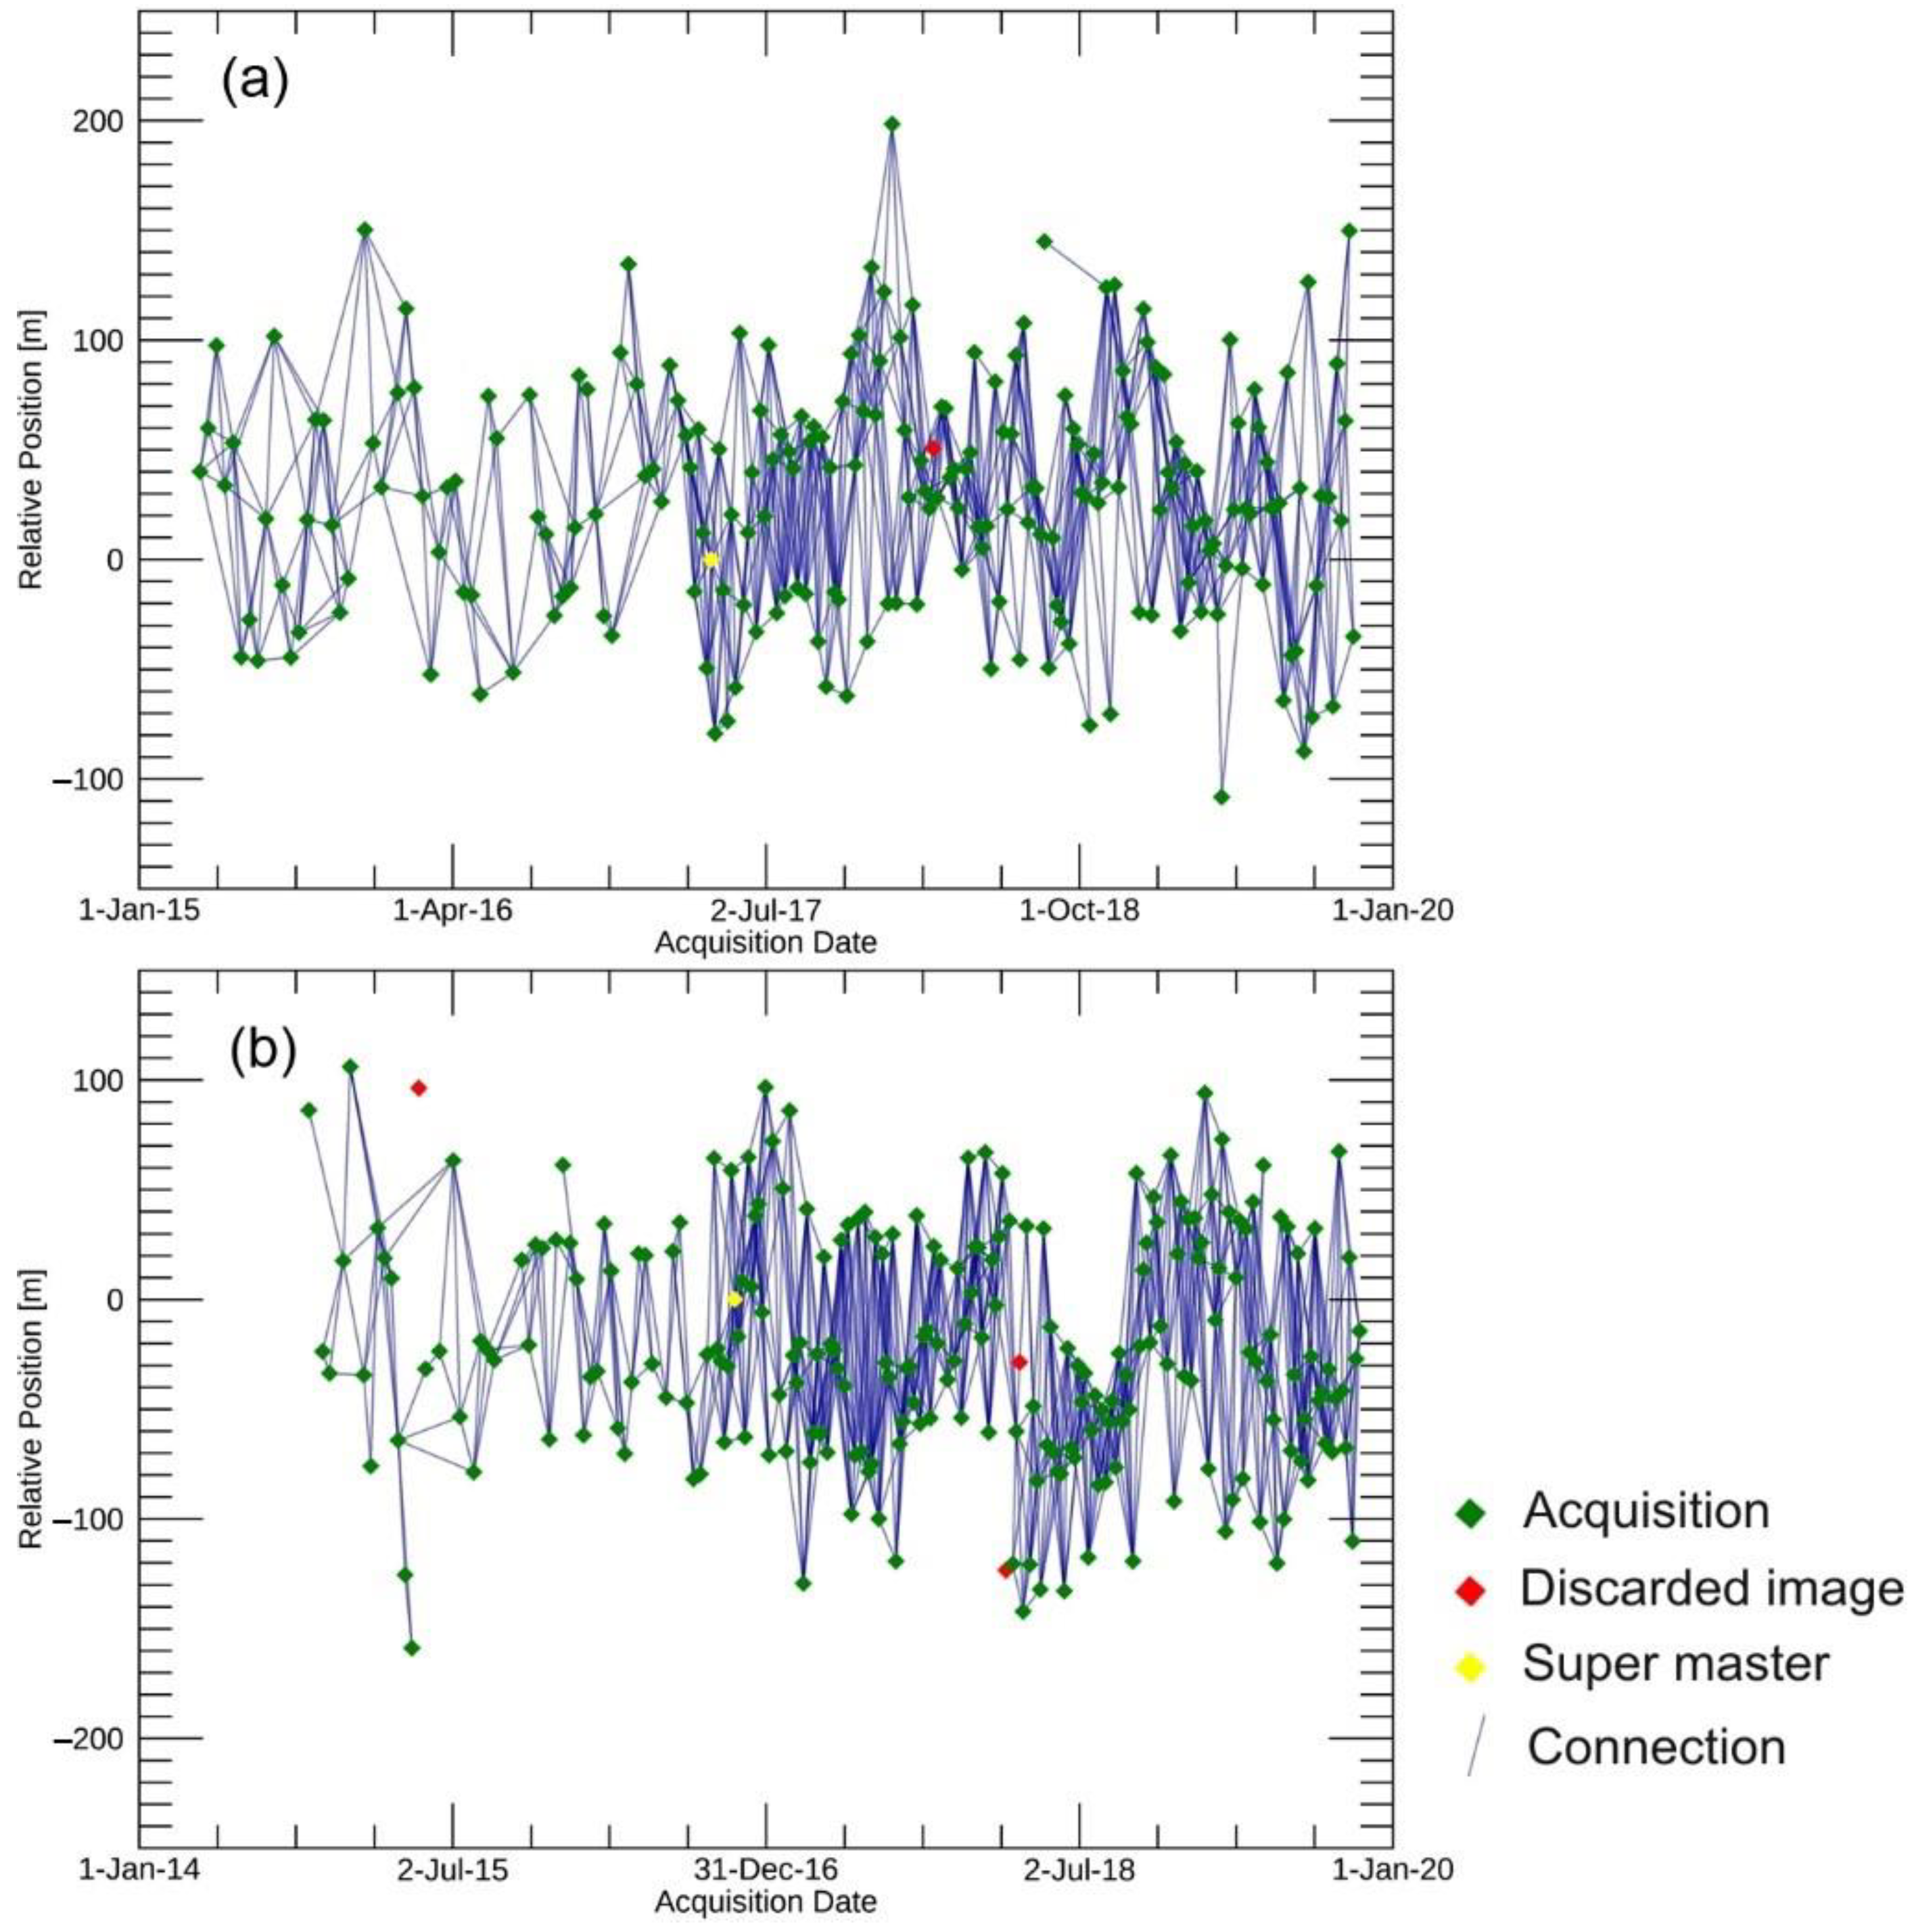
Figure 3). In the first step, a network of reference and secondary image pairs is defined using temporal and perpendicular baseline constraints (
Figure 4); the second step consists of images co-registration and interferograms generation (with the subtraction of topographic low frequencies), filtering and unwrapping for each pair; inaccuracies due to satellites orbits and phase ramps are removed in the third step; mean heights and velocities are estimated and used to re-flatten each interferogram in the first inversion (step 4); atmospheric corrections are performed in the second inversion (step 5), then displacements and heights (correction values and new elevation) related products are generated; finally, all processing results are geocoded in the selected cartographic system.
The topographic phase correction and geocoding processing were run using the 1-arc digital elevation model (DEM) from the Shuttle Radar Topography Mission (SRTM). We primarily generated 923 and 837 interferograms for descending and ascending, respectively, with a maximum temporal baseline of 36 days and a maximum perpendicular baseline of 120 m. Some acquisitions were discarded (red points in
Figure 4) both in the ascending and descending datasets, due to the low coherence of most of the interferograms involving such acquisitions. The low coherence, below the threshold set in the processing (0.35), could be related to strong surface variations induced by extreme weather conditions.
The interferograms were filtered through the Goldstein method [
29]. The alpha min and alpha max, which means the exponents applied to the power spectrum of the coherent (coherence = 1) and incoherent (coherence = 0) pixels, were set to 0.3 and 3, respectively. The value of alpha applied to each pixel varies linearly between the specified minimum and maximum values: the higher the alpha min and alpha max, the stronger is the filter smoothing [
30]. The filter window size was set to 64 pixels. The SBAS inversion was run using a disconnected approach, allowing the inversion also in case of some temporally sparse coherence drops, setting the percentage of interferograms and the minimum valid acquisitions to 60% and 95%, respectively.
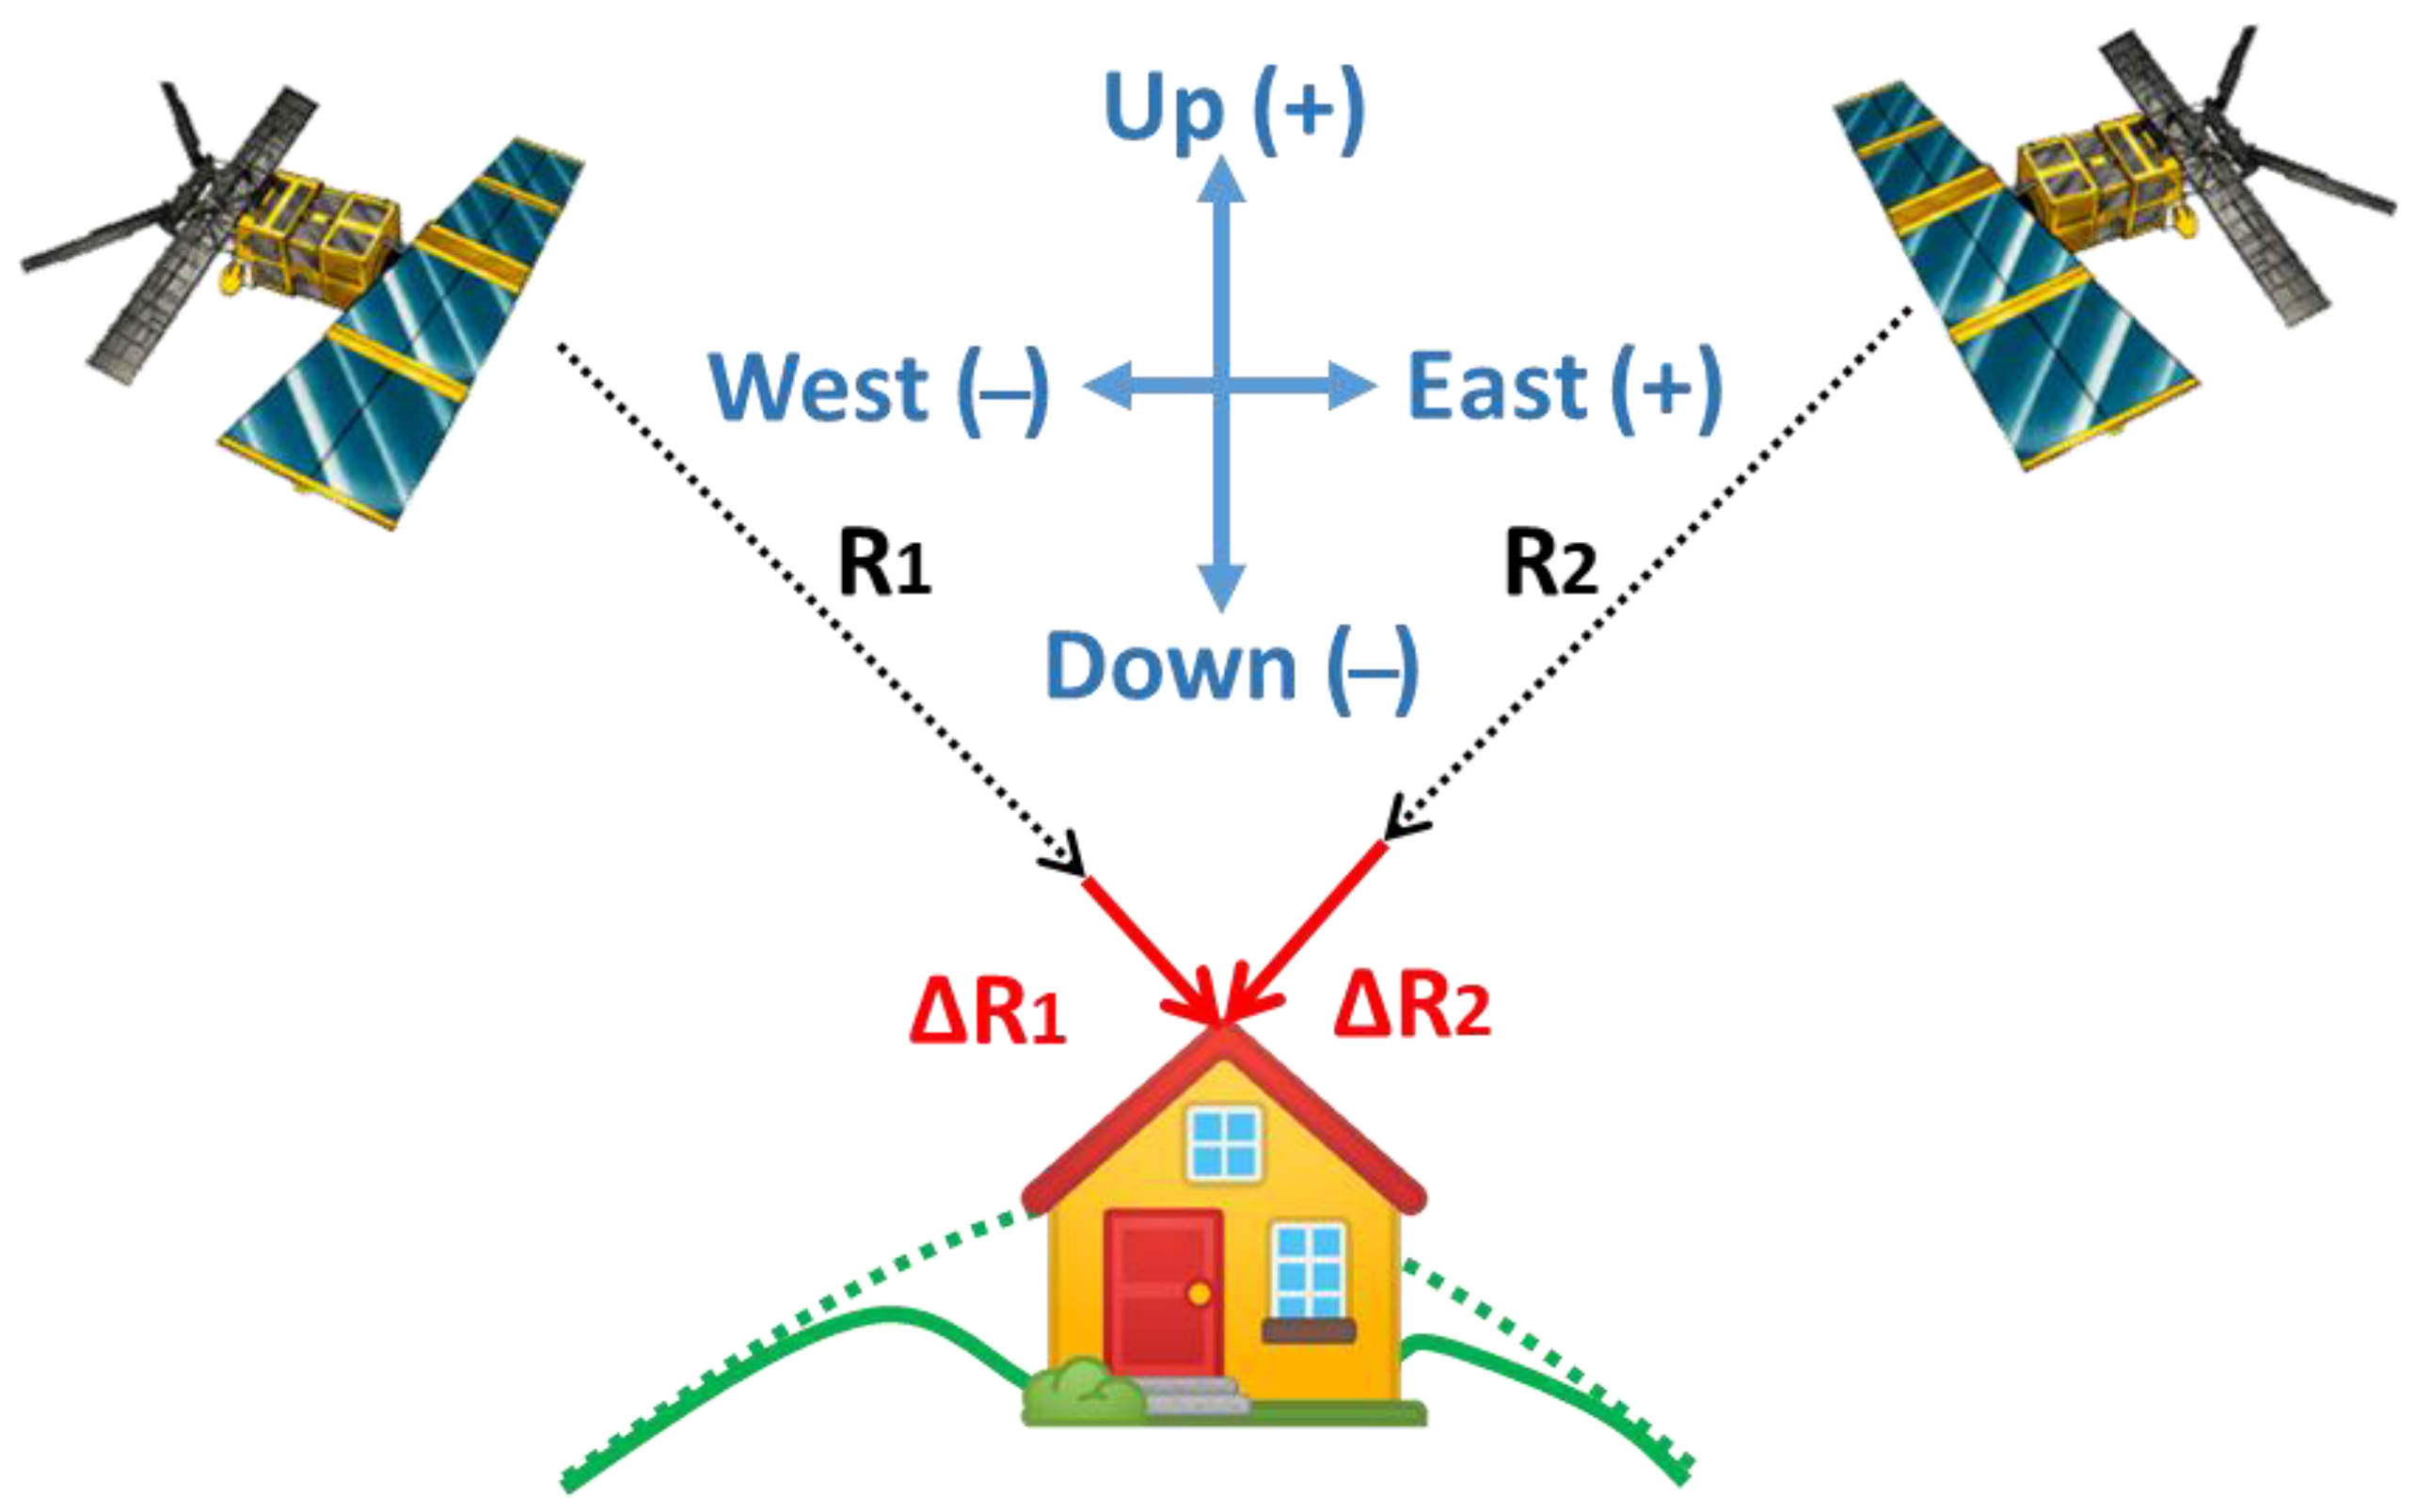
The output of both ascending and descending datasets measured the projected component of actual deformation in the direction of the line of sight (LoS). To characterize the long-term behavior of the buildings and landslides, LoS velocity should be analyzed according to the actual ground surface motion. The availability of two different viewing geometries (ascending and descending) allowed to get the horizontal (east–west) and vertical components of the actual motion from the LoS velocity [
31,
32]. In detail, this projection can be performed assuming a null north–south deformation component, and performing a 2D combination and decomposition of the ascending and descending LoS deformation vectors, for each resolution cell, taking into account the local LoS direction of each dataset (
Figure 5). This simplification is plausible considering the low sensitivity of satellite SAR near-polar orbit acquisitions, which are barely sensitive to north–south deformation components, which describe objects moving almost parallel to the satellite fly direction. Eventually, the north–south horizontal direction of deformation could be retrieved if three different geometries of acquisition are available over the same area, spanning the same time interval.
The Sentinel-1 ascending and descending data are not contemporary. Therefore, to perform the LoS result combination to the east–west and up–down directions, a temporal interpolation of the LoS time series of deformations is executed during the projection step.
3.2. Global Navigation Satellite System (GNSS)
GNSS observations have been widely applied for landslides identification and monitoring [
33] and as calibration, validation, and/or comparison of the InSAR results [
34]. The capabilities of the two techniques complement each other in monitoring ground deformations. GNSS based analysis generally involves the establishment of a network of GNSS stations, data adjustment, transformation to a common datum, and differencing for displacement detection [
35]. It is possible to obtain a three-dimensional (3D) point position with horizontal and vertical accuracy of 7–8 mm and 1–2 cm, respectively [
36].
In detail, the study area was monitored using multi-temporal GNSS data acquired during three different survey campaigns performed in October 2018, June 2019, and October 2019. Measurements were planned identifying 10 reliable non-permanent stations (NPS): eight NPS are located on stable foundations inside the unstable slope to check and monitor instability phenomena, and two NPS and a GNSS permanent station (SCHI) are positioned outside, in presumably stable areas, to check the co-registration of the reference system for each survey. The baselines, i.e., the distances between points inside and outside to the landslide, are less than 10 km. All points were selected to permit nearly ideal conditions, e.g., unobstructed horizon view, avoidance of multipath effect.
The NPS points inside the unstable slope are distributed taking into account the necessity to georeferencing the terrestrial laser scanning data, the photogrammetric acquisitions and the local topographic measurements (network for survey the laser scanning ground control points and the natural and artificial points on the external walls of the buildings): two NPS points are located close to Rovegliana Church and other two close to the building in the Cappellazzi district; the other four NPS are distributed in the deformation area. These points are useful not only for the georeferencing of terrestrial measurements, but also as a source of data for the comparison and validation of interferometry results.
Observations were performed using four double-frequencies Leica Viva GNSS receivers for each campaign, adopting the static mode approach at a sampling rate of 15 s in order to carry out the survey of the network foreseeing the minimum acquisition time of 3 h for each baseline.
Acquired data were processed using the Infinity software provided by Leica Geosystems, taking into account precise orbits of satellites downloaded from the International GPS Service for Geodynamics (IGS). The network related to the three points outside the unstable area was used to check the stability of the NPS stations in the multi-temporal analysis and to constrain the common reference system for each survey. Subsequently, the adjustment of the network related to the points inside the unstable slope and transformed in the stable reference system, provided the coordinates of the NPS points for each measurement. Finally, the differences in the 3D coordinates provided the displacements of the points along north, east, and elevation directions.
3.3. Terrestrial Laser Scanning (TLS) and Structure from Motion (SfM)
TLS is a ground-based technique that automatically collects the 3D spatial coordinates of a large number of points of objects, with a spatial resolution that ranges from millimeters to centimeters [
37]. Point clouds and red blue green (RGB) images acquired from the center of the instrument, allow the texturing of the 3D scans providing a photo-realistic metric representation of the surveyed objects. TLS data are usually acquired in form of multiple scans, that have to be aligned to create the global 3D model. Point clouds acquired in different times are co-registered and transformed into one coordinate system (e.g., using affine transformation) for change detection studies. This contactless measurement technique has been widely used for long-range monitoring in the fields of architecture [
38], civil engineering [
39], geology [
40] and geomorphology [
41].
TLS acquisitions were performed using the Leica ScanStation P20, characterized by a precision of 2 mm and 8” in distance and angular measurement, respectively [
42]. In the surrounding area of the two analyzed buildings, two local topographic networks were defined and measured using the total station Leica TCR1201 for the survey of the targets necessary to align the TLS scans [
43,
44]. The local networks are composed by five points in Cappellazzi district and six points in the Rovegliana Church area. Each network includes two GNSS NPS points (1100 and 1200, 2100 and 2200,
Figure 1) which were used for georeferencing the point clouds in the UTM 32N cartographic reference system. In each site, TLS and low-resolution image acquisitions started from the points of the topographic network, measuring the other visible targets and acquiring data of the building walls from different points of view, to reduce the shadow areas and reconstructing the 3D models as complete as possible. All the scans were performed with a sampling distance of 3.1 mm at 10 m, corresponding to a real average grid size of about 2 mm, while the additional detailed scans of the most damaged and cracked parts of the walls have a sampling distance between 0.8 and 1.6 mm at 10 m, corresponding to a real average grid size between 0.4 and 0.8 mm. Acquired portions of the structures are relative to the walls interested by the relevant fractures and not for the whole objects to optimize the work and for more efficient management of the data, focusing the analysis to the most problematic fracture patterns.
In the first phase of the processing, using the software Leica Cyclone provided by Leica Geosystems, the scans were optimized removing the unnecessary points and filtering the noise. Then, the identification of several targets and the assignment of their georeferenced coordinates allowed to register (align) the scans with the calculation of the related error for each target. These values provide the accuracy of the scans alignment that can be verified through visual inspections of the 3D model, sections and plans.
In the second phase of the processing, the comparison between multi-temporal TLS data was performed using the plugin M3C2 of the software Cloud Compare (
https://www.danielgm.net/cc/). This is a specific tool that allows to calculate the distance between two 3D entities (cloud-to-cloud, cloud-to-mesh and mesh-to-mesh) [
45,
46]. To this end, a subset of points (core points) of one of the two point clouds (reference cloud) is considered. The distance is calculated considering the points falling in a cylindrical volume around the local normal to each core point. In the processing, the following parameters have to be set: subsampling, normal scale, projection scale and maximum depth. The subsampling is the minimum distance between points in the reference cloud and it was set to 1 cm. The normal scale is the diameter of the spherical volume around each core point used to compute the local normal, the adopted value is 5 cm. The projection scale is the diameter of the cylinder used as search region to calculate the distance between the two point clouds, the value was set to 10 cm. The max depth is the height of the cylinder in both directions from the core point, it was set to 20 cm. These parameters were chosen based on our previous experiences and literature [
47,
48]. Once the parameters are set, the distance between the average positions of the points of each cloud falling in the cylindrical volume is calculated.
The total station was used for the measurement of the topographic reference network and the targets and for the survey of natural and artificial points homogeneously distributed on both sides of the main cracks affecting the buildings (20 for the building in Cappellazzi and 20 for Rovegliana Church), performing distances and angular triangulations measurements from the points of the network to evaluate any differential displacement.
In addition to the TLS surveys, terrestrial photogrammetric acquisitions were performed for the application of the SfM technique. The original idea of SfM was proposed by Ullman et al. [
49], who addressed how to infer the 3D structure and motion of objects from the 2D transformations of their projected images. SfM has been used to generate large point clouds for scene structure reconstructions [
50] and geosciences applications [
51]. This technique exploits an automatic pixel-by-pixel correlation approach, reconstructing the 3D model in a local or global reference system. The general workflow consists of an initial analysis of the imagery dataset with the feature extraction and matching through an object recognition algorithm (scale invariant feature transform, SIFT) [
52]. It allows to reconstruct the position of the camera using the coordinates of the measured targets and generate a sparse points cloud, which is composed by the homologue points (tie points) identified in different images. Then, the full-resolution images are used to increase the sparse point cloud, generating the dense cloud through the multi-view stereo (MVS) algorithm. The obtained 3D model can be used for the production of the mesh model, DEM and orthomosaic. The SfM processing was performed using the Agisoft Metashape software (
www.agisoft.com).
The images of the damaged buildings were acquired by the digital single-lens reflex (SLR) camera Canon EOS 5DS (CMOS sensor 50.6 megapixel; sensor size 36 × 24 mm), with a 35 mm focal length objective. To monitor the evolution of the crack pattern affecting the walls of the buildings, 96 images in Cappellazzi district and 127 images in Rovegliana Church were acquired, with size of 5760 × 3840 pixels and an overlap from 40% to 90%. In the first case, the average camera–object distance is 4 m which allows to obtain a ground sample distance (GSD, pixel size in the wall) of 0.7 mm. In the second, the average distance is 2 m and the GSD is 0.4 mm. The tripod and flash were not used thanks to the good and uniform light conditions.
4. Results
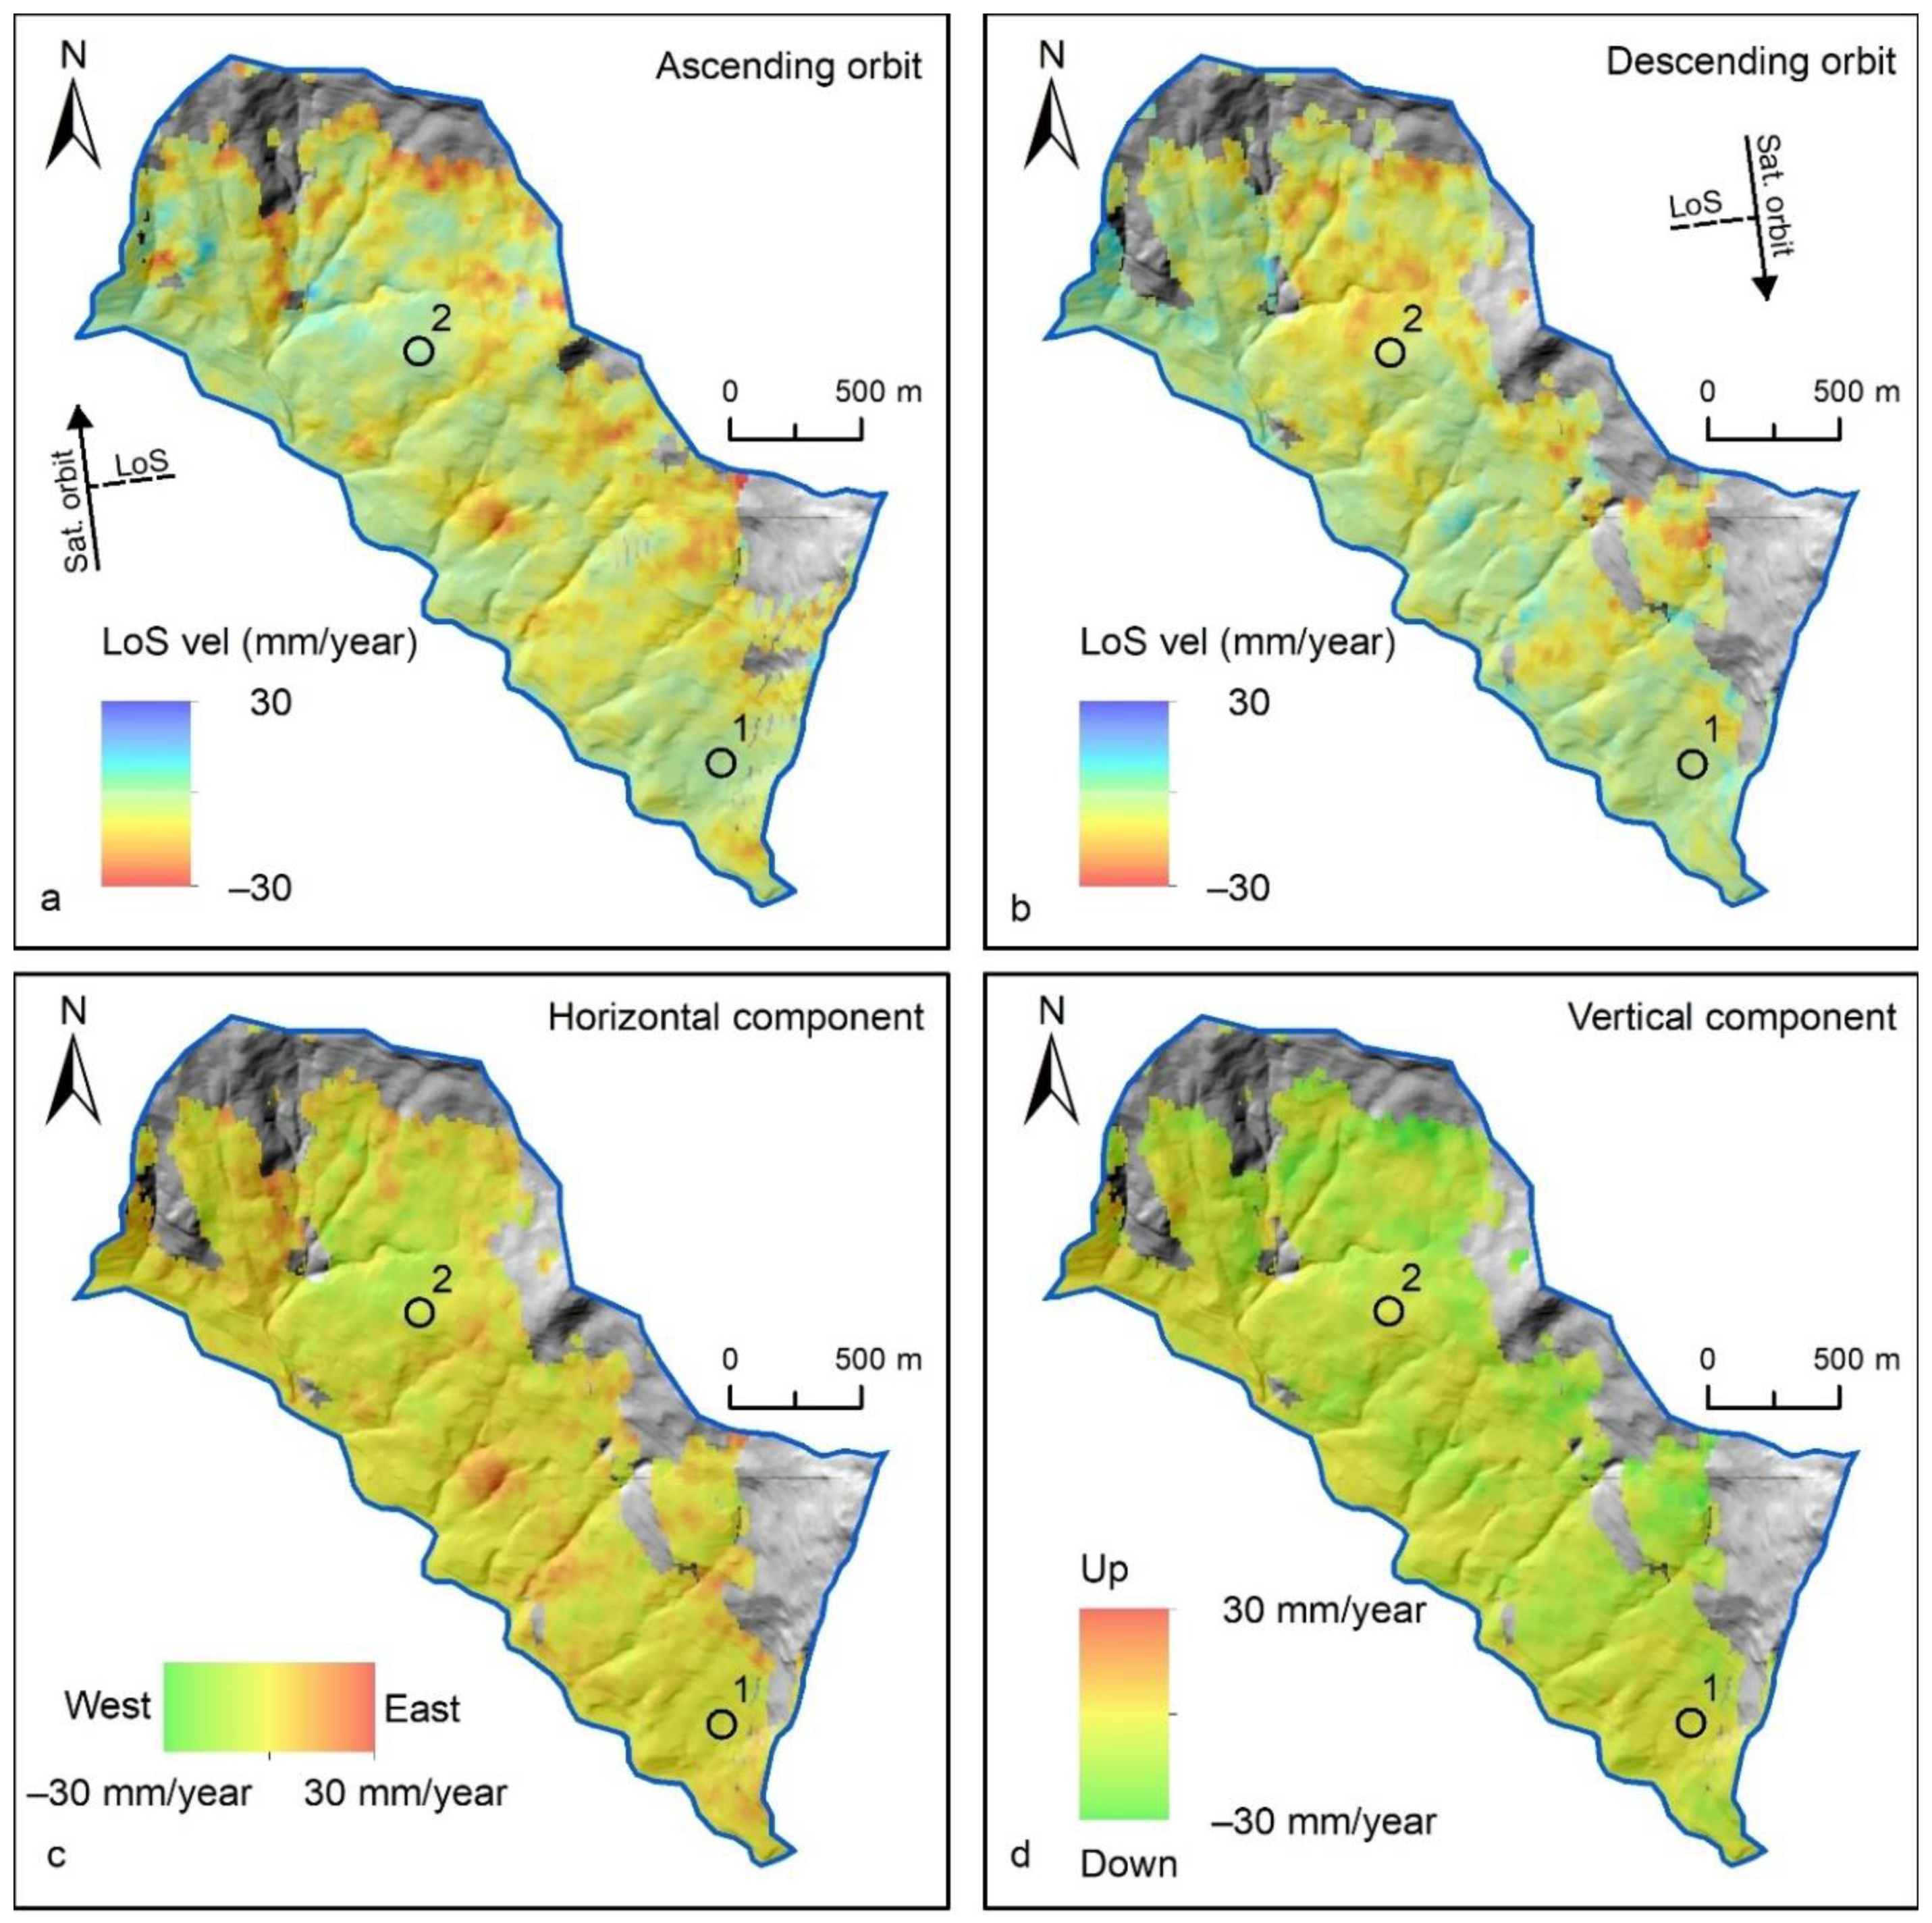
Figure 6a,b show the velocity maps along the LoS direction derived by SBAS-InSAR processing of Sentinel-1 ascending and descending datasets. Positive values mean that the movement is towards the satellites, and negative values indicate that the movement is away from the satellites. The results were obtained exploiting Sentinel-1 data full resolution, which is 15 × 15 m
2 to get squared resolution pixels, setting a coherence threshold of 0.35 for both the ascending and descending datasets. Interferometry results cover the 85% (ascending) and 76% (descending) of the entire study area, providing information on urban and non-urban areas. Landsliding areas are almost totally covered by both ascending and descending SBAS results. Displacement rates range from −30 to 30 mm/year with a mean precision of the calculated LoS mean velocities of, respectively, 3.35 ± 1.1 and 3.33 ± 1.05 mm/year for the ascending and descending output. Higher deformation velocities were measured in areas with high slope gradient, at the head of the gullies and landslides. In these areas, the direction of displacement is mainly vertical (
Figure 6d). Lower velocities were estimated in gentle or flat slopes which are characterized by a significant horizontal displacement along the slope facing (
Figure 6c) as in the case of the two sites investigated in more detail (Rovegliana Church and Cappellazzi district). The rate and direction of detected displacements are clearly connected to the kinematic of the instability phenomena affecting the slope. In the source areas, mass movements have a rotational component with a depletion of the ground surface which results in negative values in the LoS and vertical velocity maps (
Figure 6a,b,d). Along the body of landslides, the movement is mainly translational in the direction of the maximum slope (south–west). In this case, LoS velocities estimated by the processing of SAR images acquired in ascending orbit are positive, while velocities estimated through descending acquisitions are negative. It means that a prevailing horizontal component to the west is present as evaluated by combining ascending and descending SBAS results (
Figure 6c).
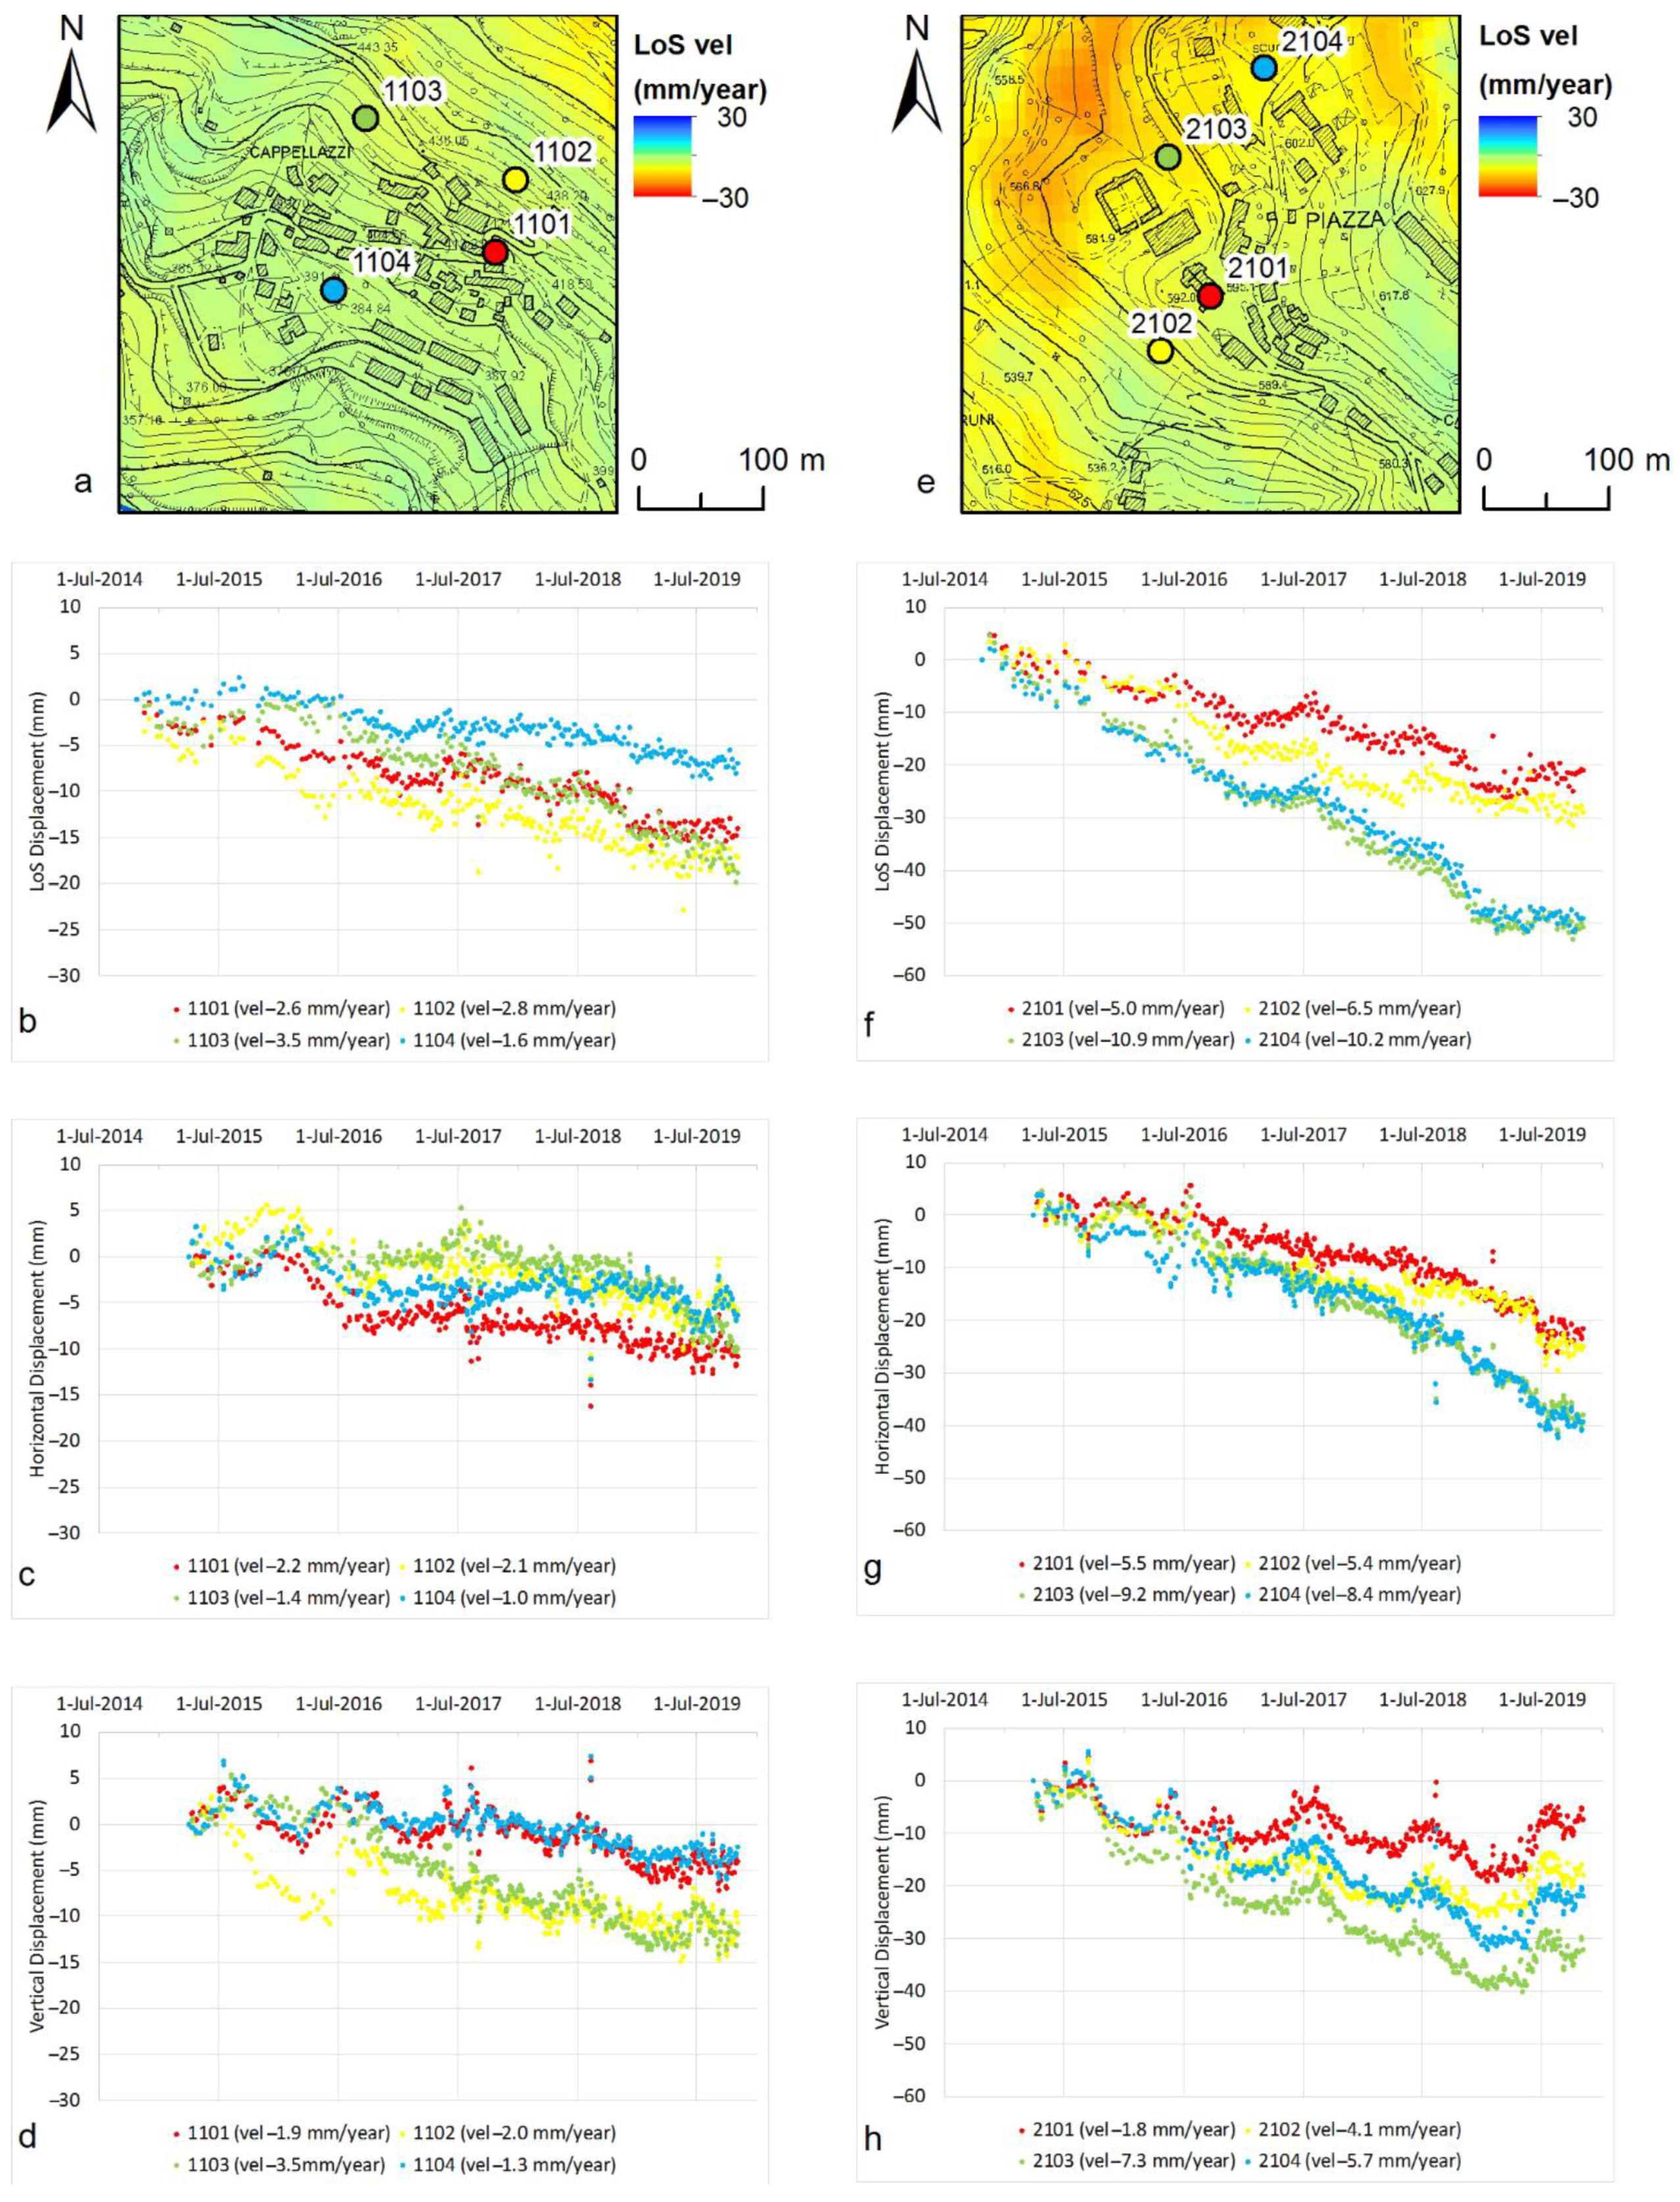
To investigate the relationships between damages to anthropic structures and mass movements, SBAS-InSAR displacement time series of points located in Cappellazzi district and Rovegliana Church area, were considered (
Figure 7). LoS, horizontal and vertical displacements affecting the two structures monitored by TLS and SfM (
Figure 1 and
Figure 2) were compared to those estimated in the surrounding non-urban areas. The trend of the time series in Cappellazzi is very similar with a total displacement between −8 and −20 mm in the LoS direction (
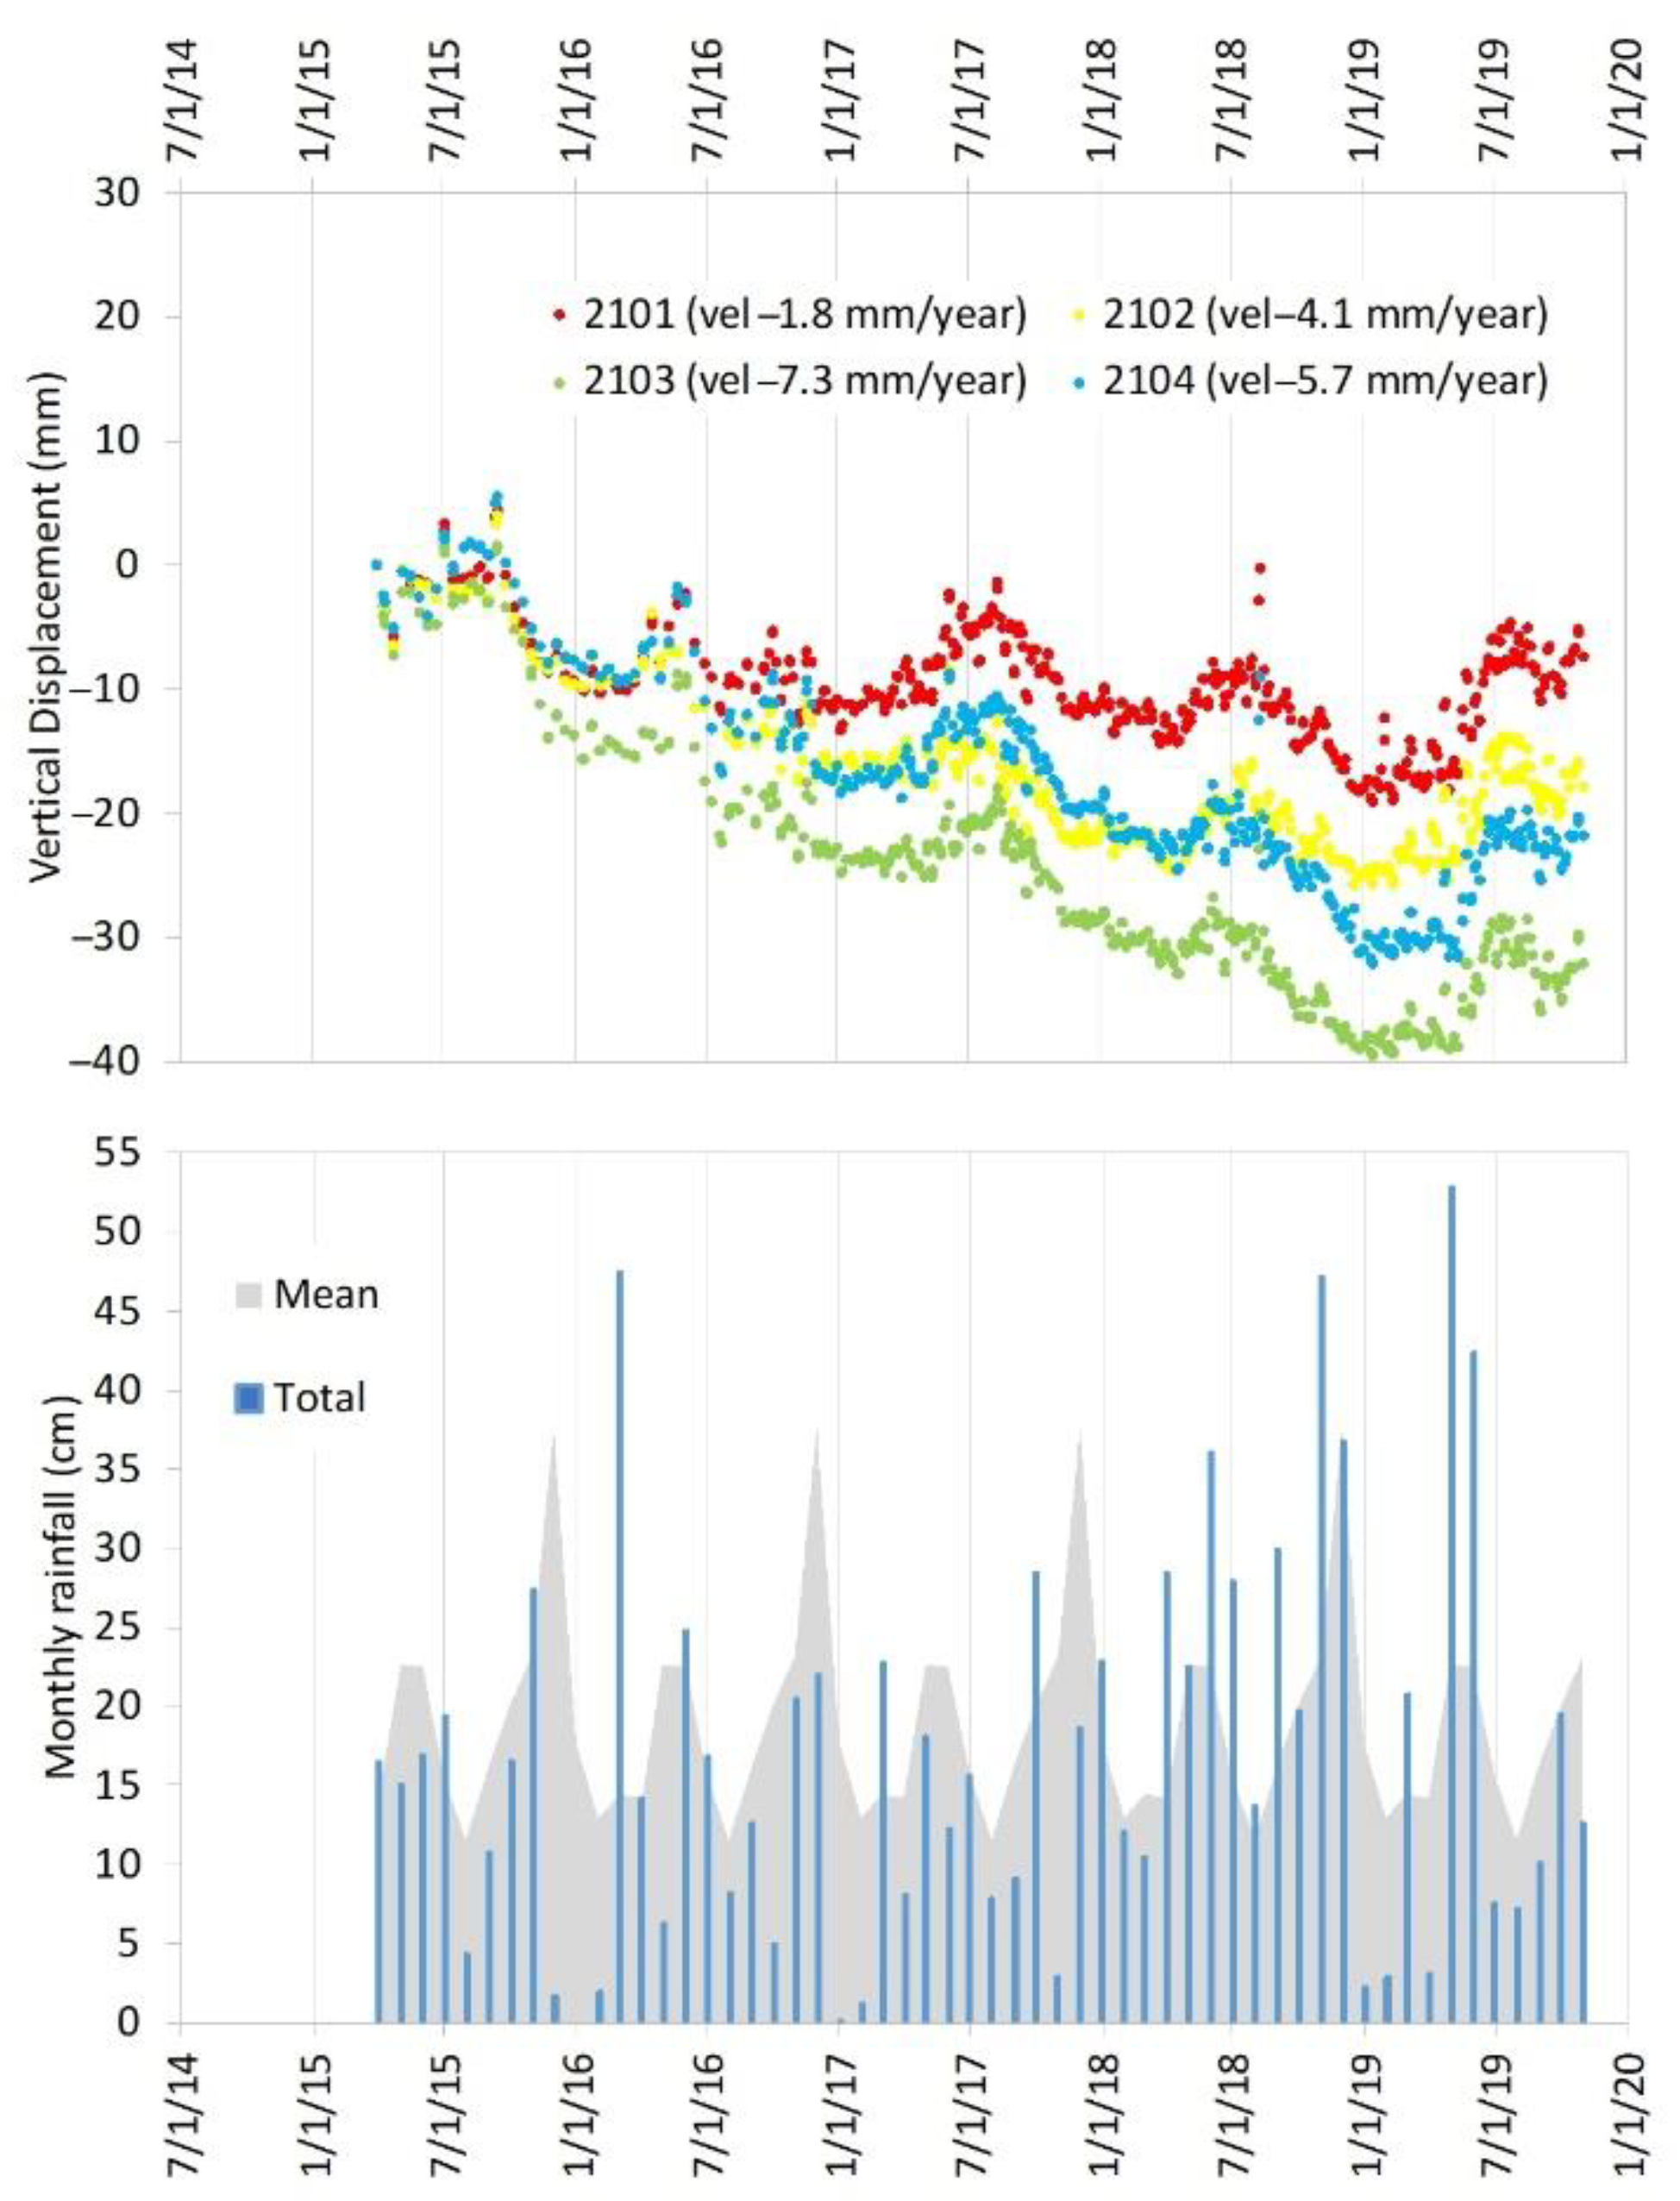
Figure 7b). The small differences are due to the different morphological conditions of the selected points: 1101, 1102 and 1103 are on the slope while 1104 is in a flat area. Total displacement along the horizontal and vertical directions is almost the same and it is between −5 and −10 mm. These results show that the entire sector is moving to SW at the same rate along the maximum slope which is consistent with the kinematic of the translational slide affecting this area. In the case of the Rovegliana Church area, the trend of the time series is similar, but points 2103 and 2104, located at north of the church, have a total displacement higher than points 2101 and 2102. These differences show that this area is affected by two different instability phenomena which have been activated in the same periods but with different intensity as occurred after July 2017 and July 2018 (
Figure 7f). The negative trend of horizontal and vertical components (
Figure 7g,h) suggests that points 2103 and 2104 are moving to west along the maximum slope due to the soil slips occurring in this sector, while points 2101 and 2102 are moving to south–west, according to the local morphology, along the same direction of the translational slide affecting the southern area of Rovegliana Church (
Figure 1).
Both in Cappellazzi and the Rovegliana Church area, the time series clearly show that displacements occur during the wet seasons, from March to June (Spring) and from September to November (Autumn) (
Figure 7b–d,f–h), rainfall being the main triggering factor.
Figure 8 shows a clear relationship between rainfall and vertical displacement affecting the area of Rovegliana Church. It has to be noted that after dry winter periods, spring rainfall events cause an upward displacement. Even if less evident, this phenomenon can occur also in the autumn season, after the main rainfall events. We do not have enough information to explain this occurrence, it can be supposed that it is related to the swelling of clayey deposits due to the variation in the soil moisture, but more detailed geotechnical investigations and an hydromechanical modeling of the instability phenomena would be required.
The GNSS processing and the adjustment of the external network composed by 3 points provided the coordinates of the 10 NPS points in the UTM 32N cartographic reference system. The three external points showed differences in the coordinates ranging from 0 to 1.0 mm (October 2018–June 2019) and from 0.1 to 1.2 mm (June 2019–October 2019), thus they can be considered stables during the observation period. The network of the NPS located inside the unstable area was adjusted by constraining the coordinates of the 3 stable external points. The results of the adjustment provided coordinates standard deviations ranging from 2 to 6 mm in planimetry and up to 9 mm in elevation. The differences of the coordinates of the 8 inside NPS points generated the 3D displacement vectors.
The cumulative 3D displacements of the GNSS NPS points are listed in
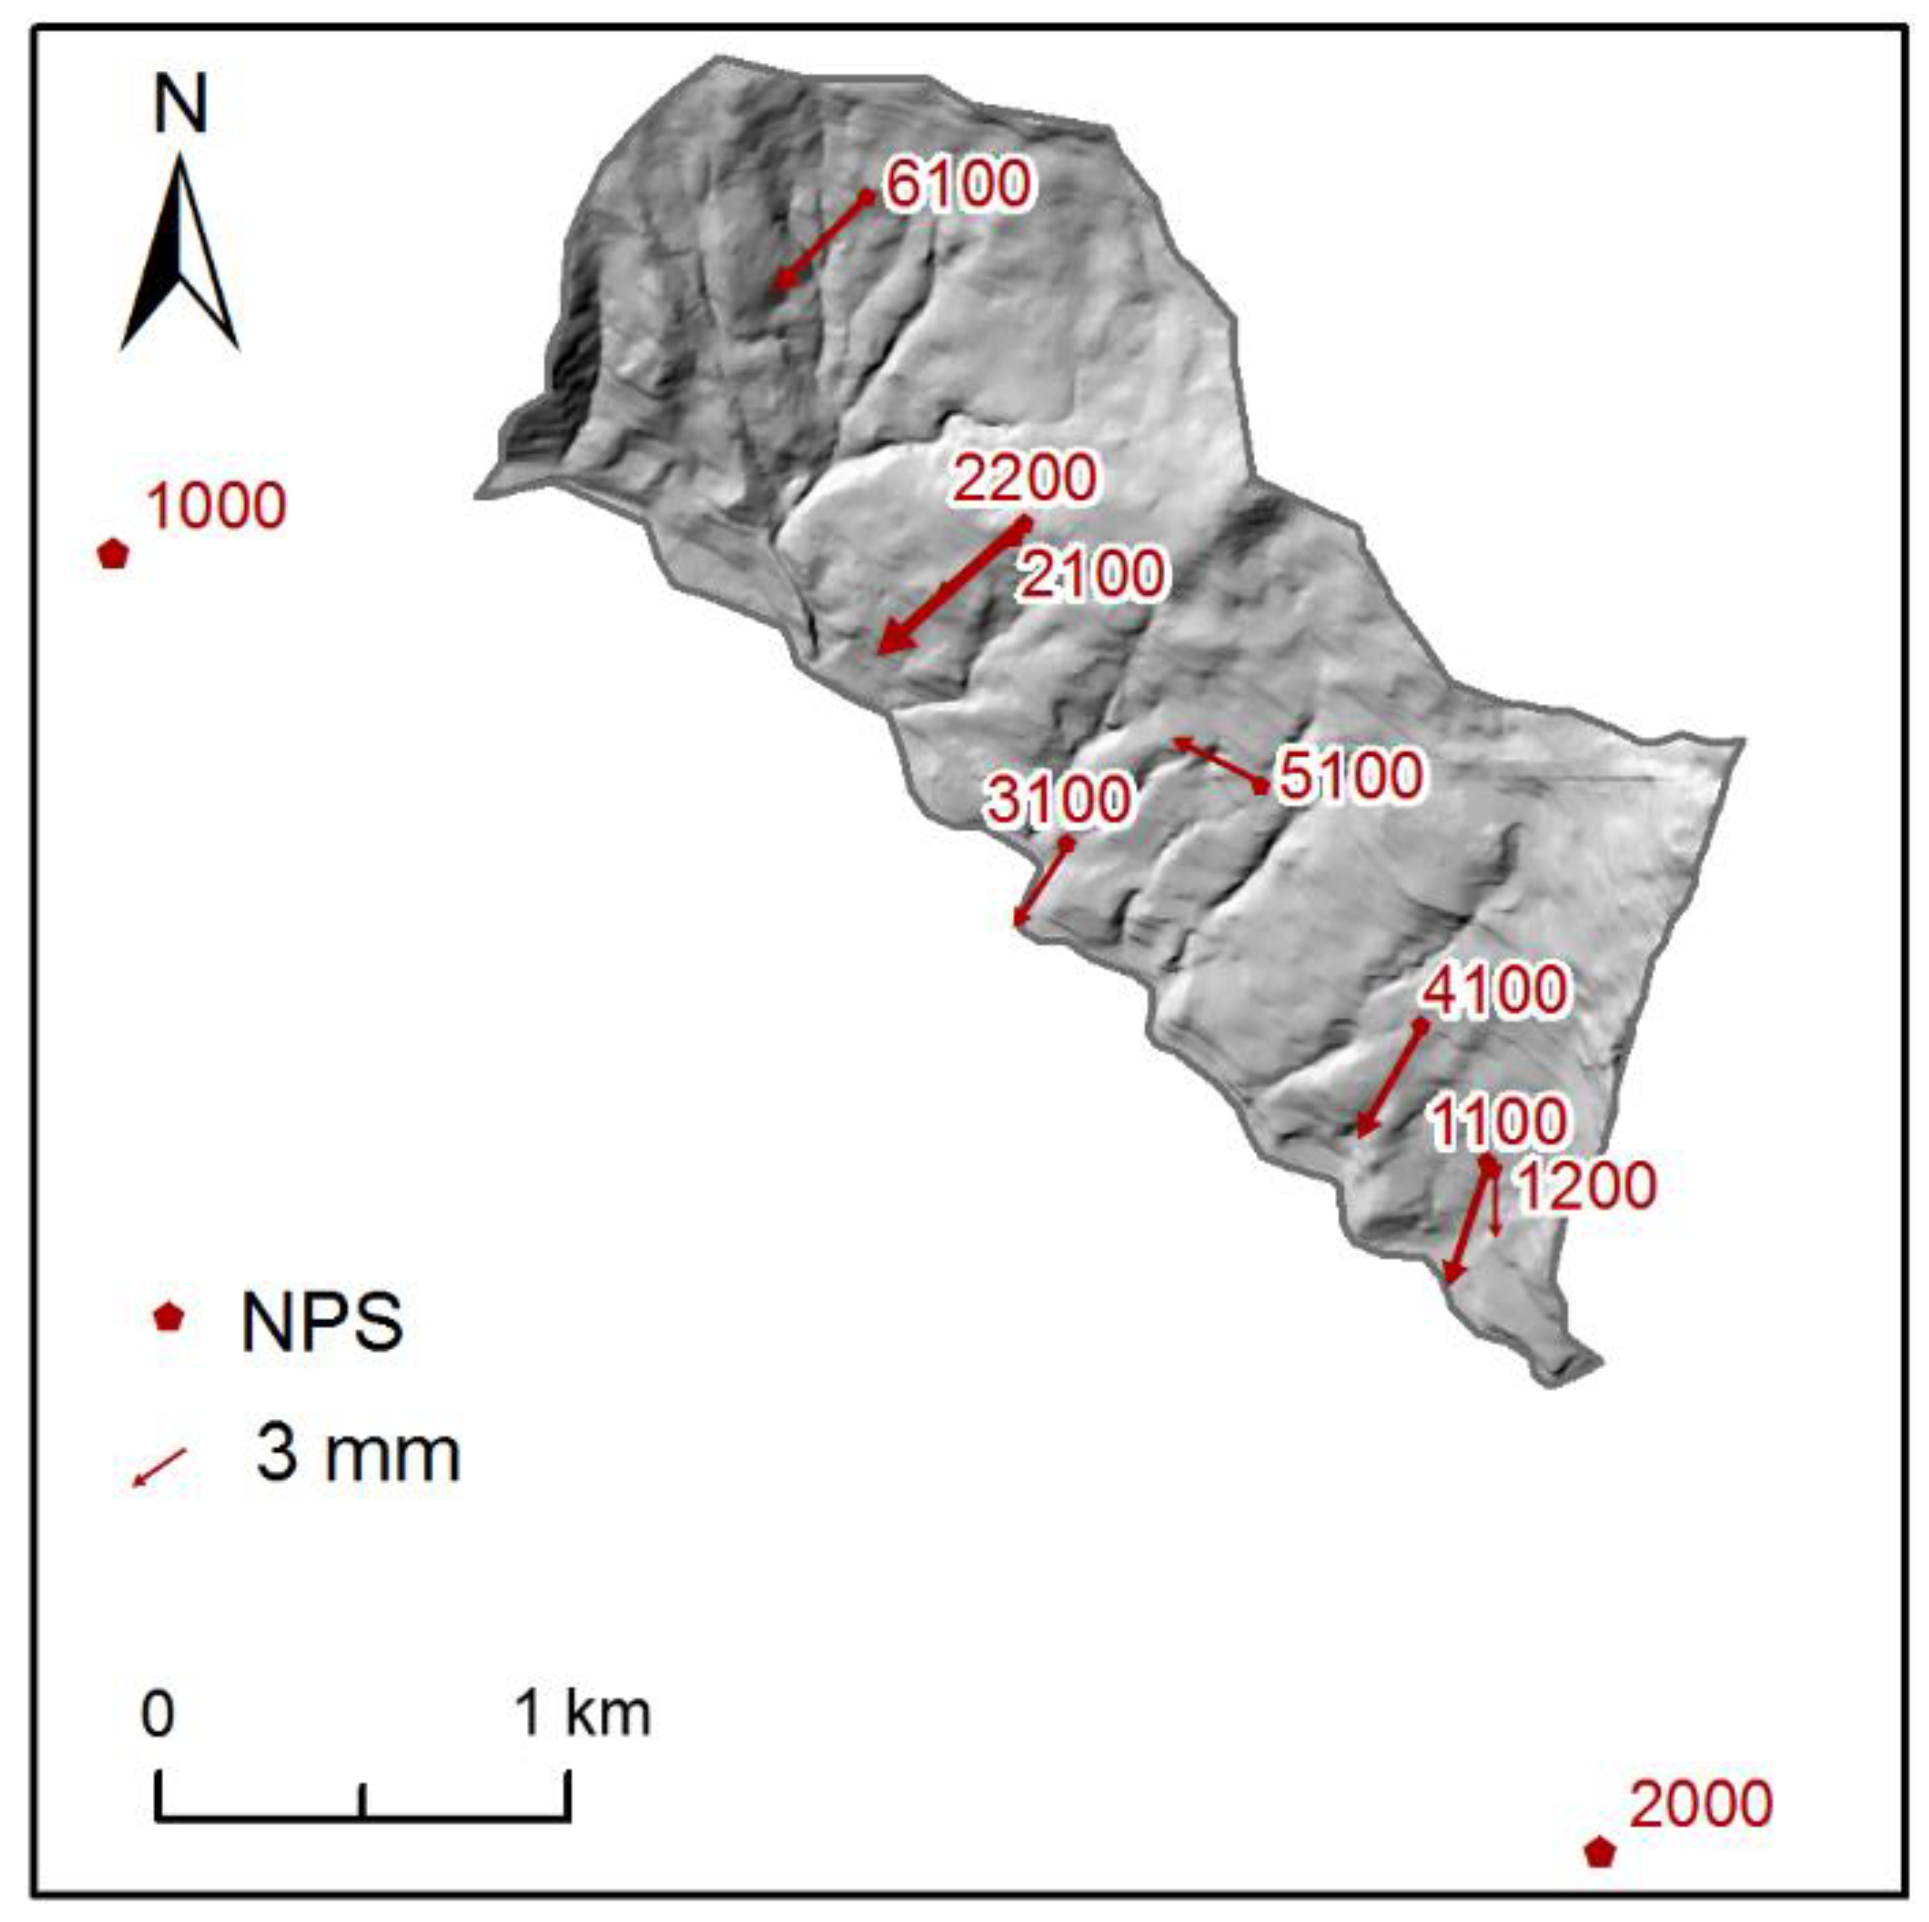
Table 1. To verify interferometry results, the horizontal (east–west) displacements estimated by the two techniques at the GNSS point inside the unstable slope were compared. The east–west component was considered because of the better accuracy of GNSS technique in measuring planimetric displacements. The results show a very good agreement between the two techniques for almost all the points, except in the case of the point 4100 where a small difference was observed. However, this is within the limits of precision of the techniques. The cumulative horizontal displacement vectors derived by GNSS are directed to south–west along the maximum slope (
Figure 9), which is consistent with the kinematic of the instability phenomena, as observed from the interferometry.
TLS methodology provided the 3D models of the two objects under investigation (
Figure 10): for the building located in Cappellazzi, four scans were executed (two scans for the global views and two high-resolution scans for the damaged parts) from two different scanning points; for Rovegliana Church, a total of six scans (with two high-resolution scans) were necessary to cover the frontal part of the building, the fractured wall of the portico and the bell tower. The global models were built with the software Leica Cyclone using the georeferenced targets for the alignment procedure and the same settings and parameters were used for the three different survey campaigns of the years 2018–2019. The average registration errors obtained in the 6 targets of the Rovegliana Church area are 3 mm for the surveys performed in October 2018 and June 2019, and 4 mm in the October 2019 measurement. In the case of Cappellazzi district, the average registration errors on 4 targets are 2, 3 and 2 mm in the three surveys. In the comparisons between models acquired at different times, to reduce the influence of the georeferencing and make the point cloud cleaner and more accurate, only the single high-resolution scans (with sample distance of 0.8 and 1.6 mm at 10 m) were used.
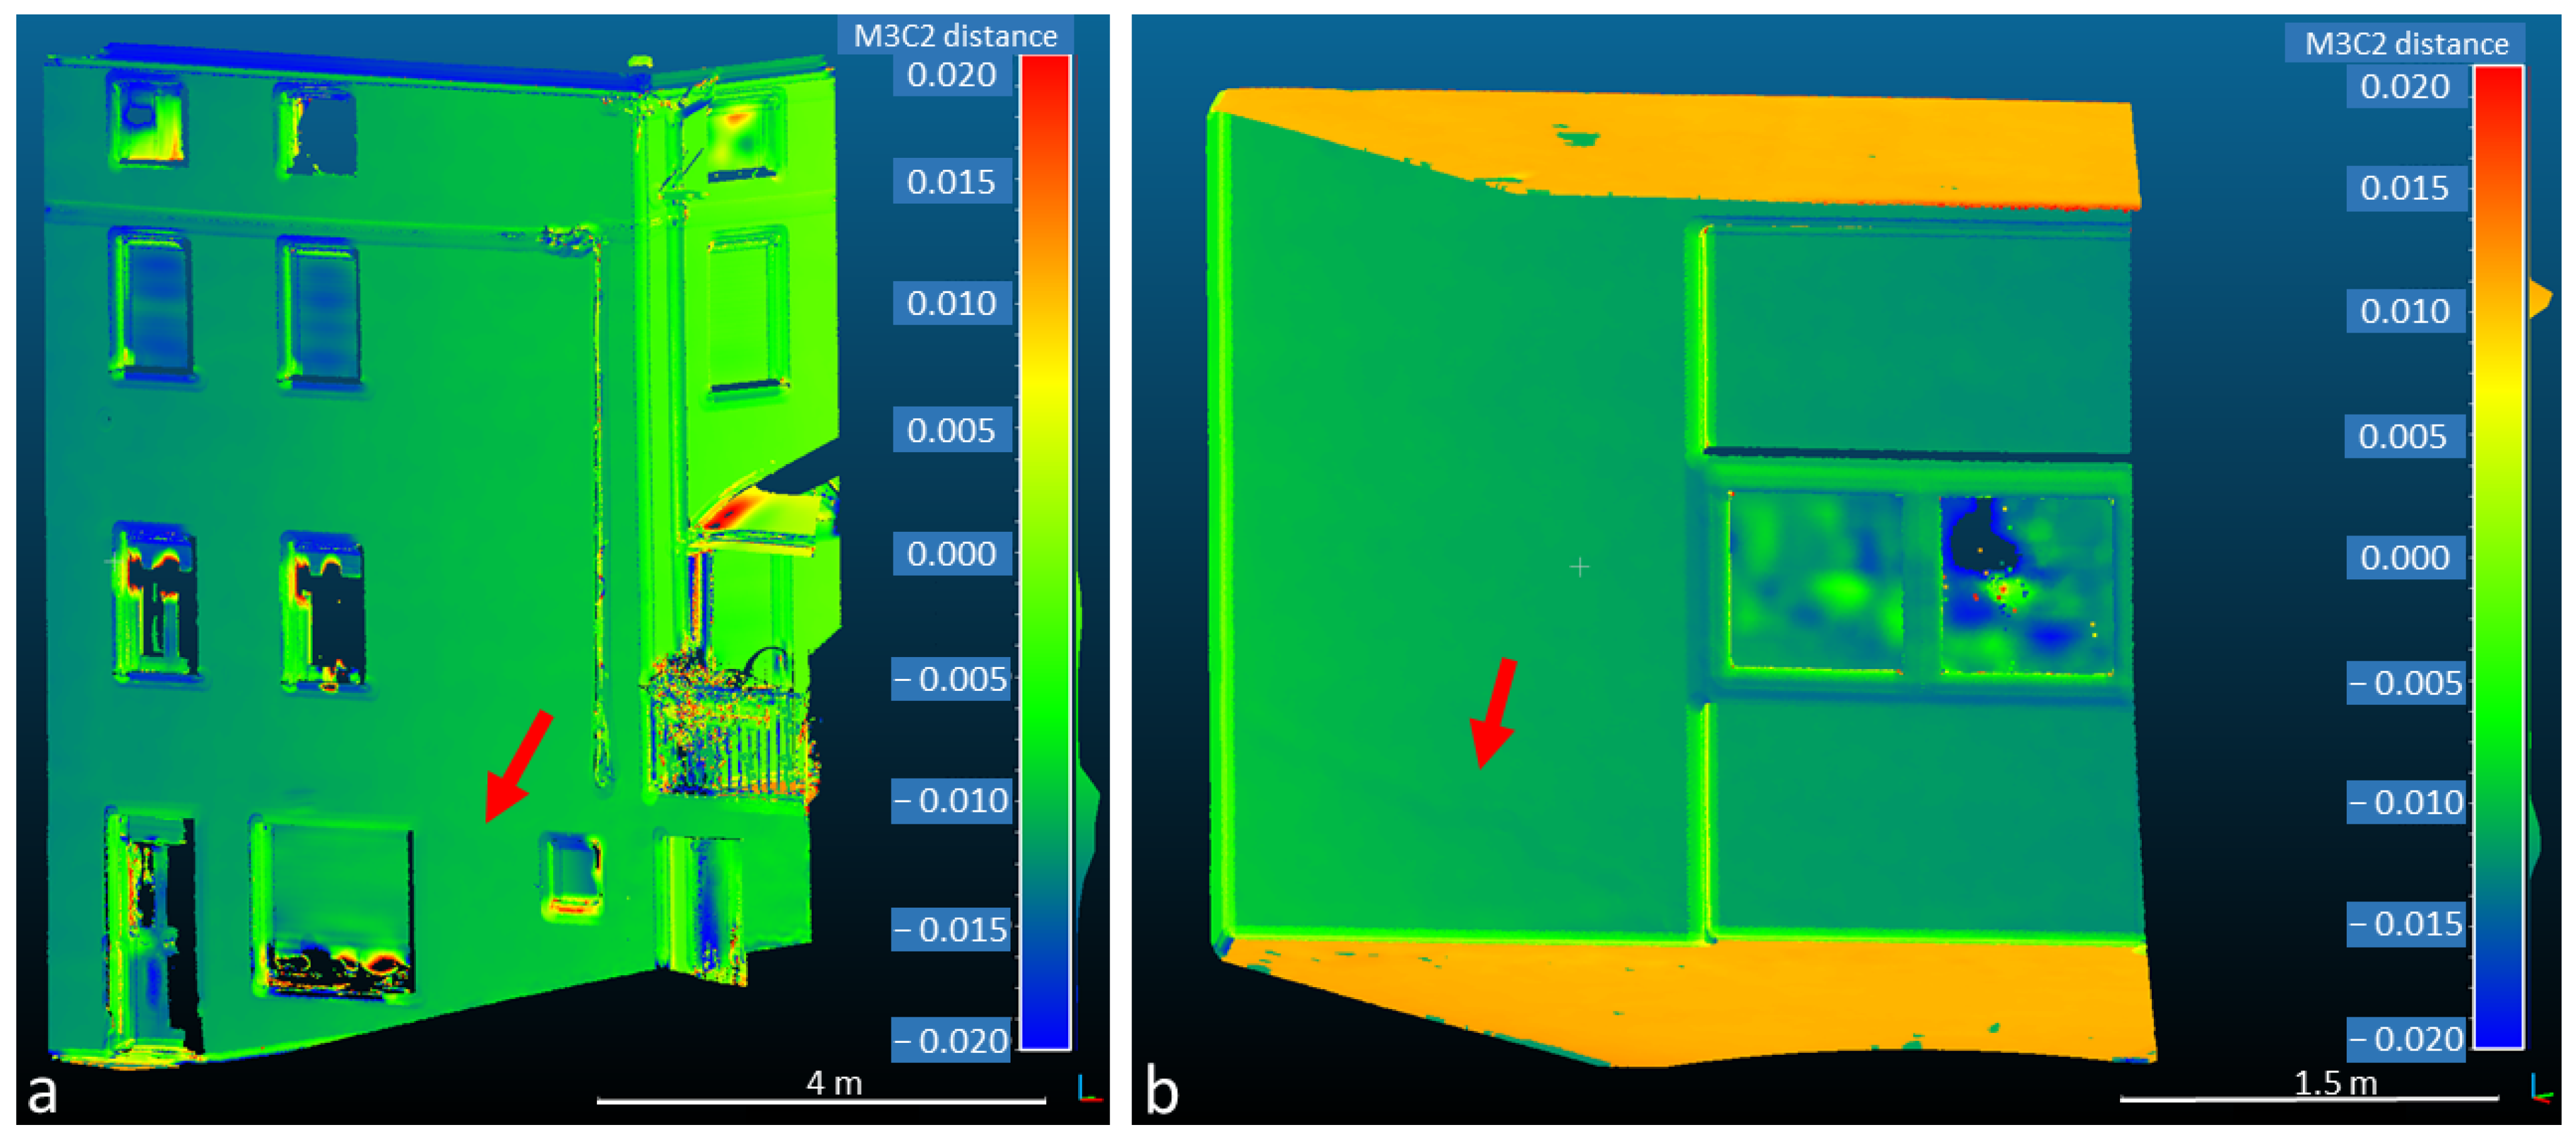
The first and the last scans were compared to detect displacements of cracks affecting the structures (
Figure 11). The M3C2 plugin tool of the software Cloud Compare allowed to perform the computation of distances between two point clouds, considering some input parameters about the density of core points and volume in which the homolog points for the distance calculation are identified [
45]. The results, highlighted by the color scale, show that the fractures seem to remain stable or the deformation is too small to be observed with the TLS approach. The displacements regard the mobile parts (windows, doors, plants, objects in
Figure 11a) and rigid translations of the whole surfaces, as shown in the two peaks of distances in
Figure 11a,b (about 1 cm to the south direction for the building in Cappellazzi district and 1.2 cm to the south–west direction for Rovegliana Church).
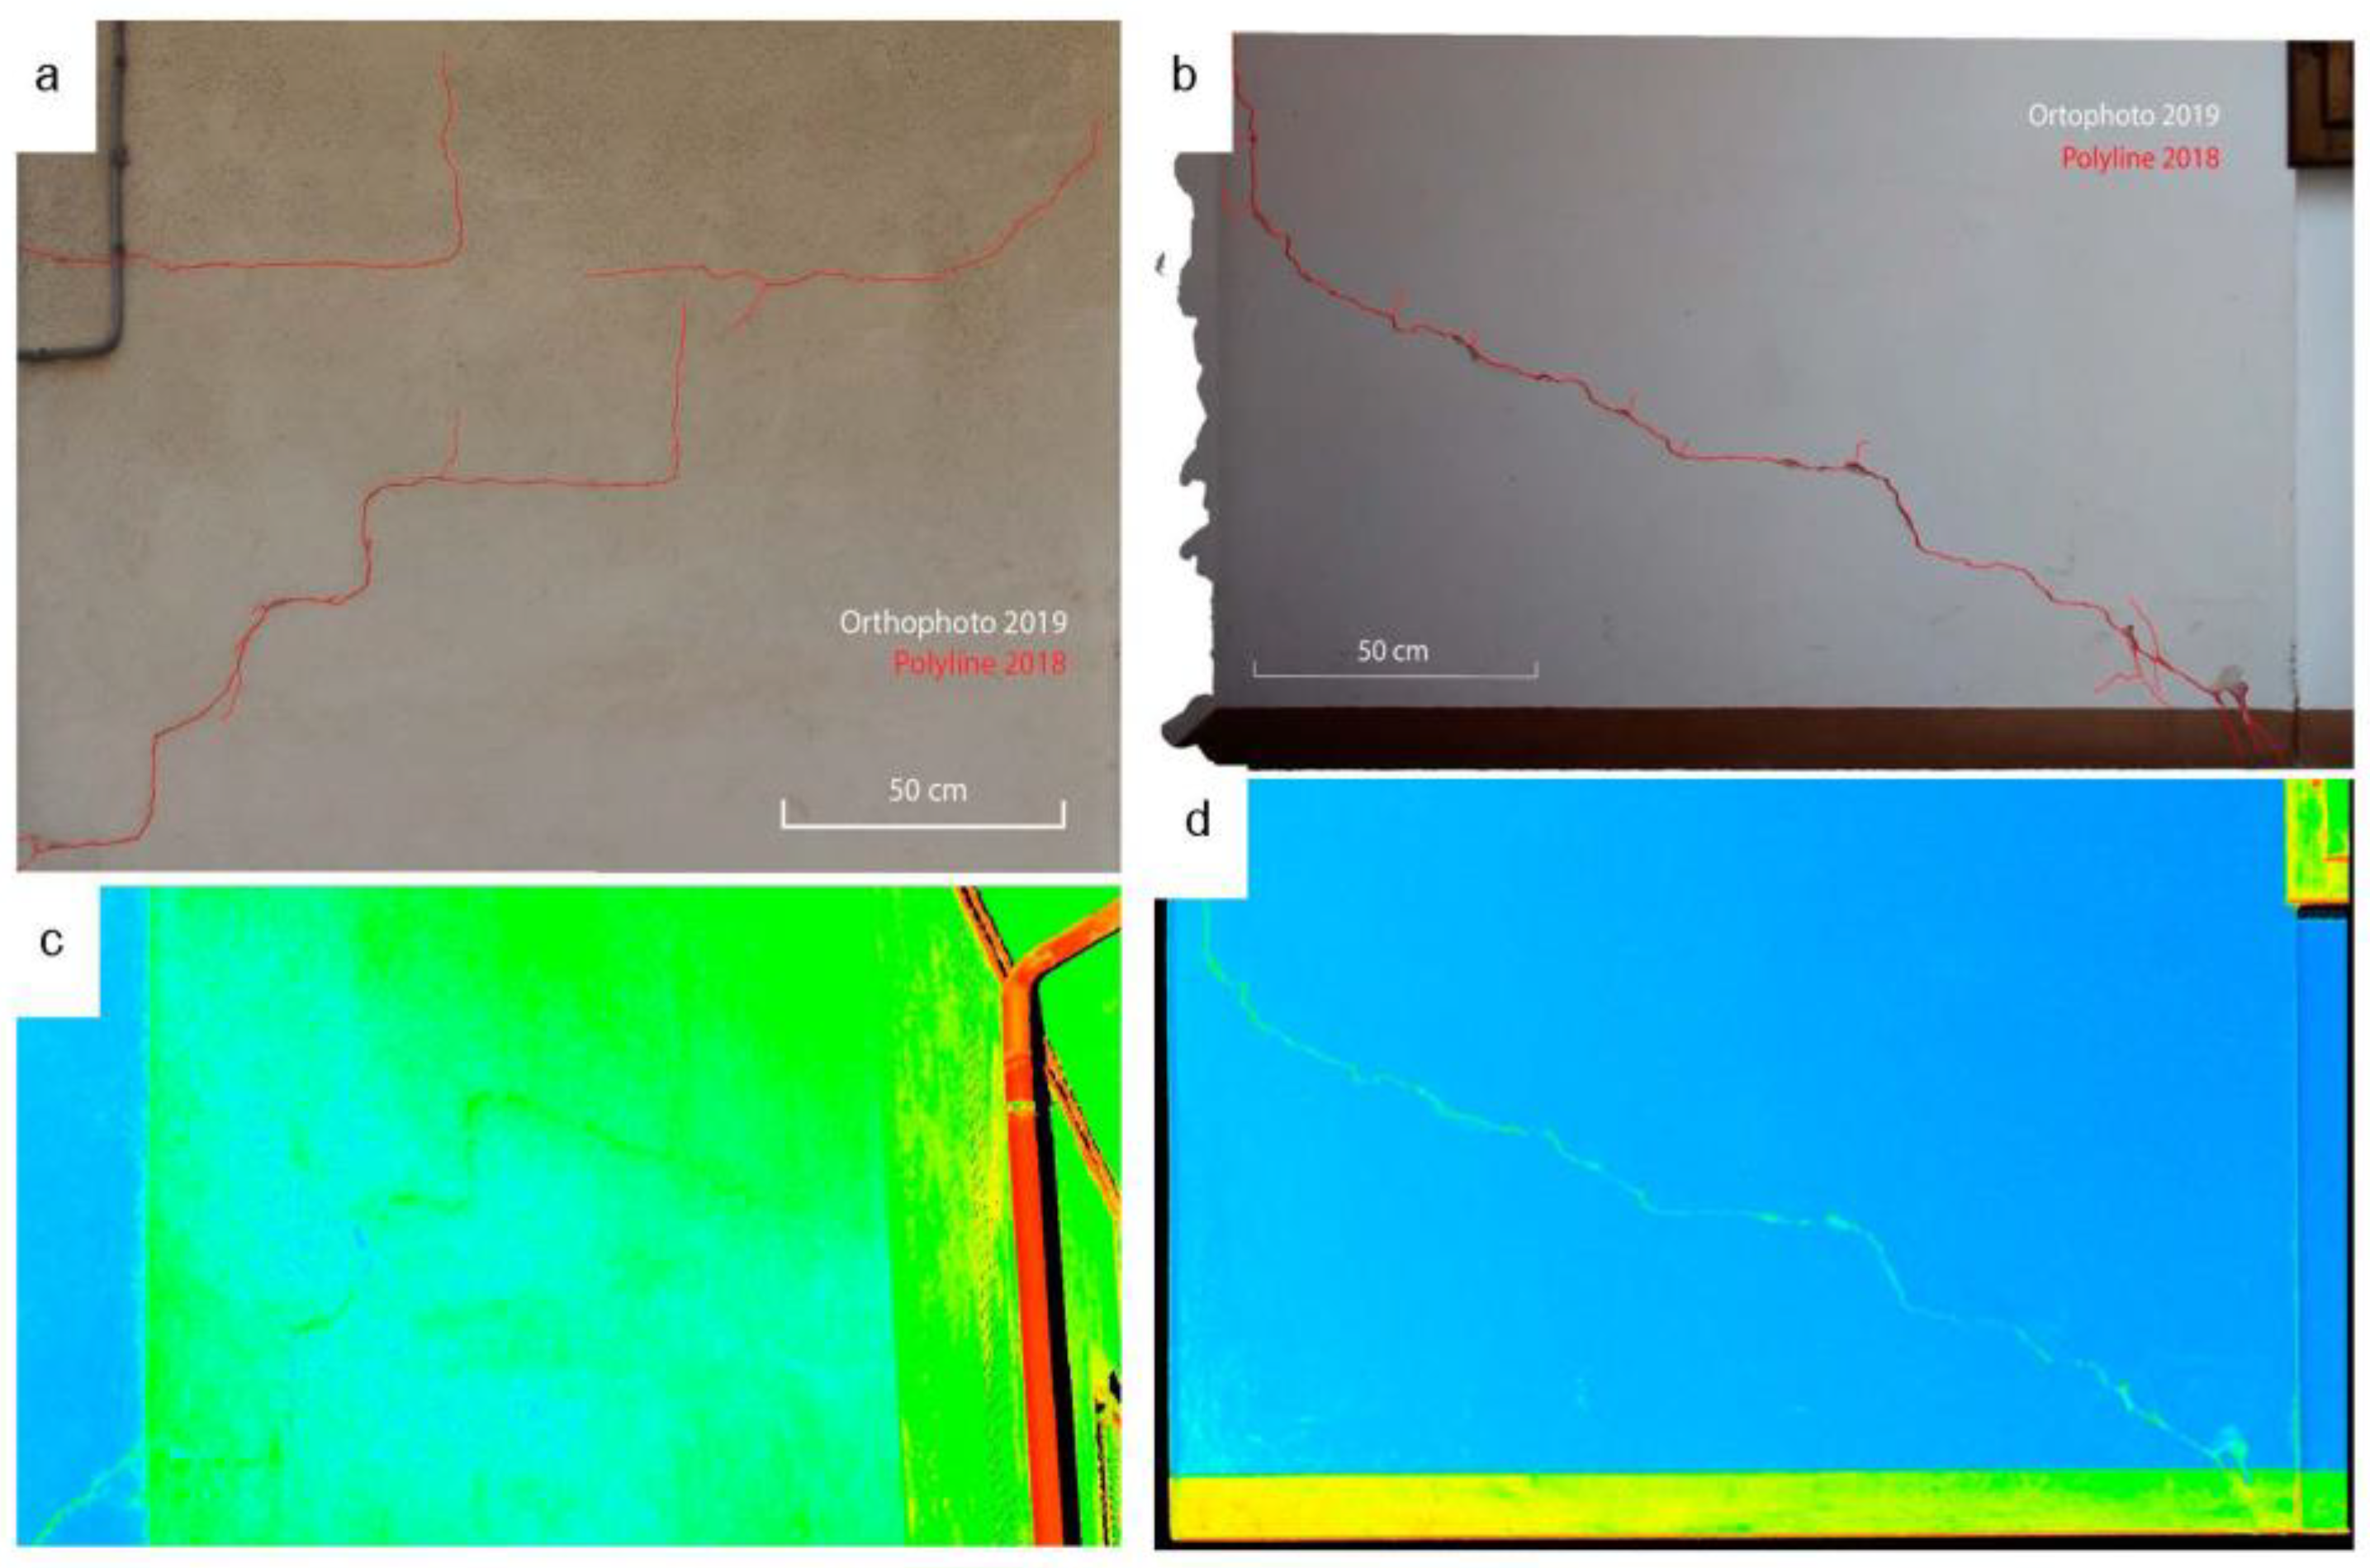
The SfM processing of the images was executed with the purpose to trace the evolution of the fractures in the observation period, thanks to the high-resolution imagery acquired by SLR camera. The reconstruction of a reliable 3D model and the extraction of the orthophotos can be validly used for identifying and tracking the discontinuities, with a higher capacity of representing small details on the surface of the objects than a point cloud. From the 3D model, the textured mesh using an orthomosaic of the corresponding images was obtained; subsequently, the extraction of the orthophoto was done defining 3 points on the surface of the wall and using them as reference for the projection of the textured mesh with pixel size of 1 mm. The orthophotos were used as base layer to draw the pattern of the cracks in the first (October 2018) and last (October 2019) surveys (
Figure 12). It was decided to use orthophotos from SfM rather than from TLS textured model because of the far better resolution of the images acquired by SLR camera and the impossibility to distinguish millimetric details in TLS point cloud. By superimposing the traces of the cracks detected in 2018 (red polylines in
Figure 12) on the 2019 orthophoto, it shows that the damage on the walls did not increase in the observation period.
5. Discussion
The obtained results show the very good performance of SBAS-InSAR technique in monitoring mass movements. The extended spatial coverage of SBAS results allows to identify the kinematic of the landslides and to detect the most active sectors. In addition, this technique provides low-noise time series of displacements which allow to estimate the temporal evolution of the movements and explore the triggering factors. For these reasons, despite SBAS technique is time-consuming from the computational viewpoint and for the operator intervention, it should be preferred to PS-InSAR based techniques [
14] which allow to estimate deformations affecting limited areas [
53]. PS techniques can be effectively used for analyzing highly urbanized unstable slopes, as shown in previous studies [
21,
22,
23,
24].
Interferometry results allowed to confirm the role of rainfall as triggering factor of the mass movements affecting Rovegliana slope. Comparing the displacement time series derived by SBAS processing to the rainfall pattern show that, in the monitoring period (2014–2019), the instabilities have been activated during the wet seasons (Spring and Autumn). An oscillation of the displacements has been measured with upward movements that can be correlated to rainfall spring events occurring after winter dry season. The fully comprehension of this phenomenon requires a detailed geotechnical investigation and modeling. Integrating remote sensing methods with geotechnical surveys and in situ monitoring of subsurface movements and pore pressure variations, would help in defining the relationships between rainfall and displacements and implementing effective mitigation measures [
54]. However, as observed in this study and in numerous previous surveys [
55,
56,
57] MT-InSAR represents a useful tool for the preliminary analysis of rainfall-induced landslides.
The velocity maps and the displacement time series derived by interferometry allowed investigating the influence of mass movements on the stability of anthropic structures in the study area. It was observed that the displacements measured at the location of the building in Cappellazzi and of Rovegliana Church are directly correlated with the activation of the instability phenomena affecting these sectors. These phenomena cause the displacement of blocks of buildings, but it is no possible to correlate landslides activation to the damages suffered by a single structure due to the resolution of Sentinel-1 SAR images. As shown by the overall results, this correlation is possible integrating interferometric data with ground-based surveys (i.e., GNSS, TLS and SfM).
GNSS data provided the 3D deformation vector at each GNSS point, with an accuracy in the order of 10 mm. The GNSS measurements, in agreement with the MT-InSAR results, provide horizontal displacement vectors directed toward the maximum slope (
Figure 9). The 2 NPS points used for monitoring deformations in Cappellazzi district and for georeferencing the topographic, TLS and photogrammetric acquisitions (1100 and 1200 of
Table 1) did not show any relative displacements each other: in fact, even if in the 3 survey campaigns the two GNSS vectors show relative differences of 8–9 mm, the direct measurements of the distance performed with the total station provided differences of 1 mm, value less than the precision of the instrument. The same consideration can be extended to the area of Rovegliana Church: the two GNSS displacement vectors (relative to the NPS points 2100 and 2200 of
Table 1) shows relative movements of 6–7 mm, but the direct measurements of the distance performed in the three surveys provided differences of 2 mm; for this reason, no differential displacements were recognized in the analyzed period, and the relative differences between the GNSS displacements vectors are due to the precision of the methodology that, in this study, can be assumed in the order of maximum 1 cm, that is the expected value [
58,
59].
The comparison between the coordinates of the artificial and natural topographic points located in different portions of the two buildings and separated by significant cracks, do not show relative displacements, indicating that the movements detected by GNSS and InSAR surveys involved the whole structures rigidly. This is confirmed by the multi-temporal TLS scans which did not detect any significant change in the crack pattern, as shown in
Figure 11 where the rigid and constant movement of the masonry element along the maximum slope is shown. Even the comparison between the images acquired in the first and last SfM surveys do not show any progression of the damages affecting the two structures (
Figure 12). This comparison was applied to the SfM models because the TLS data are widely used for identifying the deterioration of buildings, but in this case they are not reliable for the identification and monitoring of cracks patterns due to the not enough resolution of the texture in point clouds. TLS technique is very useful to detect localized or distributed movements, but the displacements have to be higher than 10–15 mm, to avoid errors due to the instrument and georeferencing process.
The findings of this study show that the mass movements observed by interferometry during the period October 2018–October 2019 (
Figure 7) have caused a rigid movement of the monitored buildings, because no differential deformations of the structures were detected by topographic, TLS and SfM surveys. Therefore, it can be argued that slope instabilities cause the displacement of block of buildings (
Figure 7a,e), but there is no direct relationship between landslide activity and temporal evolution of damage, each building reacts in different time according to its structural characteristics. These results can help in the assessment of landslide risk, but a geotechnical in-depth analysis of the landslides and the structural properties of the buildings would help to better correlate the slope dynamics to the damages suffered by the anthropic structures in order to implement the best mitigation strategies.
6. Conclusions
In this paper, we have proposed a methodology to investigate the relationships between mass movements and damages to human structures. The methodology is based on an effective integration of Sentinel-1 interferometry and ground-based geomatics techniques, such as global navigation satellite system (GNSS), terrestrial laser scanning (TLS) and structure from motion (SfM), supported by classical topographic measurements. The methodology was applied to the unstable slope of Rovegliana village (north-eastern Italian pre-Alps) to monitor the stability of anthropic structures after the activation of the mass movements.
The SBAS-InSAR technique was used to process Sentinel-1 A/B SAR data acquired in the period 2014–2019. This technique has shown a high performance, providing a large coverage of interferometry data over the study area and very low noise displacement time series which allowed to identify the most unstable sectors of the slope and the kinematic evolution of the landslides. However, due to the resolution of SAR images, the monitoring of the effects of mass movements on the structures is no possible. To this end, two damaged buildings were monitored through topographic, TLS and SfM surveys performed in October 2018, June 2019 and October 2019. In the same periods GNSS measurements were performed on eight non-permanent points inside the unstable area, to verify interferometry results and provide a reference system for the ground-based surveys.
The obtained results show that the location of the buildings investigated in detail and their surrounding areas were affected by mass movements in the period October 2018–October 2019, but the structures did not suffer any damage. This means that landslides cause the displacement of blocks of buildings and each of them reacts in different time depending on their structural properties.
The methodology and the findings of this study can help in landslide risk prevention. In the case of Rovegliana area, it is evident that mitigation measures have to be applied to ensure the global stability of the slope through structural and non-structural (monitoring) interventions. In the next future, we will continue space-borne and ground-based surveys to deepen the cause (landslide)–effect (damage to building) relation. We will consider processing high-resolution SAR data (i.e., COSMO-SkyMed data) to fill the gap of Sentinel-1 in monitoring anthropic structures. Given the high revisiting time of COSMO and Sentinel acquisitions, we expect that combining the results from multi-temporal differential SAR interferometry processing of different types of SAR data will allow a near real-time monitoring of the mass movements and elements at risk. Moreover, we will test the proposed methodology in other geological and geomorphological contexts such as alluvial and coastal plains, the most populated areas in the world, affected by subsidence phenomena which can threaten the stability of anthropic structures and infrastructures.


 ,
, 


