Abstract
Alpine topography is formed by a complex series of geomorphological processes that result in a vast number of different landforms. The youngest and most diverse landforms are various Quaternary sedimentary bodies, each characterised by its unique landform features. The formation of Quaternary sedimentary bodies and their features derive from the dominant building sedimentary processes. In recent years, studies of Quaternary sedimentary bodies and processes have been greatly aided by the use of digital elevation models (DEMs) derived by airborne laser scanning (ALS). High-resolution DEMs allow detailed mapping of sedimentary bodies, detection of surface changes, and recognition of the building sedimentary processes. DEMs are often displayed as hillshaded reliefs, the most common visualisation technique, which suffers from the limitation of a single illumination source. As a result, features can be barely visible or even invisible to the viewer if they are parallel to the light source or hidden in the shadow. These limitations become challenging when representing landforms and subtle landscape features in a diverse alpine topography. In this study, we focus on eleven visualisations of Quaternary sedimentary bodies and their sedimentary and morphological features on a 0.5 m resolution DEM. We qualitatively compare analytical hillshading with a set of visualisation techniques contained in the Raster Visualisation Toolbox software, primarily hillshading from multiple directions RGB, 8-bit sky view factor and 8-bit slope. The aim is to determine which visualisation technique is best suited for visual recognition of sedimentary bodies and sedimentation processes in complex alpine landscapes. Detailed visual examination of previously documented Pleistocene moraine and lacustrine deposits, Holocene alluvial fans, scree deposits, debris flow and fluvial deposits on the created visualisations revealed several small-scale morphological and sedimentary features that were previously difficult or impossible to detect on analytical hillshading and aerial photographs. Hillshading from multiple directions resulted in a visualisation that could be universally applied across the mountainous and hilly terrains. In contrast, 8-bit sky view factor and 8-bit slope visualisations created better visibility and facilitated interpretation of subtle and small-scale (less than ten metres) sedimentary and morphological features.
1. Introduction
The large-scale alpine topography is characterised by sharp peaks and deep valleys dominated by steep rock faces. This heterogeneous landscape consists of diverse landforms formed by the combined effect of tectonics, bedrock geology and Quaternary sedimentary processes. In particular, the large-scale alpine topography is characterised by sharp peaks and deep valleys dominated by steep rock faces. This heterogeneous landscape consists of diverse landforms formed by the combined effect of tectonics, bedrock geology and Quaternary sedimentary processes. In particular, the latter form sedimentary bodies with a distinctive shape, architecture and spatial distribution related to past or recent sedimentary transport and deposition processes [1,2,3,4,5,6,7,8,9]. Sedimentary bodies represent the most recent and very active stage in landscape formation and are thus the subject of studies regarding their formation processes, age, spatial extent and impact on human activities and infrastructure [10,11,12,13].
Geomorphological mapping in alpine environments can be challenging due to (often steep) inaccessible areas, dense vegetation, and persistence of seasonal snow cover. In these cases, only remote sensing techniques can be applied for geomorphological mapping. In recent decades, digital elevation models (DEMs) derived from airborne laser scanning (ALS) have been widely used for studies of Earth surface processes [14,15], and references therein]. DEMs proved to be an invaluable tool in geomorphological and natural hazards mapping, identifying geomorphological processes, detecting small-scale features, monitoring surface changes, reconstructing landscape evolution, re-evaluating the existing maps, and even determining surface age [16,17,18,19,20,21,22,23,24,25].
DEMs derived from ALS are usually visualised as analytical hillshading, the most widely used terrain visualisation technique existing in all GIS programmes [19,26,27]. It is widely used as a general representation of a specific area or a basis for in-depth surface analysis. It is often used as a general representation of a particular area or as a basis for in-depth surface analysis. However, landscape analysis based solely on analytical hillshading can lead to either misinterpretation of the landscape due to relief inversion [28], aerial perspective [29] and by overlooking important features hidden in shadow or aligned parallel to the direction of illumination [27,30,31].
Since the visual inspection of DEMs is usually the first step in mapping and landscape analysis, the terrain must be clearly and unambiguously visualised [27,32]. To represent terrain morphology and landscape features more comprehensively, various other visualisation techniques can be used, such as sky view factor, slope, principal component analysis, visualisation for archaeological topography (VAT), etc. [21,27,30,33,34,35,36,37,38]. These visualisation techniques are widely used in the field of archaeology [30,36,39,40,41,42,43], where the detection of even subtle small-scale (metre size) manmade features is essential. Similarly, detecting subtle geomorphological features can vastly improve the understanding and interpretation of the dynamics of surface processes. However, geomorphological features are rarely studied using visualisation techniques other than analytical hillshade, despite their proven applicability in landscape analysis [21,35,44,45,46].
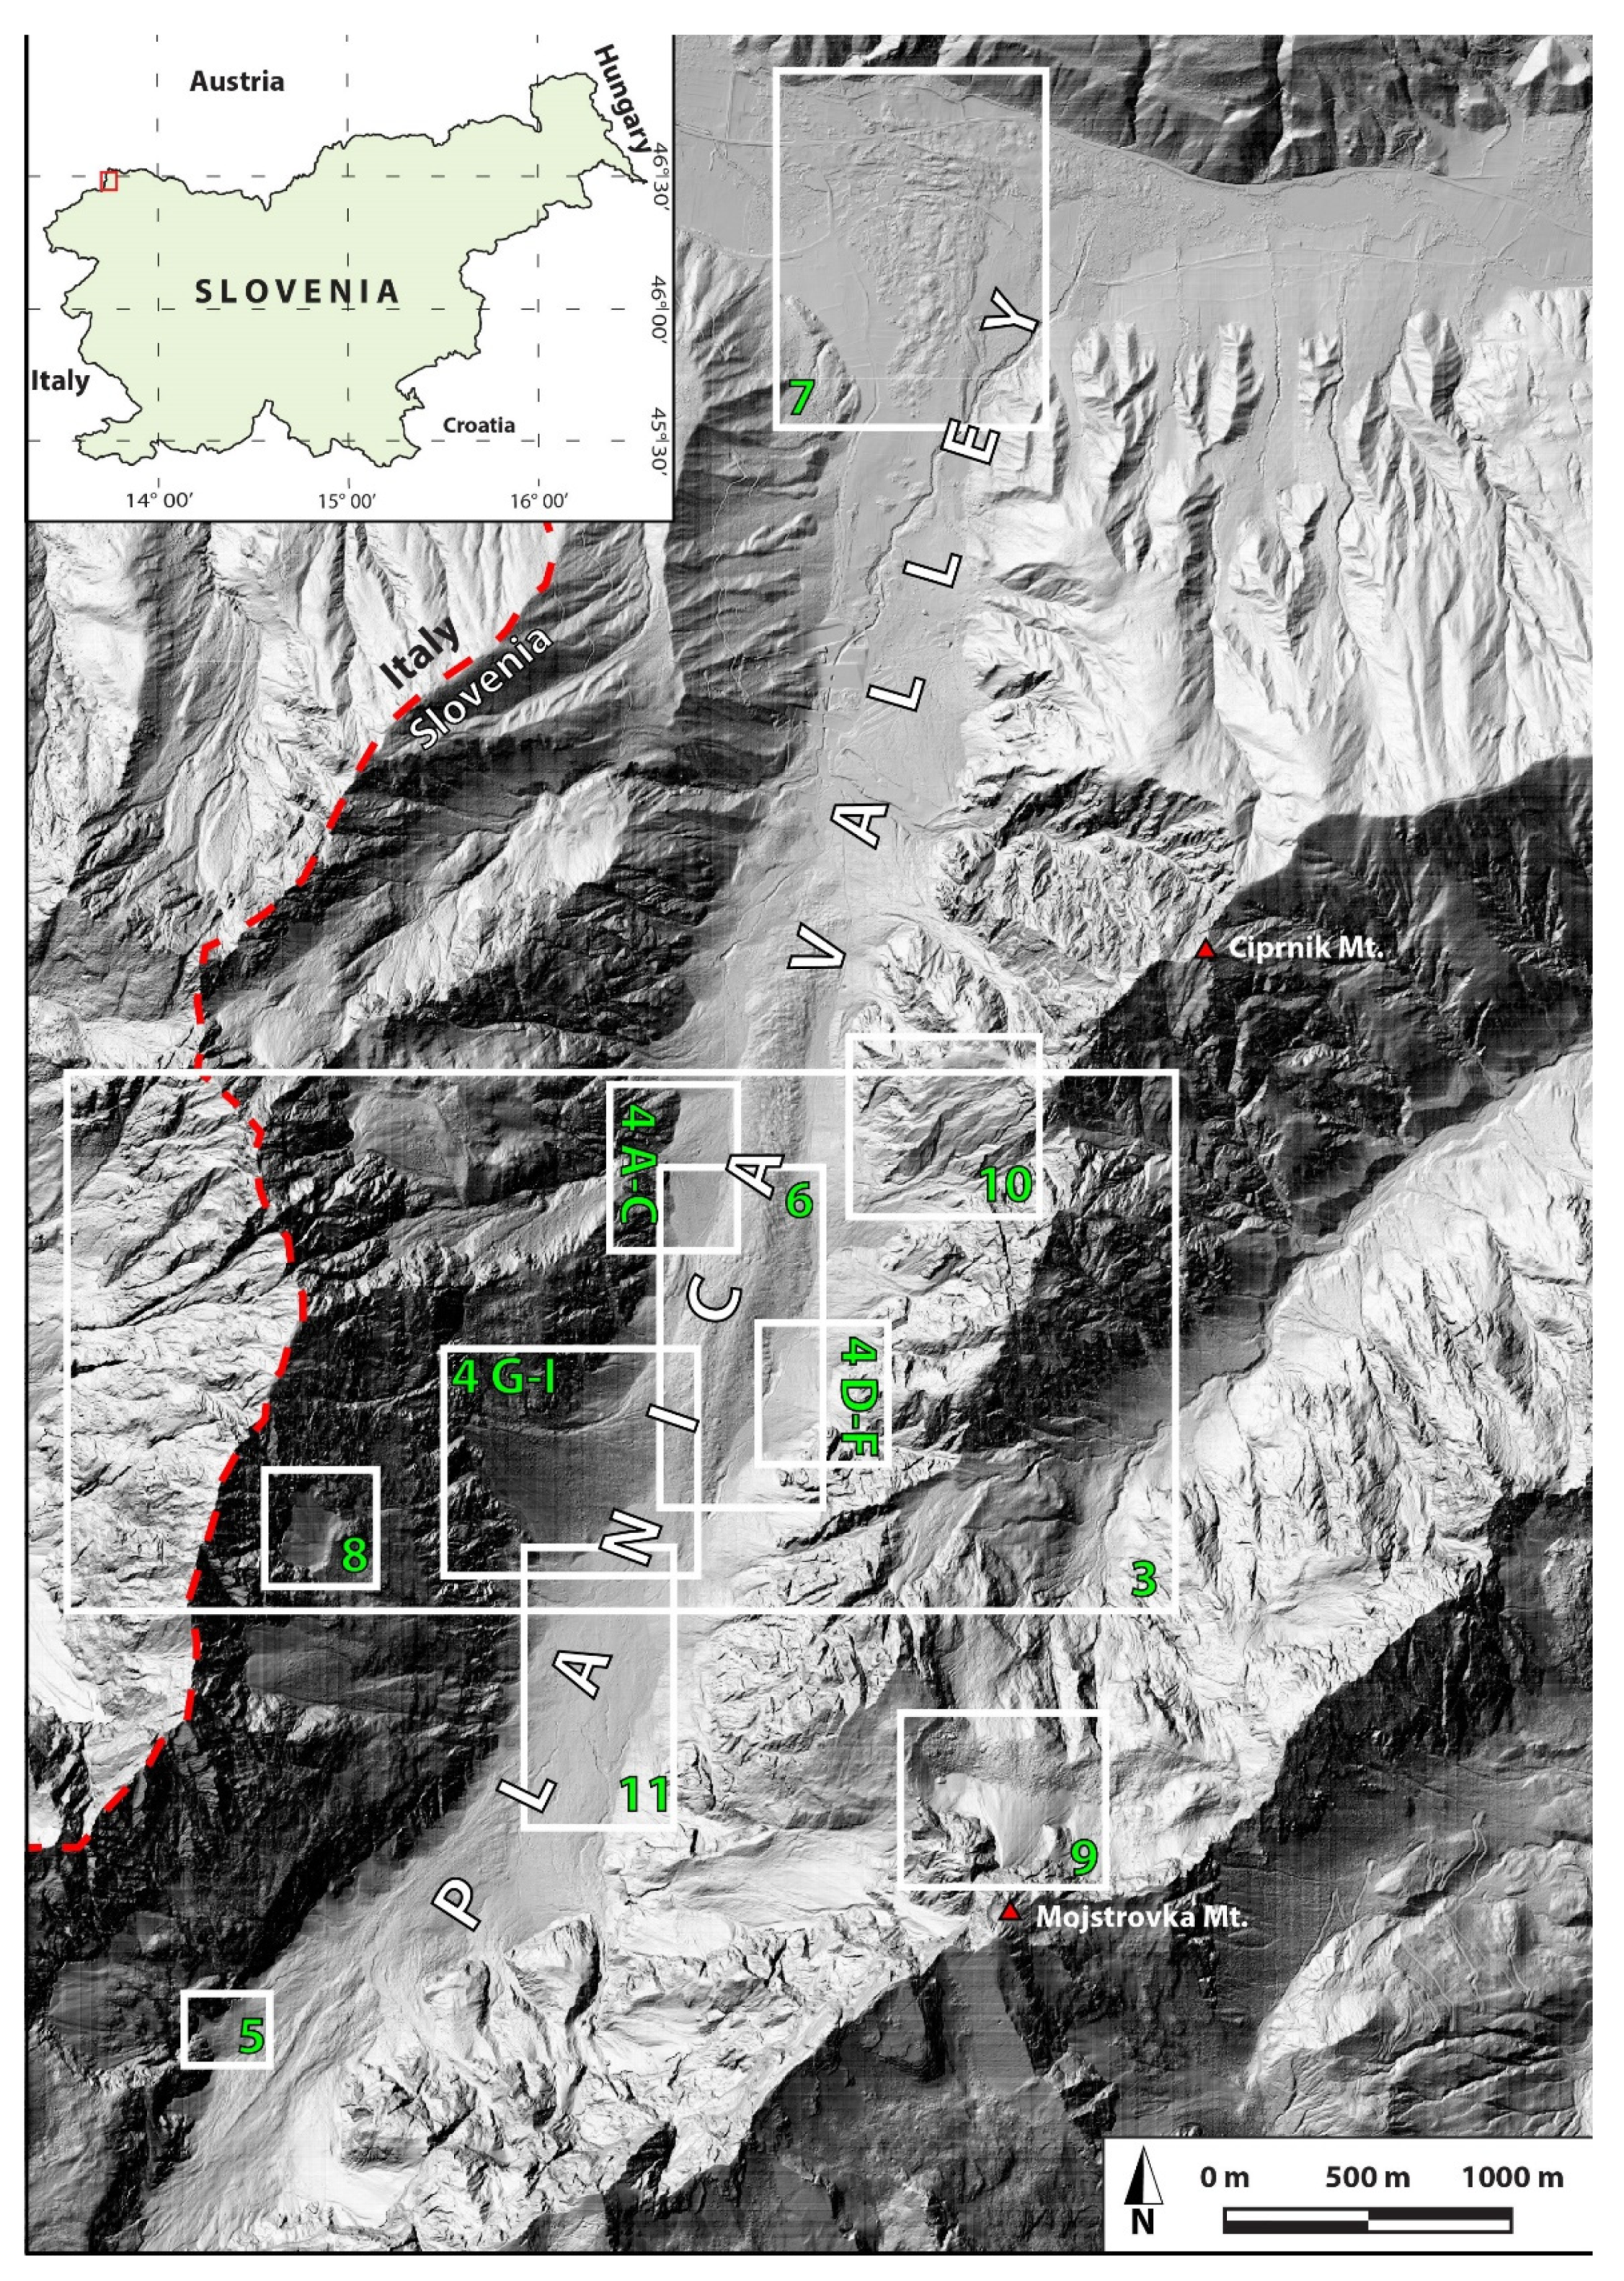
This study qualitatively compares different visualisations of Quaternary sedimentary bodies typical of the alpine landscape on DEMs with 0.5 m resolution derived from openly available airborne laser scanning data. The analysis is performed in the Planica Valley in the Julian Alps, NW Slovenia (Figure 1), where a diverse set of Quaternary sedimentary bodies has been thoroughly field mapped and identified in previous studies [47,48,49,50]. The availability of ALS data and presence of typical alpine geomorphological features assembled at one location provide an excellent testing area for comparison of different DEM visualisations. We tested eleven visualisation techniques to visually identify previously documented small- and large-scale sedimentary and geomorphological features of Quaternary deposits. Based on identification success, we qualitatively evaluate the advantages and disadvantages of the different visualisation techniques and determine which techniques are best suited for on-screen mapping and analysis of the alpine landscape.
Study Site
The study site is located in the Planica valley in the Julian Alps (NW Slovenia, Figure 1). The mountains surrounding the valley are predominantly composed of Upper Triassic carbonate rocks [51,52], while the valley floor and its lower slopes are covered by various Quaternary sedimentary bodies [47]. We choose this site because several detailed studies [47,48,49,50] located, analysed, and described a variety of different types of Quaternary sedimentary bodies. These studies are based on detailed field work, except for [49], which solely relies on inspection of an ALS derived hillshaded DEM. Each type of sedimentary deposit in the valley has a distinct morphology derived from its predominant sedimentary transport and depositional mechanism. The oldest sedimentary bodies are glacial moraines and lacustrine deposits which are of Pleistocene age and cover the valley floor. After the retreat of the Pleistocene glacier, the valley began to fill with a variety of Holocene sediments [47].
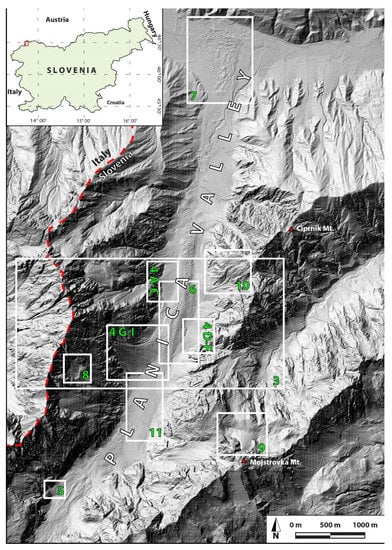
Figure 1.
Study site of the Planica valley in NW Slovenia. White rectangles and corresponding numbers refer to locations and Figures of Quaternary sedimentary bodies studied in detail in the produced visualisations. DEM is produced from freely available ALS data source [53].
Figure 1.
Study site of the Planica valley in NW Slovenia. White rectangles and corresponding numbers refer to locations and Figures of Quaternary sedimentary bodies studied in detail in the produced visualisations. DEM is produced from freely available ALS data source [53].
2. Materials and Methods
2.1. Characteristics of Quaternary Sedimentary Bodies
Following the most recent geomorphological study by [47], Quaternary sedimentary bodies can be grouped into six landform types, each with typical morphological and sedimentary features.
2.1.1. Pleistocene Moraines
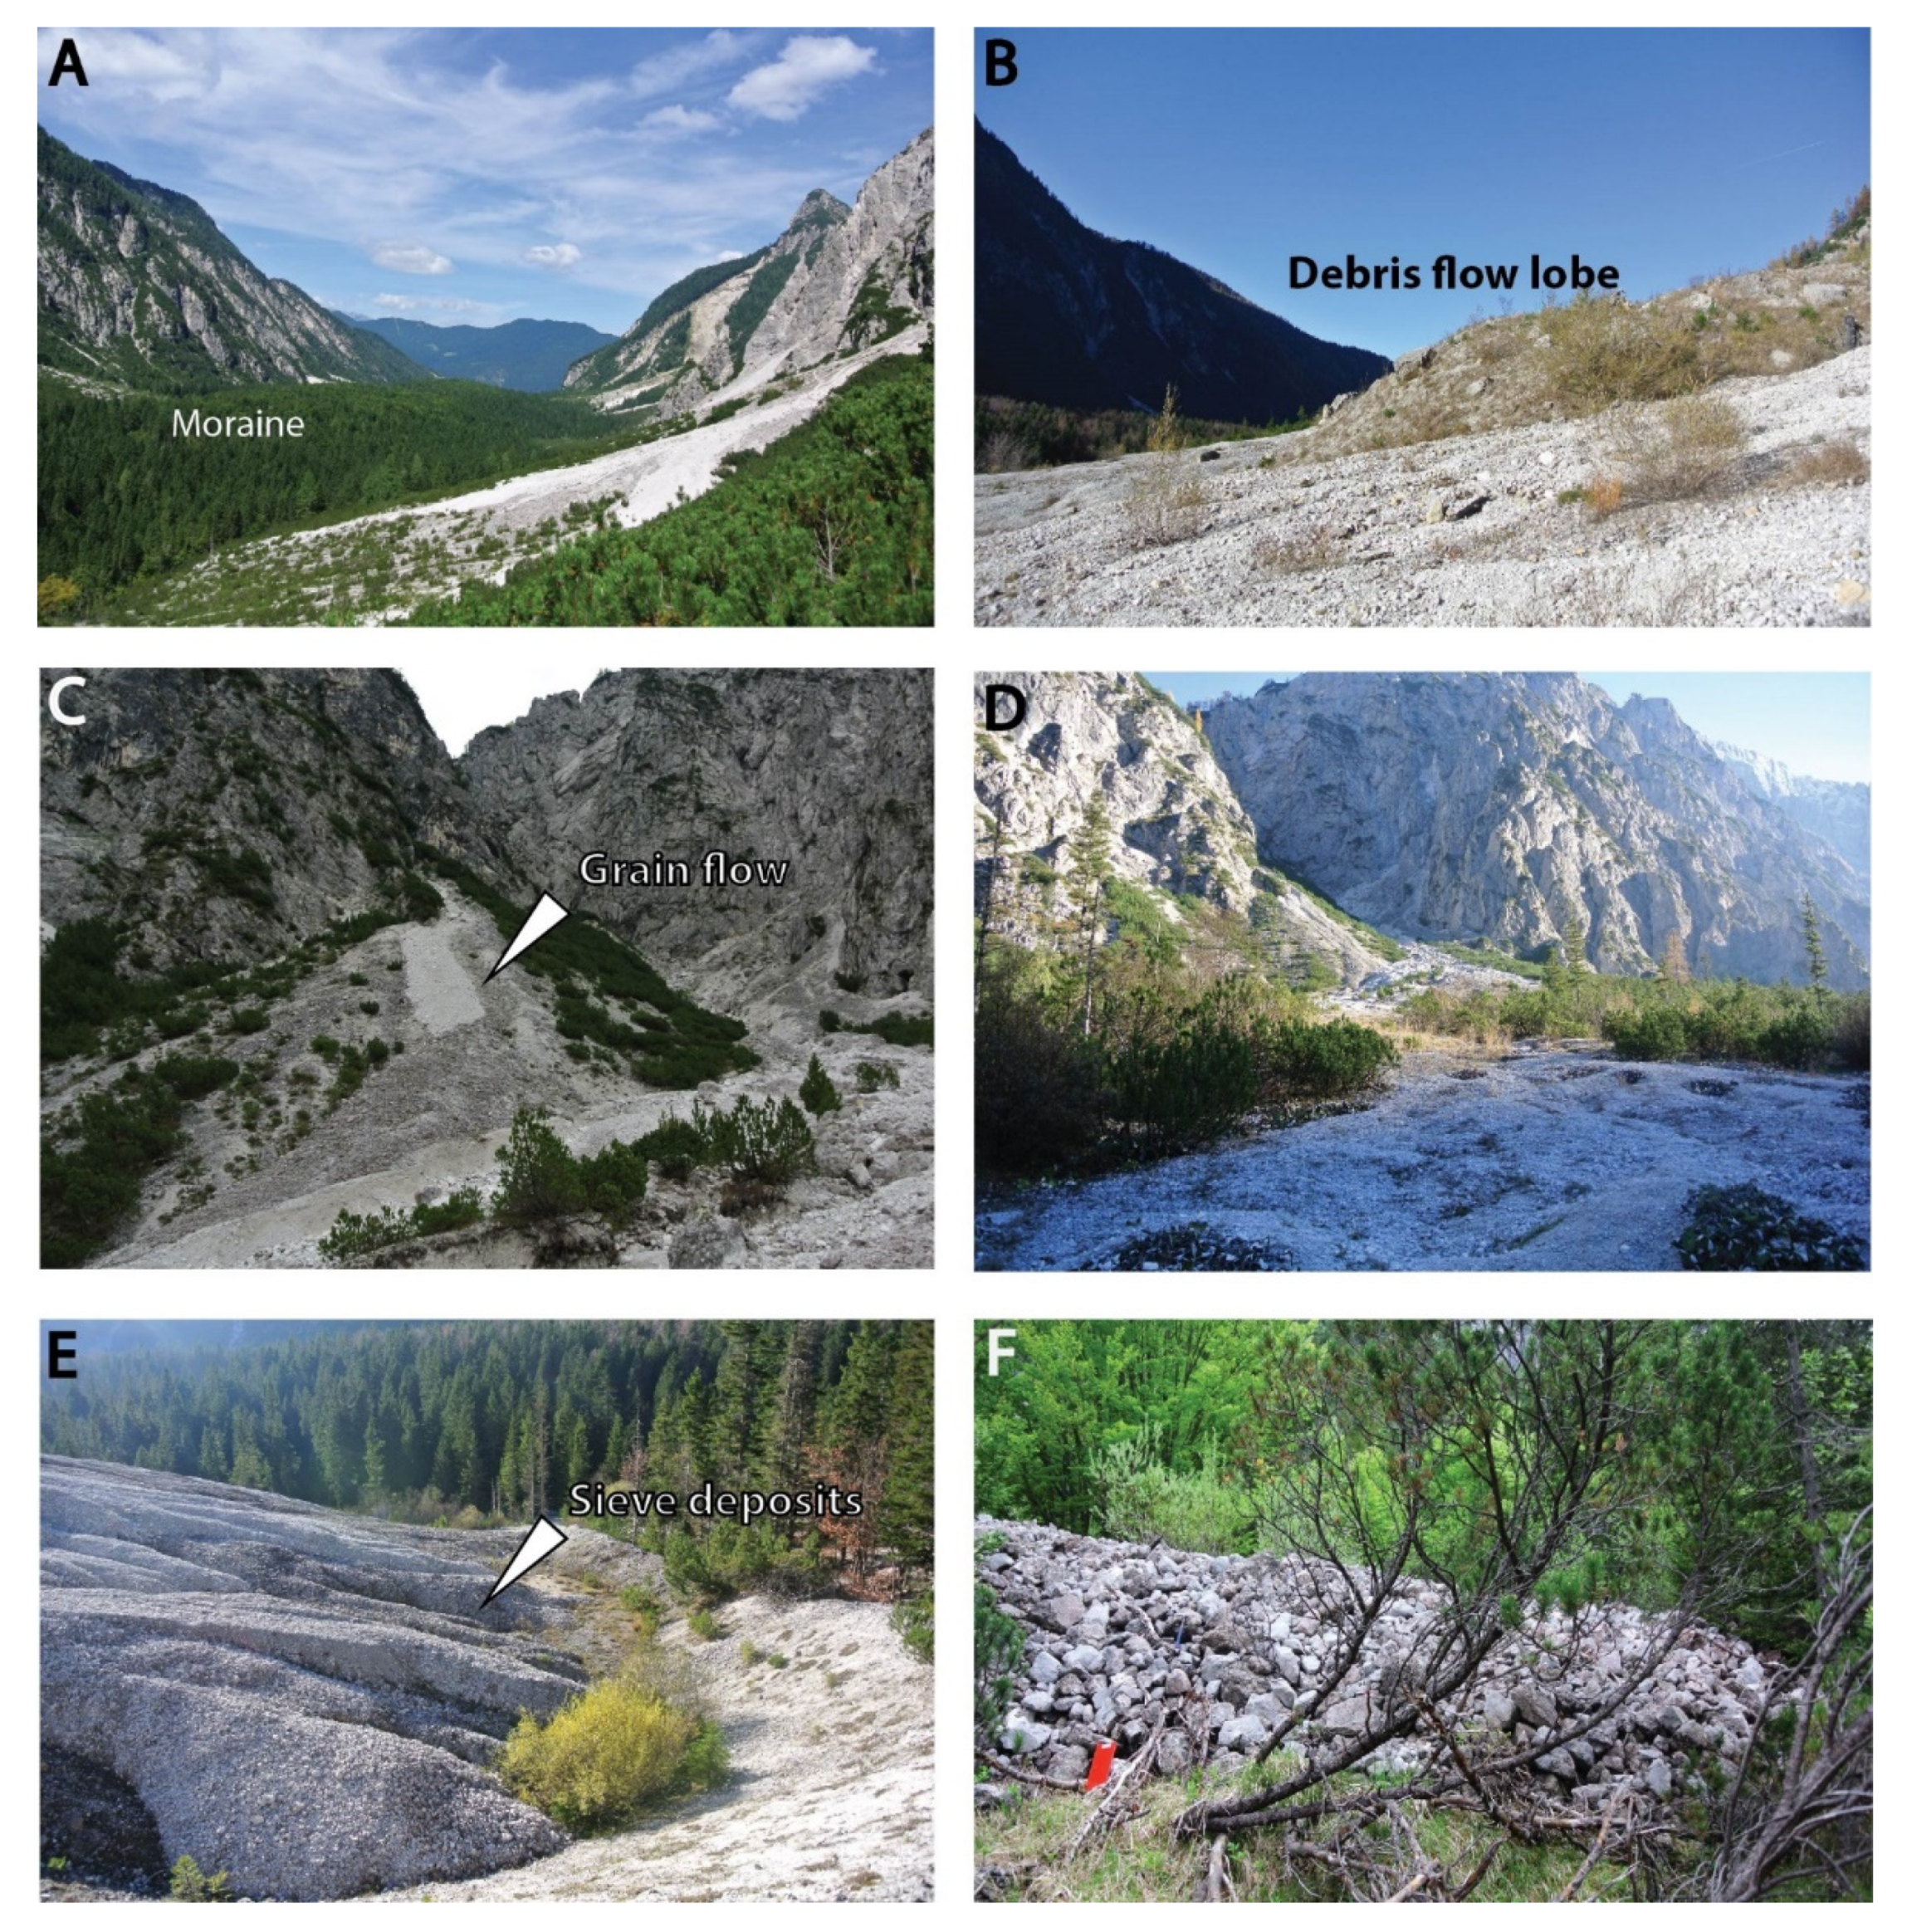
The valley floor is covered by a large moraine (approximately 2.5 km long and up to 500 m wide) that forms a distinct, undulating topographic ridge 30 m high (Figure 2A). It is composed of poorly sorted sediment whose grain size varies from silt to several tens of cubic metres of boulders. Studies by [48,49] also identified Pleistocene moraines located at the valley entrance and on the high slopes above the valley floor.
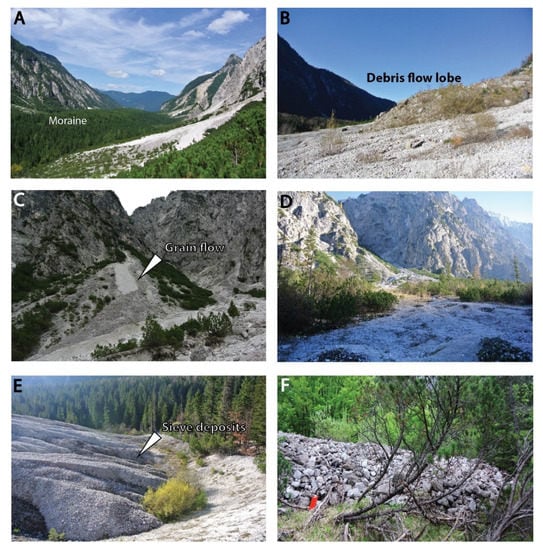
Figure 2.
Examples of sedimentary bodies in Planica Valley. (A) Large Pleistocene moraine in the valley floor forming a 30 m high topographic ridge. (B) Debris flow lobe (approximately 5 m high). (C) Small grain flow deposited onto a scree deposit. (D) Out-of-channel (sheetflood) deposit in the distal parts of an alluvial fan. (E) Sieve deposits (dimension: 10 by 5 m and a height of half a meter. (F) A sedimentary deposit (note red A4 sized map to the left corner) with a similar sedimentary texture to sieve deposits (approx. three meters high) defined as “mega sieve deposits” in this study.
2.1.2. Lacustrine Deposits
Lacustrine deposits outcrop only at one location in the valley and represent a topographic depression with a flat floor. The deposits consist of clay, silt, and very fine sand particles.
2.1.3. Fluvial Deposits
Fluvial deposits consist of sand and gravel transported by perennial water streams. Morphologically, fluvial deposits form plains with incised torrential channels and thin splay (out-of-channel) deposits of sand and gravel. The fluvial deposits are partially anthropogenically reworked due to the use of the land as pasture.
2.1.4. Debris Flow Lobe
In recent years, a debris flow occurred on the southwestern slopes of the Ciprnik mountain in November 2000 [47,50]. It partially covered an older alluvial fan and formed a lobe up to five metres high (Figure 2B), composed of clasts of clay to boulders several metres in size.
2.1.5. Talus Slopes
Talus slopes consist of very angular gravels accumulated beneath steep talus slopes and can be categorised into active and inactive talus slopes. Inactive talus slopes are generally located at lower elevations, are covered by vegetation, and have less active sediment deposits. Active talus slopes are located at higher elevations where sediment is actively deposited as rock-fall or as grain-flows via gullies (Figure 2C). Their surface inclination is larger than 30°.
2.1.6. Alluvial Fans
Alluvial fans are the most numerous sedimentary bodies with a surface slope of 5 to 25°. Most of them are categorised as Type I and II following the work of [54]. There are no permanent water streams in the valley, so sediment deposition occurs only during high rainfall events. Sediment (particles ranging from sand to very coarse cobble) is deposited either in torrential channels cut into the fans or outside the channels (Figure 2D). Sediment deposited outside the channel forms sheetflood deposits and also sieve deposits of various sizes (Figure 2C,D).
2.2. Data Acquisition and Visualisation Creation
The ALS classified point cloud data were obtained from the openly available Airborne laser scanning dataset of Slovenia [53]. Airborne laser scanning was performed between July 2014 and January 2015 using the LMS-Q780 scanner with an average scanning density of 5 points/m2. The classified point cloud was filtered in ESRI ArcGIS to man-made objects and bare ground, without of vegetation (point classes 0, 2 and 6) using ESRI ArcGIS raster conversion tools [55,56]. The generated DEM has a resolution of 0.5 m and covers a total area of 42 km2, i.e., the area of the valley and surrounding mountain ridges. We choose this resolution to better detect small-scale features such as boulders, sieve deposits and shallow channels.
Visualisations of the DEM were performed using the Raster Visualisation Toolbox (RVT), an open-source software developed by ZRC SAZU and the University of Ljubljana [27,57]. RVT provides eleven different types of visualisations, which can be generated from the input raster file. Each visualisation can be modified by a wide range of setting parameters specific to each visualisation technique [27,30]. The parameters and algorithms for each visualisation used in this study were set to the program’s default settings (Table 1) and are described in detail in [27,30,37,57]. Default settings were used since it offers best feature recognition based on previous studies [35]. A comparison of the produced visualisations was performed in QGIS 3.20 [58] where landforms and features were measured, and their terrain profiles were created using QGIS Profile Tool plugin [59].

Table 1.
Parameters set for each visualisation type in accordance with the RVT default setting [57].
2.3. Visualisation Analysis and Identification of Landscape Features
The visualisations contained in the RVT toolbox were developed for use in a large variety of terrains: from very low-gradient flat areas to rugged reliefs. For this reason, some visualisations are more suited to certain terrain types and perform less optimally in other settings [37,57]. In mountainous terrain slope inclination varies greatly resulting in a complex topography with generally low- to moderately-sloping sedimentary bodies and high-gradient relief of rock outcrops. We firstly performed a general visual interpretation of the eleven visualisations. The initial requirement for each visualisation was to provide a clear, unambiguous and intuitive distinction of the main features: valley floor, slopes, summits, ridgelines, topographic depressions, and break lines. If the produced visualisation provided a poor and unintuitive distinction of basic mountainous features, the visualisation was not used for further detailed analysis. In the second stage, we selected those visualisations that were most suitable for detailed analysis of the studied area following the criteria of [27] (e.g., clear visibility of small-scale features, intuitive visualisation, no artificially produced artifacts, etc.) and compared them with analytical hillshading. Subsequent more detailed analyses were based on qualitative visual analysis of Quaternary sedimentary bodies documented in previous studies and conducted field work. We selected specific sedimentary bodies where geomorphological and sedimentary features specific to the type of sedimentary body are evident. We validated whether these landform features are also visible on derived visualisations and if so, we evaluated which visualisation provided better feature recognition based on a qualitative visualisation assessment. To accomplish this, we compiled a list of distinct morphological and sedimentary features we aimed to identify on each type of sedimentary body. The locations and figures of the investigated Quaternary sedimentary bodies are shown in Figure 1, and their distinctive surface features that we were searching for are listed in Table 2.

Table 2.
Distinctive morphological and sedimentary features of investigated sedimentary bodies.
3. Results
3.1. Comparison of All Eleven Visualisation Types
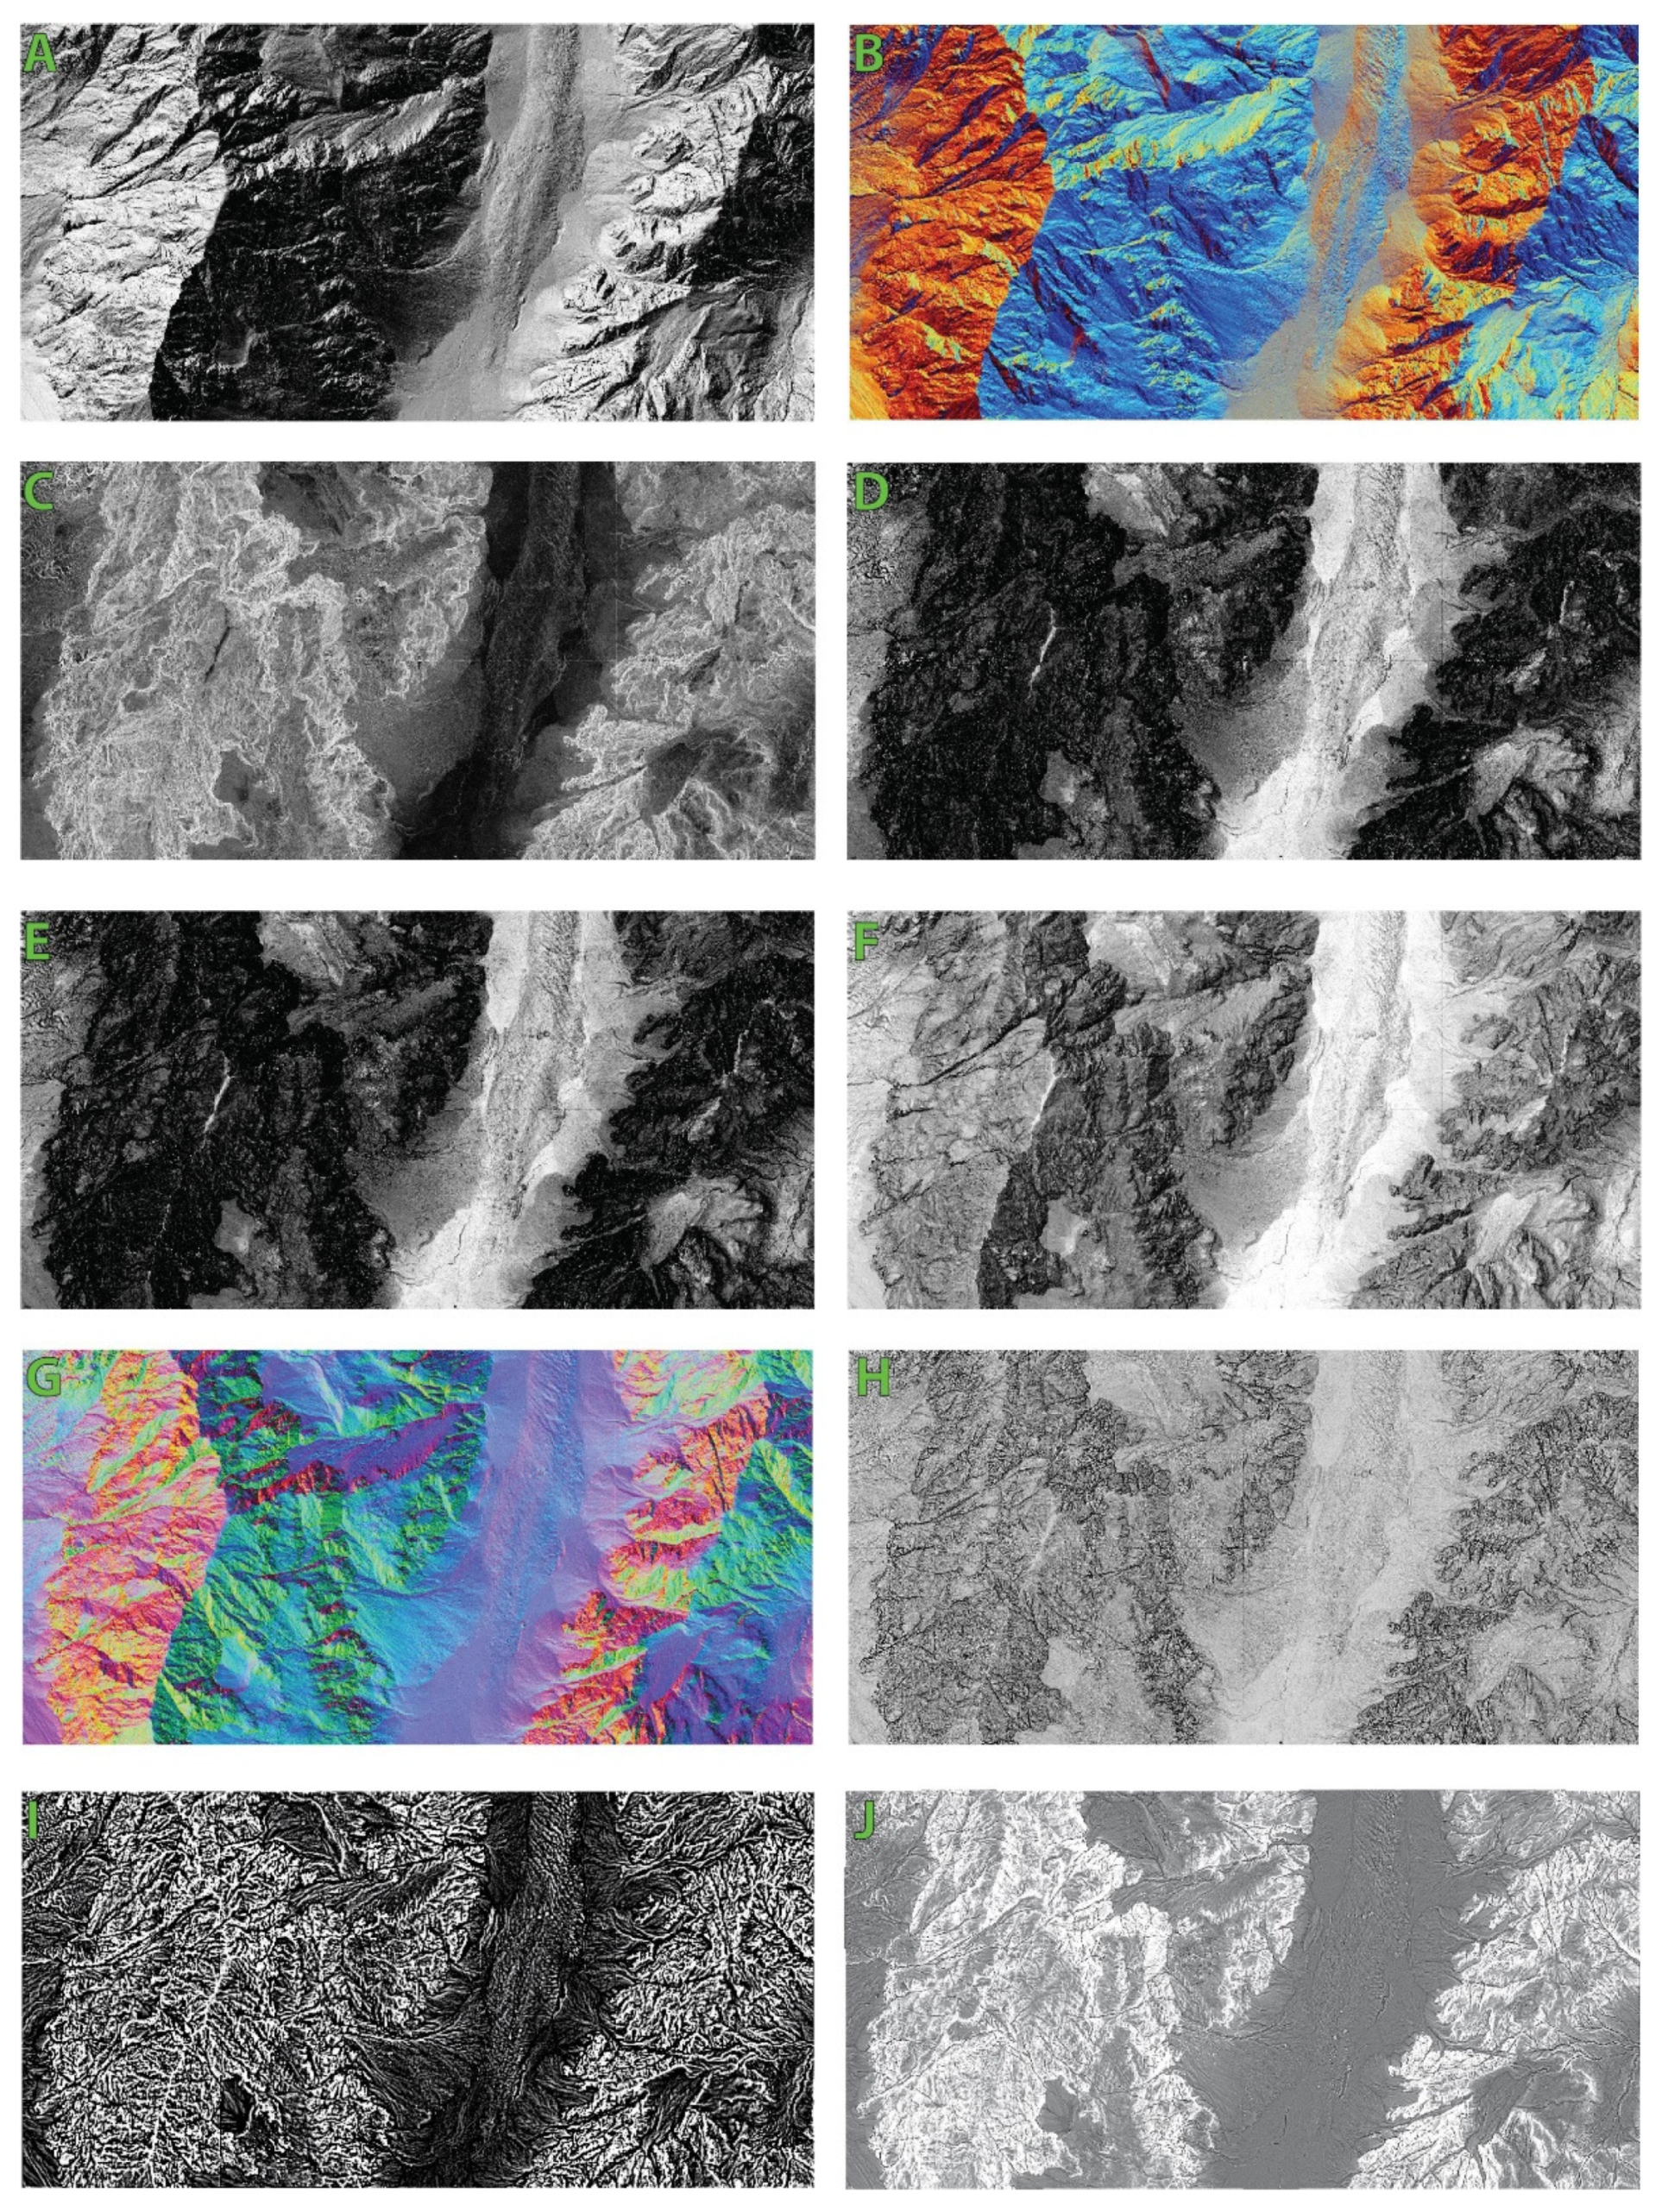
Based on the comparison of the eleven produced visualisations, we selected hillshading from multiple directions (RGB, number of directions (D) 16 and Sun elevation angle (H) 35), compressed 8-bit slope visualisation and compressed 8-bit sky view factor visualisation for further in-depth analysis of selected sedimentary bodies (Figure 3). These three visualisations offered comparable distinction of basic mountain features (mountain tops, ridges, valley floor, etc.) to analytical hillshading. Later the three visualisations were compared with the analytical hillshading (azimuth (A) 315° and H 35°) and, in a few cases, with aerial photographs for detail analysis of small and subtle features on a larger scale. The used 0.5 m resolution offers optimal cell size for feature detection since objects do not appear fragmented or blurred.
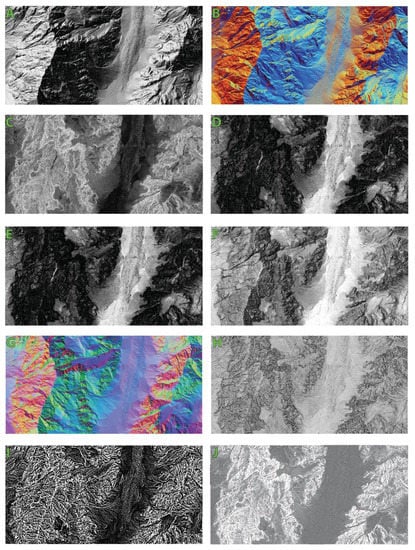
Figure 3.
Examples of produced visualisations (for location see rectangle 3 in Figure 1). (A) Analytical Hillshading (Azimuth (A) 135, Sun elevation angle (H) 35, 8-bit); (B) Hillshading from multiple directions RGB (number of directions (D) 8, H35); (C) Slope gradient; (D) Slope gradient 8-bit version; (E) Sky view factor (radius (R)10, D16 8-bit version); (F) Sky view factor allow (R10, D 16 A315); (G) Principal component analysis from hillshading (D16, H35); (H) Openness positive (R10, D16 8-bit version); (I) Simple local relief model (Radius of trend assessment: 20); (J) Local dominance (minimum radius: 10, maximum radius 20).
The remaining visualisations were not used for further detailed surface analysis of Quaternary landforms since they are more suitable for flatter surfaces and therefore offer poorer and less intuitive recognitions of basic mountain features (Figure 3). These visualisations do not always offer adequate recognition of small and subtle features on moderate to low-gradient surface typical for the studied Quaternary sedimentary bodies. Although the principal component analysis of hillshading (Figure 3G) provides recognition of small-scale features, it is not intuitive for interpreting the complex alpine landscape. Anisotropic sky view factor offers better recognition of surface morphology on steep slopes but features on low-slope sedimentary bodies are less pronounced (Figure 3F). Local dominance, simple local relief model, sky illumination model, uncompressed slope visualisation, positive and negative openness provide clear recognition between prominent break line in surface inclinations such as rock walls and valley floor (Figure 3I,J). However, these visualisations did not provide sufficient visibility of features on moderate to low-gradient Quaternary sedimentary bodies, where small-scale features are very poorly or not at all visible and challenging to delineate despite the high resolution of DEM.
3.2. Visual Analysis of Sedimentary Bodies and Identification of Landscape Features
3.2.1. Alluvial Fans
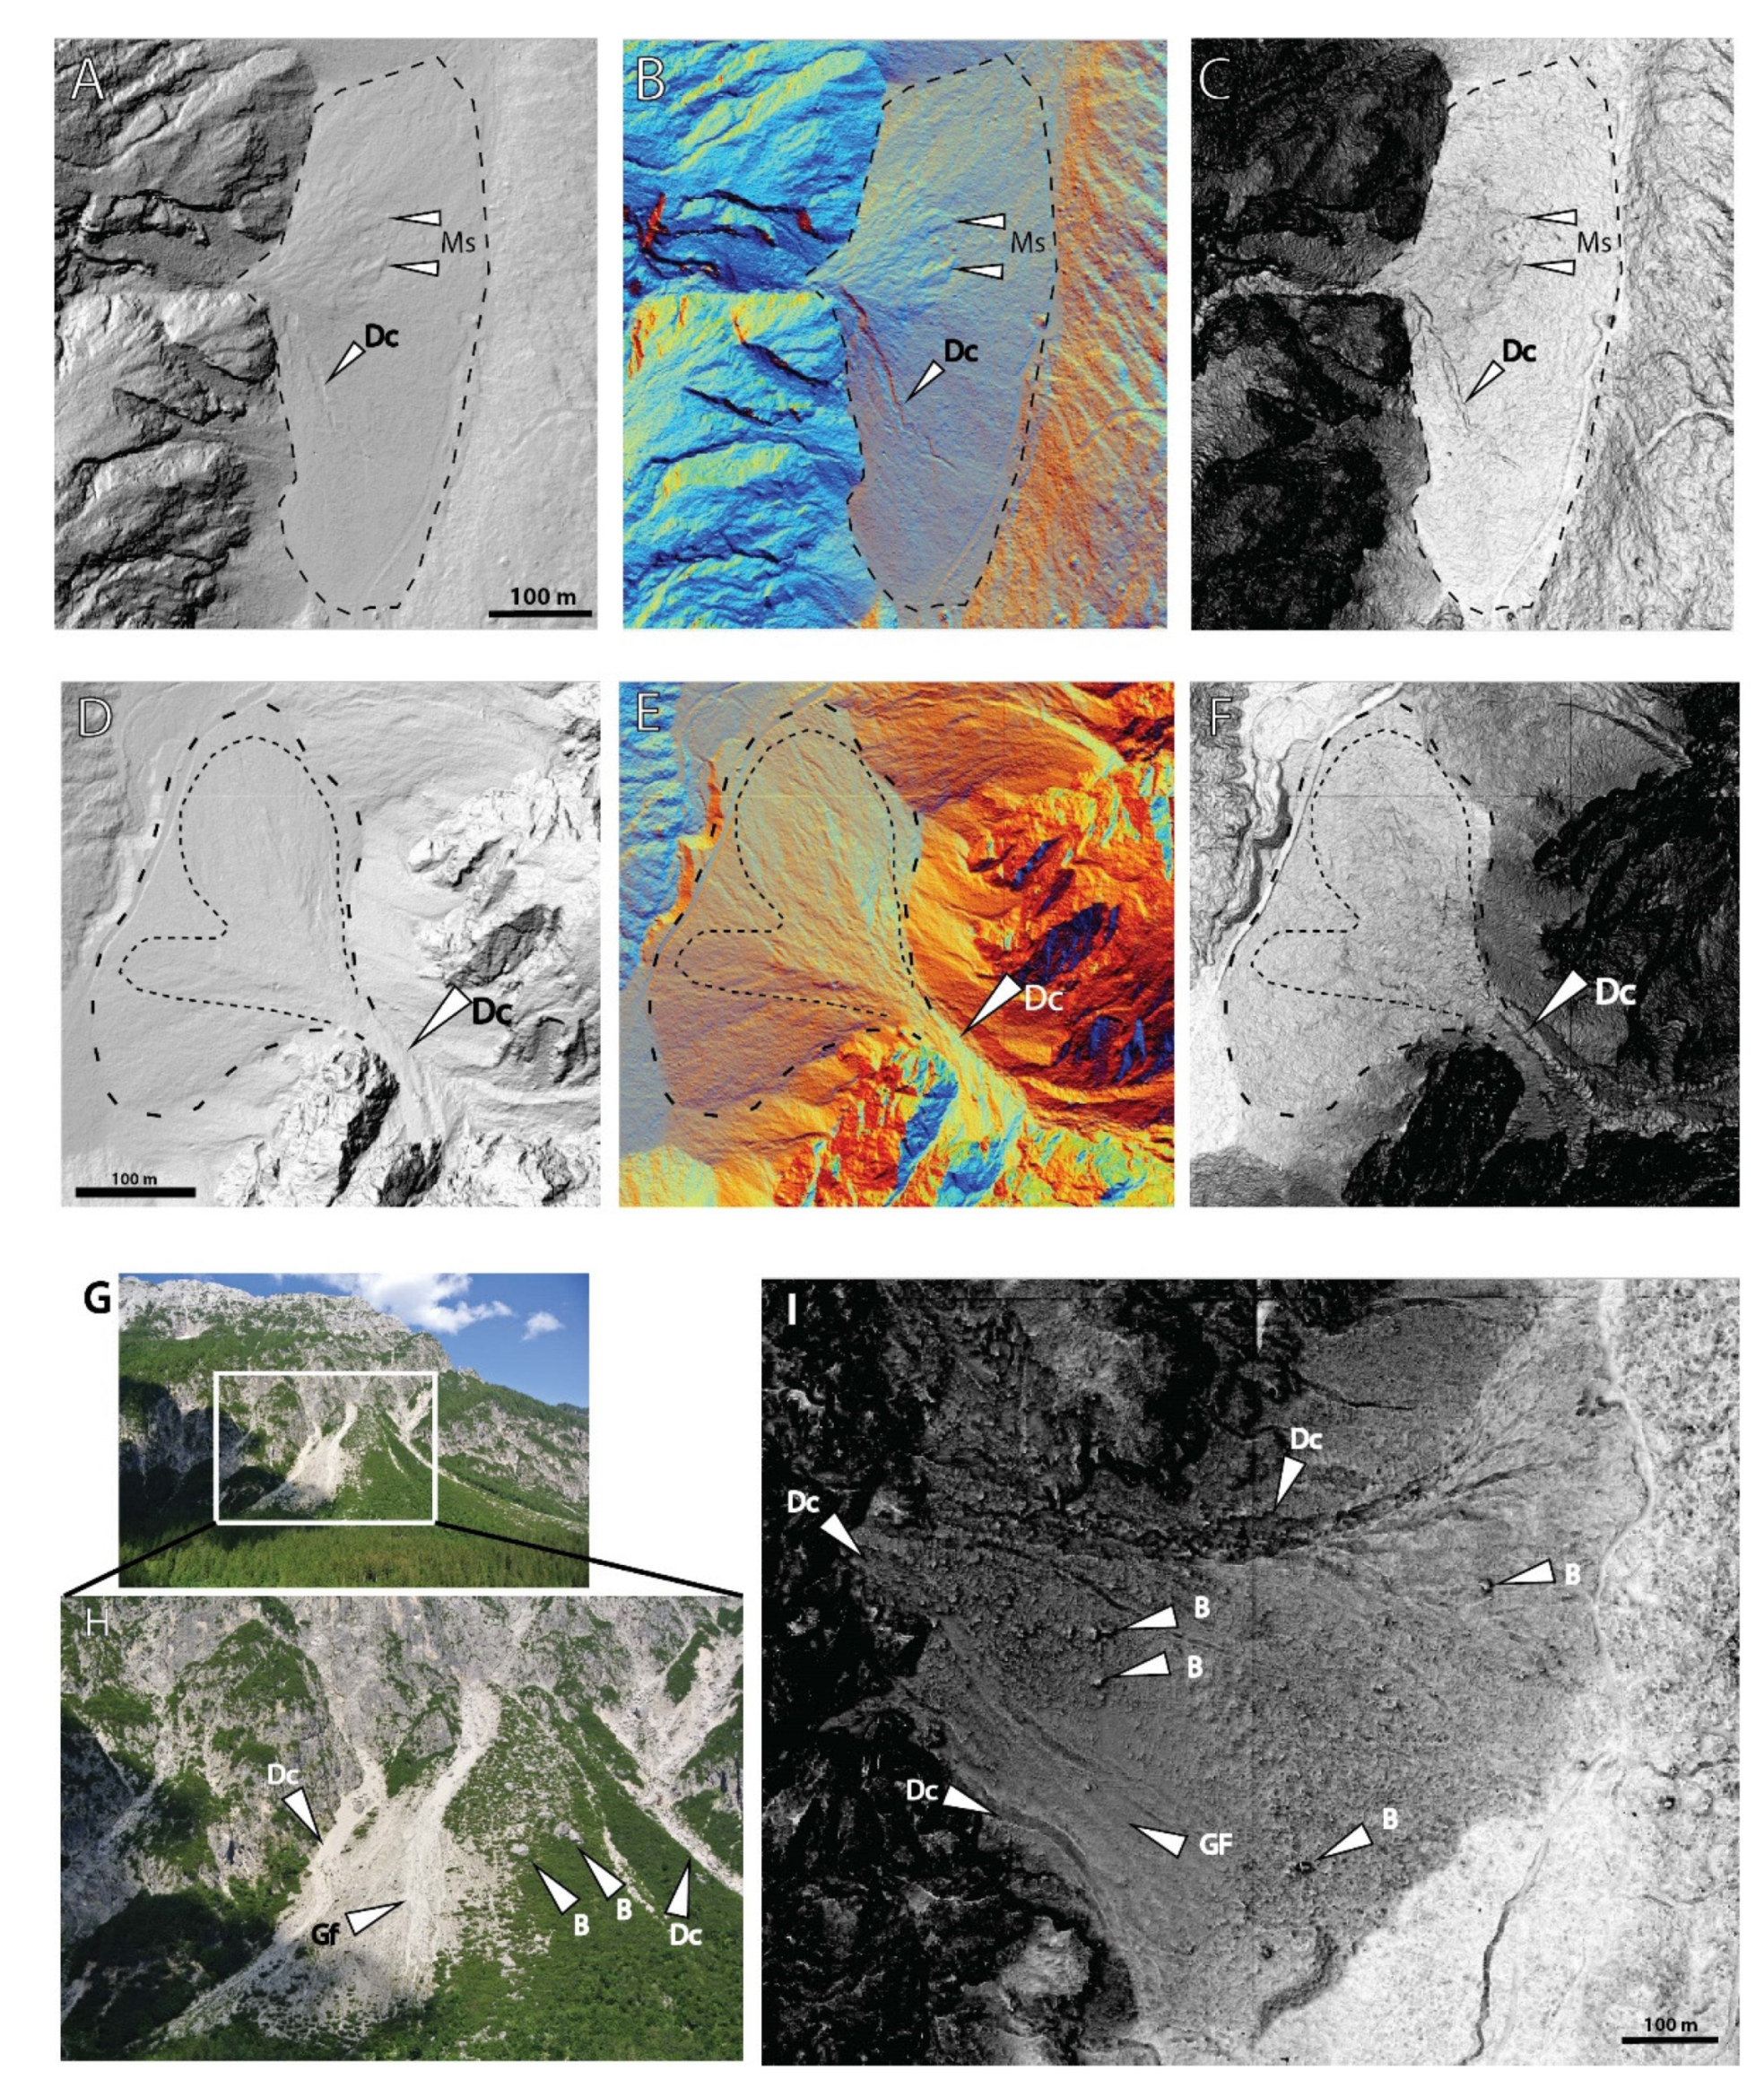
Several sedimentary and geomorphologic features that occur on alluvial fans are readily visible on the analytical hillshade visualisation, but their recognition is vastly improved on other visualisation. Visual recognition of torrential channels is much more evident on the 8-bit slope and hillshading from multiple directions RGB visualisations (Figure 4A–C). Relatively shallow channels cut into fans with a maximum depth of one metre stand out clearly from the generally flat surfaces (Figure 4B). In addition, distributary channels in catchments of fans are better visible on the 8-bit slope visualisation (Figure 4C). Visibility of features inside channels, such as braided river channel systems and channel bars, is also improved on hillshading from multiple directions RGB visualisation than on slope or analytical hillshade (Figure 4A–C).
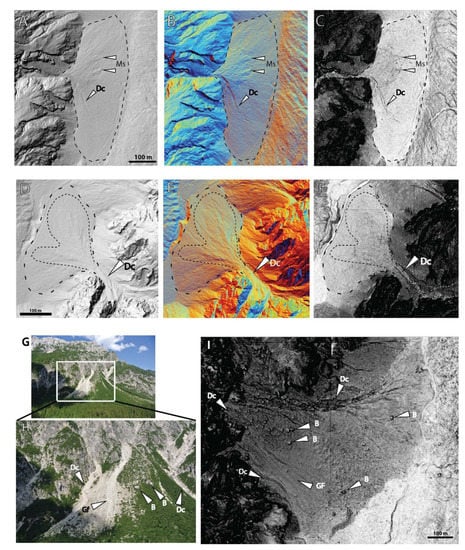
Figure 4.
Visualisation of typical features on alluvial fans. For locations see rectangles 4 A-C, 4 D-F and 4 G-I in Figure 1. (A–C) Distributary torrential channels (Dc) and large sedimentary deposits, similar to sieve deposits and defined as “mega sieve deposits” (Ms, example in Figure 2 G) on alluvial fan represented on visualisations analytical hillshading (A315, H35), hillshading from multiple directions RGB (D16, H35) and 8-bit slope respectively. (D–F) Area of out-of-channel deposits and corresponding distributary channel (Dc) on an alluvial fan marked with thin dashed line represented on visualisations analytical hillshading (A315, H35), hillshading from multiple directions RGB (D16, H35) and Slope (8-bit) respectively. (G,H) Example of Type 1 alluvial fan with boulders (B), grain flow areas (Gf) and distributary channels (Dc). (I) Same alluvial fan represented on 8-bit Slope visualisation. Notice boulders (B), grain flow areas (Gf) and distributary channels (Dc) marked with white arrows.
Deposits outside the channel are virtually invisible on the analytical hillshade visualisation (Figure 4D). However, due to their subtly undulating morphology, they are more noticeable on 8-bit slope and hillshading from multiple directions RGB visualisations (Figure 4E,F). Their general spatial extent can be inferred from the surface morphology.
Larger boulders (greater than ten metres) were detected on Type I alluvial fan c.f. [54] along with distributary channels and grain flow deposits (Figure 4G–I). Boulders are clearly visible on 8-bit slope visualisation, while areas of grain flow deposits appear as a smooth surface with slight undulation (Figure 4I).
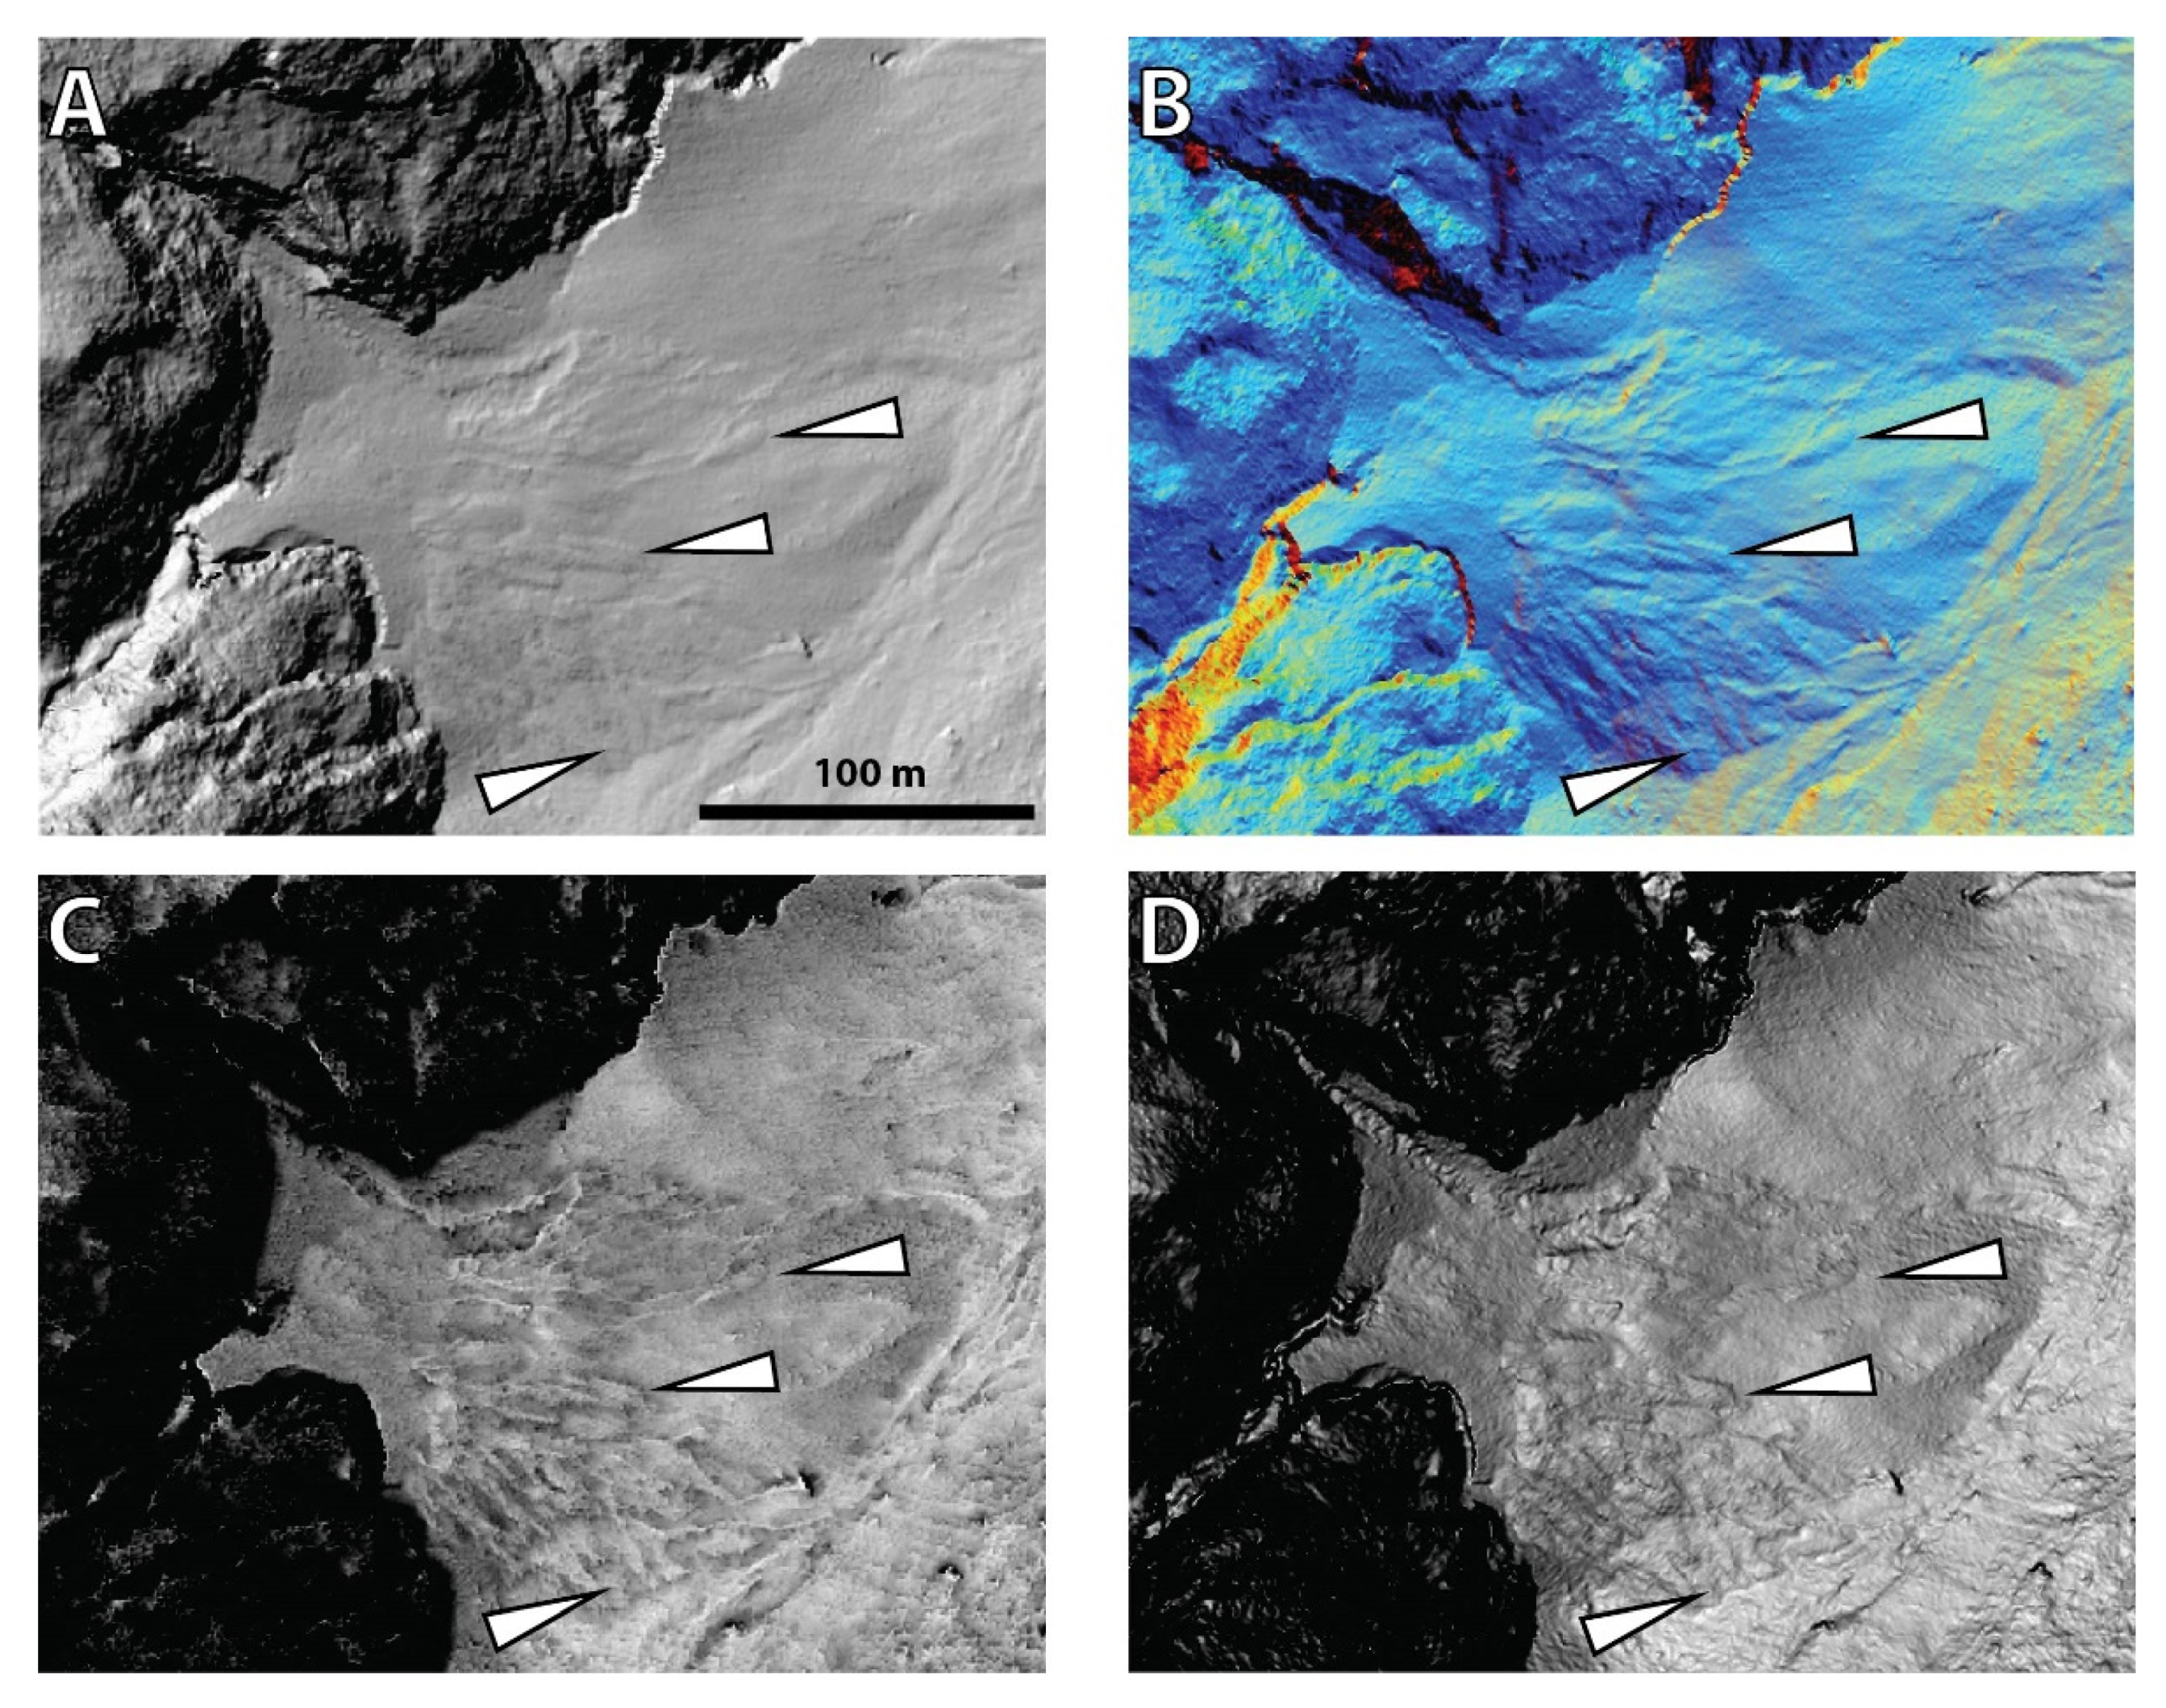
Small-scale sieve deposits (5 m long, 2 m wide, and 0.5 m high, an example is shown in Figure 2F), which are relatively common at the study site, were not recognised on any of the visualisations derived from DEM. However, larger sieve deposits (5 by 10 m, Figure 5), which are less common in the study site, were recognised. These deposits are much less apparent in the analytical hillshading (Figure 5A), but they are much more apparent in hillshading from multiple directions and in the 8-bit slope visualisations. They can be seen in 8-bit the sky view factor visualisation, although the edges do not appear as sharp as in other visualisation types (Figure 5C,D). Features similar to sieve deposits in terms of sedimentary texture and morphology were discovered during field work (Figure 2G), and we defined them as “mega sieve deposits”. Such deposits have dimensions up to 50 m in length, 15 m in width and up to 3 m in height and are recognisable on analytical hillshading (Figure 4 A–C). However, compared to hillshading from multiple directions and 8-bit slope visualisations, these deposits are significantly better visible (Figure 4B,C).
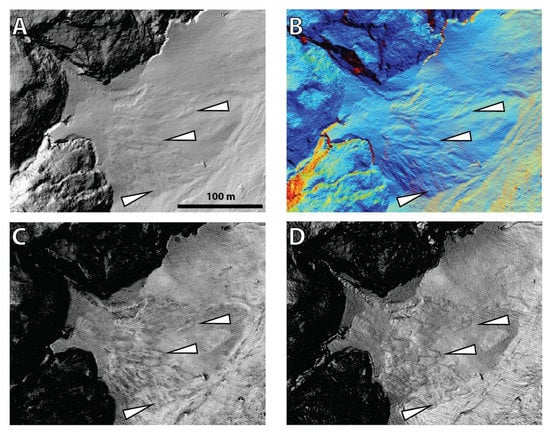
Figure 5.
Example of sieve deposits represented on (A) Analytical hillshading (A315, H35), (B) Hillshading from multiple directions RGB (D16, H35), (C) 8-bit sky view factor, and (D) 8-bit slope visualisations. Individual sieve deposits in this case measure 10 by 5 m. For location see rectangle 5 in Figure 1.
3.2.2. Glacial and Lacustrine Deposits
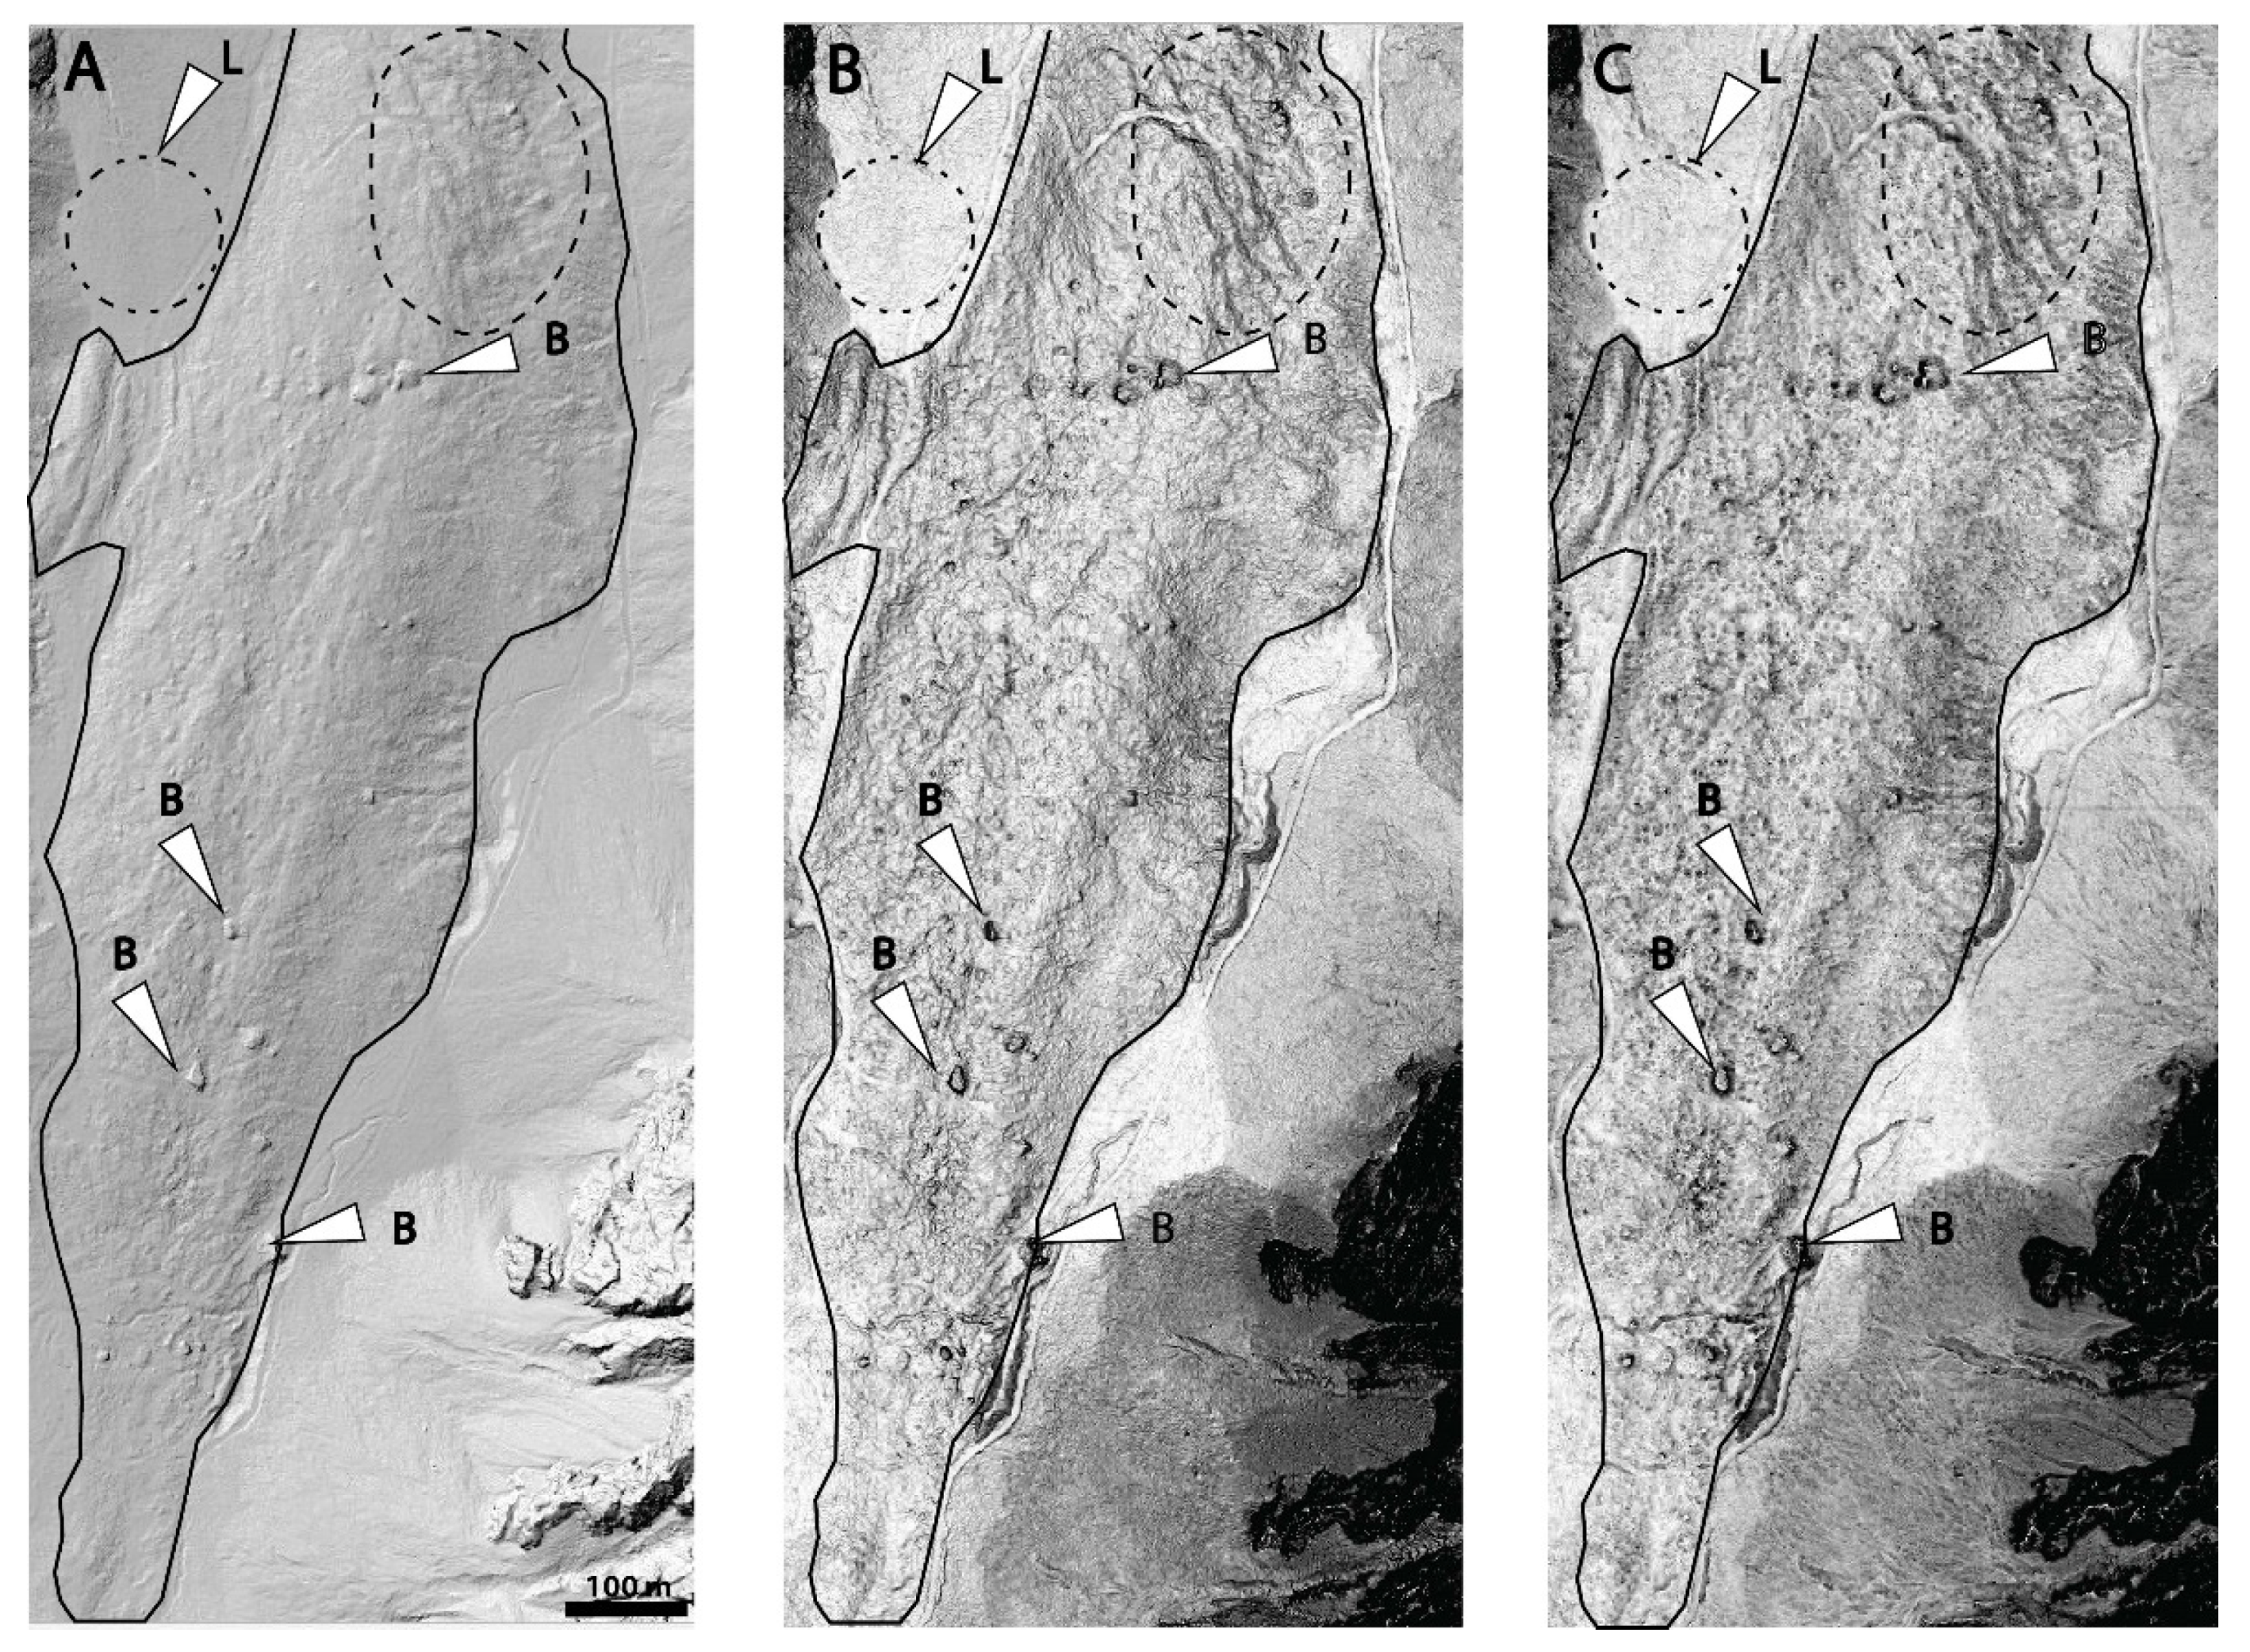
Lacustrine deposits are not particularly prominent on any visualisation type. On all types, they are seen as a flat surface with no prominent morphological features (Figure 6). The features visible as undulating terrain on 8-bit sky view factor and 8-bit slope visualisation are out-of-channel deposits from a nearby active alluvial fan that is gradually covering the lacustrine deposits [47]. The largest moraine covering the valley floor can be easily outlined from other sedimentary bodies on all four visualisation techniques due to its undulating terrain morphology, large boulders, and ridge-like topography (Figure 6). However, when comparing the three visualisation techniques, the terrain morphology is less pronounced in the analytical hillshading visualisation. In comparison, the 8-bit slope and 8-bit sky view factor visualisations significantly improve the visibility of undulating terrain and boulders larger than 5 m (Figure 6B,C).
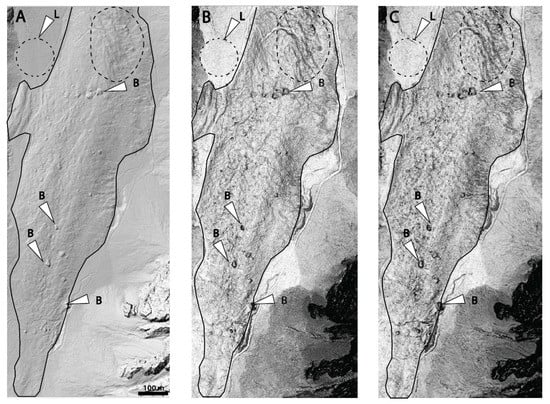
Figure 6.
Largest glacial moraine covering the valley floor (delineated with full line) and location of outcropping lacustrine deposits (L, marked by the dashed circle and white arrow). White arrows point to large boulders (B), and the area on the moraine marked with a dashed line represents its typical undulated terrain. The area is represented on (A) analytical hillshading (A315, H35), (B) 8-bit sky view factor and (C) 8-bit slope visualisations respectively. For location see rectangle 6 in Figure 1.
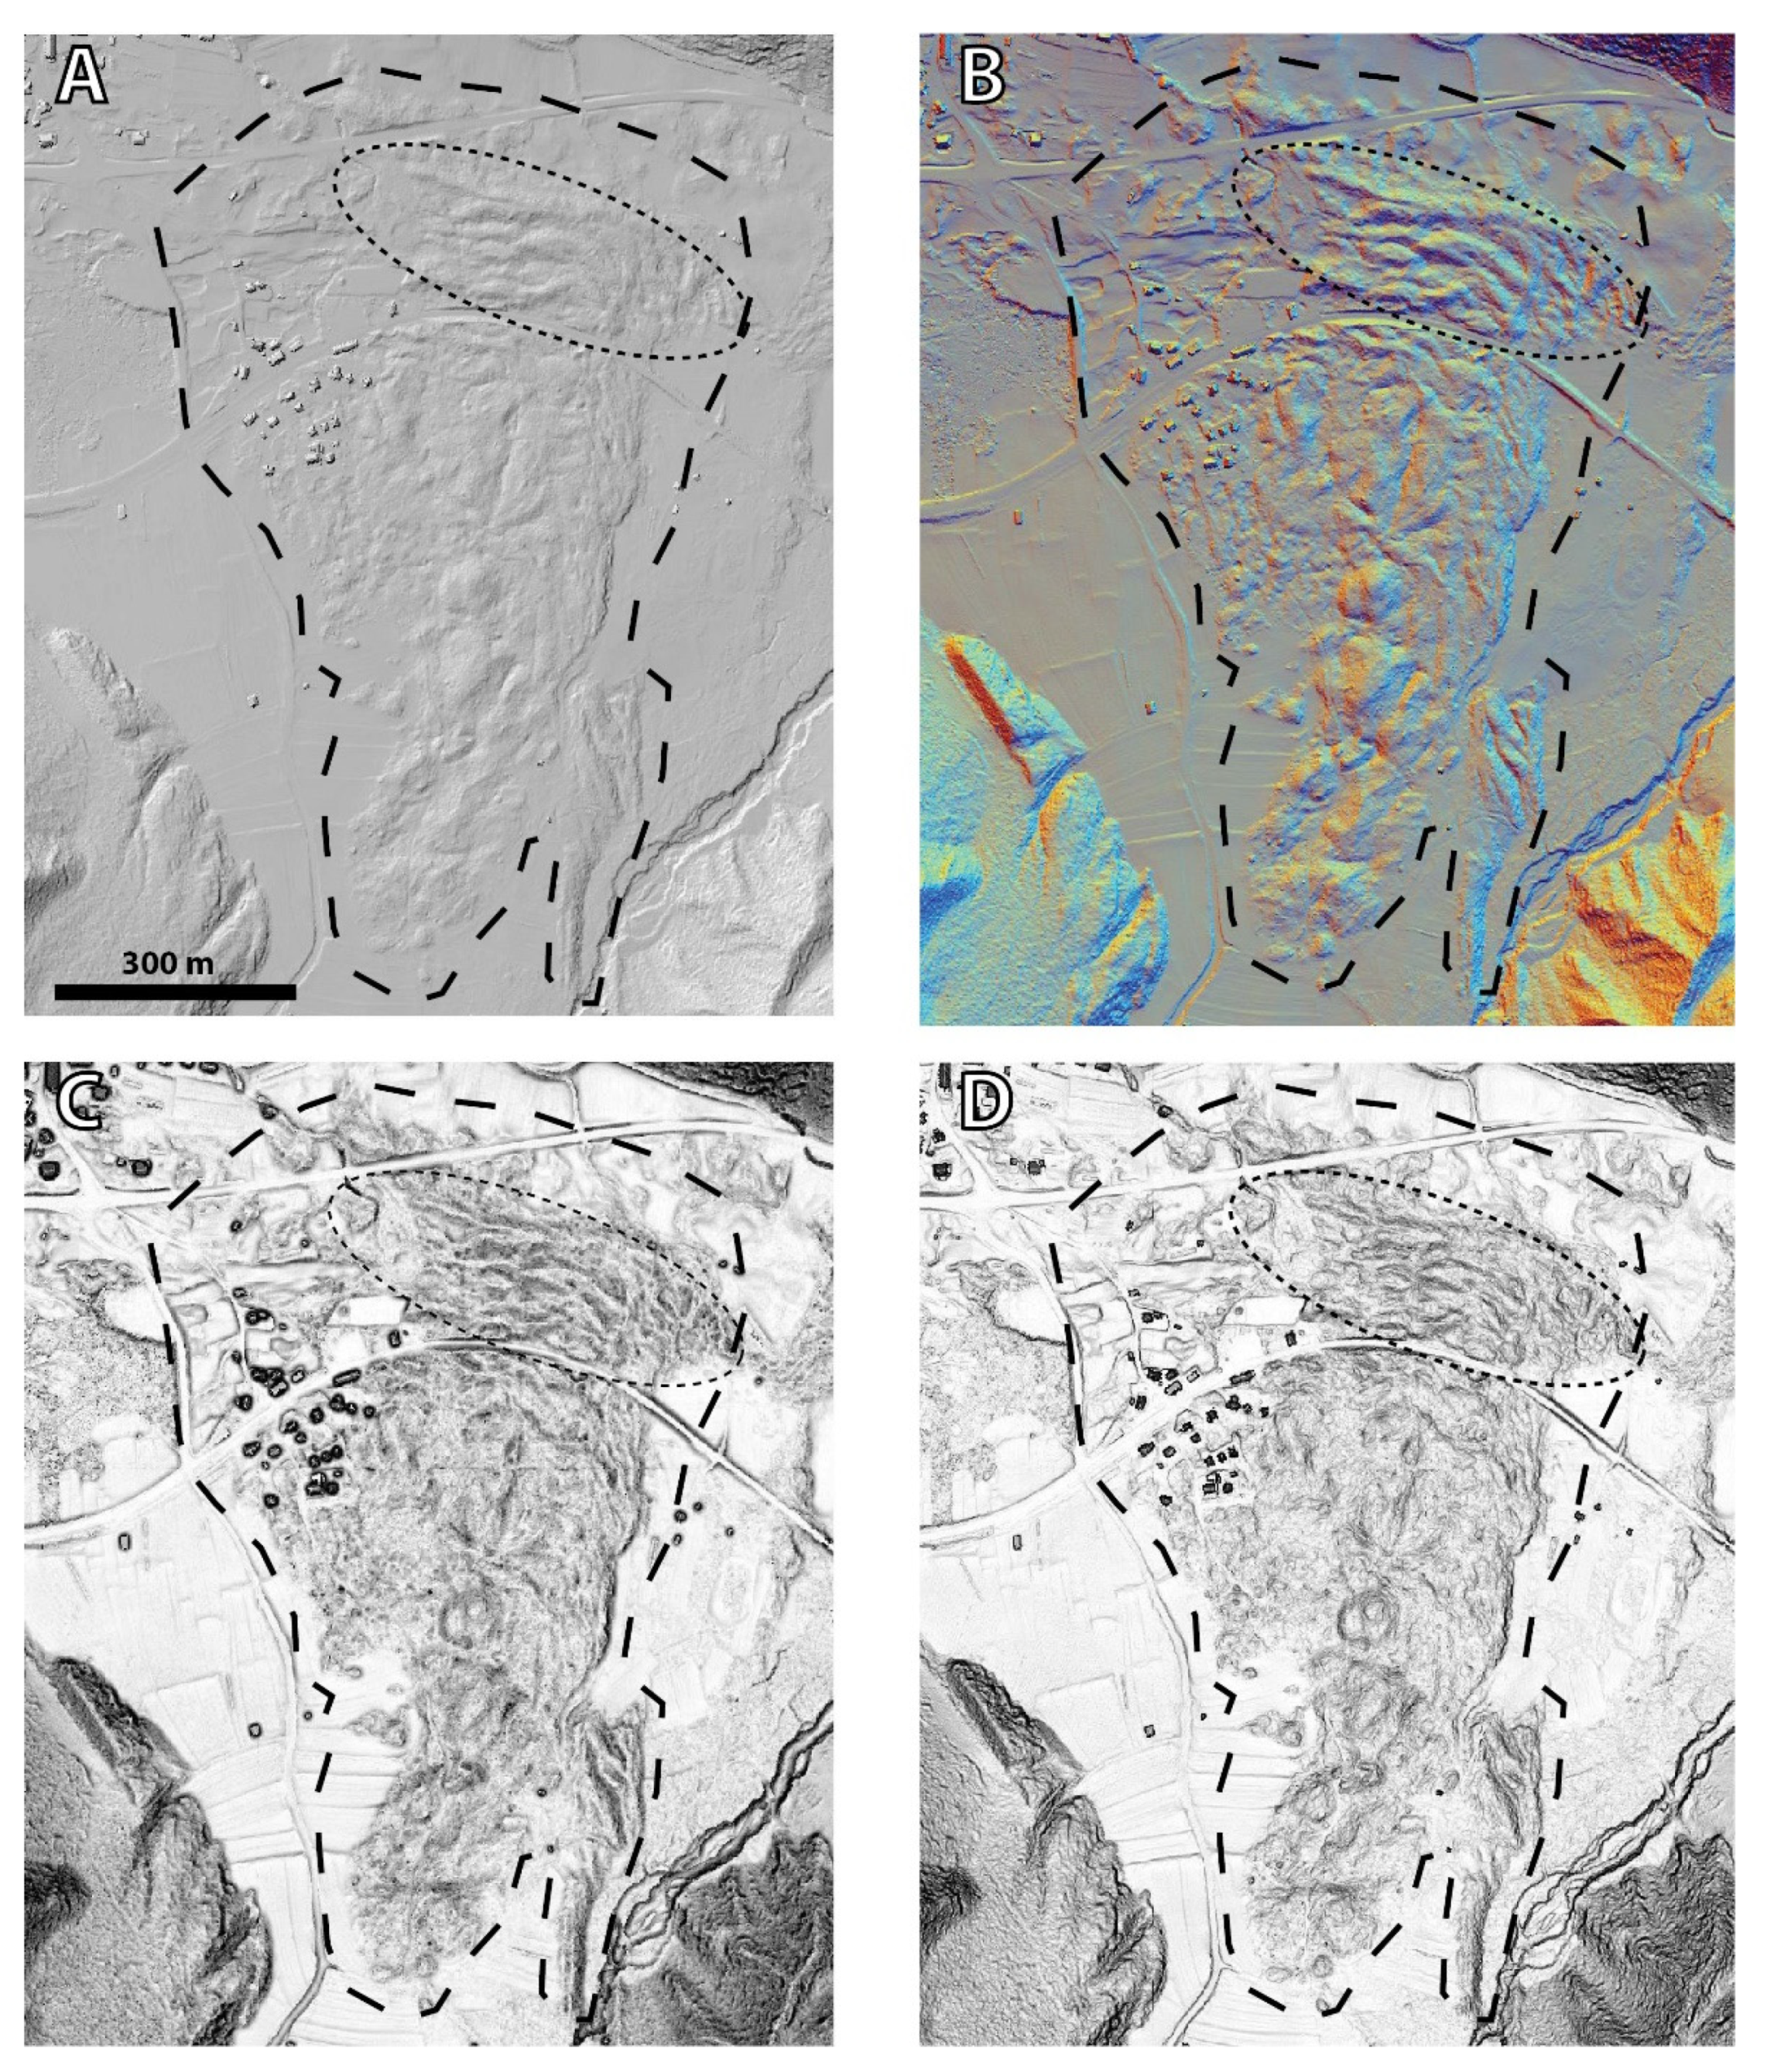
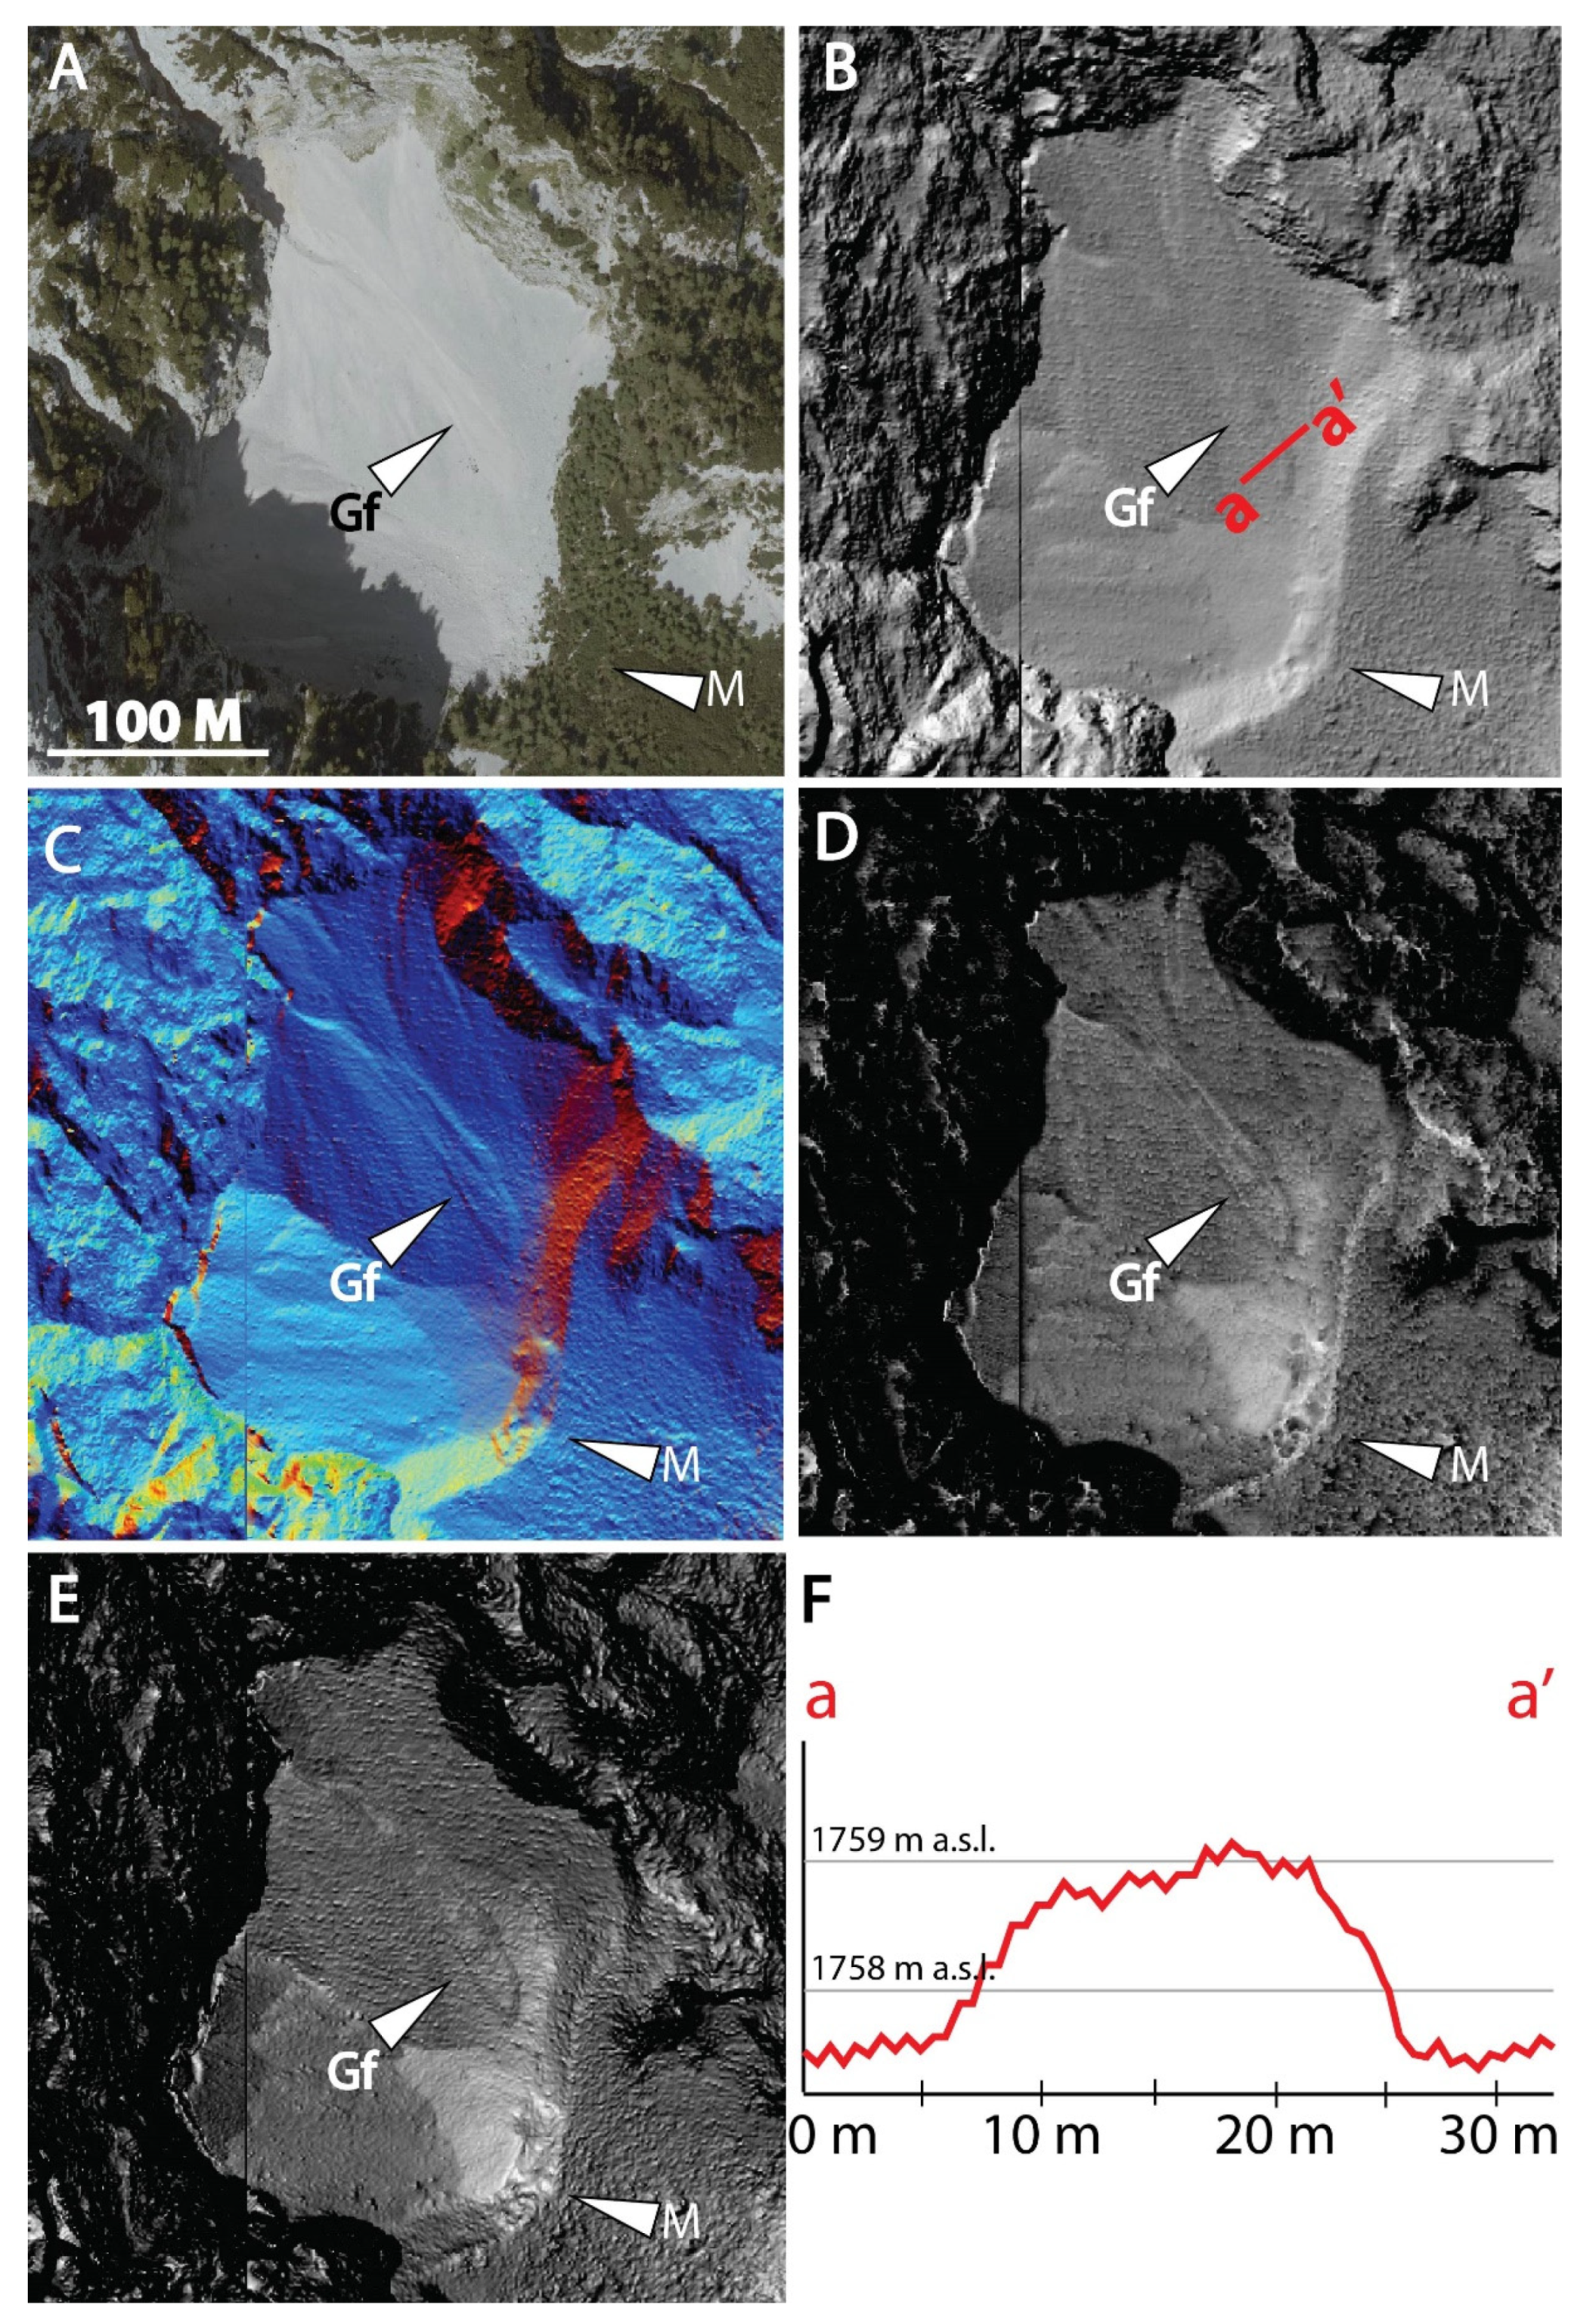
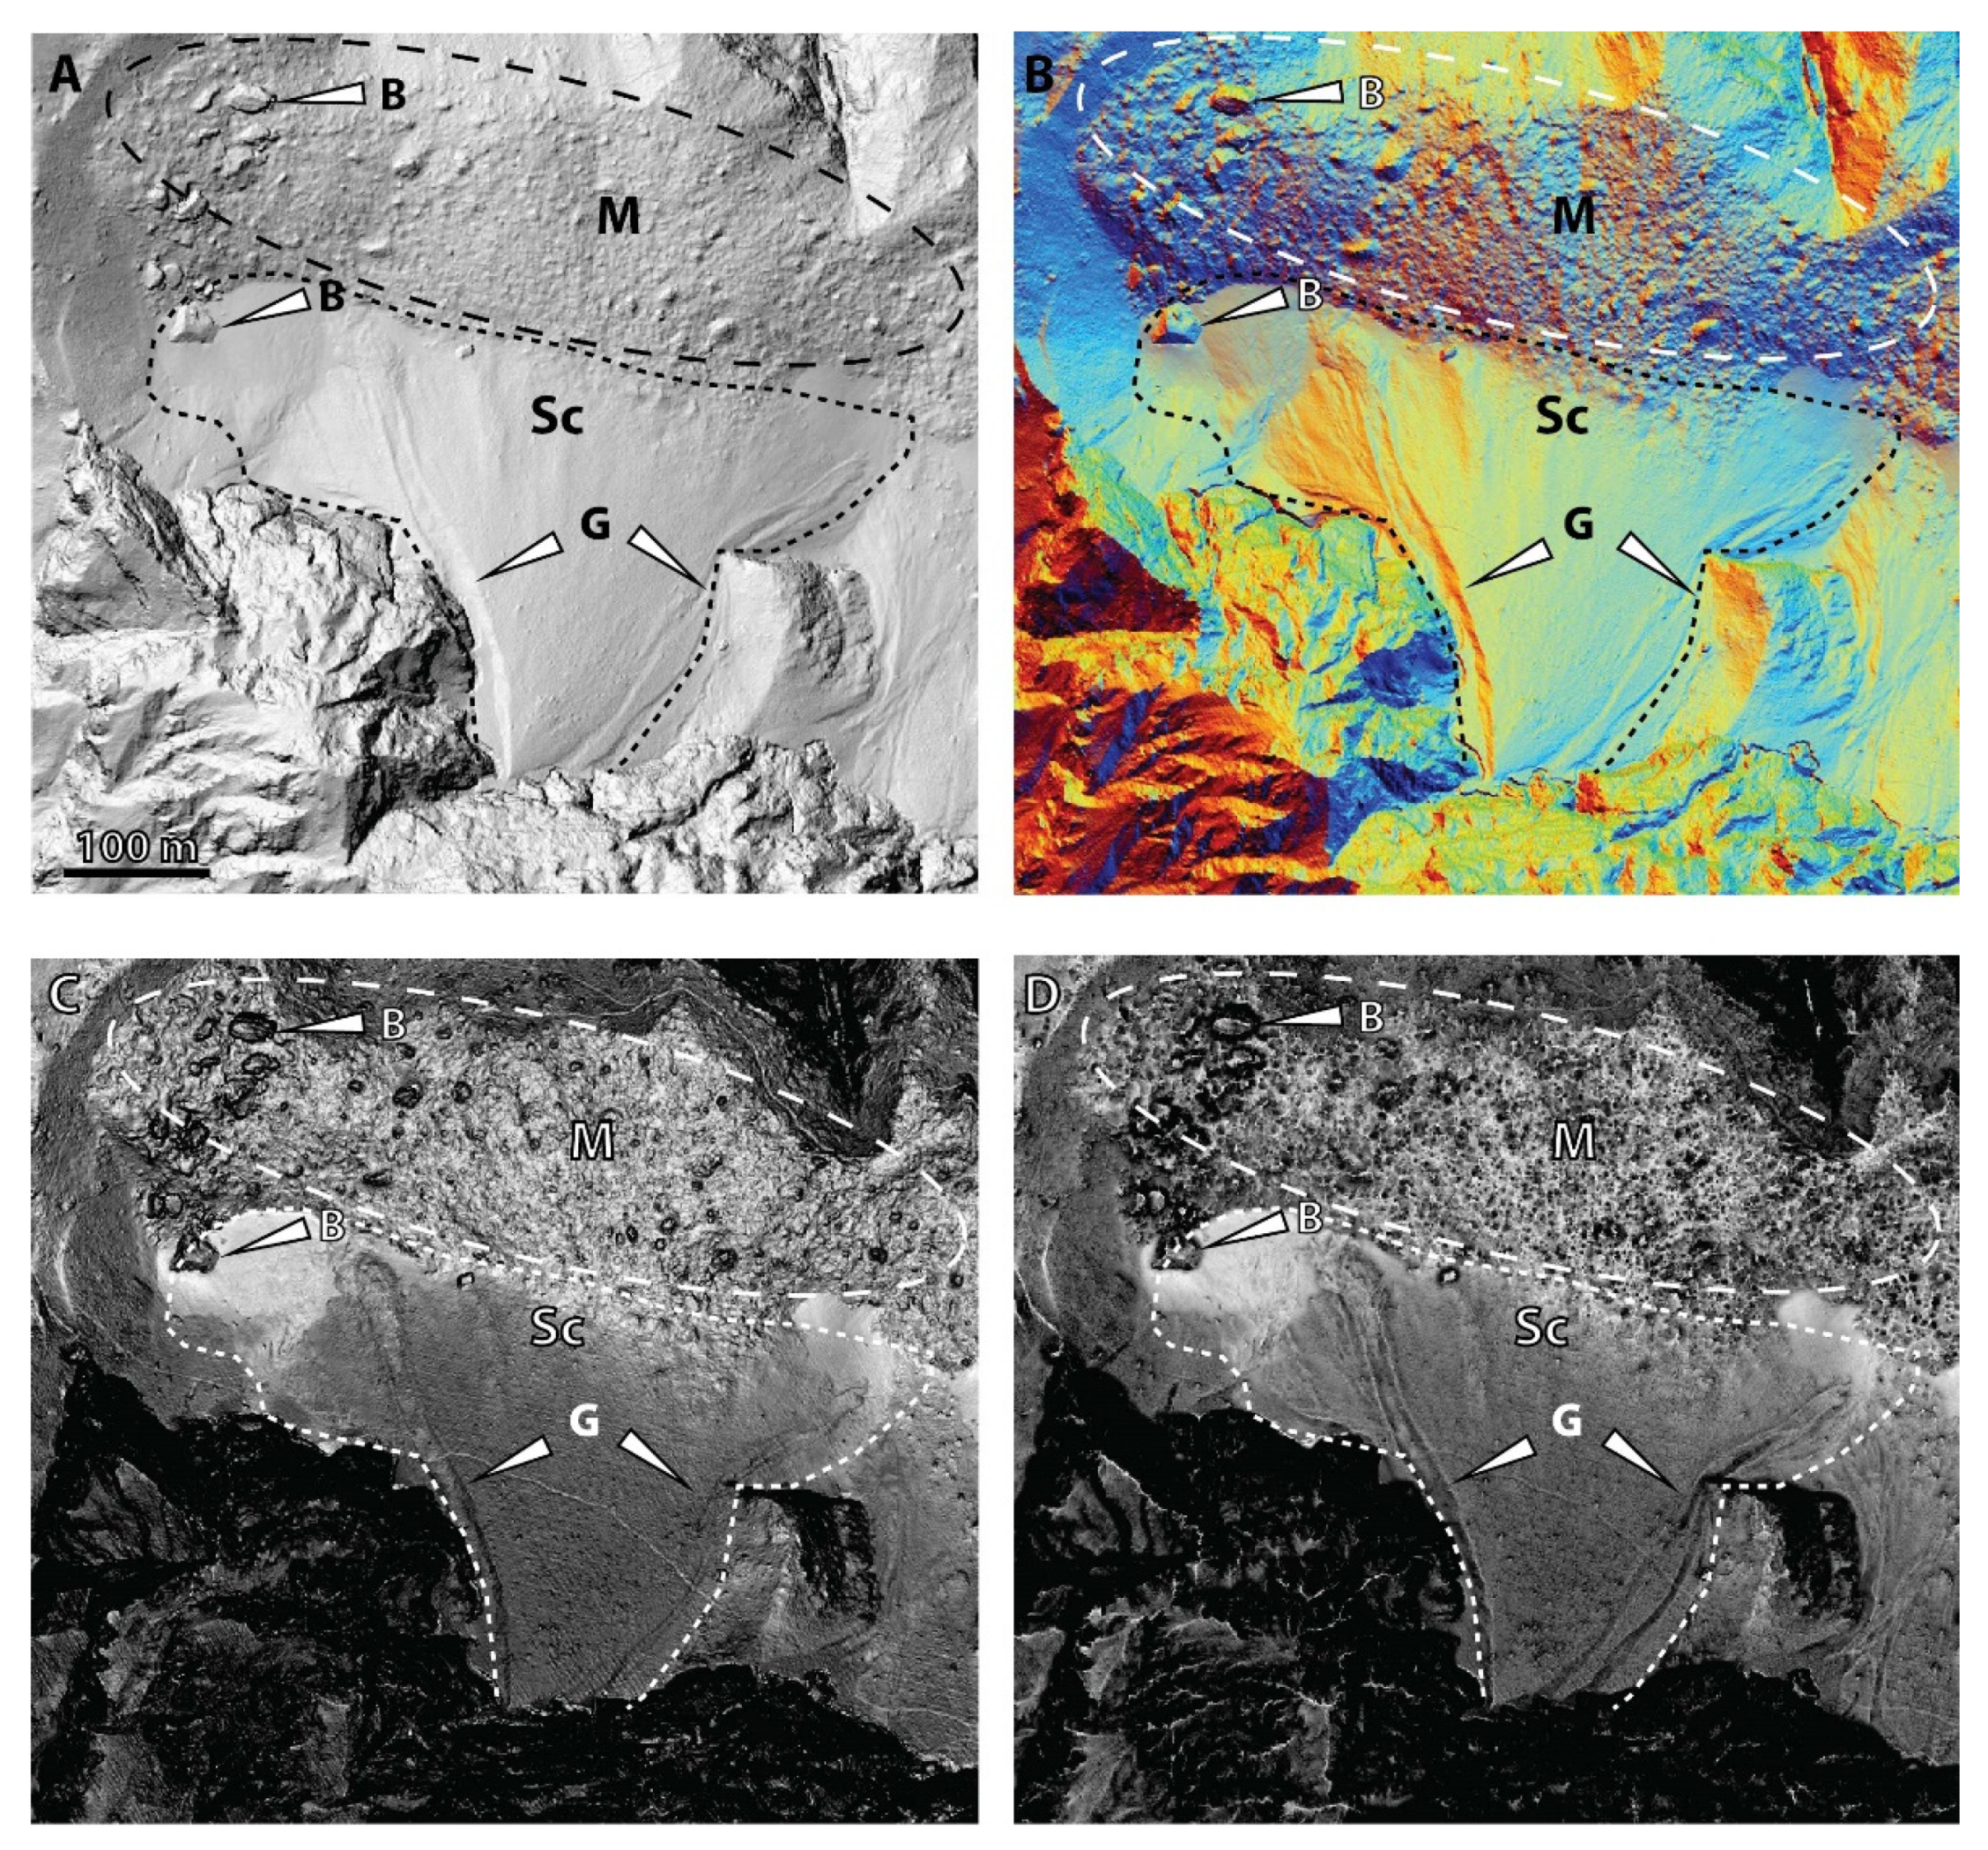
A previous study by [48] describes boulders and ridge-shape morphology of the terminal moraines at the valley entrance oriented in NW-SE direction (Figure 7). The terminal moraines are less pronounced in analytical hillshading but clearly visible in other visualisations, especially in the hillshading from multiple directions visualisation (Figure 7 B). The moraine in the Zadnja Ponca cirque (Figure 8), described by [49], represents a ridge approximately 220 m long, up to 5 m high and up to 40 m wide. This moraine is more visible in hillshading from multiple directions rather than on analytical hillshading. However, no large boulders are visible on any visualisation type. Under Mount Mojstrovka (Figure 9), we recognised a moraine more than 600 m long and up to 200 m wide. Its undulating morphology derives from huge glacial boulders with a maximum size of 30 m. Similarly, to the largest moraine covering the valley floor, the visibility of the undulating topography of the moraine is greatly enhanced by hillshading from multiple directions, 8-bit sky view factor and 8-bit slope visualisation.
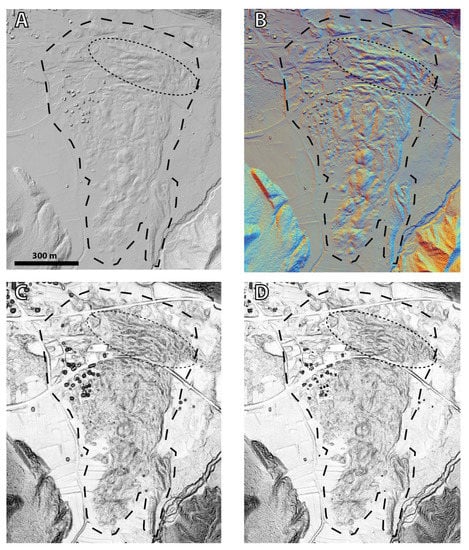
Figure 7.
Glacial deposits located at the valley entrance (dashed line). End moraine ridges orientated in NW-SE direction are marked by the oval dashed line. Square shaped object in the northwest corner and approximately left of the image centre are buildings and not boulders. (A) Analytical hillshading (A315, H35), (B) hillshading from multiple directions RGB (D16, H35), (C) 8-bit sky view factor, and (D) 8-bit slope visualisations. For location see rectangle 7 in Figure 1.
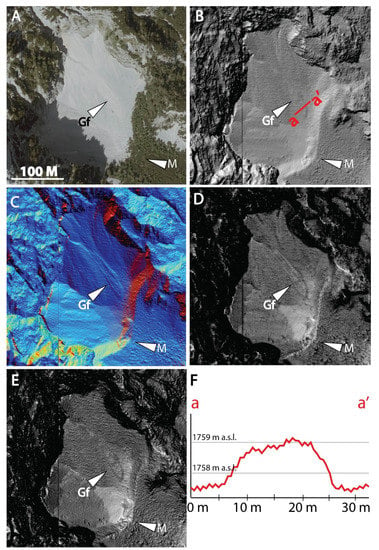
Figure 8.
Moraine ridge (M) and grain flow deposit (Gf) on a scree deposit. (A) Aerial photograph, (B) analytical hillshading (H315, A35), (C) hillshading from multiple directions RGB (D16, H35), (D) 8-bit sky view factor and (E) 8-bit slope visualisations, (F) topographic profile (a–a’) over the distal part of the grain flow deposit. For location see rectangle 8 in Figure 1.
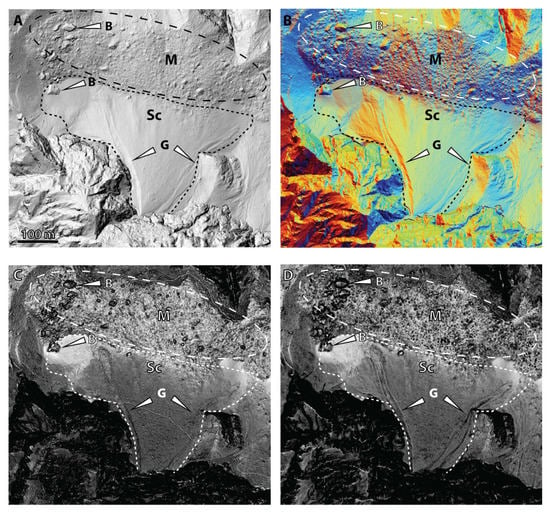
Figure 9.
Fluvial gullies (G) incised into a scree deposit (Sc). Moraine (M) composed of 30 m large boulders (B). (A) Analytical hillshading (A315, H35), (B) hillshading from multiple directions RGB (D16, H35), (C) 8-bit sky view factor, and (D) 8-bit slope visualisations. For location see rectangle 9 in Figure 1.
3.2.3. Scree Deposits
The most distinctive sedimentary and morphological features on scree deposits (Sc) are grain flow lobes (Figure 8) and gullies cut into the deposited sediment (Figure 9). They can be seen on scree slopes in the Zadnja Ponca and on the scree slope below Mojstrovka Mountain (Figure 9). In both cases, these features are poorly visible on aerial photographs because of sunlight direction (Figure 8A). The sediment consists of light grey limestone and dolomite clasts that appear white in direct sunlight, completely obscuring the geomorphological features. However, on the 8-bit sky view factor, hillshading from multiple directions RGB, and the 8-bit slope visualisation, the grain flow deposits, and fluvial gullies are spectacularly pronounced, not only compared to aerial photographs but also compared to the analytical hillshade visualisation (Figure 8A–E). Grain flows on scree deposits represent morphologically very subtle sedimentary deposits, rarely exceeding one metre in height (Figure 8F). They, therefore, do not stand out from the local relief topography. Nevertheless, their shape and microphotography are distinctly pronounced on hillshading from multiple directions visualisation (Figure 8C,F), and less so in other visualisations.
3.2.4. Debris Flow Deposits
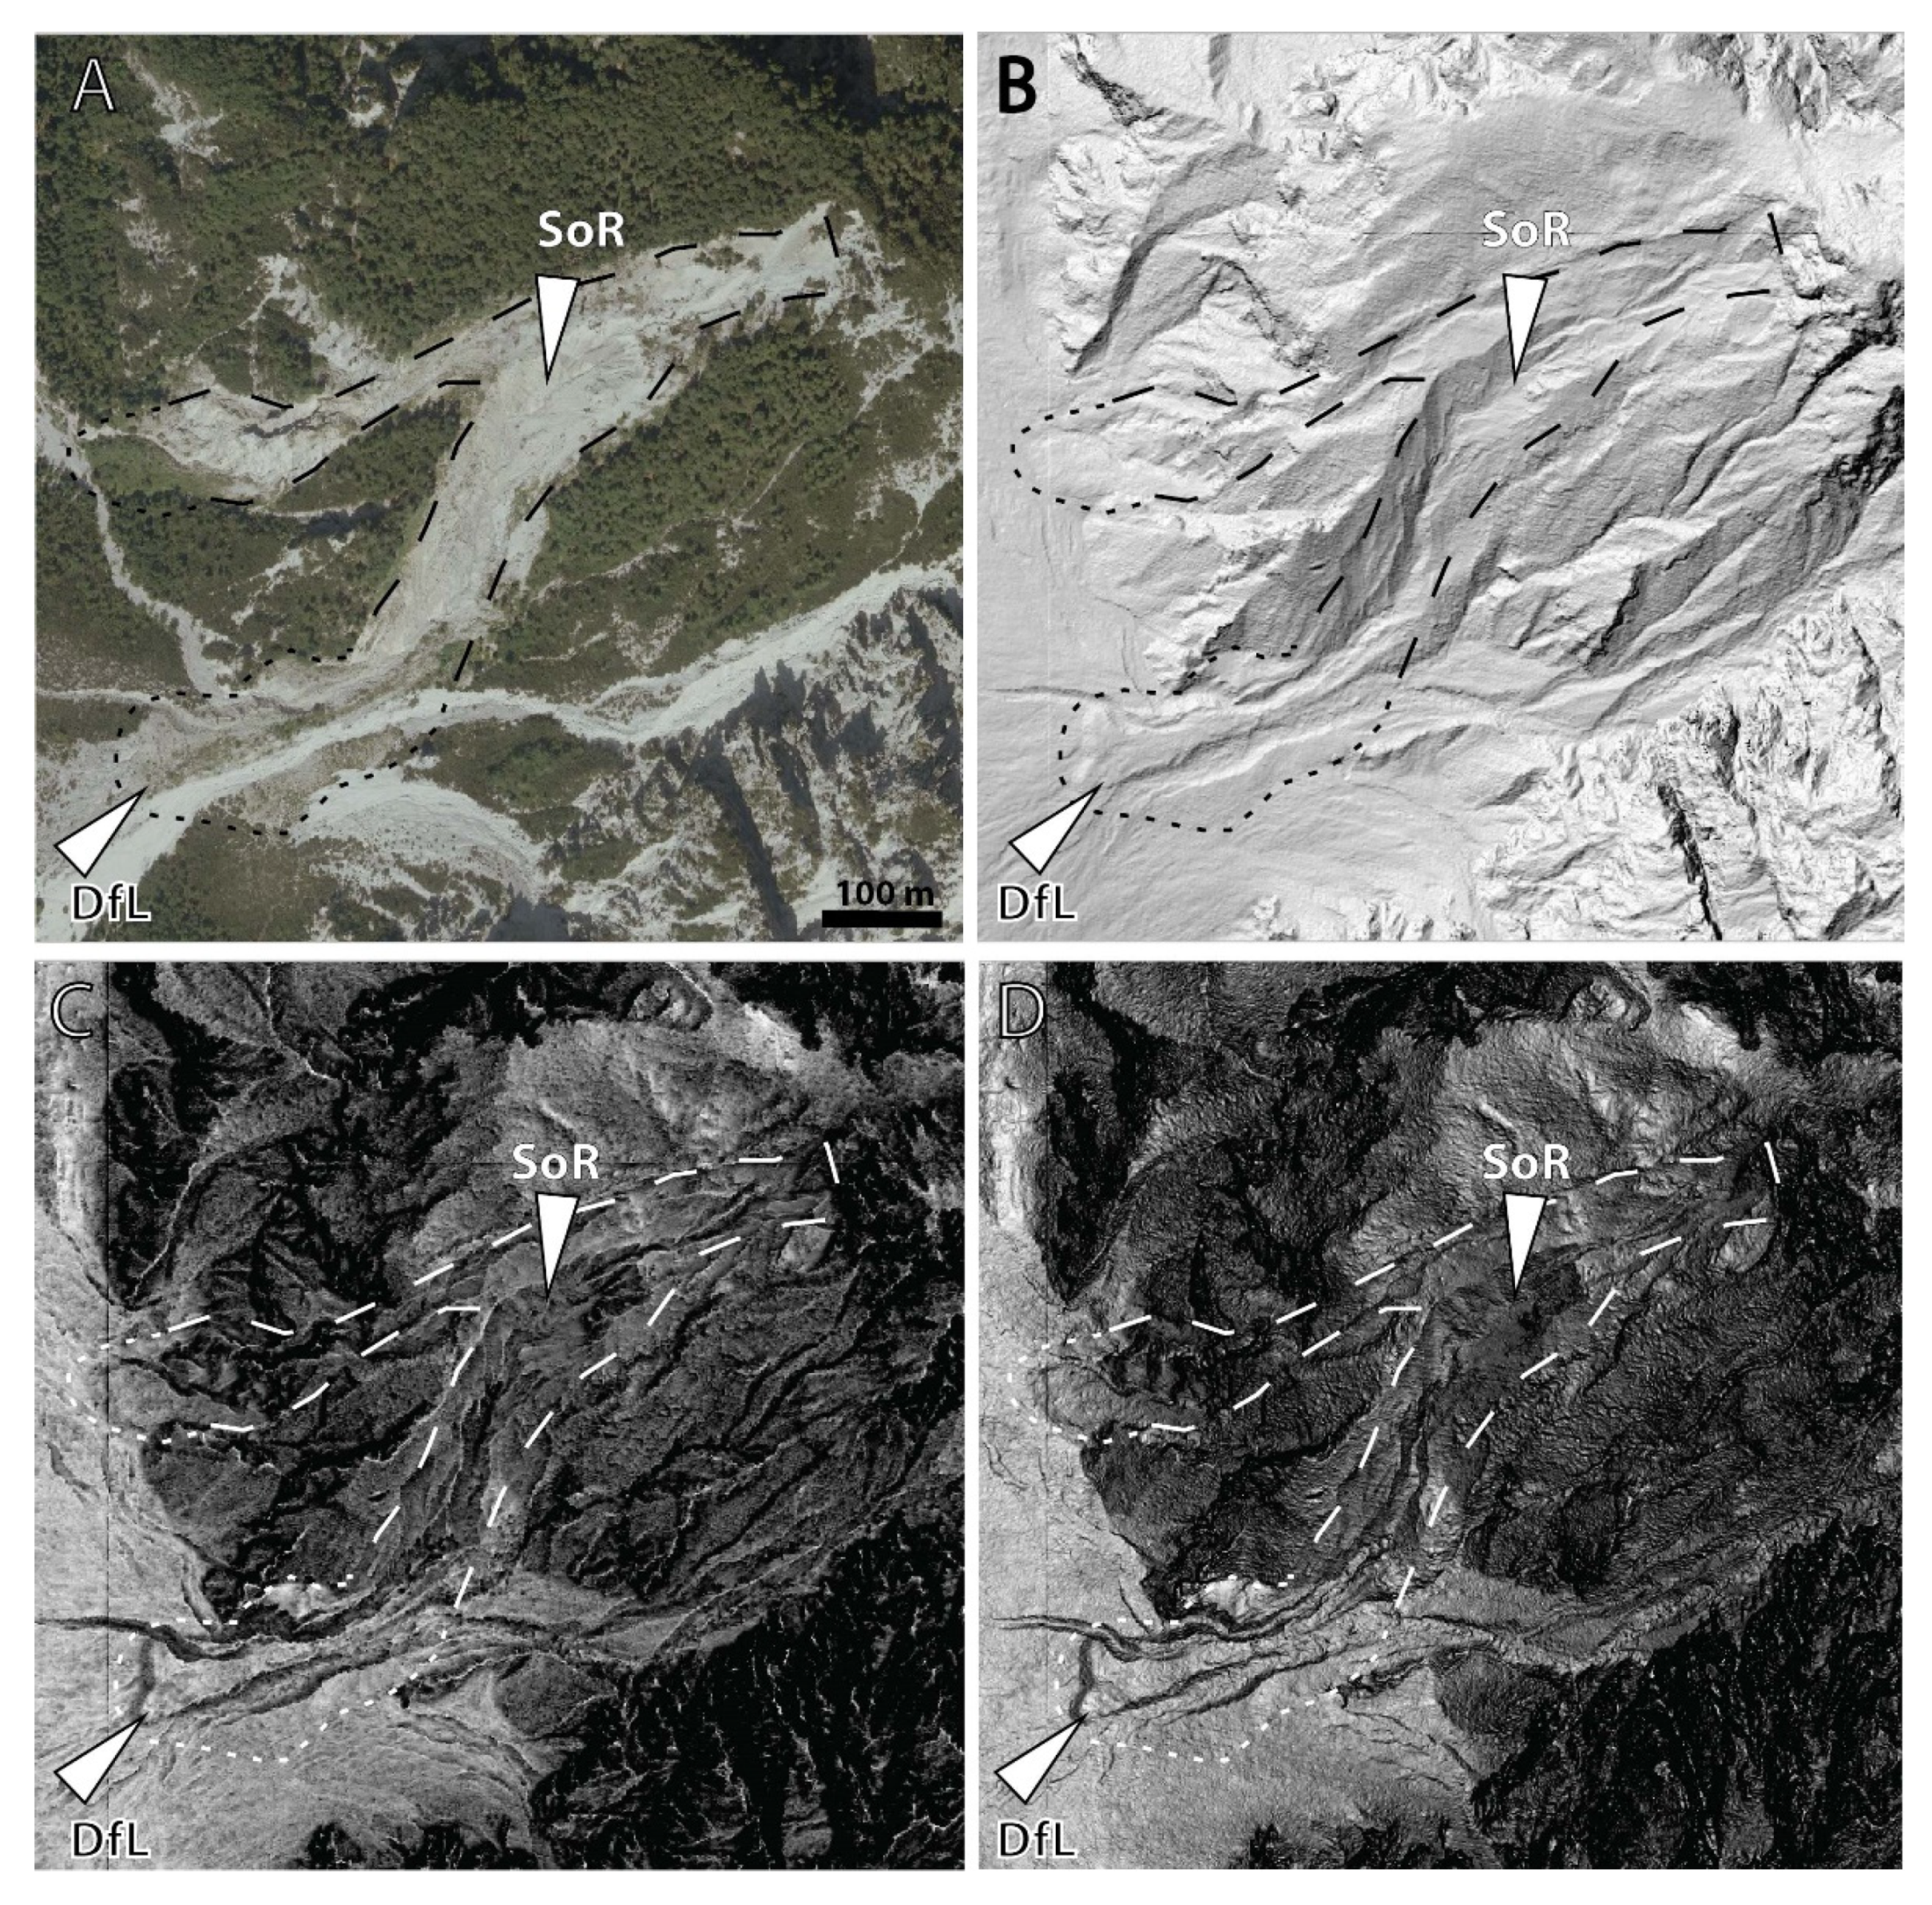
The debris flow deposited under the slopes of Mountain Ciprnik is relatively well visible in aerial photographs, especially the surface of the rapture, which has not (yet) been overgrown with vegetation (Figure 10A). However, the deposited debris flow lobe (DfL) itself is difficult to outline from the surroundings because of the vegetation cover and the colouring of the sediment. However, the lobe is visible on the analytical hillshade visualisation (Figure 10B), but its visibility is substantially improved on the 8-bit sky view factor (Figure 10C) and 8-bit slope visualisation (Figure 10D). In all three visualisation types, the morphology of the rupture surface is well pronounced with the recognisable V-shaped gullies. Despite the high resolution of DEM, the two-metre sized boulders transported by debris flow are not visible on any of visualisation. In the produced DEM, a two-metre sized object is represented by four pixels, which seems to be too small for visual recognition.
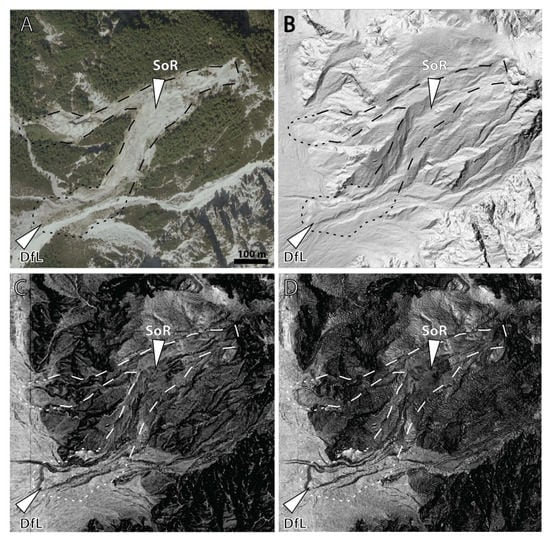
Figure 10.
Debris flow deposits under the slopes of Mountain Ciprnik. Surface of rupture (SoR) and debris flow lobe (DfL) are marked with white arrows. (A) Aerial photography, (B) analytical hillshading (A315, H35), (C) 8-bit sky view factor and (D) 8-bit slope visualisations. For location see rectangle 10 in Figure 1.
3.2.5. Fluvial Deposits
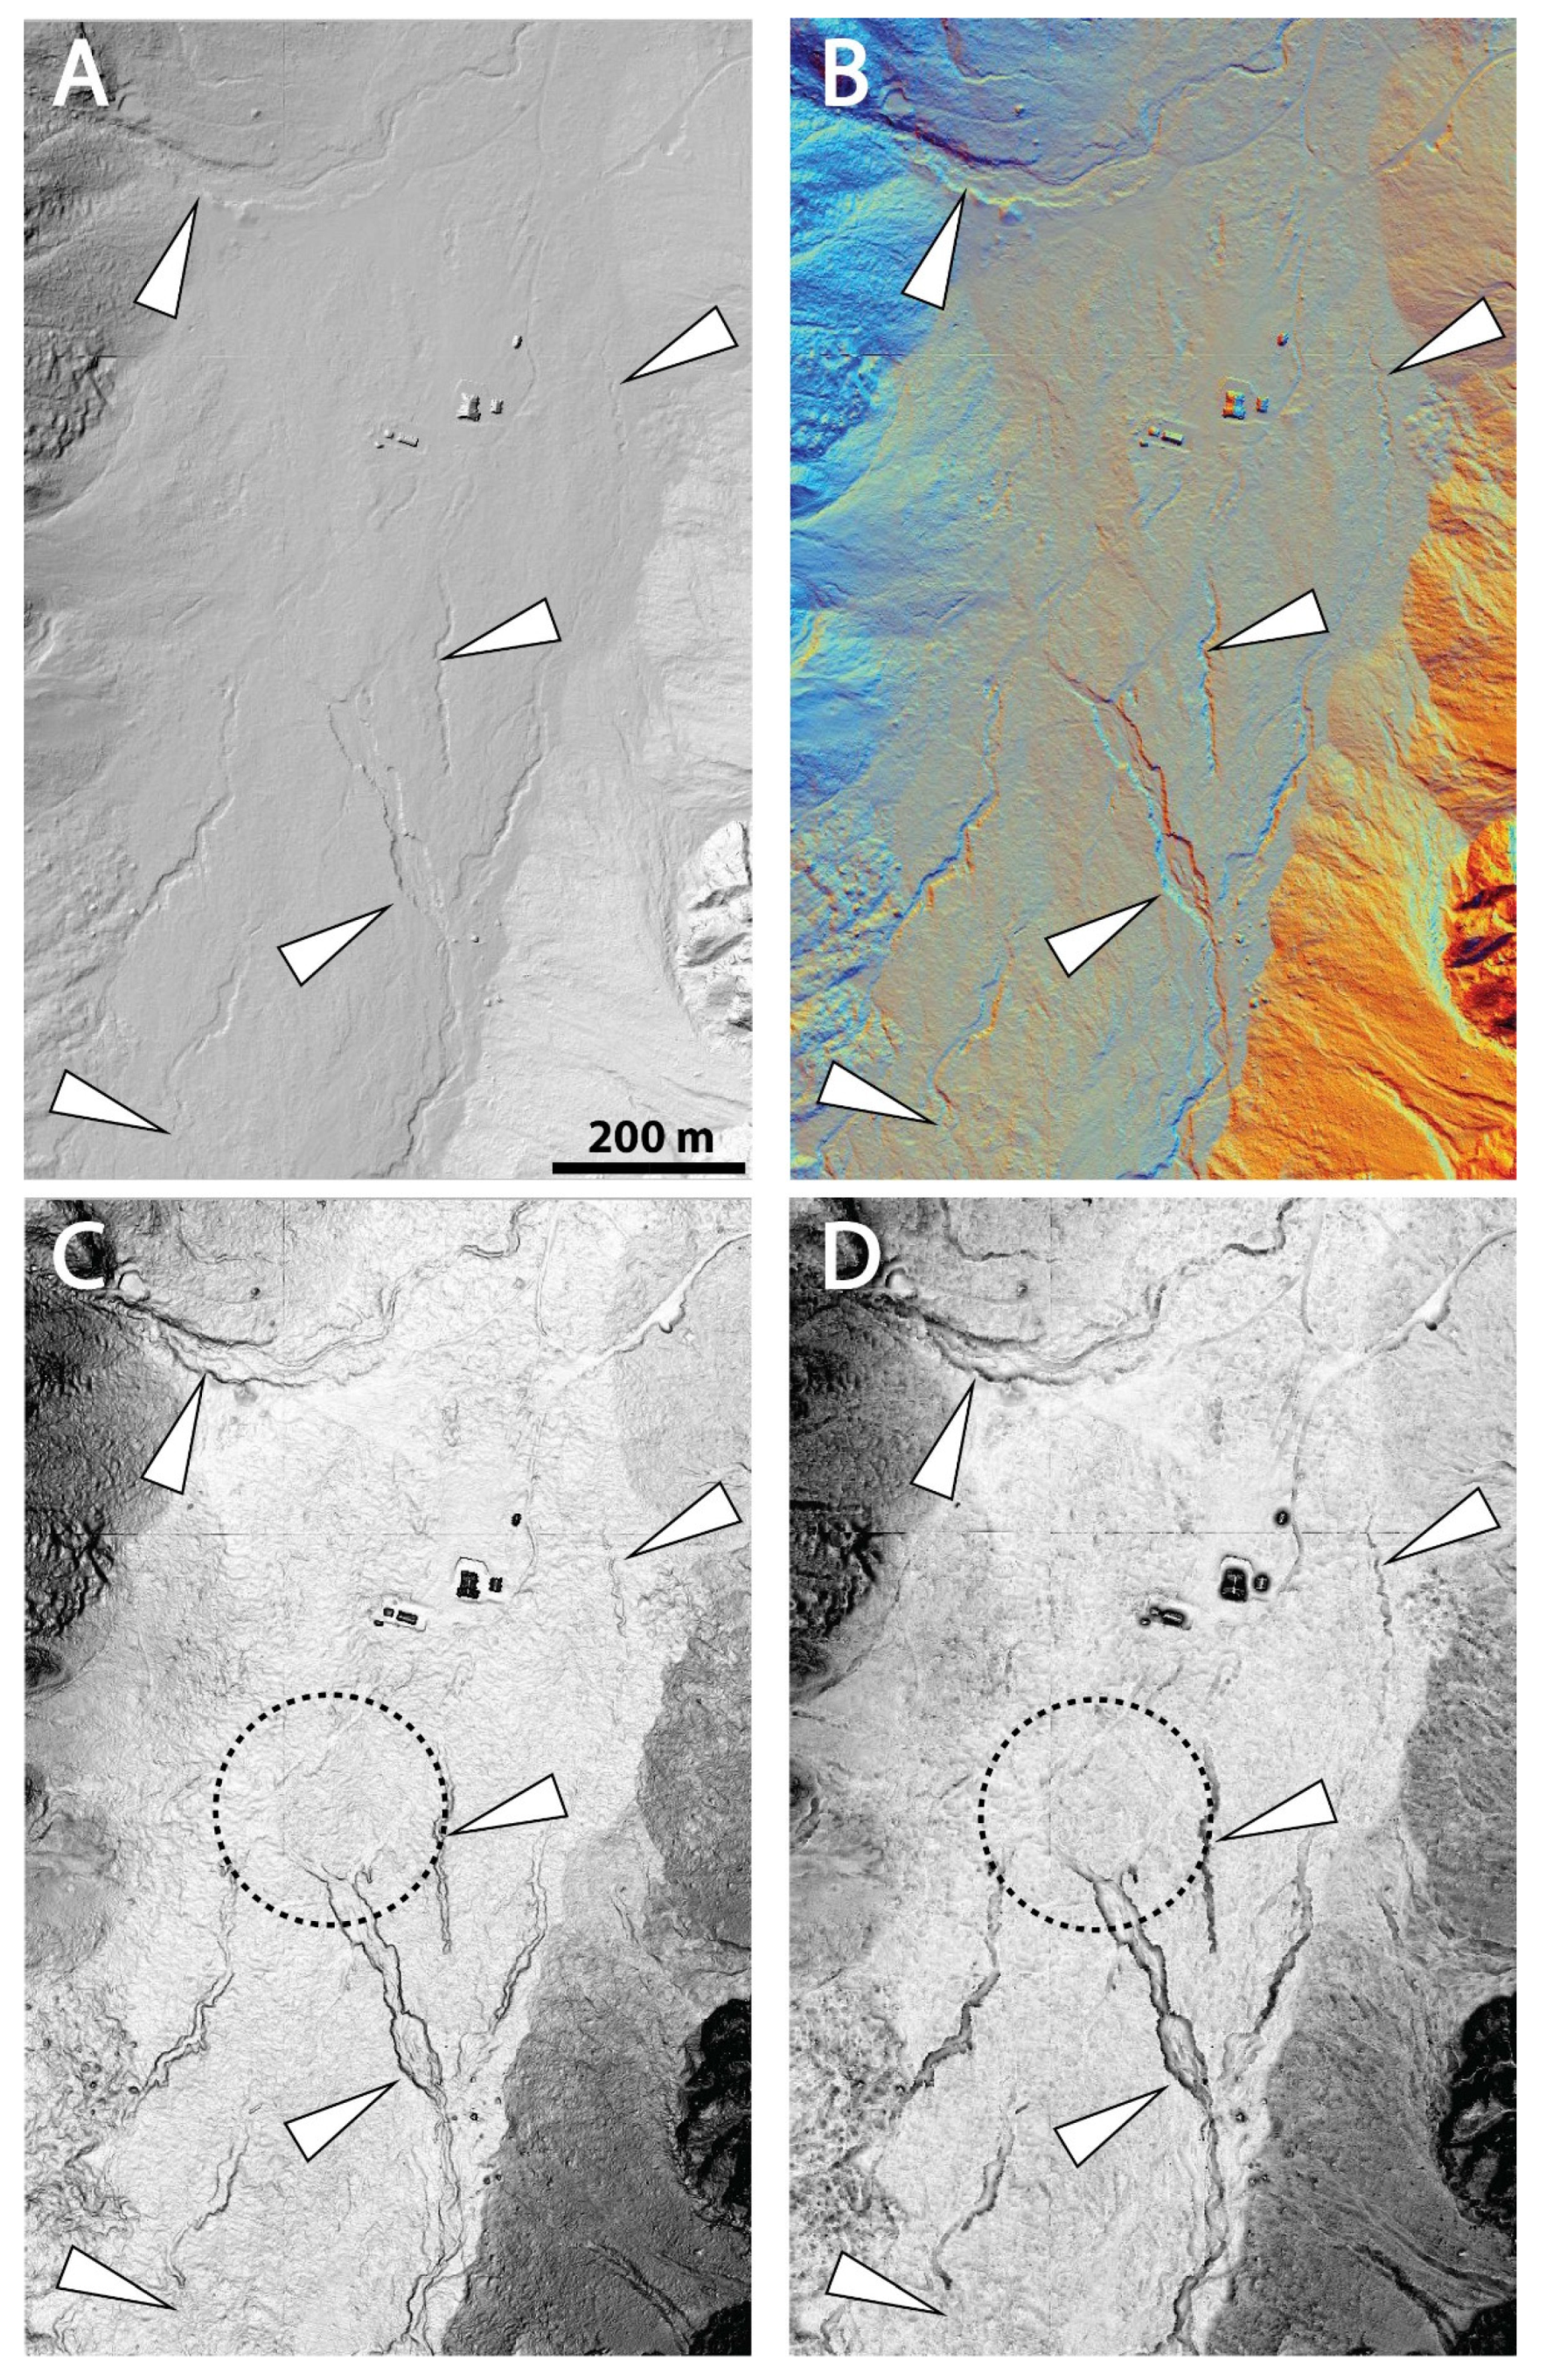
Fluvial deposits are present in areas with a relatively flat surface. A common morphological feature present on these deposits are torrential channels, which have a width of a few tens of metres, a depth of up to one metre and have a relatively short runout. Although the channels are visible on analytical hillshading, they are not strongly pronounced due to the orientation of the incoming light. They are much better pronounced on the 8-bit sky view factor, hillshading from multiple directions RGB, and 8-bit slope visualisations (Figure 11). In addition, features such as channel bars can also be also recognised, most notably in hillshading from multiple directions RGB and 8-bit sky view factor (Figure 11B,C). Sediments deposited by ephemeral torrents (marked with circles in Figure 11) are placed out of channels on the flat surface, similarly to out-of-channel deposits on alluvial fans. However, due to their low gradient and lack of distinct morphological features, these deposits are barely visible on both analytical hillshading and hillshading from multiple directions. To some extent, they are visible on 8-bit sky view factor and 8-bit slope visualisations, where their spatial extent can be tentatively outlined (Figure 4D–F).
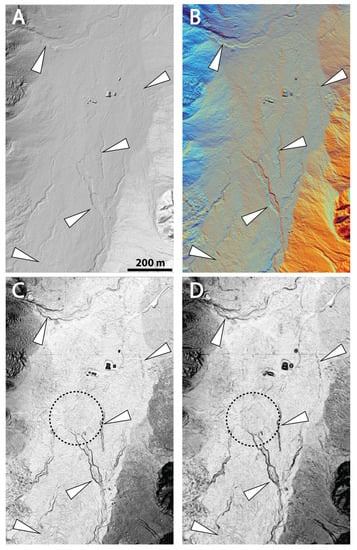
Figure 11.
Torrential channels (marked with white arrows) incised into the fluvial deposit. The area of sediment deposited out of the channel is marked with a dashed circle. The rectangle features in the centre of images are a mountain hut and other buildings. (A) Analytical hillshading (A315, H35), (B) hillshading from multiple directions RGB (D16, H35), (C) 8-bit sky view factor, and (D) 8-bit slope visualisations. For location see rectangle 11 in Figure 1.
4. Discussion
The availability of high-resolution ALS data and presence of several typical alpine geomorphological features assembled in the small area of the Planica valley provide an excellent testing area for comparing different DEM visualisations. Qualitative visual analysis of several visualisations revealed their advantages and disadvantages when applied to a complex alpine landscape. Of the eleven visualisations produced, seven were not suitable for detailed landform analysis in alpine landscapes, offering poorer recognition of basic mountainous landscape features on a small scale compared to analytical hillshading (Figure 3, Table 3). This is because each visualisation is computed using different parameters [30,37]. As a result, some visualisations are better tailored for low-gradient terrains, while others are better at pronouncing high-gradient features. Topographic break lines between steep mountain slopes and relatively low and moderate surface gradients of Quaternary sedimentary bodies can be identified in the local dominance, simple local relief model, slope visualisation, sky illumination model, positive and negative openness visualisations although not always intuitively (Figure 3, Table 3). However, despite the high resolution of DEM, these visualisations were all ineffective for an in-depth examination of small-scale features located on sedimentary bodies with low to moderate surface slopes. Features appeared either too light or too dark (Figure 3), making detailed analysis impossible. The principal component analysis resulted in visualisations in which landforms and small-scale features can be identified, but relief recognition is not always intuitive or easy to interpret. Viewers unfamiliar with the landscape type or study area could easily misinterpret or misidentify landforms. Visualisation techniques not used for analysis of low- to mid-gradient Quaternary landforms could potentially be used for analysis of steeper-gradient surfaces or other non-alpine landscapes (Table 3).

Table 3.
Summary of advantages and disadvantages of each visualisation technique for visualising Quaternary landform features in alpine environments.
However, a qualitative visual comparison of the 8-bit slope visualisation, hillshading from multiple directions RGB (D16 in H35), and the 8-bit sky view factor leads to identifying the vast majority of sedimentary and morphological features not seen in either aerial photographs or analytical hillshading. The visualisations provide a surface analysis beyond simple delineation of individual sedimentary bodies and enable the recognition of small-scale sedimentary and morphological features characteristic of the sedimentary body type. Large, raised landscape features such as debris flow lobe, grain flow deposits, larger boulders on fans and moraines, are much more pronounced and noticeable than their representation in analytical hillshading. Similarly, all shallowly incised features such as channels and gullies appear much clearer. In addition, features inside channels such as channel bars, which are not evident in analytical hillshading, are visible in the 8-bit slope visualisation, in hillshading from multiple directions RGB (D16 in H35), and in the 8-bit sky view factor visualisation. However, despite the high resolution of the generated DEM, some subtle and small-scale sedimentary features could not be detected. Subtle elements, such as out-of-channel deposits, are not discernible and are challenging to outline, but they can be at least roughly delineated due to their weak surface undulation. Small-scale sieve deposits with an approximate extent of two metres in width, ten in length, and a maximum of half a metre could not be detected on any visualisation created. However, at least twice that size larger sieve deposits were identified. No boulders were recognised on debris flow deposits, scree deposits, and on some of the moraines. It appears that the limit for detecting boulders on the produced DEM is five metres in diameter. In comparison to grain flow deposits, which are clearly recognisable (e.g., Figure 8F), boulders have a higher elevation difference. However, boulders smaller than five metres were not identified. This might be due to the boulder’s shape, which is a spherical feature, while grain flows are longitudinal features. This comparison indicates that longitudinal objects, despite being smaller, might be more successfully visually recognised.
The use and availability of high-resolution DEMs derived from ALS point clouds in topography analysis are increasing [15,37], however the ALS data is not available everywhere nor in such a high resolution. The use of presented visualisation techniques is not limited to high resolution ALS but could be used in other available DEM sources. As shown in previous studies, there is no general visualisation that could be provided as a universal surface representation across all landscape types [60]. The mountain landscape has a complex and diverse topography consisting of steep rock faces and relatively flat valley floors covered by intertwined landform features. Such topography is challenging to represent so that all landform features are equally and appropriately identifiable in a single visualisation. In our study, the best option for representing all surface aspects of Quaternary landforms was provided with hillshading from multiple directions RGB, 8-bit sky view factor, and 8-bit slope visualisation. We recommend using a combination of these visualisations as each one has different benefits and can subjected to user’s personal preferences. Hillshading from multiple directions, however, proved to be a visualisation that can be universally used in mountainous or hilly terrain.
The visibility of small- and large-scale features is vastly improved compared to analytical hillshading. All investigated features, from relatively small scales, such as shallow channels, sieve deposits and boulders, to very large-scale features, are easily recognised and have an excellent visual appearance. However, some features such as boulders and channels, might be better noticeable on 8-bit sky view factor and 8-bit slope visualisations than in hillshading from multiple directions RGB. Sky view factor and slope visualisations proved highly effective in detail recognition of small-scale features on a relatively flat surface with low surface inclinations, such as alluvial fans and fluvial deposits. There, topographically less expressed features, such as shallow torrential channels, small scale sieve deposits, and out-of-channel deposits, appear much more prominent. However, there are differences in applicability between the two visualisations. Slope visualisation produces an image where edges of features appear sharper than in the 8-bit sky view factor (Figure 5C,D and Figure 11C,D). For object delineation, the 8-bit slope visualisation appears more applicable.
By comparing the produced DEM visualisations to field mapping [47] we estimate that majority of sedimentary bodies and features can be successfully identified. The identifications and mapping of subtle and small-scale features using DEM is even more exact than field mapping due to inaccessibility of certain areas and/or vegetation cover during mapping campaign. This indicates that different visualisation techniques can be used for re-evaluating the existing geomorphological maps. The remaining unrecognized areas are challenging to identify and need to be either field mapped or investigated using other remote sensing techniques (e.g., using terrestrial laser scanning, structure-from-motion technique, structured light scanning, etc.).
Both field mapping and visual analysis of DEM can be very time consuming. Recent studies in advanced machine learning indicate a great potential for automated recognition of both manmade and natural landforms [41,61,62,63]. Automated recognition can vastly increase the mapped area size and shortens the mapping time. To achieve successful recognition, the input reference data is needed for further pattern recognition. This study shows which visualisations provides best input data for alpine Quaternary landform visual recognition and could serve as a benchmark for future geomorphological process-studies using advanced machine learning.
5. Conclusions
Landform features typical of alpine environments may be poorly or not visible on analytical hillshading or in aerial photographs due to inadequate illumination. This can lead to misinterpretation of landforms or overlooking of important features. We have compared a set of eleven different visualisations of a high-resolution DEM covering a relatively large research area. The principal component analysis, local dominance, simple local relief model, slope visualisation, positive and negative openness visualisations allowed us to distinguish steep mountain faces and ridges from the valley floor. However, these visualisations do not lend themselves to a more detailed analysis of landforms with low to moderate surface gradient. On the other hand, hillshading from multiple directions, 8-bit sky view factor, and 8-bit slop visualisations allowed better interpretation of multiple low-gradient, subtle, small- and large-scale morphological and sedimentary features compared to analytical hillshading or aerial photographs. Our results show that hillshading from multiple directions can be used as a general-purpose visualisation for identifying and mapping Quaternary sedimentary bodies. It provides unambiguous recognition of landforms without regard to their size, surface inclination and regardless of light orientation compared to analytical hillshading. In addition, the 8-bit sky view factor and 8-bit slop visualisation provide more unambiguous recognition of small-scale and subtle sedimentary and morphological features, such as boulders, channels, and channel bars, sieve, and grain flow deposits, on a high-resolution DEM. We recommend interlinked use of these three visualisation techniques in future mapping and analyses of mountainous and hilly terrain.
Author Contributions
Conceptualization, A.N. and K.O.; methodology, A.N. and K.O.; formal analysis, A.N.; writing—original draft preparation, A.N.; writing—review and editing, K.O.; visualization, A.N.; supervision, K.O. All authors have read and agreed to the published version of the manuscript.
Funding
The Slovenian Research Agency financially supported this work within the Young Researcher grant program (nr. 51975), within the research programs P1-0195 (“Geoenvironment and Geomaterials”) and P2-0406 (“Earth Observation and Geoinformatics”), and research project J2-9251 (“M3Sat”).
Institutional Review Board Statement
Not applicable.
Informed Consent Statement
Not applicable.
Data Availability Statement
Publicly available datasets were analyzed in this study. This data can be found here: http://gis.arso.gov.si/evode/profile.aspx?id=atlas_voda_Lidar@Arso (accessed on 16 May 2021).
Acknowledgments
We thank Andrej Šmuc for constructive comments during manuscript preparation. We thank four anonymous reviewers for constructive comments and suggestions, which improved the manuscript.
Conflicts of Interest
The authors declare no conflict of interest. Any role of the funders in the design of the study; in the collection, analyses or the funders had no role in the design of the study; in the collection, analyses, or interpretation of data; in the writing of the manuscript, or in the decision to publish the results.
References
- Sanders, D.; Ostermann, M.; Kramers, J. Quaternary carbonate-rocky talus slope successions (Eastern Alps, Austria): Sedimentary facies and facies architecture. Facies 2009, 55, 345–373. [Google Scholar] [CrossRef]
- Sanders, D.; Ostermann, M. Post-last glacial alluvial fan and talus slope associations (Northern Calcareous Alps, Austria): A proxy for Late Pleistocene to Holocene climate change. Geomorphology 2011, 131, 85–97. [Google Scholar] [CrossRef]
- Deline, P.; Kirkbride, M.P. Rock avalanches on a glacier and morainic complex in Haut Val Ferret (Mont Blanc Massif, Italy). Geomorphology 2009, 103, 80–92. [Google Scholar] [CrossRef]
- Lardeux, P.; Glasser, N.; Holt, T.; Hubbard, B. Glaciological and geomorphological map of Glacier Noir and Glacier Blanc, French Alps. J. Maps 2015, 12, 582–596. [Google Scholar] [CrossRef] [Green Version]
- Gotz, J.; Otto, J.-C.; Et, A. Postglacial sediment storage and rockwall retreat in a semi-closed inner-Alpine sedimentary basin (Gradenmoos, Hohe Tauern, Austria). Geogr. Fis. Din. Quat 2013, 36, 63–80. [Google Scholar]
- Bowman, D. Principles of Alluvial Fan Morphology, 1st ed.; Springer: Dordrecht, The Netherlands, 2019. [Google Scholar]
- Hungr, O.; Leroueil, S.; Picarelli, L. The Varnes classification of landslide types, an update. Landslides 2014, 11, 167–194. [Google Scholar] [CrossRef]
- Milana, J.P. The sieve lobe paradigm: Observations of active deposition. Geology 2010, 38, 207–210. [Google Scholar] [CrossRef]
- Ostermann, M.; Sanders, D.; Ivy-Ochs, S.; Alfimov, V.; Rockenschaub, M.; Römer, A. Early Holocene (8.6ka) rock avalanche deposits, Obernberg valley (Eastern Alps): Landform interpretation and kinematics of rapid mass movement. Geomorphology 2012, 171–172, 83–93. [Google Scholar] [CrossRef] [Green Version]
- Santangelo, N.; Daunisiestadella, J.; Di Crescenzo, G.; DI Donato, V.; Faillace, P.I.; Martín-Fernández, J.A.; Romano, P.; De Santo, A.V.; Scorpio, V. Topographic predictors of susceptibility to alluvial fan flooding, Southern Apennines. Earth Surf. Process. Landf. 2012, 37, 803–817. [Google Scholar] [CrossRef]
- Ouellet, M.A.; Germain, D. Hyperconcentrated flows on a forested alluvial fan of eastern Canada: Geomorphic characteris-tics, return period, and triggering scenarios. Earth Surf. Process. Landf. 2014, 39, 1876–1887. [Google Scholar] [CrossRef]
- Brenna, A.; Surian, N.; Ghinassi, M.; Marchi, L. Sediment–water flows in mountain streams: Recognition and classification based on field evidence. Geomorphology 2020, 371, 107413. [Google Scholar] [CrossRef]
- Procter, E.; Stoffel, M.; Schneuwly-Bollschweiler, M.; Neumann, M. Exploring debris-flow history and process dynamics using an integrative approach on a dolomitic cone in western Austria. Earth Surf. Process. Landf. 2012, 37, 913–922. [Google Scholar] [CrossRef]
- Sofia, G. Combining geomorphometry, feature extraction techniques and Earth-surface processes research: The way for-ward. Geomorphology 2020, 355, 107055. [Google Scholar] [CrossRef]
- Tarolli, P. High-resolution topography for understanding Earth surface processes: Opportunities and challenges. Geomorphology 2014, 216, 295–312. [Google Scholar] [CrossRef]
- Johnstone, S.A.; Hudson, A.M.; Nicovich, S.; Ruleman, C.A.; Sare, R.M.; Thompson, R.A. Establishing chronologies for alluvial-fan sequences with analysis of high-resolution topographic data: San Luis Valley, Colorado, USA. Geosphere 2018, 14, 2487–2504. [Google Scholar] [CrossRef]
- Jagodnik, P.; Gazibara, S.B.; Željko, A.; Arbanas, S.M. Engineering geological mapping using airborne LiDAR datasets—an example from the Vinodol Valley, Croatia. J. Maps 2020, 16, 855–866. [Google Scholar] [CrossRef]
- Sarala, P.; Räisänen, J.; Johansson, P.; Eskola, K. Aerial LiDAR analysis in geomorphological mapping and geochronological determination of surficial deposits in the Sodankylä region, northern Finland. GFF 2015, 137, 293–303. [Google Scholar] [CrossRef]
- Mitasova, H.; Harmon, R.S.; Weaver, K.J.; Lyons, N.J.; Overton, M.F. Scientific visualization of landscapes and landforms. Geomorphology 2012, 137, 122–137. [Google Scholar] [CrossRef]
- Sander, L.; Fruergaard, M.; Pejrup, M. Coastal landforms and the Holocene evolution of the Island of Samsø, Denmark. J. Maps 2016, 12, 276–286. [Google Scholar] [CrossRef] [Green Version]
- Razak, K.; Straatsma, M.; van Westen, C.; Malet, J.-P.; De Jong, S. Airborne laser scanning of forested landslides characterization: Terrain model quality and visualization. Geomorphology 2011, 126, 186–200. [Google Scholar] [CrossRef]
- Roering, J.J.; Mackey, B.H.; Marshall, J.A.; Sweeney, K.E.; Deligne, N.I.; Booth, A.M.; Handwerger, A.L.; Cerovski-Darriau, C. ‘You are HERE’: Connecting the dots with airborne lidar for geomorphic fieldwork. Geomorphology 2013, 200, 172–183. [Google Scholar] [CrossRef]
- Schneevoigt, N.J.; van der Linden, S.; Thamm, H.-P.; Schrott, L. Detecting Alpine landforms from remotely sensed imagery. A pilot study in the Bavarian Alps. Geomorphology 2008, 93, 104–119. [Google Scholar] [CrossRef]
- Eeckhaut, M.V.D.; Poesen, J.; Verstraeten, G.; Vanacker, V.; Nyssen, J.; Moeyersons, J.; Van Beek, L.P.H.; Vandekerckhove, L. Use of LIDAR-derived images for mapping old landslides under forest. Earth Surf. Process. Landf. 2006, 32, 754–769. [Google Scholar] [CrossRef]
- Petschko, H.; Bell, R.; Glade, T. Effectiveness of visually analyzing LiDAR DTM derivatives for earth and debris slide inventory mapping for statistical susceptibility modeling. Landslides 2016, 13, 857–872. [Google Scholar] [CrossRef]
- Marston, B.E.; Jenny, B. Improving the representation of major landforms in analytical relief shading. Int. J. Geogr. Inf. Sci. 2015, 29, 1144–1165. [Google Scholar] [CrossRef]
- Žiga, K.; Somrak, M. Why Not a Single Image? Combining Visualizations to Facilitate Fieldwork and On-Screen Mapping. Remote. Sens. 2019, 11, 747. [Google Scholar] [CrossRef] [Green Version]
- Biland, J.; Çöltekin, A. An empirical assessment of the impact of the light direction on the relief inversion effect in shaded relief maps: NNW is better than NW. Cartogr. Geogr. Inf. Sci. 2017, 44, 358–372. [Google Scholar] [CrossRef]
- Jenny, B.; Patterson, T. Aerial perspective for shaded relief. Cartogr. Geogr. Inf. Sci. 2021, 48, 21–28. [Google Scholar] [CrossRef]
- Zakšek, K.; Oštir, K.; Kokalj, Ž. Sky-View Factor as a Relief Visualization Technique. Remote Sens. 2011, 3, 398–415. [Google Scholar] [CrossRef] [Green Version]
- Eeckhaut, M.V.D.; Poesen, J.; Verstraeten, G.; Vanacker, V.; Moeyersons, J.; Nyssen, J.; van Beek, L. The effectiveness of hillshade maps and expert knowledge in mapping old deep-seated landslides. Geomorphology 2005, 67, 351–363. [Google Scholar] [CrossRef]
- Farmakis-Serebryakova, M.; Hurni, L. Comparison of Relief Shading Techniques Applied to Landforms. ISPRS Int. J. Geo-Inf. 2020, 9, 253. [Google Scholar] [CrossRef] [Green Version]
- Mayoral, A.; Toumazet, J.-P.; Simon, F.-X.; Vautier, F.; Peiry, J.-L. The Highest Gradient Model: A New Method for Analytical Assessment of the Efficiency of LiDAR-Derived Visualization Techniques for Landform Detection and Mapping. Remote. Sens. 2017, 9, 120. [Google Scholar] [CrossRef] [Green Version]
- Doneus, M. Openness as Visualization Technique for Interpretative Mapping of Airborne Lidar Derived Digital Terrain Models. Remote. Sens. 2013, 5, 6427–6442. [Google Scholar] [CrossRef] [Green Version]
- Verbovšek, T.; Popit, T.; Kokalj, Ž. VAT Method for Visualization of Mass Movement Features: An Alternative to Hillshaded DEM. Remote. Sens. 2019, 11, 2946. [Google Scholar] [CrossRef]
- Štular, B.; Žiga, K.; Oštir, K.; Nuninger, L. Visualization of lidar-derived relief models for detection of archaeological features. J. Archaeol. Sci. 2012, 39, 3354–3360. [Google Scholar] [CrossRef]
- Kokalj, Ž.; Hesse, R. Airborne Laser Scanning Raster Data Visualization: A Guide to Good Practice, 1st ed.; Gregorič Bon, N., Ed.; Založba ZRC: Ljubljana, Slovenia, 2017; ISBN 978-961-254-984-8. [Google Scholar]
- Smith, M.J.; Clark, C.D. Methods for the visualization of digital elevation models for landform mapping. Earth Surf. Process. Landf. 2005, 30, 885–900. [Google Scholar] [CrossRef]
- Inomata, T.; Pinzón, F.; Ranchos, J.L.; Haraguchi, T.; Nasu, H.; Fernandez-Diaz, J.C.; Aoyama, K.; Yonenobu, H. Archaeological Application of Airborne LiDAR with Object-Based Vegetation Classification and Visualization Techniques at the Lowland Maya Site of Ceibal, Guatemala. Remote Sens. 2017, 9, 563. [Google Scholar] [CrossRef] [Green Version]
- Masini, N.; Gizzi, F.T.; Biscione, M.; Fundone, V.; Sedile, M.; Sileo, M.; Pecci, A.; Lacovara, B.; Lasaponara, R. Medieval Archaeology Under the Canopy with LiDAR. The (Re)Discovery of a Medieval Fortified Settlement in Southern Italy. Remote Sens. 2018, 10, 1598. [Google Scholar] [CrossRef] [Green Version]
- Somrak, M.; Džeroski, S.; Kokalj, Ž. Learning to Classify Structures in ALS-derived Visualizations of Ancient Maya Settlements with CNN. Remote. Sens. 2020, 12, 2215. [Google Scholar] [CrossRef]
- Thompson, A.E. Detecting Classic Maya Settlements with Lidar-Derived Relief Visualizations. Remote Sens. 2020, 12, 2838. [Google Scholar] [CrossRef]
- Bennett, R.; Welham, K.; Hill, R.A.; Ford, A. A Comparison of Visualization Techniques for Models Created from Airborne Laser Scanned Data. Archaeol. Prospect. 2012, 19, 41–48. [Google Scholar] [CrossRef]
- Favalli, M.; Fornaciai, A. Visualization and comparison of DEM-derived parameters. Application to volcanic areas. Geomorphology 2017, 290, 69–84. [Google Scholar] [CrossRef]
- Chen, R.-F.; Lin, C.-W.; Chen, Y.-H.; He, T.-C.; Fei, L.-Y.; Jin-King Liu, J.; Gloaguen, R.; Thenkabail, P.S. Detecting and Characterizing Active Thrust Fault and Deep-Seated Landslides in Dense Forest Areas of Southern Taiwan Using Airborne LiDAR DEM. Remote Sens. 2015, 7, 15443–15466. [Google Scholar] [CrossRef] [Green Version]
- Delaney, C.A.; McCarron, S.; Davis, S. Irish Ice Sheet dynamics during deglaciation of the central Irish Midlands: Evidence of ice streaming and surging from airborne LiDAR. Geomorphology 2018, 306, 235–253. [Google Scholar] [CrossRef]
- Novak, A.; Popit, T.; Šmuc, A. Sedimentological and geomorphological characteristics of Quaternary deposits in the Planica-Tamar Valley in the Julian Alps (NW Slovenia). J. Maps 2018, 14, 382–391. [Google Scholar] [CrossRef]
- Bohinec, V. K morfologiji in glaciologiji rateške pokrajine. Geogr. Vestn. 1935, 11, 100–132. [Google Scholar]
- Triglav Čekada, M.; Barborič, B.; Zorn, M.; Ferk, M. Lasersko skeniranje Slovenije in akumulacijske reliefne oblike v slovenskem visokogorju. In Raziskave s Področja Geodezije in Geofizike 2015, Ljubljana; Kuhar, M., Čop, R., Ličer, M., Vreča, P., Gosar, A., Kobold, M., Kralj, P., Skok, G., Stopar, B., Čarman, M., Eds.; Fakulteta za Gradbeništvo in Geodezijo: Ljubljana, Slovenia, 2015; pp. 51–65. ISBN 978-961-6884-34-1. [Google Scholar]
- Šmuc, A.; Janecka, K.; Lempa, M.; Kaczka, R.J. The Spatio-Temporal Dynamics of the Ciprnik Complex Landslide, Tamar Valley, Julian Alps, Slovenia. Stud. Geomorphol. Carpatho-Balc. 2015, 49, 35–54. [Google Scholar] [CrossRef]
- Gale, L.; Celarc, B.; Caggiati, M.; Kolar-Jurkovšek, T.; Jurkovšek, B.; Gianolla, P. Paleogeographic significance of Upper Triassic basinal succession of the Tamar Valley, northern Julian Alps (Slovenia). Geol. Carpathica 2015, 66, 269–283. [Google Scholar] [CrossRef]
- Celarc, B. Problematika »cordevolskih« apnencev in dolomitov v slovenskih Južnih Alpah Problems of the “Cordevolian” Limestone and Dolomite in the Slovenian part of the Southern Alps. Geologija 2004, 47, 139–149. [Google Scholar] [CrossRef]
- ARSO Lidar Slovenia. Available online: http://gis.arso.gov.si/evode/profile.aspx?id=atlas_voda_Lidar@Arso (accessed on 16 May 2021).
- Blair, T.C.; McPherson, J.G. Alluvial fans and their natural distinction from rivers based on morphology, hydraulic processes, sedimentary processes, and facies assemblages. J. Sediment. Res. A Sediment. Petrol. Process. 1994, 64, 450–489. [Google Scholar] [CrossRef]
- ESRI an Overview of the to Raster Toolset—Help | ArcGIS for Desktop. Available online: https://desktop.arcgis.com/en/arcmap/10.3/tools/conversion-toolbox/an-overview-of-the-to-raster-toolset.htm (accessed on 9 July 2021).
- ESRI LAS Dataset to Raster—Help | ArcGIS for Desktop. Available online: https://desktop.arcgis.com/en/arcmap/10.3/tools/conversion-toolbox/las-dataset-to-raster.htm (accessed on 9 July 2021).
- RVT Relief Visualization Toolbox in Python Documentation. Available online: https://rvt-py.readthedocs.io/en/latest/ (accessed on 16 May 2021).
- QGIS QGIS. Available online: https://www.qgis.org/en/site/ (accessed on 9 July 2021).
- QGIS QGIS Python Plugins Repository. Available online: https://plugins.qgis.org/plugins/profiletool/ (accessed on 9 July 2021).
- Pingel, T.J.; Clarke, K.; Ford, A. Bonemapping: A LiDAR processing and visualization technique in support of archaeology under the canopy. Cartogr. Geogr. Inf. Sci. 2015, 42, 18–26. [Google Scholar] [CrossRef]
- Middleton, M.; Heikkonen, J.; Nevalainen, P.; Hyvönen, E.; Sutinen, R. Machine learning-based mapping of micro-topographic earthquake-induced paleo-Pulju moraines and liquefaction spreads from a digital elevation model acquired through laser scanning. Geomorphology 2020, 358, 107099. [Google Scholar] [CrossRef]
- Guyot, A.; Lennon, M.; Hubert-Moy, L. Objective comparison of relief visualization techniques with deep CNN for archaeology. J. Archaeol. Sci. Rep. 2021, 38, 103027. [Google Scholar] [CrossRef]
- Li, J.; Zhang, H.; Xu, E. A two-level nested model for extracting positive and negative terrains combining morphology and visualization indicators. Ecol. Indic. 2019, 109, 105842. [Google Scholar] [CrossRef]
Publisher’s Note: MDPI stays neutral with regard to jurisdictional claims in published maps and institutional affiliations. |
© 2021 by the authors. Licensee MDPI, Basel, Switzerland. This article is an open access article distributed under the terms and conditions of the Creative Commons Attribution (CC BY) license (https://creativecommons.org/licenses/by/4.0/).

