
SAR Ship Detection Dataset (SSDD): Official Release and Comprehensive Data Analysis


 , , , , ,
Abstract
:
1. Introduction
1.1. Deep Learning for SAR Ship Detection before SSDD
1.2. Initial Release of SSDD
1.3. Success of SSDD
- The public time of SSDD is the earliest. It is older than the second open dataset SAR-Ship-Dataset by ~1.5 years. When no other datasets are available, SSDD becomes the only option.
- Many countries or organizations have launched various SAR satellites. Several frequently used satellites for SAR ship detection include Sentinel-1 from the European Space Agency (ESA) [107], Gaofen-3 from China [108], TerraX-SAR from Germany [109], COSMO-SkyMed from Italy [110], ALOS from Japan [111], and Kompsat-5 from South Korea [112]. They are all commercial satellites. Except for Sentinel-1, users need to pay to download data, increasing research and development costs. However, the resolutions of Sentinel-1 are modest. In Sentinel-1 SAR images, ships are universally small, with unclear geometric features. However, the emergence of SSDD can solve the above dilemma.
- The publisher of SSDD is active in the SAR remote sensing research community. Some public media platforms promote the dissemination of this dataset.
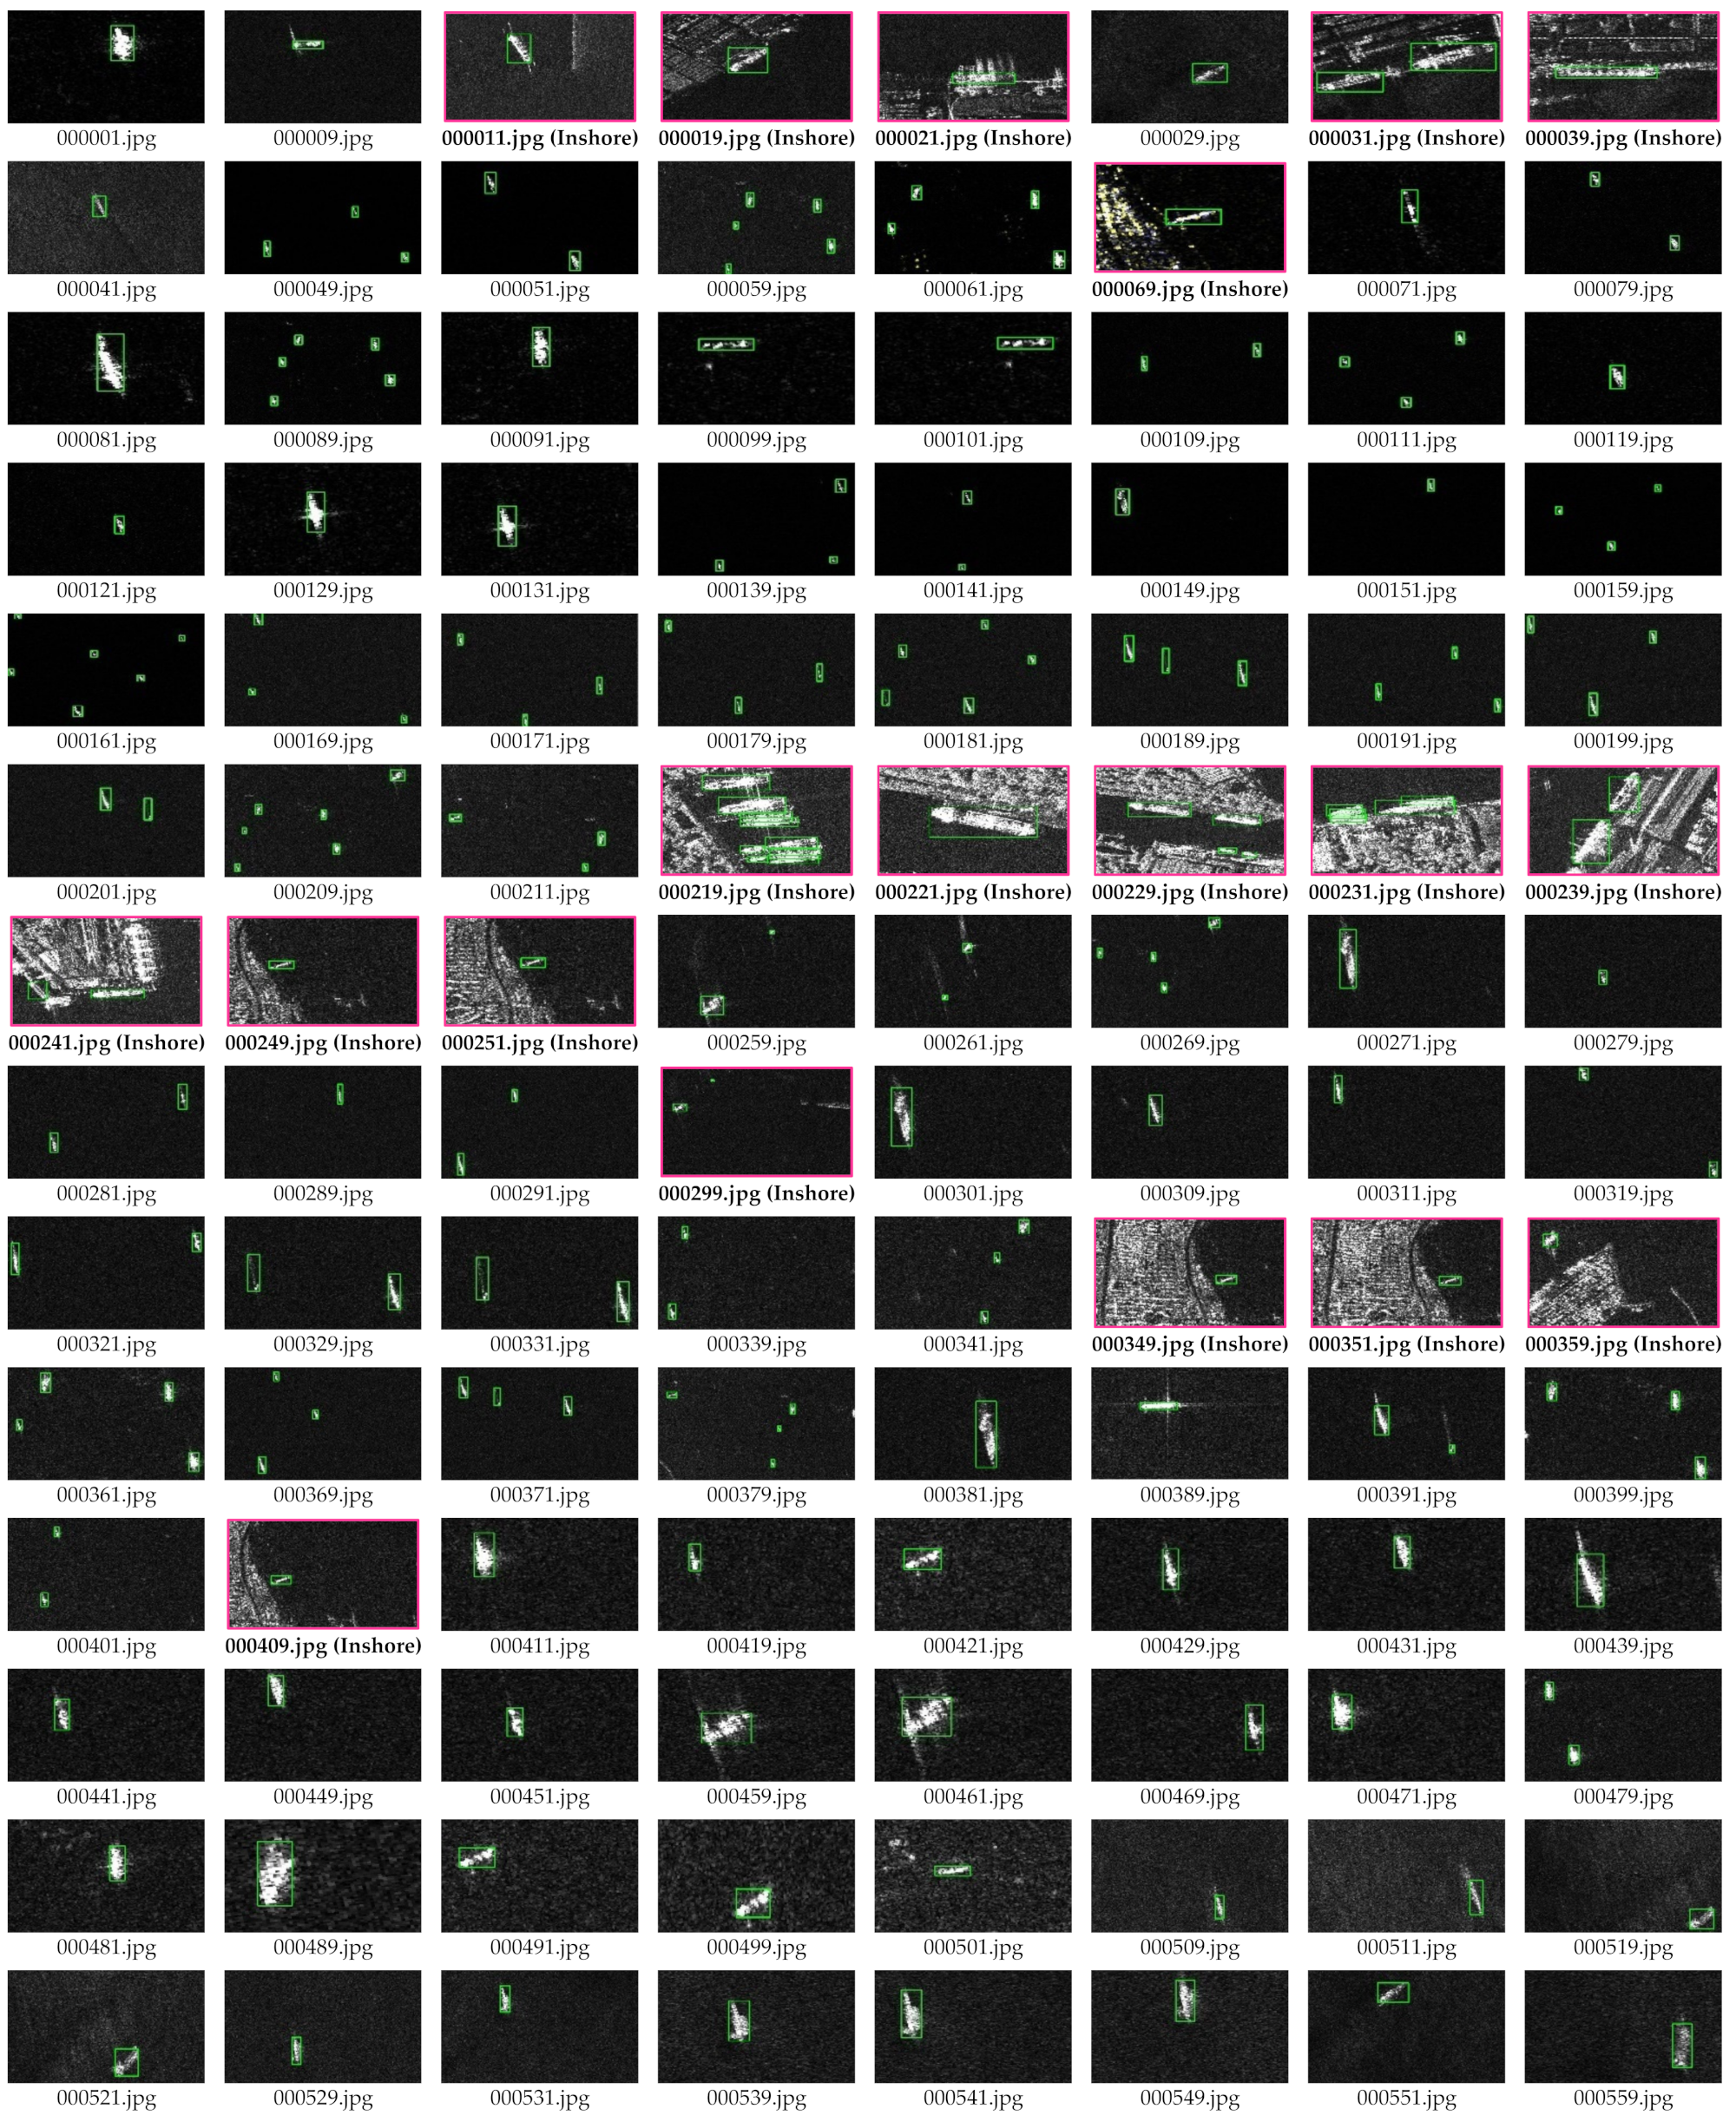
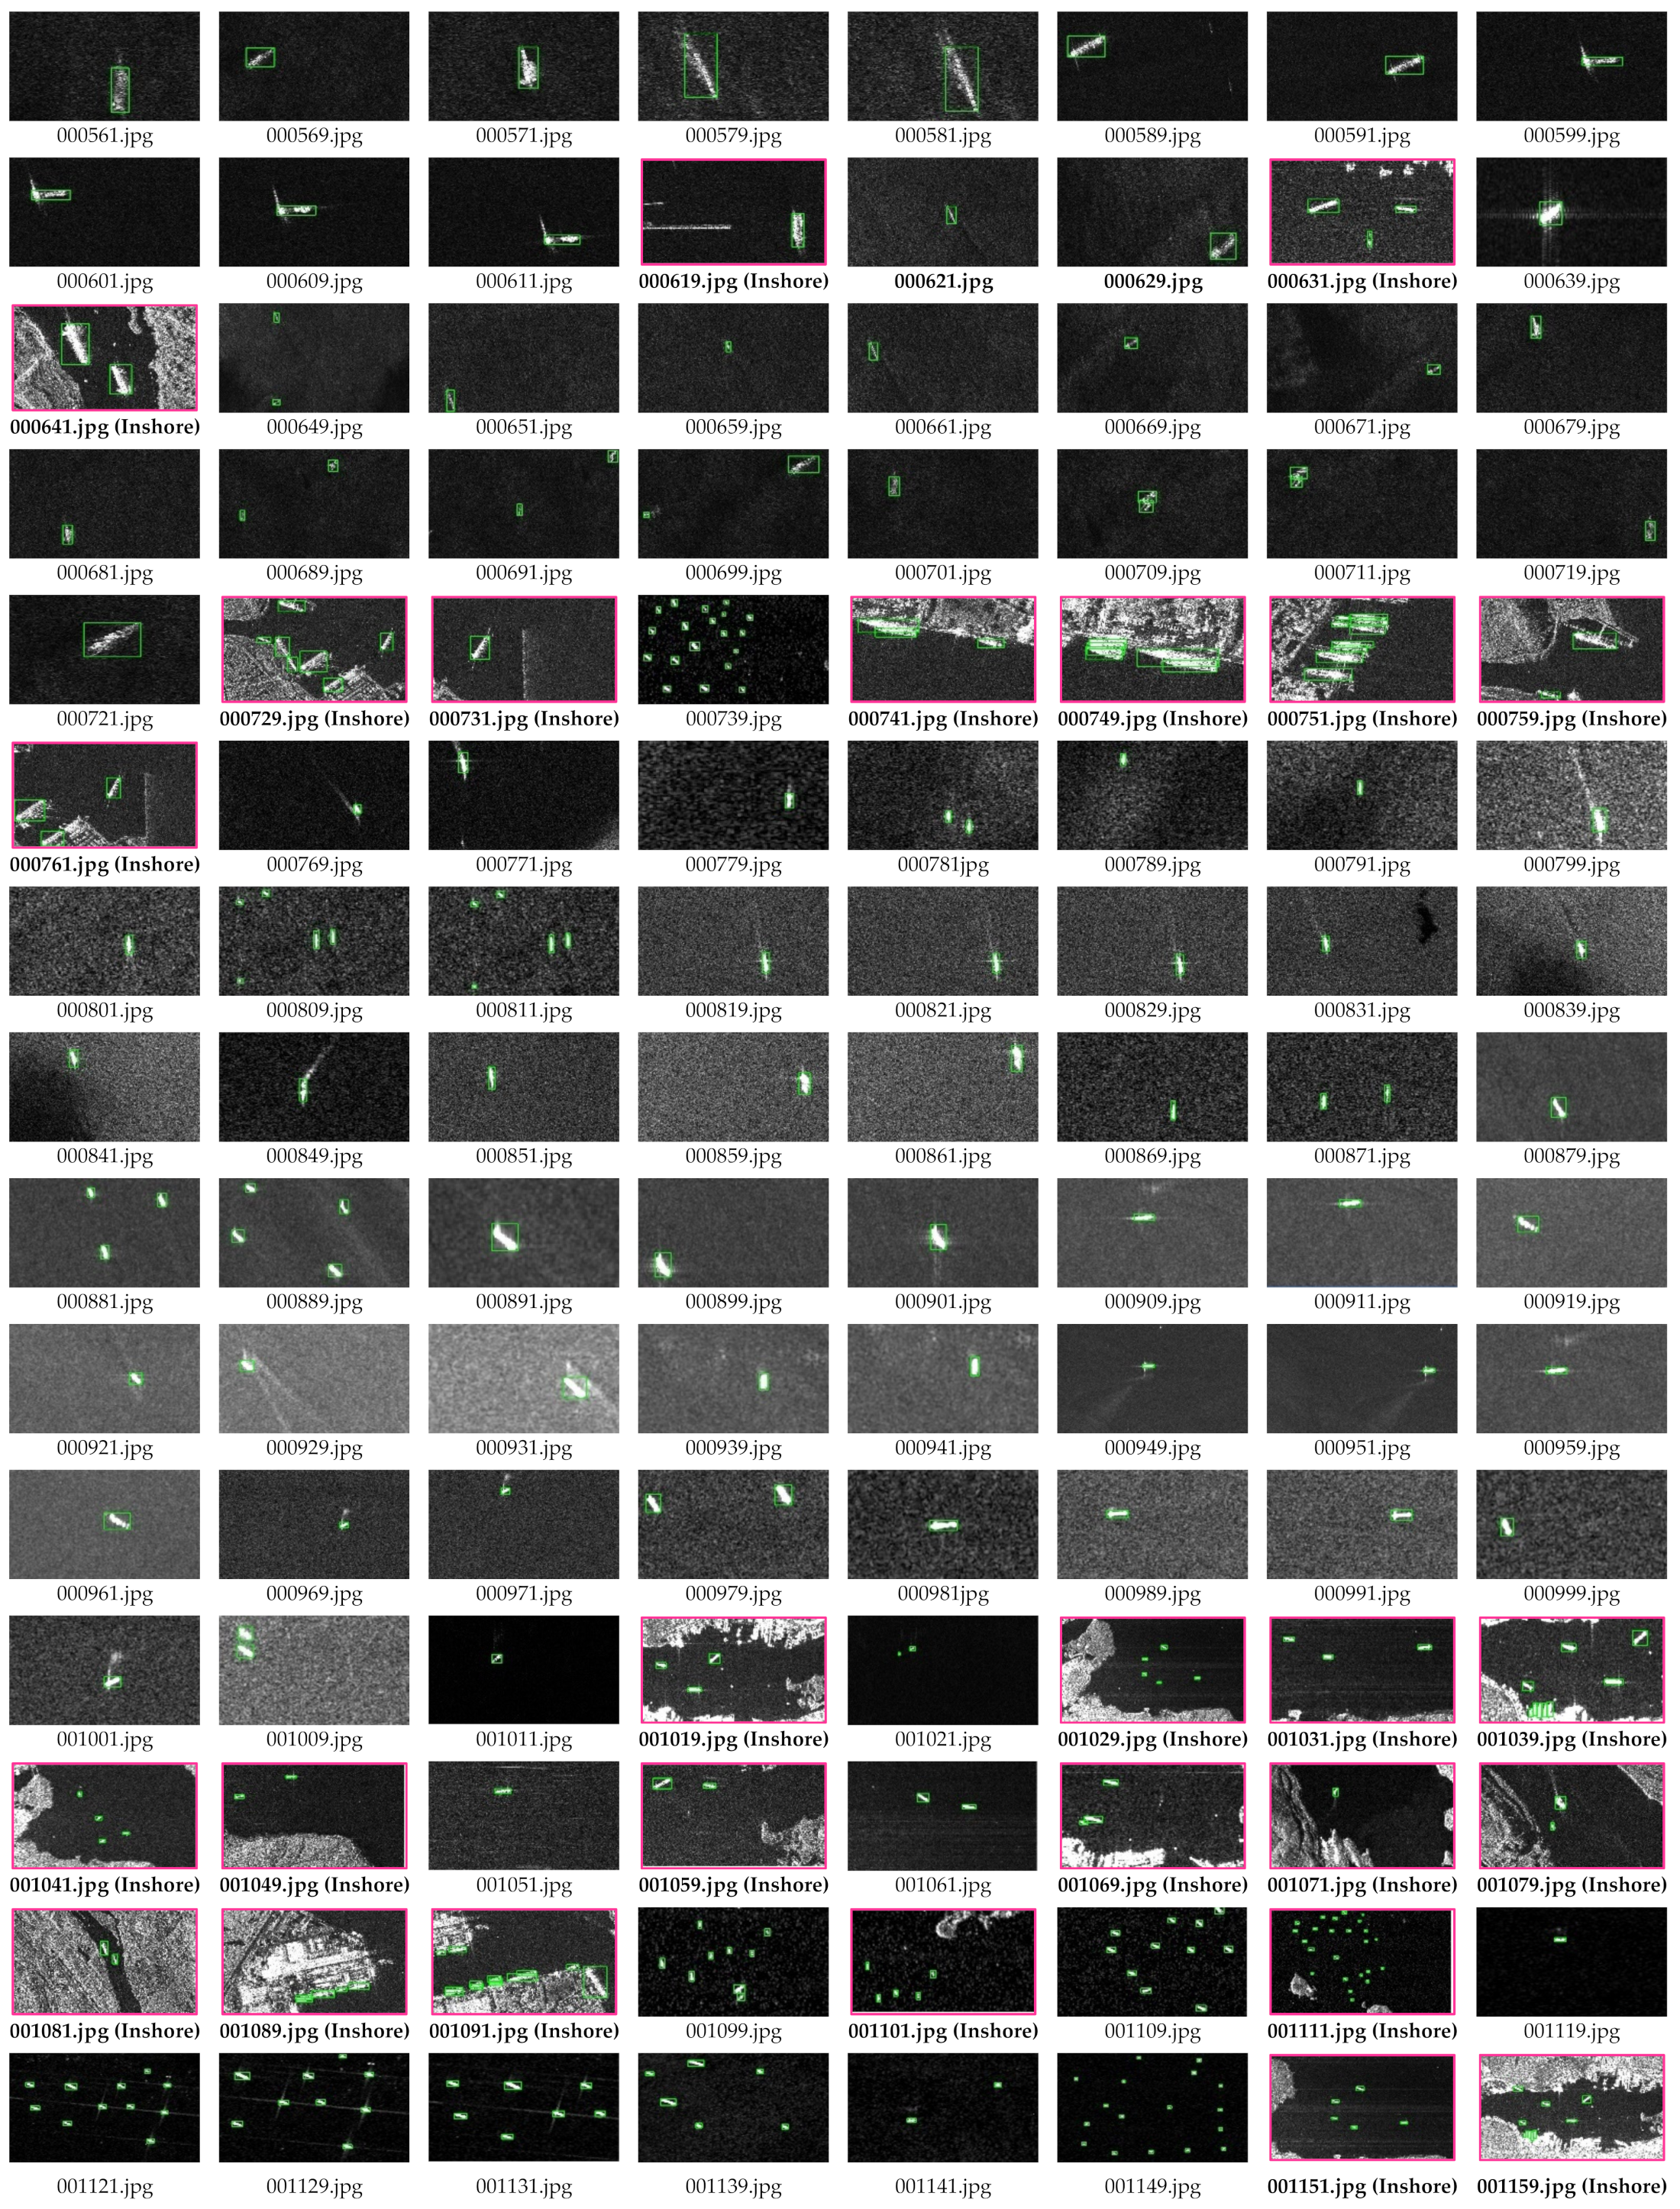
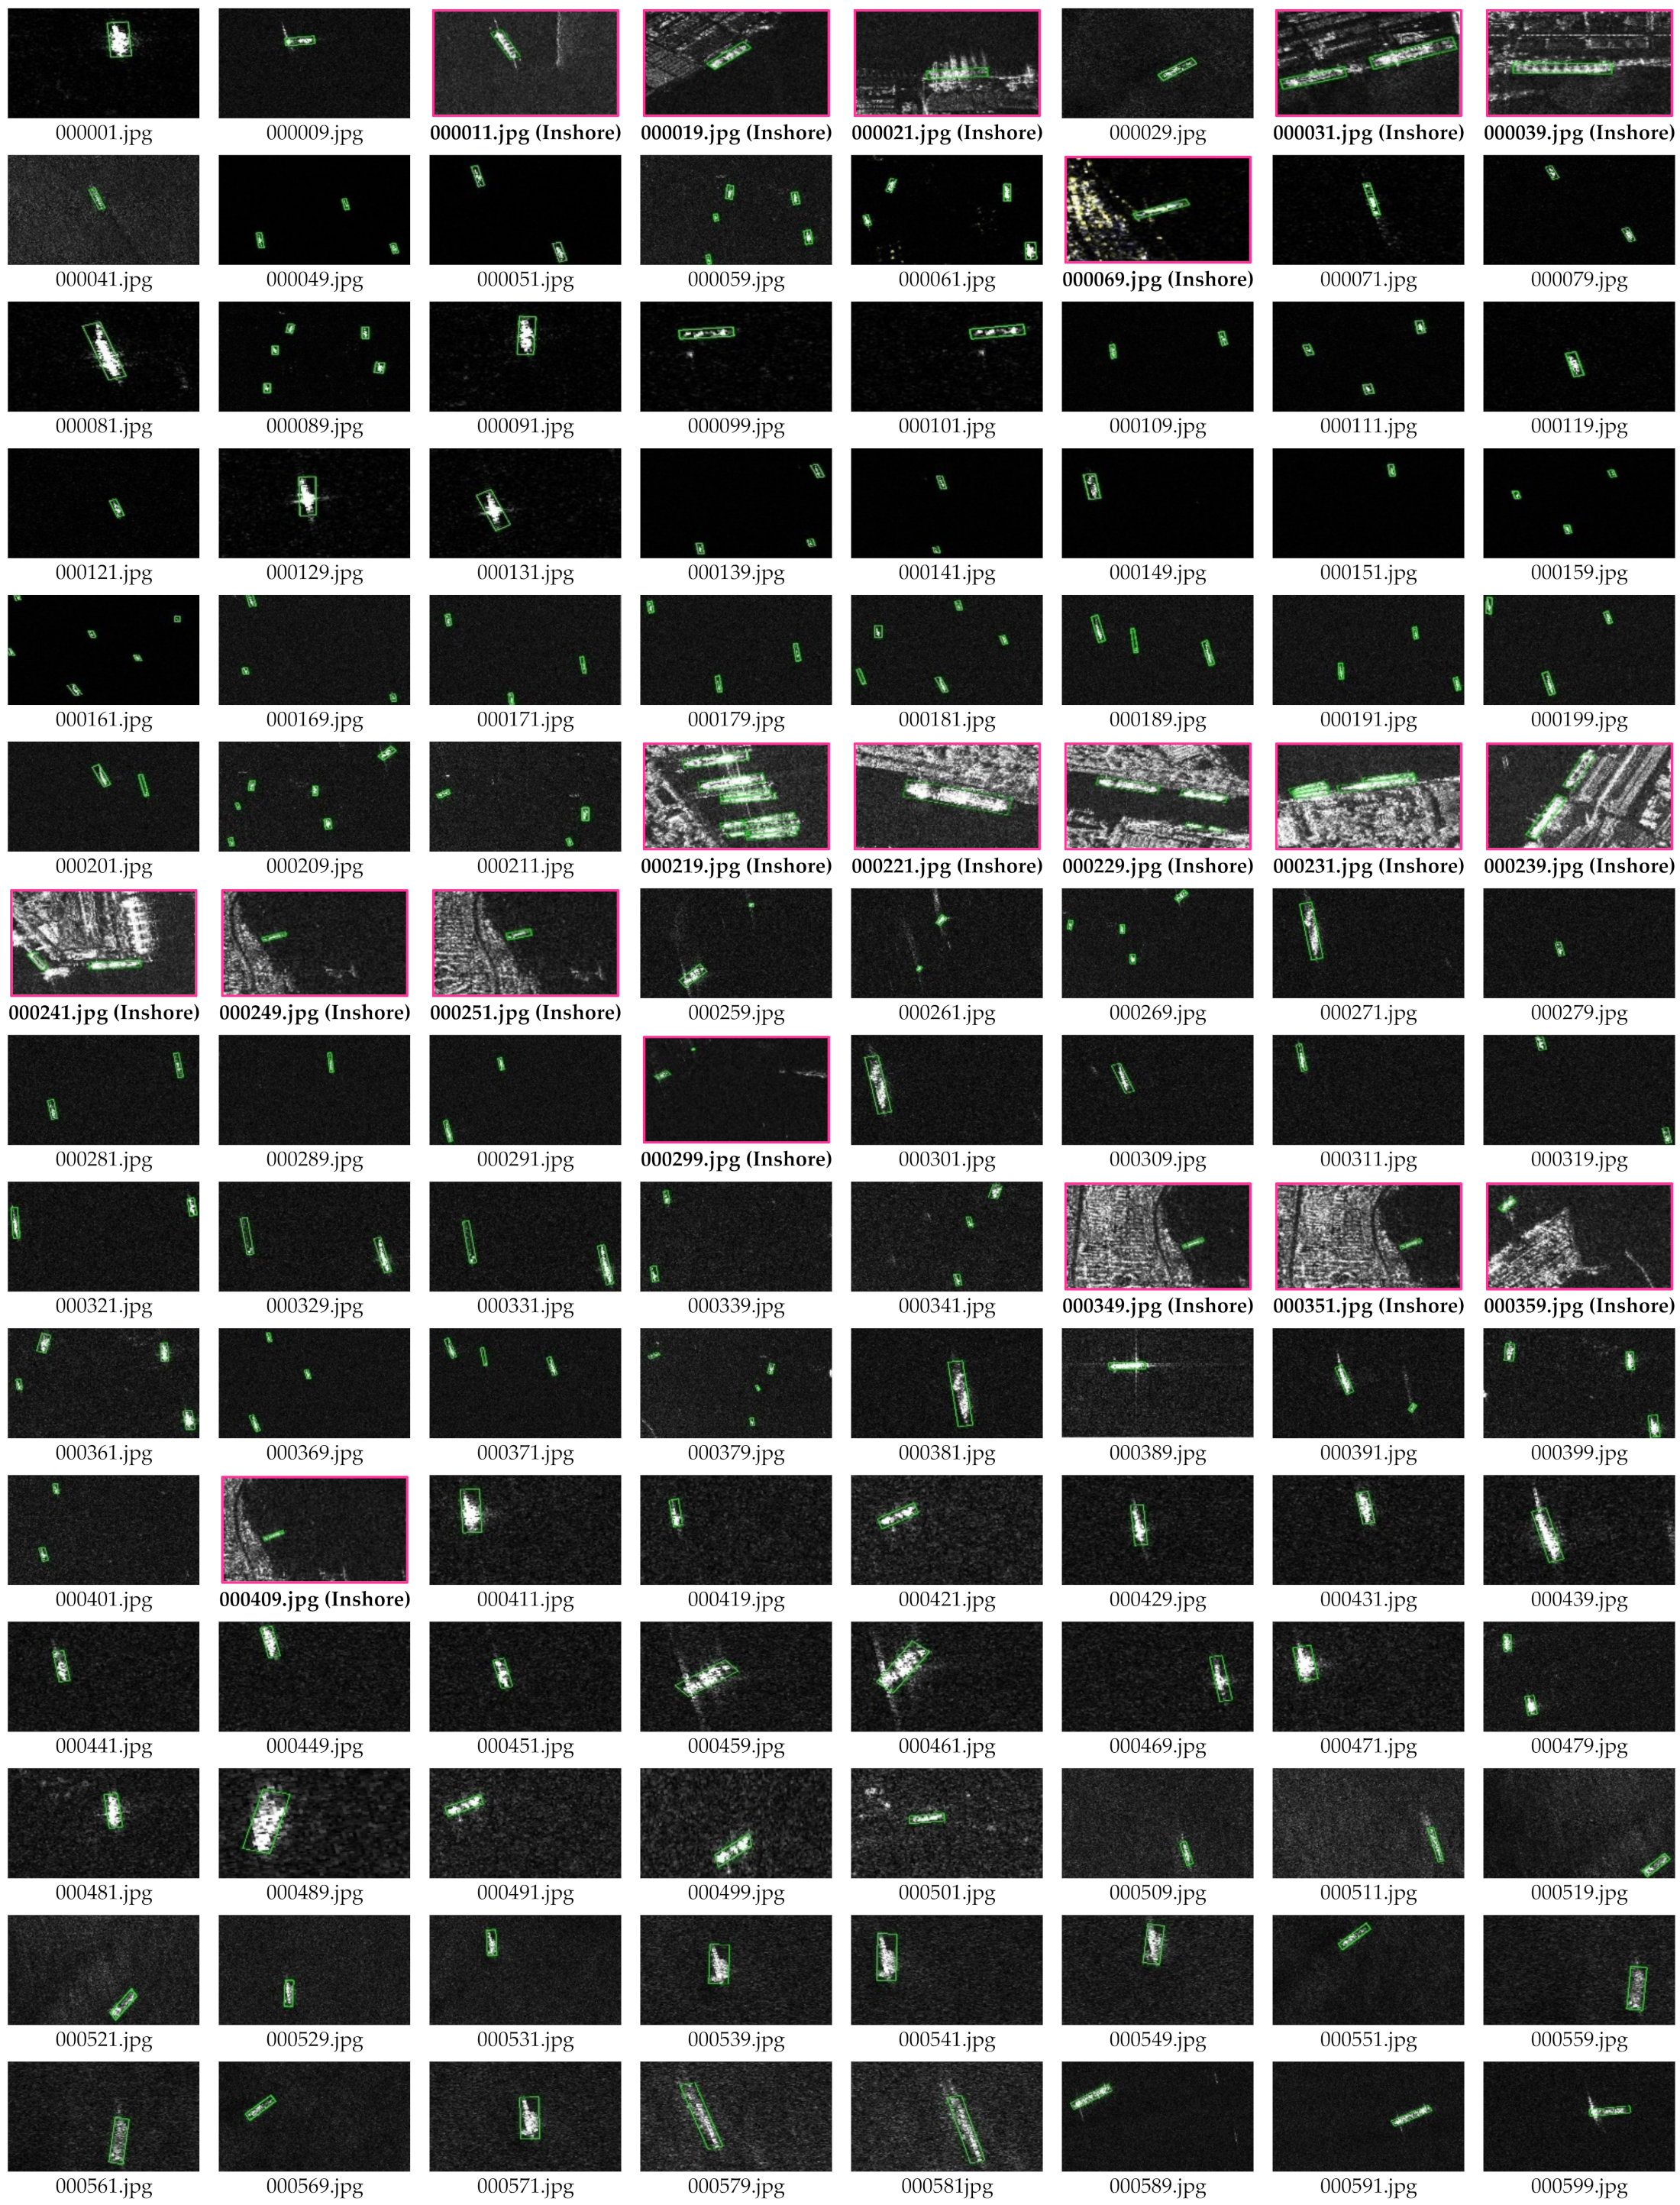
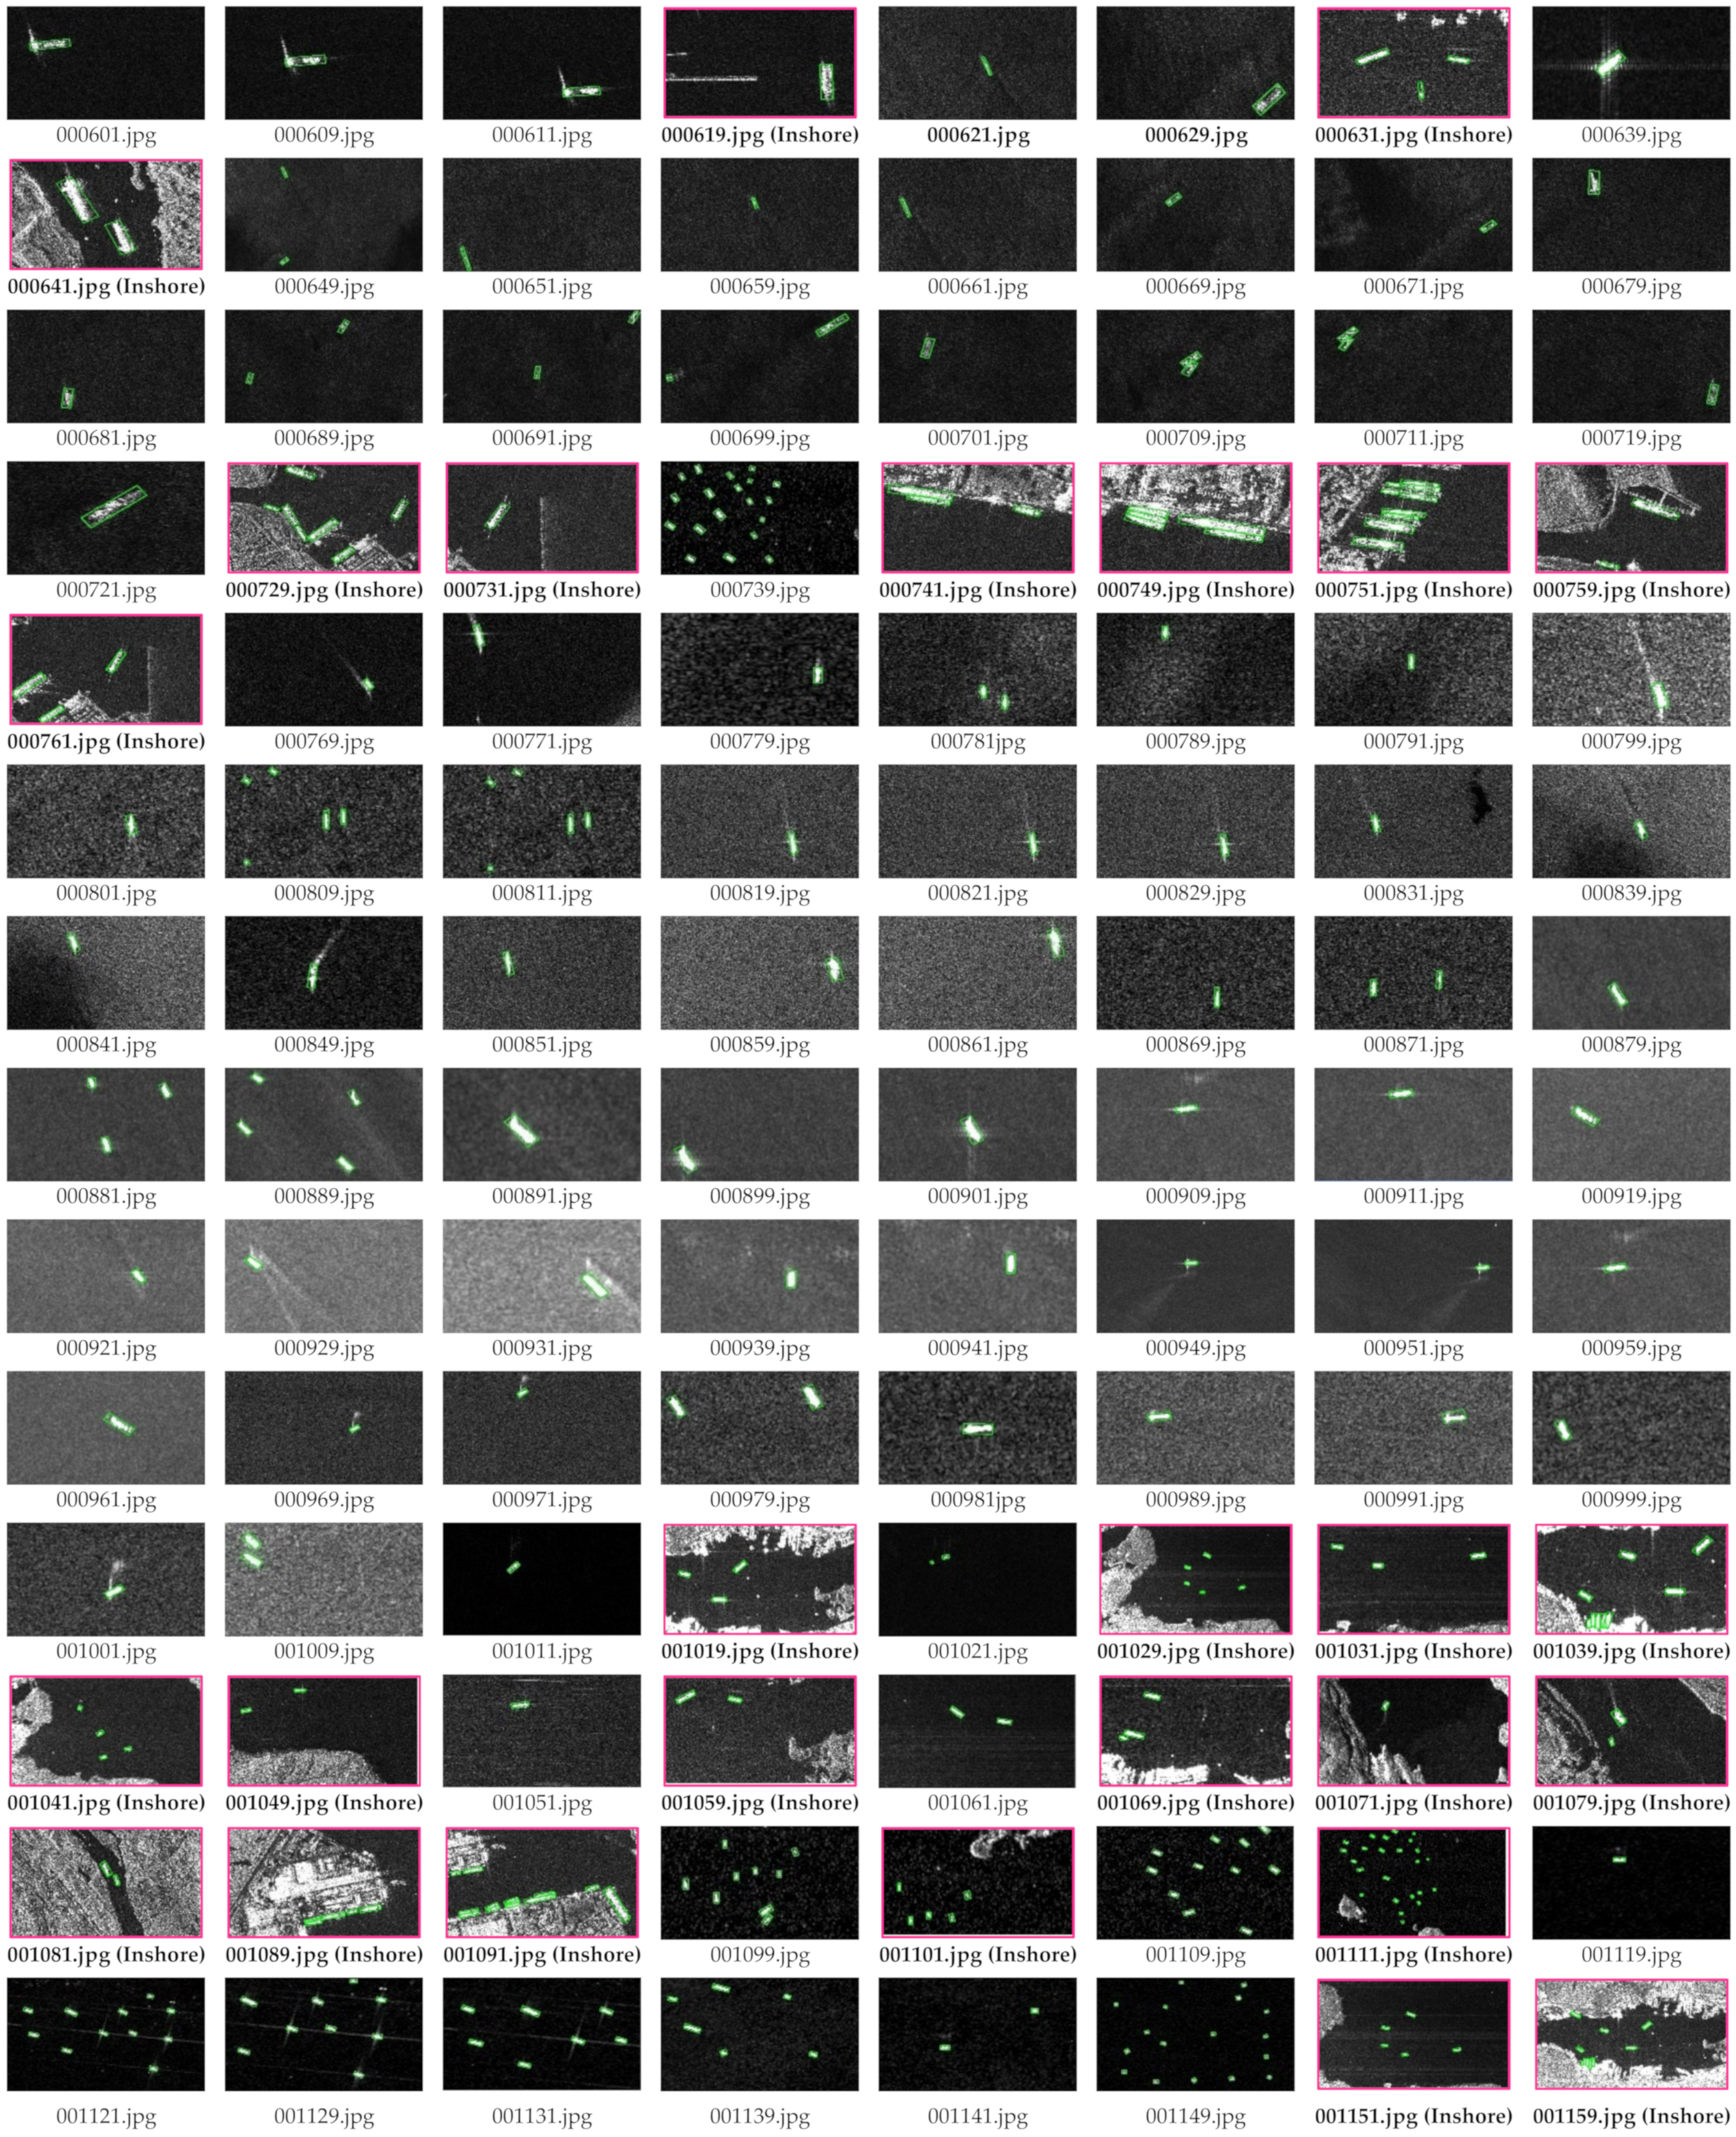
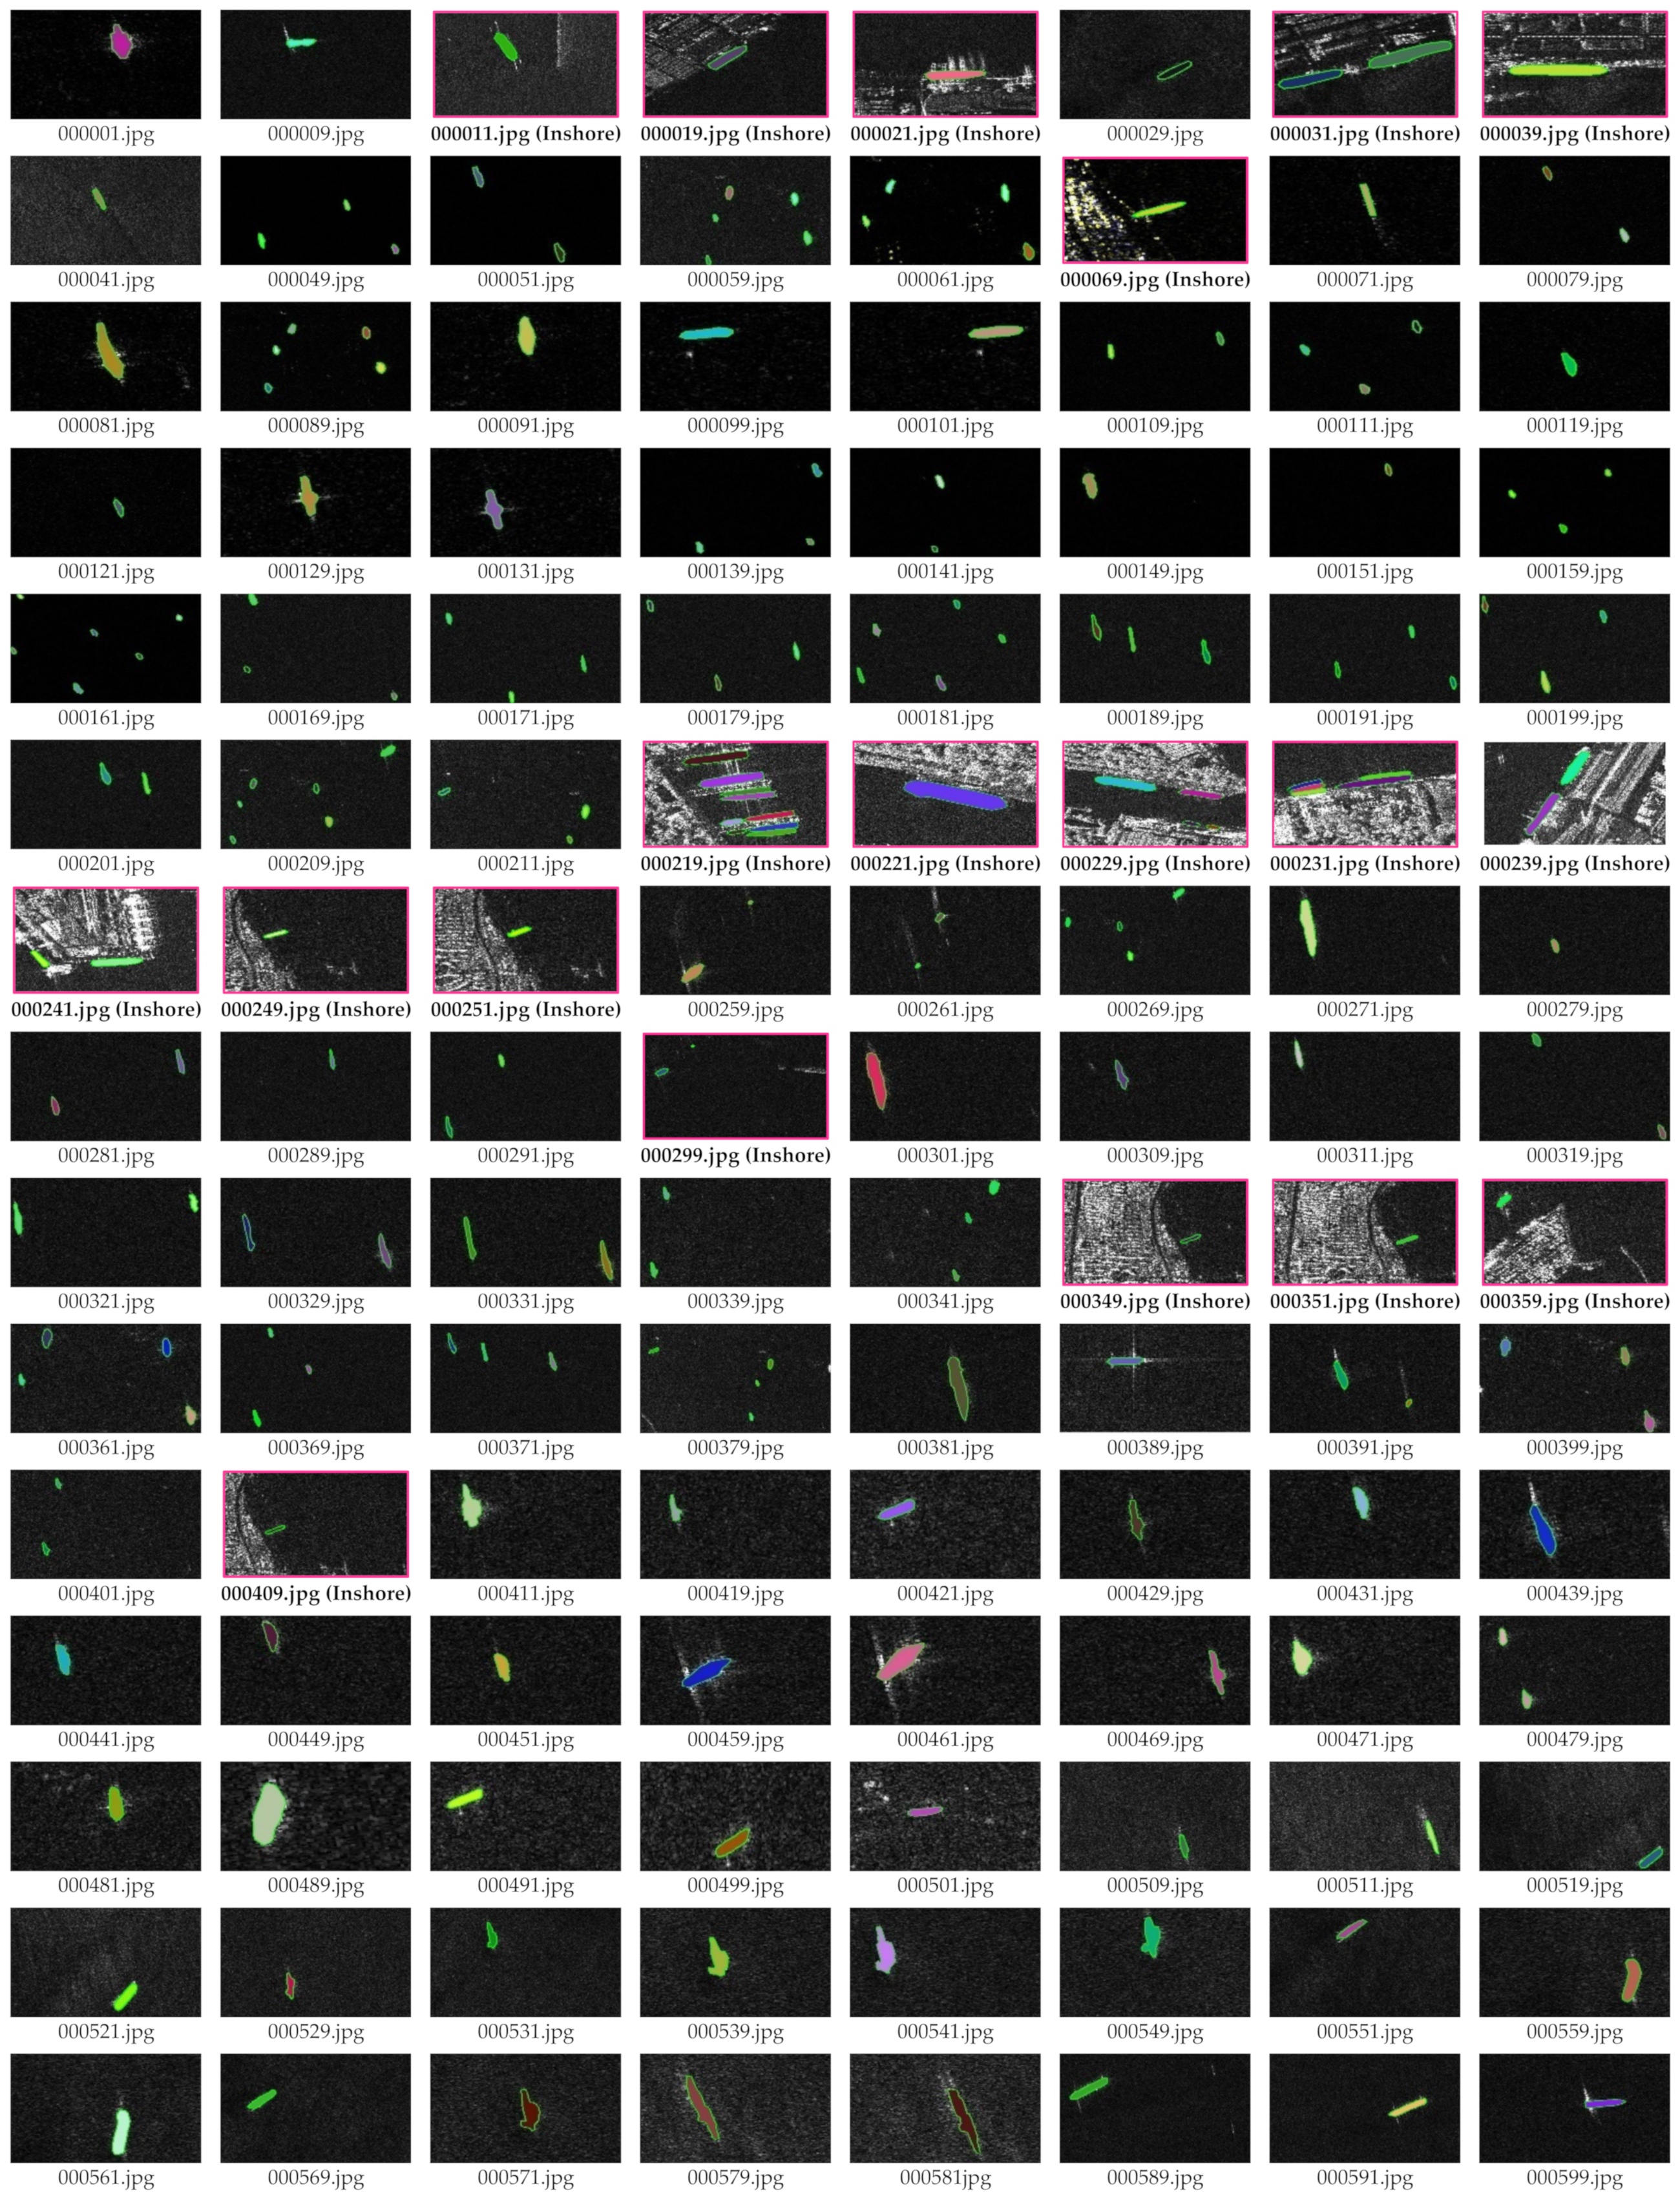
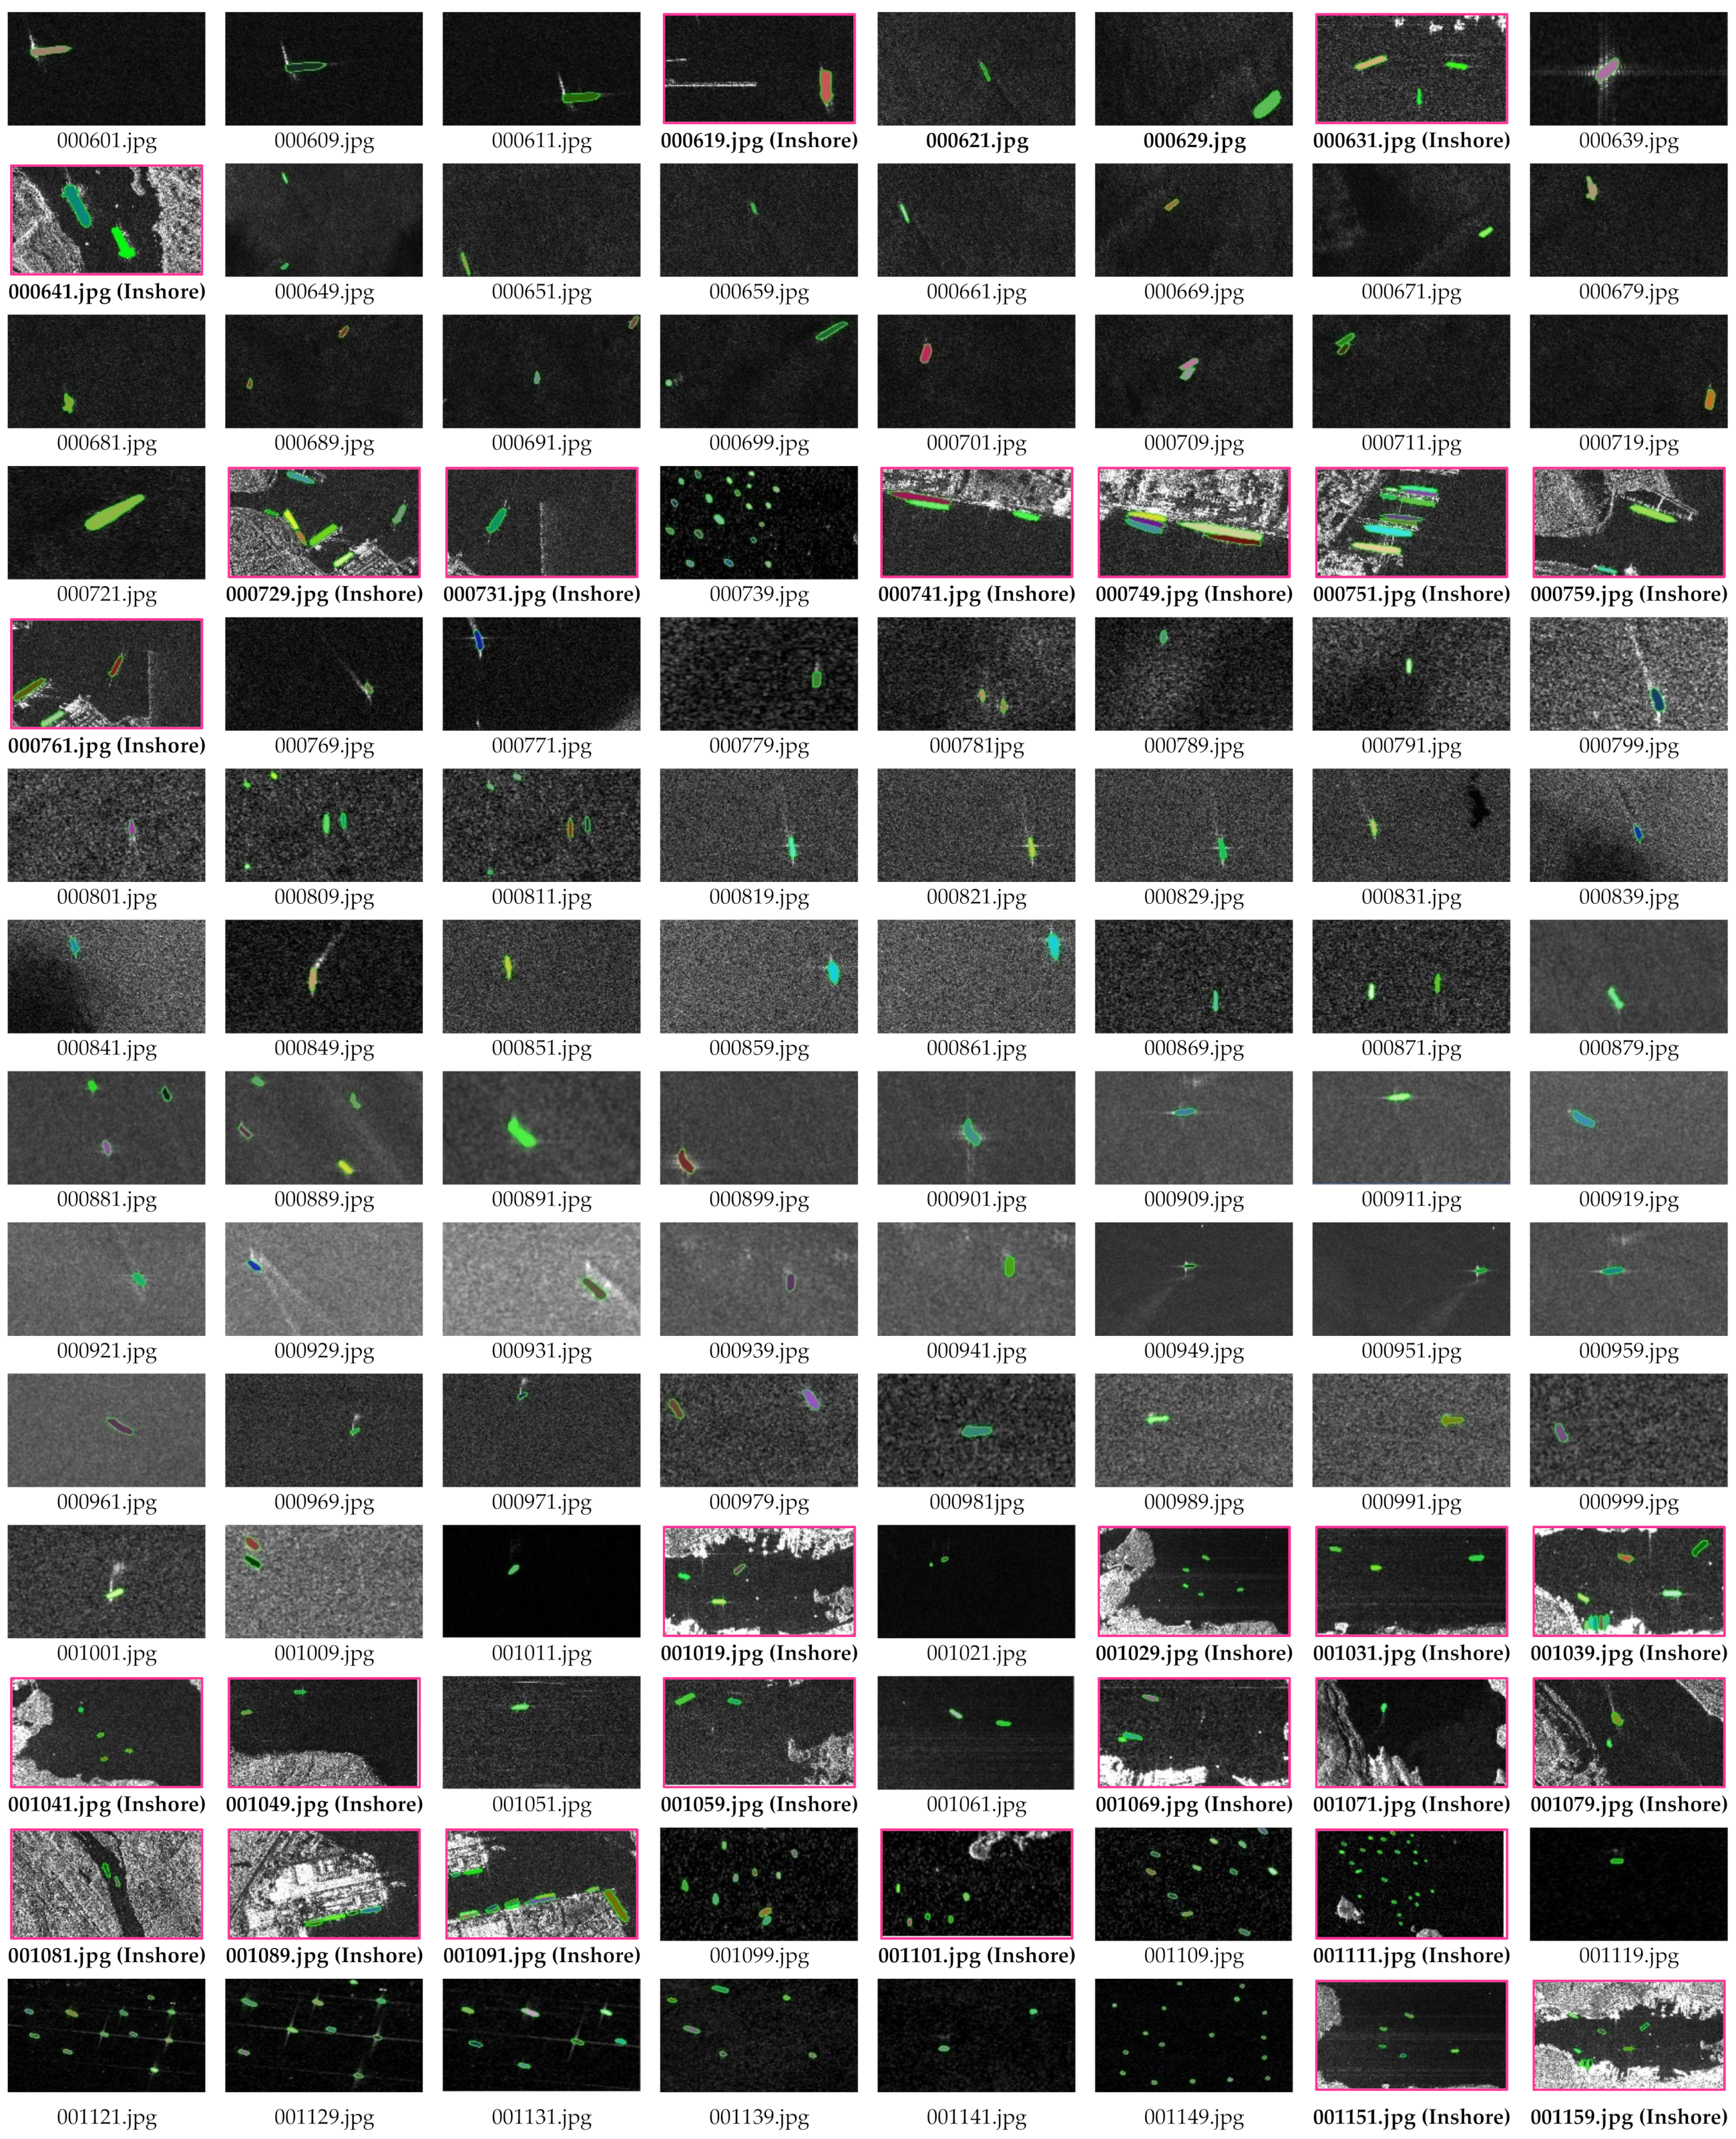
- The SAR image samples in SSDD are various with different resolutions from 1m to 15 m, different sensors from RadarSat-2, TerraSAR-X, and Sentinel-1, different polarizations (HH, VV, VH, and HV), different sea conditions, different ship scenes, including inshore and offshore, and different ship sizes. Data diversity is one of the major issues in building reliable regressive/predictive detection models. See Table 3.
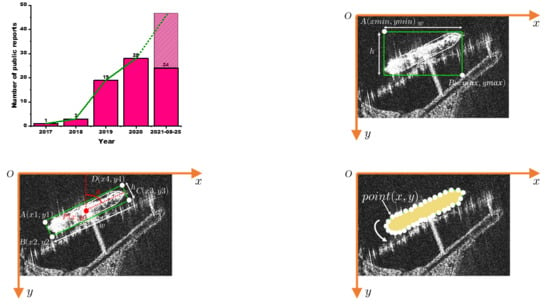
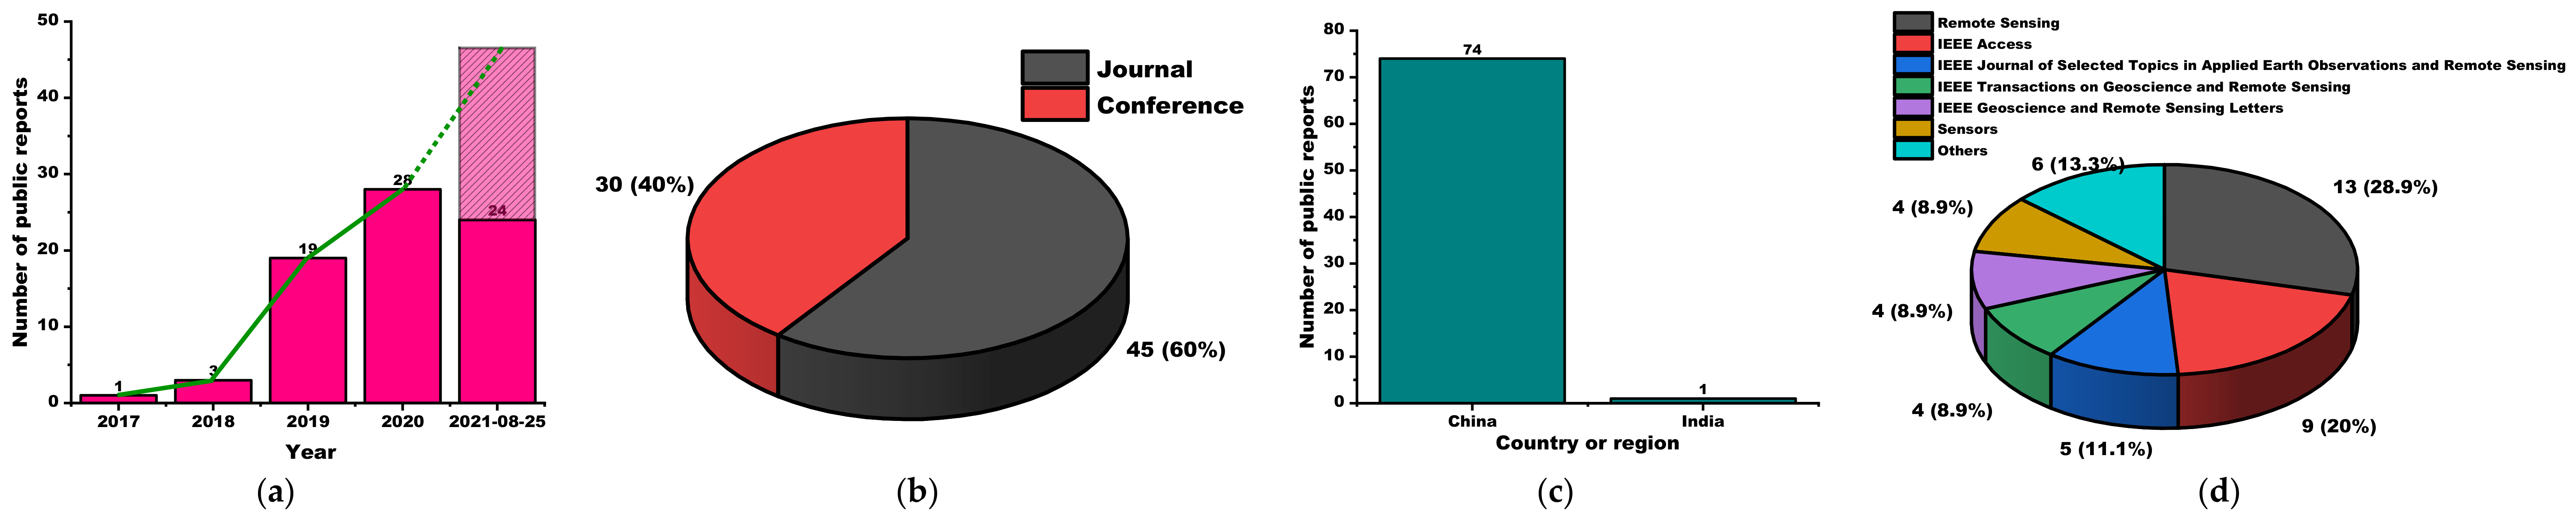
- When several reports using SSDD appeared, follow-up scholars chose to experiment on this SSDD dataset in order to facilitate the comparison of methodologies with previous scholars. As a result, there are gradually increasing public reports using this SSDD dataset.
- In the early stage, the GPU computing power of computers used by most scholars in the SAR remote sensing community was limited. The sample number of SSDD is relatively moderate, i.e., 1160, compared with large-scale datasets in the computer vision community, e.g., ~9000 images in the PASCAL VOC dataset [113] and ~20 w images in the COCO dataset [114]. This reduces the equipment cost of studies. This enables ordinary researchers equipped with general performance GPUs to carry out research and development. This point enables the community, using the SSDD dataset to study DL-based SAR ship detection, to become rather active. As a result, the increase of researchers may greatly lead to the increase of research results. Moreover, a relatively moderate sample number also facilitates the debugging of models, improving work efficiency, rather than a long time of training waiting. Of course, when using the SSDD dataset, some few-shot strategies, e.g., data augmentation and transfer learning, should be considered so as to avoid overfitting.
- There are typical hard-detected samples in SSDD. These samples all need special consideration in the practical application of SAR ship detection, e.g., (1) small ships with inconspicuous features, (2) densely parallel ships berthing at ports with overlapping ship hulls, (3) large scale-difference ships, (4) ship detection under severe speckle noise, (5) ship detection under complex, and (6) multiple types of sea clutters. Ship detection in these difficult samples is a research hotspot, regardless of traditional hand-crafted methods or modern DL-based methods. Therefore, SSDD can provide a possible data source to study these focus issues.
1.4. Motivations of This Review
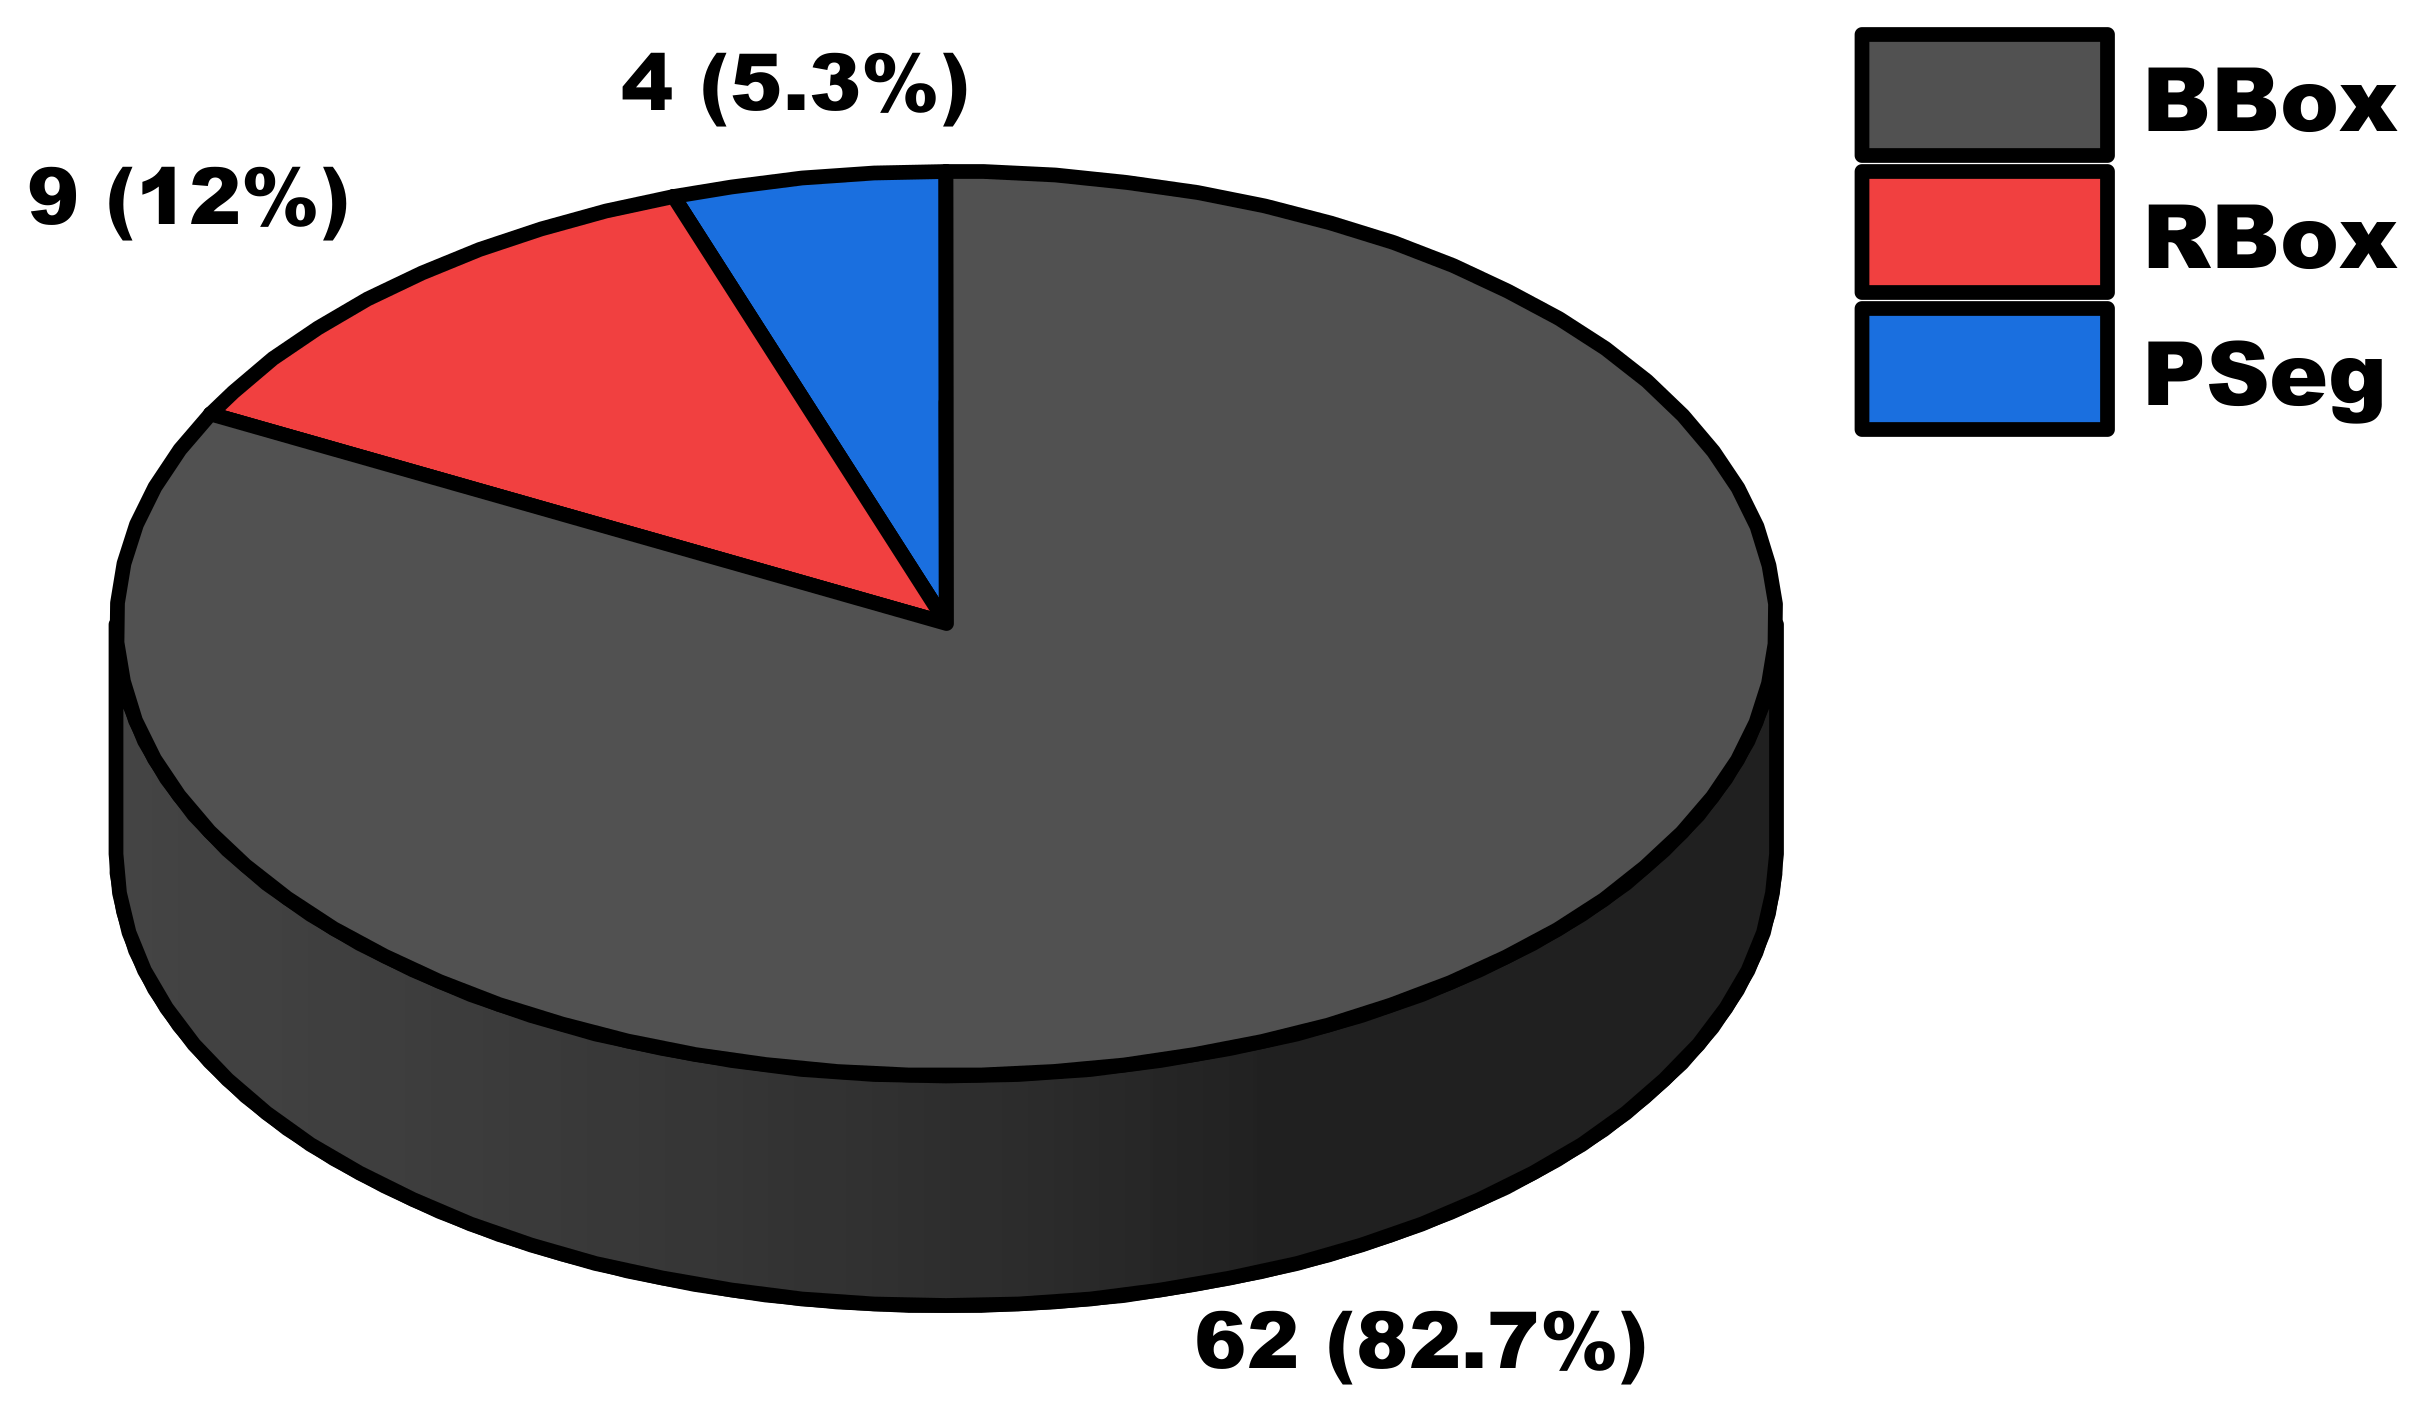
- The official version of SSDD is released, including three types: BBox-SSDD, RBox-SSDD, and PSeg-SSDD. It will be convenient for future scholars to use according to different task requirements.
- A comprehensive data analysis on BBox-SSDD, RBox-SSDD, and PSeg-SSDD is conducted. It can provide some valuable suggestions for possible future scholars to further design DL-based SAR ship detectors with higher accuracy and stronger robustness when using SSDD.
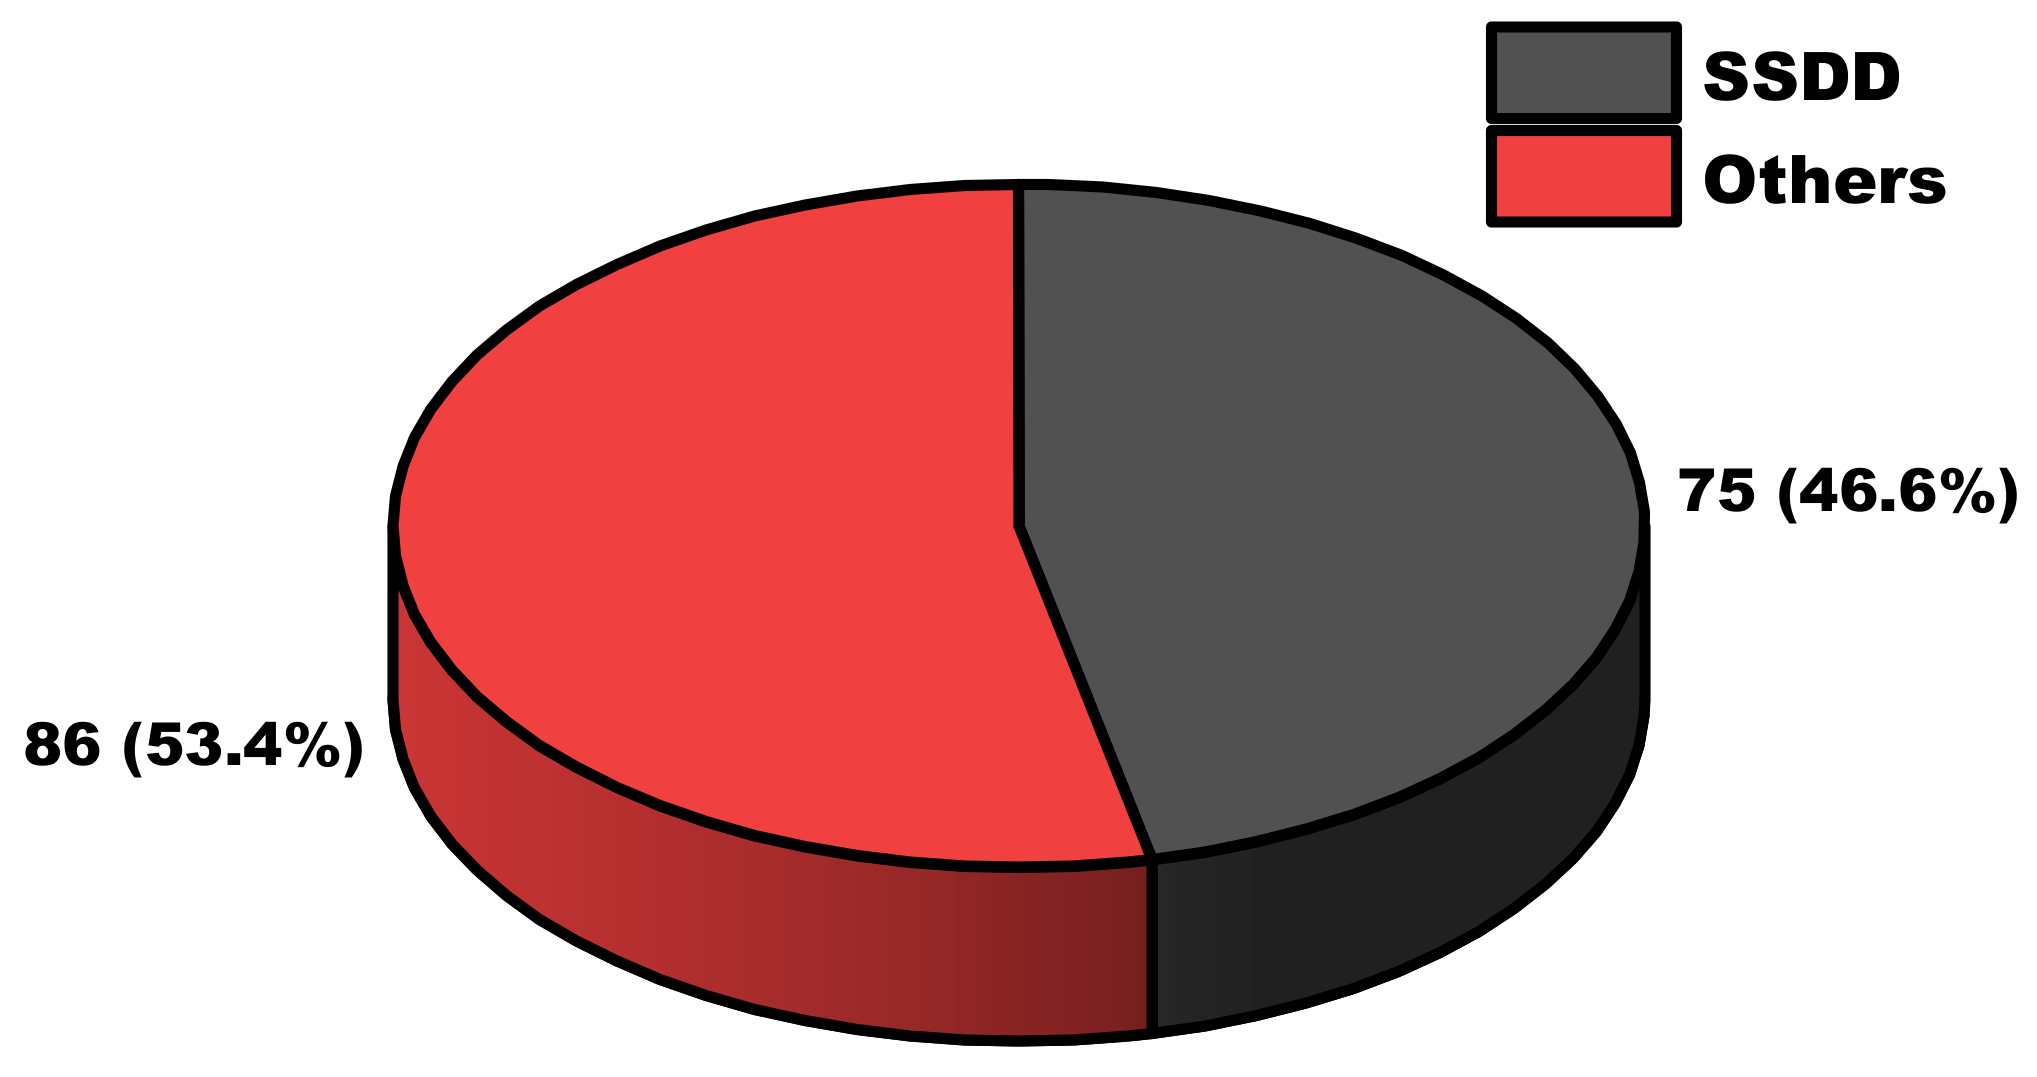
- Some more reasonable and stricter using standards are formulated objectively based on the using differences of existing 75 (161 × 46.59%) public reports. We also provide some potential solutions to improve the detection performance of difficult-detected ship samples.
2. Summary of Public Reports Using SSDD
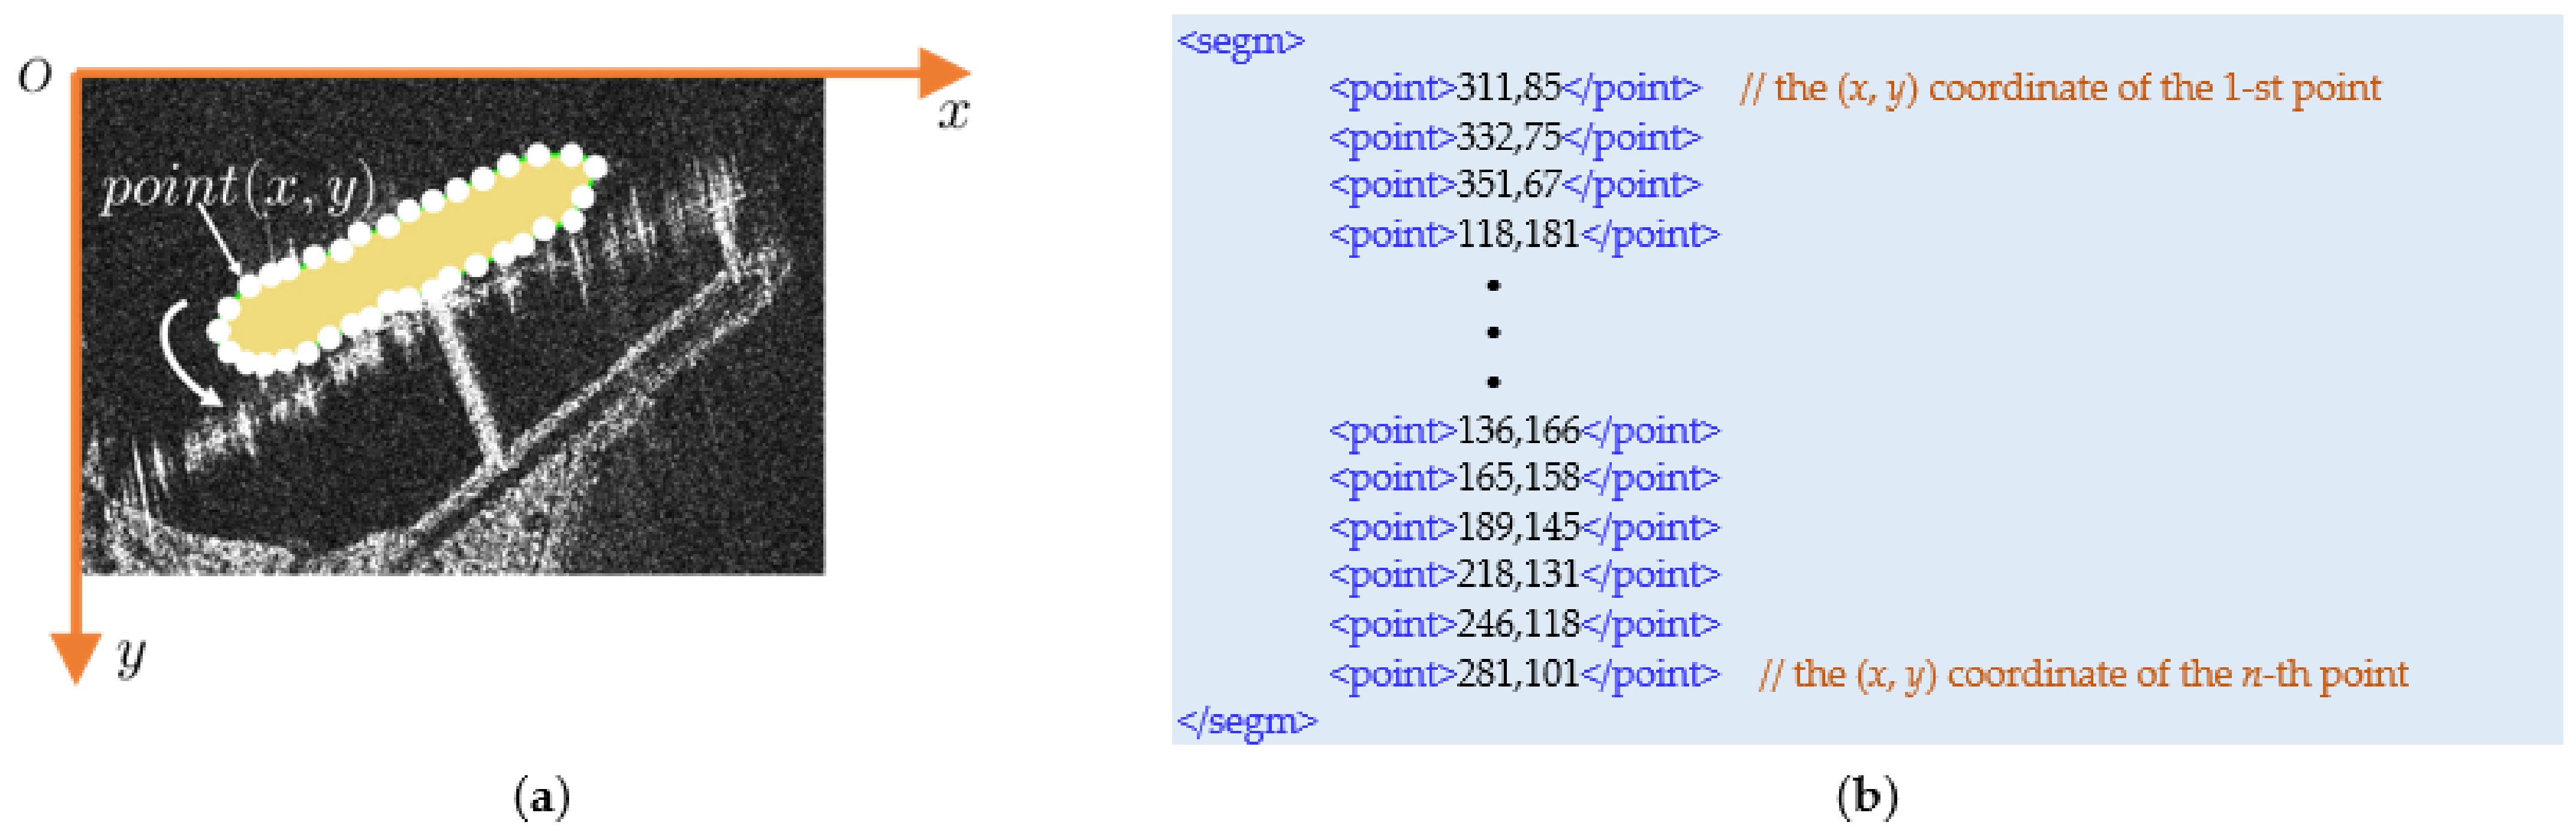
3. SSDD
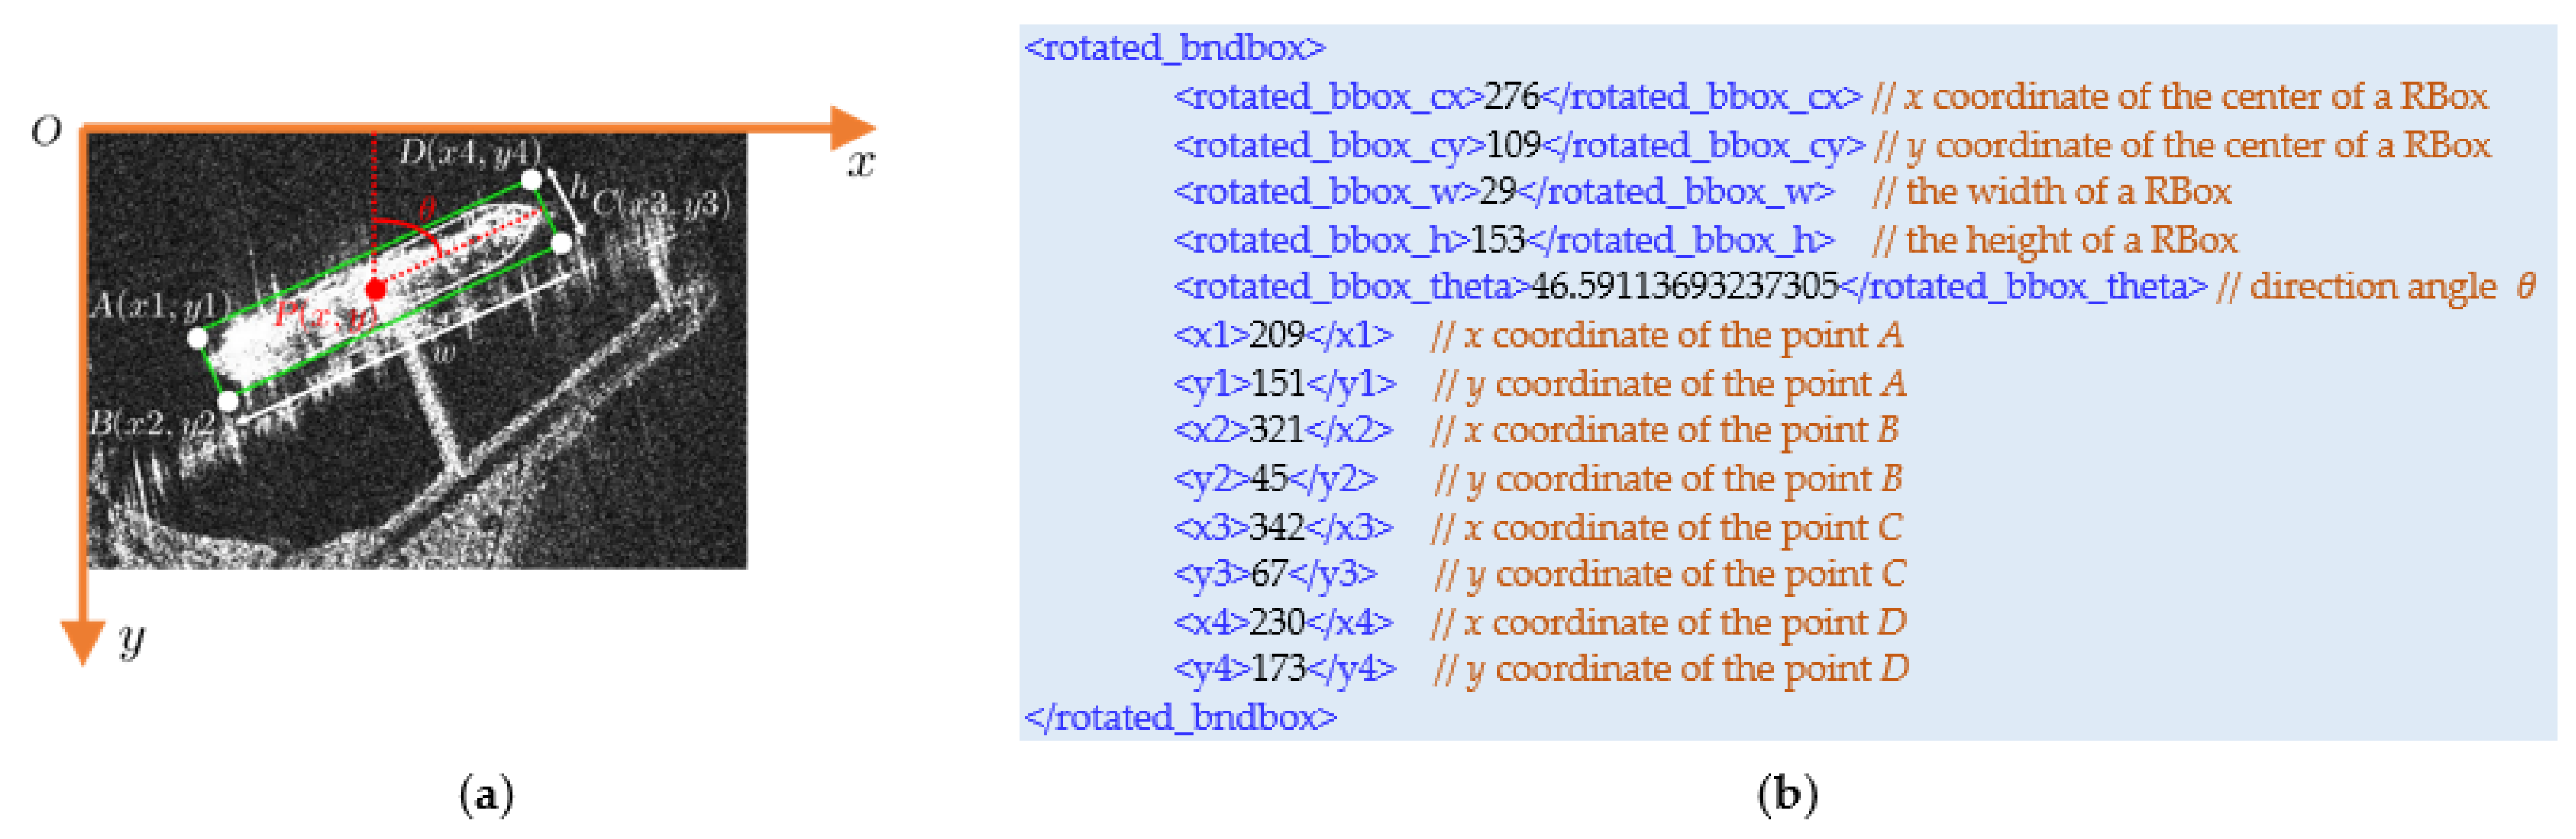
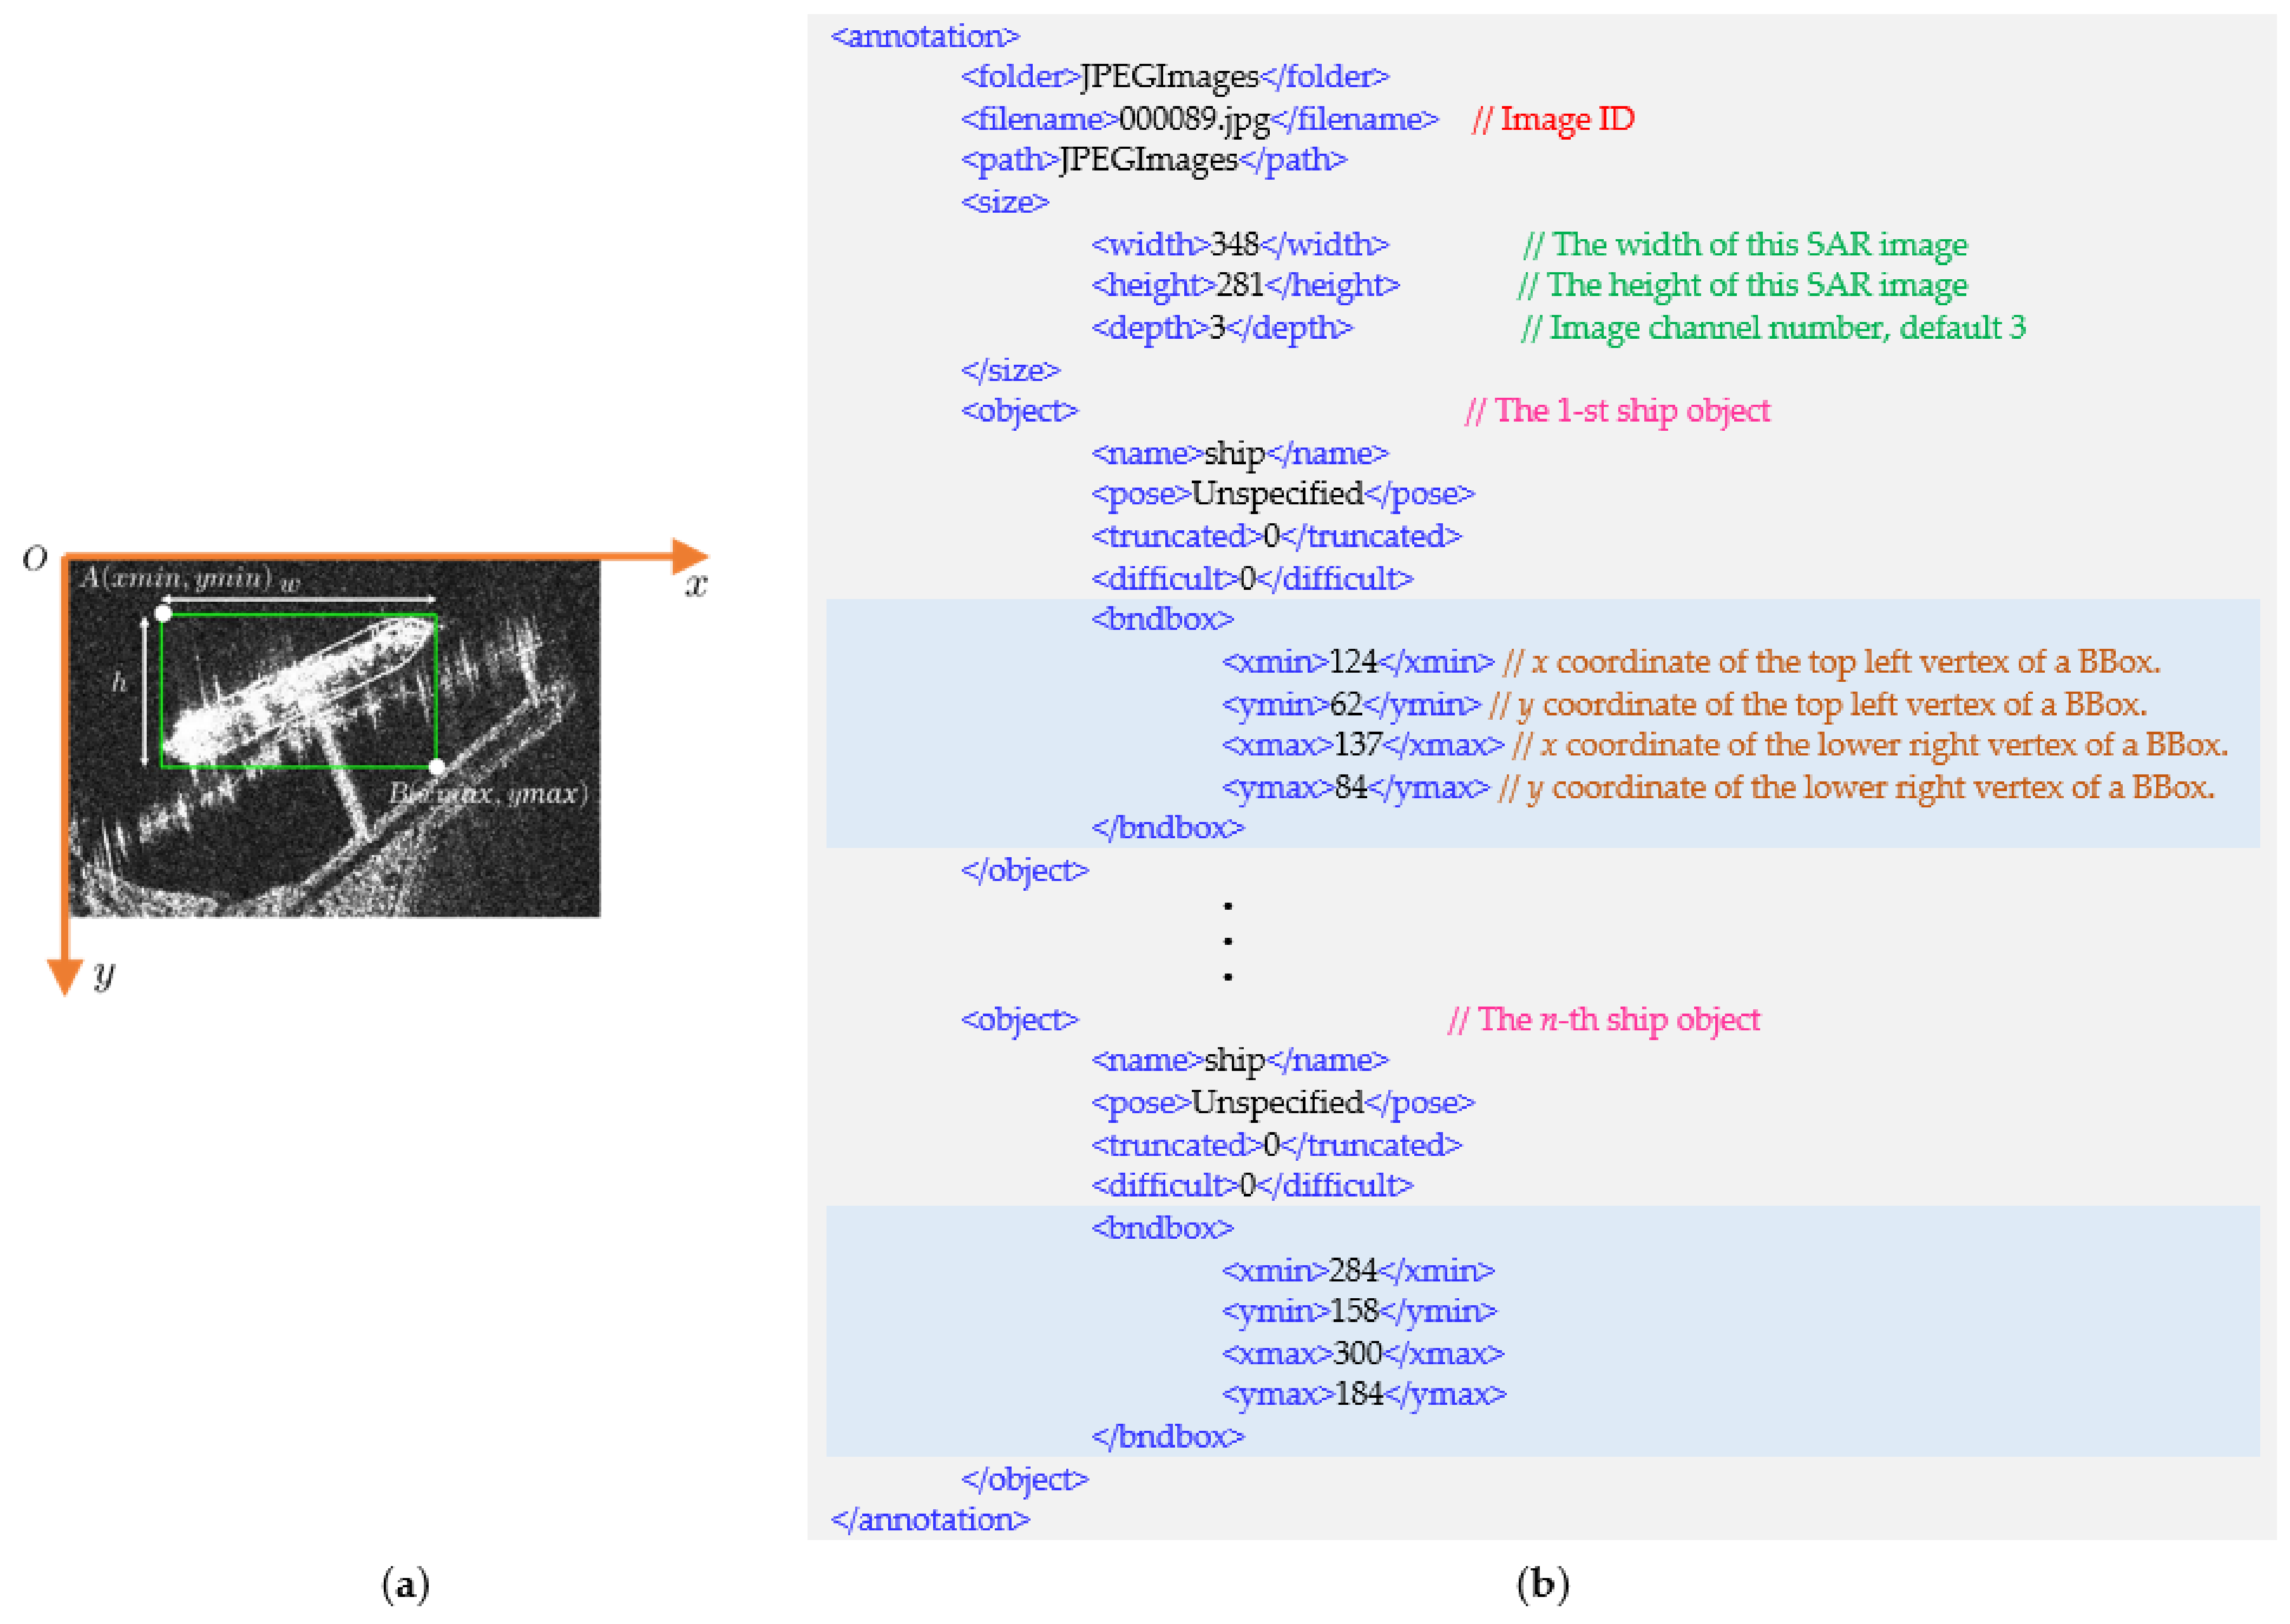
3.1. BBox-SSDD
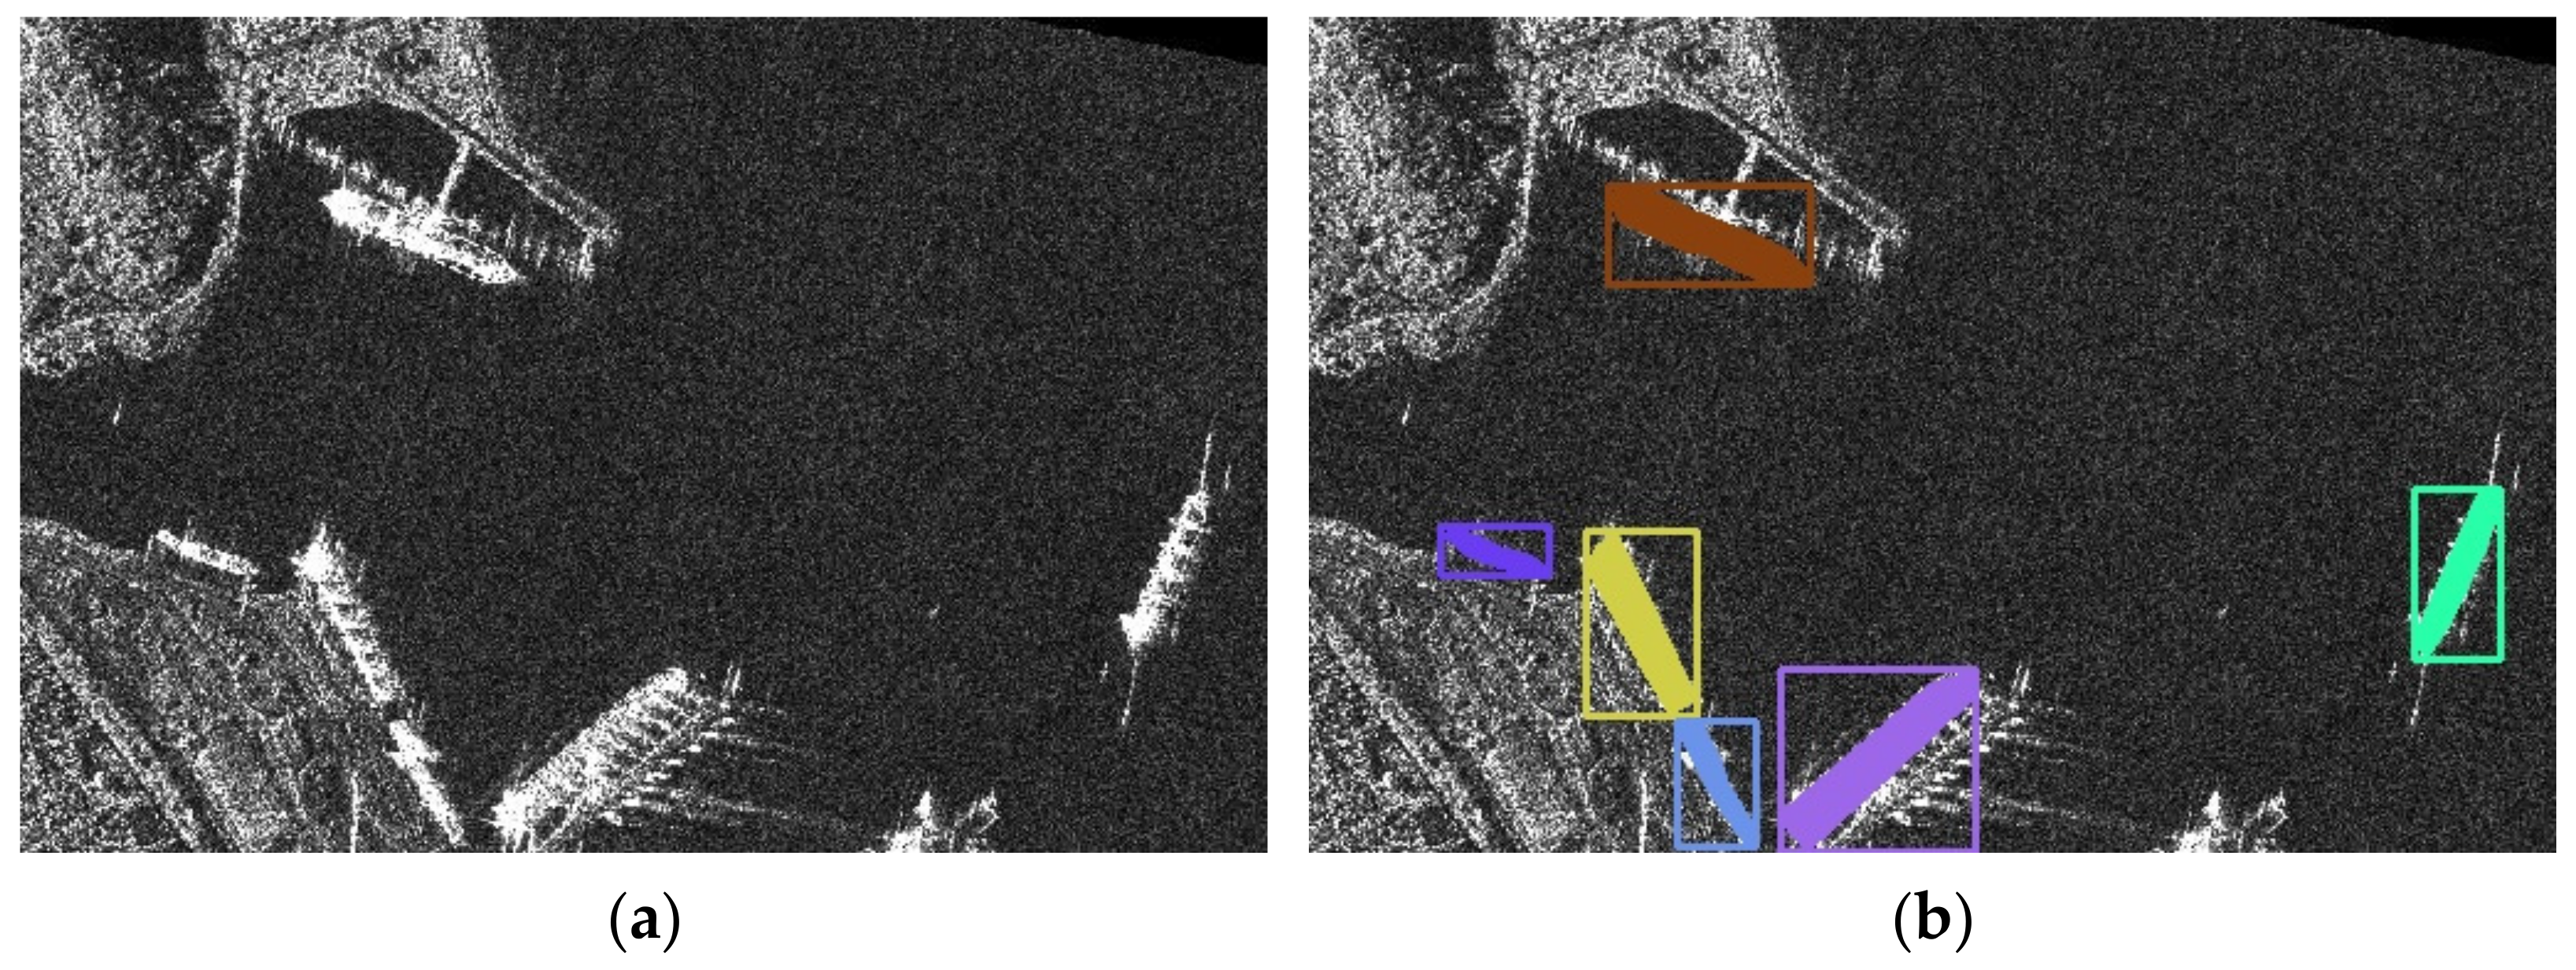
3.2. RBox-SSDD
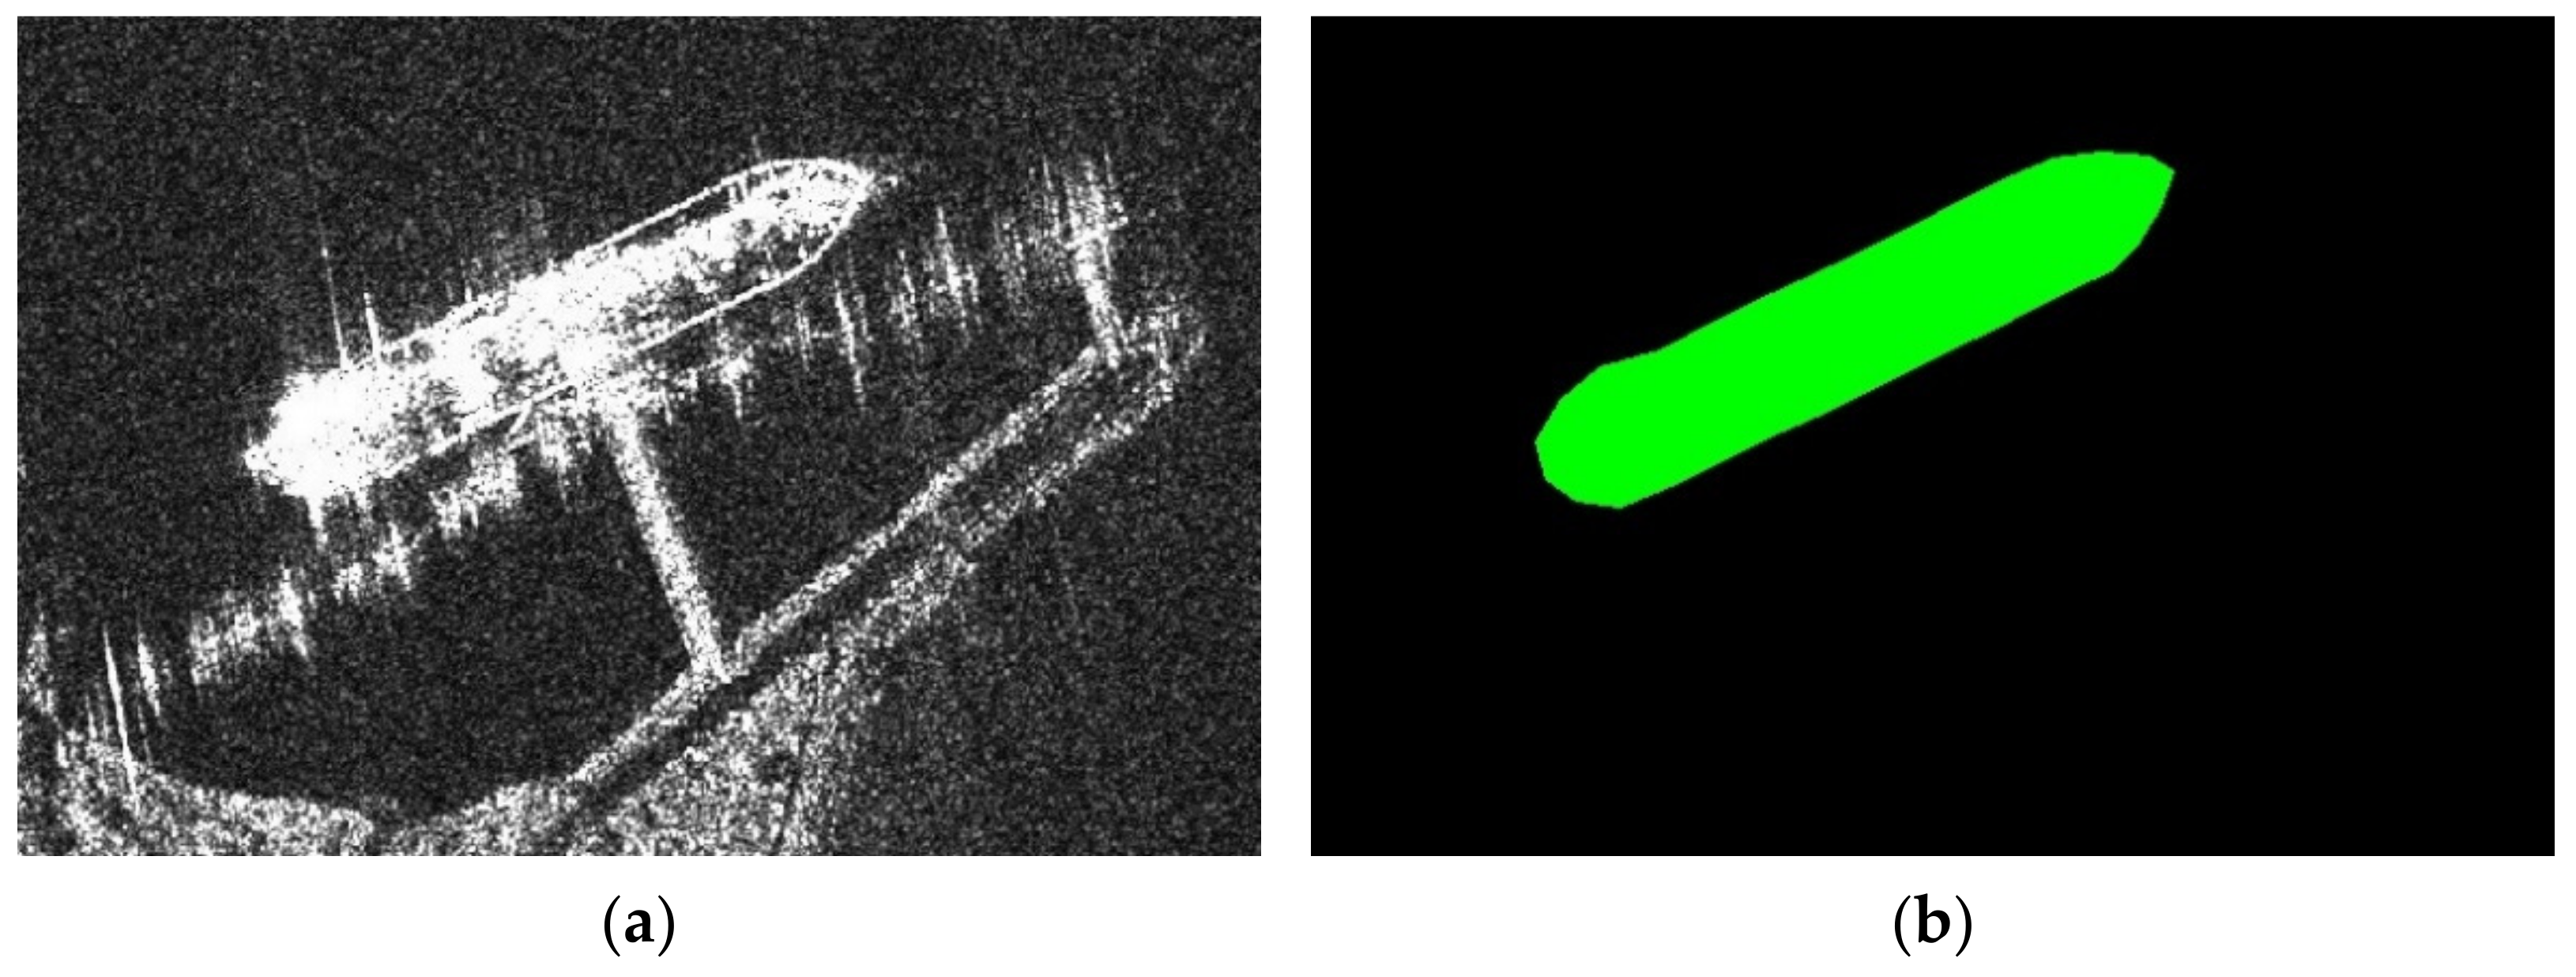
3.3. PSeg-SSDD
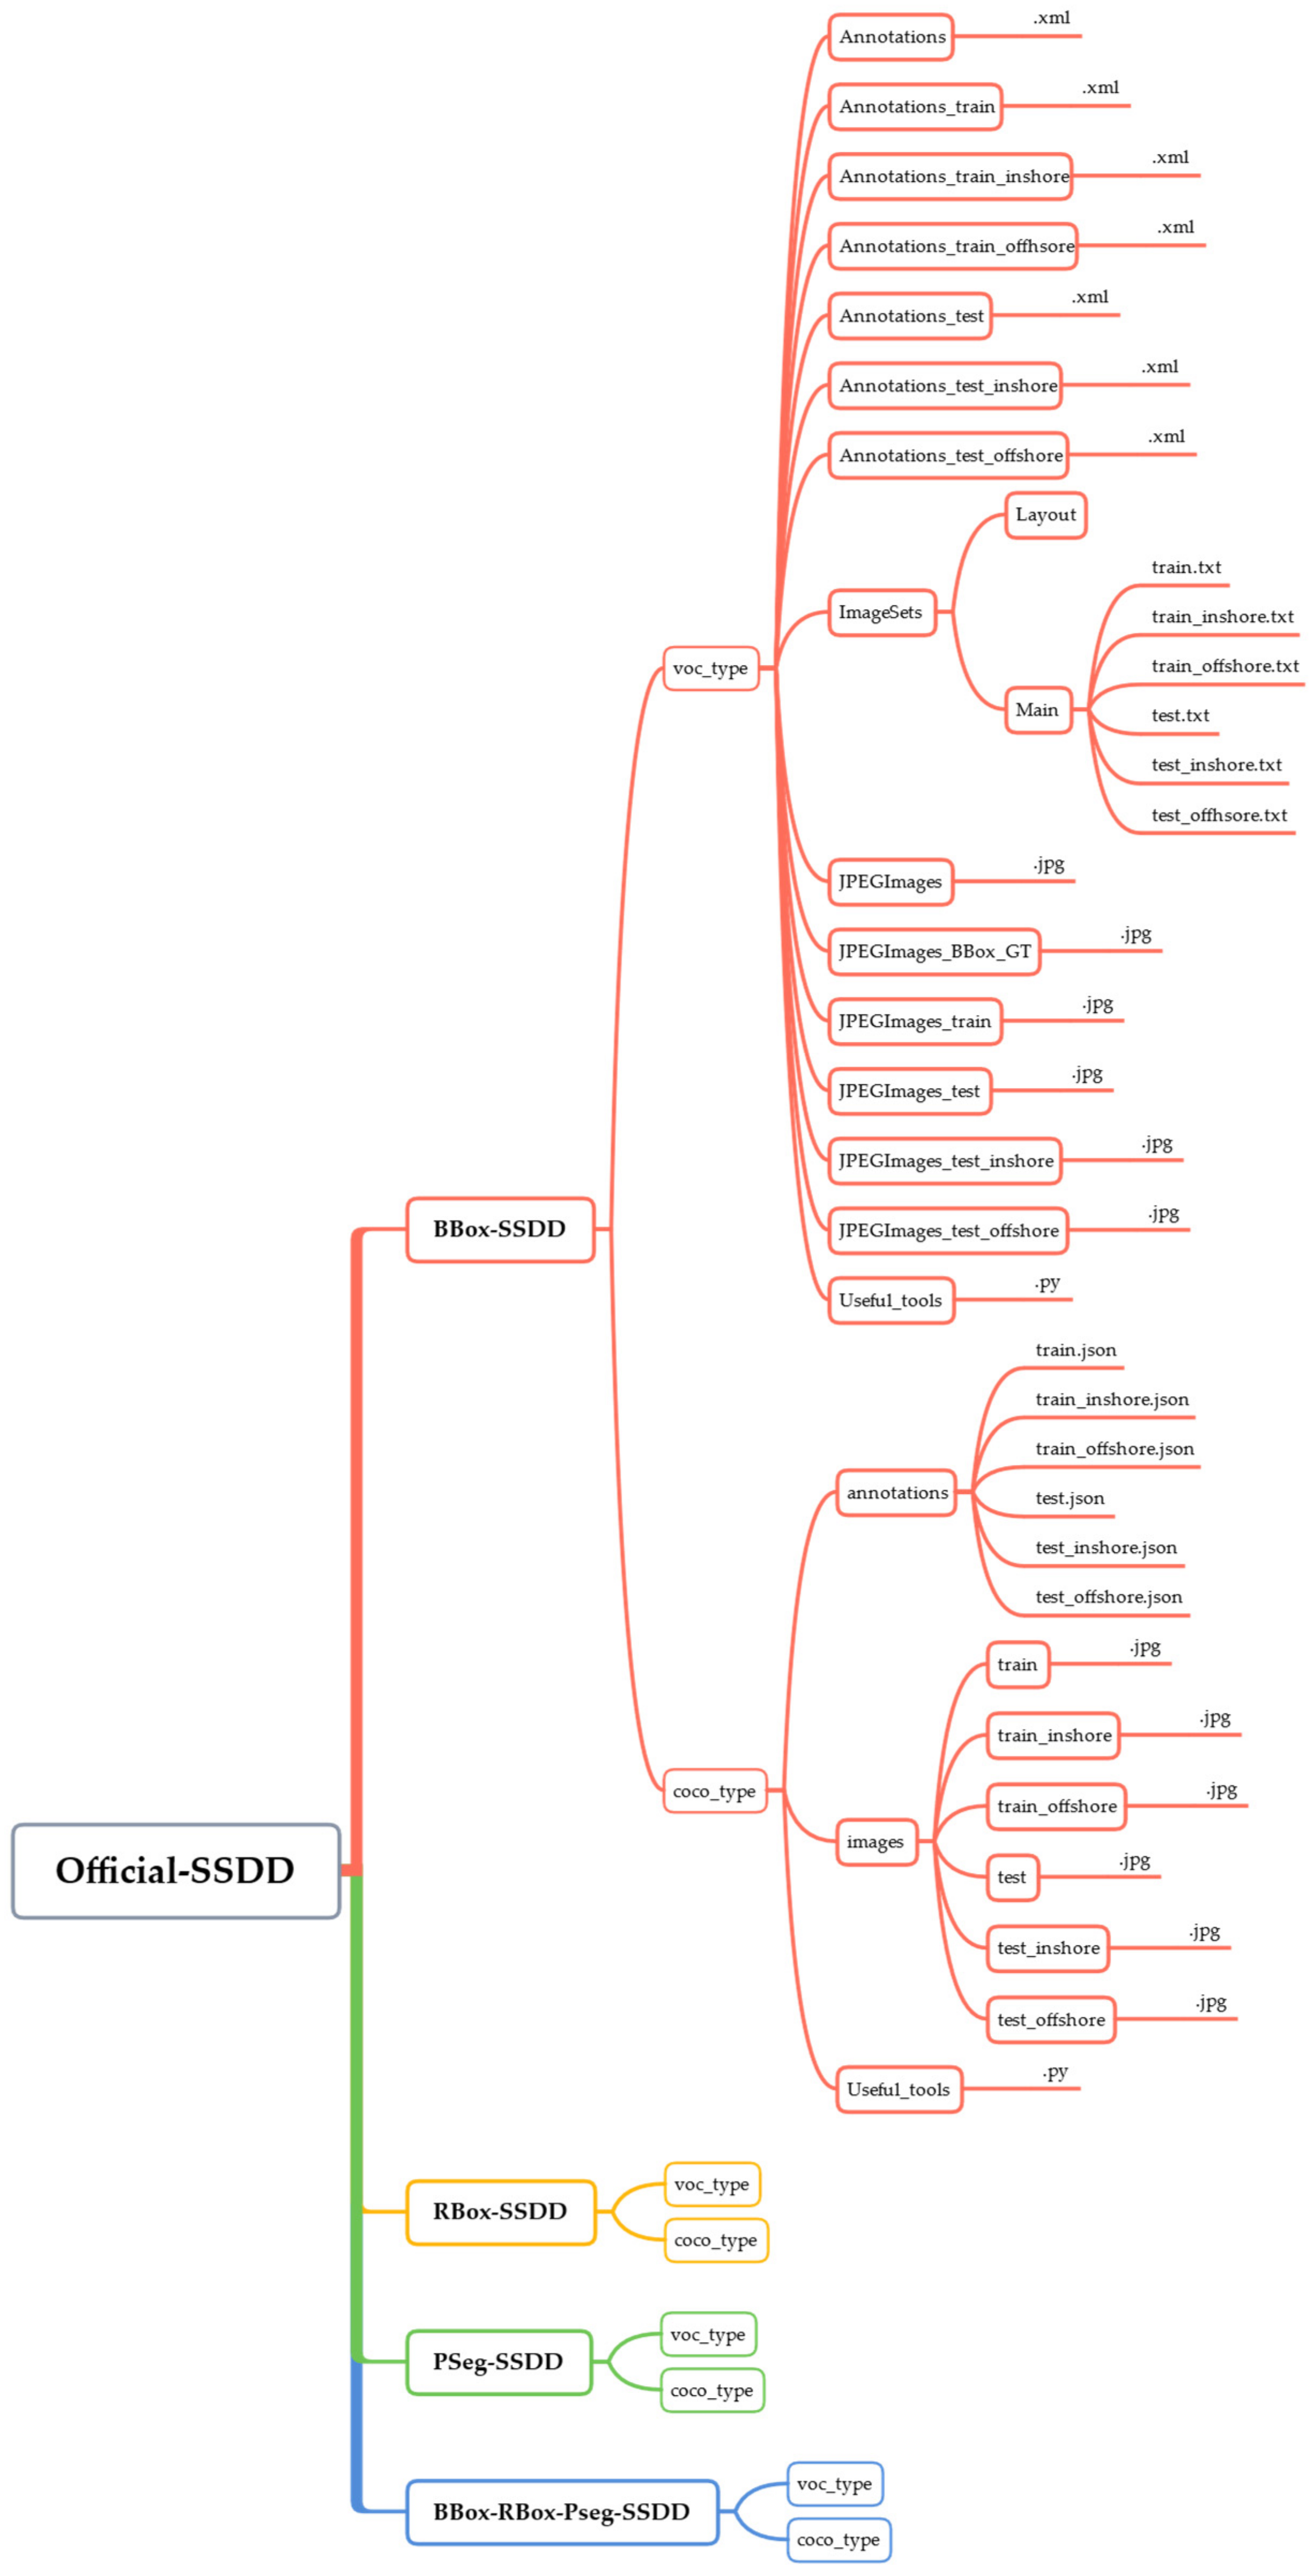
4. Data Directory
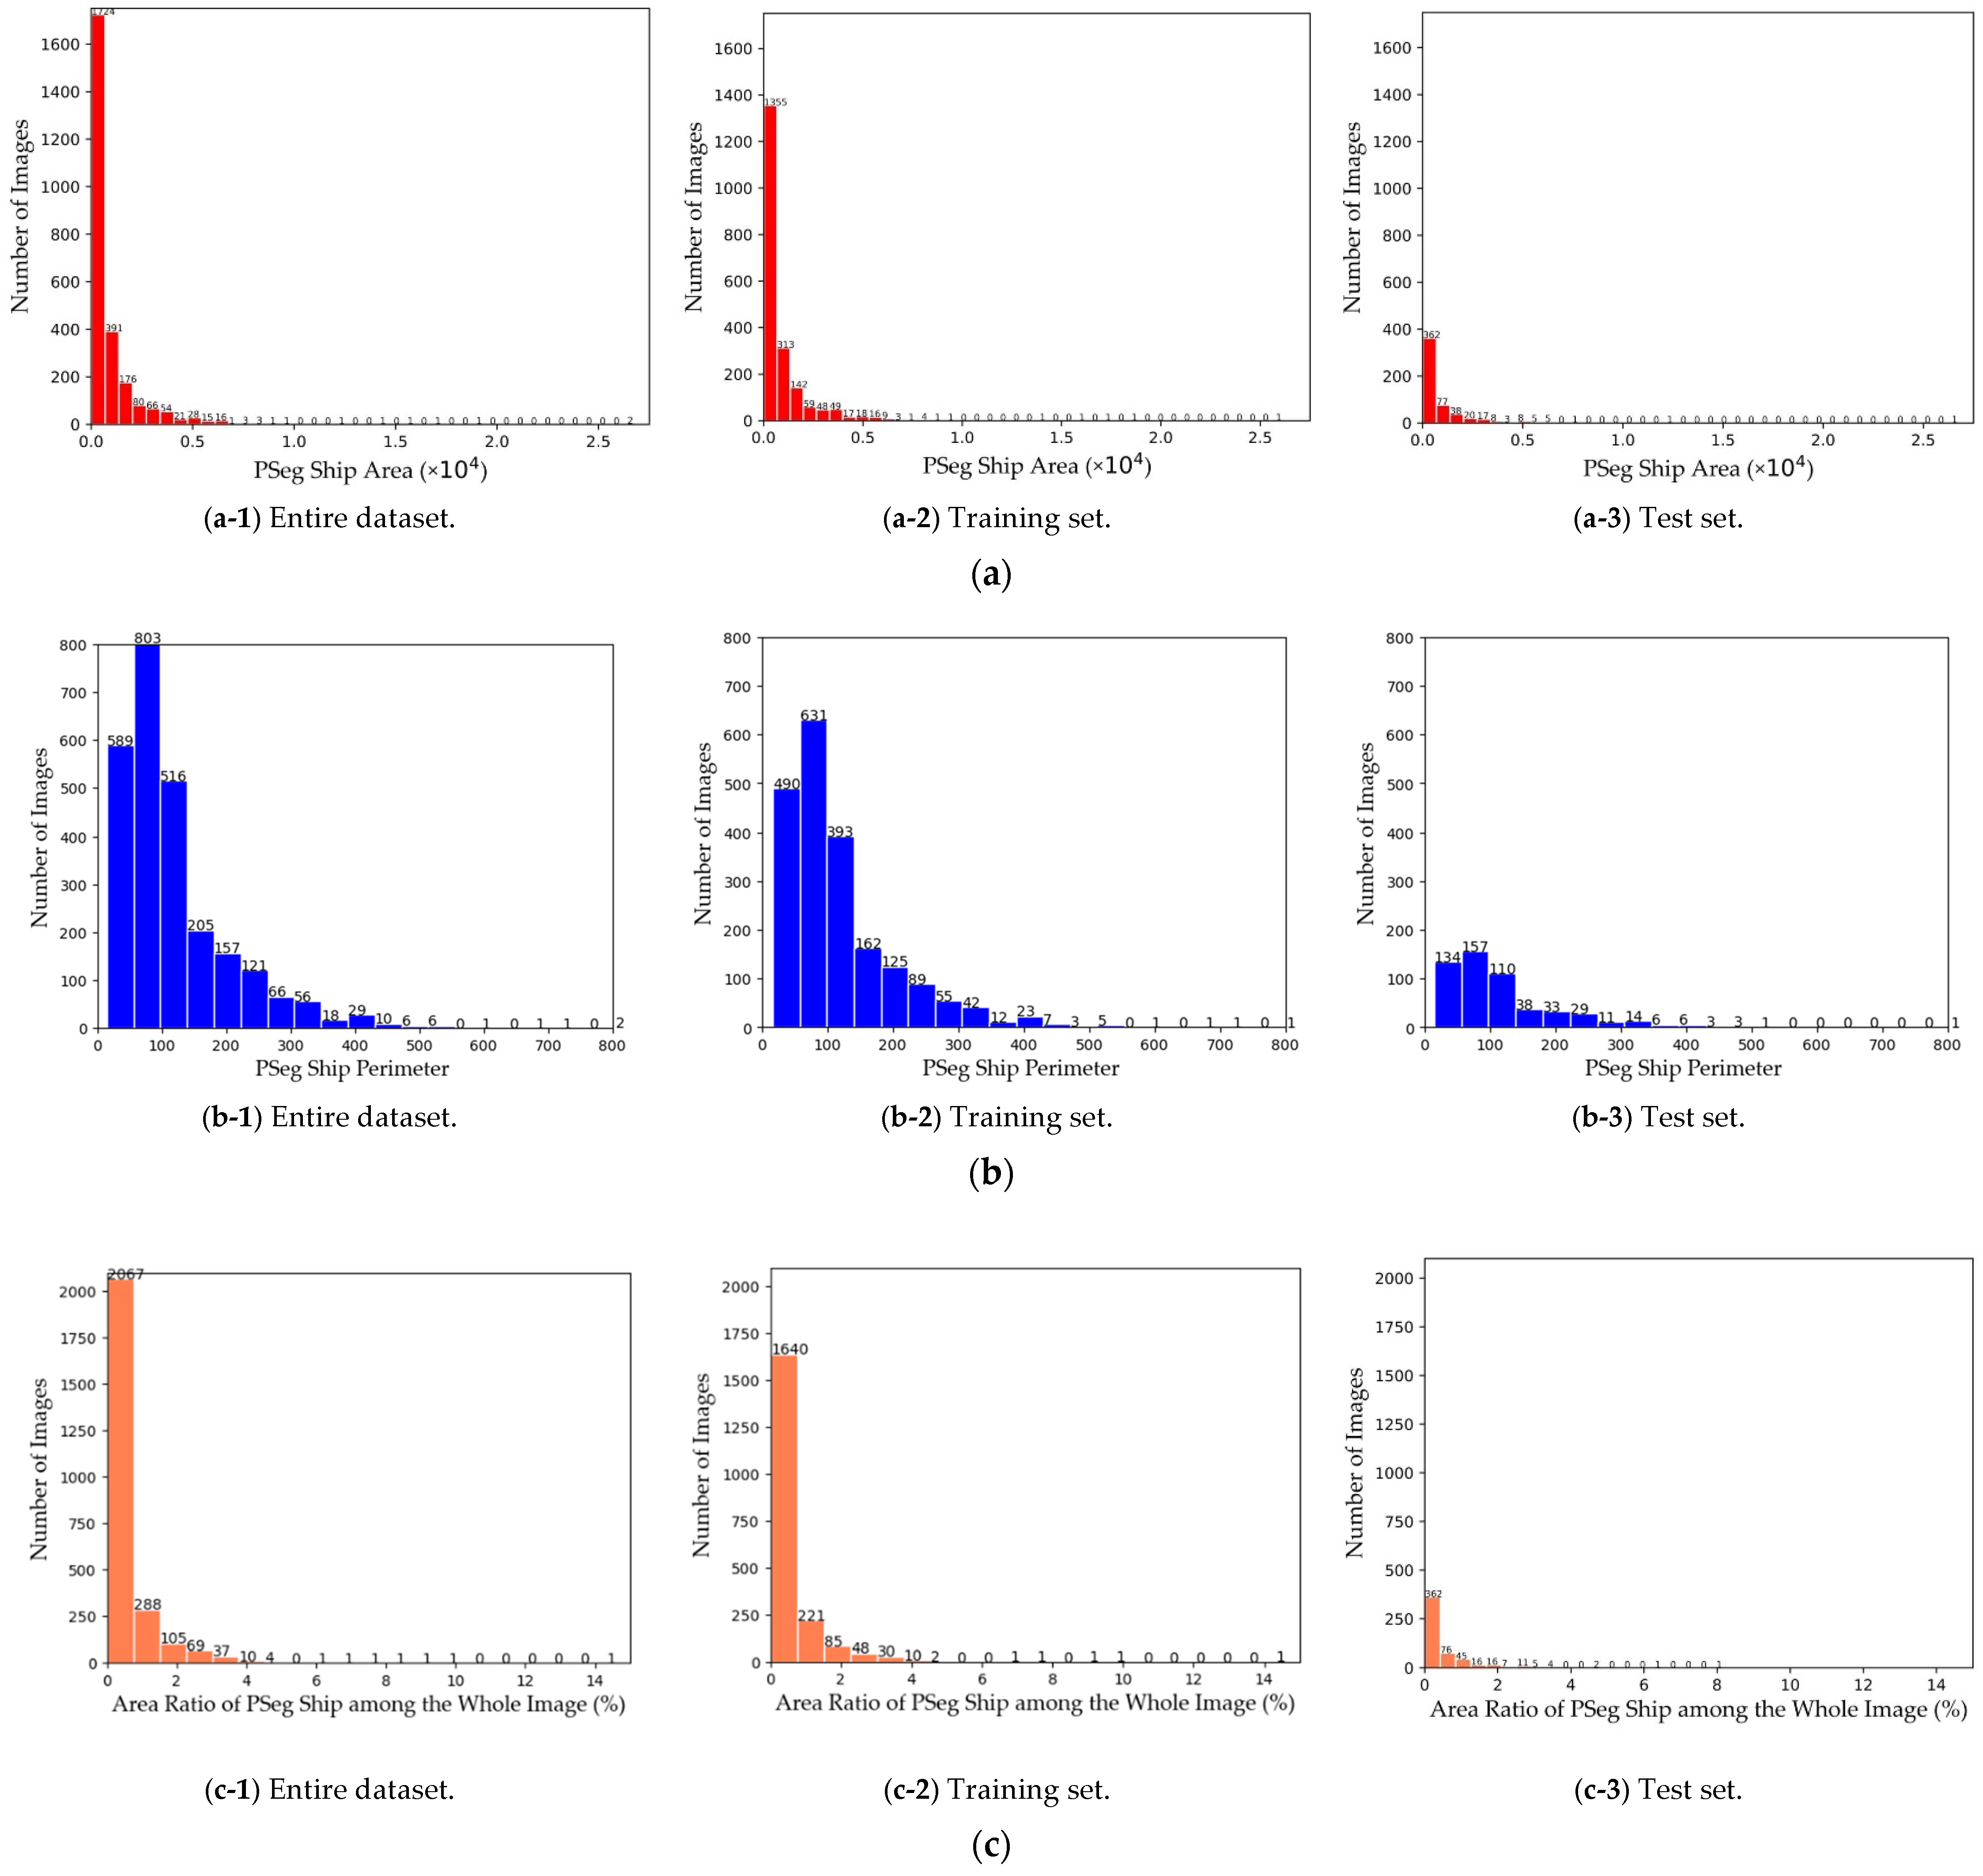
5. Data Analysis
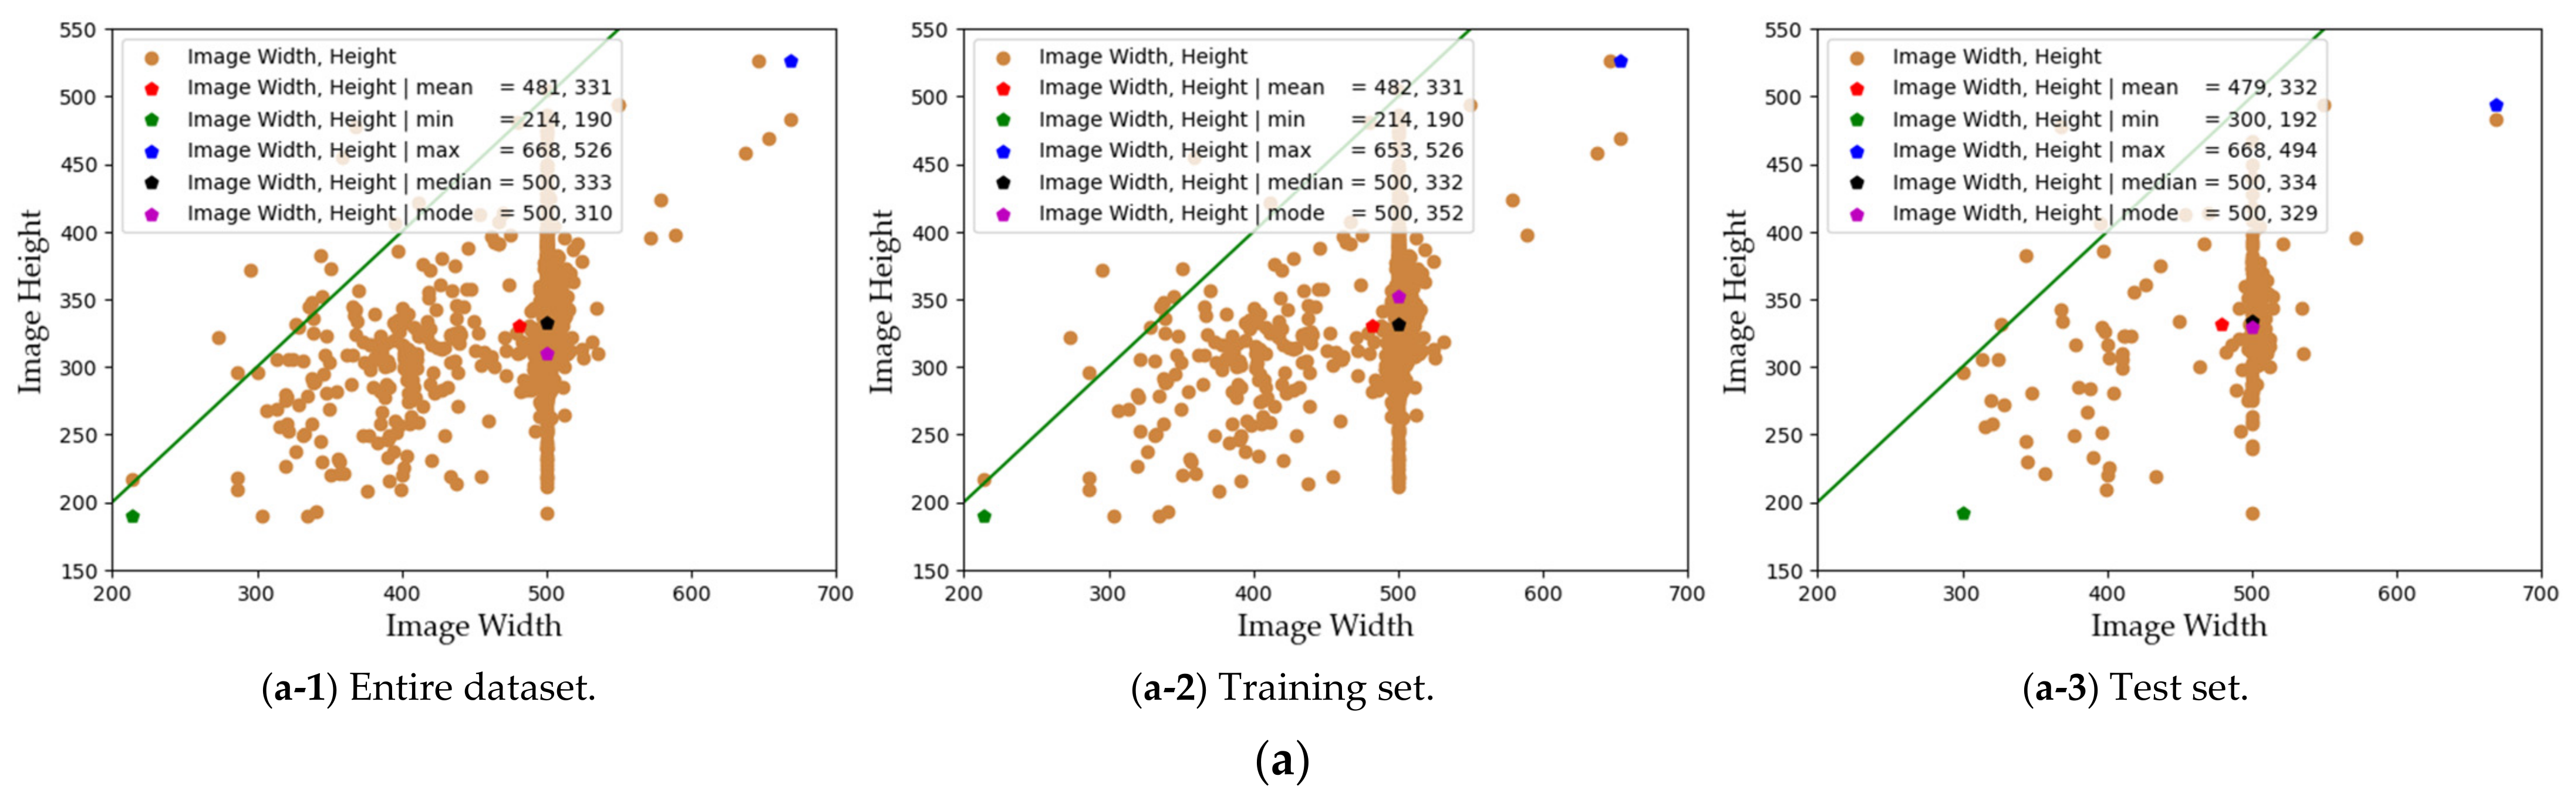
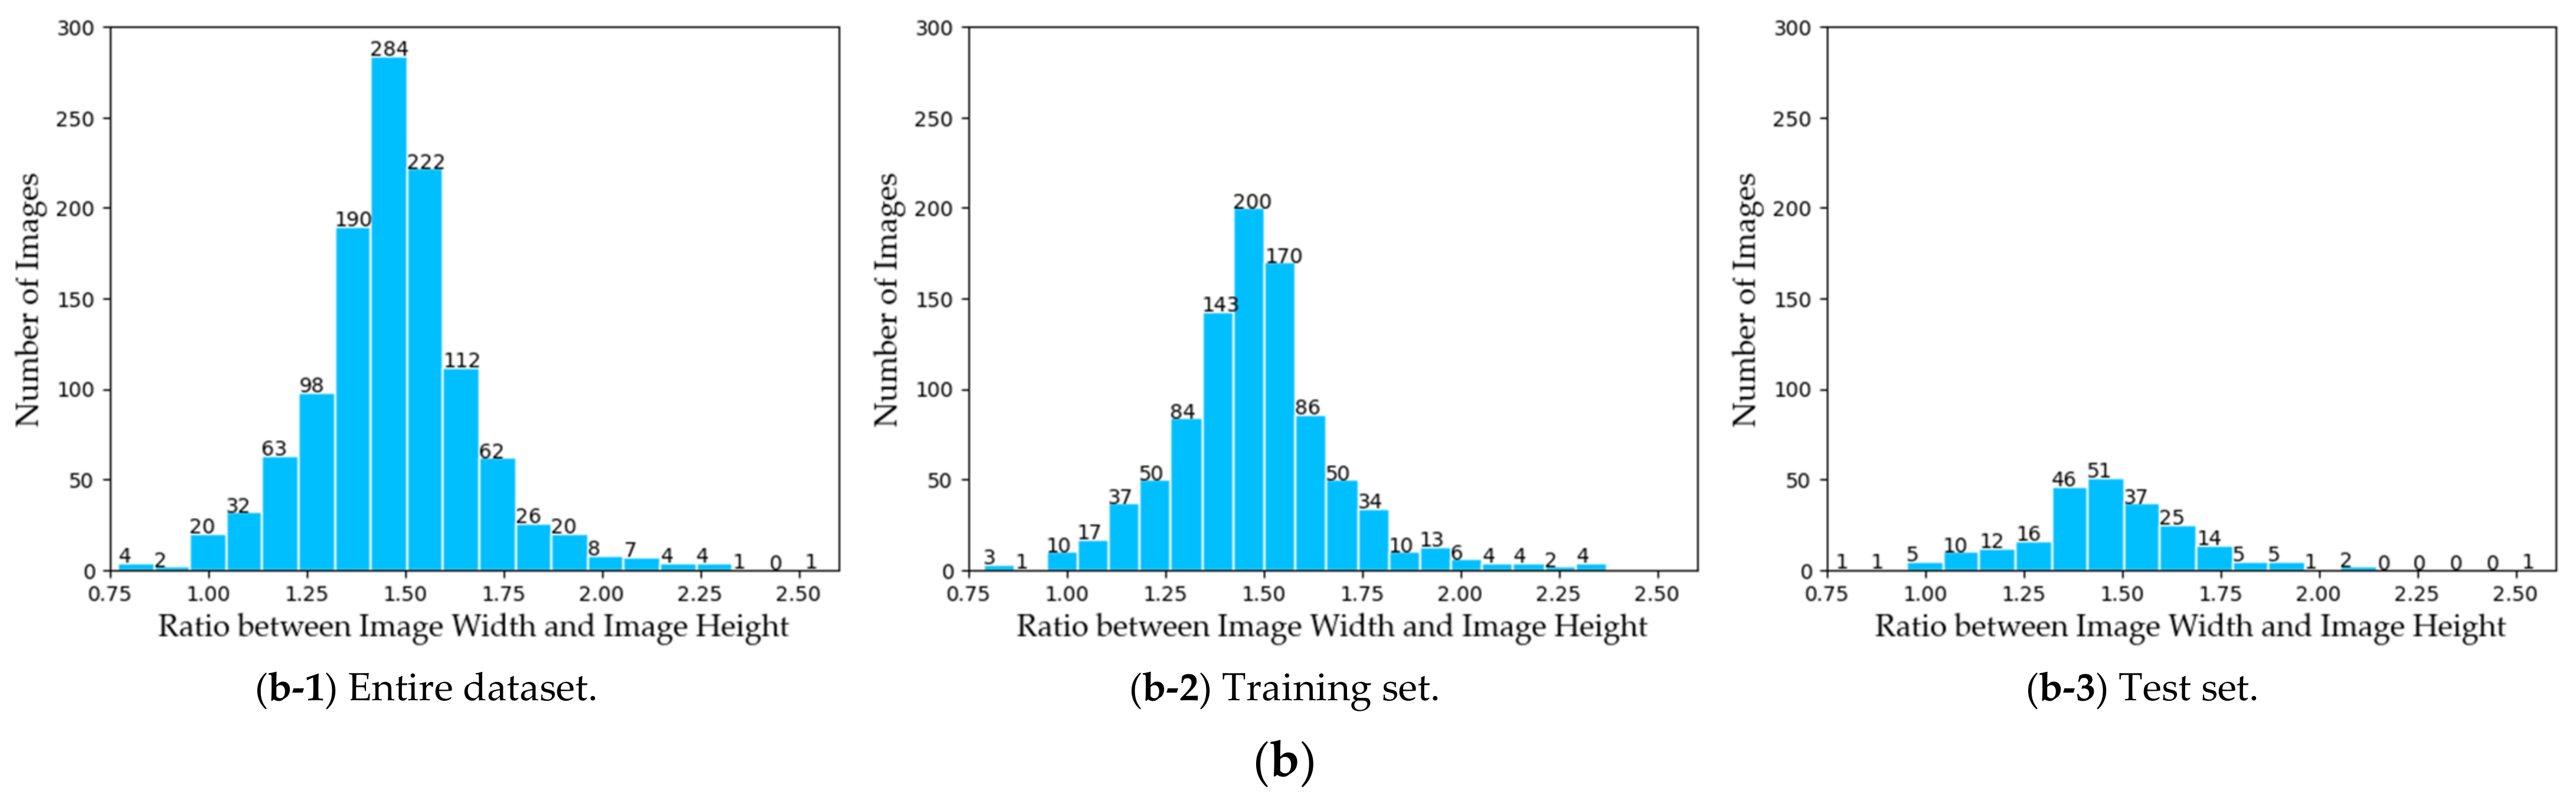
- The sample sizes in the SSDD dataset are quite different. Taking the entire dataset as an example, the smallest width is 214 pixels, while the largest one is 668 pixels. Their difference has tripled. The smallest height is 160 pixels, while the largest one is 526 pixels. Their difference has tripled too.
- The widths of images are widely larger than the heights from the green lines. Therefore, we hold the view that it may be unreasonable to directly stretch the height of the image to its width size. Otherwise, the aspect ratio of the original ship in the SAR image must change, which is a typical violation of the SAR imaging mechanism.
- Many samples share the same 500-pixel width, i.e., a strong cluster width = 500, but they do not share the same height. Their heights range from ~200-pixel to ~500-pixel. It is noteworthy that the mean, median, and mode values are all located at width = 500.
- The ratio between the image width and height reflects a normal distribution. The ratio with the highest frequency was ~1.4. Therefore, we hold the view that it is better to maintain this ratio during image pre-processing because this can minimize the information loss caused by pre-processing.
- The aspect ratio of images has an extreme tailing effect at both ends of the histogram. Therefore, scholars can consider clipping the image with an extremely differentiated aspect ratio so as to realize the normalization of network input. In fact, this practice can also serve as data enhancement.
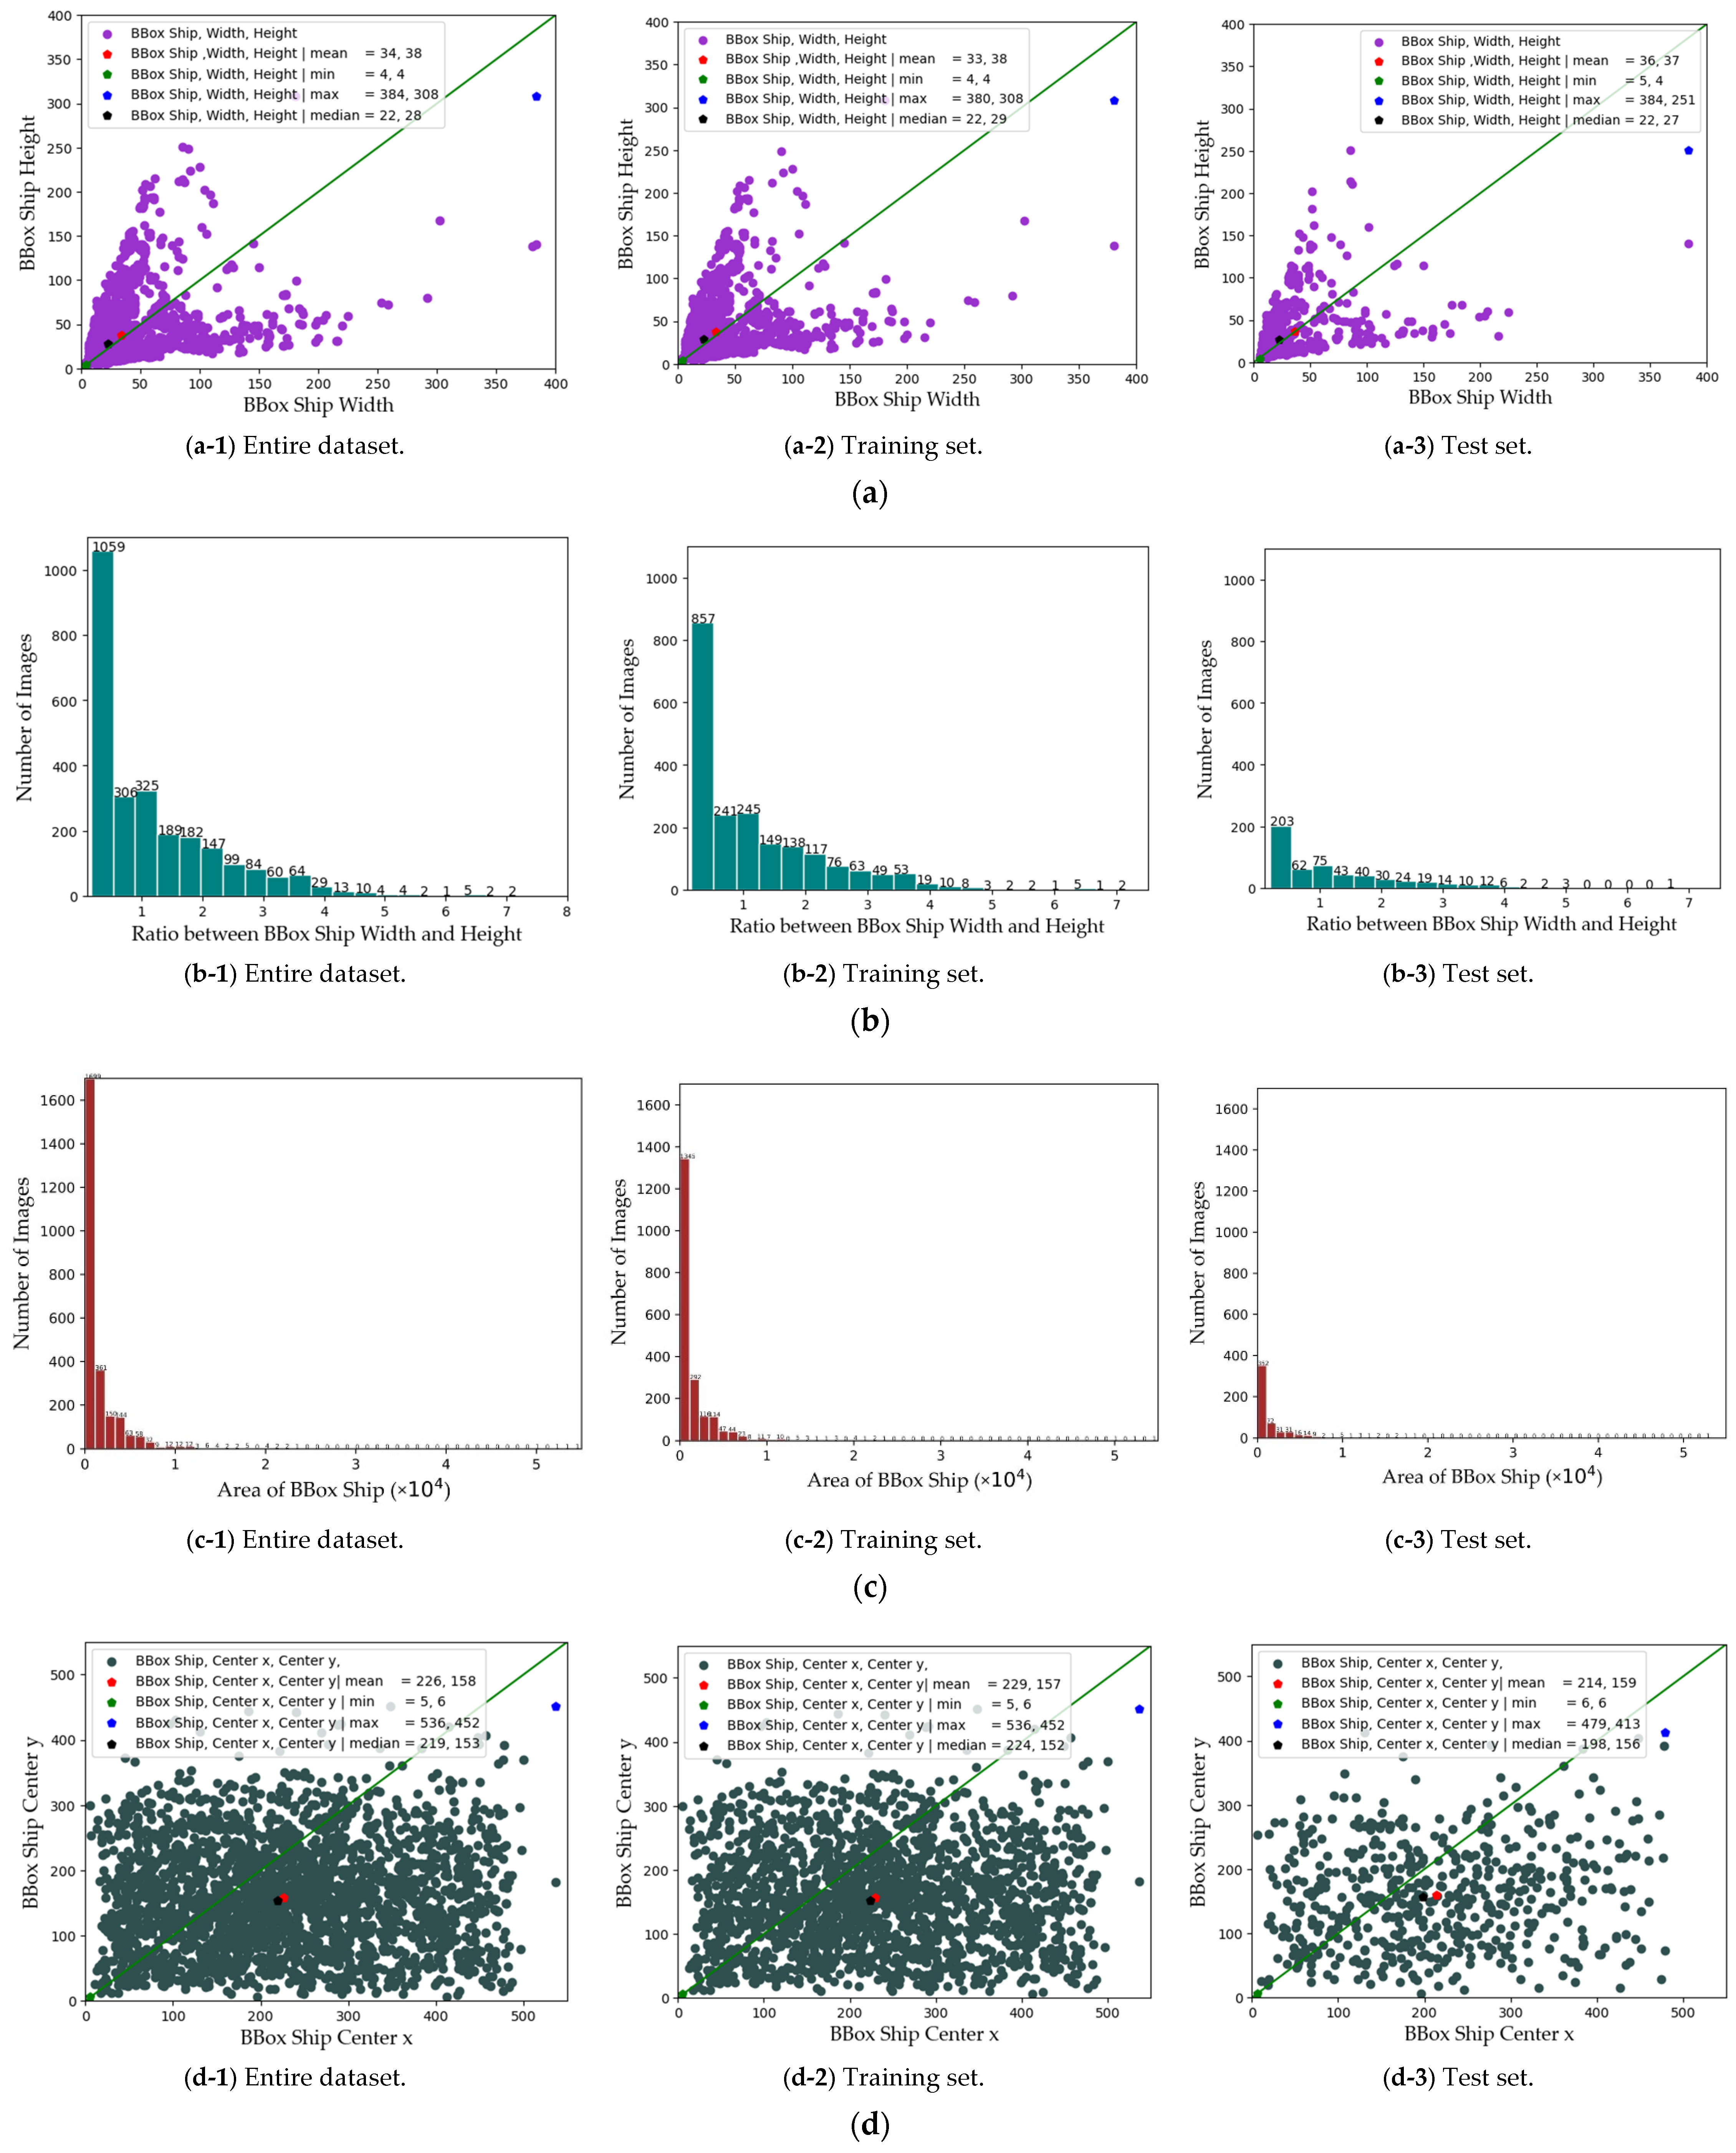
5.1. Data Analysis on BBox-SSDD
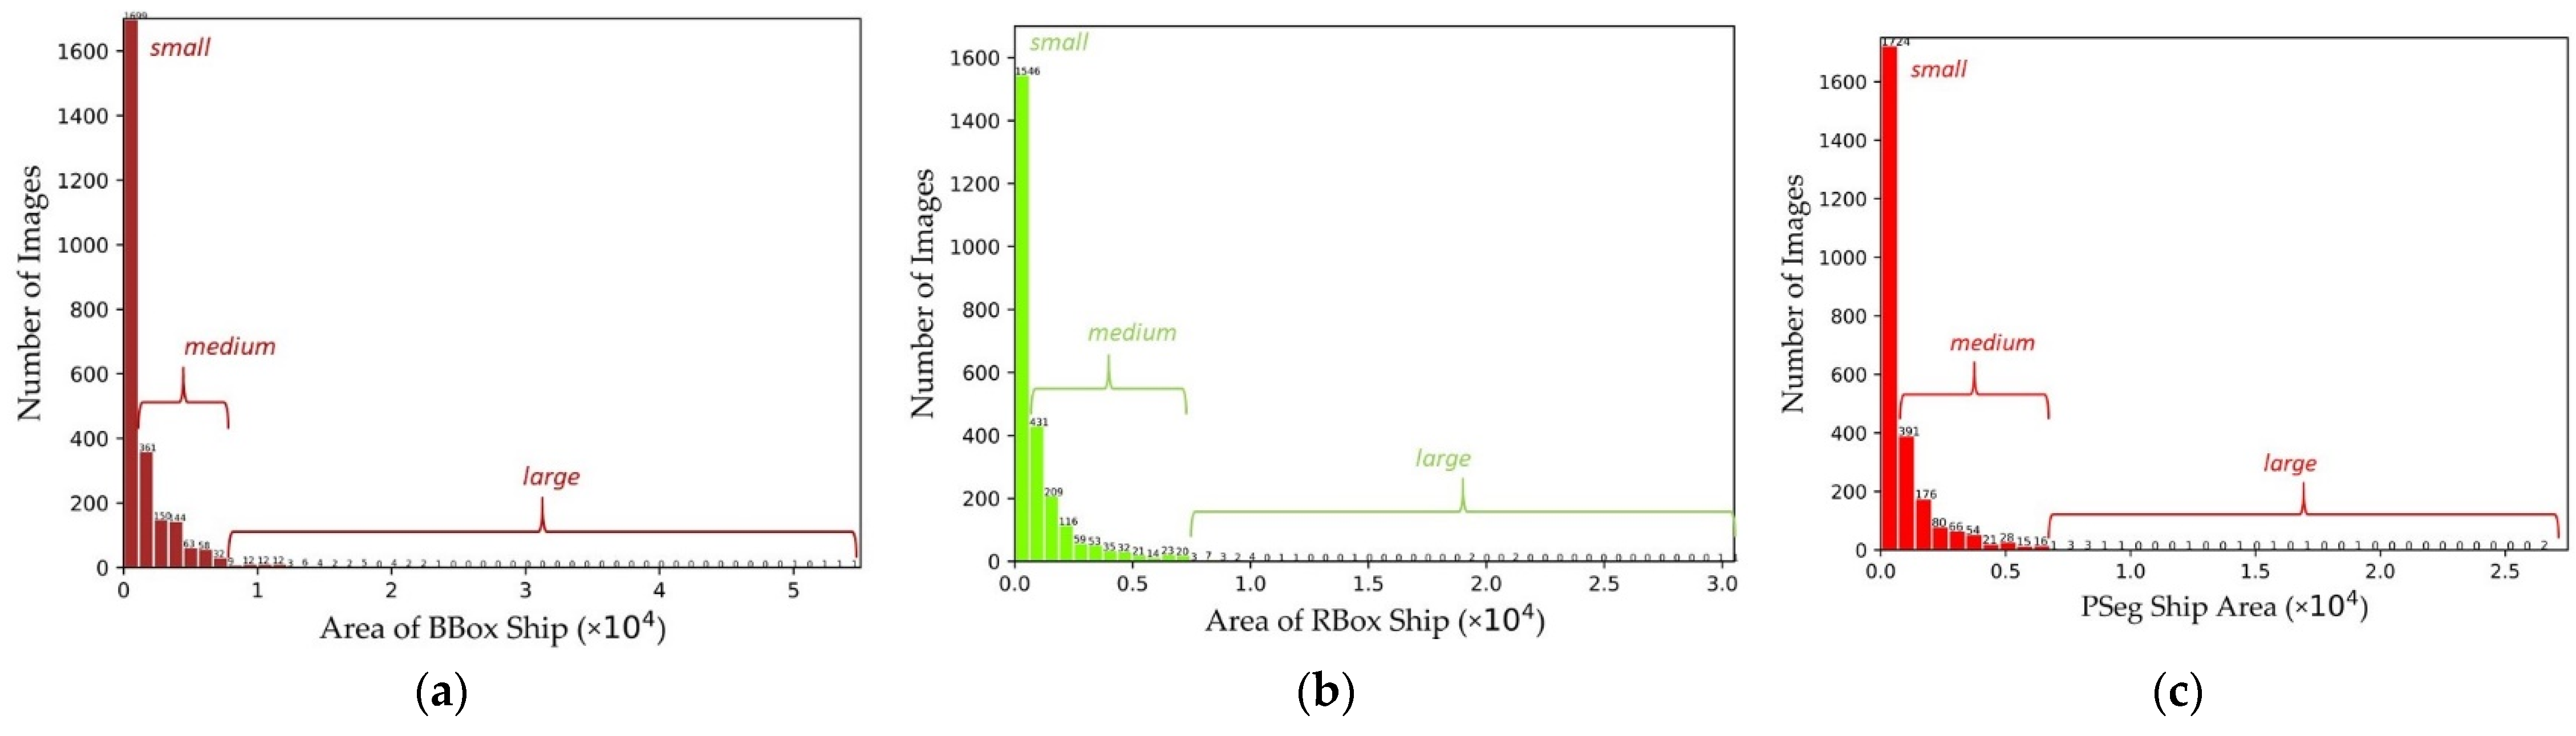
- Ships in SSDD are universally small. The width-height distribution of BBox presents a symmetrical funnel shape. There are more ships at the top of the funnel and fewer ships in the center of the funnel. This shows that SAR ships are rarely square (the green line), which is also reasonable because ships are always flat. The average size of ships is only ~ 35 × 35 pixels. It is extremely difficult to detect such small ships. Thus, scholars should pay special attention to this phenomenon.
- The reason why the ship size distribution presents a symmetrical structure based on the diagonal is that the breadth and length of the ship are not completely distinguished in the image coordinate system. Sometimes, the BBox width and height are confused.
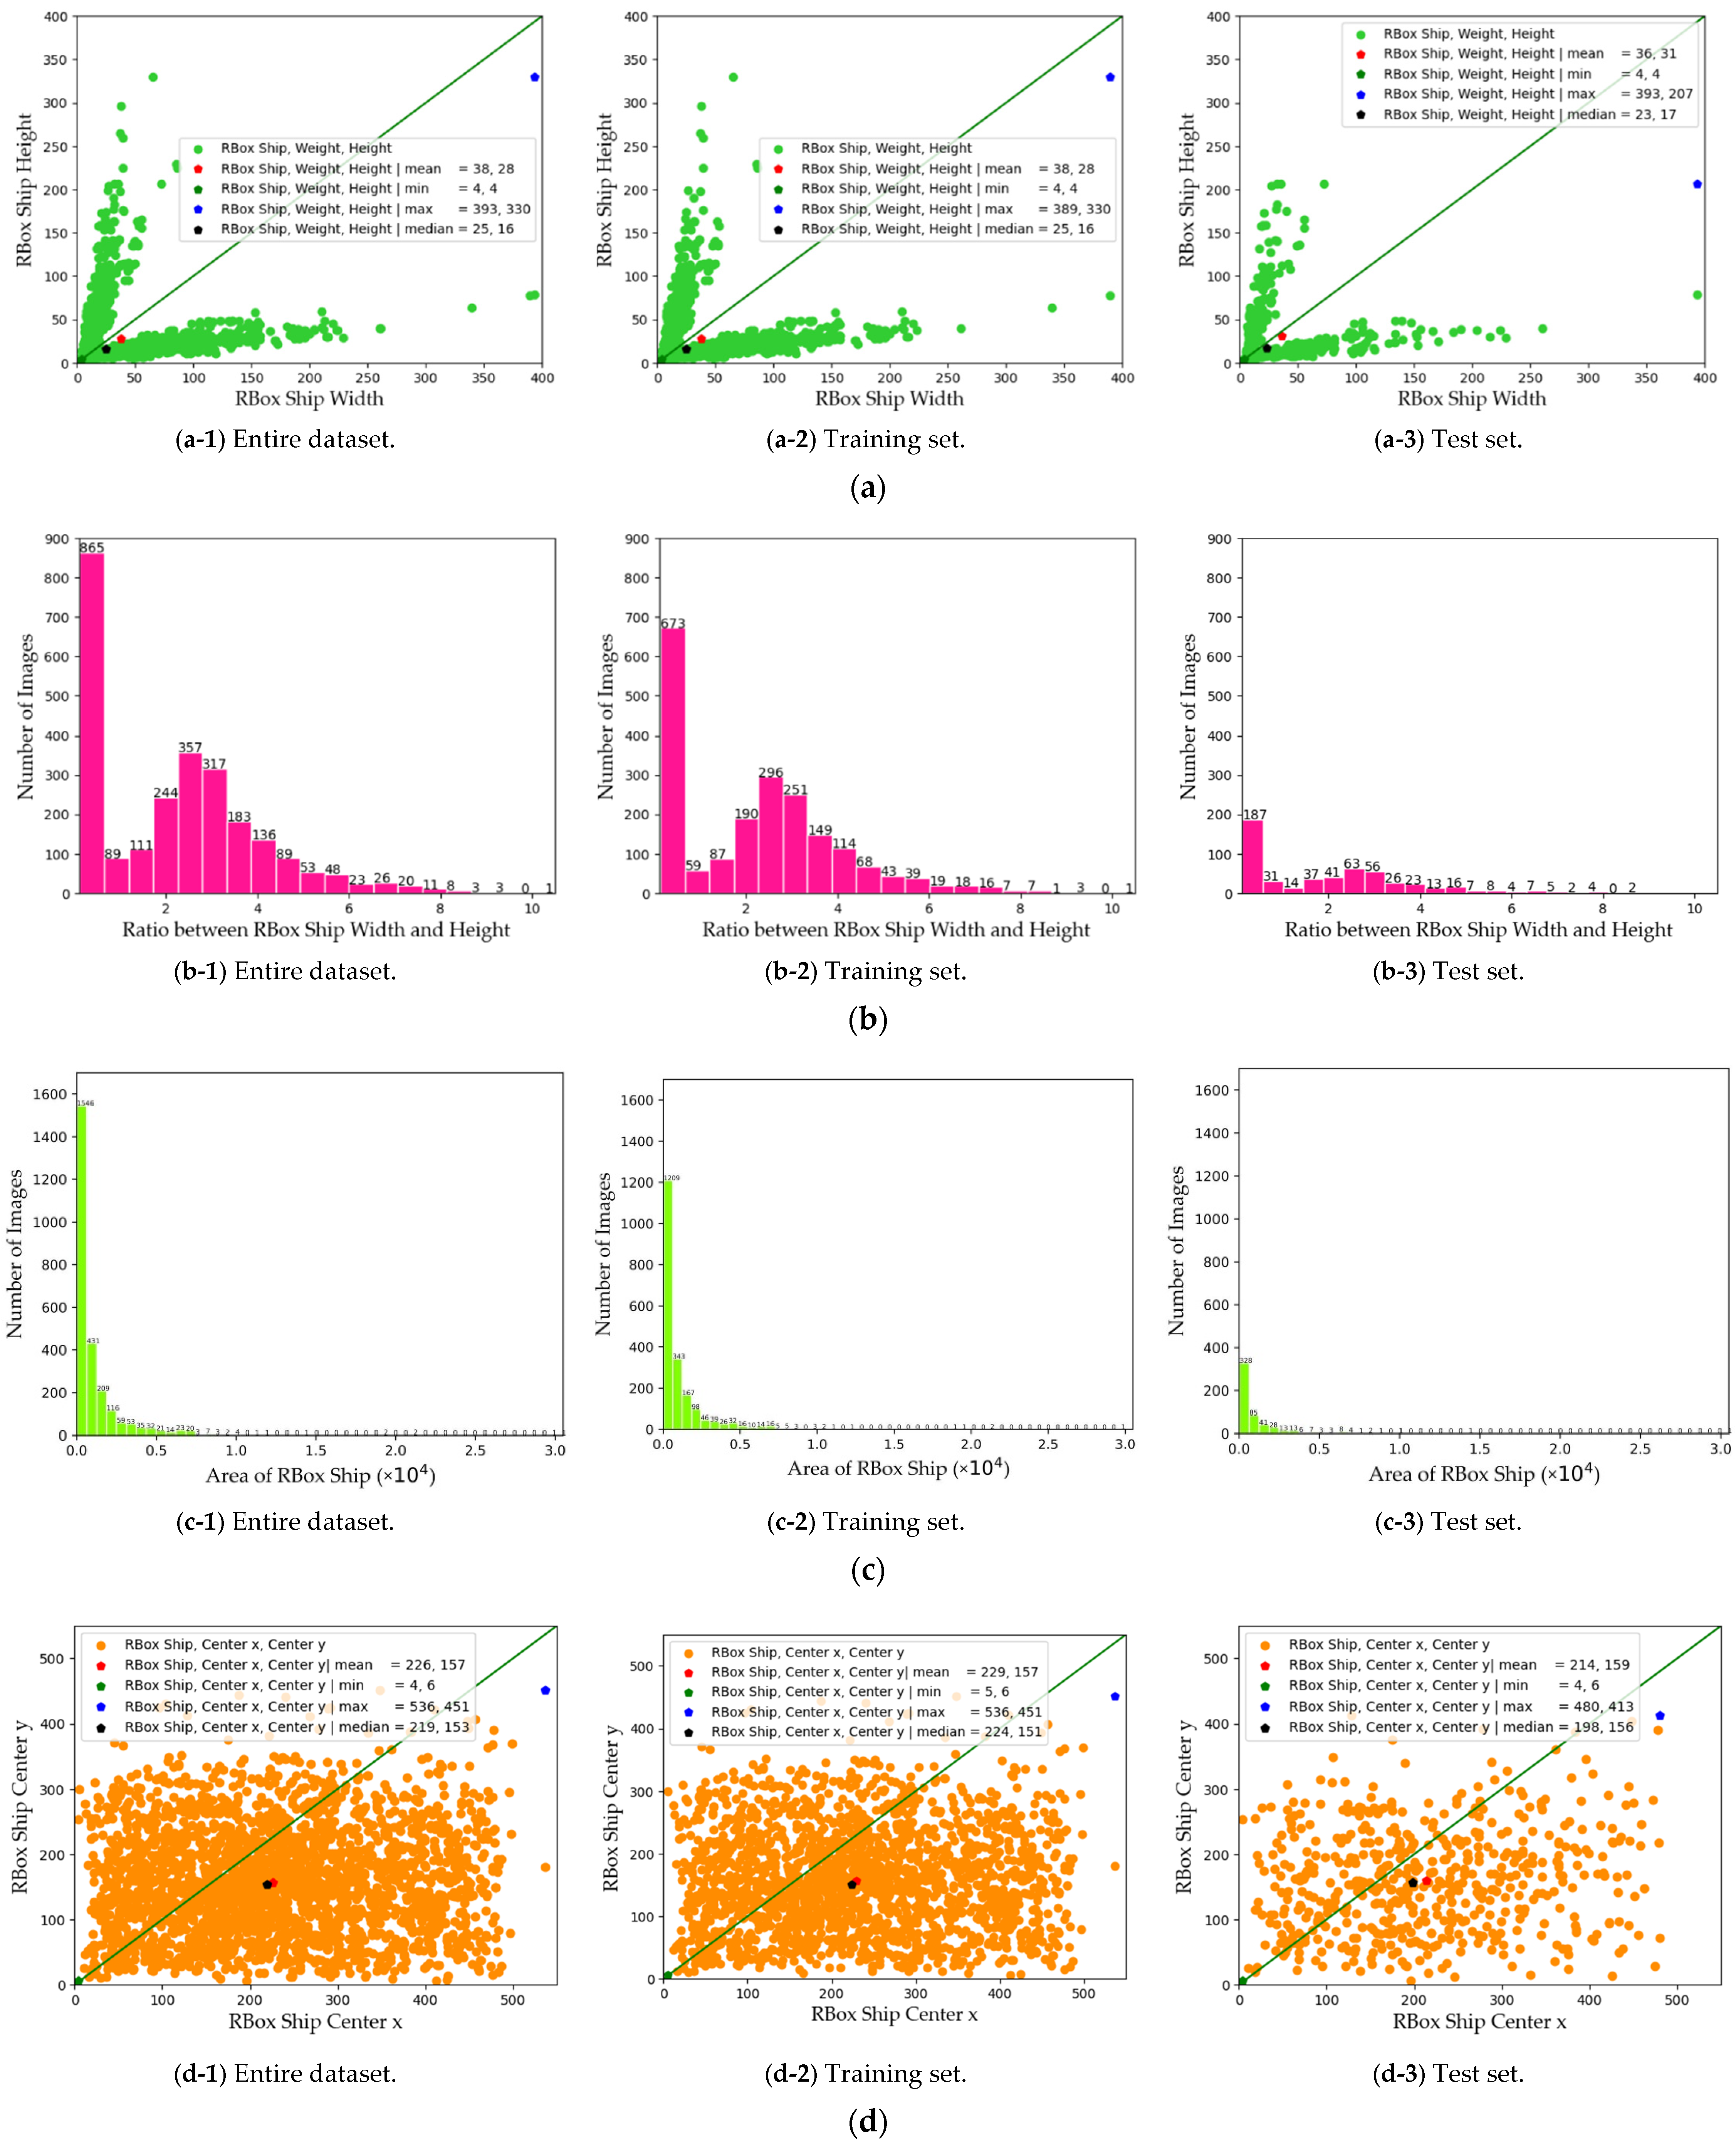
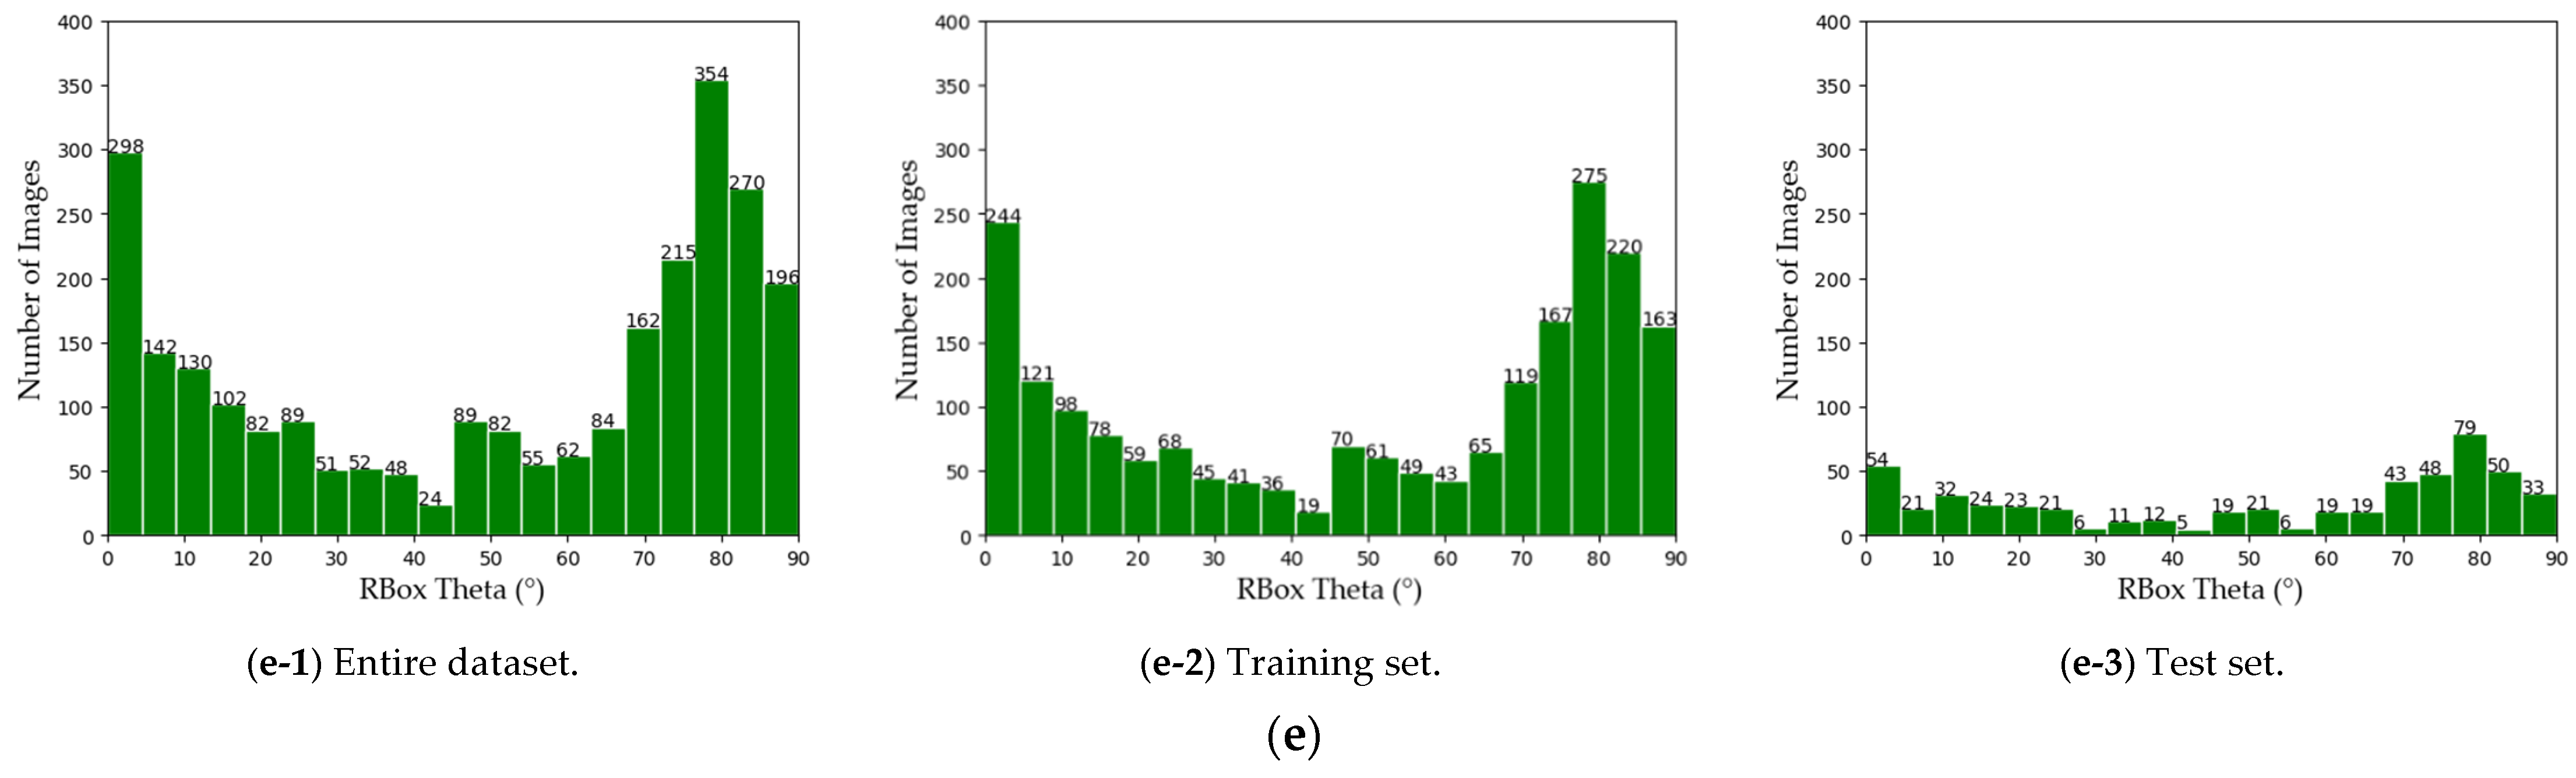
5.2. Data Analysis on RBox-SSDD
5.3. Data Analysis on PSeg-SSDD
6. Using Standards
6.1. Training-Test Division Determination
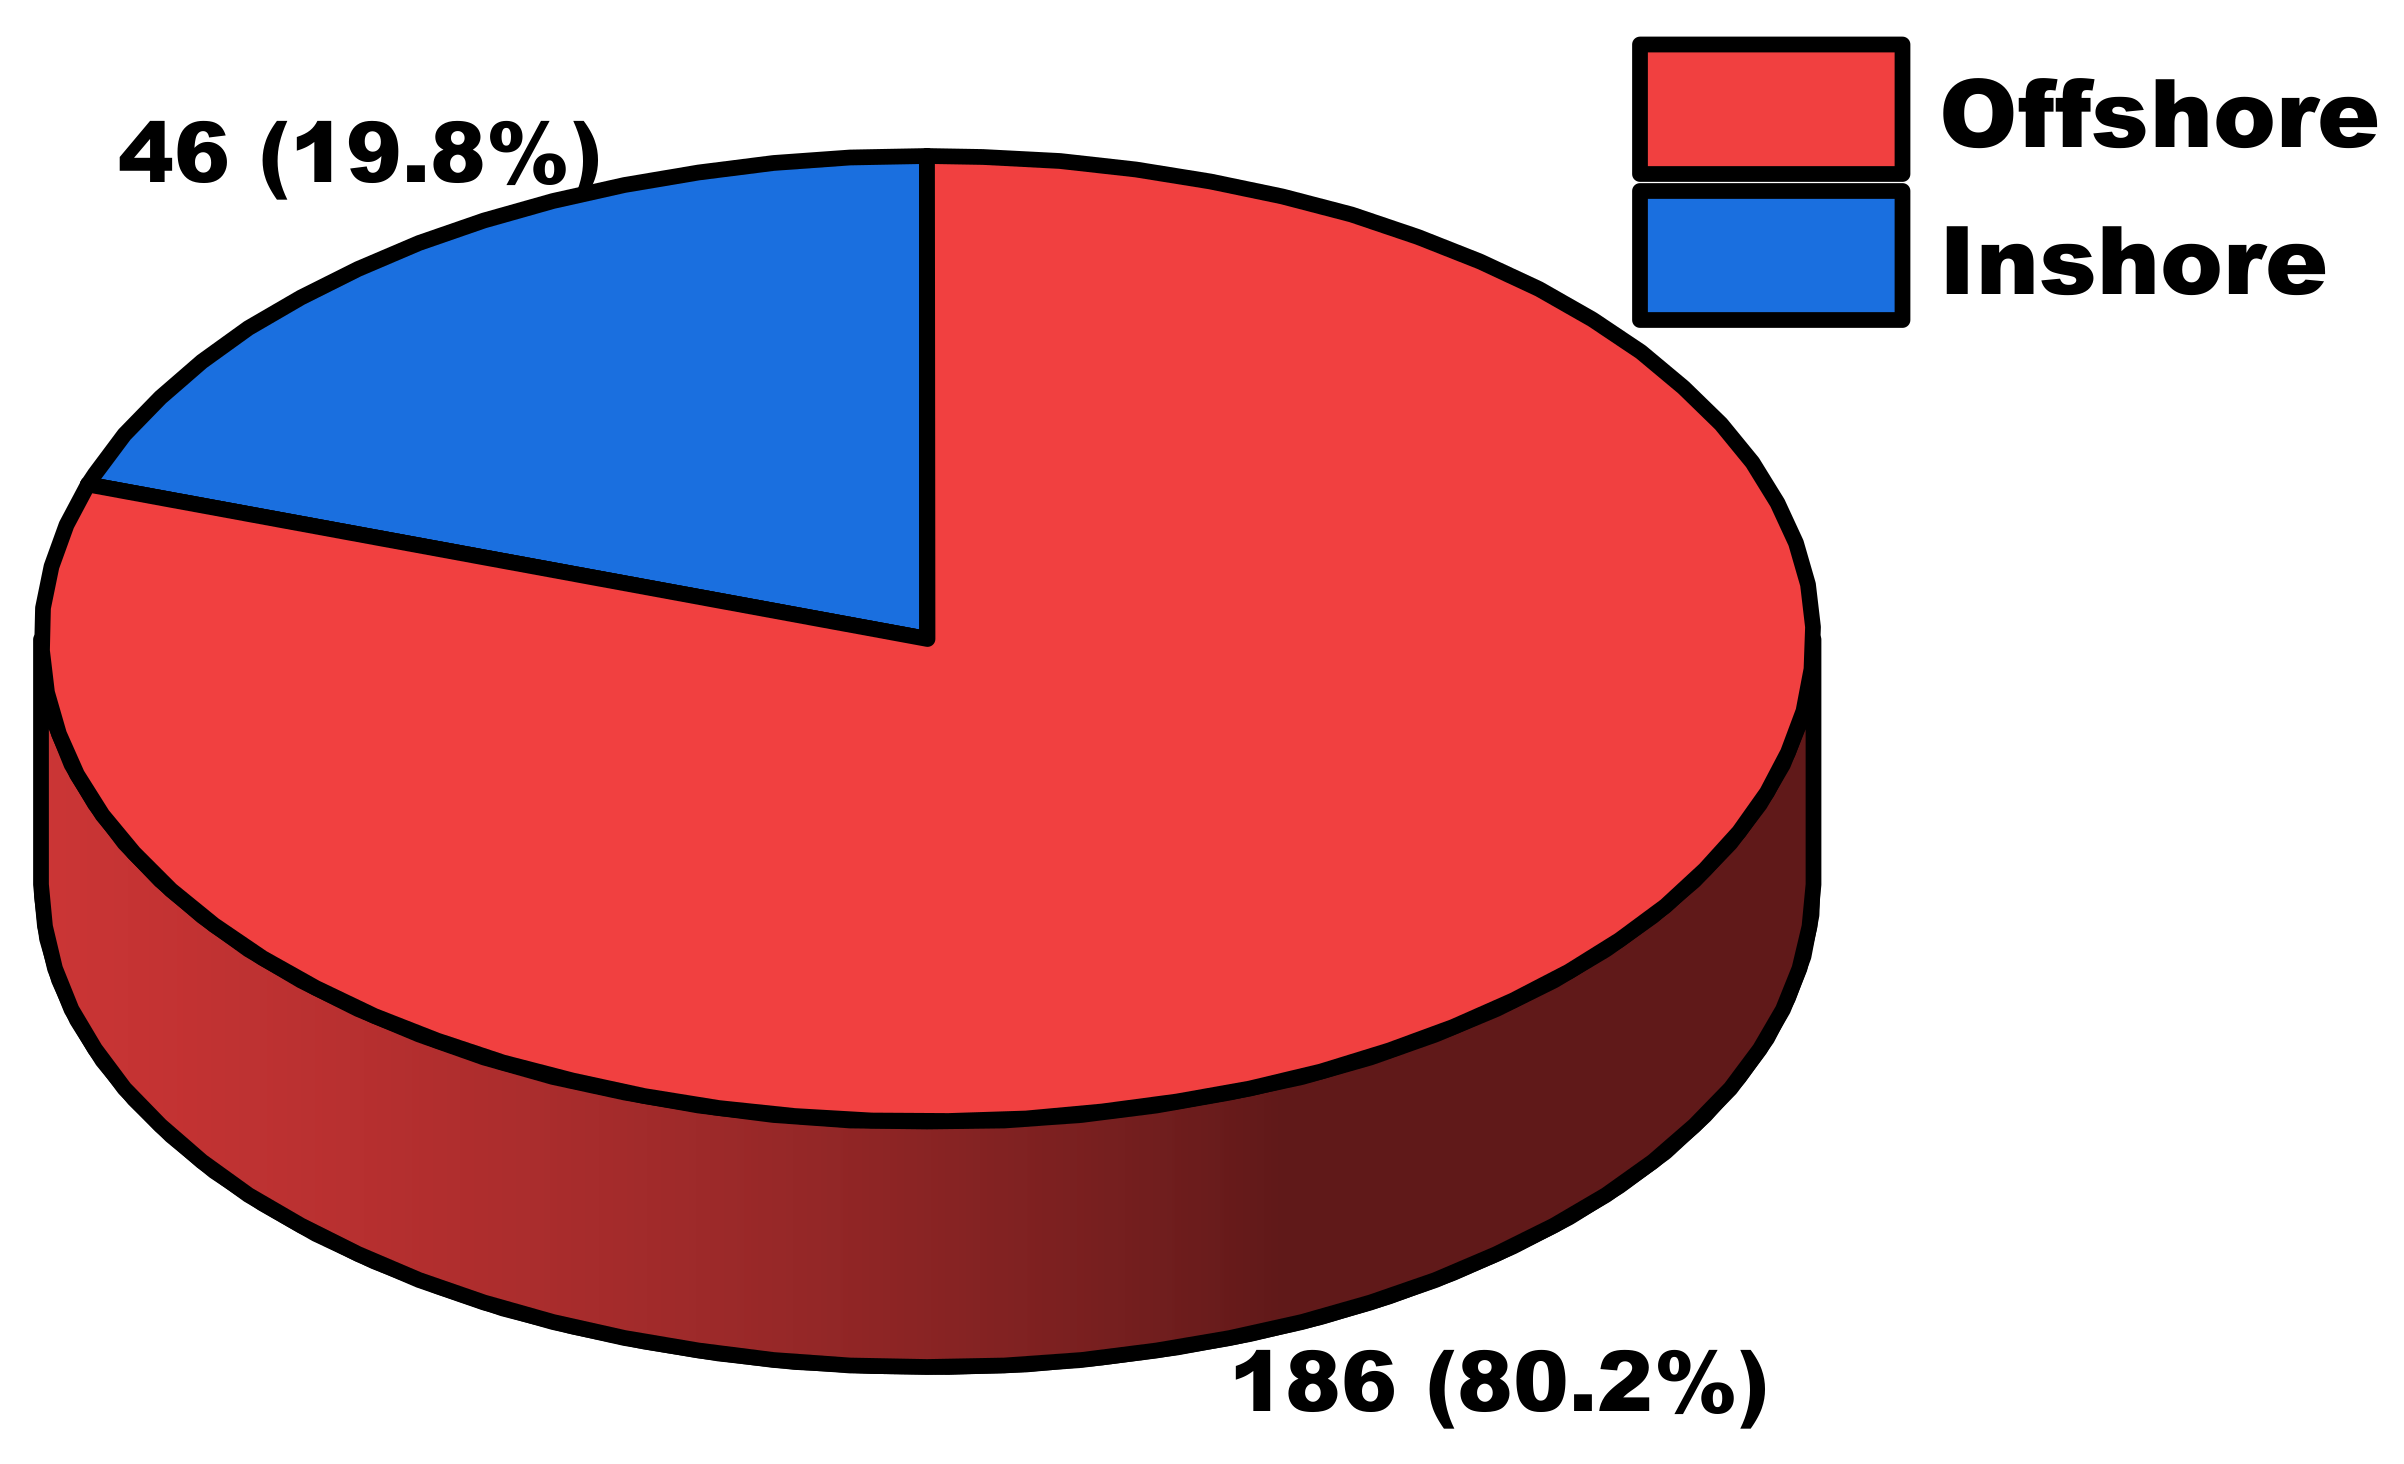
6.2. Inshore-Offshore Protocol
6.3. Ship-Size Definition
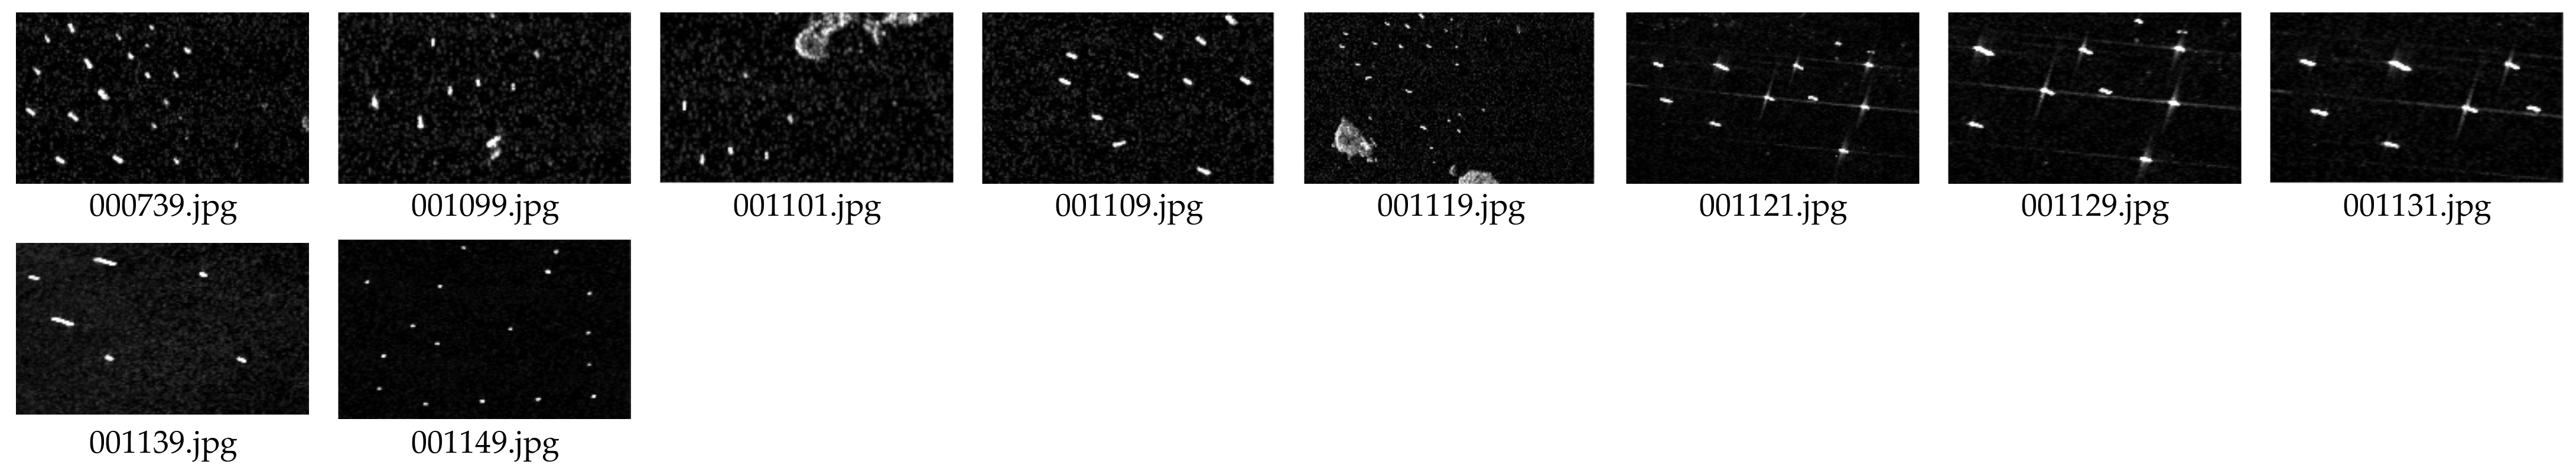
6.4. Densely Distributed Small Ship Samples
- One can use random crop data enhancement to increase the proportion of small ships in the whole image.
- One can detect small ships in the shallow layer of the deep network with low feature loss.
- One can combine CFAR into the deep network because CFAR is more pixel-sensitive.
- One can combine visual saliency theory to generate a saliency map to guide deep network learning features because these small ships are very significant in human-eye observation.
- One can design a deep network to super-resolution reconstruct the small ship. In this way, the features of small ships will become richer.
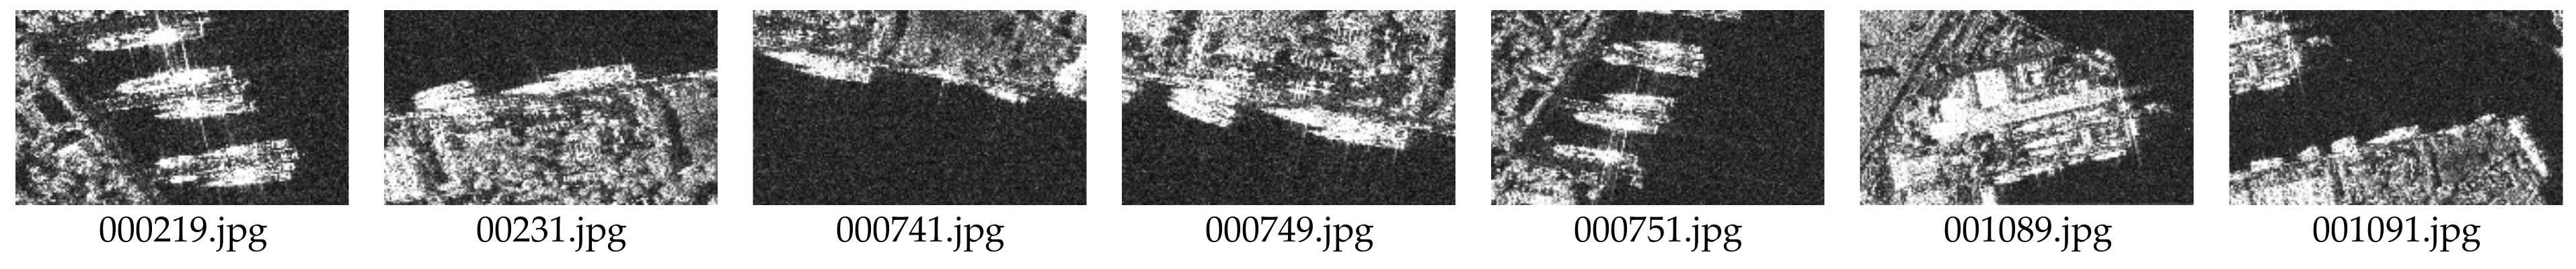
6.5. Densely Parallel Berthing at Ports Ship Samples
- One can use the attention mechanism to suppress the land interference so as to focus on the ship region.
7. Conclusions
Author Contributions
Funding
Institutional Review Board Statement
Informed Consent Statement
Data Availability Statement
Acknowledgments
Conflicts of Interest
Appendix A


References
- Yang, Y.; Pan, Z.; Hu, Y.; Ding, C. CPS-Det: An anchor-free based rotation detector for ship detection. Remote Sens. 2021, 13, 2208. [Google Scholar] [CrossRef]
- Xie, X.; Li, B.; Wei, X. Ship detection in multispectral satellite images under complex environment. Remote Sens. 2020, 12, 792. [Google Scholar] [CrossRef] [Green Version]
- Shao, Z.; Wu, W.; Wang, Z.; Du, W.; Li, C. SeaShips: A large-scale precisely annotated dataset for ship detection. IEEE Trans. Multimed. 2018, 20, 2593–2604. [Google Scholar] [CrossRef]
- Gao, F.; He, Y.; Wang, J.; Hussain, A.; Zhou, H. Anchor-free convolutional network with dense attention feature aggregation for ship detection in SAR images. Remote Sens. 2020, 12, 2619. [Google Scholar] [CrossRef]
- Born, G.H.; Dunne, J.A.; Lame, D.B. Seasat mission overview. Science 1979, 204, 1405–1406. [Google Scholar] [CrossRef] [PubMed]
- Jerzy, S.; Irfan, A.; Simon, A. Current trends in ship detection in single polarization synthetic aperture radar imagery. In Proceedings of the Photonics Applications in Astronomy, Communications, Industry, and High Energy Physics Experiments, Wilga, Poland, 14 October 2020; pp. 1–12. [Google Scholar]
- Gao, G. Statistical modeling of SAR images: A survey. Sensors 2010, 10, 775–795. [Google Scholar] [CrossRef]
- Iervolino, P.; Guida, R. A novel ship detector based on the generalized-likelihood ratio test for SAR imagery. IEEE J. Sel. Top. Appl. Earth Obs. Remote Sens. 2017, 10, 3616–3630. [Google Scholar] [CrossRef] [Green Version]
- Xu, L.; Zhang, H.; Wang, C.; Zhang, B.; Tian, S. Compact polarimetric SAR ship detection with m-δ decomposition using visual attention model. Remote Sens. 2016, 8, 751. [Google Scholar] [CrossRef] [Green Version]
- Li, M.D.; Cui, X.C.; Chen, S.W. Adaptive superpixel-level CFAR detector for SAR inshore dense ship detection. IEEE Geosci. Remote Sens. Lett. 2021, 1–5. [Google Scholar] [CrossRef]
- Liu, G.; Zhang, X.; Meng, J. A small ship target detection method based on polarimetric SAR. Remote Sens. 2019, 11, 2938. [Google Scholar] [CrossRef] [Green Version]
- Lupidi, A.; Staglianò, D.; Martorella, M.; Berizzi, F. Fast detection of oil spills and ships using SAR images. Remote Sens. 2017, 9, 230. [Google Scholar] [CrossRef] [Green Version]
- Karakuş, O.; Rizaev, I.; Achim, A. Ship wake detection in SAR images via sparse regularization. IEEE Trans. Geosci. Remote. Sens. 2020, 58, 1665–1677. [Google Scholar] [CrossRef] [Green Version]
- Crisp, D.J. The State-of-the-Art in Ship Detection in Synthetic Aperture Radar Imagery; Department of Defence: Canberra, Australia, 2004; p. 115. [Google Scholar]
- Girshick, R.; Donahue, J.; Darrell, T.; Malik, J. Rich feature hierarchies for accurate object detection and semantic segmentation. In Proceedings of the IEEE Conference on Computer Vision and Pattern Recognition, Columbus, OH, USA, 23–28 June 2014; pp. 580–587. [Google Scholar]
- Girshick, R. Fast R-CNN. In Proceedings of the IEEE International Conference on Computer Vision (ICCV), Santiago, Chile, 7–13 December 2015; pp. 1440–1448. [Google Scholar]
- Ren, S.; He, K.; Girshick, R.; Sun, J. Faster r-cnn: Towards real-time object detection with region proposal networks. In Proceedings of the International Conference on Neural Information Processing Systems (NIPS), Montreal, QC, Canada, 7–12 December 2015; pp. 91–99. [Google Scholar]
- Cai, Z.; Vasconcelos, N. Cascade R-CNN: Delving into high quality object detection. In Proceedings of the IEEE Conference on Computer Vision and Pattern Recognition (CVPR), Salt Lake City, UT, USA, 18–23 June 2018; pp. 6154–6162. [Google Scholar]
- Redmon, J.; Divvala, S.; Girshick, R.; Farhadi, A. You only look once: Unified, real-time object detection. In Proceedings of the IEEE Conference on Computer Vision and Pattern Recognition (CVPR), Las Vegas, NV, USA, 27–30 June 2016; pp. 779–788. [Google Scholar]
- Liu, W.; Anguelov, D.; Erhan, D.; Szegedy, C.; Reed, S.; Cheng-Yang, F.; Berg, A.C. SSD: Single shot multibox detector. In Proceedings of the Springer International Publishing European Conference on Computer Vision (ECCV), Cham, Germany, 11–14 October 2016; pp. 21–37. [Google Scholar]
- Lin, T.-Y.; Goyal, P.; Girshick, R.; He, K.; Dollar, P. Focal loss for dense object detection. In Proceedings of the IEEE International Conference on Computer Vision (ICCV), Venice, Italy, 22–29 October 2017; pp. 2999–3007. [Google Scholar]
- Duan, K.; Bai, S.; Xie, L.; Qi, H.; Huang, Q.; Tian, Q. CenterNet: Keypoint triplets for object detection. In Proceedings of the IEEE International Conference on Computer Vision (ICCV), Seoul, Korea, 27 October–3 November 2019; pp. 6568–6577. [Google Scholar]
- Schwegmann, C.P.; Kleynhans, W.; Salmon, B.P.; Mdakane, L.W.; Meyer, R.G.V. Very deep learning for ship discrimination in Synthetic Aperture Radar imagery. In Proceedings of the IEEE International Geoscience and Remote Sensing Symposium (IGARSS), Beijing, China, 10–15 July 2016; pp. 104–107. [Google Scholar]
- Liu, Y.; Zhang, M.; Xu, P.; Guo, Z. SAR ship detection using sea-land segmentation-based convolutional neural network. In Proceedings of the International Workshop on Remote Sensing with Intelligent Processing (RSIP), Shanghai, China, 19–21 May 2017; pp. 1–4. [Google Scholar]
- Kang, M.; Leng, X.; Lin, Z.; Ji, K. A modified Faster R-CNN based on CFAR algorithm for SAR ship detection. In Proceedings of the International Workshop on Remote Sensing with Intelligent Processing (RSIP), Shanghai, China, 19–21 May 2017; pp. 1–4. [Google Scholar]
- Kang, M.; Ji, K.; Leng, X.; Lin, Z. Contextual region-based convolutional neural network with multilayer fusion for SAR ship detection. Remote Sens. 2017, 9, 860. [Google Scholar] [CrossRef] [Green Version]
- Srivastava, R.K.; Greff, K.; Schmidhuber, J. Training very deep networks. In Proceedings of the Neural Information Processing Systems (NIPS), Montreal, QC, Canada, 11–12 December 2015; pp. 2377–2385. [Google Scholar]
- Li, J.; Qu, C.; Shao, J. Ship detection in SAR images based on an improved faster R-CNN. In Proceedings of the SAR in Big Data Era: Models, Methods and Applications (BIGSARDATA), Beijing, China, 13–14 November 2017; pp. 1–6. [Google Scholar]
- Chen, S.-Q.; Zhan, R.-H.; Zhang, J. Robust single stage detector based on two-stage regression for SAR ship detection. In Proceedings of the International Conference on Innovation in Artificial Intelligence (ICIAI), Shanghai, China, 9–12 March 2018; pp. 169–174. [Google Scholar]
- Jiao, J.; Zhang, Y.; Sun, H.; Yang, X.; Gao, X.; Hong, W.; Fu, K.; Sun, X. A densely connected end-to-end neural network for multiscale and multiscene SAR ship detection. IEEE Access 2018, 6, 20881–20892. [Google Scholar] [CrossRef]
- Wang, J.; Lu, C.; Jiang, W. Simultaneous ship detection and orientation estimation in SAR images based on attention module and angle regression. Sensors 2018, 18, 2851. [Google Scholar] [CrossRef] [Green Version]
- Liu, N.; Cao, Z.; Cui, Z.; Pi, Y.; Dang, S. Multi-scale proposal generation for ship detection in SAR images. Remote Sens. 2019, 11, 526. [Google Scholar] [CrossRef] [Green Version]
- Gui, Y.; Li, X.; Xue, L. A multilayer fusion light-head detector for SAR ship detection. Sensors 2019, 19, 1124. [Google Scholar] [CrossRef] [Green Version]
- Chang, Y.-L.; Anagaw, A.; Chang, L.; Wang, Y.C.; Hsiao, C.-Y.; Lee, W.-H. Ship detection based on YOLOv2 for SAR imagery. Remote Sens. 2019, 11, 786. [Google Scholar] [CrossRef] [Green Version]
- Zhang, T.; Zhang, X. High-speed ship detection in SAR images based on a grid convolutional neural network. Remote Sens. 2019, 11, 1206. [Google Scholar] [CrossRef] [Green Version]
- An, Q.; Pan, Z.; Liu, L.; You, H. Drbox-v2: An improved detector with rotatable boxes for target detection in SAR images. IEEE Trans. Geosci. Remote. Sens. 2019, 57, 8333–8349. [Google Scholar] [CrossRef]
- Cui, Z.; Li, Q.; Cao, Z.; Liu, N. Dense attention pyramid networks for multi-scale ship detection in SAR images. IEEE Trans. Geosci. Remote. Sens. 2019, 57, 8983–8997. [Google Scholar] [CrossRef]
- Chen, C.; Hu, C.; He, C.; Pei, H.; Pang, Z.; Zhao, T. SAR ship detection under complex background based on attention mechanism. In Image and Graphics Technologies and Applications (IGTA); Springer: Singapore, 2019; pp. 565–578. [Google Scholar]
- Chen, C.; He, C.; Hu, C.; Pei, H.; Jiao, L. A deep neural network based on an attention mechanism for SAR ship detection in multiscale and complex scenarios. IEEE Access 2019, 7, 104848–104863. [Google Scholar] [CrossRef]
- Gui, Y.; Li, X.; Xue, L.; Lv, J. A scale transfer convolution network for small ship detection in SAR images. In Proceedings of the IEEE Joint International Information Technology and Artificial Intelligence Conference (ITAIC), Chongqing, China, 24–26 May 2019; pp. 1845–1849. [Google Scholar]
- Li, Y.; Chen, J.; Ke, M.; Li, L.; Ding, Z.; Wang, Y. Small targets recognition in SAR ship image based on improved SSD. In Proceedings of the IEEE International Conference on Signal, Information and Data Processing (ICSIDP), Chongqing, China, 11–13 December 2019; pp. 1–6. [Google Scholar]
- Zhang, X.; Wang, H.; Xu, C.; Lv, Y.; Fu, C.; Xiao, H.; He, Y. A lightweight feature optimizing network for ship detection in SAR image. IEEE Access 2019, 7, 141662–141678. [Google Scholar] [CrossRef]
- Yang, T.; Zhu, J.; Liu, J. SAR image target detection and recognition based on deep network. In Proceedings of the SAR in Big Data Era (BIGSARDATA), Beijing, China, 5–6 August 2019; pp. 1–4. [Google Scholar]
- Zhang, T.; Zhang, X.; Shi, J.; Wei, S. Depthwise separable convolution neural network for high-speed SAR ship detection. Remote Sens. 2019, 11, 2483. [Google Scholar] [CrossRef] [Green Version]
- Chen, S.; Ronghui, Z.; Zhang, J. Regional attention-based single shot detector for SAR ship detection. In Proceedings of the IET International Radar Conference (IRC), Nanjing, China, 17–19 October 2019; pp. 7381–7384. [Google Scholar]
- Chen, C.; He, C.; Hu, C.; Pei, H.; Jiao, L. MSARN: A deep neural network based on an adaptive recalibration mechanism for multiscale and arbitrary-oriented SAR ship detection. IEEE Access 2019, 7, 159262–159283. [Google Scholar] [CrossRef]
- Wang, R.; Xu, F.; Pei, J.; Wang, C.; Huang, Y.; Yang, J.; Wu, J. An improved Faster R-CNN based on MSER decision criterion for SAR image ship detection in harbor. In Proceedings of the IEEE International Geoscience and Remote Sensing Symposium (IGARSS), Yokohama, Japan, 28 July–2 August 2019; pp. 1322–1325. [Google Scholar]
- Li, Y.; Ding, Z.; Zhang, C.; Wang, Y.; Chen, J. SAR ship detection based on Resnet and transfer learning. In Proceedings of the IEEE International Geoscience and Remote Sensing Symposium (IGARSS), Yokohama, Japan, 28 July–2 August 2019; pp. 1188–1191. [Google Scholar]
- Li, Q.; Min, R.; Cui, Z.; Pi, Y.; Xu, Z. Multiscale ship detection based on dense attention pyramid network in SAR images. In Proceedings of the IEEE International Geoscience and Remote Sensing Symposium (IGARSS), Yokohama, Japan, 28 July–2 August 2019; pp. 5–8. [Google Scholar]
- Liu, N.; Cui, Z.; Cao, Z.; Pi, Y.; Lan, H. Scale-transferrable pyramid network for multi-scale ship detection in SAR images. In Proceedings of the IEEE International Geoscience and Remote Sensing Symposium (IGARSS), Yokohama, Japan, 28 July–2 August 2019; pp. 1–4. [Google Scholar]
- Wei, S.; Su, H.; Ming, J.; Wang, C.; Yan, M.; Kumar, D.; Shi, J.; Zhang, X. Precise and robust ship detection for high-resolution SAR imagery based on HR-SDNet. Remote Sens. 2020, 12, 167. [Google Scholar] [CrossRef] [Green Version]
- Su, H.; Wei, S.; Liu, S.; Liang, J.; Wang, C.; Shi, J.; Zhang, X. HQ-ISNet: High-quality instance segmentation for remote sensing imagery. Remote Sens. 2020, 12, 989. [Google Scholar] [CrossRef] [Green Version]
- Su, H.; Wei, S.; Wang, M.; Zhou, L.; Shi, J.; Zhang, X. Ship detection based on RetinaNet-plus for high-resolution SAR imagery. In Proceedings of the Asia-Pacific Conference on Synthetic Aperture Radar (APSAR), Xiamen, China, 26–29 November 2019; pp. 1–5. [Google Scholar]
- Mao, Y.; Yang, Y.; Ma, Z.; Li, M.; Su, H.; Zhang, Y. Efficient low-cost ship detection for SAR imagery based on simplified U-Net. IEEE Access 2020, 8, 69742–69753. [Google Scholar] [CrossRef]
- Zhang, T.; Zhang, X.; Shi, J.; Wei, S. High-speed ship detection in SAR images by improved YOLOv3. In Proceedings of the International Computer Conference on Wavelet Active Media Technology and Information Processing (ICCWAMTIP), Chengdu, China, 13–15 December 2019; pp. 149–152. [Google Scholar]
- Pan, Z.; Yang, R.; Zhang, Z. MSR2N: Multi-stage rotational region based network for arbitrary-oriented ship detection in SAR images. Sensors 2020, 20, 2340. [Google Scholar] [CrossRef] [PubMed] [Green Version]
- Zhang, T.; Zhang, X. ShipDeNet-20: An only 20 convolution layers and <1-MB lightweight SAR ship detector. IEEE Geosci. Remote Sens. Lett. 2021, 18, 1234–1238. [Google Scholar]
- Dai, W.; Mao, Y.; Yuan, R.; Liu, Y.; Pu, X.; Li, C. A novel detector based on convolution neural networks for multiscale SAR ship detection in complex background. Sensors 2020, 20, 2547. [Google Scholar] [CrossRef]
- Yang, R.; Wang, G.; Pan, Z.; Lu, H.; Zhang, H.; Jia, X. A novel false alarm suppression method for CNN-based SAR ship detector. IEEE Geosci. Remote Sens. Lett. 2021, 18, 1401–1405. [Google Scholar] [CrossRef]
- Zhao, Y.; Zhao, L.; Xiong, B.; Kuang, G. Attention receptive pyramid network for ship detection in SAR images. IEEE J. Sel. Top. Appl. Earth Obs. Remote Sens. 2020, 13, 2738–2756. [Google Scholar] [CrossRef]
- Han, L.; Zheng, T.; Ye, W.; Ran, D. Analysis of detection preference to CNN based SAR ship detectors. In Proceedings of the Information Communication Technologies Conference (ICTC), Nanjing, China, 29–31 May 2020; pp. 307–312. [Google Scholar]
- Chen, S.; Zhang, J.; Zhan, R. R2FA-Det: Delving into high-quality rotatable boxes for ship detection in SAR images. Remote Sens. 2020, 12, 2031. [Google Scholar] [CrossRef]
- Wei, S.; Zeng, X.; Qu, Q.; Wang, M.; Su, H.; Shi, J. HRSID: A high-resolution SAR images dataset for ship detection and instance segmentation. IEEE Access 2020, 8, 120234–120254. [Google Scholar] [CrossRef]
- Fu, J.; Sun, X.; Wang, Z.; Fu, K. An anchor-free method based on feature balancing and refinement network for multiscale ship detection in SAR images. IEEE Trans. Geosci. Remote. Sens. 2020, 59, 1331–1344. [Google Scholar] [CrossRef]
- Zhang, T.; Zhang, X.; Shi, J.; Wei, S. HyperLi-Net: A hyper-light deep learning network for high-accurate and high-speed ship detection from synthetic aperture radar imagery. ISPRS J. Photogramm. Remote Sens. 2020, 167, 123–153. [Google Scholar] [CrossRef]
- Han, L.; Ye, W.; Li, J.; Ran, D. Small ship detection in SAR images based on modified SSD. In Proceedings of the IEEE International Conference on Signal, Information and Data Processing (ICSIDP), Chongqing, China, 11–13 December 2019; pp. 1–5. [Google Scholar]
- Han, L.; Zhao, X.; Ye, W.; Ran, D. Asymmetric and square convolutional neural network for SAR ship detection from scratch. In Proceedings of the International Conference on Biomedical Signal and Image Processing (ICBIP), Suzhou, China, 21–23 August 2020; pp. 80–85. [Google Scholar]
- Han, L.; Ran, D.; Ye, W.; Yang, W.; Wu, X. Multi-size convolution and learning deep network for SAR ship detection from scratch. IEEE Access 2020, 8, 158996–159016. [Google Scholar] [CrossRef]
- Zhou, L.; Wei, S.; Cui, Z.; Fan, J.; Yang, X.; Wei, D. Lira-YOLO: A lightweight model for ship detection in radar images. J. Syst. Eng. Electron. 2020, 31, 950–956. [Google Scholar]
- Mao, Y.; Li, X.; Li, Z.; Li, M.; Chen, S. An anchor-free SAR ship detector with only 1.17M parameters. In Proceedings of the International Conference on Aviation Safety and Information Technology (ICASIT), Weihai, China, 14–16 October 2020; pp. 182–186. [Google Scholar]
- Mao, Y.; Li, X.; Li, Z.; Li, M.; Chen, S. Network slimming method for SAR ship detection based on knowlegde distillation. In Proceedings of the International Conference on Aviation Safety and Information Technology (ICASIT), Weihai, China, 14–16 October 2020; pp. 177–181. [Google Scholar]
- Han, L.; Ran, D.; Ye, W.; Wu, X. Asymmetric convolution-based neural network for SAR ship detection from scratch. In Proceedings of the International Conference on Computing and Pattern Recognition (ICCPR), New York, NY, USA, 30 October–1 November 2020; pp. 90–95. [Google Scholar]
- Zhang, T.; Zhang, X.; Shi, J.; Wei, S.; Wang, J.; Li, J.; Su, H.; Zhou, Y. Balance scene learning mechanism for offshore and inshore ship detection in SAR images. IEEE Geosci. Remote Sens. Lett. 2020, 1–5. [Google Scholar] [CrossRef]
- Li, Y.; Zhang, S.; Wang, W.-Q. A lightweight Faster R-CNN for ship detection in SAR images. IEEE Geosci. Remote Sens. Lett. 2020, 1–5. [Google Scholar] [CrossRef]
- Zhu, M.; Hu, G.; Zhou, H.; Lu, C.; Zhang, Y.; Yue, S.; Li, Y. Rapid ship detection in SAR images based on YOLOv3. In Proceedings of the International Conference on Communication, Image and Signal Processing (CCISP), Chengdu, China, 13–15 November 2020; pp. 214–218. [Google Scholar]
- Zhang, T.; Zhang, X.; Shi, J.; Wei, S.; Li, J. Balanced feature pyramid network for ship detection in Synthetic Aperture Radar images. In Proceedings of the IEEE Radar Conference (RadarConf), Florence, Italy, 21–25 September 2020; pp. 1–5. [Google Scholar]
- Chen, S.Q.; Zhan, R.H.; Wang, W.; Zhang, J. Learning slimming SAR ship object detector through network pruning and knowledge distillation. IEEE J. Sel. Top. Appl. Earth Obs. Remote Sens. 2021, 14, 1267–1282. [Google Scholar] [CrossRef]
- Guo, H.; Yang, X.; Wang, N.; Gao, X. A Centernet++ model for ship detection in SAR images. Pattern Recognit. 2021, 112, 107787. [Google Scholar] [CrossRef]
- Yang, R.; Pan, Z.; Jia, X.; Zhang, L.; Deng, Y. A novel CNN-based detector for ship detection based on rotatable bounding box in SAR images. IEEE J. Sel. Top. Appl. Earth Obs. Remote Sens. 2021, 14, 1938–1958. [Google Scholar] [CrossRef]
- An, Q.; Pan, Z.; You, H.; Hu, Y. Transitive transfer learning-based anchor free rotatable detector for SAR target detection with few samples. IEEE Access 2021, 9, 24011–24025. [Google Scholar] [CrossRef]
- Zhao, K.; Zhou, Y.; Chen, X. A dense connection based SAR ship detection network. In Proceedings of the IEEE Joint International Information Technology and Artificial Intelligence Conference (ITAIC), Chongqing, China, 17–19 June 2020; pp. 669–673. [Google Scholar]
- Mao, Y.; Li, X.; Su, H.; Zhou, Y.; Li, J. Ship detection for SAR imagery based on deep learning: A benchmark. In Proceedings of the IEEE Joint International Information Technology and Artificial Intelligence Conference (ITAIC), Chongqing, China, 17–19 June 2020; pp. 1934–1940. [Google Scholar]
- Wang, R.; Shao, S.; An, M.; Li, J.; Wang, S.; Xu, X. Soft thresholding attention network for adaptive feature denoising in SAR ship detection. IEEE Access 2021, 9, 29090–29105. [Google Scholar] [CrossRef]
- Hou, S.; Ma, X.; Wang, X.; Fu, Z.; Wang, J.; Wang, H. SAR image ship detection based on scene interpretation. In Proceedings of the IEEE International Geoscience and Remote Sensing Symposium (IGARSS), Waikoloa, HI, USA, 26 September–2 October 2020; pp. 2863–2866. [Google Scholar]
- Zhang, T.; Zhang, X.; Shi, J.; Wei, S. ShipDeNet-18: An only 1 MB with only 18 convolution layers light-weight deep learning network for SAR ship detection. In Proceedings of the IEEE International Geoscience and Remote Sensing Symposium (IGARSS), Waikoloa, HI, USA, 26 September–2 October 2020; pp. 1221–1224. [Google Scholar]
- Kun, J.; Yan, C. SAR image ship detection based on deep learning. In Proceedings of the International Conference on Computer Engineering and Intelligent Control (ICCEIC), Chongqing, China, 6–8 November 2020; pp. 55–59. [Google Scholar]
- Anil Raj, J.; Idicula, S.M.; Paul, B. A novel ship detection method from SAR image with reduced false alarm. In Proceedings of the International Conference on Computational Intelligence and Energy Advancements (ICCIEA), Telangana, India, 11–12 September 2021; p. 12010. [Google Scholar]
- Li, D.; Liang, Q.; Liu, H.; Liu, Q.; Liu, H.; Liao, G. A novel multidimensional domain deep learning network for SAR ship detection. IEEE Trans. Geosci. Remote. Sens. 2021, 1–13. [Google Scholar] [CrossRef]
- Jin, L.; Liu, G. An approach on image processing of deep learning based on improved SSD. Symmetry 2021, 13, 495. [Google Scholar] [CrossRef]
- Chen, Y.; Duan, T.; Wang, C.; Zhang, Y.; Huang, M. End-to-end ship detection in SAR images for complex scenes based on deep cnns. J. Sens. 2021, 2021, 8893182. [Google Scholar] [CrossRef]
- He, Y.; Gao, F.; Wang, J.; Hussain, A.; Yang, E.; Zhou, H. Learning polar encodings for arbitrary-oriented ship detection in SAR images. IEEE J. Sel. Top. Appl. Earth Obs. Remote Sens. 2021, 14, 3846–3859. [Google Scholar] [CrossRef]
- Tian, L.; Cao, Y.; He, B.; Zhang, Y.; He, C.; Li, D. Image enhancement driven by object characteristics and dense feature reuse network for ship target detection in remote sensing imagery. Remote Sens. 2021, 13, 1327. [Google Scholar] [CrossRef]
- Li, Y.; Zhu, W.; Zhu, B. SAR image nearshore ship target detection in complex environment. In Proceedings of the IEEE Advanced Information Technology, Electronic and Automation Control Conference (IAEAC), Chongqing, China, 12–14 March 2021; pp. 1964–1968. [Google Scholar]
- Zhao, K.; Zhou, Y.; Chen, X.; Wang, B.; Zhang, Y. Ship detection from scratch in Synthetic Aperture Radar (SAR) images. Int. J. Remote Sens. 2021, 42, 5014–5028. [Google Scholar] [CrossRef]
- Jiang, J.; Fu, X.; Qin, R.; Wang, X.; Ma, Z. High-speed lightweight ship detection algorithm based on YOLO-v4 for three-channels RGB SAR image. Remote Sens. 2021, 13, 1909. [Google Scholar] [CrossRef]
- Zhu, M.; Hu, G.; Li, S.; Liu, S.; Wang, S. An effective ship detection method based on RefineDet in SAR images. In Proceedings of the International Conference on Communications, Information System and Computer Engineering (CISCE), Beijing, China, 5–7 July 2021; pp. 377–380. [Google Scholar]
- Yu, L.; Wu, H.; Zhong, Z.; Zheng, L.; Deng, Q.; Hu, H. TWC-Net: A SAR ship detection using two-way convolution and multiscale feature mapping. Remote Sens. 2021, 13, 2558. [Google Scholar] [CrossRef]
- Sun, W.; Huang, X. Semantic attention-based network for inshore SAR ship detection. In Proceedings of the International Conference on Digital Image Processing (ICDIP), Singapore, 20–23 May 2021; p. 11878. [Google Scholar]
- Wu, Z.; Hou, B.; Ren, B.; Ren, Z.; Wang, S.; Jiao, L. A deep detection network based on interaction of instance segmentation and object detection for SAR images. Remote Sens. 2021, 13, 2582. [Google Scholar] [CrossRef]
- Sun, K.; Liang, Y.; Ma, X.; Huai, Y.; Xing, M. DSDet: A lightweight densely connected sparsely activated detector for ship target detection in high-resolution SAR images. Remote Sens. 2021, 13, 2743. [Google Scholar] [CrossRef]
- Zhang, T.; Zhang, X.; Ke, X. Quad-FPN: A novel quad feature pyramid network for SAR ship detection. Remote Sens. 2021, 13, 2771. [Google Scholar] [CrossRef]
- Sun, Z.; Dai, M.; Leng, X.; Lei, Y.; Xiong, B.; Ji, K. An anchor-free detection method for ship targets in high-resolution SAR images. IEEE J. Sel. Top. Appl. Earth Obs. Remote Sens. 2021, 14, 7799–7816. [Google Scholar] [CrossRef]
- Wang, Y.; Wang, C.; Zhang, H.; Dong, Y.; Wei, S. A SAR dataset of ship detection for deep learning under complex backgrounds. Remote Sens. 2019, 11, 765. [Google Scholar] [CrossRef] [Green Version]
- Sun, X.; Wang, Z.; Sun, Y.; Diao, W.; Zhang, Y.; Kun, F. AIR-SARShip-1.0: High-resolution SAR Ship Detection Dataset. J. Radars 2019, 8, 852. [Google Scholar]
- Zhang, T.; Zhang, X.; Ke, X.; Zhan, X.; Shi, J.; Wei, S.; Pan, D.; Li, J.; Su, H.; Zhou, Y.; et al. LS-SSDD-v1.0: A deep learning dataset dedicated to small ship detection from large-scale sentinel-1 SAR images. Remote Sens. 2020, 12, 2997. [Google Scholar] [CrossRef]
- Sun, X.; Wang, Z.; Sun, Y.; Diao, W.; Zhang, Y.; Kun, F. AIR-SARShip-2.0. Available online: http://radars.ie.ac.cn/web/data/getData?dataType=SARDataset_en&pageType=en (accessed on 25 August 2021).
- Torres, R.; Snoeij, P.; Geudtner, D.; Bibby, D.; Davidson, M.; Rommen, B. GMES Sentinel-1 mission. Remote Sens. Environ. 2012, 120, 9–24. [Google Scholar] [CrossRef]
- Zhang, Q.; Liu, Y. Overview of chinese first c band multi-polarization SAR satellite GF-3. Aerosp. China 2017, 18, 22–31. [Google Scholar]
- Buckreuss, S.; Schättler, B.; Fritz, T.; Mittermayer, J.; Kahle, R.; Maurer, E.; Böer, J.; Bachmann, M.; Mrowka, F.; Schwarz, E.; et al. Ten years of TerraSAR-X operations. Remote Sens. 2018, 10, 873. [Google Scholar] [CrossRef] [Green Version]
- Virelli, M.; Coletta, A.; Battagliere, M.L. ASI COSMO-SkyMed: Mission overview and data exploitation. IEEE Geosci. Remote Sens. Mag. 2014, 2, 64–66. [Google Scholar] [CrossRef]
- Shimada, M.; Tadono, T.; Rosenqvist, A. Advanced Land Observing Satellite (ALOS) and monitoring global environmental change. Proc. IEEE 2010, 98, 780–799. [Google Scholar] [CrossRef]
- Hwang, J.-I.; Chae, S.-H.; Kim, D.; Jung, H.-S. Application of artificial neural networks to ship detection from X-band Kompsat-5 imagery. Appl. Sci. 2017, 7, 961. [Google Scholar] [CrossRef]
- Everingham, M.; Gool, L.V.; Williams, C.K.I.; Winn, J.; Zisserman, A. The pascal visual object classes (VOC) challenge. Int. J. Comput. Vis. 2010, 88, 303–338. [Google Scholar] [CrossRef] [Green Version]
- Lin, T.-Y.; Maire, M.; Belongie, S.; Hays, J.; Perona, P.; Raman, D.; Zitnick, C.L.; Dollár, P. Microsoft COCO: Common objects in context. In Proceedings of the European Conference on Computer Vision (ECCV), Cham, Germany, 6–12 September 2014; pp. 740–755. [Google Scholar]
- Jiang, Y.; Zhu, X.; Wang, X.; Yang, S.; Li, W.; Wang, H.; Fu, P.; Luo, Z. R2CNN: Rotational region CNN for arbitrarily-oriented scene text detection. In Proceedings of the International Conference on Pattern Recognition (ICPR), Piscataway, NJ, USA, 20–24 August 2018; pp. 3610–3615. [Google Scholar]
- Zhou, X.; Yao, C.; Wen, H.; Wang, Y.; Zhou, S.; He, W.; Liang, J. East: An efficient and accurate scene text detector. In Proceedings of the IEEE Conference on Computer Vision and Pattern Recognition (CVPR), Honolulu, HI, USA, 21–26 July 2017; pp. 2642–2651. [Google Scholar]
- LabelMe. Available online: http://labelme.csail.mit.edu/Release3.0/ (accessed on 25 August 2021).
- Long, J.; Shelhamer, E.; Darrell, T. Fully convolutional networks for semantic segmentation. In Proceedings of the IEEE Conference on Computer Vision and Pattern Recognition (CVPR), Boston, MA, USA, 7–12 June 2015; pp. 3431–3440. [Google Scholar]
- Olaf, R.; Philipp, F.; Thomas, B. U-Net: Convolutional networks for biomedical image segmentation. In Proceedings of the Medical Image Computing and Computer-Assisted Intervention (MICCAI), Munich, Germany, 5–9 October 2015; pp. 234–241. [Google Scholar]
- He, K.; Gkioxari, G.; Dollar, P.; Girshick, R. Mask R-CNN. In Proceedings of the IEEE International Conference on Computer Vision (ICCV), Venice, Italy, 22–29 October 2017; pp. 2980–2988. [Google Scholar]
- Liu, S.; Qi, L.; Qin, H.; Shi, J.; Jia, J. Path aggregation network for instance segmentation. In Proceedings of the IEEE Conference on Computer Vision and Pattern Recognition (CVPR), Salt Lake City, UT, USA, 18–23 June 2018; pp. 8759–8768. [Google Scholar]
- Yang, R.; Wang, R.; Deng, Y.; Jia, X.; Zhang, H. Rethinking the random cropping data augmentation method used in the training of CNN-based SAR image ship detector. Remote Sens. 2021, 13, 34. [Google Scholar] [CrossRef]
- Liu, L.; Ouyang, W.; Wang, X.; Fieguth, P.; Chen, J.; Liu, X.; Pietikäinen, M. Deep learning for generic object detection: A survey. Int. J. Comput. Vis. 2019, 128, 261–318. [Google Scholar] [CrossRef] [Green Version]
- Bochkovskiy, A.; Wang, C.-Y.; Liao, H.-Y.M. YOLOV4: Optimal speed and accuracy of object detection. arXiv 2020, arXiv:2004.10934. [Google Scholar]
- Goodfellow, I.J.; Pouget-Abadie, J.; Mirza, M.; Xu, B.; Warde-Farley, D.; Ozair, S.; Courville, A.; Bengio, Y. Generative adversarial nets. In Proceedings of the International Conference on Neural Information Processing Systems (NIPS), Montreal, QC, Canada, 8–13 December 2014; pp. 2672–2680. [Google Scholar]
- Bodla, N.; Singh, B.; Chellappa, R.; Davis, L.S. Soft-NMS—Improving object detection with one line of code. In Proceedings of the IEEE International Conference on Computer Vision (ICCV), Venice, Italy, 22–29 October 2017; pp. 5562–5570. [Google Scholar]


| No. | Publication Date † | Authors | Title | Journal/Conference †† |
|---|---|---|---|---|
| 1 | 2016-11-03 | C.P. Schwegmann et al. [23] | Very deep learning for ship discrimination in Synthetic Aperture Radar imagery | IEEE International Geoscience and Remote Sensing Symposium (IGARSS) |
| 2 | 2017-06-26 | Liu et al. [24] | SAR ship detection using sea-land segmentation-based convolutional neural network | International Workshop on Remote Sensing with Intelligent Processing (RSIP) |
| 3 | 2017-06-26 | Kang et al. [25] | A modified Faster R-CNN based on CFAR algorithm for SAR ship detection | International Workshop on Remote Sensing with Intelligent Processing (RSIP) |
| 4 | 2017-08-20 | Kang et al. [26] | Contextual region-based convolutional neural network with multilayer fusion for SAR ship detection | Remote Sensing |
| No. | Publication Date † | Authors | Title | Journal/Conference †† |
|---|---|---|---|---|
| 1 | 2017-12-01 | Li et al. [28] | Ship detection in SAR images based on an improved Faster R-CNN | SAR in Big Data Era: Models, Methods and Applications (BIGSARDATA) |
| Sensors | RadarSat-2, TerraSAR-X, Sentinel-1 |
| Polarization | HH, VV, VH, HV |
| Resolution | 1 m–15 m |
| Places | Yantai, China; Visakhapatnam, India |
| Scale | 1:1, 1:2, 2:1 |
| Ship | Different sizes and materials |
| Sea condition | Good and bad conditions |
| Scenes | Inshore and offshore |
| Image number | 1160 |
| Ship number | 2456 |
| These descriptions are in line with the initial presentation of SSDD. | |
| No. | Dataset | Publication Date † | Authors | Title | Journal/Conference/Website †† |
|---|---|---|---|---|---|
| 1 | SSDD | 2017-12-01 | Li et al. [28] | Ship detection in SAR images based on an improved Faster R-CNN | SAR in Big Data Era: Models, Methods and Applications (BIGSARDATA) |
| 2 | SAR-Ship-Dataset 1 | 2019-03-29 | Want et al. [103] | A SAR dataset of ship detection for deep learning under complex backgrounds | Remote Sensing |
| 3 | AIR-SARShip-1.0 2 | 2019-12-01 | Sun et al. [104] | AIR-SARShip-1.0: High-resolution SAR Ship Detection Dataset | Journal of Radars |
| 4 | HRSID 3 | 2020-06-29 | Wei et al. [63] | HRSID: A high-resolution SAR images dataset for ship detection and instance segmentation | IEEE Access |
| 5 | LS-SSDD-v1.0 4 | 2020-09-15 | Zhang et al. [105] | LS-SSDD-v1.0: A deep learning dataset dedicated to small ship detection from large-scale Sentinel-1 SAR images | Remote Sensing |
| 6 | AIR-SARShip-2.0 5 | -- | Sun et al. [106] | -- | http://radars.ie.ac.cn/web/data/getData?dataType=SARDataset_en&pageType=en (accessed on 25 August 2021) |
| No. | Publication Date † | Authors | Title | Journal/Conference †† |
|---|---|---|---|---|
| 1 | 2017-12-01 | Li et al. [28] | Ship detection in SAR images based on an improved Faster R-CNN | SAR in Big Data Era: Models, Methods and Applications (BIGSARDATA) |
| 2 | 2018-03-09 | Chen et al. [29] | Robust single stage detector based on two-stage regression for SAR ship detection | International Conference on Innovation in Artificial Intelligence (ICIAI) |
| 3 | 2018-04-10 | Jiao et al. [30] | A densely connected end-to-end neural network for multiscale and multiscene SAR ship detection | IEEE Access |
| 4 ■ | 2018-08-29 | Wang et al. [31] | Simultaneous ship detection and orientation estimation in SAR images based on attention module and angle regression | Sensors |
| 5 | 2019-03-05 | Liu et al. [32] | Multi-scale proposal generation for ship detection in SAR images | Remote Sensing |
| 6 | 2019-03-05 | Gui et al. [33] | A multilayer fusion light-head detector for SAR ship detection | Sensors |
| 7 | 2019-04-02 | Chang et al. [34] | Ship detection based on YOLOv2 for SAR imagery | Remote Sensing |
| 8 | 2019-05-21 | Zhang et al. [35] | High-speed ship detection in SAR images based on a grid convolutional neural network | Remote Sensing |
| 9 ■ | 2019-06-26 | An et al. [36] | Drbox-v2: An improved detector with rotatable boxes for target detection in SAR images | IEEE Transactions on Geoscience and Remote Sensing |
| 10 | 2019-07-15 | Cui et al. [37] | Dense attention pyramid networks for multi-scale ship detection in SAR images | IEEE Transactions on Geoscience and Remote Sensing |
| 11 | 2019-07-20 | Chen et al. [38] | SAR ship detection under complex background based on attention mechanism | Image and Graphics Technologies and Applications (IGTA) |
| 12 | 2019-07-24 | Chen et al. [39] | A deep neural network based on an attention mechanism for SAR ship detection in multiscale and complex scenarios | IEEE Access |
| 13 | 2019-08-05 | Gui et al. [40] | A scale transfer convolution network for small ship detection in SAR images | IEEE Joint International Information Technology and Artificial Intelligence Conference (ITAIC) |
| 14 | 2019-08-21 | Li et al. [41] | Small targets recognition in SAR ship image based on improved SSD | IEEE International Conference on Signal, Information and Data Processing (ICSIDP) |
| 15 | 2019-09-23 | Zhang et al. [42] | A lightweight feature optimizing network for ship detection in SAR image | IEEE Access |
| 16 | 2019-10-07 | Yang et al. [43] | SAR image target detection and recognition based on deep network | SAR in Big Data Era: Models, Methods and Applications (BIGSARDATA) |
| 17 | 2019-10-24 | Zhang et al. [44] | Depthwise separable convolution neural network for high-speed SAR ship detection | Remote Sensing |
| 18 | 2019-10-24 | Chen et al. [45] | Regional attention-based single shot detector for SAR ship detection | IET International Radar Conference (IRC) |
| 19 ■ | 2019-11-04 | Chen et al. [46] | MSARN: A deep neural network based on an adaptive recalibration mechanism for multiscale and arbitrary-oriented SAR ship detection | IEEE Access |
| 20 | 2019-11-14 | Wang et al. [47] | An improved Faster R-CNN based on MSER decision criterion for SAR image ship detection in harbors | IEEE International Geoscience and Remote Sensing Symposium (IGARSS) |
| 21 | 2019-11-14 | Li et al. [48] | SAR ship detection based on Resnet and transfer learning | IEEE International Geoscience and Remote Sensing Symposium (IGARSS) |
| 22 | 2019-11-14 | Li et al. [49] | Multiscale ship detection based on dense attention pyramid network in SAR images | IEEE International Geoscience and Remote Sensing Symposium (IGARSS) |
| 23 | 2019-11-14 | Liu et al. [50] | Scale-transferrable pyramid network for multi-scale ship detection in SAR images | IEEE International Geoscience and Remote Sensing Symposium (IGARSS) |
| 24 | 2020-01-02 | Wei et al. [51] | Precise and robust ship detection for high-resolution SAR imagery based on HR-SDNet | Remote Sensing |
| 25 ■■ | 2020-03-19 | Su et al. [52] | HQ-ISNet: High-quality instance segmentation for remote sensing imagery | Remote Sensing |
| 26 | 2020-03-30 | Su et al. [53] | Ship detection based on RetinaNet-plus for high-resolution SAR imagery | Asia-Pacific Conference on Synthetic Aperture Radar (APSAR) |
| 27 ■■ | 2020-04-03 | Mao et al. [54] | Efficient low-cost ship detection for SAR imagery based on simplified U-Net | IEEE Access |
| 28 | 2020-04-16 | Zhang et al. [55] | High-speed ship detection in SAR images by improved YOLOv3 | International Computer Conference on Wavelet Active Media Technology and Information Processing (ICCWAMTIP) |
| 29 ■ | 2020-04-20 | Pan et al. [56] | MSR2N: Multi-stage rotational region-based network for arbitrary-oriented ship detection in SAR images | Sensors |
| 30 | 2020-04-22 | Zhang et al. [57] | ShipDeNet-20: An only 20 convolution layers and <1-MB lightweight SAR ship detector | IEEE Geoscience and Remote Sensing Letters |
| 31 | 2020-04-30 | Dai et al. [58] | A novel detector based on convolution neural networks for multiscale SAR ship detection in complex background | Sensors |
| 32 ■ | 2020-05-25 | Yang et al. [59] | A novel false alarm suppression method for CNN-based SAR ship detector | IEEE Geoscience and Remote Sensing Letters |
| 33 | 2020-05-28 | Zhao et al. [60] | Attention receptive pyramid network for ship detection in SAR images | IEEE Journal of Selected Topics in Applied Earth Observations and Remote Sensing |
| 34 | 2020-06-23 | Han et al. [61] | Analysis of detection preference to CNN based SAR ship detectors | Information Communication Technologies Conference (ICTC) |
| 35 ■ | 2020-06-24 | Chen et al. [62] | R2FA-Det: Delving into high-quality rotatable boxes for ship detection in SAR images | Remote Sensing |
| 36 | 2020-06-29 | Wei et al. [63] | HRSID: A high-resolution SAR images dataset for ship detection and instance segmentation | IEEE Access |
| 37 | 2020-07-07 | Fu et al. [64] | An anchor-free method based on feature balancing and refinement network for multiscale ship detection in SAR images | IEEE Transactions on Geoscience and Remote Sensing |
| 38 | 2020-07-21 | Zhang et al. [65] | HyperLi-Net: A hyper-light deep learning network for high-accurate and high-speed ship detection from Synthetic Aperture Radar imagery | ISPRS Journal of Photogrammetry and Remote Sensing |
| 39 | 2020-08-21 | Han et al. [66] | Small ship detection in SAR images based on modified SSD | IEEE International Conference on Signal, Information and Data Processing (ICSIDP) |
| 40 | 2020-08-21 | Han et al. [67] | Asymmetric and square convolutional neural network for SAR ship detection from scratch | International Conference on Biomedical Signal and Image Processing (ICBIP) |
| 41 | 2020-08-31 | Han et al. [68] | Multi-size convolution and deep learning network for SAR ship detection from scratch | IEEE Access |
| 42 | 2020-10-06 | Zhou et al. [69] | Lira-YOLO: A lightweight model for ship detection in radar images | Journal of Systems Engineering and Electronics |
| 43 | 2020-10-14 | Mao et al. [70] | An anchor-free SAR ship detector with only 1.17M parameters | International Conference on Aviation Safety and Information Technology (ICASIT) |
| 44 | 2020-10-14 | Mao et al. [71] | Network slimming method for SAR ship detection based on knowledge distillation | International Conference on Aviation Safety and Information Technology (ICASIT) |
| 45 | 2020-10-30 | Han et al. [72] | Asymmetric convolution-based neural network for SAR ship detection from scratch | International Conference on Computing and Pattern Recognition (ICCPR) |
| 46 | 2020-11-16 | Zhang et al. [73] | Balance scene learning mechanism for offshore and inshore ship detection in SAR images | IEEE Geoscience and Remote Sensing Letters |
| 47 | 2020-12-02 | Li et al. [74] | A lightweight Faster R-CNN for ship detection in SAR images | IEEE Geoscience and Remote Sensing Letters |
| 48 | 2020-12-03 | Zhu et al. [75] | Rapid ship detection in SAR images based on YOLOv3 | International Conference on Communication, Image and Signal Processing (CCISP) |
| 49 | 2020-12-04 | Zhang et al. [76] | Balanced feature pyramid network for ship detection in Synthetic Aperture Radar images | IEEE Radar Conference (RadarConf) |
| 50 | 2020-12-07 | Chen et al. [77] | Learning slimming SAR ship object detector through network pruning and knowledge distillation | IEEE Journal of Selected Topics in Applied Earth Observations and Remote Sensing |
| 51 | 2020-12-28 | Guo et al. [78] | A Centernet++ model for ship detection in SAR images | Pattern Recognition |
| 52 ■ | 2021-01-08 | Yang et al. [79] | A novel CNN-based detector for ship detection based on rotatable bounding box in SAR images | IEEE Journal of Selected Topics in Applied Earth Observations and Remote Sensing |
| 53 ■ | 2021-02-03 | An et al. [80] | Transitive transfer learning-based anchor free rotatable detector for SAR target detection with few samples | IEEE Access |
| 54 | 2021-02-03 | Zhao et al. [81] | A dense connection based SAR ship detection network | IEEE Joint International Information Technology and Artificial Intelligence Conference (ITAIC) |
| 55 | 2021-02-03 | Mao et al. [82] | Ship detection for SAR imagery based on deep learning: A benchmark | IEEE Joint International Information Technology and Artificial Intelligence Conference (ITAIC) |
| 56 | 2021-02-12 | Wang et al. [83] | Soft thresholding attention network for adaptive feature denoising in SAR ship detection | IEEE Access |
| 57 | 2021-02-17 | Hou et al. [84] | SAR image ship detection based on scene interpretation | IEEE International Geoscience and Remote Sensing Symposium (IGARSS) |
| 58 | 2021-02-17 | Zhang et al. [85] | ShipDeNet-18: An only 1 MB with only 18 convolution layers light-weight deep learning network for SAR ship detection | IEEE International Geoscience and Remote Sensing Symposium (IGARSS) |
| 59 | 2021-03-01 | Kun et al. [86] | SAR image ship detection based on deep learning | International Conference on Computer Engineering and Intelligent Control (ICCEIC) |
| 60 | 2021-03-01 | Anil Raj et al. [87] | A novel ship detection method from SAR image with reduced false alarm | International Conference on Computational Intelligence and Energy Advancements (ICCIEA) |
| 61 | 2021-03-11 | Li et al. [88] | A novel multidimensional domain deep learning network for SAR ship detection | IEEE Transactions on Geoscience and Remote Sensing |
| 62 | 2021-03-17 | Jin et al. [89] | An approach on image processing of deep learning based on improved SSD | Symmetry |
| 63 | 2021-03-23 | Chen et al. [90] | End-to-end ship detection in SAR images for complex scenes based on deep CNNs | Journal of Sensors |
| 64 ■ | 2021-03-24 | He et al. [91] | Learning polar encodings for arbitrary-oriented ship detection in SAR images | IEEE Journal of Selected Topics in Applied Earth Observations and Remote Sensing |
| 65 | 2021-03-31 | Tian et al. [92] | Image enhancement driven by object characteristics and dense feature reuse network for ship target detection in remote sensing imagery | Remote Sensing |
| 66 | 2021-04-05 | Li et al. [93] | SAR image nearshore ship target detection in complex environment | IEEE Advanced Information Technology, Electronic and Automation Control Conference (IAEAC) |
| 67 | 2021-04-27 | Zhao et al. [94] | Ship detection from scratch in Synthetic Aperture Radar (SAR) images | International Journal of Remote Sensing |
| 68 | 2021-05-13 | Jiang et al. [95] | High-speed lightweight ship detection algorithm based on YOLO-v4 for three-channels RGB SAR image | Remote Sensing |
| 69 | 2021-06-09 | Zhu et al. [96] | An effective ship detection method based on RefineDet in SAR images | International Conference on Communications, Information System and Computer Engineering (CISCE) |
| 70 | 2021-06-30 | Yu et al. [97] | TWC-Net: A SAR ship detection using two-way convolution and multiscale feature mapping | Remote Sensing |
| 71 ■■ | 2021-06-30 | Sun et al. [98] | Semantic attention-based network for inshore SAR ship detection | International Conference on Digital Image Processing (ICDIP) |
| 72 ■■ | 2021-07-01 | Wu et al. [99] | A deep detection network based on interaction of instance segmentation and object detection for SAR images | Remote Sensing |
| 73 | 2021-07-13 | Sun et al. [100] | DSDet: A lightweight, densely connected sparsely activated detector for ship target detection in high-resolution SAR images | Remote Sensing |
| 74 | 2021-07-14 | Zhang et al. [101] | Quad-FPN: A novel quad feature pyramid network for SAR ship detection | Remote Sensing |
| 75 | 2021-07-26 | Sun et al. [102] | An anchor-free detection method for ship targets in high-resolution SAR images | IEEE Journal of Selected Topics in Applied Earth Observations and Remote Sensing |
| Training Set | Test Set | |
|---|---|---|
| Image file name | * 0.jpg, * 2.jpg, * 3.jpg, * 4.jpg, * 5.jpg, * 6.jpg, * 7.jpg, * 8.jpg, | * 1.jpg, * 9.jpg |
| Number | 928 | 232 |
| Training-test ratio | 8:2 | |
| Label Type | Small | Medium | Large |
|---|---|---|---|
| BBox-SSDD | Area < 1000 | 1000 <= Area <= 8000 | Area > 8000 |
| RBox-SSDD | Area < 625 | 625 <= Area <= 7500 | Area > 7500 |
| PSeg-SSDD | Area < 625 | 625 <= Area <= 6875 | Area > 6875 |
Publisher’s Note: MDPI stays neutral with regard to jurisdictional claims in published maps and institutional affiliations. |
© 2021 by the authors. Licensee MDPI, Basel, Switzerland. This article is an open access article distributed under the terms and conditions of the Creative Commons Attribution (CC BY) license (https://creativecommons.org/licenses/by/4.0/).
Share and Cite
Zhang, T.; Zhang, X.; Li, J.; Xu, X.; Wang, B.; Zhan, X.; Xu, Y.; Ke, X.; Zeng, T.; Su, H.; et al. SAR Ship Detection Dataset (SSDD): Official Release and Comprehensive Data Analysis. Remote Sens. 2021, 13, 3690. https://doi.org/10.3390/rs13183690
Zhang T, Zhang X, Li J, Xu X, Wang B, Zhan X, Xu Y, Ke X, Zeng T, Su H, et al. SAR Ship Detection Dataset (SSDD): Official Release and Comprehensive Data Analysis. Remote Sensing. 2021; 13(18):3690. https://doi.org/10.3390/rs13183690
Chicago/Turabian StyleZhang, Tianwen, Xiaoling Zhang, Jianwei Li, Xiaowo Xu, Baoyou Wang, Xu Zhan, Yanqin Xu, Xiao Ke, Tianjiao Zeng, Hao Su, and et al. 2021. "SAR Ship Detection Dataset (SSDD): Official Release and Comprehensive Data Analysis" Remote Sensing 13, no. 18: 3690. https://doi.org/10.3390/rs13183690
APA StyleZhang, T., Zhang, X., Li, J., Xu, X., Wang, B., Zhan, X., Xu, Y., Ke, X., Zeng, T., Su, H., Ahmad, I., Pan, D., Liu, C., Zhou, Y., Shi, J., & Wei, S. (2021). SAR Ship Detection Dataset (SSDD): Official Release and Comprehensive Data Analysis. Remote Sensing, 13(18), 3690. https://doi.org/10.3390/rs13183690