Abstract
Open burning is often used to remove crop residue during the harvest season. Despite a series of regulations by the Chinese government, the open burning of crop residue still frequently occurs in China, and the monitoring and forecasting crop fires have become a topic of active research. In this paper, crop fires in Northeastern China were forecasted using an artificial neural network (ANN) based on moderate-resolution imaging spectroradiometer (MODIS) satellite fire data from 2013–2020. Both natural factors (meteorological, soil moisture content, harvest date) and anthropogenic factors were considered. The model’s forecasting accuracy under natural factors reached 77.01% during 2013–2017. When considering the influence of anthropogenic management and control policies, such as the straw open burning prohibition areas in Jilin Province, the accuracy of the forecast results for 2020 was reduced to 60%. Although the forecasting accuracy was lower than for natural factors, the relative error between the observed fire points and the back propagation neural network (BPNN) forecasting results was acceptable. In terms of influencing factors, air pressure, the change in soil moisture content in a 24 h period and the daily soil moisture content were significantly correlated with open burning. The results of this study improve our ability to forecast agricultural fires and provide a scientific framework for regional prevention and control of crop residue burning.
1. Introduction
Open field combustion is a widely used approach to eliminate crop residue from agricultural land. The burning of crop residue emits carbon dioxide, carbon monoxide, nitric oxide, nitrous oxide and particulate material into the atmosphere [1], resulting in regional haze and environmental pollution. In addition, when these pollutants are in high concentrations, they will affect climate change and pose a great challenge for regional air quality, potentially leading to an increase in the rate of human cardiovascular and respiratory diseases [2,3]. With the rapid industrialization and modernization in China, fossil fuel consumption in rural regions has increased, and domestic biofuel usage has decreased; until 2018, the demand for fossil fuels accounted for 80% of all energy [4]. Combustion is a simple, convenient and effective way to remove crop residue and to prepare the land before planting crops for the next season, meaning that open burning is common during the harvest season. To reduce the effects of crop residue burning on the atmosphere and human health, the Chinese government has implemented regulations to prohibit field burning and to promote constructive alternatives for using the crop residue in energy production, soil amendments, and animal feed [5]. Despite these prohibitive laws, the changes have not been widely adopted by farmers [6]. Therefore, there is a growing emphasis on developing methods to accurately forecast the burning of crop residue.
If the spatial distribution of open burning can be forecast quickly, accurately and at a low cost, forecasting methods could play a vital role in managing crop residue burning and air quality protection. At present, the monitoring of crop residue open burning in China is mainly based on satellite remote sensing data. However, the on-site inspection based on near real-time fire points extracted from remote sensing images has a lag time, which limits the prevention and control of crop residue burning [7]. In recent years, the policies controlling crop residue open burning in Northeastern China have constantly been changing. Since 2018, the Ecology and Environment Department of Jilin Province has implemented the environmental regulation of the Straw Open Burning Prohibition Plan across the province. The plan contains a series of control measures for the open field burning of straw, including the demarcation of areas where crop residue fires are banned (called Straw Open Burning Prohibition Areas) and areas where fires are limited (called Straw Open Burning Limit Areas) [8,9]. These human-activity-related factors have become a major challenge for forecasting crop residue fire points.
Limited research has been carried out on the forecasting of crop residue burning due to the unpredictable and non-linear relationship between natural and anthropogenic factors. Previous studies have mainly focused on forecasting and research related to forest fires and fire risks [10,11,12,13]. How to accurately quantify the non-linearity is a major difficulty associated with crop residue fire forecasting [14]. Machine-learning techniques (MLTs), such as artificial neural network (ANN) models, can substantially improve our understanding of fire point probability [15,16] because the robust behavior of a neural network makes it adaptable to non-linear environmental models [17]. ANN models are based on simulation mechanisms of the human brain and have been in development for over 50 years. In recent years, ANN methods have been widely applied in pattern recognition and in modeling complex relationships [14,18]. Many types of neural networks have been developed, including the back propagation neural network (BPNN), radial basis function neural network and linear neural network. Among these methods, the internal structure of the BPNN is the simplest, meaning that when large-scale data are processed, errors in single data points have a small impact on the overall forecasting result [19]. Due to this advantage, BPNN methods have been used to conduct research on many topics, such as physics, medical care, atmospheric pollutant concentrations and the forecasting of forest fires [10,20,21,22]. For example, Xu F [23] used a BPNN model to forecast the number of crop residue fire points across Southern China in 2018, achieving correlation coefficients with MODIS satellite data of 0.6–0.8. However, precisely forecasting when and where a fire may start has not yet been explored, especially in environments affected by complex anthropogenic and natural factors. Furthermore, there is currently no research on fire forecasting in Northeastern China, despite this region being important for grain production in China.
To fill these gaps, we developed a BPNN model to estimate the probability of crop residue fire occurrences in Northeastern China. We investigated methods of forecasting the spatial distribution of crop residue fires using satellite remote sensing data from Northeastern China from 2013–2020, and proposed a hypothesis: if the final forecasting accuracy can reach more than 60%, then this model is acceptable. This study is one of the first to consider the influence of human factors to better understand and forecast fire probability.
2. Study Area and Methodology
2.1. Study Area
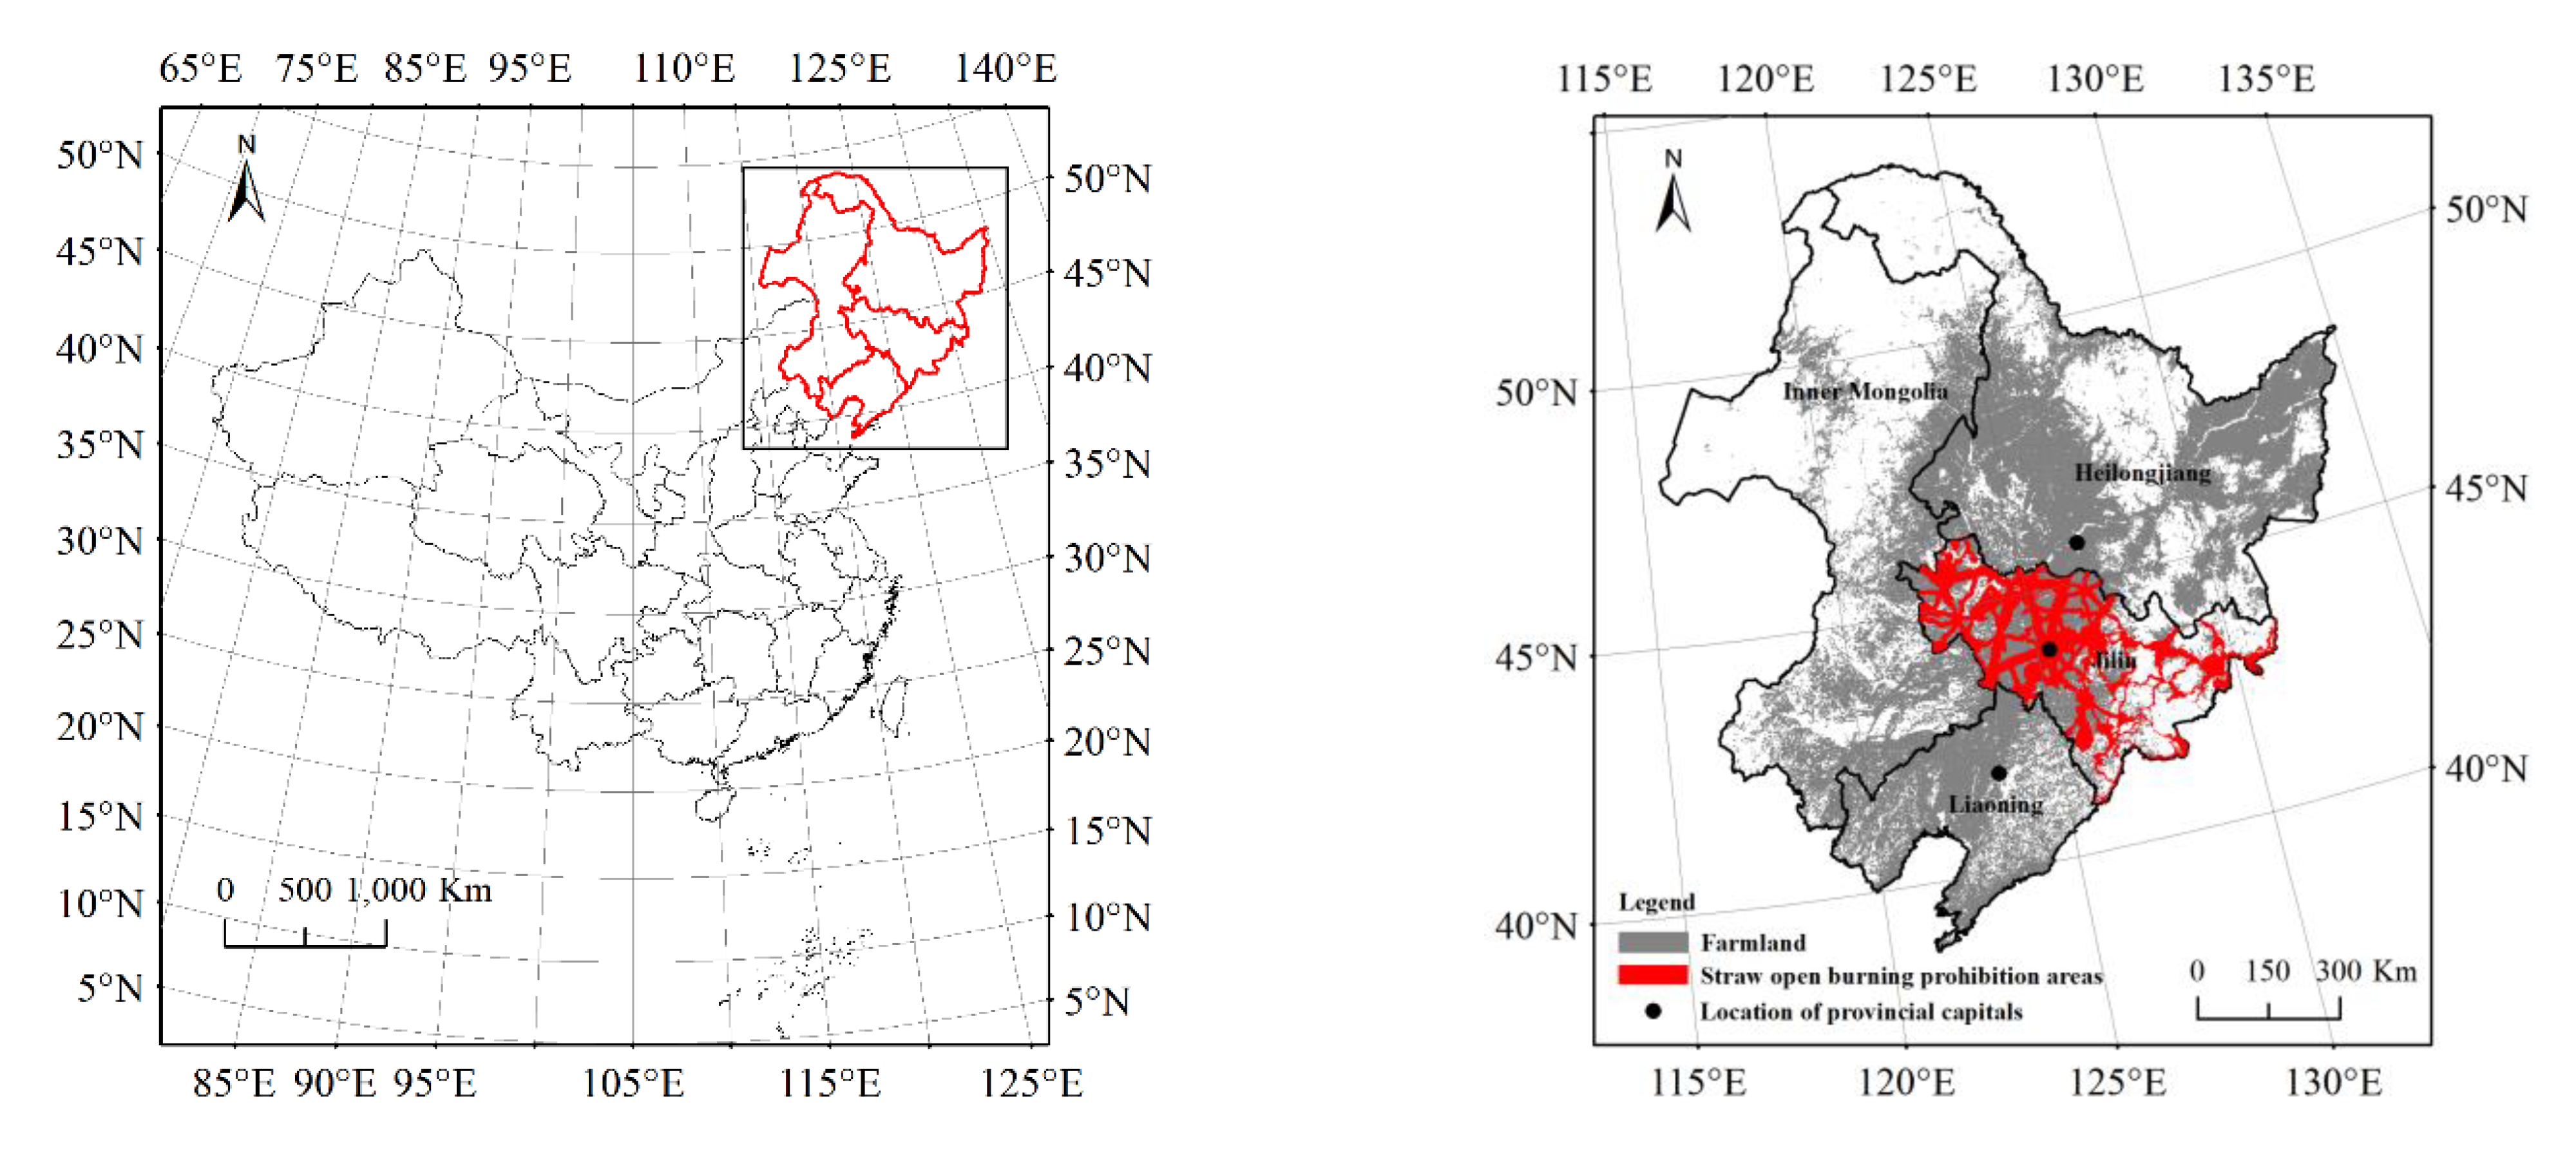
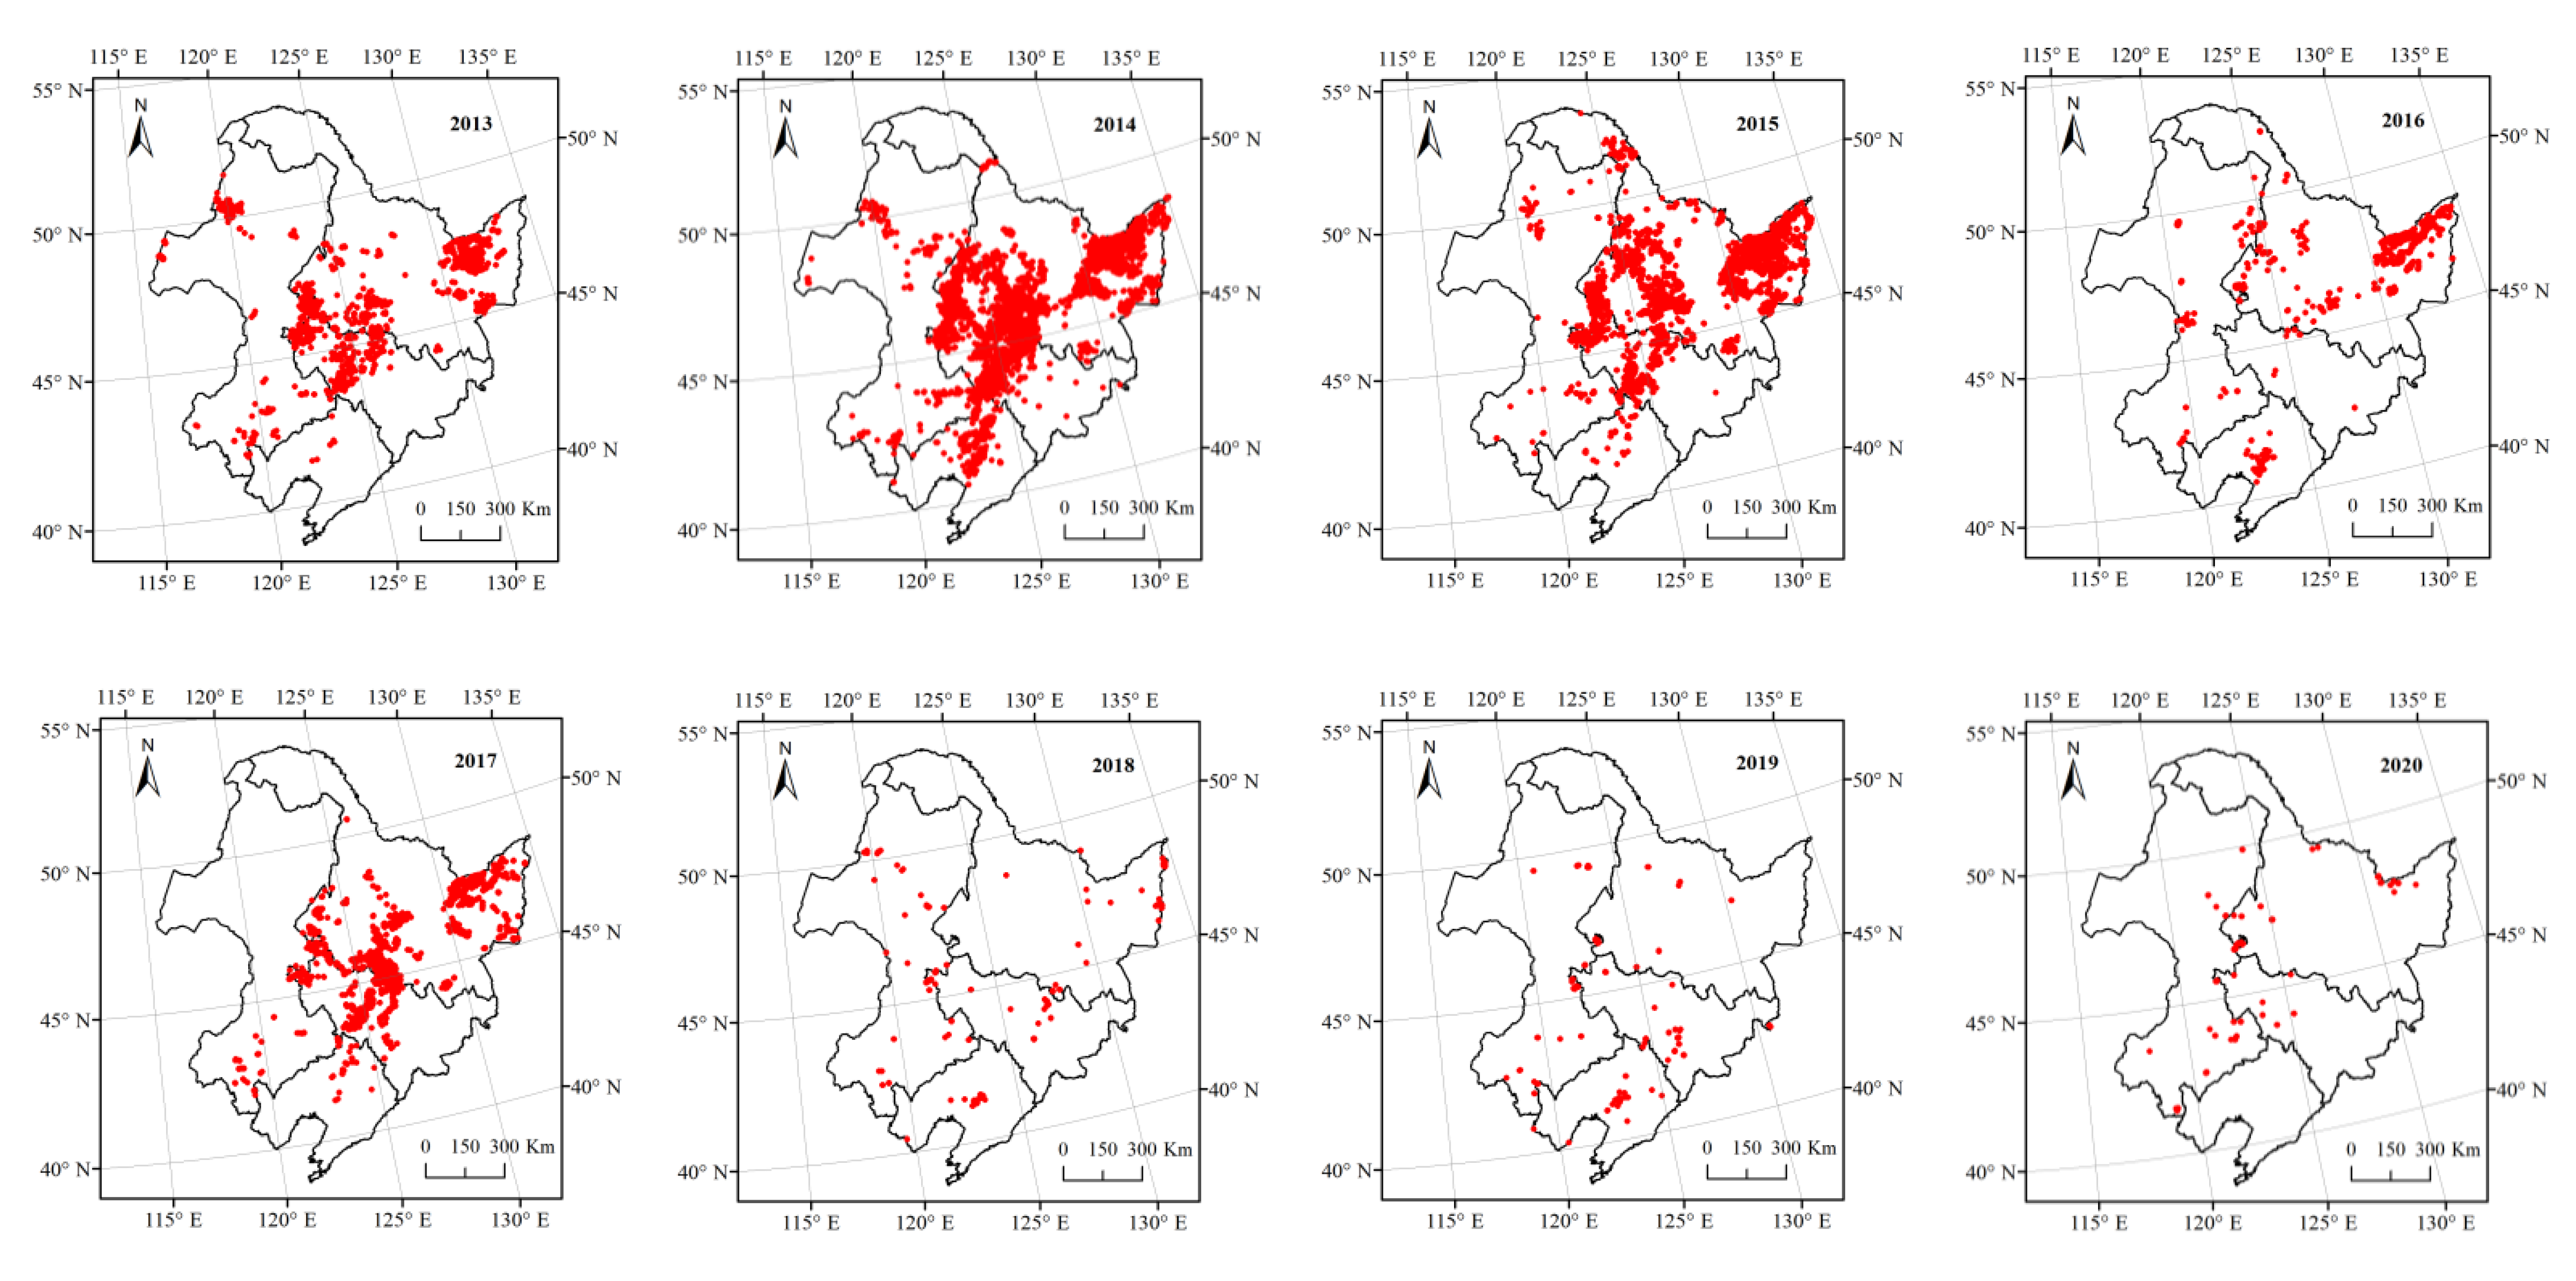
Northeastern China is located between 38°42′–53°35′ N and 115°32′–135°09′ E, covering an area of 1,240,000 km2 and with an elevation ranging from 55 to 8250 m. The administrative divisions comprise eastern Inner Mongolia, Liaoning, Jilin and Heilongjiang provinces (Figure 1). Most of this region has a temperate, humid or semi-humid continental monsoon climate, with annual average temperatures between −1.3 and 6.6 ℃ and annual total precipitation between 500 and 1000 mm [24,25]. Northeastern China is rich in fertile black soil resources, and the agricultural area encompasses approximately 40,000 km2, planted with a large number of commercial grains and representing an important region for grain production [26]. The main crops grown in Northeast China are rice, corn, soybeans and wheat, which have growing periods of one year, with sowing in spring and harvesting in autumn. The annual straw output from Northeastern China was 160 million tons in 2015. This output represents 20% of the total straw produced in China, and the overall utilization ratio (80%) is lower than the national average (83%) [27]. Therefore, the open burning of crop residue frequently occurs in Northeast China during the harvest season. The field fire points in Heilongjiang, Jilin and Liaoning provinces accounted for 57.37% of fire points across the whole country from 2014 to 2018 [28]. In recent years, the policies for the control of crop residue burning in Northeastern China have changed frequently. In 2013, the Chinese government announced the “Air Pollution Prevention and Control Action Plan”, where farmers were encouraged to return crop residue to agricultural soil as a fertilizer. From 2018, Jilin Province began to prohibit field burning in specific areas, which reduced the magnitude of field burning. Straw Open Burning Prohibition Areas are mainly located around cities, expressways, railways, national and provincial arterial roads and airports. Consequently, the spatiotemporal distribution of crop residue burning has also changed (Figure 2).
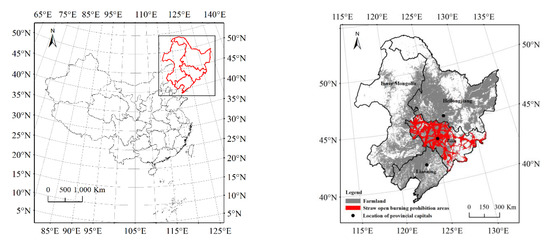
Figure 1.
The location of Northeastern China (left) and the provinces (eastern Inner Mongolia, Liaoning, Jilin and Heilongjiang) mentioned in this study (right).
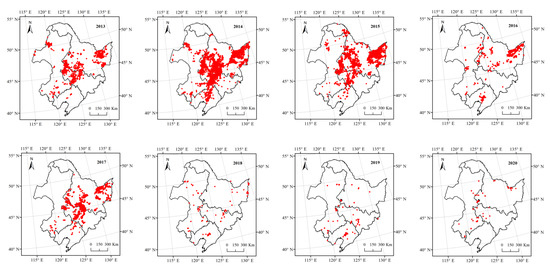
Figure 2.
Spatial distribution of fire points in Northeastern China by MODIS observations from 2013–2020.
2.2. Research Data
2.2.1. Fire Data
The daily fire location data were downloaded from the Global Monthly Fire Location Product (MCD64A1, Collection 6) [29] during the months of October and November for the years 2013–2020. The data were observed by the MODIS instruments onboard the Terra and Aqua satellites, with a spatial resolution of 1 km × 1 km. There are many monitoring satellites for fire point data, but MODIS is currently the most widely used. MODIS data are easy to obtain and process, the spectral range is relatively wide, and it can observe the Earth’s surface twice per day. The data include the date and the longitude and latitude of fire points. Data files are provided in HDF format, and daily fire points were obtained using image extraction in ArcGIS.
2.2.2. Meteorological Data
Daily surface meteorological data for October and November during 2013–2020 were obtained from the China Meteorological Data Network [30]. Daily average air temperature (TEM), daily relative humidity (PHU), daily average air pressure (PRS), 24 h cumulative rainfall (PRE) and daily average wind speed (WIN) were selected. For particular meteorological stations in Northeastern China, we used ArcGIS to extract station information to facilitate the compatibility with other domestic and foreign air quality models. The meteorological data were interpolated using the ordinary kriging method by ArcGIS, with a spatial resolution of 3 km × 3 km, and the semivariogram model is circular.
2.2.3. Soil Moisture Data
The surface soil moisture data (volumetric absolute values) from 2013–2019 were sourced from the soil moisture project of the European Space Agency’s (ESA) Climate Change Initiative (CCI) [31]. The latest product is the ESA CCI SM v06.1, which consists of three surface soil moisture data sets: the active product, passive product and combined product. The active product and the passive product were created by fusing scatterometer and radiometer soil moisture products, and the combined product is a blended product based on the former two datasets [32]. We selected the combined product, which contains daily global surface soil moisture datasets with a spatial resolution of 0.25°. Data files were provided in NetCDF-4 classic format, and the units were m3m−3. Soil moisture data were interpolated using the ordinary kriging method by ArcGIS, with a spatial resolution of 3 km × 3 km, and the semivariogram model is circular.
2.2.4. Harvest Date
In Northeastern China, the harvest date of dry fields is different to that of paddy fields. Usually, seven days after harvesting, the crop residue are dry enough to burn, and open burning would occur. Harvest date information from 2013–2020 was sourced from the center for sustainability and the global environment at the University of Wisconsin-Madison [33]. Data files were provided in NetCDF-4 format and contain global merged surface soil moisture datasets at 5’ × 5’ resolution. We collected paddy field and dry field crop harvest end dates from Northeastern China. Dry fields are harvested on 11 October each year, and paddy fields are harvested on 20 October each year. Consequently, adopting a consistent time period from 11 October to 15 November for analysis could impair the accuracy of forecasts for paddy fields. Therefore, we calculated the data corresponding to each grid cell using the ordinary kriging method by ArcGIS, such that crop harvest information for every latitude and longitude was obtained. Considering that fires mainly occur from 1 November to 10 November, the dates from 11 October to 15 November were selected as the study period.
2.2.5. Anthropogenic Management and Control Policy
Human activity is another major factor affecting open burning crop residue. To reduce open straw burning, Jilin Province implemented environmental regulations across the entire province in its Straw Open Burning Prohibition Plan. The division information of burning-prohibited areas in Jilin Province was obtained from the People’s Government of Jilin Province. The data file was provided in vector format, and the anti-burning information per kilometer was obtained using the convert to points feature in ArcGIS. We then linked these data with information about the farmland in Northeast China so that each neural grid contained information on whether the open burning of crops was prohibited. The straw open burning areas were defined according to the current legislation, and the fire points of every straw open burning prohibition area were set to 0.
2.3. Back Propagation Neural Networks (BPNN)
2.3.1. Construction of BPNN Model
SPSS Modeler14.1 was used in this study to build the neural network. The training and verification of the methods were conducted using the total fire history database, and these data were applied to the neural network for each index variable (Table 1) [17]. Because the farmland in Northeastern China can be divided into 78,694 units with a spatial resolution of 3 km × 3 km, we constructed a BPNN ensemble of 78,694 members to parameterize the relationships between agricultural fire points and environmental variables. A neural network consists of an input layer, a hidden layer and an output layer [23,34]. In this study, the input layer was the environmental data (including meteorological, soil moisture content, the harvest date and anthropogenic management and control policy data), and the output layer was the occurrence of fire. As there was only one output neuron, the output result was either 0 or 1, where a value of 0 represents no fire, and a value of 1 represents a fire.

Table 1.
Information about the training and verification of forecasting samples in the two scenarios of this study (WIN: average daily wind speed; PRE: 24 h cumulative rainfall; TEM: average daily air temperature; PRS: average daily air pressure; PHU: average daily relative humidity; SOIL: daily soil moisture content; D2-D1: change in soil moisture content within a 24 h period).
The forecasting of the open burning of crop residue using a BPNN consists of three stages: training, verification and testing. When training samples, grid values are presented to the neural network, with batch learning calibrated to known fire points in each input layer. Consequently, training is one of the most important steps in developing BPNN models. Neural network training aims to structure a model of the data so that in the testing stage, the model can generalize and predict results from inputs it has not seen before. By training BPNN members, we sought to minimize the computational cost, so this process is repeated iteratively until: (1) the maximum number of pre-specified iterations was reached, (2) the model performance met a suitable level, and (3) the gradient was below a suitable target. These parameters must be determined experimentally [10,23,34]. Through trial and error, the hidden layer was set to a single layer with fifteen neurons and 200 iterations. We found this was the simplest structure that served our needs and could produce accurate outputs. In this neural network model, we used the ordinary least squares to calculate the residual sum of squares as the loss function [35].
2.3.2. Statistical Analysis and Model Evaluation
Considering the neural network training accuracy and efficiency, the input data were normalized as follows [11,14]:
where Xi are the original data, Xmin is the minimum value of the data, Xmax is the maximum value of the data, and X represents the normalized input value.
In order to evaluate the forecasting accuracy, four different cases are considered in this paper: (TP) both the forecast and the observations indicate burning, (TN) both the forecast and the observations indicate no burning, (FN) the observations indicate burning, but the forecast indicates no burning, and (FP) the observations indicate no burning, but the forecast indicates burning. In cases TP and TN the BPNN ensemble correctly forecasted fire occurrences, whereas in FN and FP there were situations where the forecast was wrong. The accuracy is calculated by comparing the model’s forecasted value (the forecast results from BPNN) for each case to the case’s generated (fire points observed by MODIS) outcome, the formula for calculation is as follows:
where ncurrect is the correctly forecasted fire points, nsample is the total sample size, and Paccuracy represents the accuracy of this forecasting.
A Receiver Operating Characteristic Curve (ROC curve) was constructed for the BPNN model for sensitivity and specificity assessment. The ROC curves were plotted by a true signal (sensitivity) and a false signal (1-specificity). Furthermore, the areas under ROC curves (AUC) were calculated. An AUC value of 0.5 means no ability to forecasting, while a value less than 0.60 indicates poor forecasting, a value between 0.60 and 0.75 reflects a possibly helpful forecasting, and a value of more than 0.75 is considered very good [36].
2.4. Crop Residue Burning Forecasting Scenarios
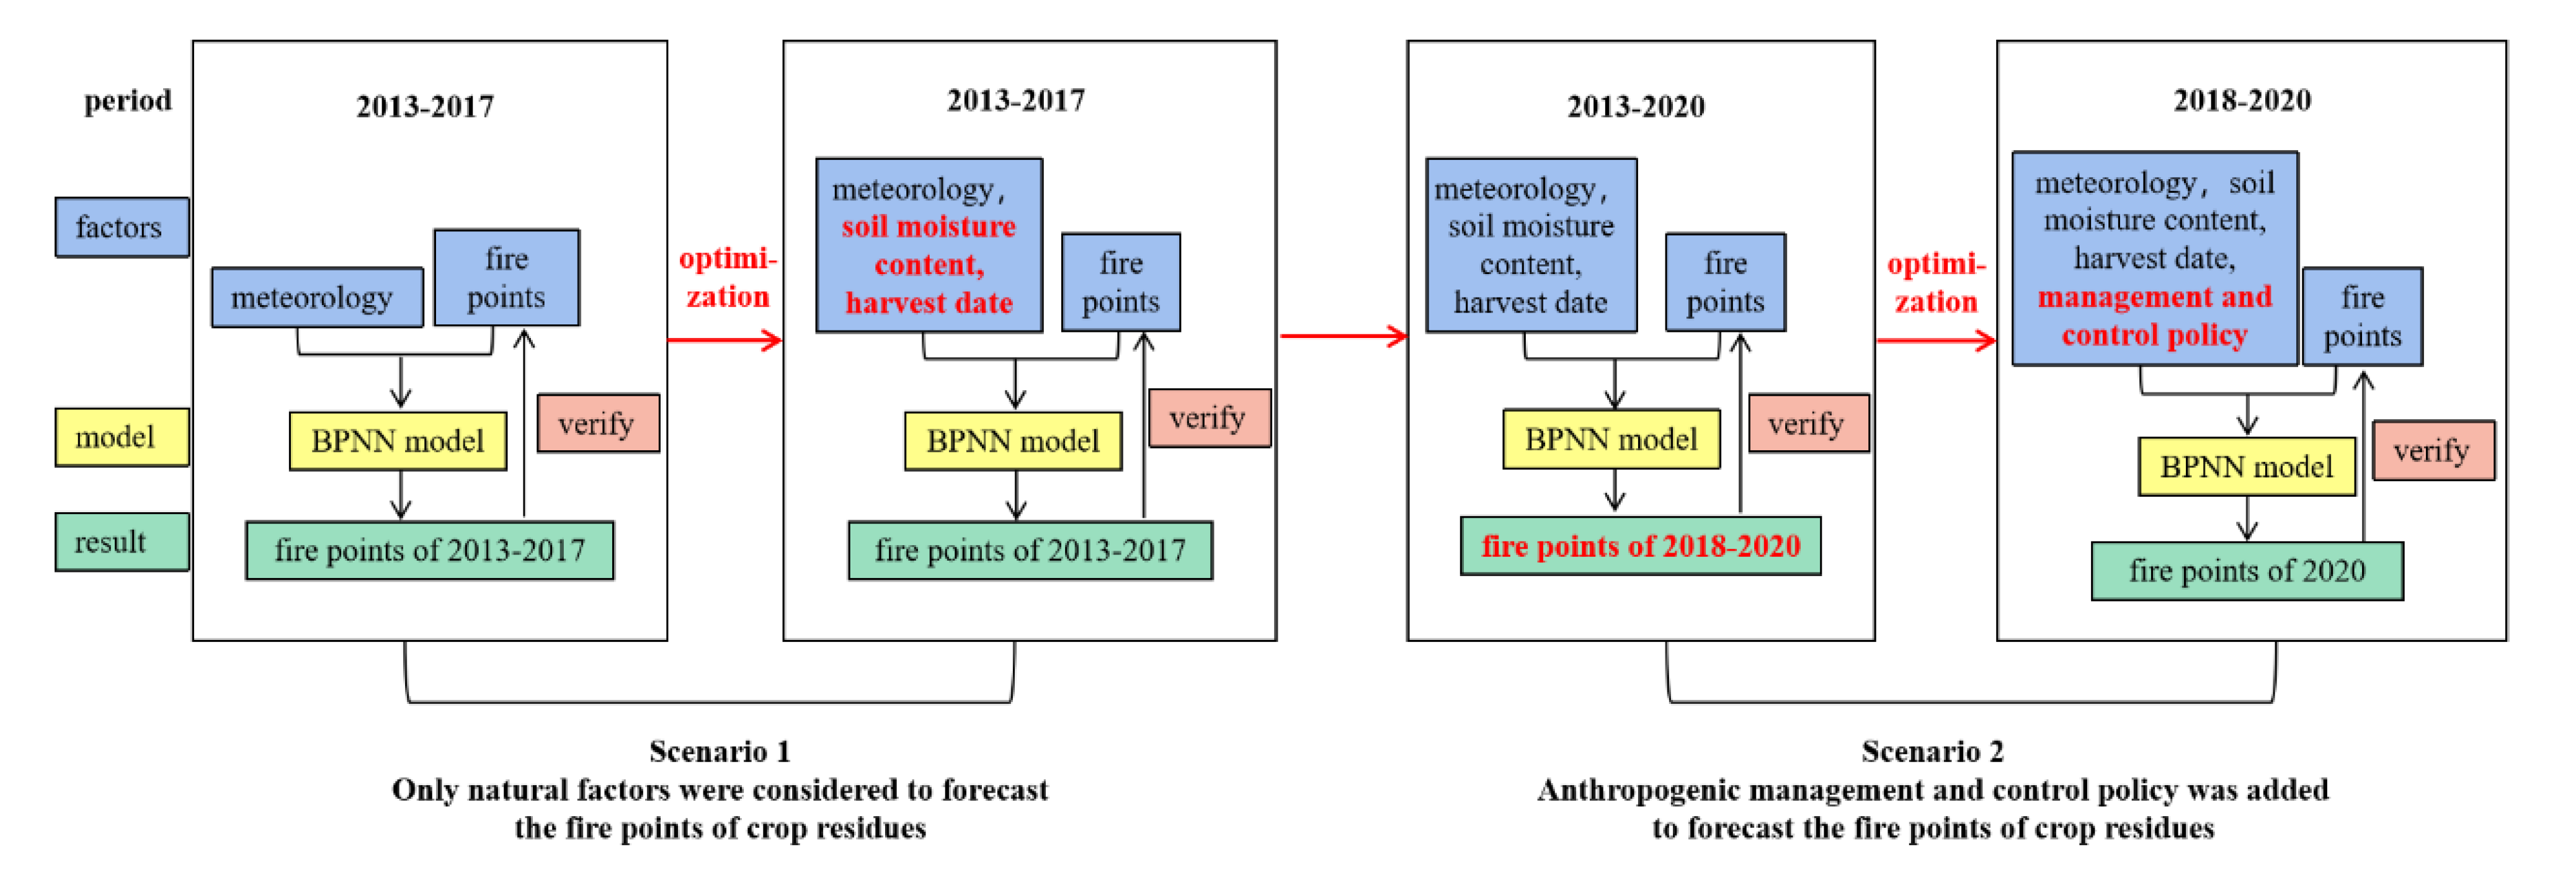
As variable policies and effect factors for crop residue open burning were conducted in different years during the study period, two crop residue burning scenarios were defined in this study. In the first scenario, only natural factors were considered to forecast the fire points of crop residue. Firstly, 80% of the 2013–2017 fire points and five meteorological factors were selected randomly for modeling, and the remaining 20% data for validation, as some other natural factors, such as soil moisture content and harvesting time, also have impact on crop residue open field burning. Then, the soil moisture content and the harvest date were added to optimize the model. In the second scenario, the crop residue fire points of 2018–2020 were forecasted with the optimized model firstly. However, Jilin Province began to prohibit field burning in specific areas since 2018. Then, the anthropogenic management and control policies (i.e., the straw open burning prohibition areas) were added to forecast the fire points of crop residue. The fire points of 2018–2019 were selected for modeling, and the fire points of 2020 were selected for validation, so the model was further optimized again. A research flow chart is shown in Figure 3, and detailed information is included in Table 1.

Figure 3.
Research flow chart showing the BPNN methods used in this study.
3. Results
3.1. Using Natural Factors to Forecast the Crop Residue Fire Points (Scenario 1)
3.1.1. Preliminary Construction of a Forecasting Model in Northeastern China
Based on previous forecasting research on the Songnen Plain, in China [37], we took five meteorological factors as the input neurons and used fire point data from 2013–2017 for modeling and verification. One problem that often arises with neural networks is overfitting, but this can be avoided by controlling the network error on the training set [14,38]. Moreover, in order to improve the robustness and stability of results and to reduce bias, by setting 10 kinds of different numbers of modeling and verification data combinations, the result indicated that when the ratio of modeling and verification was 8:2, the accuracy of model forecasting was the highest and the model constructed by the neural network forecasting was stable and feasible [37]. To avoid overfitting and to optimize the accuracy of the forecasting results, we randomly selected 80% of the daily data to train the model and reserved the remaining 20% of the data for validation. The accuracy of the model was quantified as 66.17%, with the results shown in Table 2.
Table 2.
Comparison of the results of the BPNN in forecasting fire points over Northeastern China from 2013–2017, when considering five meteorological variables (Scenario 1); (TP) both the forecast and the observations indicate burning, (TN) both the forecast and the observations indicate no burning, (FN) the observations indicate burning, but the forecast indicates no burning, and (FP) the observations indicate no burning, but the forecast indicates burning.
The overall accuracy of the verification was 73.67%. The verification proportion of case TP was 43.35%, and the proportion of case TN was 30.32%. This result for Northeastern China shows greater accuracy than the previous forecasting for the Songnen Plain in China (69.1%), and used more training data (38856) than was used for the Songnen Plain (32642) [37]. This comparison suggests that, within a certain sample range, the larger the amount of training data, the better the learning performance of the neural network. This statement is consistent with the previous view of other scholars [23]. The results also reveal that the forecasting of the spatial variability of crop residue open burning based on BPNN can be applied to other source regions. In addition, as long the model is given a sufficiently large training dataset, the BPNN can potentially learn to forecast fires based on meteorological conditions. The BPNN may have even greater potential than satellite-based fire observations in representing fire activities, because satellite instruments cannot detect surface fires obscured by clouds [23].
3.1.2. Optimization of the Forecasting Model in Northeastern China
Five meteorological factors were used as the input neurons in the preliminary construction of the forecasting model for fires in Northeastern China. Compared with the actual influencing factors, these selected input factors are relatively simple, and additional factors such as the soil moisture content and the harvest date also affect crop residue burning. In the optimized model, the daily soil moisture content data (SOIL), the change in soil moisture content within a 24 h period (D2-D1), the harvest date and meteorological data from 2013–2017 were selected as the input data. The optimized model results are shown in Table 3.
Table 3.
The results of BPNN ensembles in forecasting fire points over Northeastern China in 2013–2017 using the optimized model for Scenario 1.
After adding these additional input variables, the accuracies of the model and verification were 69.02% and 77.01%, respectively, showing improvements relative to the preliminary model. The importance of the input factors, as calculated by the SPSS Modeler14.1, decreased in the order PRS, D2-D1, SOIL, PHU, WIN, TEM, PRE. The soil moisture content was strongly correlated with the open burning of crops. These results indicate that the accuracy of forecasting crop fires could be improved by adding SOIL, D2-D1 and harvest date variables. However, the forecasting results were still lower than those reported in the previous literature using a neural network to forecast forest fires [10,11,39]. A key reason for these differences is that forest fires are dominated by natural factors and have a high correlation with meteorological data, whereas crops residue burning is affected by human activities in addition to meteorological conditions.
3.2. Considering Anthropogenic Management and Control Policy to Forecast Fire Points (Scenario 2)
3.2.1. Using Natural Factors to Forecast Fire Points after the Implementation of Management and Control Policies
Jilin Province has prohibited the open burning of straw in certain areas since 2018. To explore whether only natural factors can be used to forecast crop residue fire points after these management and control policies were established, we continued to use the model developed in Section 3.1.2 to forecast fires in Northeastern China from 2018 to 2020. The number of fire points was 178 during this period, and an additional 178 no-fire points were randomly selected as the forecasting dataset. The results from these tests are shown in Table 4.
Table 4.
Results of the BPNN in forecasting fire points over Northeastern China during 2018–2020 using the model developed in Section 3.1.2.
The forecasting accuracy of results was 52.48%, which is lower than the result for 2013–2017 (77.01%). As shown in Table 4, the number of fire points forecast by the BPNN was less than the observed value. The proportion of case TN was higher than the proportion of case TP when the forecasting was correct. The significant reduction in accuracy after anthropogenic management and control policies were implemented suggests that only including natural factors in the model was insufficient to forecast crop residue fires. Furthermore, the proportion of training to forecasting samples approached 99:1, which potentially adds to the inaccuracy of the neural network, as the proportion can affect the output results.
3.2.2. Adding Anthropogenic Management and Control Policies to Build the BPNN Model
To account for the influence of the burning ban policy and to minimize inaccuracies in the model output, we conducted a forecasting scenario using the crop residue fire points from 2018–2020. In this scenario, eight natural factors (five meteorological variables, two soil moisture content variables and the harvest date) and anthropogenic management and control policy data (the straw open burning prohibition areas of Jilin Province) were included as input variables. Fire point data from 2018–2019 in Northeastern China were selected to build the model, and data from 2020 were used for forecasting. The sample sizes used in the training and forecasting datasets were 248 and 125, respectively. After 20 trainings, the accuracy of the best model reached 91.08%, which was far higher than previous versions. These findings show that the integration of anthropogenic management and control policy variables enabled the production of an accurate model to forecast crop residue burning in Northeastern China. The forecasting results are shown in Table 5, with an overall forecasting accuracy of 60%. Compared with the results presented in Section 3.2.1, the accuracy was significantly higher after adjusting the number of samples. Although the forecasting accuracy after adding the straw burning prohibition areas was lower than only selecting natural factors, the relative error between observed fire points and the forecast produced by the BPNN was acceptable.
Table 5.
Results of the BPNN in forecasting fire points over Northeastern China in 2020 after adding anthropogenic management and control policy factors.
3.3. Importance of Factors Affecting Combustion
To further understand the relationships between input variables and fire activity, we conducted a comparative analysis of the different input variables. In an artificial neural network, each connection link has an associated weight, and these weights are stored by the machine learning method during the training stage [17]. Various methods have been developed to explore the correlation between input variables in outcome assessments. Most of these methods revealed the importance of selecting the input variables, and those input variables are either directly or indirectly related to the output, such as mathematical statistics, Pearson correlation coefficient and Spearman correlation coefficient [40]. In this study, the importance of the input variables were quantified automatically when the model was built using the SPSS Modeler software. In the Variable Assessment System of the SPSS Modeler software, the variance of predictive error is used as the measure of importance [35]. The results are shown in Table 6.
Table 6.
Importance between input variables and field burning fire point forecasting results for the different models developed in this study. The importance of the input variables was sorted from high to low. The value in parentheses after the variable means the importance score calculated by the SPSS Modeler 14.1 software.
Table 6 illustrates how the daily variability of crop residue fire points is closely related to the variability of air pressure. The mechanisms for this correlation remain unclear, but we suspected that the variability of air pressure affects non-linear feedbacks between relative humidity, temperature and fire activity. The change in soil moisture content within a 24 h period, the daily soil moisture content and relative humidity are also important factors. These factors affect the success rate of fire ignition and fire burning time, with dry soil and crops increasing fire ignition probability and potential fire behavior. Furthermore, the soil moisture content and relative humidity are affected by the air temperature, meaning that an increase in temperature can increase the fire ignition potential. Wind speed has a direct negative correlation with the open burning of crops because high wind speeds can lead to fires becoming out of control, and farmers usually burn crop residue when wind speeds are less than 2 m/s. These findings have also been verified by previous studies [17,23,39].
In theory, the accumulated precipitation in a 24-h period and straw open burning prohibition areas should have a great influence on crop residue open burning. However, both of these factors show a low importance to the fire activity results. These findings are related to the climate in Northeastern China, where rainfall is extremely rare after the summer, and the early snow falls after 10 November each year, meaning that farmers choose to burn crop residue during the dry season. In addition, Jilin Province is the only region with straw open burning prohibition areas in Northeastern China, meaning that the probability of selecting data from burning prohibition areas was very small and the importance was minimal.
4. Discussion
4.1. Analysis of Sensitivity, Specificity, Accuracy and AUC
To evaluate the model, the accuracy, sensitivity and specificity were analyzed. The final modeling and forecasting results of all scenarios are shown in Table 7, and the ROC curves for each model were presented in Figure 4. When forecasting crop residue fires from 2013–2017 with eight natural factors as the input variables, the accuracies of the model and verification data were 69.02% and 77.01%, respectively. However, when we added the anthropogenic management data (straw open burning prohibition areas of Jilin Province) to forecast crop residue fire points for 2020, the accuracy of the model was 91.08%, and the forecasting result was 60%. Although the accuracy of the model had been significantly improved, the accuracy of the forecast was significantly reduced after adding the anthropogenic management data.
Table 7.
Information about the accuracy, sensitivity, specificity and AUC of the model and forecasting in the two scenarios of this study (AUC: the areas under ROC curves).
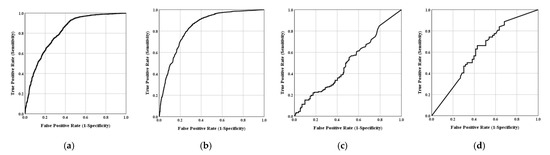
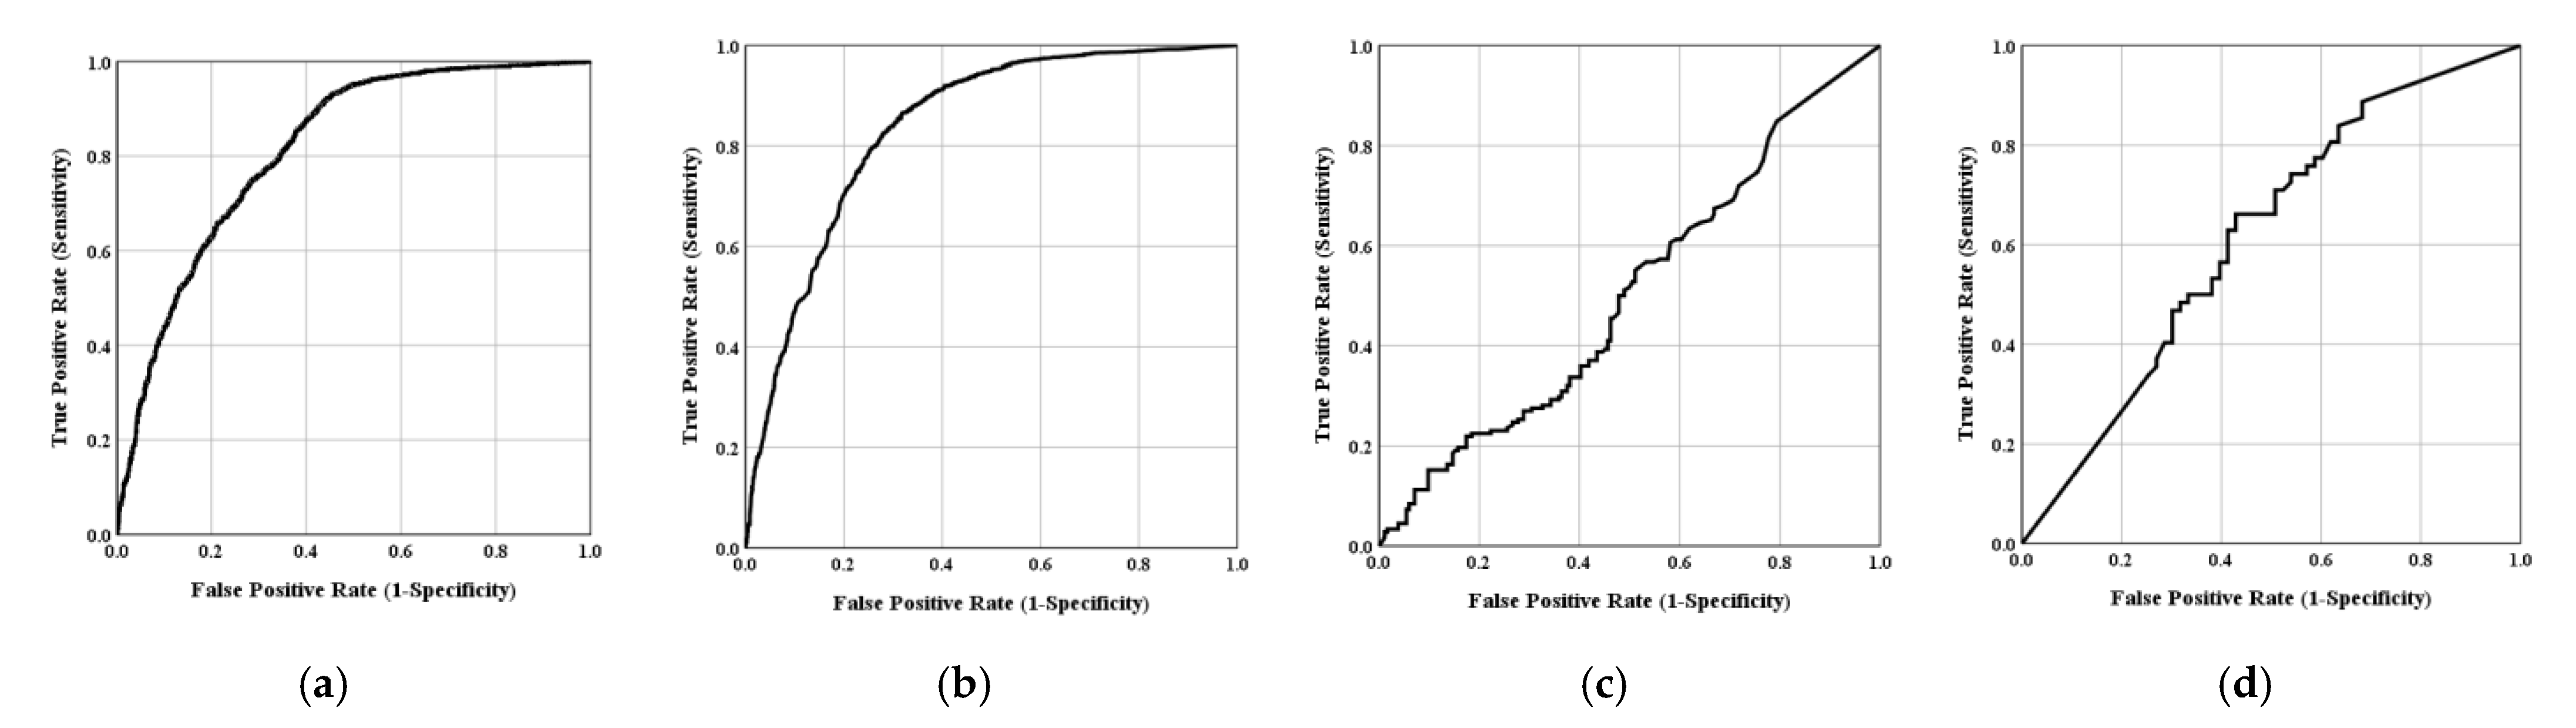
Figure 4.
ROC curves of each model in the two scenarios, (a) the model of preliminary construction used meteorological factors in Scenario 1, (b) the model of optimized that contained 8 natural factors in Scenario 1, (c) the model of the first study in Scenario 2, (d) the model of optimized which added the anthropogenic management and the control policy factor in Scenario 2.
The sensitivity, specificity and AUC of BPNN models were acceptable in this study. In Scenario 1, the sensitivity and specificity values were more than 70% and 55%, it indicating that the models have a certain stability. The AUC value was more than 0.75. The results suggested that the models worked very well, that they were clearly useful. On the other hand, when the anthropogenic management and control policy were added, the values of AUC and sensitivity in the first study of Scenario 2 decreased. This suggested that the anthropogenic management and control policy factor had an important impact on agricultural fire forecasting, and those factors must be considered in neural network forecasting. Then, in the optimized study of Scenario 2, where the anthropogenic management and control policy factor were added as the input data, the sensitivity value increased significantly. At the same time, the specificity value was 55.11%, and the AUC value was higher than 0.5 (0.615). The results indicated that the model was still possibly helpful to forecast the crop residue fire points. Furthermore, the sensitivity and specificity in Scenario 2 were lower when compared with Scenario 1, which could be caused by the fewer sampling data in a short time period in Scenario 2’s optimized model. A long time period and more data would be considered in the future study.
4.2. Analysis of the Causes of False Fire Results
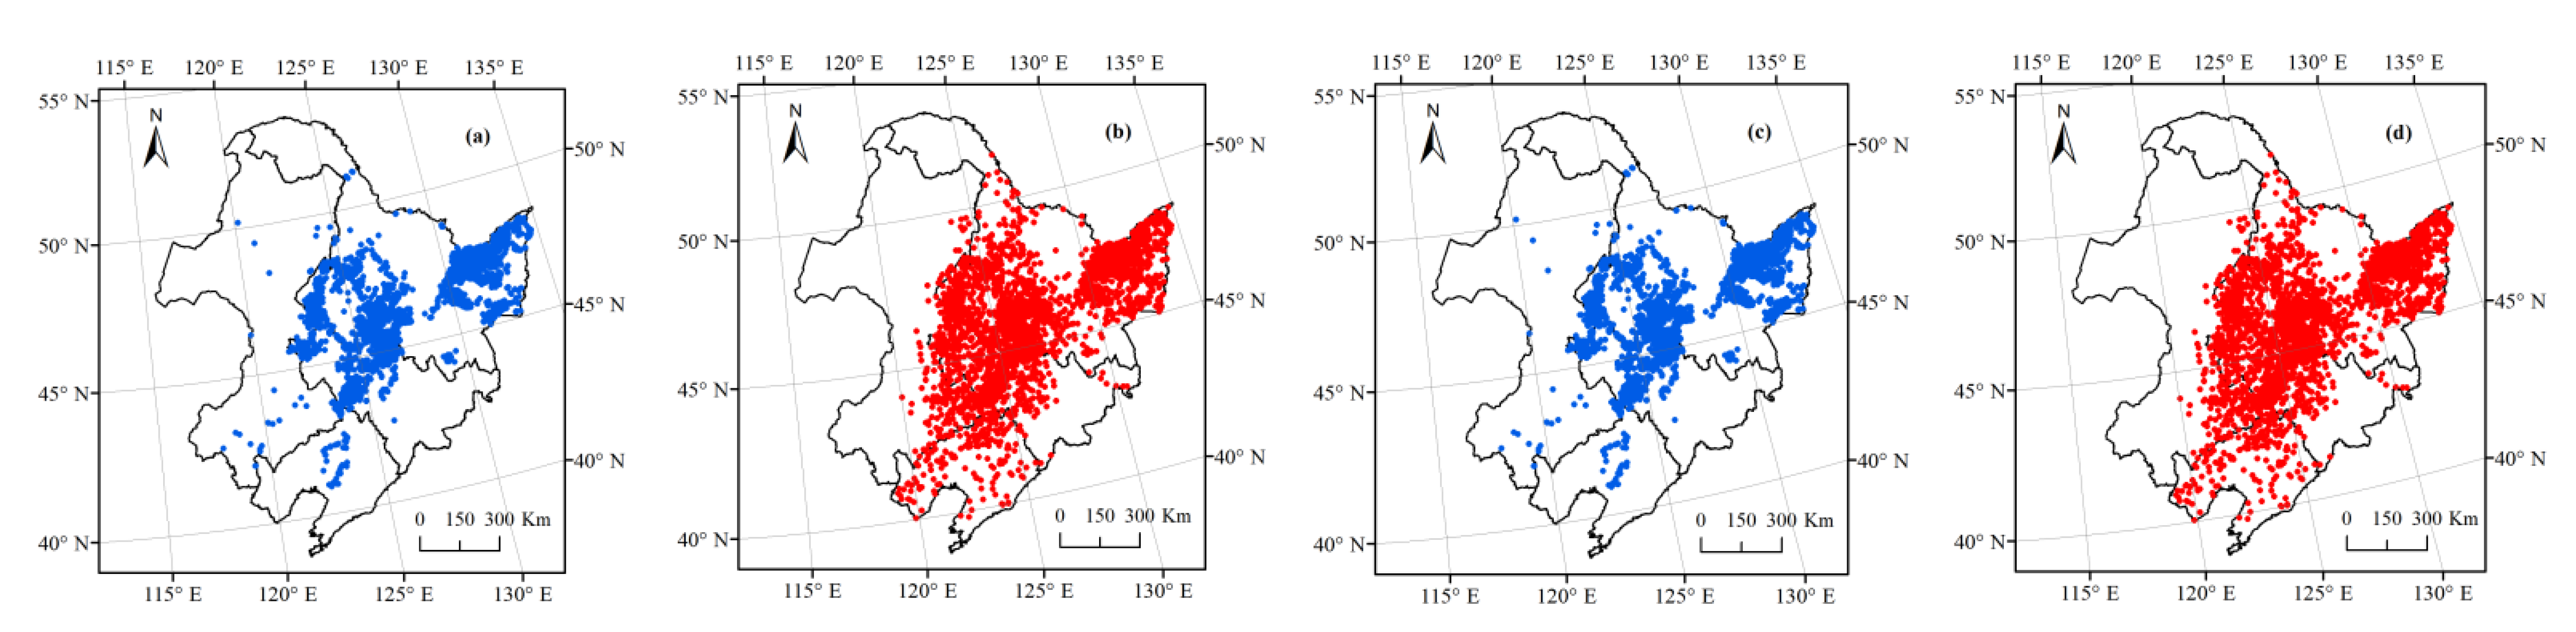
The spatial distribution of MODIS observed and the BPNN forecasted fire points in Scenarios 1 and 2 are illustrated in Figure 5 and Figure 6. Figure 4 shows that the fire locations forecast by the BPNN for 2013–2017 were mainly distributed in the central and northeastern regions of the study area. The forecast position of fires was generally consistent with the observed position, but the number of forecasted fires was higher than the number of observed fire occurrences. By sorting the training and forecasting data defined in Section 3.1.1, we calculated the average value for each variable. Using the same kind of input variable for observation and forecasting had a limited effect on the results, indicating that the forecast result was not only affected by meteorological factors. In terms of geographical locations, the central region of Northeastern China is the Songnen Plain, which is one of the main grain-producing areas. During 2013–2017, this region did not enforce any policies to prohibit the open burning of crop residue, but the Chinese government did encourage farmers to use crop residue for energy production and animal feed, so model inaccuracies were likely to include a contribution from human factors. Combining the results in Table 2 and Table 3, we show that case FN had a higher proportion than case FP. After this, we continued to take the mean of all the input data in Section 3.1.2 and conducted statistical and comparative analyses. Judging from the input data, the difference between the observed and the forecast data was mainly reflected in the PRS, TEM and D2-D1 variables. The forecasted values were higher than the observed values, which means that these factors have a positive influence on wildfire ignition, consistent with the previous results from the Songnen Plain in China [37]. A large difference between the daily soil moisture content of a certain day and the previous day implies that there may have been rainfall on that day. The soil moisture content was observed at 0:00 UTC time daily, which is equivalent to 8:00 Beijing time. If there was rainfall on a certain day, local farmers were most likely to burn straw before the rain. This human behavior factor is a potential reason why case FN had a higher proportion than case FP, and explains why forecasted fire point data were higher than the observed values.
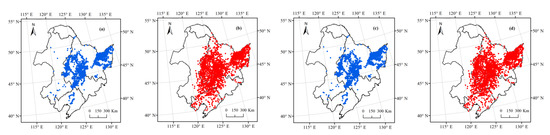
Figure 5.
Comparison of the spatial distribution of fire points in Northeastern China according to MODIS observations (blue points) and BPNN verifications (red points) from 2013–2017. (a,b) only consider meteorological factors to forecast fire points as described in Section 3.1.1, whereas (c,d) also used soil moisture content and harvest date data to forecast fire points as described in Section 3.1.2.
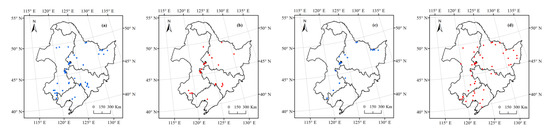
Figure 6.
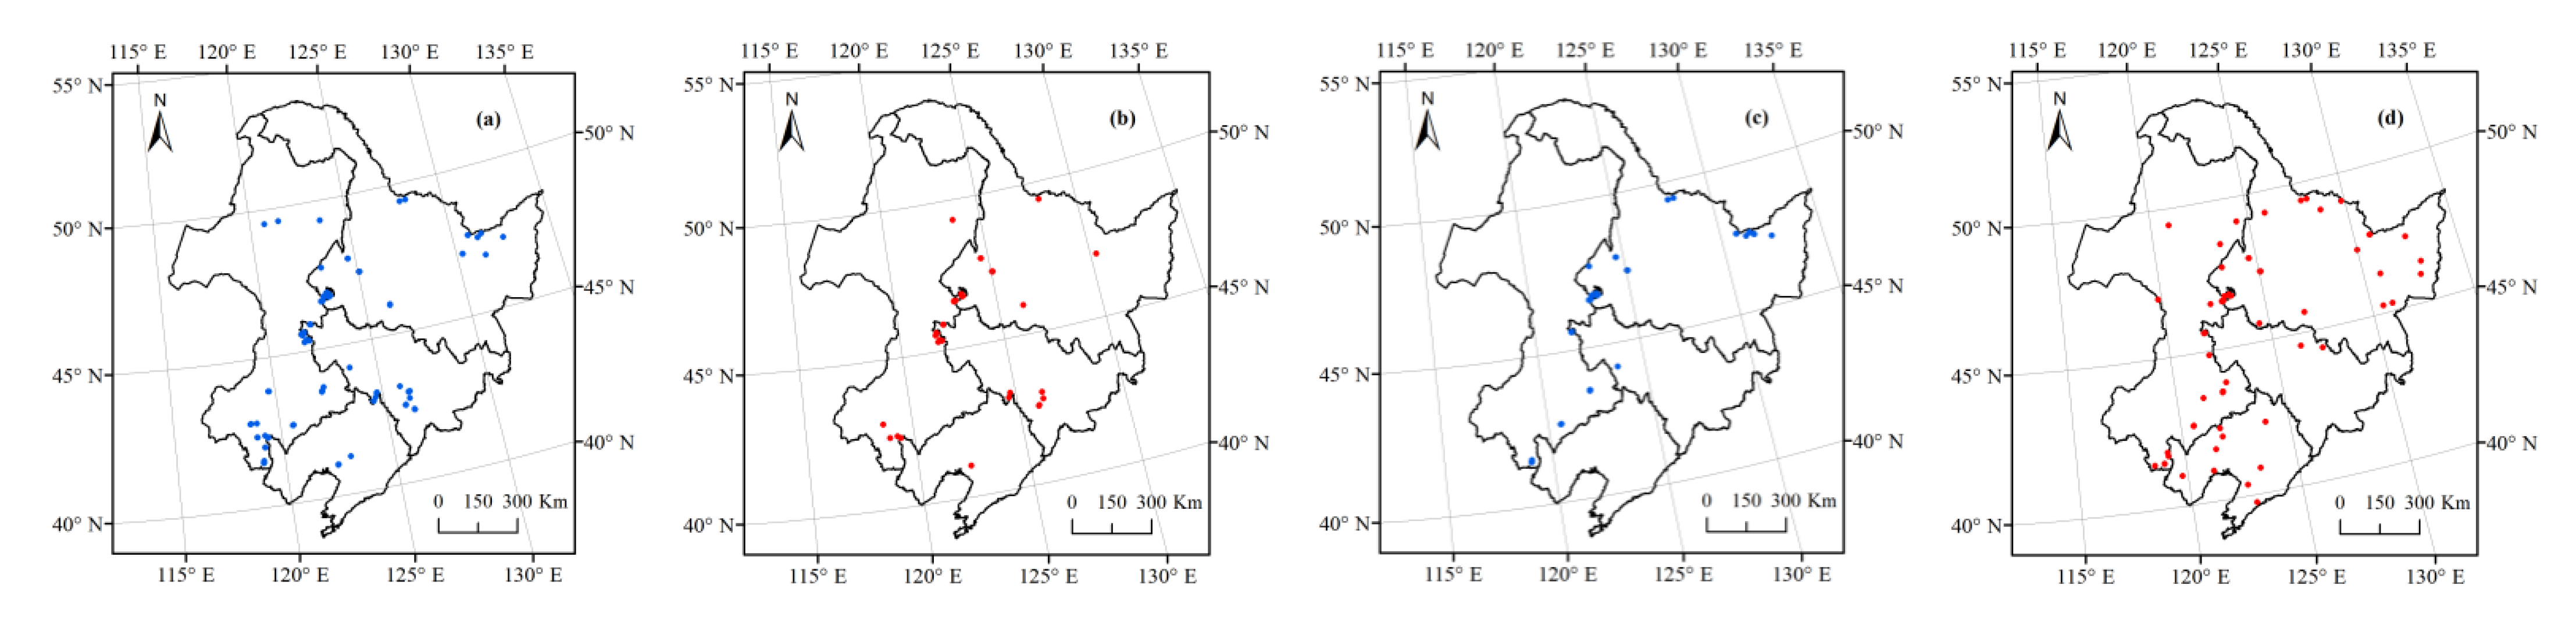
Comparison of the spatial distribution of fire points in Northeastern China from MODIS observations (blue points) and BPNN forecasting (red points). (a,b) use the model described in Section 3.1.2 to forecast fire points from 2018–2020, and (c,d) show the data from 2018–2019 that were used to forecast fire points in 2020, after adding the anthropogenic management and control policy as input data.
As the government strengthened the management of straw field burning in 2018, the straw open burning prohibition areas of 2018–2020 in Jilin Province were added to forecast the field fire points. Figure 6a,b shows the spatial distribution of the field fire points from the MODIS observations and BPNN forecasts for 2018–2020. The occurrence of crop residue open burning was significantly reduced, and the distribution of observations and forecasting fires was similar, but the number of forecasted fire points was less than the observed value. On the one hand, there were fire points in the straw open burning prohibition areas, but the model default indicated no fires in this area. On the other hand, the difference between the observed and forecast data was mainly reflected in the WIN and TEM variables. Compared with the average value of the training data, the wind speed was higher, and the temperature was generally lower in the forecast data. It was easy to understand why the wind speed was negatively correlated with fire points, since humans are less likely to burn straw under high wind speeds. According to previous research, the effects of decreasing temperature on crops fires are difficult to forecast [37]. These factors all contributed to the number of forecasted fire points being less than the observations.
The accuracy of the field fire point forecasts in 2020 was 60%. We also compared the forecast outputs with the observed spatial distribution, as shown in Figure 6c,d. An interesting phenomenon can be seen in Figure 6c, where the spatial distribution of fire points in 2020 was found to be concentrated at the borders of various provinces. According to Table 5, the number of fire points forecasted by the BPNN was 18 more than the actual number observed by MODIS. These 18 fire points were mainly distributed in Liaoning Province, and the northeastern border of Jilin and Heilongjiang Provinces. Generally, the supervision of administrative boundaries is not strict, which leads a few farmers to carry out the open field burning of crop residue without government monitoring and the natural conditions permit, making the neural network increase the probability of the fire points at the boundary in the learning process. Likewise, the air temperature in Liaoning Province is higher than in other areas, which will also increase the probability that fire points will be forecast in this region.
4.3. Discussion and Analysis of the Decrease of Forecast Accuracy after Adding Anthropogenic Management and Control Policy Data
From a realistic point of view, the actual number of field fire points in 2020 observed by MODIS in Northeastern China was only 62, and the sample size of our forecasting input was 125. This small number of samples will have reduced the learning ability of the neural network. In addition, although open burning is forbidden in straw open burning prohibition areas, there were still occurrences of crop residue burning. As the model forecasting process determined that there were no fire points in areas where open fires were prohibited, this also affected the accuracy of the results.
In addition, the research can be improved in the following aspects. First, we chose a study period to collect enough sampling for training, and better results may be obtained if the data can be processed with some augmentation techniques, such as enhancing satellite-based change detection and image recognition [41,42,43,44]. Second, there are some modern machine-learning methods, for example symbolic regression, which are computationally much cheaper and easier to interpret [45]. Moreover, in recent years, the use of Deep Learning as a prediction method began to rise gradually, in particular the use of Generative Adversarial Networks and Convolutional Neural Networks (CNN). These networks are suitable for the recognition and prediction of the images, and the U-NET technique as an algorithm in a fully convolutional neural network. Both began being used in the prediction research of medicine, physics, pollutant concentration, etc. Although there has been no research on crop residue fire points forecasting, the CNN began being used to forecast forest fires [11,46,47]. In the future, we can consider trying to use these methods or a combination of these methods to forecast crop residue fire points. Finally, the SPSS Modeler tool that we chose this time had a relatively slow operation speed, but the operation is simple and intuitional, whereas python notebooks are abundant and more flexible.
5. Conclusions
The study selected eight years (2013–2020) of MODIS-observed daily fire pixel counts and used neural network modeling techniques integrating anthropogenic and natural variables to accurately forecast crop residue open burning fire points. This research compared the accuracy of natural factors and added anthropogenic factors to forecast crop residue fire points. After adding the anthropogenic management and control policy, the forecasting accuracy (60%) was lower than when only considering natural factors (77.01%), but the accuracy of this model was 91.08%. This finding demonstrates that BPNN methods provide a robust technique for integrating anthropogenic and natural factors that are capable of forecasting crop residue fire points, but it still has room for improvement. The methods developed in this study are valuable for forecasting crop residue open field burning with anthropogenic management and control across Northeastern China. By analyzing the impact of input variables on the forecasting results, we showed that air pressure, the change in soil moisture content within a 24 h period and the daily soil moisture content have the greatest effect on the open burning of crop residue; meanwhile, 24 h cumulative rainfall has little influence. These results were consistent with the observations in Northeastern China.
In this study we focused on Northeastern China, but the BPNN model could be applied to other regions. The fire forecasting results can also be integrated into air quality models to improve forecasting and early warning capabilities. Furthermore, this model can be used by local governments and other decision makers to understand and mitigate the impacts of agricultural fires.
Author Contributions
Conceptualization, H.Z.; methodology, B.B.; software, B.B.; validation, B.B., H.Z. and S.Z.; formal analysis, B.B. and Y.D.; data curation, B.B.; writing—original draft preparation, B.B.; writing—review & editing, B.B., H.Z., S.Z. and X.Z.; visualization, B.B.; supervision, H.Z. All authors have read and agreed to the published version of the manuscript.
Funding
This work is financially supported by the National Natural Science Foundation of China (No. 41771504, 4210012334) and the National Natural Science Foundation of Jilin Province (No.20200201214JC).
Institutional Review Board Statement
The study did not involve humans or animals.
Informed Consent Statement
The study did not involve humans.
Data Availability Statement
Not applicable.
Acknowledgments
We thank the NASA Earth Data Open Access for Open Science, the China Meteorological Data Network, the European Space Agency and the Climate Change Initiative Soil Moisture Project for freely sharing the fire points, meteorological data and soil moist data.
Conflicts of Interest
The authors declare no conflict of interest.
References
- Yin, S.; Wang, X.; Xiao, Y.; Tani, H.; Zhong, G.; Sun, Z. Study on spatial distribution of crop residue burning and PM2.5 change in China. Environ. Pollut. 2017, 220, 204–221. [Google Scholar] [CrossRef]
- Zhuang, Y.; Li, R.; Yang, H.; Chen, D.; Chen, Z.; Gao, B.; He, B. Understanding temporal and spatial distribution of crop residue burning in China from 2003 to 2017 using MODIS data. Remote Sens. 2018, 10, 390. [Google Scholar] [CrossRef] [Green Version]
- Enkhjargal, A.; Burmaajav, B. Impact of the ambient air PM2.5 on cardiovascular diseases of Ulaanbaatar residents. Geography 2015, 4, 35–41. [Google Scholar]
- Zha, S.; Zhang, S.; Cheng, T.; Chen, J.; Huang, G.; Li, X.; Wang, Q. Agricultural fires and their potential impacts on regional air quality over China. Aerosol. Air Qual. Res. 2013, 13, 992–1001. [Google Scholar] [CrossRef] [Green Version]
- Liu, H.; Jianga, G.; Zhuang, H.; Wang, K. Distribution, utilization structure and potential of biomass resources in rural China: With special references of crop residues. Renew. Sust. Energ. Rev. 2008, 12, 1402–1418. [Google Scholar] [CrossRef]
- Zhao, H.; Zhang, X.; Zhang, S.; Chen, W.; Tong, Q.; Xiu, A. Effects of Agricultural Biomass Burning on Regional Haze in China: A Review. Atmosphere 2017, 8, 1423. [Google Scholar] [CrossRef] [Green Version]
- Wang, G.; Gao, B. Fire location model based on adaptive learning rate BP Neural Network. Comput. Syst. Appl. 2019, 28, 250–254, (in Chinese with English abstract). [Google Scholar]
- Jilin Province Government. Work Program for Straw Open Burning Prohibition in Autumn and Winter of 2018. Available online: http://sthjt.jl.gov.cn/xxfb/tzgg/201810/t20181024_5196951.html (accessed on 10 July 2020).
- Wen, X.; Chen, W.; Chen, B.; Yang, C.; Tu, G.; Cheng, T. Does the prohibition on open burning of straw mitigate air pollution? An empirical study in Jilin Province of China in the post-harvest season. J. Environ. Manag. 2020, 264. [Google Scholar] [CrossRef]
- Satir, O.; Berberoglu, S.; Donmez, C. Mapping regional forest fire probability using artificial neural network model in a Mediterranean forest ecosystem. Geomat. Nat. Hazards Risk 2016, 7, 1645–1658. [Google Scholar] [CrossRef] [Green Version]
- Zhang, G.; Wang, M.; Liu, K. Forest fire susceptibility modeling using a convolutional neural network for Yunnan Province of China. Int. J. Disaster Risk Sci. 2019, 10, 386–403. [Google Scholar] [CrossRef] [Green Version]
- Elgar, B.; Efrain, Y.; Cláudia, M.; Rolando, S.; Nilton, B.R. Monitoring wildfires in the Northeastern Peruvian Amazon using Landsat-8 and Sentinel-2 Imagery in the GEE Platform. ISPRS Int. J. Geo-Inf. 2020, 9, 564–585. [Google Scholar]
- Yaron, M.; Helman, D.; Glickman, O.; Gabay, D.; Brenner, S.; Lensky, I. Forecasting fire risk with machine learning and dynamic information derived from satellite vegetation index time-series. Sci. Total Environ. 2021, 764. [Google Scholar] [CrossRef]
- Li, L.; Song, W.; Ma, J.; Satoh, K. Artificial neural network approach for modeling the impact of population density and weather parameters on forest fire risk. Int. J. Wildland Fire. 2009, 18, 640–647. [Google Scholar] [CrossRef]
- Jain, P.; Coogan, S.; Subramanian, S.; Crowley, M.; Taylor, S.; Flannigan, M. A review of machine learning applications in wildfire science and management. Environ. Rev. 2020, 28, 478–505. [Google Scholar] [CrossRef]
- Eliaa, M.; D’Estea, M.; Ascolib, D.; Giannicoa, V.; Spanoa, G.; Ganga, A.; Colangelo, G.; Lafortezza, R.; Sanesi, G. Estimating the probability of wildfire occurrence in Mediterranean landscapes using Artificial Neural Networks. Environ. Impact Assess. Rev. 2020, 85, 64–74. [Google Scholar] [CrossRef]
- Vasilakos, C.; Kalabokidis, K.; Hatzopoulos, J.; Matsinos, I. Identifying wildland fire ignition factors through sensitivity analysis of a neural network. Nat. Hazards. 2009, 50, 125–143. [Google Scholar] [CrossRef]
- Gardner, M.; Dorling, S. Artificial neural networks (the multilayer perceptron)—A review of applications in the atmospheric sciences. Atmos. Environ. 1998, 32, 2627–2636. [Google Scholar] [CrossRef]
- Liu, F.; Xu, L.; Ma, X. Development of BP neural network and its application in chemistry and chemical engineering. Chem. Ind. Eng. Progress. 2019, 38, 2559–2573, (in Chinese with English abstract). [Google Scholar]
- Huang, Z.; Xia, J.; Wang, J.; Wang, J.; Shen, H. Observer-based finite-time bounded analysis for switched inertial recurrent neural networks under the PDT switching law. Physica A. 2020, 538. [Google Scholar] [CrossRef]
- Lu, D.; Mao, W.; Zheng, L.; Xiao, W.; Zhang, L.; Wei, J. Ambient PM2.5 Estimates and Variations during COVID-19 Pandemic in the Yangtze River Delta Using Machine Learning and Big Data. Remote Sens. 2021, 13, 1423. [Google Scholar] [CrossRef]
- Mao, X.; Shen, T.; Feng, X. Prediction of hourly ground-level PM2.5 concentrations 3 days in advance using neural networks with satellite data in eastern China. Atmos. Pollut. Res. 2017, 8, 1005–1015. [Google Scholar] [CrossRef]
- Xu, F.; Fu, T.; Cao, H.; Tian, H.; Fan, Q.; Chen, X. Neural network predictions of pollutant emissions from open burning of crop residues: Application to air quality forecasts in southern China. Atmos. Environ. 2019, 204, 22–31. [Google Scholar]
- Genga, R.; Zhao, Y.; Cui, Q.; Qin, F. Representation of modern pollen assemblages with respect to vegetation and climate in Northeast China. Quat. Int. 2019, 532, 126–137. [Google Scholar] [CrossRef]
- Zhang, S.; Liu, G.; Chen, S. Rasmussen, C.; Liu, B. Assessing soil thickness in a black soil watershed in northeast China using random forest and field observations. Int. Soil Water Conse. 2021, 9, 49–57. [Google Scholar] [CrossRef]
- Li, H.; Zhang, H.; Li, Q.; Zhao, J.; Guo, X.; Ying, H.; Deng, G.; Rihan, W.; Wang, S. Vegetation productivity dynamics in response to climate change and human activities under different topography and land cover in Northeast China. Remote Sens. 2021, 13, 975. [Google Scholar] [CrossRef]
- Wang, J. Tang, H. Wang, J. Comprehensive utilization stauts and development analysis of crop straw resource in Northeast China. Trans. Chin. Soc. Agric. Mach. 2017, 48, 1–21, (in Chinese with English abstract). [Google Scholar]
- Zhang, J.; Yang, X.; Tu, X.; Ning, K.; Luan, X. Spatio-temporal change of straw burning fire points in field of China from 2014 to 2018. Trans. Chin. Soc. Agric. Eng. 2019, 35, 191–199, (in Chinese with English abstract). [Google Scholar]
- NASA. Earth Data Open Access for Open Science Home Page. In Publications Division Home Page. Available online: https://earthdata.nasa.gov (accessed on 7 November 2010).
- China Meteorological Data Network Home Page. Available online: https://data.cma.cn (accessed on 12 April 2019).
- European Space Agency. Climate Change Initiative Soil Moisture Project Home Page. Available online: http://www.esa-soilmoisturecci.org. (accessed on 8 July 2019).
- Dorigo, W.; Wagner, W.; Albergel, C.; Albrecht, F.; Balsamo, G.; Brocca, L.; Chung, D.; Ertl, M.; Forkel, M.; Gruber, A.; et al. ESA CCI Soil Moisture for improved Earth system understanding: State-of-the art and future directions. Remote Sens. Environ. 2017, 203, 185–215. [Google Scholar] [CrossRef]
- Center For Sustainability and the Global Environment of the University of Wisconsin-Madison Home Page. Available online: http://www.sage.wisc.edu. (accessed on 10 November 2020).
- Liu, W.; Wang, Z.; Liu, X.; Zeng, N.; Liu, Y.; Alsaadi, F. A survey of deep neural network architectures and their applications. Neurocomputing 2017, 234, 11–26. [Google Scholar] [CrossRef]
- IBM. SPSS Modeler 14.1 Algorithms Guide; IBM Corporation 1994, the United States of America; IBM Corporation: Armonk, NY, USA, 2010; pp. 218–219. [Google Scholar]
- Shukla, A.; Kumar, S.; Singh, H. MLP-ANN-Based execution time prediction model and assessment of input parameters through structural modeling. Proc. Natl. Acad. Sci. India A. 2021, 91, 577–585. [Google Scholar]
- Bai, B.; Zhao, H.; Zhang, S.; Zhang, X.; Yang, G. Forecasting of agricultural straw burning in the Northeastern China based on neural network. China Environ. Sci. 2020, 40, 5205–5212, (in Chinese with English abstract). [Google Scholar]
- Vasconcelos, M.; Silva, S.; Margarida, T.; Pereira, J. Spatial prediction of fire ignition probabilities: Comparing logistic regression and neural networks. Photogramm. Eng. Remote Sens. 2001, 67, 73–81. [Google Scholar]
- Maeda, E.; Formaggio, A.; Shimabukuro, Y.; Arcoverde, G.; Hansen, M. Predicting forest fire in the Brazilian Amazon using MODIS imagery and artificial neural networks. Int. J. Appl. Earth Obs. Geoinf. 2009, 11, 65–272. [Google Scholar] [CrossRef]
- Lin, C.; Hsu, S.; Lu, H.; Pan, L.; Yan, Y. Comparison of Back-Propagation Neural Network, LACE Index and HOSPITAL Score in Predicting All-Cause Risk of 30-Day Readmission. Risk Manag. Healthc. Policy 2021, 14, 3853–3864. [Google Scholar] [CrossRef] [PubMed]
- Crist, E.; Cicone, R. A physically-based transformation of thematic mapper data-The TM Tasseled Cap. IEEE Trans. Geosci. Remote Sens. 1984, 22, 256–263. [Google Scholar] [CrossRef]
- Morisette, J.; Khorram, S. An introduction to using generalized linear models to enhance satellite-based change detection. In Proceedings of the IEEE International Geoscience and Remote Sensing Symposium, Singapore, 3–8 August 1997. [Google Scholar]
- Celik, T. Multiscale change detection in multitemporal satellite images. IEEE Geosci. Remote Sens. Lett. 2009, 6, 820–824. [Google Scholar] [CrossRef]
- Falini, A.; Tamborrino, C.; Castellano, G.; Mazzia, F.; Mininni, R.; Appice, A.; Malerba, D. Novel reconstruction errors for saliency detection in hyperspectral images. In Proceedings of the International Conference on Machine Learning, Optimization, and Data Science, Siena, Italy, 19–23 July 2020. [Google Scholar]
- Yang, G.; Huang, J. Model selection of symbolic regression to improve the accuracy of PM2.5 concentration prediction. In Proceedings of the Trends and Applications in Knowledge Discovery and Data Mining, Ho Chi Minh City, Vietnam, 19–21 May 2015. [Google Scholar]
- Lutz, S.; Amplianitis, K.; Smolic, A. AlphaGAN. Generative adversarial networks for natural image matting. In Proceedings of the British Machine Vision Conference, Newcastle, UK, 26 July 2018. [Google Scholar]
- Alom, M.; Hasan, M.; Yakopcic, C.; Taha, T.; Asari, V. Recurrent residual convolutional neural network based on U-Net (R2U-Net) for medical image segmentation. Comput. Sci. 2018, arXiv:1802.06955. [Google Scholar]
Publisher’s Note: MDPI stays neutral with regard to jurisdictional claims in published maps and institutional affiliations. |
© 2021 by the authors. Licensee MDPI, Basel, Switzerland. This article is an open access article distributed under the terms and conditions of the Creative Commons Attribution (CC BY) license (https://creativecommons.org/licenses/by/4.0/).