Article

Changes in Urban Mobility Related to the Public Bike System with Regard to Weather Conditions and Statutory Retail Restrictions

by
Marta Borowska-Stefańska
1,
Miroslava Mikusova
2,*,
Michał Kowalski
1,
Paulina Kurzyk
1 and
Szymon Wiśniewski
1
1
Institute of the Built Environment and Spatial Policy, Faculty of Geographical Sciences, University of Lodz, Kopcińskiego St. 31, 90-142 Łódź, Poland
2
Department of Road and Urban Transport, Faculty of Operation and Economics of Transport and Communications, University of Zilina, Univerzitná 8215/1, 010 26 Zilina, Slovakia
*
Author to whom correspondence should be addressed.
Remote Sens. 2021, 13(18), 3597; https://doi.org/10.3390/rs13183597
Submission received: 8 August 2021 / Revised: 5 September 2021 / Accepted: 6 September 2021 / Published: 9 September 2021
(This article belongs to the Special Issue Remote Sensing for Urban Development and Sustainability)

Abstract

:
The main purpose of the paper is to determine changes in transport behaviour of users of the public bike-share (PBS) scheme in a large Polish city, Łódź. By tracking GPS signals for individual trips taken by PBS users, it was possible to analyse their changeability (time and spatial) for periods before the implementation of statutory Sunday retail restrictions (2017) and after their partial introduction (2018). The study also took into account weather conditions, namely maximum and minimum daily temperatures and daily totals of precipitation recorded by a weather station in Łodź. In order to determine the correlations between certain weather conditions and PBS trips, the authors applied regression analysis. The results of the study showed that weekend cycling is less susceptible to the impact of weather than cycling on weekdays. At the same time, a comparative analysis of trading and non-trading Sundays proved that, during Sundays with retail restrictions, public bikes were used for longer, farther, and slower trips. These observations were confirmed by analyses of maps of traffic structure.

Graphical Abstract

1. Introduction

Non-motorised means of transport are an essential part of sustainable transport systems, characterised by very low emissions and noise and a substantially decreased risk of accident for other road users. Today, these modes of transport are also believed to have become effective methods of counteracting health issues (e.g., obesity) for many people. The incorporation of a bike-sharing scheme into the urban transport system is a solution that helps increase the percentage of non-motorised transport modes within the city’s modal division. Not only does a PBS have a beneficial impact on its users and other elements of the transport system, but it also offers a unique opportunity to obtain exceptionally accurate and vast research material for analysing transport behaviour.
The main purpose of this study was to determine changes in the transport behaviour of users of a bike-sharing scheme in a large Polish city, Łódź. Our analysis aimed to identify changes in users’ behaviour connected to the weather and the statutory Sunday retail restrictions that were implemented in Poland. By tracking GPS signals for individual PBS trips, we were able to analyse changeability in time and space for the period before the implementation of the restrictions (2017) and after they were partially introduced (2018). A comparative analysis of the results from the two periods made it possible to observe any differences. Naturally, the impact of retail restrictions on cyclists’ behaviour must not be overinterpreted, as it may also be determined by other less or more significant factors or by the personal traits of a given PBS user. Nevertheless, the vast resources of the database (in terms of measurement periods and the number of recorded trips) followed by meticulous analysis offered a chance to determine certain regularities, despite the aforementioned imperfections.
In order to make the results of our study even more reliable, we decided to expand analyses with the most crucial factor that determines the inclination to cycle in places such as Łódź, i.e., weather conditions. We verified the impact of selected weather conditions on trips taken by PBS users with the intention of incorporating their role in shaping regularities related to the Sunday retail restrictions. Obviously, when compared to other means of transport, cycling is strongly influenced by weather, and in consequence, each abrupt change of atmospheric conditions may have a significant impact on general demand for bike trips, in particular.
First and foremost, the study is of prime importance due to the fact that cities should strive for sustainable urban mobility, i.e., they ought to implement transport policies that motivate residents to reduce the number of trips taken by private car in favour of—inter alia—the bicycle. This is absolutely vital for cities due to their high aggregation of vehicles, congestion, and intense car-based transit of people and cargo, which are responsible for the highest emission of transport-related greenhouse gases that feed climate change. Secondly, understanding the impact of weather is essential in the context of global climate changes. Temperatures in Poland are predicted to continue rising, with mild winters and hot summers being foreseen as an even more common occurrence, bringing extreme precipitation, heat waves, strong winds, and other connected hazards [1]. These factors are of great importance to authorities responsible for appropriate infrastructure and transport management. What is more, recognition of how and to what extent weather influences cycling is crucial if we wish to minimise its impact on this particular means of transport.
Although there are numerous studies on how weather impacts the use of bicycles, there are still very few analyses that focus on a local scale and even fewer that take into account statutory Sunday retail restrictions.

2. Theoretical Foundations

2.1. Statutory Sunday Retail Restrictions—The Idea, Purposes, Principles, and Effects

The issue of regulations concerning shop opening hours, on Sundays in particular, has been regularly discussed in many European countries over the last two decades. Although this discussion has generally resulted in a softening of many legal restrictions, the restrictions still vary considerably across European countries [2,3,4].
Religious organisations see the implemented restrictions as a means of ensuring that Sunday is a day of rest and spiritual revitalisation (the obligation to refrain from any labour on the seventh day of the week has extremely strong axiological grounds stemming from religious tenets); trade unions, on the other hand, use it to protect employees from being forced to work overtime, while the majority of small and independent retailers support regulations that defend them against large-format competition. Finally, many people recognise the benefits behind the idea of a day off for quality time with friends and family. It must be added, however, that Sunday retail restrictions also generate costs incurred by consumers, retail businesses, and employees [4,5].
In Poland, an act on retail restrictions on Sundays and public holidays (as well as some certain other days) was introduced in March 2018. In accordance with this bill, the trading ban was introduced gradually, with shops being open on two Sundays per month from March 2018, then on only one Sunday from 2019, and since 2020, the ban has affected all but seven Sundays [6] (plus one more Sunday in December 2020 due to the COVID-19 pandemic). The act also contains a list of businesses that are exempt from the ban, including filling stations, flower shops, pharmacies, post offices, and retail outlets where the owner is the only person engaged in serving customers [7]. Officially, the main premise behind the implementation of these restrictions was to protect employee rights to a day off (with particular focus on female workers) [8]. As for the expected social and economic effects, the originators of said act stressed the promotion of the importance of the family as the most fundamental social unit and the reduction of consumerism [7]. Interestingly, Poland is an exception in the EU when it comes to the implementation of such restrictions.

2.2. The Bicycle as Part of the Urban Transport System

For decades, transport has been globally considered a bridge between all aspects of life. The natural environment, social prosperity, and economic development all depend on transport systems. In most cases, a safe, clean, sustainable, and equally accessible transport system facilitates development in countries, especially in cities and urban agglomerations. Alas, a broad spectrum of studies show that transport systems in most cities and urban areas are by no means sustainable [9]. Excessive reliance on car use in cities has decreased travel speeds, disturbed the smooth operation of mass transit, and, in consequence, caused considerable delays for commuters [10]. Moreover, motorised transport generates noise and air pollution and may lead to congestion, insufficient parking spaces, and accidents [11,12,13,14]. Congestion, alone, decreases accessibility to destinations, especially those located in city centres [15]. Construction of new roads and other transport-related facilities requires great outlays and demands transformation of vast areas of land, thereby reducing terrain that could be used for other purposes (parks, playgrounds, etc.). Parked vehicles often obstruct pedestrians, cyclists, and people with disabilities. Therefore, it is crucial to mitigate these issues by changing people’s transport habits and behaviour, making them less reliant on private cars and more on mass transit, bicycles, and walking. Obviously, the point is not to eradicate travelling by car completely, but to rationally utilise it, i.e., to opt for private car only when other transport options are inconvenient [10].
The bicycle is becoming an increasingly more popular alternative to motorised transport in cities and urban agglomerations, mainly in Europe [16]. In 2014, the bicycle was a preferred transport option for 7% of Poles, with the EU average amounting to 8% [17]. Importantly, not only is the popularity of cycling growing in countries traditionally associated with bicycle transport, e.g., Holland, Denmark, and Germany [18,19] but also in countries where its share still remains marginal, i.e., the US and Canada [20]. At the same time, it seems that the use of the car in North America and many Western European countries has reached a plateau, if not begun to decrease [21].
At present, an effective tool to popularise alternative modes of transport are bike-sharing schemes, which can be used—mainly in cities—to reinforce sustainable mobility, defined as shaping transport behaviour within the spatial structure and the transport system so that route lengths are optimised and rationalised, private car transport does not degrade mass transit and non-motorised transport (pedestrians and cyclists), and the operation of the transport system is harmonious with the environment [22]. Therefore, sustainable urban mobility requires people to switch from traditional models of mobility (private cars with combustion engine, commercial vehicles, etc.) in favour of alternative and sustainable solutions (electric cars and scooters, car- and bike-sharing schemes, etc.) [23]. Integration of transport and spatial management is commonly recognised as a prerequisite for sustainable development [24,25]. Modern solutions that combine spatial and transport planning aim at a broader application of the bicycle as an alternative mode of transport, since it brings great benefits to users (saving money, physical activity, flexible mobility) and the natural environment [26]. However, cycling is obviously not the answer to all mobility needs, which means that the car will still be in use not only in large cities, and metropolitan, densely urbanised areas, but also in the suburbs and rural areas. Thus, solutions that encourage people to use the car more circumspectly need to be introduced nationwide [22].
In recent decades, a revival of public bike-share schemes has been observed [27]. A bicycle-sharing system is a transport service in which bicycles are made available for shared use to individuals on a short-term basis. These bikes are owned by the provider of the scheme, who ‘sells’ bicycle functionality via a range of systems of distribution and payment [28,29]. Upon paying a fee (or, rarely, for free), bikes can be borrowed from one docking station and returned at another (belonging to the same operator) within a given metropolitan area. The fee charged for a bike is low, since the user is only renting, not purchasing it [30,31,32]. The very first public bike-sharing scheme in Europe was launched in 1965 (Amsterdam) and offered several hundred bicycles which were repainted white and made available for free. In 1995, the first large-scale public bike-share scheme debuted in Copenhagen (1100 bikes) [18,28]. Currently, the biggest European bike-sharing system is operated in Paris (23,600 bicycles and 1800 docking stations), followed by London (12,000 bikes), Barcelona (6000 bicycles), and Lyon (4000 bikes). Globally, the largest sharing systems can be found in the Chinese cities of Hangzhou and Wuhan, where users have access to 90,000 and 70,000 bicycles, respectively [28].

2.3. The Cyclists’ Transport Behaviour–Determinants and Key Features

In numerous European cities, the bicycle is an important daily mobility mode of transport for commuting to work, doing shopping, taking children to school, etc. [33]. Cycling has a number of assets for both individuals and the whole of society. Individuals benefit from the fact that riding a bike is a healthy and cheap means of transport as well as often being a faster way of moving around the city than other modes of transport, as it allows cyclists to avoid traffic jams [34]. For the whole of society (and the natural environment), the benefits of cycling include environmental sustainability (lack of direct emission of pollutants, CO2, and noise), cheap infrastructure, and improvement of public health [34]. Nevertheless, cycling also has its drawbacks, e.g., greater physical effort, difficult transportation of larger cargo (e.g., weekly shopping), and high weather dependency. Outside urban areas, cycling is a notably slower mode of transport than its motorised alternatives, and the physical strain and travel speed also limit the distance that a cyclist can cover. With these benefits and drawbacks in mind, we can express the elements that shape demand for non-motorised trips as including:
  • The quality, network, and cohesion of the infrastructure;
  • The spatio-functional structure of the city (location of destinations and starting points, including shops);
  • Population density;
  • Environmental factors, including weather conditions (ambient temperature, exposure to the elements, wind speed, and precipitation), and hilliness;
  • Travel safety (objective and subjective);
  • A given city’s cycling policy;
  • Accessibility of the public bike-share scheme [32,35].
As opposed to motorised transport, the use of bicycle is strongly conditioned by environmental factors, i.e., hilliness, weather, and climate (Table 1) [36].
The impact of these environmental factors on transport behaviour varies depending on the destination, population categories, and geographical contexts. The effects for discretionary travel purposes such as leisure are stronger than for non-discretionary trips such as commuting [37,38]. Sabir [37] showed how weather-related variables impact the selection of transport modes for different trip destinations. In general, windy weather discourages people from cycling and reinforces their inclination for taking the car. Low ambient temperature also translates into a drop in bicycle trips in favour of journeys by car and mass transit, but the trend is reversed when the temperature rises to 25 °C.
Table 1. Environmental factors and their impact on cycling.
DeterminantsInfluence Mode ChoiceReferences
HillinessLess cycling with hillsHunt and Abraham (2007) [39];
Rietveld and Daniel (2004) [40];
Stinson and Bhat (2003) [41]
SeasonMore cycling in summer and
autumn (20% to 10%, 40% to 25%, differs between locations)
Guo et al. (2007) [42];
Stinson and Bath (2003) [41]
TemperatureUnpleasant temperature
corresponds with less cycling
Cold more unpleasant than heat
Bergström and Magnussen (2003) [43];
Brandenburg et al. (2004) [44];
Miranda-Moreno and Nosal (2011) [45];
Nankervis (1999) [46]
RainNegative effect on cycling
Delayed impact of rain on cycling
Ahmed et al. (2012) [47];
Bergström and Magnussen (2003) [43];
Brandenburg et al. (2004) [44]; Miranda-Moreno and Nosal (2011) [45];
Nankervis (1999) [46]
ClimateContinental climates generally have larger seasonal contrasts (hotter summers, colder winters) but smaller day-to-day weather fluctuations.
In continental climates, we expect larger effects from seasonality on travel behaviours, whereas day-to-day weather effects are larger in temperate climates.
Böcker et al. (2013) [48]
Finally, the probability of choosing a bicycle over a car or public transport decreases with a rise in precipitation. As a result, we may generally conclude that ‘nicer’ weather leads to an increase in the percentage of bicycle trips and an analogical drop in car use, whereas in bad weather the bicycle is swapped for the car. The same study also shows that, for shopping trips, the probability of taking a bicycle decreases most if there is precipitation and low temperature (<0 °C), while the highest rise in bicycle use is recorded in hot weather (>20 °C) [37].

3. Research Area

3.1. Outline of the Socio-Economic Characteristics of Łódź

Łódź is a large city and the central administrative unit of the Łódź Province. The city is characterised by relatively high population density (mainly within large housing estates) and a concentric-sectorial spatial structure of population (Figure 1), which developed under the socialist Polish People’s Republic [49]. According to the Polish Central Statistical Office, in 2019, the population of Łódź—which is struggling with a low RNI (−5.61) and a negative net migration rate (−1086 per 1000 residents)—amounted to 679,941 residents, 54% of whom were women (this high female bias of 119 is related to the historical development of the city based on a textile industry, which mainly employed female workers). The city is facing the ever more serious issue of depopulation, which emerged in the 1990s and is so constant that population forecasts predict that by 2050 the city will have shrunk to approximately 484,000 residents. Another problem in Łódź is ageing, which is exceptionally high by national and European scales [50]. According to the demographic prognosis compiled by the Polish Central Statistical Office, the process of ageing in the city is expected to increase—with the percentage of people at pre-productive age (between 2020 and 2040) being predicted to drop from 14.4% to 12.1%, while the share of elderly residents is expected to rise to 27.4%. This process is also expected to be fastest in Łódź when compared to other big cities in Poland.
Average income per capita in Łódź is relatively low (EUR 1073.37) but comparable to other similar urban agglomerations in Poland. After [51], we can state that, in recent years, the city has undergone a major economic, urbanistic, and social metamorphosis. Following the collapse of the once buoyant textile industry in 1990s, the city has transformed itself into a hub of services for business and new technologies, housing offices of major global players, e.g., Infosys, Fujitsu, TomTom, Dell, and BSH. In addition, Łódź is also an important academic centre, with more than 64,400 students attending over 20 tertiary education institutions in the academic year of 2019–2020 (the Polish Central Statistical Office). Another noteworthy fact is that numerous investment projects have been conducted to revitalise the city, thereby improving residents’ quality of life and the general perception of Łódź. The city was among the first to develop and implement a local revitalisation scheme in 2004. At this point, the concept of the so-called Urban Core Zone must be mentioned. The Urban Core Zone is located in the central part of Łódź, has a surface of 1400 ha, and was delineated for the purposes of spatial policy and planning. The oldest and most diverse part of the city, the area was formed primarily in the 19th century and today boasts the greatest assets that fuel urban and cultural development, along with numerous businesses entities and city amenities. The Urban Core Zone is well-developed infrastructurally and lies within the area where the city’s public transport is most efficient. What is more, the area exerts a considerable impact on the operation of the whole city since it is so intensely used and utilised [52].

3.2. Description of Retail Trade

The city centre boasts by far the highest concentration of retail and service facilities. As proven by Dzieciuchowicz [53], the density ratio of retail facilities to population takes a positive value. As for the largest shopping centres, there are several patterns to their location in Łódź (Figure 2): in the city centre, within large housing estates, along the axes that form a continuum from the city centre to these estates, and finally in suburban and peripheral areas [54].
There are 1666 commercial buildings in Łódź. As for the type of store, the local market is dominated by convince stores, the main representative of which is Żabka (9% of all stores). Taking into account the other types of stores, their share in the total of stores is negligible. However, attention should be paid to stores such as Społem (6%), Rossman, Rosa and Biedronka (3%), Livio (2%), as well as Lidli and Pepco (1%). These are general-purpose stores, available in every district of the city.

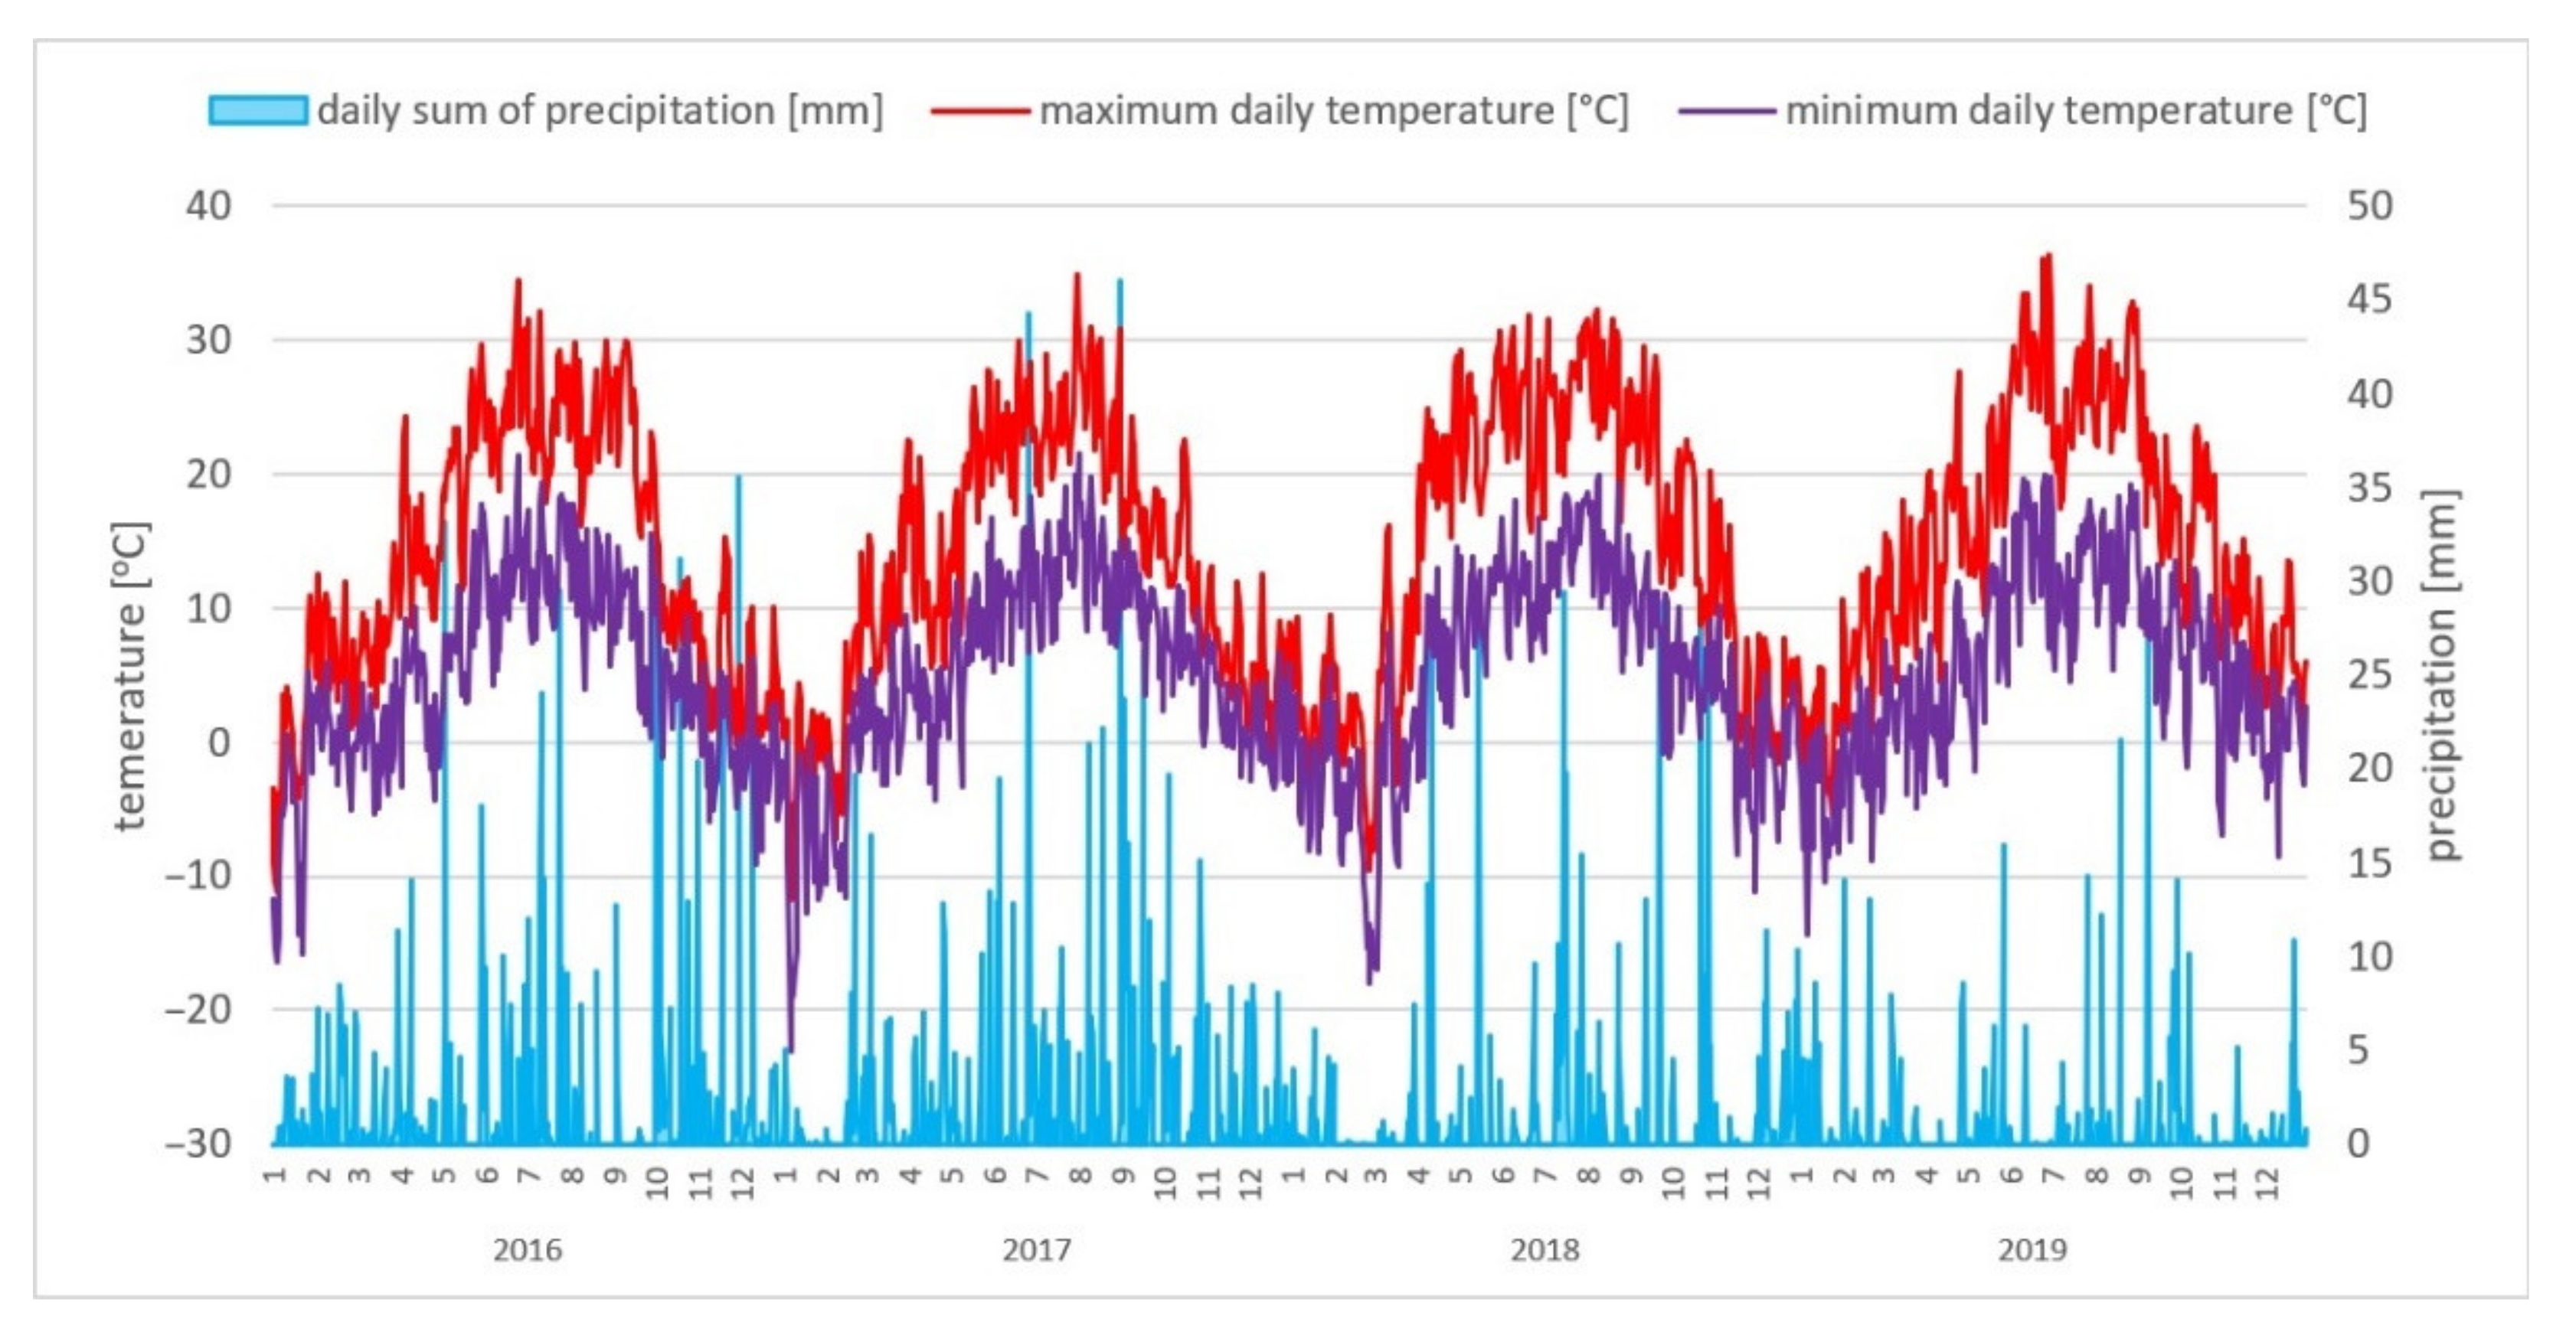
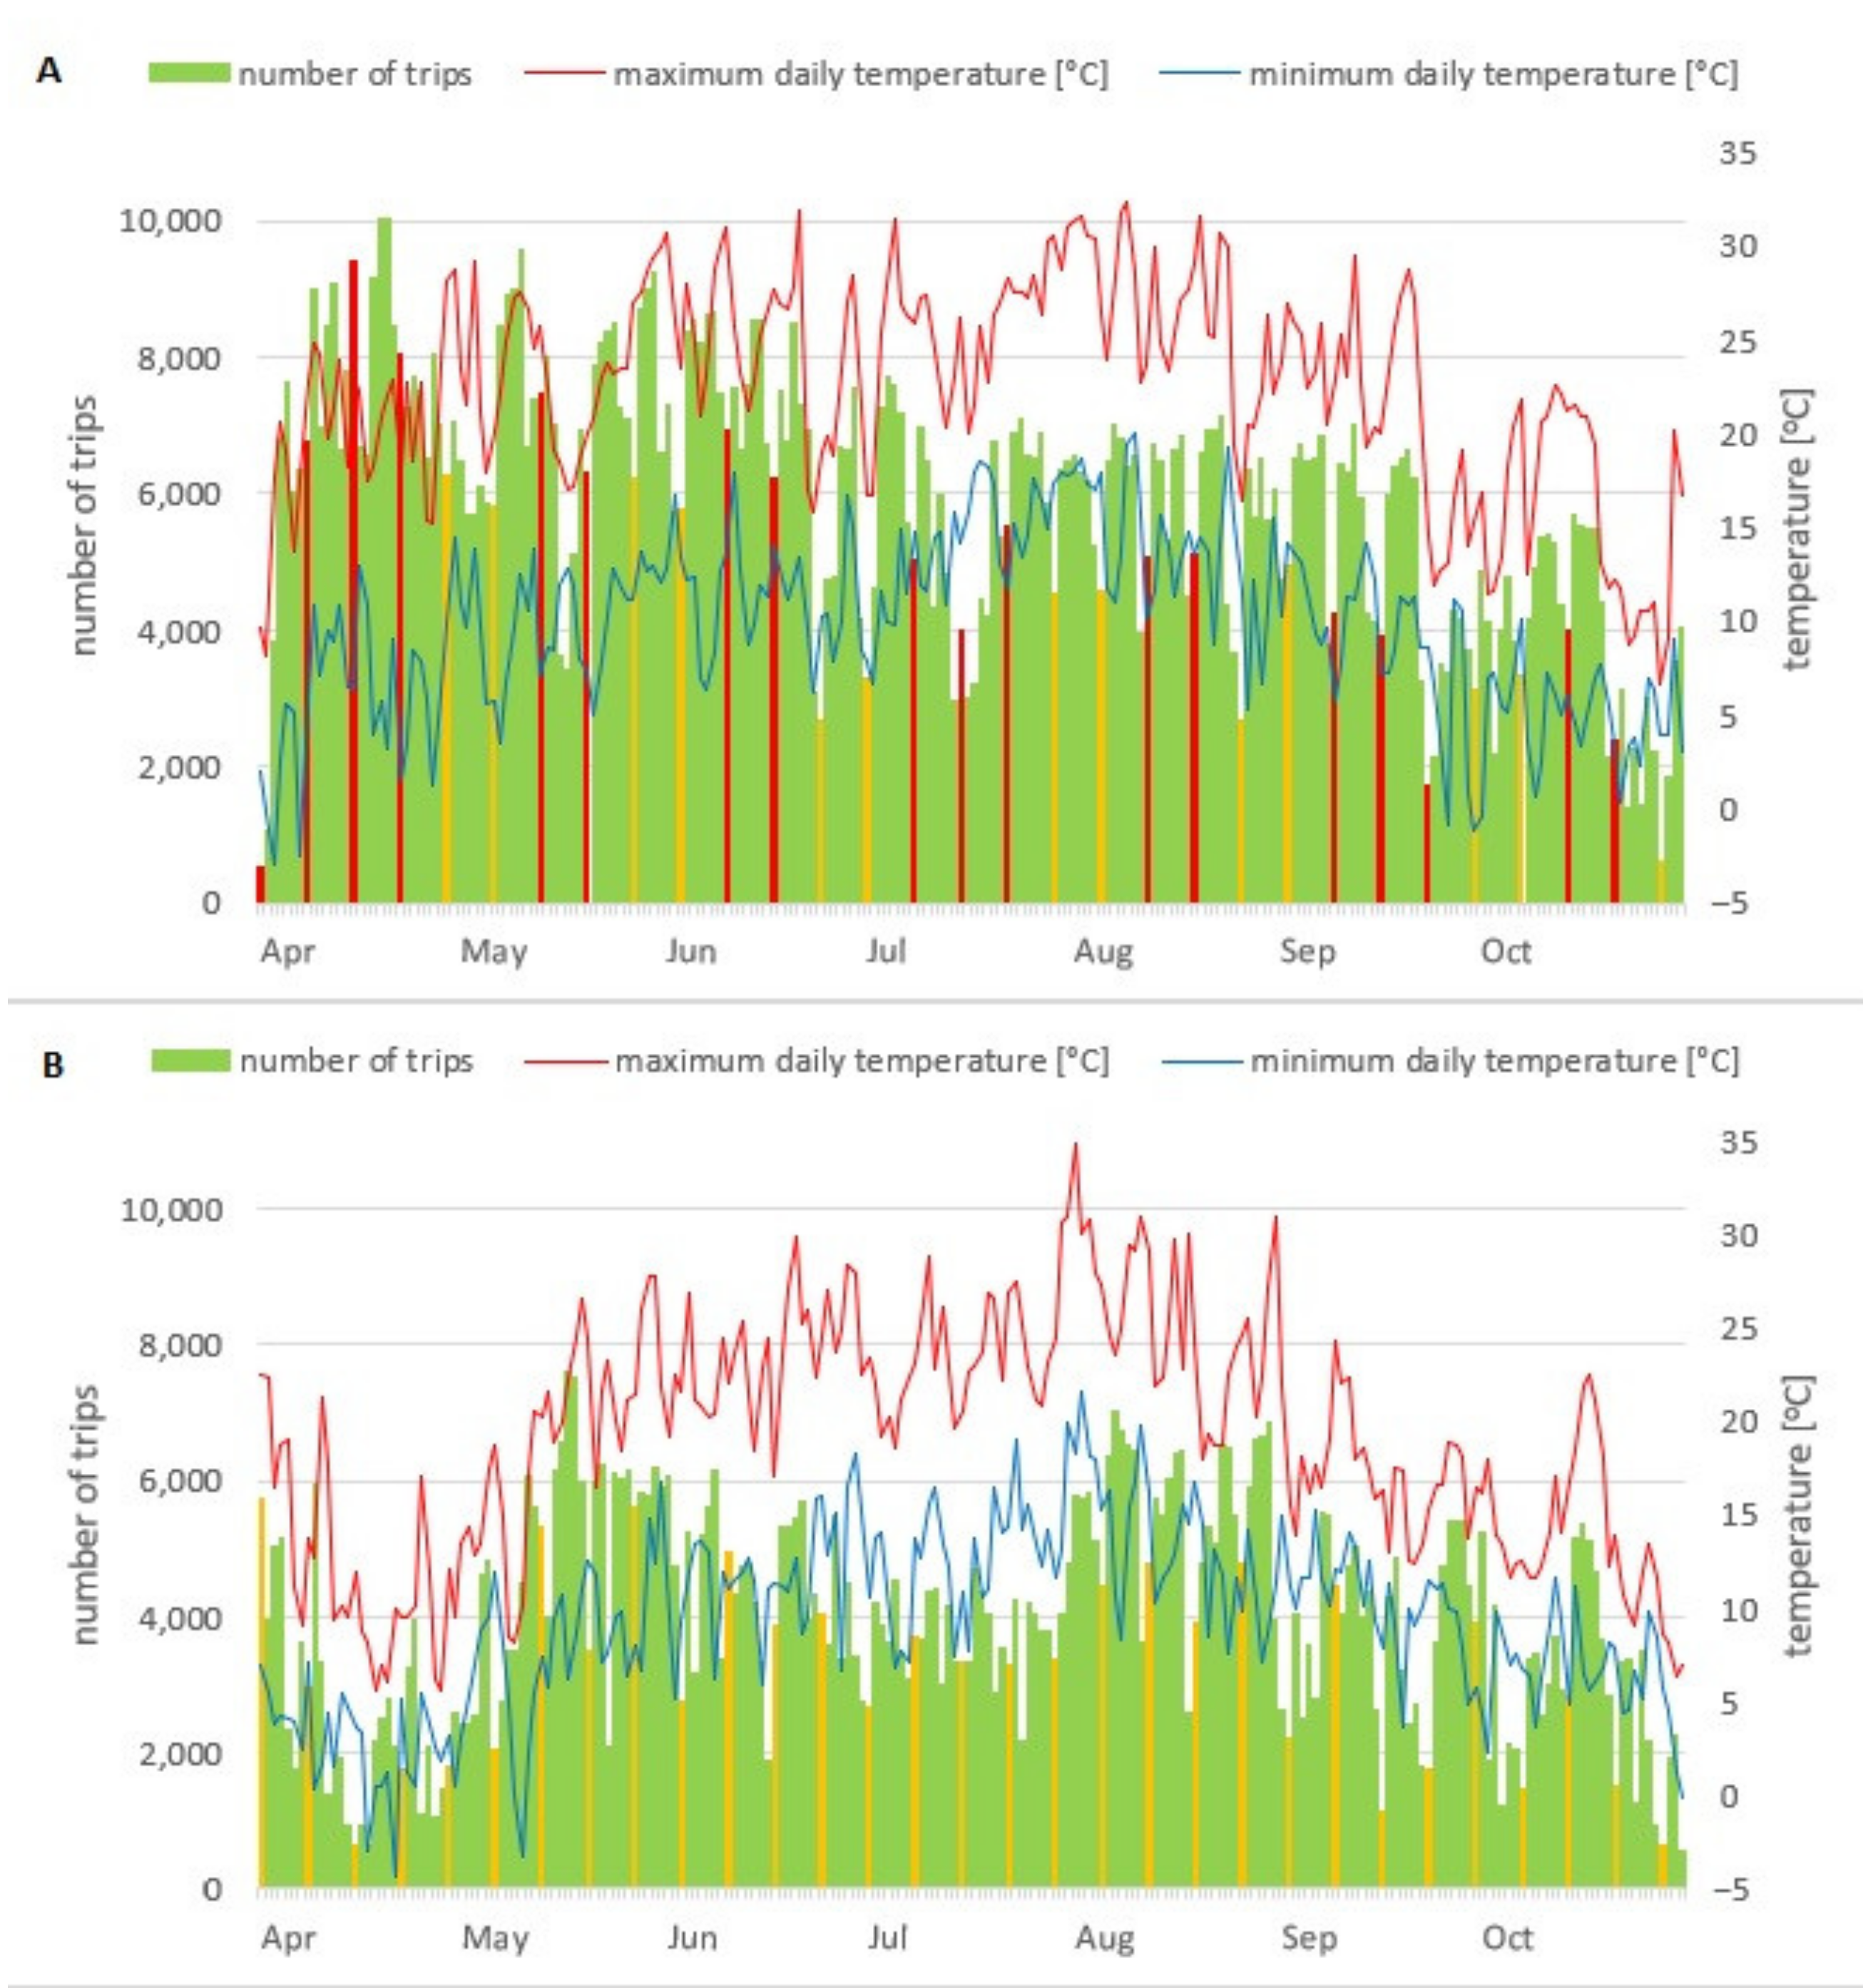
3.3. Environmental Determinants

The use of a bicycle as an alternative mode of transport greatly depends on environmental determinants, with areas having smaller differences in relative altitude offering better conditions for cycling [55]. Altitudes in Łódź range from 163.17 metres above sea level in the southwest (the Smulsko Hollow) to 279.34 metres above sea level in the northeast (the Stoki Plateau) [56], which means that the relatively flat terrain has a positive, significant impact on the popularity of cycling. What does affect the decision to opt for cycling, however (and is therefore worth paying attention to), is local weather conditions, especially when we take into account the research conducted by authors of [32], who emphasise the critical role of weather when people who want to travel around the city make decisions regarding the bike-sharing scheme.
Despite there being no large rivers, lakes, and hills to significantly influence and shape weather conditions in the researched area, we cannot ignore local housing development, whose density, structure, and pattern may impact and alter its intensity when discussing weather in Łódź. In addition, the urban structure of the city is relatively regular and forms a large, homogeneous, and dense metropolis. As shown in Figure 3, the distribution of annual precipitation is comparable for individual seasons and corresponds with results recorded nationwide. The highest total rainfall is observed during summer months, especially in July, followed by late October and November. Temperatures recorded in Łódź between 2016 and 2018 also seem to correspond with those observed in other regions of Poland. Highest daily temperatures (up to 35 °C) are recorded in late June and early July, whereas the coldest days (down to −25 °C) are observed early in the year, i.e., in late January and early February. Finally, the greatest daily amplitudes are reported at the turn of August and September.

3.4. Łódź Public Bike-Share Scheme against the Background of the City’s Transport System—Development, Management, and Exploitation

For many years, the public bike-share scheme (hereinafter referred to as Łódź Public Bike or ŁPB) attracted the attention of both potential users and the authorities responsible for mass transit in the city. The idea was first born in 2008 [57], but, due to various legal and organisational perturbations, the scheme was not implemented until the second quarter of 2016. In 2013, substantive steps were taken to prepare for its launch through a project within the framework of the local budget chosen by residents in a vote. The scheme was added to the Long-Term Financial Forecast, and its implementation eventually began in 2015 through a tender that involved bids from three companies (NextBike Polska, BilkU, and Romet Rental System). At a total cost exceeding EUR 26 million, the ŁPB scheme was eventually launched by NextBike Polska on 30 April 2016, with 100 docking stations and 1000 bikes, with an additional docking station being funded by the Port Łódź Shopping Centre in July 2016.
From the very beginning, the scheme was enthusiastically welcome by the residents, which was noticeable even before it became operational. According to the data on the ŁPB website, nearly 3000 users registered on the scheme 48 h before its official launch, and after three days, the operator’s database listed over 16,000 customers and as many as 24,683 rental operations. Within the first fortnight, the number of users doubled, and the total number of rentals exceeded 100,000. With 1 million rentals and 57,000 users after three months, the ŁPB scheme became a national phenomenon, while other large cities only reached comparable results much later. In Warsaw, total rentals only exceeded 1 million after more than a year; in Wrocław, it took over two years; and in Lublin, 21 months [58]. After [32], we must state that the ŁPB scheme smoothly integrated with the city’s structure, even though it had been in operation for a short time. The same study shows that the average time of bike rental ranged from 10 to 20 min and helped the city in its drive to implement the objectives of sustainable urban transport. As of late 2018, the ŁPB offered 152 docking stations and 1534 bicycles, which made it the second-largest bike-sharing scheme in Poland (following the Warsaw-based Verturilo, which provided 368 stations and 5319 bikes). The ŁPB stations are located mainly within the city centre, with the majority being located in the Urban Core Zone (Figure 4). However, their presence is significantly lower in large housing estates (e.g., Retknia), while some areas are completely lacking direct access to docks (e.g., Teofilów). A major benefit of the ŁPB scheme is the low fee, as the initial 20 min are free of charge, and the following 40 min cost just EUR 0.211; the second hour, EUR 0.661; and each subsequent hour, EUR 1.1 (Euro-zloty exchange rate as of 27/04/2021). Unfortunately, the operation of the scheme has currently been suspended due to administrative and tender-related conditions, and the system is waiting to be relaunched.

4. Materials and Methods

Data from 2017–2018 was used for all calculations in the study. Information on bicycle traffic comes from a database containing a registry of GPS locations of bike rentals. The initial set of data (obtained from the official administrator, Łódź City Hall) consisted of multiple CSV files, each containing a 60 min record of all trips taken by the 2284 ŁPB bikes. For instance, the data for 2018 was stored in over 5000 files, and each contained information on GPS signal recording time (to an accuracy of 1 s); a given bike’s identification number; the longitude and latitude of its location; an explanation of whether a given record documents the start, duration, or termination of the trip; and the identification number of a given rental operation. With this amount of unconnected data, it was necessary to combine all CSV files so that subsequent points within a given bicycle trip could be tracked, regardless of its duration (and the number of initial CSV files that documented it). Next, the obtained bike movements were saved as shapefiles, together with the aforementioned attributed information, since this format is compatible with the GIS software tools. Then, we could connect all subsequent points within each trip by creating linear layers. Although the bike’s location was recorded at an extremely high frequency (every few seconds), in some cases, the physical line joining two subsequent points on a route was closer to physical distance (straight line) than the actual distance between them (the course of a given road). However, this limitation was taken into account when the results were analysed and conclusions were drawn. In order to determine the density of bicycle traffic in the city, we applied a set of tools for density analysis, which are part of the GIS spatial analysis system and based on kernel density estimation [59,60]. Since the set is part of non-parametric statistics, there was no prerequisite to provide information on the type of variable distribution [61,62], and the applied cell size was 20 × 20 metres. There are many research applications for such GPS data. Naumov and Banet used them in their research, i.a., to identify the segment of recreational trips, for example, from Wavelo bike-sharing system in Kraków (Poland) [63], and to describe an approach to the travel demand estimation [64].
Data on the city’s spatial management was retrieved from the Database of Topographic Objects administered by the Geodesic and Cartographic Documentation Centre and its regional branches. The data on the type of land cover used to determine ‘the functional background’ of trips taken by the ŁPB users covers 100% of the city’s area, and its spatial resolution is a single cadastral parcel.
In order to specify the correlation between selected weather conditions and ŁPB bike trips, regression analysis was utilised. When building the regression models, we successively applied maximum and minimum daily air temperatures and daily totals of precipitation. This approach allowed us to determine the shape of this correlation, as opposed to the previously applied Pearson correlation coefficient, which only measures the strength of the correlation between the variables and its direction. The impact that weather has on the selection of a bicycle as an alternative mode of transport is a subject commonly discussed in the literature. A popular approach in the matter is to juxtapose cycling frequency or bike trip data with weather data, called ‘revealed accounts of weather approach’. A vast majority of studies focus on extreme weather conditions, which means that the impact of typical weather on people’s everyday habitual transport behaviour is researched significantly less often [48]. In our study, we used archival data from the Institute of Meteorology and Water Management at the National Research Institute that shows maximum and minimum daily temperatures and daily totals of precipitation recorded by a weather station in Łódź.

5. Results and Discussion

Generally, the ŁPB traffic in 2018 was denser than in 2017, which may be a combined effect of the greater popularity of the still-novel sharing scheme in Poland [32] and a warmer spring. Despite this, the differences between the two analysed years are not considerable in terms of the daily structure of trips on a weekly basis. Approximately 15% of trips were taken on each workday (with the average difference between the two years amounting to 0.05 p.p.), about 12% on Saturdays (in this case, the percentage of trips in the total number of journeys in a week was lower by 0.12 p.p. for 2018), and 11.5% on Sundays (the percentage of Sunday trips in the total number of trips in a week was higher by 0.35 p.p. in 2018 when compared to 2017). The higher average usage of the ŁPB bikes on working days is concordant with observations made in other cities [65]. Negligible year-on-year changes in time distribution of trip percentages for weekdays prove that Łódź residents have consistent transport behaviour in the working week and reveal slightly bigger differences during weekends for the analysed time aggregation. The aforementioned year-on-year differences recorded for weekends are an interesting premise for us to determine how Sunday retail restrictions (still quite lenient following their implementation in 2018) impacted transport behaviour of ŁPB users. The impact of retail restrictions on the mobility and transport behaviour of Łódź residents on a week-on-week basis in 2018 with regard to other transport sub-systems was proved by Borowska-Stefańska et al. [6,8]. However, our study focuses on an alternative mode of transport that is at least partially vulnerable to changing weather [66,67]. Therefore, not only should it take weather into account, but, in fact, it must also be preceded by a statistical interpretation of the impact it has on the aforementioned changes resulting from retail restrictions. In general, analyses of weather-related impacts are relatively common in the literature [68,69].
Statistical analysis reveals differences in the relationship between weather and the ŁPB traffic structure. Correlation indicators which present—in a very general manner—the impact of weather on traffic, allow us to determine that particular weather conditions do not manifest an interrelation with the average travel time and speed of ŁPB trips (with the exception of daily totals of precipitation and their weak correlation with the average travel time and speed on weekends). As for the impact of weather on the number of trips, we must indicate a moderate positive correlation with ambient temperature (its maximum values) and a weak negative correlation with recorded totals of precipitation. When it comes to travel time, we can observe slightly stronger correlations with the researched thermal indicators (Table 2). Interestingly, authors of [70] discerned similar correlations between weather and the use of car-sharing schemes, indicating that, along with temperature, other conditions that they analysed (wind and precipitation) were negatively correlated.
More profound statistical analyses allowed us to determine that an increase in maximum temperatures translated into a rise in the number of bicycle trips and their length. At the same time, comparative analysis of empirical measurements and their statistical estimation based on the regression model enabled us to distinguish one basic correlation. Namely, an increase in temperatures was accompanied by greater differentiation of the number of trips. In low temperatures, the actual number of trips differs one-directionally from its estimates, i.e., it is noticeably lower. When maximum daily temperatures begin to grow, the lowest actual numbers of trips also diverge by a comparable absolute value (from the estimated pattern), but there is a large number of actual trips that significantly exceed the applied pattern. These observations are convergent for weekends and working days (Figure 5), and larger numbers of trips on warmer days are concordant with the results of analyses conducted in Toronto [71].
Similar conclusions can be drawn upon the analysis of correlations between trip length and maximum recorded temperatures at the weekend. For weekdays, differentiation of trip length is noted regardless of daily temperature peaks, while weekend trips seem to be more strongly correlated with their optional destinations, which may explain differences in the matter, as optional destinations are commonly related to recreation, and, as a result, they require longer distances to be covered. Our analyses showed that weekend cycling is less susceptible to the impact of weather than cycling on working days, which is also confirmed by other studies, e.g., [72].
Since the analytical approaches presented above are characterised by a relatively high level of time data aggregation, they might show a slightly blurred picture of correlations between weather and the number of ŁPB trips due to the multitude of factors that shape urban mobility. Applying a lower level of analysis (daily scale and a simple diagram of weather impacting the number of trips) makes it possible to indicate that weather conditions are an important factor modifying the level of the ŁPB-related mobility. From the aforementioned warmer spring that was one of the factors behind denser bike traffic in 2018 to a significant drop in the ŁPB trips in the autumn (colder days), temperature seems to be a seasonal modifier of the number of bike trips, causing sharp changes, and the value of the daily peak temperature that ‘moderates’ these sharp spikes is 20 °C (Figure 6). In contrast, precipitation may impact the number of bike trips in a different manner, as there seems to be no ‘moderating’ value, i.e., any precipitation at all decreases their number, while heavy rainfall (over 10 mm a day) drastically reduces it (Figure 7).
Many researchers believe that the strength of impact that environmental factors have when people choose bicycle as their mode of transport depends on a given individual’s subjective preferences. As a result, substantial spatial differentiation of the impact is observed, depending greatly on the nature of a given urban community. Precipitation, therefore, may play a considerably smaller role in restricting the use of bicycle in some cities [67], while in others—including Łódź—its impact on bike traffic might be quite discernible. Existing studies that focus on other locations show that, when it comes to ambient temperatures, the warmer it gets, the more eager people become to use bicycle-sharing schemes, although extremely hot weather reverses the trend [68]. However, our analyses (for days with maximum temperatures exceeding 30 °C) indicated no negative impact of extremely high temperatures on the intensity of ŁPB use in the city, and in this respect, our study is concordant with the research performed in Toronto [71]. However, it must be reemphasised that the impact of environmental factors depends, to a large extent, on the nature of local communities. Perhaps the reason behind the divergent observations in the matter [73] lies in the fact that different societies manifest different tolerance for hot weather as far as cycling is concerned. When modelling bike traffic in New York, authors of [74] argue that temperatures in the city are a significant predictive variable for estimating traffic. What is more, the negative impact of rain revealed in our results is confirmed by the majority of other studies [75,76], as they indicate that the negative influence it has on the number of trips does not depend on the intensity of precipitation but on the fact that it occurs at all.
Obviously, being natural phenomena, environmental factors are not influenced by the day of the week and are unrelated to any social arrangements, e.g., division of the week into working days and weekend. For that reason, analyses of large time strings may apply random distribution of deterministic changes of different and individual weather conditions. These analyses usually reveal measurements whose stimulant and de-stimulant variables cancel each other out, i.e., random factors become diffused (Table 2). However, the situation is completely different when it comes to social arrangements that are connected to mobility. These can be said to be strongly linked to the said division of the weekly calendar, the clearest example of which is a division into working and free days—making the week a seven-day cycle, where five consecutive days are workdays and the remaining two are devoted to rest and relaxation (in Poland, just as in most other regions the world, these are customarily Saturday and Sunday). Factors that determine trips on workdays differ from those at the weekend (for short-term mobility, they include changes in starting points and destinations when the trip-based approach is applied). Analogically to workdays, we predict that Sunday retail restrictions will be noticeable and undistorted by temporary changes (e.g., of weather conditions).
On the basis of the aforementioned assumptions, we can distinguish several daily cycles related to bike traffic on the different types of days of the week (Figure 8). When it comes to trips taken by the ŁPB users, the following regularities are observed:
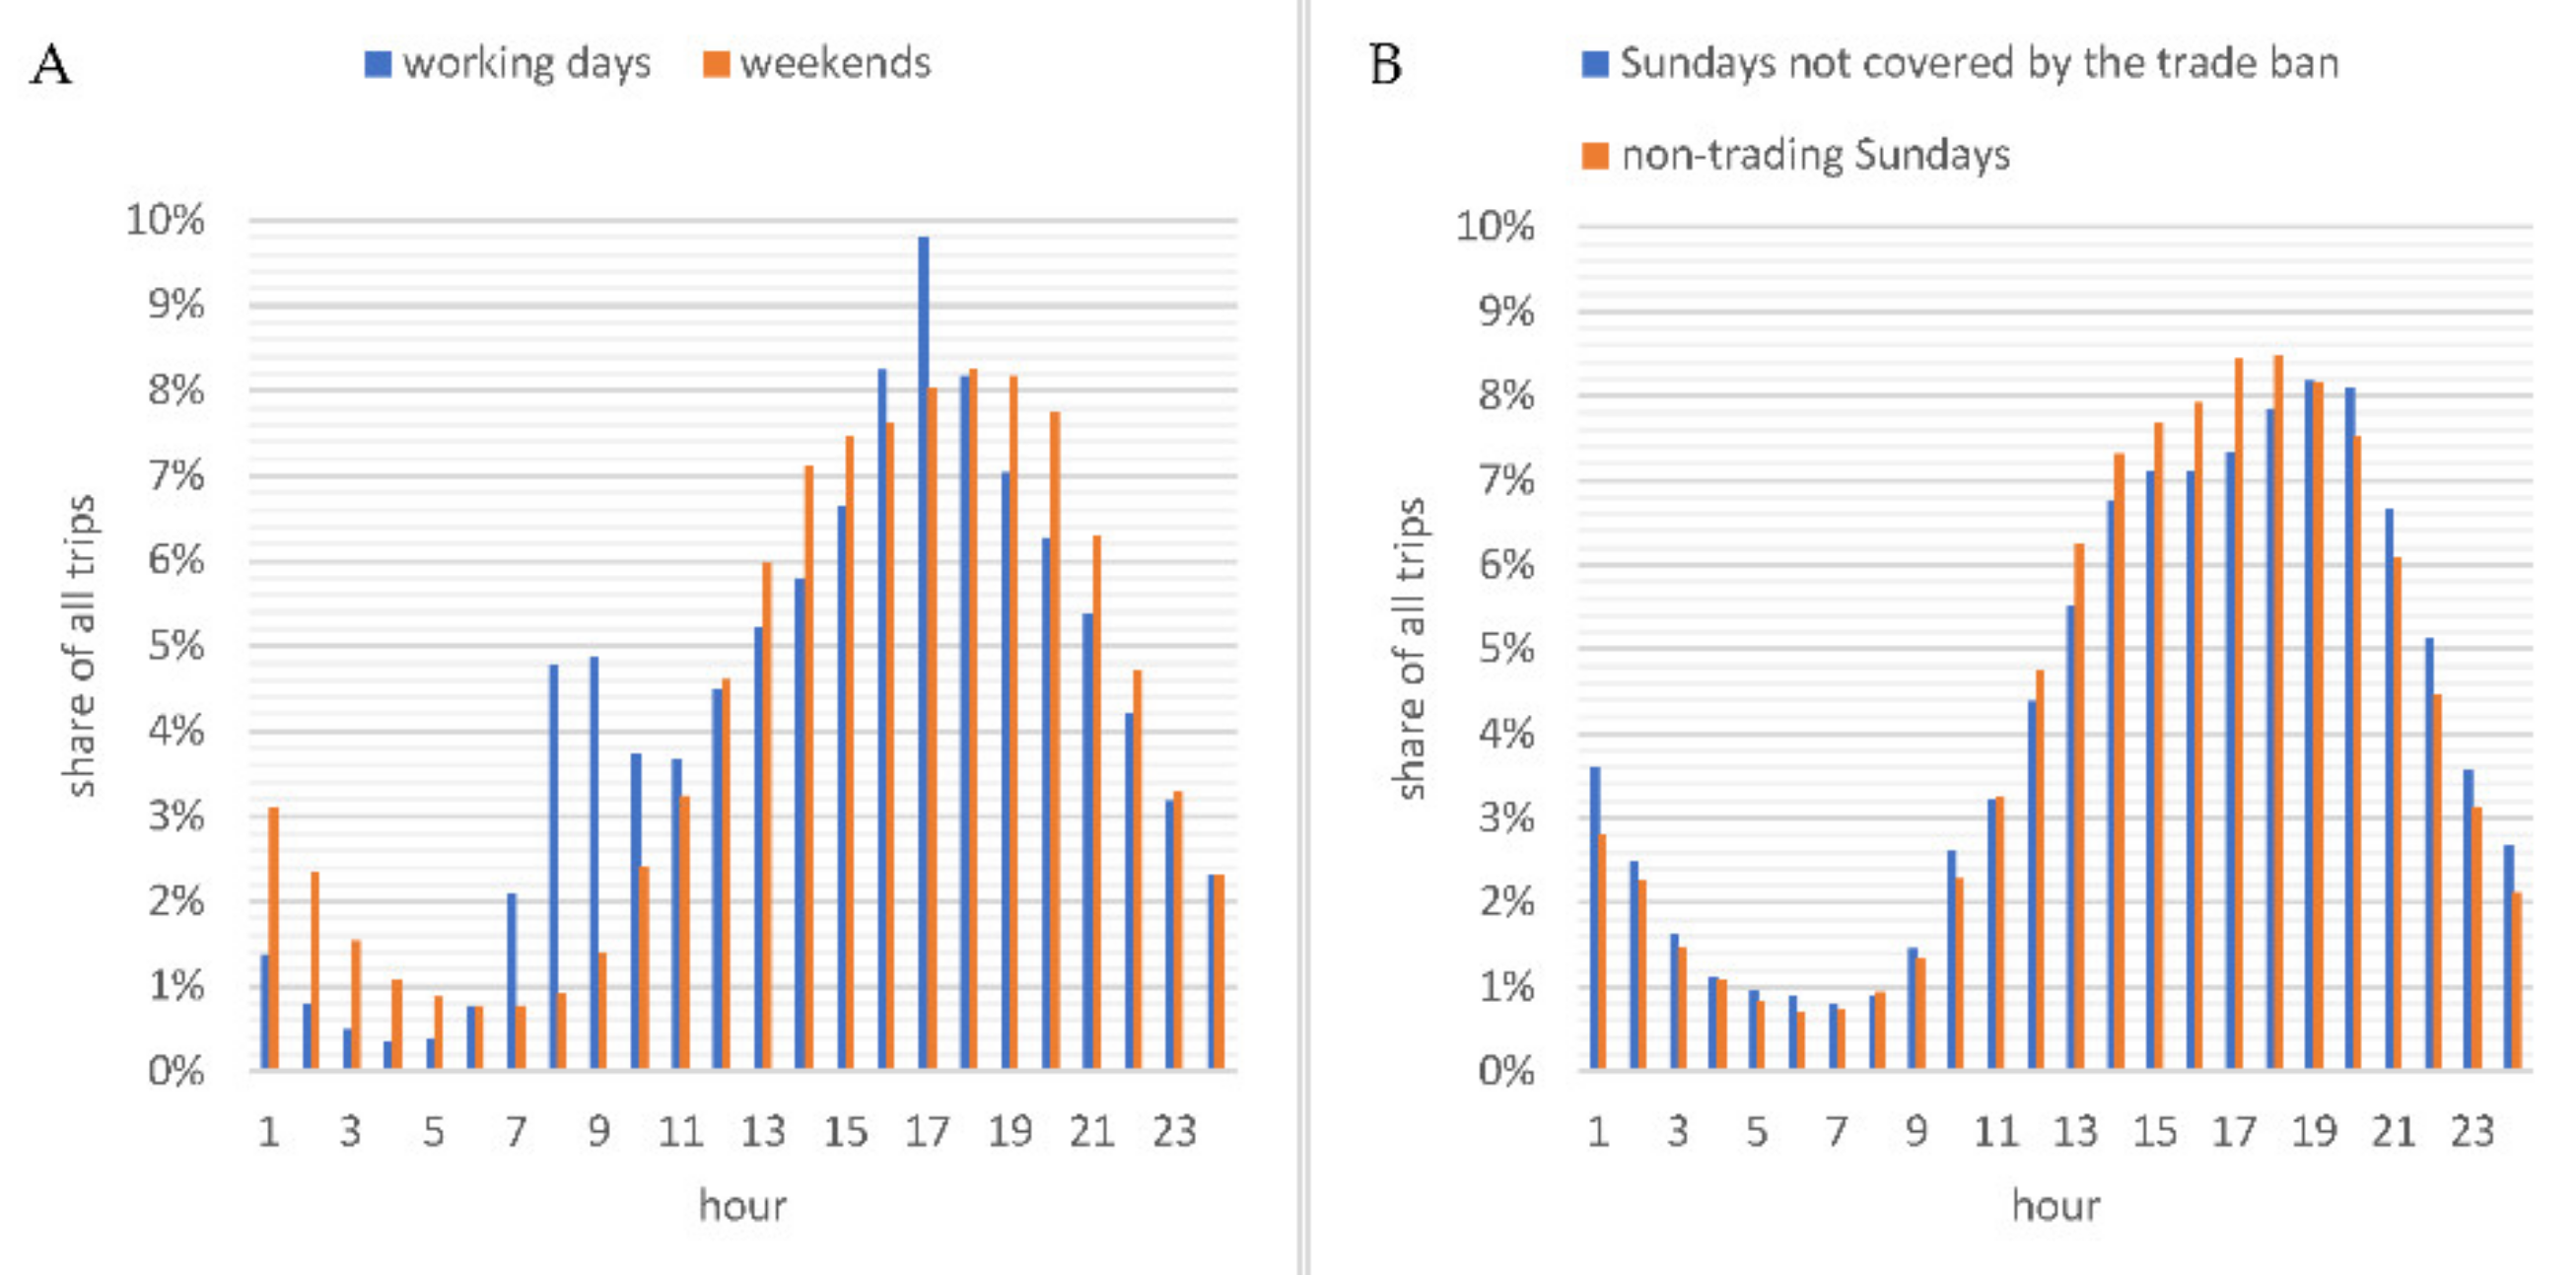
  • On weekdays, the first wave of traffic can be observed from 7 a.m., reaching its peak at 9 a.m. and followed by a gradual decline in trips until 11 a.m., which is then followed by another increase that lasts 6 h (peak at 5 p.m.), followed by a steady and later rather dramatic drop.
  • On weekends, relatively high values (when compared to weekdays) are observed in the first hour of the day (on average, 3% of daily trips are taken between midnight and 1 a.m.), and then there is a continuous decline until morning hours, when traffic begins to increase, reaching its peak between 6 and 7 p.m. After this, the number of trips begins to drop, and in the final hour of the day reaches values lower than the average for the first hour of the day.
Distribution of traffic on the ŁPB network corresponds with daily cycles observed in other cities that boast similar transport solutions (they are the most important traffic determinant, for instance, in studies by Sathishkumar and Yongyun [65] and the sub-system of private car transport in Łódź [77]). This could be a premise to conclude that bikes offered within the sharing scheme are partially a substitute for cars.
Interestingly, time distribution of bike traffic on Sundays may imply a completely different purpose for which this mode of transport is used on free days. Namely, there is more bicycle traffic on non-trading Sundays, when the scope of optional mobility related to shopping is greatly limited (Figure 9), which may mean that the ŁPB scheme is more often used for recreation.
Besides disparities in time distribution of ŁPB trips taken on different days of the week and the different types of Sundays, we can also observe differences between other features of trips (Figure 9). These indicate that it may not be a great simplification to conclude as above, i.e., that there is a shift in purpose for which the ŁPB bikes are used on weekends—from daily commuting to work, school and shops on weekdays to recreation and leisure on free days. This is because, on weekends, bike trips are, on average, longer (in terms of time and distance) and taken at a slower speed. What is more, differences between trading and non-trading Sundays also show that, during Sundays with retail restrictions, ŁPB bikes are used for longer, farther, and slower rides (Table 3).
Additional data that confirms the thesis that the ŁPB scheme is most often used for recreation on weekends is the spatial distribution of ŁPB trips (Figure 10). El-Assi et al. [71] show that, apart from temperature, land use is a factor that strongly correlates with trips taken by users of bike-sharing schemes. On weekends, the densest ŁPB traffic is recorded in the city centre of Łódź and, in particular, around the main public amenities, the core of which are in Piotrkowska Street (Figure 11).
Differences in the ŁPB traffic on trading and non-trading Sundays, previously indicated in the statistical analysis, are also visible, since, on Sundays with retail restrictions, the concentration of bicycle traffic is significantly higher in the vicinity of Piotrkowska Street and the spatial scope of trips is noticeably greater (Figure 12).
Finally, the aforementioned changes in the number of ŁPB trips on non-trading Sundays and their predicted causes seem to be ultimately confirmed by the restructured analysis of maps of dominating road traffic, displayed in graphs (Figure 13) and tables (Table 4) that present the structure of source–destination relationship and in tables that show the general spatio-functional structure of the city (Table 3). Juxtaposition of traffic structures on the basis of graphs makes it possible to observe a rise in the percentage of trips (whose total absolute number increases, as shown in the previous analyses) between residential areas and forests and countryside. On non-trading Sundays, ŁPB trips were definitely less often commenced and terminated in the following areas: commercial and service buildings, grassy vegetation and forest areas; however, the percentage of trips that were taken across these areas increased (Table 4).
Depending on the type of Sunday, changes can be observed in the percentages of trips taken within the borders of the Urban Core Zone (a higher share on trading Sundays) and trips outside the Urban Core Zone (a higher percentage on non-trading Sundays). Percentages of other types of trips (that differ in their starting point, the longest part of the route, and the final destination) do not demonstrate equally discernible changeability (Table 5). In general, on trading Sundays 53.4% of intermediate points were located exclusively within the Urban Core Zone, while on non-trading Sundays the percentage was lower by 9.1 p.p.
On trading and non-trading Sundays, as little as 1.2% of all intermediate points were recorded in areas of shopping malls. Regardless of the type of Sunday, a shopping centre was the final destination for less than 1% of all ŁPB bike users, who equally rarely began their trips there.
It is worth illustrating our analyses with another table, which shows disproportions in starting points and destinations of ŁPB trips and the location of the scheme’s nodes (docking stations) in the Urban Core Zone and other parts of the city (Table 6). Since most of the bike-sharing infrastructure has been developed within the Urban Core Zone trips usually originate there (57% of all rentals on non-trading Sundays and 60% on trading Sundays). In the Urban Core Zone, a narrow majority of trips begin from the docking stations, while most trips outside the Urban Core Zone do not.
The data presented above indicate that there is a change in transport behaviour of Łódź residents that stems from the statutory Sunday retail restrictions. Although Goetzke and Rave [78] argue that the probability of choosing a bicycle to go shopping increases together with the level of local cycling culture and greatly depends on the infrastructure, it may also be impacted by the type of shopping. Plazier et al. [79] prove that as little as 1% of trips for a substantial shop are taken by bike, while 2.7% of everyday convenience shopping is done that way. Before the implementation of the statutory retail restrictions, Sunday was the main day when Poles did their weekly shop [80], which might be a premise for the empirical observations conducted by Dudek [81] in Krakow, and Kowalski and Wiśniewski [82], who reported increased weekend car traffic (and carpark occupancy) in a shopping mall in Łódź. As a result, we may conclude that trips taken by ŁPB users are generally unrelated to shopping, and since Sunday retail restrictions have left people with a substantial amount of leisure time that they previously spent shopping, they now more frequently devote this time to recreational purposes (visiting friends/family, active recreation, time spent in fresh air), for which an increasing number of people choose the bicycle.

6. Conclusions

The purpose of the study was to determine changes in the transport behaviour of users of a public bike-share scheme in a large Polish city—Łódź. On the basis of the conducted analyses, we determined that no changes are recorded (on a year-on-year basis) in the weekly distribution of the percentages of ŁPB bike trips during the working week. Analyses of correlations between the selected weather conditions and their impact on ŁPB traffic density show a positive correlation between temperatures and the average length and number of trips. A comparative analysis of empirical measurements of the popularity of ŁPB and their statistical estimation based on the regression model allowed us to distinguish one basic correlation. Namely, an increase in temperatures was accompanied by greater differentiation in the number of trips. Temperature impacts the volume of bike trips, and this influence is particularly noticeable when it rises above 20 °C. This higher differentiation of the results of empirical observations when compared to the estimated value for that temperature can be explained by the existence/presence of another factor that impacts bike traffic. We believe that this is, inter alia, precipitation. If the rainfall is above 10 mm per day, it drastically reduced the popularity of the bike-sharing scheme. Our analyses also showed that weekend cycling is less susceptible to the impact of weather than cycling on workdays. However, due to the immense influence of precipitation (in particular), it is important and necessary for cyclists to be forewarned about weather conditions if we want to increase the share of this mode of transport in the modal division (which is crucial for accomplishing the objectives of sustainable urban mobility). For instance, detailed short-term weather forecasts could be displayed real-time on variable-message signs in the vicinity of docking stations, which would, in consequence, encourage more people to use this means of transport for daily commuting.
The daily ebb and flow of traffic density during the working week is concordant with observations made for other transport sub-systems. In this regard, we noted differences in the hourly distribution of trips between trading and non-trading Sundays. In general, the number of trips is higher on non-trading Sundays between 12 and 6 p.m. when compared to Sundays without retail restrictions. The differences between the two types of Sundays also show that, on days with retail restrictions, the ŁPB scheme is used for longer, farther, and slower bike rides, which may indicate a larger percentage of reactional trips. This is reflected by the spatial distribution of Sunday rides, which are noticeably longer (distance) on non-trading Sundays. These observations are also confirmed by analyses of maps of traffic structure based on detailed plans of land use in the vicinity of starting points and destinations and maps of traffic structures created on the basis of the city’s general spatio-functional structure (location of facilities in relation to the Urban Core Zone, etc.).
Even though our study returned relatively unambiguous conclusions, the impact of retail restrictions on cyclists’ behaviour must not be overinterpreted, as it may also be determined by other factors, including the individual traits of a given cyclist. The vast capacity of the database (in terms of measurement periods and the number of recorded trips) followed by its meticulous analysis still allowed us to determine certain regularities, despite the imperfections named earlier in the paper. Besides these imperfections, one must also be aware that conclusions on starting points and destinations that are drawn on the basis of type of land use in their vicinity may verge on an overgeneralisation. After all, a bicycle might be just one of several modes of transport used during a given trip, and the fact that it begins/ends at a certain point is not always a resultant of a traffic attractor or generator therein (e.g., in order to avoid extra payment, a user may leave the bike far away from their actual destination).

Author Contributions

Conceptualization, S.W. and M.K.; methodology, M.K. and M.M.; software, M.K.; validation, M.B.-S., M.K., P.K., and S.W.; formal analysis, M.B.-S., M.M., M.K., P.K., and S.W.; investigation, M.B.-S., M.K., P.K., and S.W.; resources, M.M. and M.K.; data curation, M.K. and S.W.; writing—original draft preparation, M.B.-S., M.K., P.K., and S.W.; writing—review and editing, M.B.-S., M.M., M.K., P.K., and S.W.; visualization, M.K. and S.W.; supervision, M.B.-S., M.K., P.K.; M.M., and S.W.; project administration, S.W.; funding acquisition, S.W. All authors have read and agreed to the published version of the manuscript.

Funding

This paper was produced under the research project no. 2019/35/D/HS4/00697, financed from the funds of the National Science Centre in Poland.

Institutional Review Board Statement

Not applicable.

Informed Consent Statement

Not applicable.

Conflicts of Interest

The authors declare no conflict of interest.

References

  1. Piotrowicz, K. The Occurrence of Unfavorable Thermal Conditions on Human Health in Central Europe and Potential Climate Change Impacts: An Example from Cracow, Poland. Environ. Manag. 2009, 44, 766–775. [Google Scholar] [CrossRef] [PubMed]
  2. Skuterud, M. The impact of Sunday shopping on employment and hours of work in the retail industry: Evidence from Canada. Eur. Econ. Rev. 2005, 49, 1953–1978. [Google Scholar] [CrossRef]
  3. Dijkgraaf, E.; Gradus, R. Collusion in the Dutch waste collection market. Local Gov. Stud. 2007, 33, 573–588. [Google Scholar] [CrossRef]
  4. Genakos, C.; Danchev, S. Evaluating the Impact of Sunday Trading Deregulation Christos Genakos Svetoslav Danchev. In CEP Discussion Paper; Centre for Economic Performance (CEP): London, UK, 2015. [Google Scholar]
  5. Stelina, J. Legal restrictions on work on Sundays and festive days in Poland. Istor. Cult. Cetatenie Un. Eur. 2018, 11, 105–114. [Google Scholar]
  6. Borowska-Stefańska, M.; Kowalski, M.; Wiśniewski, S. Changes in urban transport behaviours and spatial mobility resulting from the introduction of statutory Sunday retail restrictions: A case study of Lodz, Poland. Morav. Geogr. Rep. 2020, 28, 29–47. [Google Scholar] [CrossRef]
  7. Gurazda, P. Ograniczenie handlu a konstytucyjne prawa i wolności przedsiębiorców. Zesz. Stud. Kół Nauk. Wydz. Prawa Adm. UAM 2020, 10, 67–81. [Google Scholar]
  8. Borowska-Stefańska, M.; Kowalski, M.; Wiśniewski, S.; Szustowski, B.; Maczuga, M. The impact of statutory sunday trading restrictions… on the choices of residents of a large polish city with regard to transport behaviours and mobility. Stud. Reg. Lokal. 2020, 82, 33–59. [Google Scholar] [CrossRef]
  9. Bamwesigye, D.; Hlavackova, P. Analysis of sustainable transport for smart cities. Sustainability 2019, 11, 2140. [Google Scholar] [CrossRef] [Green Version]
  10. Nosal, K.; Solecka, K. Application of AHP method for multi-criteria evaluation of variants of the integration of Urban public transport. Transp. Res. Procedia 2014, 3, 269–278. [Google Scholar] [CrossRef] [Green Version]
  11. Russo, F.; Comi, A. City Characteristics and Urban Goods Movements: A Way to Environmental Transportation System in a Sustainable City. Procedia-Soc. Behav. Sci. 2012, 39, 61–73. [Google Scholar] [CrossRef]
  12. Cherrett, T.; Allen, J.; McLeod, F.; Maynard, S.; Hickford, A.; Browne, M. Understanding urban freight activity—Key issues for freight planning. J. Transp. Geogr. 2012, 24, 22–32. [Google Scholar] [CrossRef] [Green Version]
  13. Taniguchi, E. Concepts of City Logistics for Sustainable and Liveable Cities. Procedia-Soc. Behav. Sci. 2014, 151, 310–317. [Google Scholar] [CrossRef] [Green Version]
  14. Kijewska, K.; Iwan, S. Analysis of the Functioning of Urban Deliveries in the City Centre and its Environmental Impact Based on Szczecin Example. Transp. Res. Procedia 2016, 12, 739–749. [Google Scholar] [CrossRef] [Green Version]
  15. Banister, D. Unsustainable Transport; Routledge: London, UK, 2005; ISBN 9781134325122. [Google Scholar]
  16. Krykewycz, G.; Puchalsky, C.; Rocks, J.; Bonnette, B.; Jaskiewicz, F. Defining a Primary Market and Estimating Demand for Major Bicycle-Sharing Program in Philadelphia, Pennsylvania. Transp. Res. Rec. J. Transp. Res. Board 2010, 2143, 117–124. [Google Scholar] [CrossRef]
  17. Biernat, E.; Buchholtz, S.; Bartkiewicz, P. Motivations and barriers to bicycle commuting: Lessons from Poland. Transp. Res. Part F Traffic Psychol. Behav. 2018, 55, 492–502. [Google Scholar] [CrossRef]
  18. Buehler, R.; Pucher, J. (Eds.) City Cycling; The MIT Press: Cambridge, MA, USA, 2012; ISBN 9780262305914. [Google Scholar]
  19. Pucher, J.; Buelher, R. At the Frontiers of Cycling: Policy innovations in the Netherlands, Denmark and Germany. World Transp. Policy Pract. 2007, 13, 8–57. [Google Scholar]
  20. Pucher, J.; Buehler, R.; Seinen, M. Bicycling renaissance in North America? An update and re-appraisal of cycling trends and policies. Transp. Res. Part A Policy Pract. 2011, 45, 451–475. [Google Scholar] [CrossRef]
  21. Goodwin, P.; Van Dender, K. The prospects for future levels of car access and use. Transp. Rev. 2013, 33, 243–254. [Google Scholar] [CrossRef]
  22. Macioszek, E.; Świerk, P.; Kurek, A. The bike-sharing system as an element of enhancing sustainable mobility—A case study based on a city in Poland. Sustainability 2020, 12, 3285. [Google Scholar] [CrossRef] [Green Version]
  23. Kowalska-Pyzalska, A.; Kott, J.; Kott, M. Why Polish market of alternative fuel vehicles (AFVs) is the smallest in Europe? SWOT analysis of opportunities and threats. Renew. Sustain. Energy Rev. 2020, 133, 110076. [Google Scholar] [CrossRef]
  24. Priemus, H.; Nijkamp, P.; Banister, D. Mobility and spatial dynamics: An uneasy relationship. J. Transp. Geogr. 2001, 9, 167–171. [Google Scholar] [CrossRef]
  25. Bertolini, L.; le Clercq, F.; Kapoen, L. Sustainable accessibility: A conceptual framework to integrate transport and land use plan-making. Two test-applications in the Netherlands and a reflection on the way forward. Transp. Policy 2005, 12, 207–220. [Google Scholar] [CrossRef]
  26. Shaheen, S.A.; Guzman, S.; Zhang, H. Bikesharing in Europe, the Americas, and Asia. Transp. Res. Rec. J. Transp. Res. Board 2010, 2143(1), 159–167. [Google Scholar] [CrossRef] [Green Version]
  27. Wang, M.; Zhou, X. Bike-sharing systems and congestion: Evidence from US cities. J. Transp. Geogr. 2017, 65, 147–154. [Google Scholar] [CrossRef]
  28. Otero, I.; Nieuwenhuijsen, M.J.; Rojas-Rueda, D. Health impacts of bike sharing systems in Europe. Environ. Int. 2018, 115, 387–394. [Google Scholar] [CrossRef] [PubMed]
  29. Zhang, Y.; Mi, Z. Environmental benefits of bike sharing: A big data-based analysis. Appl. Energy 2018, 220, 296–301. [Google Scholar] [CrossRef]
  30. Midgley, P. The Role of Smart Bike-sharing Systems in Urban Mobility. Journeys 2009, 2, 23–31. Available online: https://www.lta.gov.sg/ltaacademy/doc/IS02-p23%20Bike-sharing.pdf (accessed on 23 May 2021).
  31. Raviv, T.; Tzur, M.; Forma, I.A. Static repositioning in a bike-sharing system: Models and solution approaches. EURO J. Transp. Logist. 2013, 2, 187–229. [Google Scholar] [CrossRef] [Green Version]
  32. Borowska-Stefańska, M.; Wiśniewski, S.; Kowalski, M. Funkcjonowanie Roweru Publicznego w Dużym Mieście: Przykład Łodzi; Łódź University Press: Łódź, Poland, 2020. [Google Scholar]
  33. Heinen, E.; van Wee, B.; Maat, K. Commuting by Bicycle: An Overview of the Literature. Transp. Rev. 2010, 30, 59–96. [Google Scholar] [CrossRef]
  34. Olde Kalter, M.J. Vaker op de Fiets? Effecten van Overheidsmaatregelen (More often the Bicycle? Effects of Government Measures); Kennisinstituut voor Mobiliteitsbeleid: Den Haag, The Netherlands, 2007. [Google Scholar]
  35. Pikora, T.; Giles-Corti, B.; Bull, F.; Jamrozik, K.; Donovan, R. Developing a framework for assessment of the environmental determinants of walking and cycling. Soc. Sci. Med. 2003, 56, 1693–1703. [Google Scholar] [CrossRef]
  36. Wardman, M.; Hatfield, R.; Page, M. The UK national cycling strategy: Can improved facilities meet the targets? Transp. Policy 1997, 4, 123–133. [Google Scholar] [CrossRef]
  37. Sabir, M. Weather and Travel Behaviour. Doctoral Dissertation, Vrije Universiteit Amsterdam, Amsterdam, The Netherlands, 2011. [Google Scholar]
  38. Aaheim, H.A.; Hauge, K.E. Impacts of Climate Change on Travel Habits A National Assessment Based on Individual Choices; Center for International Climate and Environmental Research, Blindern: Oslo, Norway, 2005; pp. 1–38. [Google Scholar]
  39. Hunt, J.D.; Abraham, J.E. Influences on bicycle use. Transportation 2007, 34, 453–470. [Google Scholar] [CrossRef]
  40. Rietveld, P.; Daniel, V. Determinants of bicycle use: Do municipal policies matter? Transp. Res. Part A Policy Pract. 2004, 38, 531–550. [Google Scholar] [CrossRef]
  41. Stinson, M.A.; Bhat, C.R. Analysis Using a Stated Preference Survey. Transp. Res. Rec. J. Transp. Res. Board 2003, 1828, 107–115. [Google Scholar] [CrossRef]
  42. Guo, J.Y.; Bhat, C.R.; Copperman, R.B. Effect of the built environment on motorized and nonmotorized trip making: Substitutive, complementary, or synergistic? Transp. Res. Rec. 2007, 1–11. [Google Scholar] [CrossRef] [Green Version]
  43. Bergström, A.; Magnusson, R. Potential of transferring car trips to bicycle during winter. Transp. Res. Part A Policy Pract. 2003, 37, 649–666. [Google Scholar] [CrossRef]
  44. Brandenburg, C.; Matzarakis, A.; Arnberger, A. The effects of weather on frequencies of use by commuting and recreation bicyclists. Adv. Tour. Climatol. 2004, 12, 189–197. [Google Scholar]
  45. Miranda-Moreno, L.; Nosal, T. Weather or not to cycle: Temporal trends and impact of weather on cycling in an urban environment. Transp. Res. Rec. 2011, 42–52. [Google Scholar] [CrossRef]
  46. Nankervis, M. The effect of weather and climate on bicycle commuting. Transp. Res. Part A Policy Pract. 1999, 33, 417–431. [Google Scholar] [CrossRef]
  47. Ahmed, F.; Rose, G.; Jakob, C. Commuter cyclist travel behavior. Transp. Res. Rec. 2013, 76–82. [Google Scholar] [CrossRef]
  48. Böcker, L.; Dijst, M.; Prillwitz, J. Impact of Everyday Weather on Individual Daily Travel Behaviours in Perspective: A Literature Review. Transp. Rev. 2013, 33, 71–91. [Google Scholar] [CrossRef]
  49. Dzieciuchowicz, J. Ludność Łodzi—Rozwój i Przemiany Strukturalne; Łódź University Press: Łódź, Poland, 2014. [Google Scholar]
  50. Janiszewska, A. Senior-Oriented Policy for the Ageing Society of the City of Łódź. Pr. Nauk. Uniw. Ekon. We Wrocławiu 2018, 510, 75–89. [Google Scholar] [CrossRef] [Green Version]
  51. Stawasz, D.; Wawrzyniec, R. Kultura i jej wpływ na rozwój społeczno-gospodarczy Łodzi. Stud. Ekon. 2018, 376, 211–224. [Google Scholar]
  52. Integrated Development Strategy for Lodz 2020+; Łódź City Hall: Łódź, Poland, 2012; p. 23.
  53. Dzieciuchowicz, J. Handel w Przestrzeni Wielkomiejskiej. Przykład Łodzi; Wyd. UŁ: Łódź, Poland, 2013. [Google Scholar]
  54. Kowalski, M.; Wiśniewski, S. Dostępność transportowa łódzkich centrów handlowych. Handel Wewnętrzny 2017, 3, 339–357. [Google Scholar]
  55. Du, G. Development Mode Selection of Urban Slow Traffic System. IOP Conf. Ser. Mater. Sci. Eng. 2018, 392, 062153. [Google Scholar] [CrossRef] [Green Version]
  56. Goździk, J.; Wieczorkowska, J. Atlas Miasta Łodzi, Plansza VIIII: Rzeźba Terenu. ŁTN; ŁTN: Łódź, Poland, 2002. [Google Scholar]
  57. Pamuła, A.; Gontar, B. Rower miejski w Łodzi—Ocena użytkowników. Nierówności Społeczne Wzrost Gospod. 2017, 52, 490–499. [Google Scholar] [CrossRef]
  58. Infobike Łódzki Rower Publiczny Zakończył Sezon—1,7 mln Wypożyczeń. Available online: https://transinfo.pl/infobike/lodzki-rower-publiczny-zakonczyl-sezon-17-mln-wypozyczen-_more_110447/ (accessed on 26 April 2021).
  59. Mohaymany, A.S.; Shahri, M.; Mirbagheri, B. GIS-based method for detecting high-crash-risk road segments using network kernel density estimation. Geo-Spat. Inf. Sci. 2013, 16, 113–119. [Google Scholar] [CrossRef]
  60. Xie, Z.; Yan, J. Detecting traffic accident clusters with network kernel density estimation and local spatial statistics: An integrated approach. J. Transp. Geogr. 2013, 31, 64–71. [Google Scholar] [CrossRef]
  61. Borruso, G. Network Density Estimation: A GIS Approach for Analysing Point Patterns in a Network Space. Trans. GIS 2008, 12, 377–402. [Google Scholar] [CrossRef]
  62. Downs, J.A. Time-Geographic Density Estimation for Moving Point Objects. In Geographic Information Science. GIScience 2010. Lecture Notes in Computer Science; Springer: Berlin/Heidelberg, Germany, 2010; Volume 6292, pp. 16–26. [Google Scholar]
  63. Naumov, V.; Banet, K. Using Clustering Algorithms to Identify Recreational Trips within a Bike-Sharing System. In Reliability and Statistics in Transportation and Communication. RelStat 2019. Lecture Notes in Networks and Systems; Springer: Cham, Switzerland, 2020; Volume 117, pp. 130–138. [Google Scholar]
  64. Naumov, V.; Banet, K. Estimating Parameters of Demand for Trips by Public Bicycle System Using GPS Data. In Smart and Green Solutions for Transport Systems. TSTP 2019. Advances in Intelligent Systems and Computing; Springer: Cham, Switzerland, 2020; Volume 1091, pp. 213–224. [Google Scholar]
  65. Sathishkumar, V.E.; Cho, Y. A rule-based model for Seoul Bike sharing demand prediction using weather data. Eur. J. Remote Sens. 2020, 53, 166–183. [Google Scholar] [CrossRef] [Green Version]
  66. Sears, J.; Flynn, B.S.; Aultman-Hall, L.; Dana, G.S. To Bike or Not to Bike. Transp. Res. Rec. J. Transp. Res. Board 2012, 2314, 105–111. [Google Scholar] [CrossRef]
  67. Ashqar, H.I.; Elhenawy, M.; Rakha, H.A. Modeling bike counts in a bike-sharing system considering the effect of weather conditions. Case Stud. Transp. Policy 2019, 7, 261–268. [Google Scholar] [CrossRef]
  68. Eren, E.; Uz, V.E. A review on bike-sharing: The factors affecting bike-sharing demand. Sustain. Cities Soc. 2020, 54, 101882. [Google Scholar] [CrossRef]
  69. Martinez, M. The Impact Weather Has on NYC Citi Bike Share Company Activity. J. Environ. Resour. Econ. Colby 2017, 4, 12. [Google Scholar]
  70. Saneinejad, S.; Roorda, M.J.; Kennedy, C. Modelling the impact of weather conditions on active transportation travel behaviour. Transp. Res. Part D Transp. Environ. 2012, 17, 129–137. [Google Scholar] [CrossRef] [Green Version]
  71. El-Assi, W.; Salah Mahmoud, M.; Nurul Habib, K. Effects of built environment and weather on bike sharing demand: A station level analysis of commercial bike sharing in Toronto. Transportation 2017, 44, 589–613. [Google Scholar] [CrossRef]
  72. Zhao, J.; Wang, J.; Xing, Z.; Luan, X.; Jiang, Y. Weather and cycling: Mining big data to have an in-depth understanding of the association of weather variability with cycling on an off-road trail and an on-road bike lane. Transp. Res. Part A Policy Pract. 2018, 111, 119–135. [Google Scholar] [CrossRef]
  73. Kim, K. Investigation on the effects of weather and calendar events on bike-sharing according to the trip patterns of bike rentals of stations. J. Transp. Geogr. 2018, 66, 309–320. [Google Scholar] [CrossRef]
  74. Cantelmo, G.; Kucharski, R.; Antoniou, C. Low-Dimensional Model for Bike-Sharing Demand Forecasting that Explicitly Accounts for Weather Data. Transp. Res. Rec. J. Transp. Res. Board 2020, 2674, 132–144. [Google Scholar] [CrossRef]
  75. Corcoran, J.; Li, T.; Rohde, D.; Charles-Edwards, E.; Mateo-Babiano, D. Spatio-temporal patterns of a Public Bicycle Sharing Program: The effect of weather and calendar events. J. Transp. Geogr. 2014, 41, 292–305. [Google Scholar] [CrossRef]
  76. Hyland, M.; Hong, Z.; de Farias Pinto, H.K.R.; Chen, Y. de F.; Chen, Y. Hybrid cluster-regression approach to model bikeshare station usage. Transp. Res. Part A Policy Pract. 2018, 115, 71–89. [Google Scholar] [CrossRef]
  77. Kowalski, M.; Wiśniewski, S. Natężenie ruchu a zagospodarowanie Łodzi—Zarys problematyki w świetle danych z Obszarowego Systemu Sterowania Ruchem. Pr. Kom. Geogr. Komun. PTG 2017, 20, 20–36. [Google Scholar] [CrossRef] [Green Version]
  78. Goetzke, F.; Rave, T. Bicycle Use in Germany: Explaining Differences between Municipalities with Social Network Effects. Urban Stud. 2011, 48, 427–437. [Google Scholar] [CrossRef] [PubMed]
  79. Plazier, P.A.; Weitkamp, G.; van den Berg, A.E. “Cycling was never so easy!” An analysis of e-bike commuters’ motives, travel behaviour and experiences using GPS-tracking and interviews. J. Transp. Geogr. 2017, 65, 25–34. [Google Scholar] [CrossRef] [Green Version]
  80. Sagan, A.; Łapczyński, M. Badania Marketingowe. Podstawy Metodologiczne; Materiały Dodatkowe: Warsow, Poland, 1998. [Google Scholar]
  81. Dudek, M. Analiza wykorzystania parkingów przy galerii handlowej na przykładzie Krakowa. Zesz. Nauk. SITK RP ODDZIAŁ W KRAKOWIE 2013, 1, 63–73. [Google Scholar]
  82. Kowalski, M.; Wiśniewski, S. Centrum handlowe jako czynnik ruchotwórczy w transporcie samochodowym—Przykład Portu Łódź. Przegląd Geogr. 2017, 89, 617–639. [Google Scholar] [CrossRef] [Green Version]
Figure 1. Location of bike docking stations and cycle paths against spatial differentiation of population density in Łódź. Source: own elaboration based on data from the Łódź City Hall, OpenStreetMap, and the Database of Topographic Objects.
Remotesensing 13 03597 g001
Figure 2. Location of bike docking stations and cycle paths against the network of retail facilities and spatial differentiation of forms of land cover in Łódź. Source: own elaboration based on data from the Łódź City Hall, OpenStreetMap, and the Database of Topographic Objects.
Remotesensing 13 03597 g002
Figure 3. Differentiation of total daily precipitation and maximum and minimum daily temperatures in Łódź between 2016 and 2019. Source: own elaboration based on archival data of the Institute of Meteorology and Water Management at the National Research Institute.
Remotesensing 13 03597 g003
Figure 4. Location of the ŁPB docking stations and cycle paths against other elements of the transport infrastructure in Łódź; Source: own elaboration based on the Łódź City Hall, OpenStreetMap, and the Database of Topographic Objects.
Remotesensing 13 03597 g004
Figure 5. Correlation between the maximum daily temperature and the number (A,C,E) and length (B,D,F) of trips taken by users of the ŁPB scheme throughout the week (A,B) on working days (C,D) and on weekends (E,F) in Łódź in 2018. Source: own elaboration based on the Łódź City Hall and archival data of the Institute of Meteorology and Water Management at the National Research Institute.
Remotesensing 13 03597 g005
Figure 6. Daily number of ŁPB trips against differentiation of maximum and minimum daily temperatures in Łódź in 2017 (A) and 2018 (B); green bar–Mon–Fri, yellow bar–trading Sunday, red bar–non-trading Sunday. Source: own elaboration based on data from the Łódź City Hall and archival data of the Institute of Meteorology and Water Management at the National Research Institute.
Remotesensing 13 03597 g006
Figure 7. Daily number of ŁPB trips against differentiation of daily totals of precipitation in Łódź in 2017 and 2018. Source: own elaboration based on data from the Łódź City Hall and archival data of the Institute of Meteorology and Water Management at the National Research Institute.
Remotesensing 13 03597 g007
Figure 8. Time distribution of ŁPB trips divided into workdays and weekends (A) and non-trading and trading Sundays (B) in Łódź in 2018. Source: own elaboration based on data from the Łódź City Hall.
Remotesensing 13 03597 g008
Figure 9. Differentiation of average length and duration of ŁPB trips in Łodź in 2017 and 2018. Source: own elaboration based on data from the Łódź City Hall.
Remotesensing 13 03597 g009
Figure 10. Spatial differentiation of ŁPB traffic density on workdays (A) and on weekends (B) in Łódź in 2018. Source: own elaboration based on data from the Łódź City Hall.
Remotesensing 13 03597 g010
Figure 11. Spatial differentiation of ŁPB traffic density on workdays (A,B) and on weekends (C,D) between 8.00 a.m. and 9.59 a.m. (A,C) and from 4.00 p.m. to 5.59 p.m. (B,D) in Łódź in 2018. Source: own elaboration based on data from the Łódź City Hall.
Remotesensing 13 03597 g011
Figure 12. Differentiation of the ŁPB traffic density on non-trading (A,C,E,G) and trading (B,D,F,H) Sundays at the start of the trip (A,B), during the trip (C,D), at peak hours (E,F), and at the end of the trip (G,H) in Łódź in 2018. Source: own elaboration based on data from the Łódź City Hall.
Remotesensing 13 03597 g012
Figure 13. The structure of share of source–destination relationship for ŁPB trips on non-trading (A) and trading (B) Sundays in Łódź in 2018 (only relations that constitute at least 1% of all relationships were taken into account). Source: own elaboration based on data from the Łódź City Hall.
Remotesensing 13 03597 g013
Table 2. Table of correlations between ŁPB trips and weather conditions in Łódź in 2018.
No. of TripsAverage Travel TimeAverage LengthAverage Speed
trips taken throughout the week
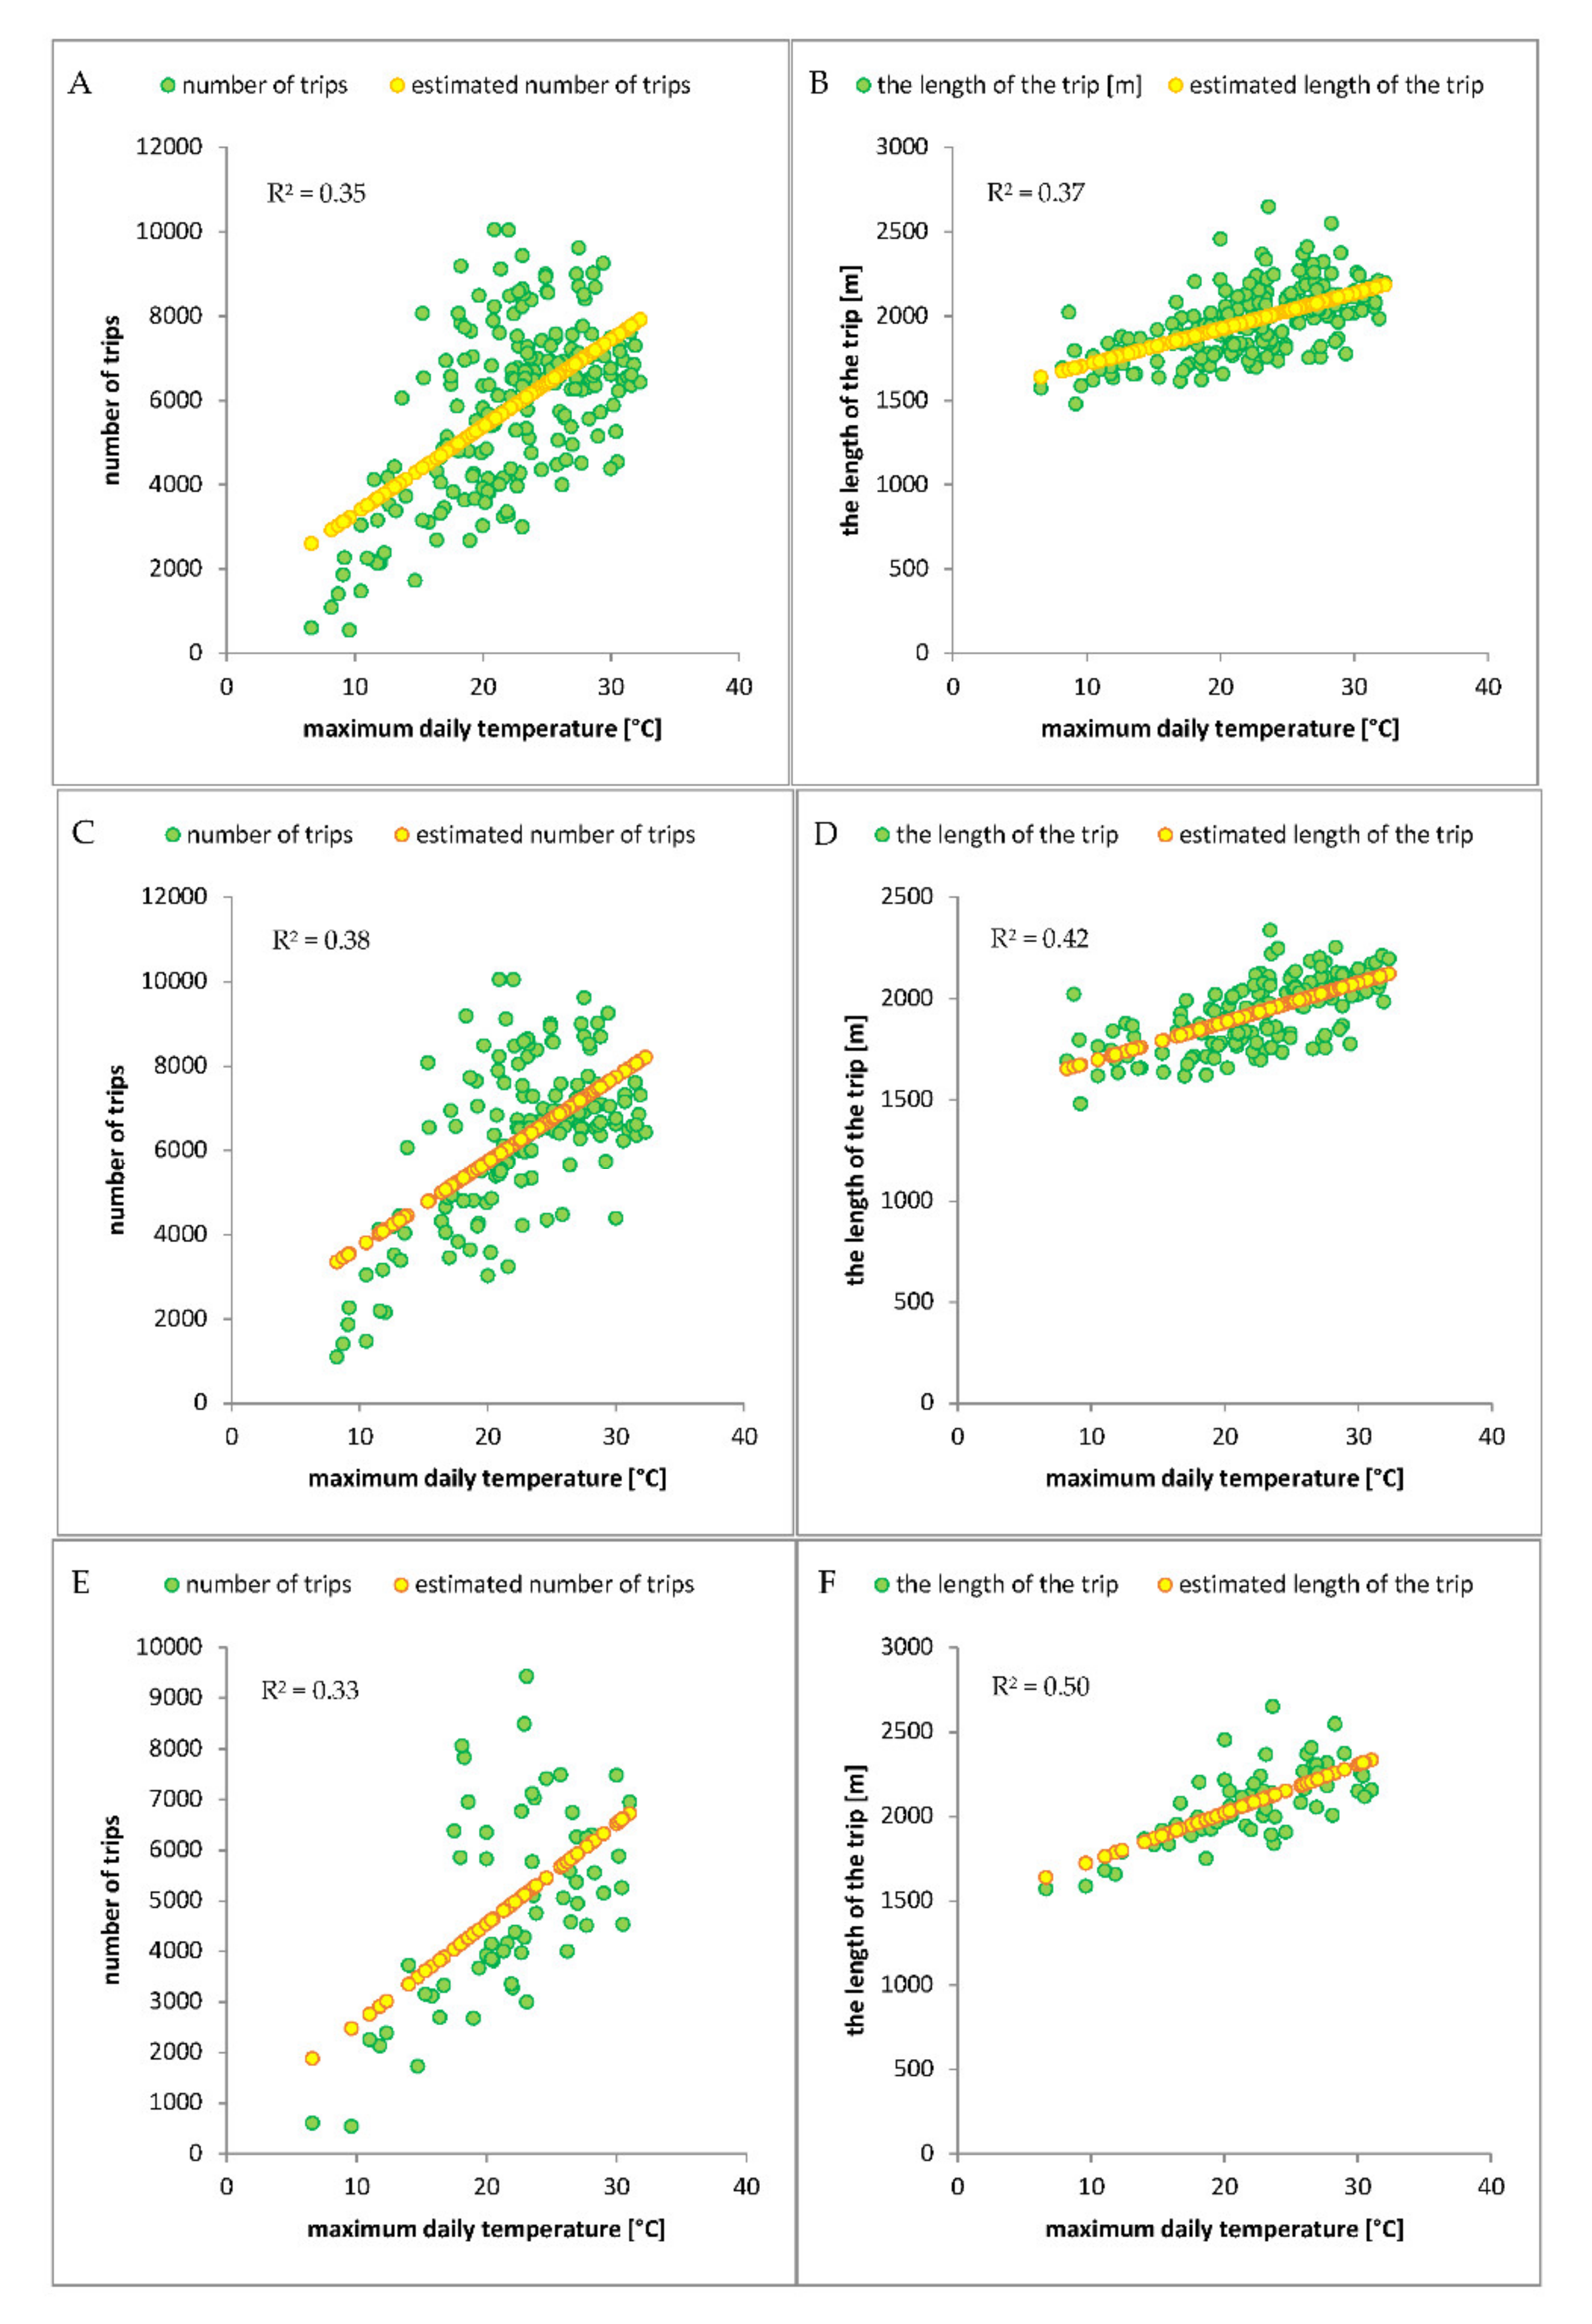
maximum daily temperature [°C]0.5940.0400.604−0.058
minimum daily temperature [°C]0.1980.0070.4740.147
daily total of precipitation [mm]−0.3610.107−0.1620.124
trips taken from Monday to Friday
maximum daily temperature [°C]0.618−0.0350.649−0.126
minimum daily temperature [°C]0.2190.0580.5590.094
daily total of precipitation [mm]−0.3690.334−0.1040.057
trips taken on weekends
maximum daily temperature [°C]0.5770.3070.710−0.113
minimum daily temperature [°C]0.122−0.0210.4610.258
daily total of precipitation [mm]−0.421−0.301−0.2870.334
Source: own elaboration based on data from the Łódź City Hall and archival data of the Institute of Meteorology and Water Management at the National Research Institute.
Table 3. Static characteristics of features of ŁPB trips and the selected weather conditions in Łódź by days of the week during the bike-sharing season of 2018.
DayPercentage of Total TripsAverage Trip Duration [min]Average Trip Length [m]Average Speed [km/h]Average Max. Daily Temperature [°C]Average Min. Daily Temperature [°C]Average Daily Precipitation [mm]Total of Daily Precipitation [mm]
Mon15.0%16.31912.210.922.19.21.647.9
Tue15.3%16.91934.311.022.29.72.061.9
Wed15.0%16.81938.511.022.89.32.165.2
Thu15.6%17.41945.710.923.911.21.646.7
Fri15.2%16.51948.310.922.911.32.574.9
Sat12.3%18.42014.510.422.09.90.721.8
Sun11.7%21.32137.710.222.09.22.887.1
trading Sun4.3%19.42042.510.421.410.23.951.0
non-trading Sun7.4%22.62206.510.022.38.52.036.1
Source: own elaboration based on data from the Łódź City Hall and archival data of the Institute of Meteorology and Water Management at the National Research Institute.
Table 4. The structure of distribution of characteristic points for trips taken by the ŁPB users against the type of land cover in Łódź in the cycling season of 2018.
Type of Land CoverPercentage of Starting PointsPercentage of Intermediate PointsPercentage of Destinations
Trading SundaysNon-Trading SundaysTrading SundaysNon-Trading SundaysTrading SundaysNon-Trading Sundays
multi-family housing33.2%34.0%32.1%27.7%32.8%33.7%
single-family housing0.9%1.0%3.5%4.2%0.9%1.0%
industrial buildings0.4%0.4%1.8%1.9%0.5%0.5%
commercial and service buildings9.6%8.9%7.6%7.8%10.0%9.2%
other buildings18.2%18.8%12.5%11.7%18.4%19.1%
place11.5%11.4%7.3%6.9%11.0%10.9%
grassy vegetation22.5%22.2%22.3%25.0%22.9%22.6%
shrub vegetation0.0%0.0%0.0%0.0%0.0%0.0%
forest area3.3%2.8%10.7%12.5%3.3%2.7%
agricultural land0.0%0.0%1.0%1.4%0.0%0.0%
surface waters0.0%0.0%0.2%0.2%0.0%0.0%
unused land0.0%0.0%0.1%0.1%0.0%0.0%
other undeveloped area0.4%0.5%0.8%0.8%0.2%0.3%
Source: own elaboration based on data from the Łódź City Hall.
Table 5. The structure of distribution of characteristic points for trips taken by the ŁPB users against the type of land cover in Łódź in the cycling season of 2018.
Starting PointsIntermediate PointsDestinationsPercentage of Trips
Trading SundaysNon-Trading Sundays
within the Urban Core Zone+++34.3%23.6%
++9.0%8.8%
+8.7%8.3%
++10.7%10.1%
+7.3%8.0%
24.3%32.7%
++3.0%4.4%
+2.7%4.1%
Source: own elaboration based on data from the Łódź City Hall.
Table 6. The structure of the percentage of ŁPB trips on trading and non-trading Sundays by starting point and destination with regard to the distribution of docking stations in Łódź in 2018.
Destination
Docking Station Within the Urban Core ZoneDocking Station Outside the Urban Core ZoneOutside Docking Station Within the Urban Core ZoneOutside Docking Station Outside the Urban Core Zone
starting pointtrading Sundaysdocking station within the Urban Core Zone10.6%2.6%10.2%7.8%
docking station outside the Urban Core Zone2.6%1.6%1.9%4.7%
docking station outside the Urban Core Zone10.0%2.3%10.1%6.4%
outside docking station outside the Urban Core Zone6.7%4.4%5.6%12.5%
non-trading Sundaysdocking station within the Urban Core Zone10.3%2.6%9.8%7.8%
docking station outside the Urban Core Zone2.4%1.8%1.9%5.2%
docking station outside the Urban Core Zone9.8%2.1%8.7%6.1%
outside docking station outside the Urban Core Zone7.1%5.0%5.5%13.9%
Source: own elaboration based on data from the Łódź City Hall.
Publisher’s Note: MDPI stays neutral with regard to jurisdictional claims in published maps and institutional affiliations.

