Article

Regarding Some Pitfalls in Urban Heat Island Studies Using Remote Sensing Technology

Department for Environmental Sciences, Meteorology, Climatology and Remote Sensing, University Basel, CH-4056 Basel, Switzerland
Remote Sens. 2021, 13(18), 3598; https://doi.org/10.3390/rs13183598
Submission received: 6 June 2021 / Revised: 2 September 2021 / Accepted: 3 September 2021 / Published: 9 September 2021
(This article belongs to the Special Issue Advancement of Urban Heat Island Studies with Remote Sensing)

Abstract

:
This paper attempts to illustrate the complexity of thermal infrared (TIR) data analysis for urban heat island studies. While a certain shift regarding the use of correct scientific nomenclature (using the term “surface urban heat island”) could be observed, the literature is full of incorrect conclusions and results using erroneous terminology. This seems to be the result of the ease of such literature implicitly suggesting that “warm surfaces” result in “high air temperatures”, ultimately drawing conclusions for urban planning authorities. It seems that the UHI is easy to measure, easy to explain, easy to find, and easy to illustrate—simply take a TIR-image. Due to this apparent simplicity, many authors seem to jump into UHI studies without fully understanding the nature of the phenomenon as far as time and spatial scales, physical processes, and the numerous methodological pitfalls inherent to UHI studies are concerned. This paper attempts to point out some of the many pitfalls in UHI studies, beginning with a proper correction of longwave emission data, the consideration of the source area of a thermal signal in an urban system—which is predominantly at the roof level—demonstrating the physics and interactions of radiation and heat fluxes, especially in relation to the importance of urban storage heat flux, and ending with an examination of examples from the Basel study area in Switzerland. Attention is then turned to the analysis of spatially distributed net radiation in the day- and at nighttime as a minimum requirement for urban heat island studies. The integration of nocturnal TIR images is notably recommended, as satellite data and the UHI-phenomenon cover the same time period.

1. Introduction

One major interest in urban climatology is the study of the so-called “urban heat island” effect (UHI). This effect has been well known for nearly 200 years, since the first publication on the urban heat island in London was published by Luke Howard [1] in the year 1833 in an updated and extended edition. Since then, scientific contributions regarding this effect, which is typical for urban climates in most cities and urban agglomerations worldwide, have developed and, over the last two centuries, new and innovative methods for the detection and spatio-temporal distribution of the UHI effect have been integrated into the field. The UHI effect does not merely depend on urban surface conditions rather than the general situation of adjacent rural sites in terms of vegetation type, season of the year (bare fields or vegetation surfaces with evapotranspiration), etc. All this influences the intensity of the UHI effect. In both cases, air temperatures as well as surface temperatures, the UHI effect is always a relative effect when comparing urban and nearby rural conditions [2,3].
Howard [1] performed some measurements of air temperature between the former City of London and the surrounding rural environment, but these measurements were not performed at fixed sites nor using fixed instruments. From these various measurements, Howard calculated an annual mean temperature for the city of London at 50.608 °F (10.38 °C), with 48.848 °F (9.36 °C) for a rural village, for the years 1807–1809. This is a difference in air temperature of 1.76 °F (1.02 °C). The measurements were repeated at different sites for the years 1810–1812, and the city was again 0.916 °C warmer compared to the rural environment. Howard also mentioned that “the city is warmer at night and colder at daytime”. An urban heat island was discovered with measurements over many years and, since then, a multitude of publications have been published dealing with the urban heat island effect. In the early 20th century, when motor cars were available, Wilhelm Schmidt [4] published the first paper on an urban heat island in Vienna, Austria, using a mobile platform. He measured air temperature along an itinerary across the city and its rural outskirts. This type of measurement was also performed by Peppler [5] in Karlsruhe, Germany. Over many years, all UHI papers have dealt with air temperatures as a well-defined variable for the urban heat island effect.
In the 1970s, various weather satellites were launched, all of which contained a thermal infrared band on board to estimate surface temperature distribution. Rao [6] was one of the early authors to address the urban heat island effect using thermal infrared data from an operational meteorological satellite (ITOS: Improved Tiros Operational Satellite). During that time, it was assumed that warm surfaces were always linked to high air temperatures. This assumption was also valid during the HCMM mission (Heat Capacity Mapping Mission), which was operated during 1978–1980 and offered the first civilian infrared satellite data with a spatial resolution of less than 1000 m. HCMM operated with two spectral bands (0.55–1.1. µm and 10.5–12.5 µm) with a grid size of 600 m and a resolution of 0.3 K at nadir. The orbit of HCMM allowed for the revisiting of the same area within about 12 h, and it made day-IR, night-IR, and day-difference measurements possible, weather conditions permitting. This was a breakthrough for urban climate studies, and these new data were rapidly used in many urban climate studies, e.g., Price [7], Gossmann [8], and Parlow [9] to mention a few. After this stimulating period of “high-resolution” thermal infrared investigations, operational weather satellites from the NOAA-AVHRR series were analyzed intensively. The spatial resolution at nadir with roughly 1000m was smaller than HCMM, but data were available all over the world and throughout the year. Unsurprisingly, AVHRR data became a standard source of satellite-based information for urban heat island studies [10,11,12], and the use of these satellite data continues today [13].
Since the launch of Landsat-5-TM in 1984, Landsat-7-ETM in 1999, Landsat-8 in 2013, and the Advanced Spaceborne Thermal Emission and Reflection Radiometer (ASTER) in 1999, a new generation of thermal IR satellite data have become available, offering an unforeseeable spatial resolution in the 60 to 120 m range, which enables the investigation of inner-urban differences in land surface temperatures (LST) with high accuracy or statistical analysis, as well as thermal unmixing of LST data according to land use variations [14]. Important overview articles have since been written by Voogt and Oke [15] and Rasul et al. [16]. Since Stewart and Oke [17] introduced the concept of local climate zones (LCZ) for urban climate studies, the integration of thermal infrared data for urban studies has developed.
During this methodological development and ongoing integration of remote sensing data, a subtle change in the scientific meaning of the term “urban heat island” has occurred—from air temperature to surface temperature differences between urban and rural sites and pixels. It is not surprising—and this is no criticism—that many authors working on thermal IR satellite data in urban heat island studies are not familiar with the correct terminology and physics behind this phenomenon, as many of them come from the pure remote sensing field, geodesy, geo-statistics, and many other disciplines. Surface temperatures are one part of a complex radiation and heat flux budget and should not be treated simply as a single variable or be related to assumed higher air temperatures. The crucial question is whether air temperature fields and LST fields are highly correlated, as well as what physical relation exists between these terms. Therefore, a clear distinction has been made between the following: the urban heat island effect (UHI), which is related to air temperature differences between urban and rural sites and even sub-dividing between a boundary layers urban heat island (UHIUBL) and a canopy layer urban heat island (UHIUCL); the surface urban heat island effect (SUHI or UHISurf), which considers the land surface temperature distribution (LST) between urban and rural areas, and is mostly derived from remote sensing data; and the subsurface urban heat island effect (SSUHI or UHISub), which is based on soil temperature measurements under urban versus rural surfaces [3]. These differences are important to clarify before establishing the scientific target of this investigation. Fortunately, in recent years, a trend towards correct terminology has been observed in the international literature.

2. Physical Background

With its thermal infrared channel, a satellite measures the longwave emission of part of the Earth’s surface (mostly in the 10–12 µm range). Then, data are usually converted to brightness or surface temperature according to the calibration formula. Longwave emission is one variable in the total radiation budget and should not be treated as a single or independent meteorological variable. It is part of a complex process with various actors, each of them interacting with each other and varying in short time intervals. One important equation in this context is radiation balance because several radiation fluxes work in parallel depending on daytime or nighttime conditions. It can be expressed as (red highlights, which is related to TIR satellite data):
Q * = K W K W + L W L W Wm 2
with
  • Q*: net radiation;
  • KW: solar irradiance (diffuse and direct during daytime only);
  • KW: reflectance of solar radiations due to albedo (during daytime only);
  • LW: atmospheric counter-radiation (mainly due to air temperature, water vapor and carbon dioxide (CO2));
  • LW: longwave terrestrial emission due to surface/brightness temperature according to the law of Stefan–Boltzmann.
During nighttime, the solar radiation fluxes are zero and the equation reduces to:
Q * = L W L W Wm 2
What can be measured from satellite IR- sensors is related to the outgoing longwave radiation flux LW, which is directed from the surface to the sky and therefore always shows a radiative energy loss for the surface unit. Longwave emission follows the Stefan–Boltzmann law describing energy flux emitted as function of brightness/surface temperature:
L W = σ · ε · T 4
where σ is the Stefan–Boltzmann constant (5.678 × 10⁻⁸), T is the surface temperature in K, and ε is the emission coefficient that gives the ratio of the radiative emission of the surface compared to an ideal black body radiation. When surface temperatures are considered, it is essential to integrate emissivity because real surfaces can deviate strongly from a black body emissivity of 1.0, e.g., aluminium roofs can have an emissivity of less than 0.1, which results in extremely low surface temperatures if not corrected (Figure 1). In many papers, the atmospheric influence (e.g., water vapor) is corrected using numerical models such as MODTRAN, etc., but the number of publications also considering emissivity accurately is limited. Sometimes, a certain general correction is made by assuming a constant emissivity of about ε = 0.96. What can often be found in the literature are TOA data (top of atmosphere) or brightness temperatures of the Earth’s surface without any emissivity correction. In any case, these are not correct surface temperatures.
Figure 1 shows the city of Windhoek, Namibia, as an RGB-image from ASTER (16 March 2018) and the brightness temperatures measured from a Landsat-8-TIR scene (10 September 2016). TIR data were not corrected for emissivity and so represent brightness temperatures. In the northwest, west, and south of Windhoek, one can see a pixel cluster in greenish colors, which corresponds to a brightness temperature between 292 and 298 K (≈19–25 °C) and strongly contrasts with the urban and rural areas in a yellow-orange color. These green pixels are contaminated by aluminum/metal roofs from industry in the south and aluminum shelters of informal settlements in the northwest and west. If the emissivity of these pixels remains uncorrected, the surface temperatures are assumed to be 8–10 °C lower than in reality.
In any case, a high LST is equivalent to an elevated energy loss by emission. Since net radiation can take positive, negative, or zero values depending on the quantities of incoming and outgoing radiation fluxes, and because the surface of a unit m2 has no mass and therefore cannot store any heat, the energy has to be distributed into various heat fluxes. This can be described by the following heat budget equation:
Q * ± Q H ± Q E ± Q G ± Q F = 0 Wm 2
with
  • Q * : net radiation;
  • Q H : sensible heat flux (air temperature);
  • Q E : latent heat flux (evapotranspiration, condensation);
  • Q G : storage heat flux (soil/storage temperature);
  • Q F : anthropogenic heat flux (heat release from traffic, air conditioning, industry).

3. The Importance of Net Radiation

This framework of radiation and heat fluxes is important to consider in the context of urban heat island studies. To increase air temperature, energy is required from net radiation. If solar irradiance is higher, such as on sun-exposed slopes in mountainous areas, a certain portion of this radiative energy surplus can be “invested” into the sensible heat flux to obtain higher air temperatures. This can easily be seen in many agricultural areas when warmer slopes are south-facing (on the northern hemisphere) or land use on these slopes is more thermophilic (e.g., vineyards). However, urban surfaces are quite flat, and even a sun-facing roof has its opposite end and, in the mean, can be assumed nearly “horizontal”, which means there is no significant surplus of solar radiation, resulting in higher surface temperatures. On the contrary, a higher LST (higher energy loss), as in urban areas during daytime and nighttime, reduces net radiation; thus, the available energy for sensible heat flux is reduced. To enable higher air temperatures during the daytime, it is necessary to increase sensible heat flux. There are two theoretical possibilities to attain this:
  • Increase solar incoming irradiance;
  • Reduce the latent heat flux and re-invest more energy into the sensible heat flux.
Possibility “a” is not really possible. Nevertheless, solar radiation input in urban areas is very complex because urban surfaces are very structured with roofs, vertical walls, street canyons, etc. This influences e.g., the sky-view factor which is small in street canyons and great at roof level. Trapping of radiation in street canyons has an impact on both longwave emission and shortwave radiation.
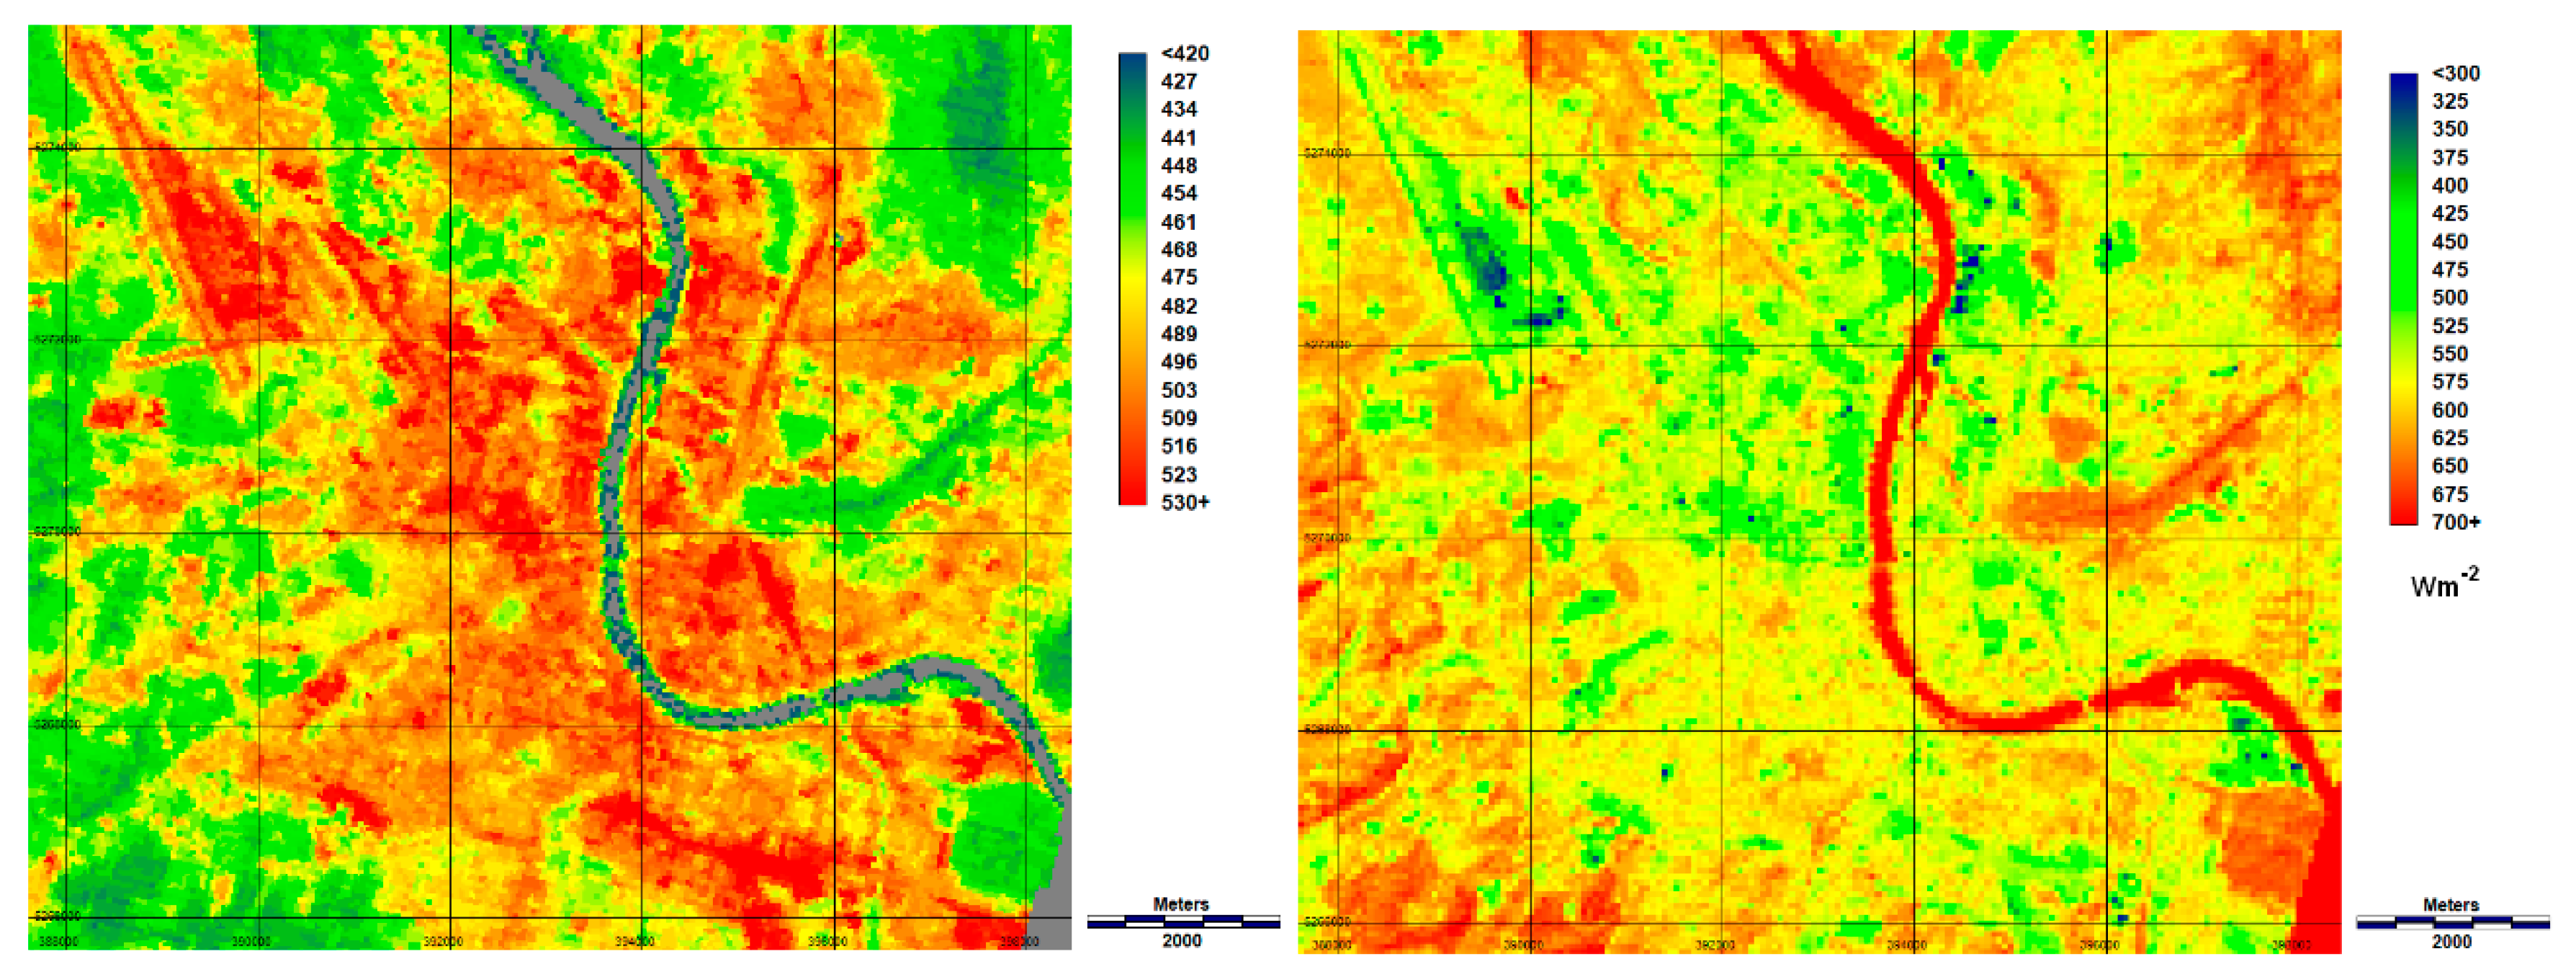
Possibility b. could be a solution if net radiation is not strongly reduced and stays on a normal level. However, this is not the case. Daytime surfaces in urban areas are often 15–20 K warmer than their rural surroundings, which corresponds to a higher longwave emission of 70–100 Wm−2, which automatically reduces net radiation by these values at least. On the other hand, in most urban areas, a reduction in net radiation is not balanced by an equivalent reduction in latent heat, resulting in a similar sensible heat flux. Although an urban surface is impervious, the latent heat flux is not equal to zero. In most cities, a certain latent heat flux remains due to vegetation along streets or in backyards and urban parks. During the BUBBLE field campaign, mean daytime latent heat flux at flux tower sites in the city center was about −100 ± 20 Wm−2 [18]; this was also apparent during the recent URBANFLUX study [19,20]. Figure 2 shows longwave emissions from 2 August 2002, in the city of Basel, Switzerland. Data are from Landsat-7-ETM, and they are atmospherically and emissivity corrected. During an intensive urban climate field campaign named BUBBLE (Basel Urban Boundary Layer Experiment) [21], all radiation and heat fluxes, vertical profiles at 30 m flux towers, etc., were measured at numerous stations within the city of Basel and at several rural stations. In Figure 2, one can see the Rhine River flowing through the city of Basel and bending to the north. In the northwestern part of the area, one easily can see the international airport Basel-Mulhouse with its runways. Longwave emissions span a range between 418 and 530 Wm−2, which corresponds to a surface temperature range between 20 °C (Rhine River) and 38 °C (city center and airport). On the right side, net radiation Q* at a satellite overpass on 2 August 2002, is shown. The range is from about 200–800 Wm−2. To compute the net radiation of the whole area, spatially distributed solar irradiance was calculated using a numerical model [22,23], and calibrated by local measurements at seven urban and rural flux towers; shortwave reflection was computed using a linear combination of Landsat visible bands, and atmospheric counter-radiation was assumed to be constant in that small area. For further information, I refer you to Rigo and Parlow [24]. The basic statement of Figure 2 is that areas with the highest LST have the lowest net radiation of Q*. The water surface of the Rhine River is colder (low emission loss) and darker than the urban areas (low albedo—low shortwave reflection loss), and it reaches a net radiation of about 800 Wm−2; however, since heat fluxes into the water body are extremely turbulent and the heat capacity of the water is high, this does not result in increased water temperatures. Net radiation of the warm surfaces in the city is in the range of 500–550 Wm−2, and the extremely hot (38 °C) surfaces at the airport reach a net radiation of 250–300 Wm- 2. These values are due to the high longwave emissions and increased shortwave reflectance of light concrete parking surfaces. This also means that the warm surfaces of the airport have 200–300 Wm−2 less energy available for the heat budget (especially sensible and storage heat flux).
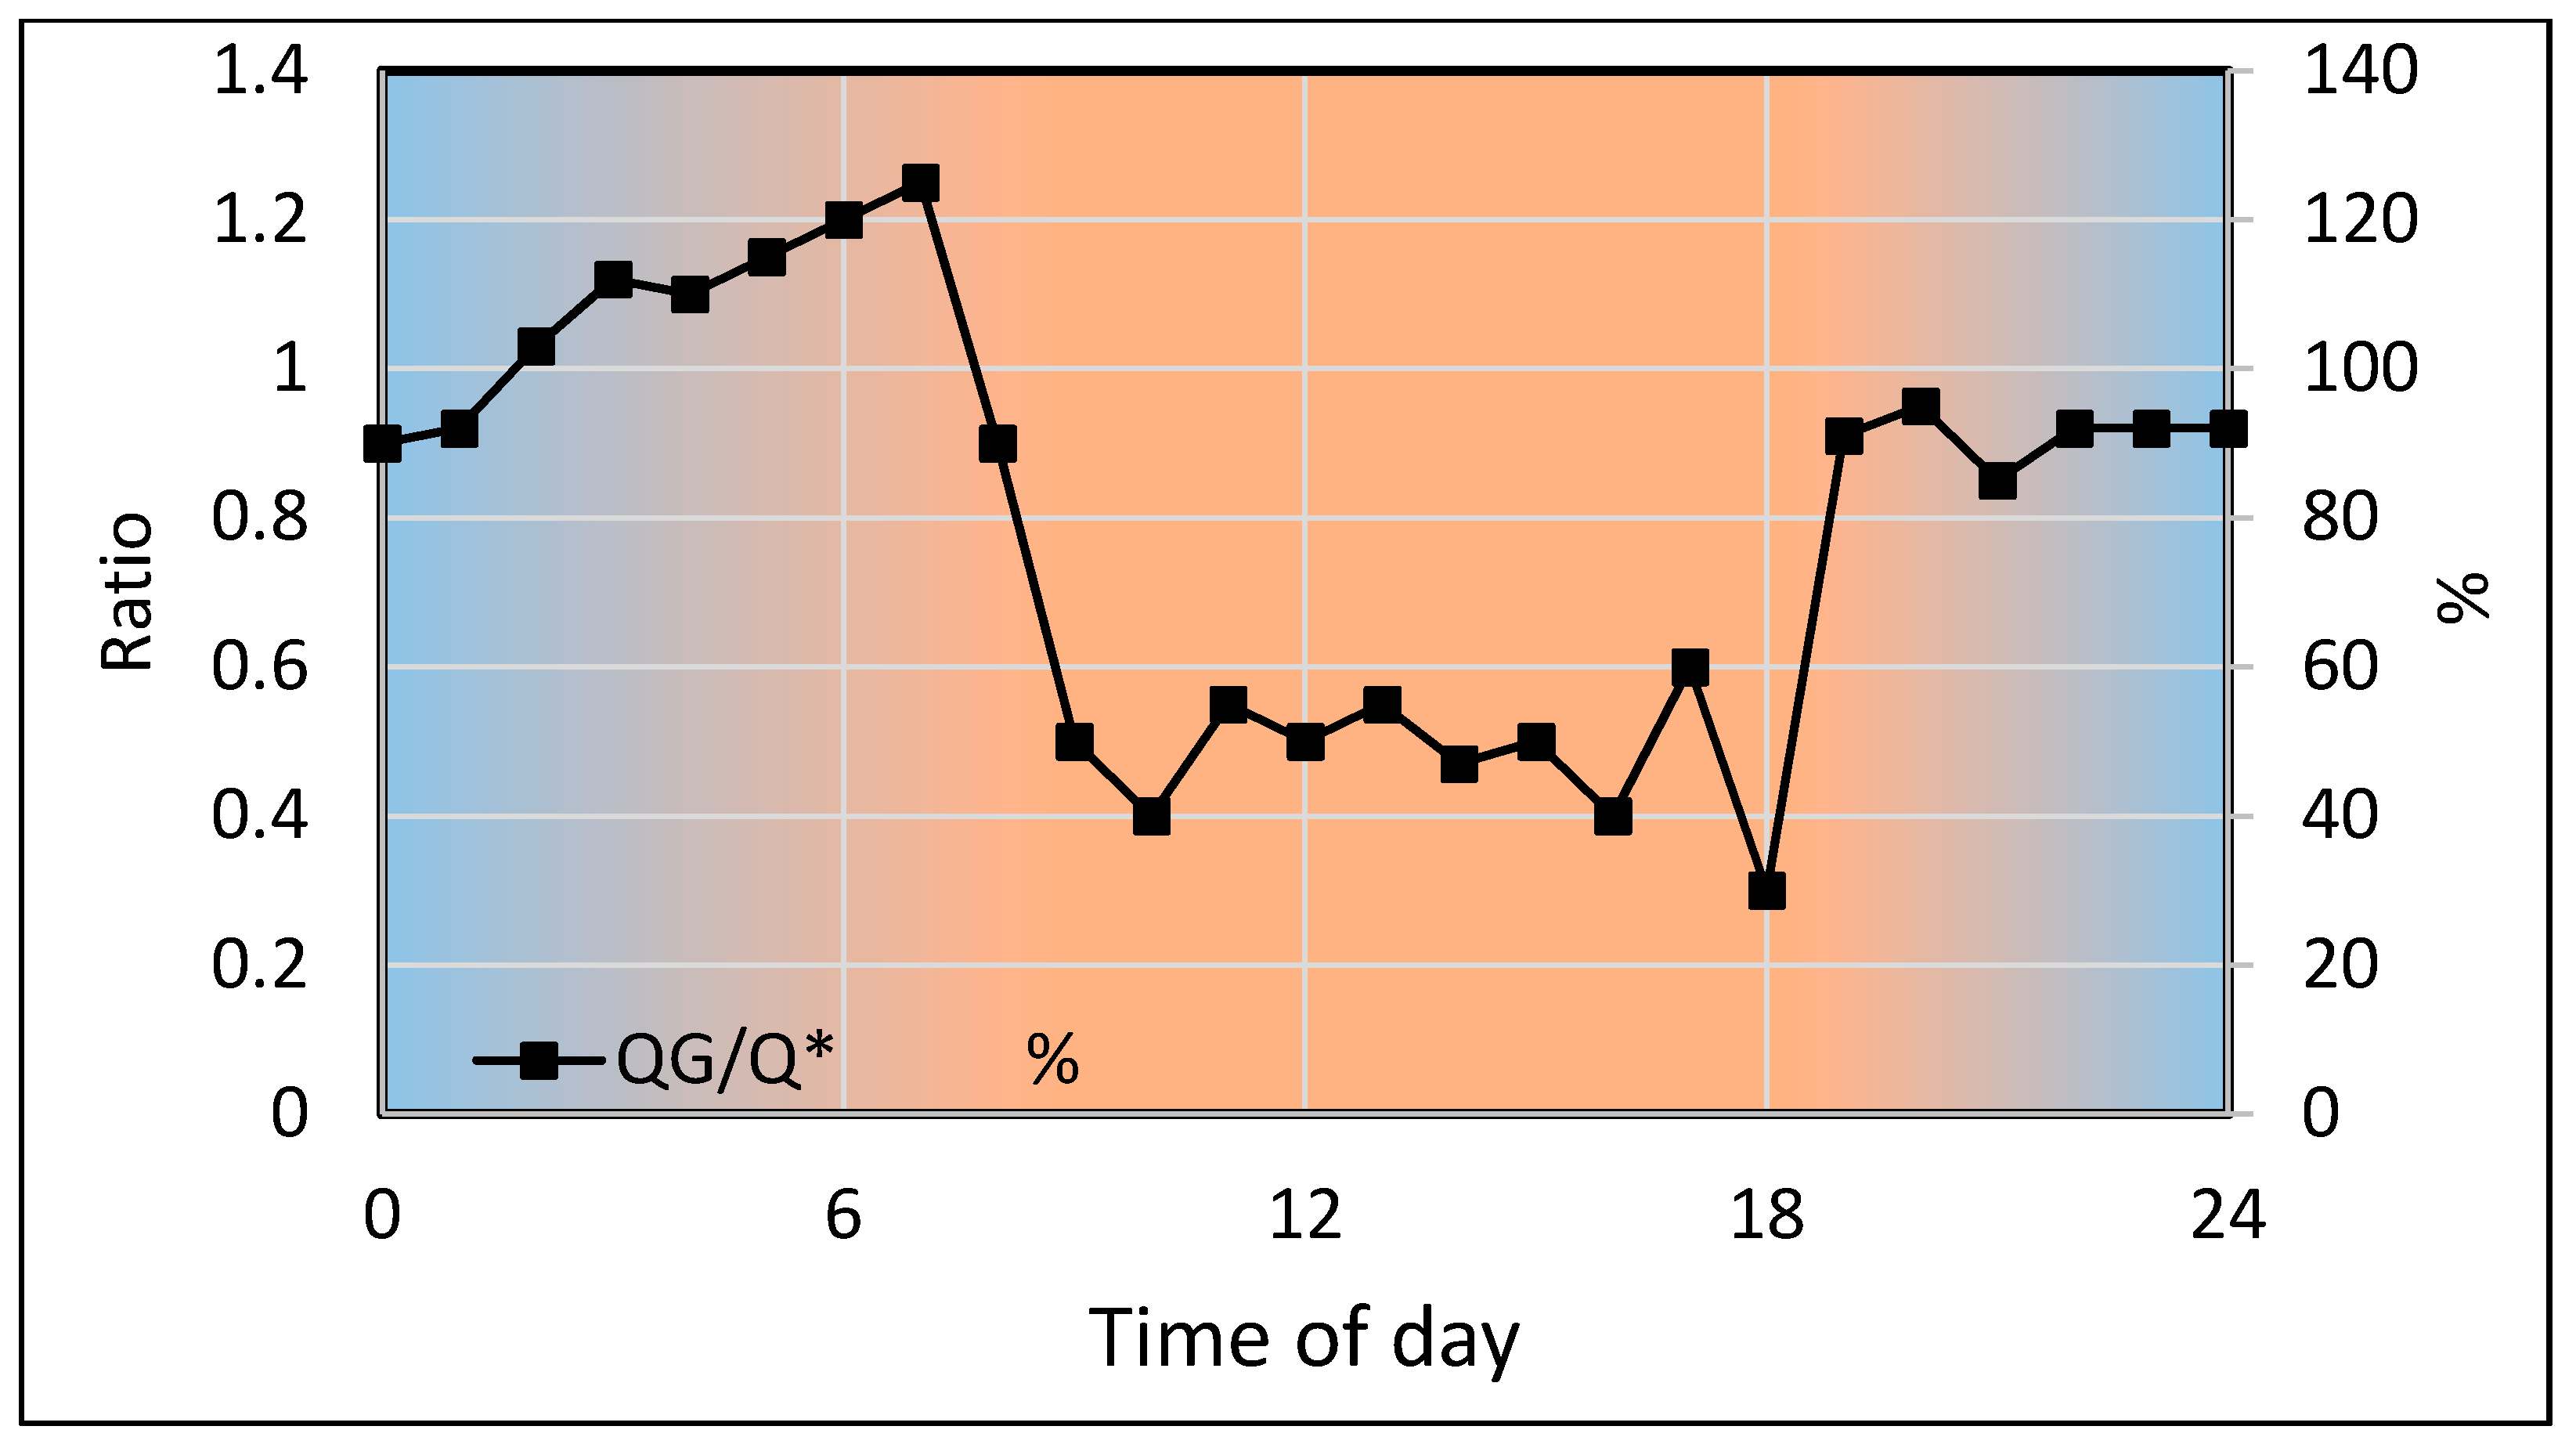
Regarding the heat budget, it is important to understand how artificial urban surfaces (buildings, asphalt, concrete, etc.) react concerning heat storage and how they influence LST patterns and the urban heat island effect. Figure 3 shows the hourly mean values of 20 clear-sky days of storage heat flux QG, normalized by net radiation Q* (or given as percentages of Q*) between 1 December 2001 and 30 April 2002 at the urban station in Basel-Spalenring during the BUBBLE field experiment [21]. For a detailed site description and an overview of instruments used, see [25]. During the night hours, net radiation is normally negative (as indicated by a blueish background in Figure 3). Negative net radiation is in the range of −70 to −100 Wm2, which means that the heat fluxes have to compensate for this loss in radiative energy. Positive net radiation during the daytime is indicated by a reddish background, and normal values are in the range of +400–+600 Wm−2, especially during the summer months, as solar irradiance is high during the daytime. This means that the system must invest this amount of net radiation into the various heat fluxes (sensible, latent, and storage heat flux).
The black line shows the ratio of storage heat flux (QG) normalized versus net radiation (Q*), or, in other words, how much of a percent of net radiation is “invested” in storage heat flux during the course of the days measured at one of the flux tower sites during the BUBBLE experiment. Some aspects are pointed out below:
  • During the daytime (10–18 o’clock), between 40 and 60 percent of net radiation goes into storage heat flux, which is high compared to rural sites, which use ±10% of net radiation. In urban areas, storage heat flux into urban fabrics, asphalt, concrete, etc., is 4–5 times higher [25]. Urban net radiation values in Figure 2 (city center of Basel around 550 Wm−2) show storage heat flux gains between 200 and 350 Wm−2 during the satellite overpass, which have also been validated by measurements during BUBBLE [24]. This happens during the daytime when most LST satellite data are taken, and it can be considered akin to loading the “urban storage-heat-flux-battery” during the daytime; this energy is then re-invested at night to keep urban air temperatures on a high level and manifest a nocturnal urban heat island.
  • On the other hand, if 40–60 % of the diurnal net radiation is stored in urban fabrics, this energy is not available for instantaneous turbulent heat fluxes (sensible and/or latent heat flux) to increase air temperature during the day. Given this, the available energy for turbulent fluxes is limited by two aspects (a—low net radiation; b—high storage heat flux), and it becomes clear that a high LST does not automatically translate to high air temperatures. During the day, and in most satellite data, urban areas have a surface urban heat island (SUHI) and no urban heat island (UHI). If surface temperatures are extreme, as they are in desert cities, even an urban cooling island can develop at these warm spots [26].
    Under these considerations, LST is probably related more to high storage heat fluxes rather than enhanced air temperatures.
  • An important point to consider is that, at night, the QG/Q*-ratio can reach values greater than 1.0 (>100 %), which means that the nocturnal storage heat flux QG does not only completely compensate for the negative net radiation at night; rather, it also helps to maintain a sensible heat flux—even at night— which is directed upwards towards the urban atmosphere by up to 20 %, which is equivalent to 10–20 Wm−2 [25].

4. The Anthropogenic Heat Flux and Street Canon Radiation Trap

Nevertheless, there are many publications demonstrating a more or less increased air temperature in urban areas during the day. What is the specialty of these sites? What is the source of energy for keeping air temperatures high although net radiation is reduced?
Data in Figure 4 indicate a seasonal modification, with the highest heat island effect (+2 K) in the evening (21:00) in summer and the lowest UHI effect with +1 K at 19:00 in winter. While, in all seasons, temperature differences between urban roof level and rural sites drop to −0.5 K (left), air temperatures at street level remain at +0.2–+0.5 K, even during daytime, indicating a shallow urban heat island effect at the urban site during all seasons (right). There are several main reasons that are responsible for this small difference:
  • At street level, there are additional sources of energy available, mainly the anthropogenic heat flux from street traffic (exhaust pipes, engine cooling), but also air conditioning and heating. This anthropogenic heat flux can be quite relevant and can reach several 100 Wm−2 in dense urban areas [20,27].
  • Radiation trapping is another important reason to keep radiative energy within a street canyon. Since surrounding walls are much warmer than the sky above, a street canyon atmosphere gains additional longwave radiation from these walls.
  • At roof level, only atmospheric counter-radiation exists as a longwave input from a rather cool atmospheric volume ranging over the year at around 340 ± 60 Wm−2 and corresponding to an atmospheric volumetric brightness temperature of ≈288 K (≈5 °C). Therefore, warmer house walls increase the longwave radiative input for street level atmosphere. However, normally, urban streets are much narrower than a thermal IR satellite pixel, so the source area of the remotely sensed surface temperature is not the street level but instead the roof level [28]. In dense city centers, the percentage of roof area in a TIR-satellite pixel can easily reach 50–70% or even more.
  • At first glance, it seems to be a paradox that, at roof level, we find the highest surface temperatures but lower air temperatures during the day; however, the physics of radiation and heat fluxes is clear. In Figure 5, it is clear how high surface temperatures correspond with areas with a small sky-view factor (the proportion of visible sky above a pixel) and a high percentage of roof surfaces.
  • Figure 4 also demonstrates that the diurnal UHI in Basel at street canyon level with a high traffic load during all seasons is +0.2–+0.5 K, which is shallow; in this case, the level should not be overinterpreted as HEAT island.

5. Nocturnal LST and Net Radiation

Most remote sensing-based urban heat island studies use thermal infrared data from Landsat-TM, Landsat-ETM, Landsat-8-TIRS, ASTER, MODIS, or NOAA-AVHRR. However, in most cases, this leads to daytime overpasses of satellite data for investigating what is usually a nocturnal phenomenon. It might be more appropriate to use nocturnal thermal IR data; then, remote sensing data and the UHI phenomenon would cover the same time of day. These data have been available on pre-order request from Landsat and ASTER for several years, whereas it never was a problem with MODIS or NOAA-AVHRR, and these only offer a relatively coarse resolution.
What is the general difference concerning radiation and heat budget between nighttime and daytime? Below are the most evident aspects regarding nighttime satellite data:
  • The nighttime radiation budget is reduced to longwave fluxes only, as solar radiation, such as shortwave irradiance and shortwave reflection, does not exist.
  • Atmospheric longwave counter-radiation mostly has no spatial variations during fair weather situations, except when altitudinal effects come into play. Therefore, a constant value from a nearby urban climate station can be applied to all pixels.
  • During the night, net radiation values should be negative because terrestrial emissions are higher than atmospheric counter-radiation. It can take values between −10 and −150 Wm−2, which then implicitly means that, at pixels with negative net radiation, the surface is warm (high emission), and heat fluxes must provide the system with more energy to compensate for negative Q*.
  • Longwave terrestrial emission mirrors net radiation in terms of high emission versus negative net radiation.
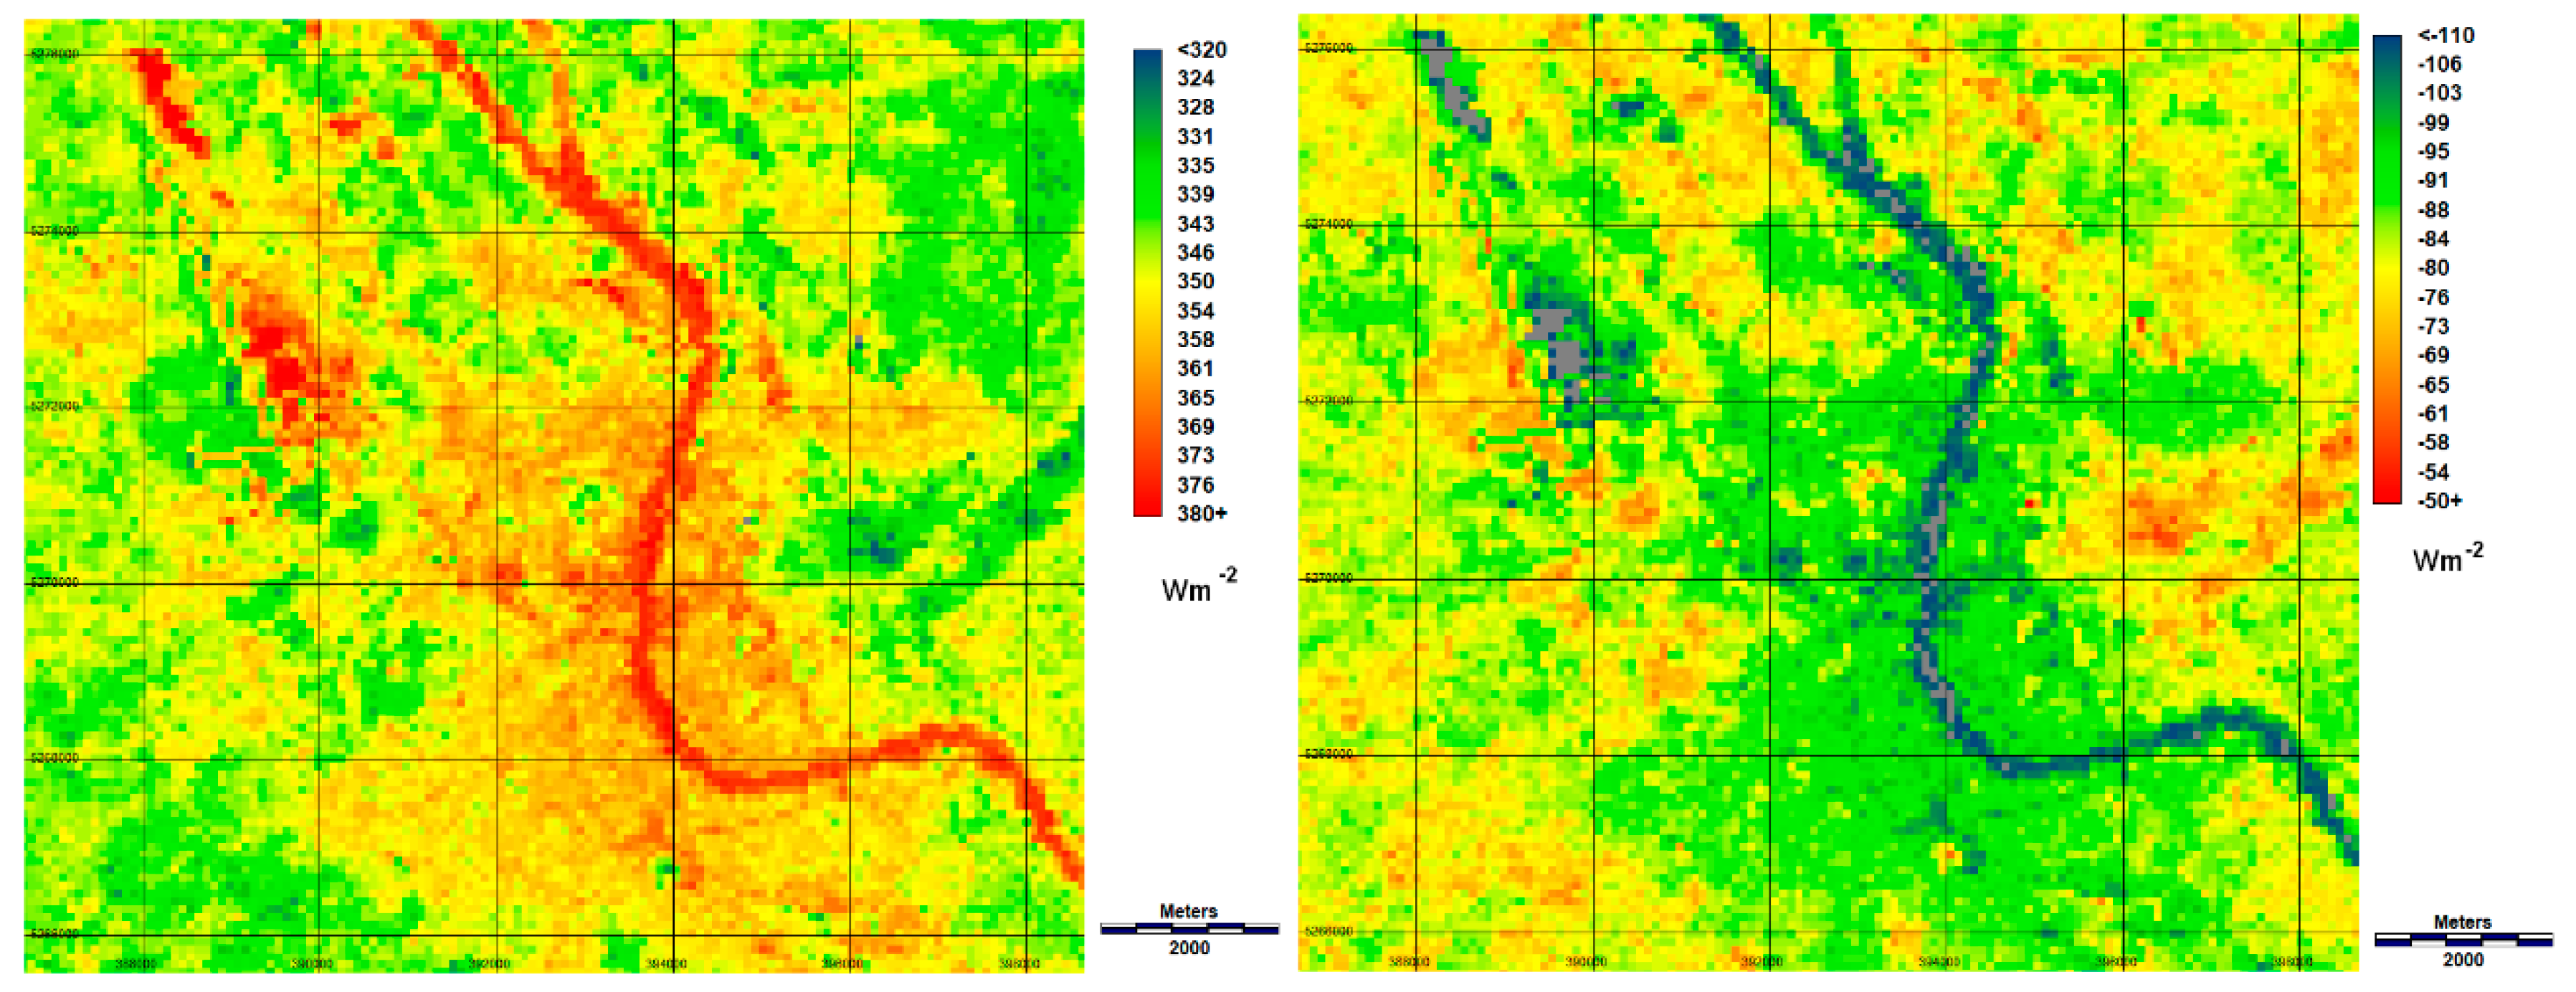
To show these results, a one night-TIR scene from ASTER (13 May 2012, satellite overpass at 21:12 UTC (22:12) CET) was downloaded. To compute net radiation at night, the mean atmospheric counter-radiation measured at three urban flux tower stations in Basel was 264.5 Wm−2, ranging from 259 to 270 Wm−2. Then, longwave emissions (Figure 7 left) from satellite data were reduced by this factor to obtain nocturnal net radiation distribution (Figure 7 right).
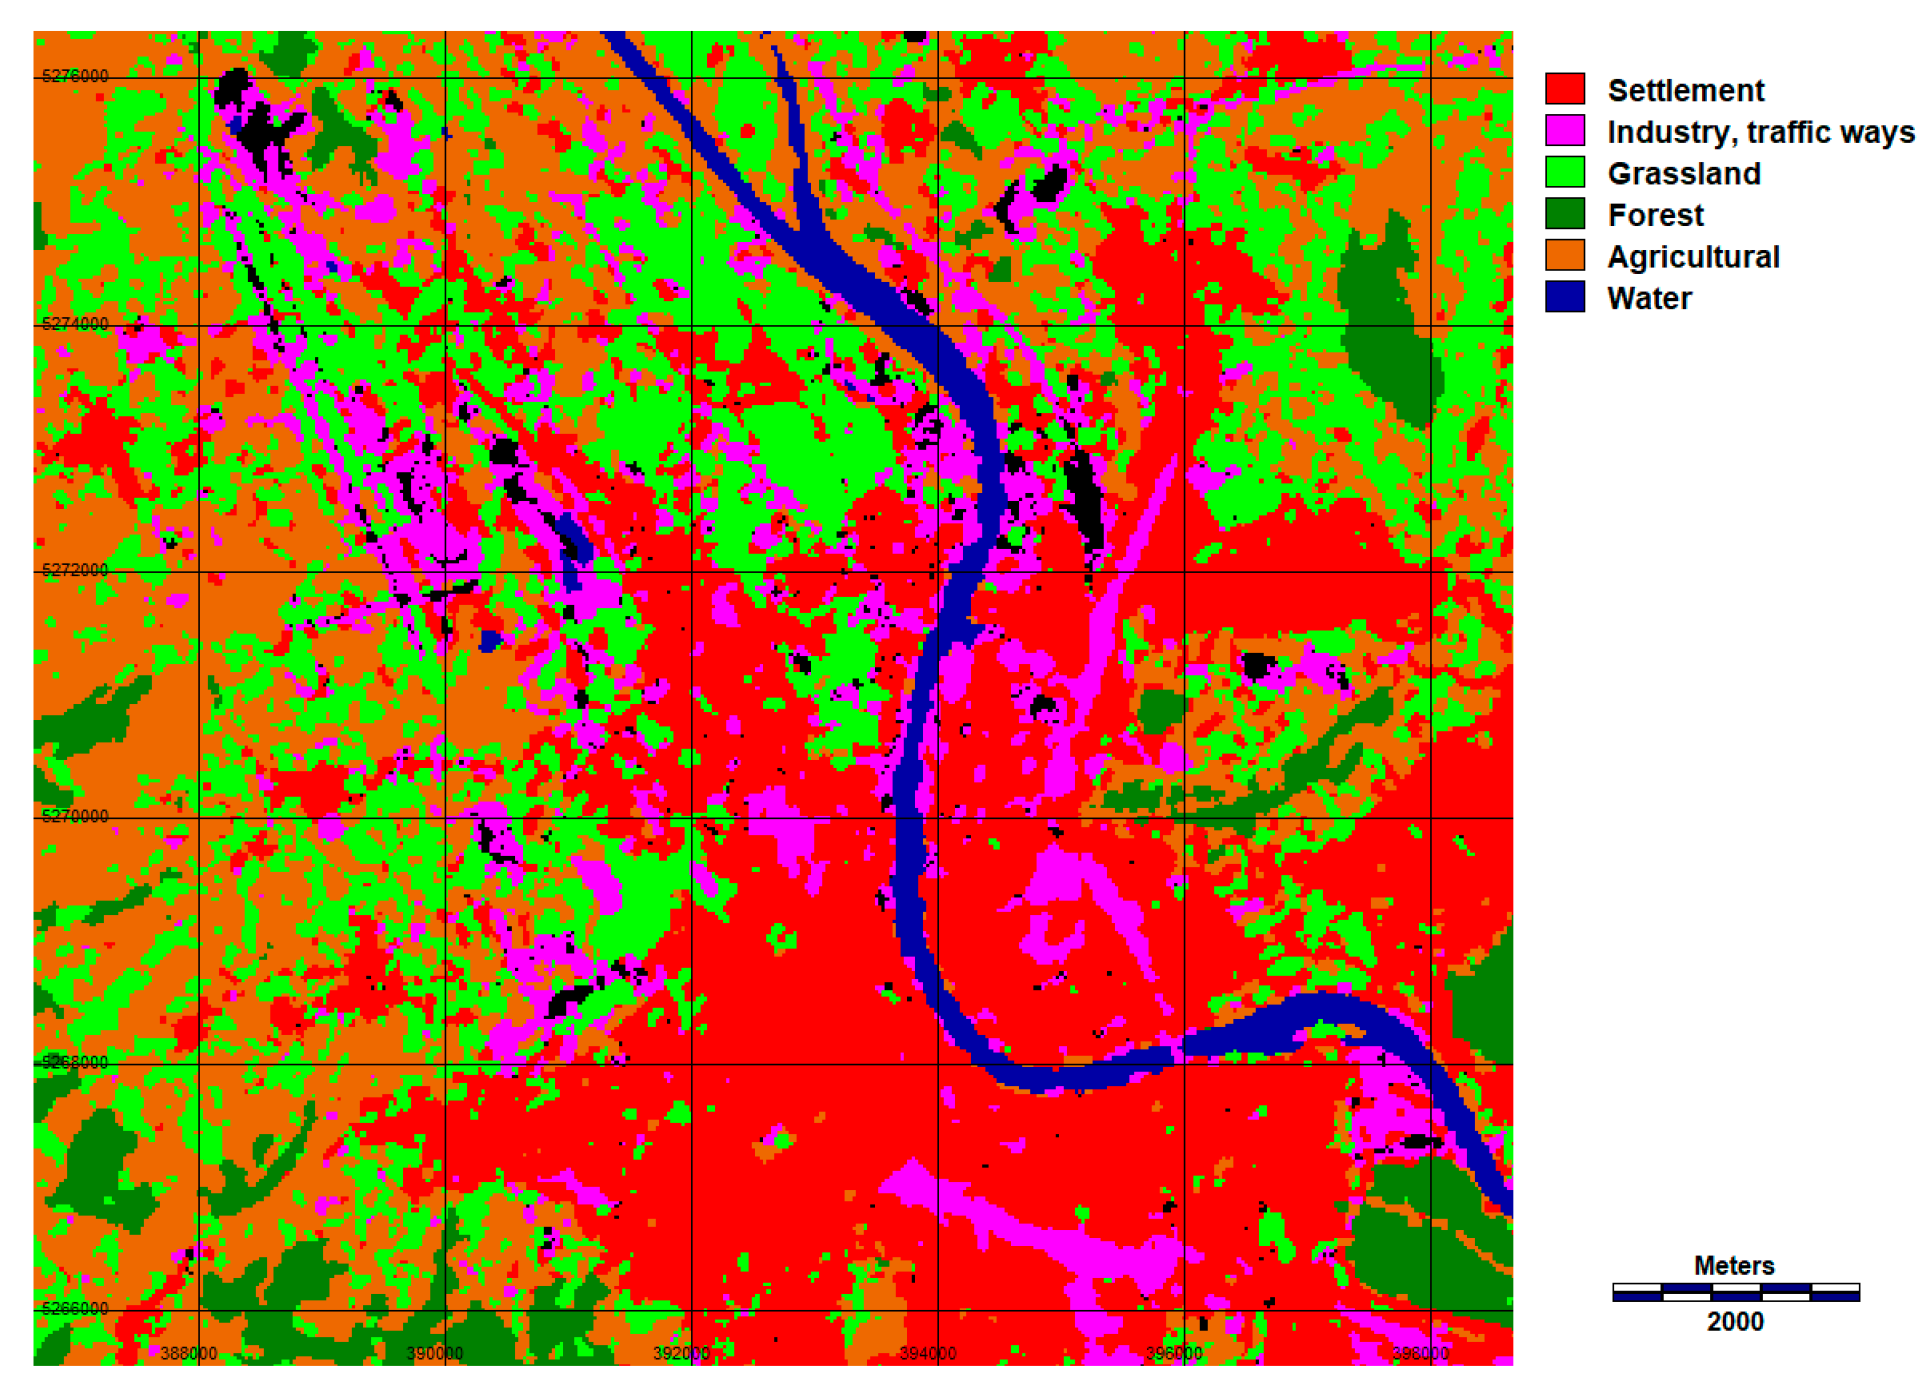
For a more appropriate comparison, Figure 6 shows the generalized land use/landcover of the study area reduced to six major classes, as computed from Landsat-ETM data. Much of the area is settlement, industry, or important traffic ways such as railway stations, the airport in the northwest, etc. The water surface of the Rhine River bends through the city center to the north, and some small dredging lakes towards the airport are related to gravel excavation. Grassland and agricultural fields are located at the northern and western edges of the image. For further comparison, Figure 6 covers the same area as Figure 7 (left and right).
Although the data are from different years, and therefore the absolute values are different, a comparison between Figure 2 (left) and Figure 7 (left) shows a similarity concerning the spatial pattern of longwave emissions. Nevertheless, the most striking difference is the Rhine River, which is colder during the day and warmer at night compared to the urban pixels. In reality, water temperatures do not change much from the day hours to the night hours (≈0.5–1 K) due to the high heat capacity of water. Actual data of all the Basel urban climate network stations can easily be accessed through https://mcr.unibas.ch/dolueg2/index.php?project=overview [30].
Apart from the water surfaces, the highest nocturnal emissions are related to the airport buildings and parking lots, the city center, and the industrial area north of the city on both sides of Rhine River. The range of emissions is from 330 to 380 Wm−2, which is equivalent to surface temperatures between 6 and 17 °C, which are typical values for a mid-May situation.
Nocturnal net radiation (Figure 7 right) shows negative values only, which is the normal situation during nighttime, and it ranges for the urban pixels between −80 Wm−2 and −119 Wm−2 at the airport. The warmest pixels (highest longwave emission) have the lowest negative net radiation; this is unsurprising and is in a similar range to the warmer water surfaces. This feature of highest emission/lowest net radiation at night can be measured throughout the night. This again means that, throughout the whole night, urban surfaces can keep their high surface temperatures and heat fluxes must be efficient enough to compensate for this extremely low net radiation throughout the night. In agricultural areas, forests, and grassland, the important fluxes that compensate for negative net radiation are predominantly turbulent heat fluxes (sensible and latent), as these cool down air temperatures with some potential condensation on the surface. Storage heat fluxes play a minor role in the compensation of nocturnal negative net radiation of rural areas because, during daytime, they do not receive enough energy to contribute much at night.
Figure 3 and Figure 4 outline high urban air temperatures during the night and a high storage heat flux of up to 100 Wm−2 to compensate/overcompensate for urban negative net radiation, as already mentioned. When urban fabrics are considered to act like a “battery”, which is loaded during daytime and discharged during nighttime, then the energetics of the nocturnal urban heat island become clear. However, this also means that high urban surface temperatures are clearly related to a high storage heat flux rather than high air temperatures.

6. Conclusions

Remotely sensed data play an important role in urban climate studies, especially urban heat island investigations. Most of the data used are from diurnal overpasses of satellites, such as the Landsat series or ASTER, as they offer reasonable spatial resolutions between 60 and 100 m. In urban climatology, a clear difference between the terms “urban heat island” and “surface urban heat island” is drawn. The former refers to air temperature differences between urban and nearby rural conditions and is typically a nighttime characteristic of the urban climate. The latter is related to surface temperatures typically recorded from satellite or airborne platforms in the 10 µm wavelength range. Although data of nighttime satellite passages are available, only a few publications exist. Most papers deal with daytime orbits for nighttime urban climate features.
A further important aspect is that longwave emissions, recorded by TIR sensors, are only one part of a complex radiation and heat fluxes process, which should be carefully investigated to draw any conclusions for urban climate or planning. While high surface temperatures can be the result of higher solar irradiance, such as on sun-exposed slopes, in the urban system, they are more likely an indicator of a high storage heat flux into urban and artificial materials. Measurements from urban flux towers show that storage heat flux in urban systems is much higher compared to rural sites, resulting in a reduction in energy that is then lost to instantaneous turbulent heat fluxes, i.e., the sensible heat flux to increase air temperatures. This explains why daytime air temperatures are in about the same range as rural ones, unless other sources of energy, namely anthropogenic heat fluxes from traffic and air conditioning, come into play.
The physical chain of energy transfer to bridge the time gap between day and night is as follows: absorption of solar radiative energy from urban surfaces during the day and an increase in the storage heat flux by several percentage points, which is called “loading the urban battery”. Then, during the night, when net radiation is extremely negative (up to ≤−100 Wm−2), the urban system makes use of this “battery” to compensate for negative net radiation from this source (“discharge the battery”). It becomes obvious that more detailed investigations with nighttime TIR data are necessary to develop deeper understandings of these energetic processes.

Funding

This research received no external funding.

Conflicts of Interest

The author declares that he has no conflict of interest.

References

  1. Howard, L. The Climate of London; Harvey and Darton: London, UK, 1833; Volumes 1–3. [Google Scholar]
  2. Arnfield, A.J. Two decades of urban climate research: A review of turbulence, exchanges of energy and water, and the urban heat island. Int. J. Clim. 2003, 23, 1–26. [Google Scholar] [CrossRef]
  3. Oke, T.; Mills, G.; Christen, A.; Voogt, J. Urban Climates; Cambridge University Press: Cambridge, UK, 2017. [Google Scholar] [CrossRef] [Green Version]
  4. Schmidt, W. Die Verteilung der Minimumtemperaturen in der Frostnacht des 12. Mai 1927 im Gemeindegebiet von Wien. Fortschritte Landwirtsch. 1927, 21, 1–11. [Google Scholar]
  5. Peppler, A. Die Temperaturverhältnisse von Karlsruhe an heissen Sommertagen. Dtsch. Meteorol. Jahrb. Baden 1929, 61, 59–60. [Google Scholar]
  6. Krishna, R.P. Remote sensing of urban “heat islands” from an environmental satellite. Bull. Am. Meteorol. Soc. 1972, 53, 647–648. [Google Scholar]
  7. Price, J.C. Assessment of the urban heat island effect through the use of satellite data. Mon. Weather Rev. 1979, 107, 1554–1557. [Google Scholar] [CrossRef] [Green Version]
  8. Gossmann, H. The influence of geography on local environment as inferred from night thermal infrared imagery. Remote Sens. Rev. 1986, 1, 249–275. [Google Scholar] [CrossRef]
  9. Parlow, E. Thermal infrared satellite images and their application in regional planning (presented with a map of surface temperatures of NE-Zealand/Denmark). Geogr. Ann. Ser. A Phys. Geogr. 1985, 67, 285. [Google Scholar] [CrossRef]
  10. Roth, M.; Oke, T.R.; Emery, W. Satellite-derived urban heat islands from three coastal cities and the utilization of such data in urban climatology. Int. J. Remote Sens. 1989, 10, 1699–1720. [Google Scholar] [CrossRef]
  11. Gallo, K.P.; McNab, A.L.; Karl, T.R.; Brown, J.F.; Hood, J.J.; Tarpley, J.D. The use of NOAA AVHRR data for assessment of the urban heat island effect. J. Appl. Meteorol. Climatol. 1993, 32, 899–908. [Google Scholar] [CrossRef] [Green Version]
  12. Caselles, V.; García, M.J.L.; Meliá, J.; Cueva, A.J.P. Analysis of the heat-island effect of the city of Valencia, Spain, through air temperature transects and NOAA satellite data. Theor. Appl. Clim. 1991, 43, 195–203. [Google Scholar] [CrossRef]
  13. Streutker, D. Satellite-measured growth of the urban heat island of Houston, Texas. Remote Sens. Environ. 2003, 85, 282–289. [Google Scholar] [CrossRef]
  14. Wicki, A.; Parlow, E. Multiple regression analysis for unmixing of surface temperature data in an urban environment. Remote Sens. 2017, 9, 684. [Google Scholar] [CrossRef] [Green Version]
  15. Voogt, J.; Oke, T. Thermal remote sensing of urban climates. Remote Sens. Environ. 2003, 86, 370–384. [Google Scholar] [CrossRef]
  16. Rasul, A.; Balzter, H.; Smith, C.; Remedios, J.; Adamu, B.; Sobrino, J.A.; Srivanit, M.; Weng, Q. A Review on Remote Sensing of Urban Heat and Cool Islands. Land 2017, 6, 38. [Google Scholar] [CrossRef] [Green Version]
  17. Stewart, I.D.; Oke, T.R. Local climate zones for urban temperature studies. Bull. Am. Meteorol. Soc. 2012, 93, 1879–1900. [Google Scholar] [CrossRef]
  18. Parlow, E. Urban climate. In Urban Ecology; Niemelä, J., Breuste, J.H., Guntenspergen, G., McIntyre, N.E., Elmqvist, T., James, P., Eds.; Oxford University Press: Oxford, UK, 2011; pp. 31–44. [Google Scholar] [CrossRef]
  19. Feigenwinter, C.; Parlow, E.; Vogt, R.; Schmutz, M.; Lindberg, F.; Grimmond, S.; Crawford, B.; Marconcini, M.; Chrysoulakis, N.; Mitraka, Z.; et al. Spatial distribution of sensible and latent heat flux in the city of Basel (Switzerland). IEEE J. Sel. Top. Appl. Earth Obs. Remote Sens. 2018, 11, 2717–2723. [Google Scholar] [CrossRef] [Green Version]
  20. Chrysoulakis, N.; Grimmond, S.; Feigenwinter, C.; Lindberg, F.; Gastellu-Etchegorry, J.P.; Marconcini, M.; Mitraka, Z.; Stagakis, S.; Crawford, B.; Olofson, F.; et al. Urban energy exchanges monitoring from space. Sci. Rep. 2018, 8, 1–8. [Google Scholar] [CrossRef] [PubMed] [Green Version]
  21. Rotach, M.W.; Vogt, R.; Bernhofer, C.; Batchvarova, E.; Christen, A.; Clappier, A.; Feddersen, B.; Gryning, S.-E.; Martucci, G.; Mayer, H.; et al. BUBBLE—An urban boundary layer meteorology project. Theor. Appl. Climatol. 2005, 81, 231–261. [Google Scholar] [CrossRef] [Green Version]
  22. Parlow, E. Correction of terrain-controlled illumination effects in satellite data. In Progress in Environmental Remote Sensing Research and Applications, Proceedings of the 15th EARSeL Symposium, Basel, Switzerland, 4–6 September 1995; Balkema Publishers: Rotterdam, The Netherlands, 1996; pp. 139–145. [Google Scholar]
  23. Parlow, E. The urban heat budget derived from satellite data. Geogr. Helv. 2003, 58, 99–111. [Google Scholar] [CrossRef] [Green Version]
  24. Rigo, G.; Parlow, E. Modelling the ground heat flux of an urban area using remote sensing data. Theor. Appl. Clim. 2007, 90, 185–199. [Google Scholar] [CrossRef]
  25. Christen, A.; Vogt, R. Energy and radiation balance of a central European city. Int. J. Clim. 2004, 24, 1395–1421. [Google Scholar] [CrossRef]
  26. Frey, C.M.; Rigo, G.; Parlow, E. Urban radiation balance of two coastal cities in a hot and dry environment. Int. J. Remote Sens. 2007, 28, 2695–2712. [Google Scholar] [CrossRef]
  27. Iamarino, M.; Beevers, S.; Grimmond, C.S.B. High-resolution (space, time) anthropogenic heat emissions: London 1970–2025. Int. J. Climatol. 2012, 32, 1754–1767. [Google Scholar] [CrossRef] [Green Version]
  28. Parlow, E.; Vogt, R.; Feigenwinter, C. The urban heat island of Basel—Seen from different perspectives. Die Erde–J. Geogr. Soc. Berl. 2014, 145, 96–110. [Google Scholar] [CrossRef]
  29. Vogt, R.; Parlow, E. Die städtische Wärmeinsel von Basel-tages- und jahreszeitliche Charakterisierung. Reg. Basil. 2011, 52, 7–15. [Google Scholar]
  30. Spirig, R.; Feigenwinter, C.; Kalberer, M.; Parlow, E.; Vogt, R. Dolueg: A measurement network’s face. Bull. Am. Meteorol. Soc. 2021, 102, 629–631. [Google Scholar] [CrossRef]
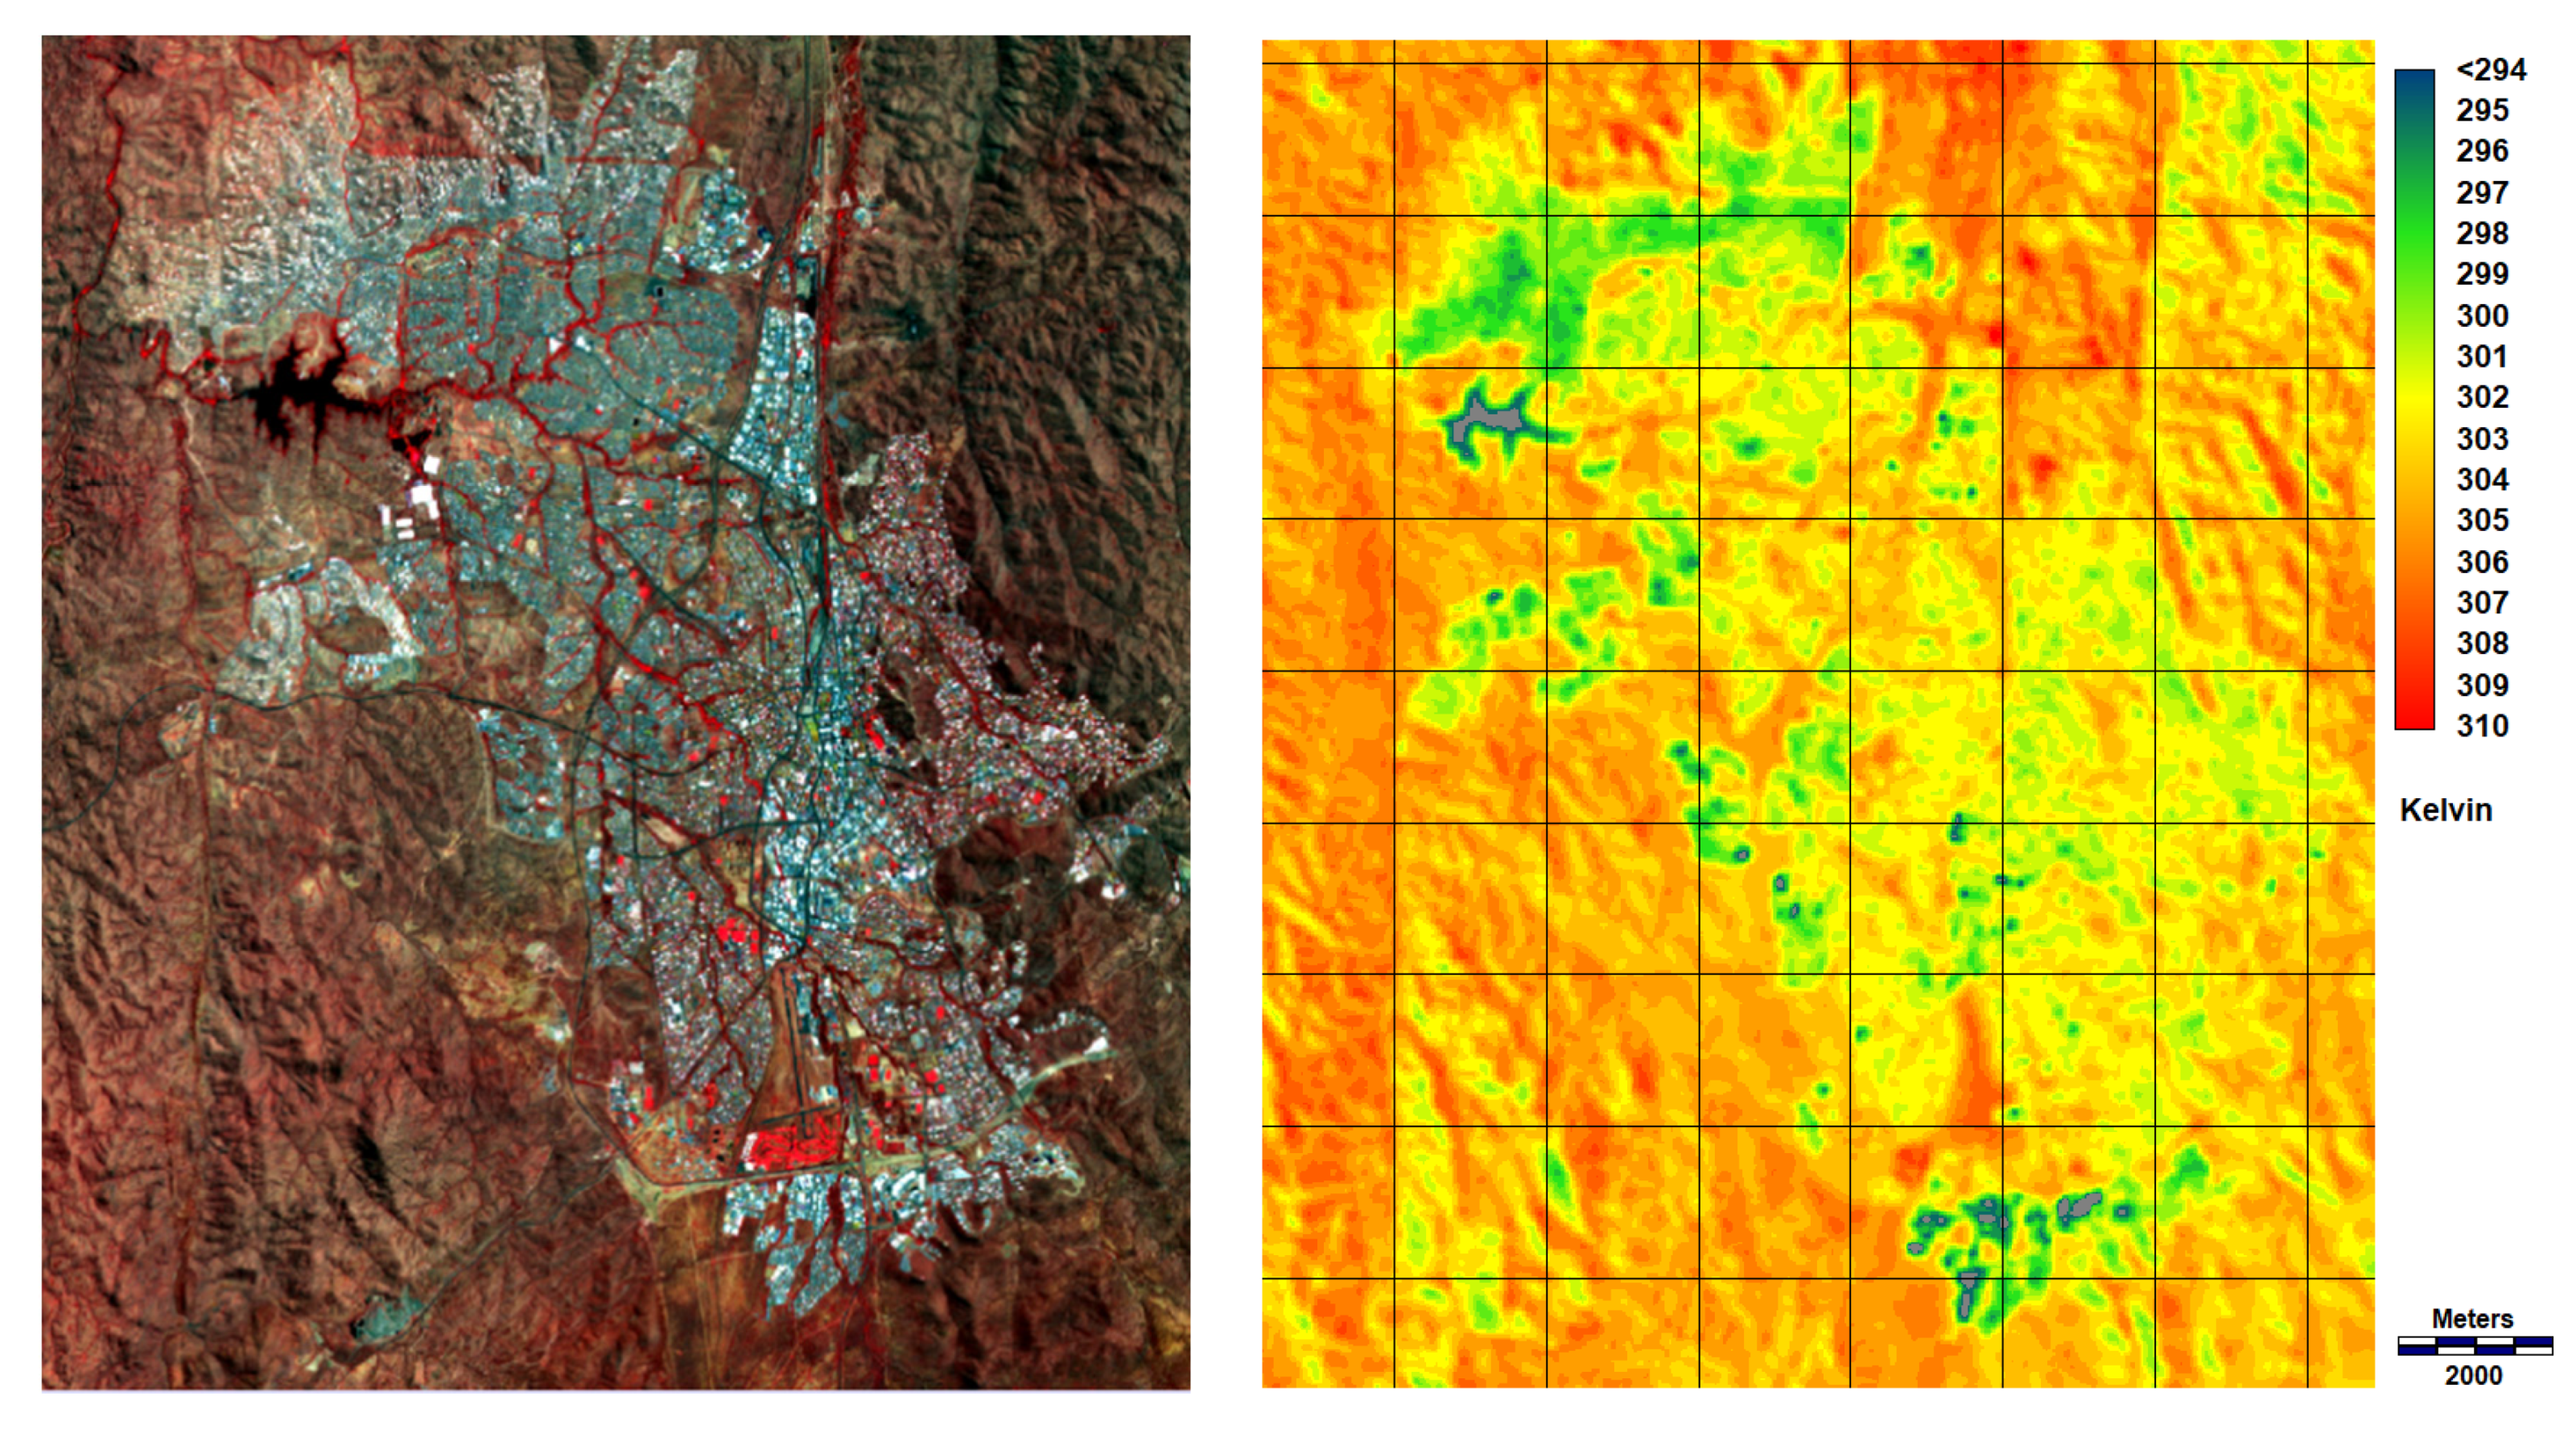
Figure 1. ASTER-RGB image (left) and LANDSAT-8-terrestrial emission (right), ε = 1.0 of the city of Windhoek, Namibia.
Remotesensing 13 03598 g001
Figure 2. Longwave emission in Wm−2 (left) and net radiation in Wm−2 (right) from Landsat-ETM on 2 August 2002, in Basel, Switzerland, during the BUBBLE field campaign.
Remotesensing 13 03598 g002
Figure 3. Ratio of storage heat fluxes QG (as percentages of Q* on secondary axe), normalized by net radiation, from 20 clear-sky days during the BUBBLE-field campaign in Basel, Switzerland (station Basel-Spalenring).
Remotesensing 13 03598 g003
Figure 4. Mean diurnal course of air temperature differences (urban–rural) for the period 1994–2003 between the urban flux stations Basel-Spalenring (roof level, 32 m AGL) and the rural station Basel-Lange Erlen (2 m above ground) (left), and Basel- Spalenring (street level, 3 m AGL) and Basel-Lange Erlen (2 m AGL) (right) (–– spring, - - - summer, ●-● autumn, ◦-◦ winter, and –– annual mean) [29]. Note that time axes (X-axes) are midnight centered (X-axis in Central European Time).
Remotesensing 13 03598 g004
Figure 5. Surface temperatures of the city of Basel, Switzerland (left), from 1 m TIR airborne data, a sky-view factor in 1 m resolution (center), and percentages of roof surfaces at Landsat-ETM-LST-resolution (60 m) (right) [28].
Remotesensing 13 03598 g005
Figure 6. Landuse/landcover (LULC) in Basel.
Remotesensing 13 03598 g006
Figure 7. Longwave terrestrial emission (left) and net radiation (right) on 13 May 2012, at 21:12 UTC in the city of Basel, Switzerland. Data in Wm−2.
Remotesensing 13 03598 g007
Publisher’s Note: MDPI stays neutral with regard to jurisdictional claims in published maps and institutional affiliations.