Article

Spatial Dimension of Transport Exclusion Related to Statutory Trade Restriction—The Use of ITS Tools in Studies of Sustainable Urban Development

by
Marta Borowska-Stefańska
,
Michał Kowalski
,
Szymon Wiśniewski
and
Paulina Kurzyk
*
Institute of the Built Environment and Spatial Policy, Faculty of Geographical Sciences, University of Lodz, 70-445 Lodz, Poland
*
Author to whom correspondence should be addressed.
Remote Sens. 2021, 13(23), 4804; https://doi.org/10.3390/rs13234804
Submission received: 28 September 2021 / Revised: 23 November 2021 / Accepted: 25 November 2021 / Published: 26 November 2021
(This article belongs to the Special Issue Remote Sensing for Urban Development and Sustainability)

Abstract

:
The problem of statutory restrictions of the freedom to conduct business activities is a subject addressed by many researchers. On the other hand, there is little research into the spatial aspect of this phenomenon and its impact on the quality of life of the inhabitants of urban centres in terms of their exclusion from one of the key motivations for travelling, namely shopping trips. The main purpose of the article is to determine the impact of the introduction of a statutory restriction on Sunday trading on sustainable urban development in terms of identifying areas excluded from free access to such services within a large urban settlement in Poland. Our studies on accessibility by car utilised data from ITS systems, the assumptions of the probabilistic Huff Model, and methods to determine market catchment areas. The data used in the study were based on the results of a questionnaire survey. The research procedure was conducted for eight scenarios that covered two periods (March 2019 and November 2020) on trading and non-trading Sundays. The conducted research shows that changes in the temporal accessibility of grocery shops in Łódź within the analysed periods are noticeable for trading and non-trading Sundays. In both cases, accessibility by private car is decidedly worse on non-trading Sundays. Transport exclusion from accessibility to grocery shops applies, in particular, to residents of peripheral areas of the city and is further compounded by the statutory Sunday retail restrictions implemented nationwide.

Graphical Abstract

1. Introduction

An important constituent of customer behaviour analysis is the characteristics of the shopping process itself. The consumer’s decision to purchase products determines the basic characteristics of shopping activity. A purchase, as an operational manifestation aimed at satisfying the customer’s needs and demands, refers to the item, scale, brand and model of a given product, and the place and time of purchase. The time of the sale–purchase transaction is the most fundamental feature of the whole process, and it can be generally determined (year, month, week) or pinpointed to a more specific timeframe (specified day of the week and hour) [1].
Daily mobility for shopping varies not only in terms of the period in which the purchase takes place, but also its frequency, journey time necessary, preferred mode of transport, etc. Some customers do their shopping every day, while others only visit stores once in a while. In general, decisions on shopping trips do not have to be made on a daily basis, but in a weekly cycle. Currently, due to the popularity of larger home refrigerators, the ever-increasing number of cars, and the greater participation of women in work life, etc., there is a growing trend to shop weekly. Therefore, any study on shopping behaviour should take into account multi-day data that encompass at least a weekly perspective and reflect any rise in customers’ shopping activity across successive days of the week [2]. Furthermore, it must be stressed that shopping behaviour mainly depends on the person’s working hours, the manner in which a given customer manages their leisure time at weekends, their shopping habits, the size of their household, the accessibility of retail stores, etc.
The traditional Catholic image of the weekend (particularly Sunday as a day off) has undergone dramatic changes during socio-political transformation. Changes to the job market brought about new working conditions, including the forms and rules of employment, which translated into substantial changes to the ways and standards of life of both individuals and whole families. These changes resulted in a shift in the weekly schedule of cultural, educational, social, and also shopping activities among those professionally active (especially the young) [1]. The issue of Sunday trading has long been a widely discussed social issue in Poland. An act on retail restrictions on Sundays and public holidays (as well as some certain other days) was introduced in Poland in March 2018. In accordance with this bill, the trading ban was introduced gradually, with shops being open on two Sundays per month from March 2018, then on only one Sunday from 2019, and since 2020, the ban has affected all but seven Sundays [3,4] (plus one more Sunday in December 2020 due to the COVID-19 pandemic). An act on retail restrictions once again shifted people’s spatial mobility due to the imposed restrictions (e.g., changes in shopping habits and trips across the weekly cycle). This was confirmed by a pilot study [4,5] conducted within the framework of the project A Pilot Study of Changes in Transport Behaviour of Łódź Residents upon the Introduction of Retail Restrictions on Sundays.
After the gradual introduction of the Sunday retail restrictions (from March 2018), numerous aspects of everyday life have been impacted, mostly affecting residents of medium-sized and large cities, and influencing daily mobility related to shopping. As was concluded by Chmielewski [6], who assessed the impact of the Sunday retail ban on daily traffic density over a weekend in the road network of Bydgoszcz (the regional capital and the largest city of the Kujawy-Pomerania Province), a rise in traffic density on trading Sundays is noticeable when compared to non-trading Sundays, though its scale varies depending on the season of the year and the weather. Spring and summer months foster recreation, so residents eschew shopping trips in favour of relaxation, which translates into the smallest rise in traffic density. On the other hand, August and September, marked by gradually worsening weather, post-season sales, and the beginning of a new school year, generate higher traffic related to weekend shopping. The highest rise in traffic density, however, was recorded in November and December, which was attributed to the upcoming Christmas season. A particularly dynamic growth of nearly 30% was reported in December, when volumes of traffic for trading and non-trading Sunday were compared.
A similar study was conducted by Borowska-Stefańska et al. [4,5], who identified and determined changes in transport behaviour related to Sunday retail restrictions in Łódź (one of the largest Polish cities and the regional capital of the Łódź Province). The returned results showed that, during trading Sundays, the traffic density observed in the course of monitoring road users was slightly higher than on non-trading Sundays. On Sundays with no retail ban, shopping centres and malls were an important destination, which most residents visited by car. However, the study did not take into account the difference in traffic density between trading and non-trading Sundays on an annual basis.
Moreover, a survey conducted in September 2016 by the CBOS Public Opinion Research Centre on a representative, random sample of 981 adult residents of Poland revealed that as many as 79% respondents did their shopping on Sunday. The decision depended on the respondents’ age, professional status, size of their household, and devoutness. The CBOS survey also showed that, relatively, Sunday shopping is most often done by people aged 25 to 44 who are residing in a big city and have full-time work (but not shift workers). On the other hand, people who do their shopping least frequently on that day are senior citizens (65+) and those who visit a place of worship [7].
As can be seen, the retail restrictions introduced in Poland have had a significant impact on people’s transport behaviour (primarily city residents). Currently, as few as 9 out of 27 EU member states have significant Sunday retail restrictions. Since there is no common EU law to regulate the matter, member states individually exercise control over retail trade on Sundays [8]. In this respect, Poland is similar to Germany and Austria, where Sunday retail restrictions remain in force. The review of the literature shows that Sunday retail restrictions across Europe can be reduced to two basic patterns: a total ban on retail outside designated zones (e.g., popular tourist destinations, where shops can be open on Sundays) and a general ban that allows local authorities to stipulate the number of trading Sundays within a given region. Against this background, the solution implemented in Poland is quite restrictive [9,10]. This implementation of nationwide regulations on retail trade has had an immense impact on people’s spatial behaviour. While non-grocery shopping can still be done online, there is a great social necessity for groceries to be freely available. In many well-developed economies, the system of grocery retail has been restructured, and new types of retail outlets have appeared at the expense of small shops, e.g., discount supermarket chains, supermarkets, etc. [11,12]. This trend has been clearly visible in most industrialised countries and across the majority of economic sectors over the last few decades. One of the postulates behind the implementation of retail restrictions on Sundays was the expectation that small local shops would benefit from the fact that larger stores remain closed on that day. Knowledge of the effects related to retail restrictions would be very informative for urban authorities and politicians responsible for making new national laws and city planners, with regard to such issues as conscious mobility and its impact on residents’ quality of life and their activities undertaken. As the periods when the restrictions were imposed in Poland were implemented in stages, we decided to delve into the matter.
The main purpose of the article is to determine the impact of the introduction of a statutory restriction on Sunday trading on sustainable urban development in terms of identifying areas excluded from free access to such services. The research procedure was based on a set of specific objectives of both a cognitive and methodological nature. The first one was to analyse changes in the number of grocery shops, and their surface area, type, and distribution between the period of the mildest and the strictest restrictions. Another task was to investigate changes in the level of exclusion from convenient use of grocery shops resulting from the introduction of statutory restrictions. The third cognitive aim focused on identifying the effects of co-occurring changes in customer behaviour and the state of the shop network on accessibility during the restrictions. The methodological objectives included the development of a method for accessibility analysis based on vector data on land use and remotely acquired data on the functioning of the urban transport system, accounting for the variability of the transport behaviour (modal split, travel time) and purchasing behaviour (shopping time) of the population and the spatial and functional diversity of the study area, at the same time taking into consideration the factor of competitiveness.
Our research concerns the issue of exclusion from access to services as a result of the introduction of the law on Sunday trading restrictions in Poland with reference to the use of motor vehicle transport. The Sunday trading ban policy restricts shopping activities in both spatial and temporal terms. Unfortunately, however, it has not yet been studied in detail either with regard to changes in accessibility to retail facilities (by format) or excluding areas in the city from access to grocery shops. Therefore, this study, based on the example of a large Polish centre (Lodz), fills this gap and contributes to the important research concerning the impact of the trade ban not only on accessibility but also on sustainable urban development. Since our study is devoted to transport-related exclusion from access to shops, the first aspect to be discussed is the mechanisms of exclusion that stem from a lack of transport and social equity. In recent years, the pool of studies on transport equity and equality has increased dramatically, even though the issue was primarily ignored in the early 21st century, especially in reference to its spatial and mobility-related aspects [13]. The need for transport services will differ depending on age, gender, and lifestyle. According to Martens [14], even though we must expect certain degrees of disproportion in access to transport, excessive transport-related impediments may restrict daily mobility, thereby leading to transport-induced social exclusion [15]. In the literature, there are studies [16,17] that show that all transport-related deficits (no public transport, insufficient number of connections, etc.) are corelated with a number of types of social exclusion, which results in transport poverty. The literature indicates that the factors that influence transport-related exclusion include:
  • physical exclusion;
  • geographical exclusion;
  • exclusion from facilities (the distance to facilities, e.g., shopping);
  • economic exclusion;
  • time-based exclusion;
  • fear-based exclusion;
  • space exclusion [18].
The innovation of our study is based on two main features: its spatial nature and the inclusion of data from the Intelligent Transport System. The research problem that we undertake has been a subject of interest among representatives of other disciplines, e.g., economists or sociologists, but, from their perspective, it has a nonspatial character. This is an obvious research gap within the issue of trading restrictions. By including vector-based urban development data in the study, we were able to identify and examine how the introduction of a statutory restriction on trade determines the city’s sustainability, i.e., the level of exclusion from the free use of services affecting the quality of urban life. The introduction of remotely collected transport system data from the tools typical of smart cities allowed us to capture the features of the city’s transport subsystem and, at the same time, to determine the spatial consequences of the implementation of the restrictions in question in a more accurate manner.

2. Materials and Methods

2.1. The Researched Area

The introduced statutory restrictions on Sunday trading have mainly affected large-format retail facilities, which tend to be located in large- and medium-sized cities. Łódź, the capital of the region, is the largest city in terms of both administrative area and number of inhabitants in the Łódź province. Hence, the number of retail facilities in the urban space is by far the highest in this area, and therefore the exemplification of the introduced restrictions is clearly discernible there. Furthermore, the city’s transport infrastructure is equipped with an ITS system containing data that has been made fully available to us. The article presents two zones of the city: the external and the internal one, related to the city’s past and the formation of its settlement structure, which conditioned the course of the transport network and thus indirectly influenced the distribution of commercial facilities.
The inner zone has its origins in the historical development of the city, which initially was a typically agricultural settlement. A brief chronological description shows that what came next was the development of a new and precisely planned city, as a result of which Łódź, from being a rural settlement, underwent the process of dynamic industrialisation. In the 19th century, it boasted elements typical for developing cities of that time (e.g., factories and manufacturers’ mansions), and irregular and explosively expanding suburbs. The structure of the city began to change dramatically after the political transformations in the late 20th century (the marketisation of the Polish economy). A particularly noticeable feature was the expansion of office and service space [19], which is still visible nowadays (Figure 1). On the other hand, the outer area, which lies outside the ring of the railway, is marked by dynamically growing, large housing estates (built in the 1970s and 80s, and later), vast industrial areas, and warehousing, which are usually located in peripheral areas.
Łódź is characterised by its relatively high population density (especially in the large housing estates of Chojny, Dąbrowa, Olechów, Radogoszcz, Retkinia, Teofilów, Widzew) and the dense network of roads (Figure 2). A comparative analysis of the spatio-functional structure and the road system allows us to conclude that the relatively well-developed infrastructure along axes connecting the suburbs with the city centre (Śródmieście), together with a slightly underdeveloped system of connections within large housing estates, confirms the concentricity of the urban layout [4,20], which becomes increasingly less regular outside the city centre.
The city centre boasts by far the highest concentration of retail facilities [21]. As proven by Dzieciuchowicz [22], the density ratio of retail facilities to population takes a positive value. As for the largest retail facilities (shopping centres), there are several patterns to their location in Łódź: in the city centre, within large housing estates, and along the axes that form a continuum from the city centre to the large housing estates and residential areas in the suburbs [23]. In general, the total number of grocery shops is dominated by general food shops and convenience stores, while the largest retail space is offered by hypermarkets and discount supermarket chains (Figure 3).
The third most populated urban agglomeration in Poland, Łódź has a demographic structure that places it among gender-imbalanced cities—according to the Polish Central Statistical Office, there were 119 females for 100 males in 2019. The city is also struggling with a low RNI (−5.61), a negative net migration rate (−1086 per 1000 residents), and is dominated by small households. The city’s problems have their roots in history and the fact that the majority of residents used to work for state-run industries (mostly textile). Moreover, Łódź—similar to other Polish urban settlements of comparable size—faces the issue of low average income per capita (which is actually the lowest for Łódź and amounts to EUR 1073.37). This is partially a result of the constant and hesitant changes that are the effect of the political transformation and decentralisation of the Polish economy. In 2019, the number of business entities classified as retail decreased marginally in comparison to previous years, and amounted to 20,600 (607 fewer than in 2018).
Following the 2018 Sunday retail restrictions, the Pilot Study of Changes in Transport Behaviour of Łódź Residents upon the Introduction of Retail Restrictions on Sundays was conducted to verify if, and to what extent, retail restrictions on Sundays and public holidays (as well as some certain other days) impacted the residents’ activities and their transport behaviour. The returned results showed that the inhabitants of Łódź prefer a sedentary lifestyle on Sundays, regardless of whether it is a trading or non-trading day. Approximately one third did not take any trip on a trading Sunday, while, on a Sunday, with no retail ban, half of respondents did likewise. The results of the survey also made it possible to determine which forms of leisure residents opted for on a non-trading Sunday, including sport and recreation, culture, and entertainment. On average, the respondents devoted around 30 min to these activities, which mostly began and finished at their place of residence. Another conclusion drawn from the survey concerns the place that residents chose to do their shopping on either trading and non-trading Sundays. They were most likely to choose shops within walking distance of their home. As a result, it was local shops (especially on non-trading Sundays), discount supermarket chains, and supermarkets that appeared to be the most popular destinations. However, the study also revealed that, on trading Sundays, important destinations were also shopping centres, to which the respondents primarily travelled by car. Additionally, the survey also indicated that women were more active than men, especially during trading Sundays, but they would shop for goods other than groceries. Finally, the survey also showed the amount of time devoted to different activities during the day. It turned out that, no matter which Sunday was considered, Łódź residents would spend most time studying and then working, and the least time doing grocery shopping [4,5].

2.2. Sources of Data and Research Methods

2.2.1. Grocery Retail Facilities

The most useful source of data used in the study is the Retail Trade Database offered by a commercial data provider of location and spatial analysis operating on the Polish market. The data cover two periods—March 2019 (i.e., the transition period when the retail restrictions were being introduced) and November 2020 (nearly a year after the full scope of the restrictions was implemented). Each shop in the database was attributed with two descriptions of store type, where the first one consisted of three classes (food stores, non-food stores, and other stores and services), and the second contained a division into format and products on offer (37 types of facilities in total). Regarding store types, firstly, all types of food stores were selected to be incorporated in the study, including the following: hypermarkets, supermarkets, discount supermarket chains, cash and carries, general food stores, specialised food stores, and convenience stores. In addition, the database offered some extra information on store fascia, operator identifier, address, geographical coordinates, gross area, net sales area, and opening and closing date. These data were mainly of commercial use (location analyses for retail facilities) aimed at both small retailers and large retail chains.
The global picture of the retail market in Łódź that emerges from the aforementioned data is as follows. During the initial period of restrictions, the largest percentage of total retail space among food stores was attributed to hypermarkets (36%), discount supermarket chains (21%), cash and carries (13%), and supermarkets (13%), i.e., retail facilities closed on non-trading Sundays. The share of other shops amounted to 10% for general food stores, 6% for convenience stores, and 1% for specialised food stores. The data for 2020 do not show any substantial differences in market share (Figure 4). Between March 2019 and November 2020, the net number of stores decreased by four (new supermarkets, discount supermarket chains, and general food stores appeared, while some specialised food stores and convenience stores disappeared). As for the net amount of retail space, it showed a decrease for supermarkets, specialised food stores, and convenience stores, and a rise in general food stores and discount supermarket chains. At the same time, the comparative analysis of the percentage of liquidated and newly opened stores (Figure 4) and the total number of shops and their retail space clearly indicates the ongoing expansion of discount supermarkets chains in Łódź, which is not exceptional when compared to other regions [24,25].
The most common types of stores newly opened in the vicinity of a liquidated grocery shop were discount supermarket chains and food shops, and the average distance between a new shop and a liquidated one was slightly over one kilometre (Table 1).
On the basis of the data on the distribution of retail facilities, a static measure of their density was calculated for each analysed variant (Figure 5 and Figure 6). The measure, which is based on the ratio of the number of stores to the retail space of the basic unit, was selected due to the fact that the inclination to travel in order to do shopping is, to a great extent, determined by the distance between the starting point and the destination (shop). It was assumed that, in those areas that have a high density of retail facilities, the inclination to cover longer distances is smaller, since they possess a higher potential [26]. On the other hand, residents of those areas with a low density of retail facilities have to cover longer distances to do their shopping.

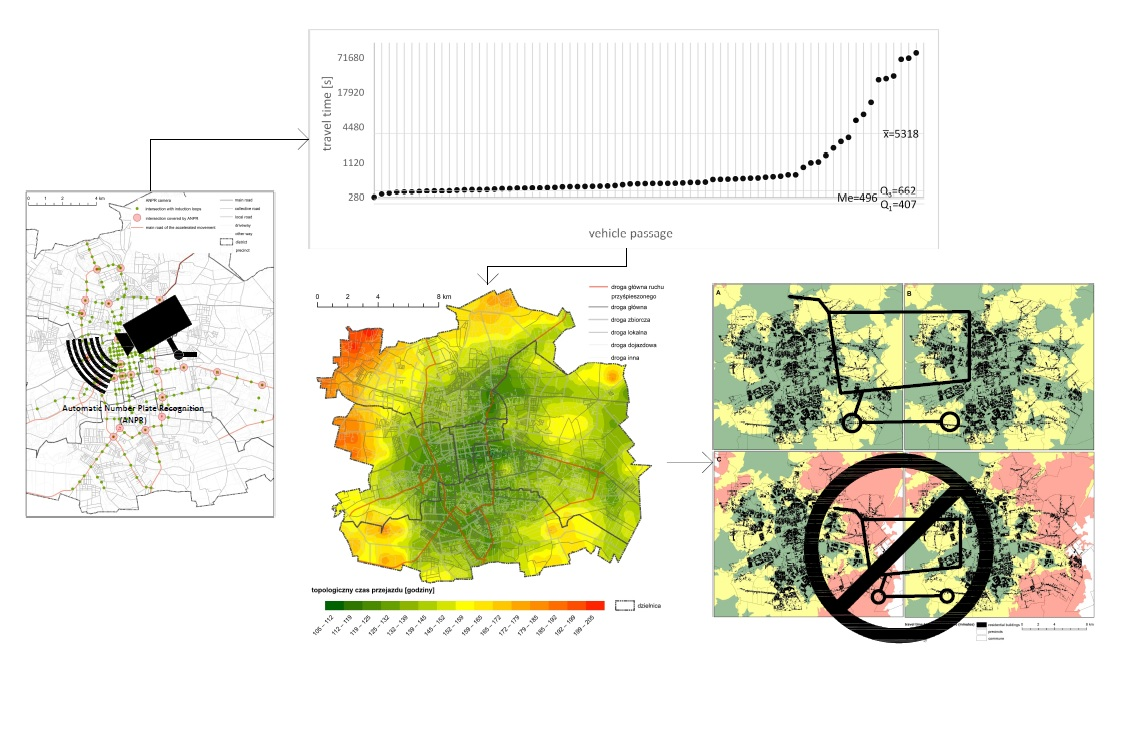
2.2.2. Use of ITS Tools—Models of the Road Network and Traffic Speed

Speed models for accessibility analyses vary, with differences stemming from two fundamental aspects: access to data, and the spatial scope of the study. Moreover, speed modelling can also differ depending on the chosen mode of transport. Speeds applied for accessibility analyses focusing on pedestrians are usually around 5 km/h (Table 2), which is the value assumed in this study.
The issue of modelling car speeds is considerably more complex. As a result, various approaches to the problem of assessing road traffic speeds and travel time are applied in the literature. Some studies are based on classic, empirical premises, while others use models of the transport network and then calibrate the returned results on the basis of empirical sets of data. An alternative solution involves networks used to analyse transport accessibility, where speeds are set on the basis of the traffic code (maximum allowable speeds) [36,37] or determined upon the analysis of data officially provided by road operators and sometimes modified according to the researcher’s personal experience [38,39]. Regarding the aforementioned classic modelling of speeds based on observations whose results are directly transferred into a speed model, we can distinguish the following types of information to be applied: commercial, ICT and floating car data [40,41,42], or data collected by intelligent transport systems [20]. In traffic speed modelling, the approach based on hypostatisation and deduction most commonly utilises two methods of assessing speed. The first takes into consideration speeds that stem from simulation traffic models [43,44], while the other utilises parameters of the transport network, as well as land use and the environmental conditions in its vicinity [45,46]. Importantly, due to the level of entropy in transport systems, any attempt to model traffic speeds may accurately, but never faultlessly, reflect average speeds for a given location and time.
In our analyses of car-related accessibility, we used data from ITS systems and results presented by Bartosiewicz and Pielesiak [47]. The choice of which data to use at a given time was determined by the location of a given road section within the settlement network. More precisely, ITS data were used to model speeds for sections within the administrative borders of Łódź, while the data from the other source were applied for segments outside the city. In the first case, we used data from ANPR [48,49], a tool not commonly used in transport studies [50,51,52,53], which is based on an intelligent technology of automatic number-plate recognition. In Łódź, the data come from 125 cameras installed at 23 intersections.
On the basis of the aforementioned measurements, we selected roads based on their class and location within the spatial structure of the city (inside and outside the railway ring). These roads were a sample used to calculate travel speed, and the results referred to the whole set of roads of a given class for the two specified locations. Each selected section was tested during two transport peaks and the time between them. Once travel speeds were averaged (a significant disparity was revealed for different periods), these values were compared to speeds in the traffic code: (vANPR ÷ vk) × 100%. The result was the percentage of the traffic-code speed reached for analysed trips on individual classes of roads and in specified locations. Next, we estimated the decrease in speed with regard to the traffic-code speed on main and service roads outside the city centre by proportionally comparing the said speeds to speeds observed on a higher road class: (vout = (vin × vout) ÷ vin). For local and access roads, we applied relative speeds previously returned for the class of service roads since they are quite similar. In order to verify the accuracy of the model, we compared our results of the topological accessibility of inner Łódź with analogical results returned when data from Google Matrix Responses were used [20].
For the areas outside the centre of Łódź, we applied a speed model based on calculations by Bartosiewicz and Pielesiak [47], who conducted analyses of the Łódź Metropolitan Area (ŁMA) and compared the differences between the travel times they recorded and travel times based on the traffic code for selected roads leading from the peripheral areas of ŁMA to the outer ring road of Łódź (road lengths: 25.6–51.5 km). Next, we compared the said differences to traffic-code speeds, which allowed us to determine the network efficiency, i.e., the possibility to travel on the network at traffic-code speeds. Then, for each section, we multiplied the travel time for driving at the traffic-code speed by the returned value of network efficiency.
The procedure that we applied is one of the classic means of modelling traffic speeds. The modelling itself only involved the collection and appropriate processing of sufficient amounts of empirical data and analytical results on the area around Łódź that were available in the literature. The model was not calibrated, but the juxtaposition with data from Google Matrix Responses [20] allowed us to state that it accurately reflected the road conditions in Łódź (maximum differences in temporal accessibility between spots of the topology based on 291 nodes did not, on average, exceed |3.3| s).

2.2.3. Assessment of Store Load and Accessibility

The research procedure in this paper aims to assess the possible load of (demand for) food stores and the resultant accessibility of retail space. The procedure is based on the methodology implemented to analyse the vulnerability of accessibility to foodstuffs when the supply chain is disrupted by a non-typical event [54]. This analysis also takes into account the premises of the probabilistic Huff Model [55,56], and several methods used to determine catchment areas [57,58,59]. The applied solution offers the possibility to assess the load of food stores by determining their net retail space (areas for customers where goods are displayed, excluding staff-only facilities), expressed in square metres per person-hour of grocery shopping. The initial version of the method did not take into account the factor of time due to insufficient data on the average duration of shopping. However, the aforementioned questionnaire survey contained this parameter and showed that the time is noticeably different for grocery shopping done on trading and non-trading Sundays. In Łódź, the average time for grocery shopping is 26 and 14 min for trading and non-trading Sundays, respectively. This disparity was considered a variable important enough for it to be taken into consideration by the algorithm of the upgraded method. Moreover, store load enables us to determine the total retail space accessible to the residents of a given basic research unit (each of the 215 boroughs of Łódź). The first stage of the procedure was to generate a matrix of travel times between all basic research units and all grocery shops. In order to make the returned results more realistic, we decided to exclude the border effect by taking into account food stores located outside Łódź. The rationale behind this was that administrative borders are of no significance when it comes to trips analysed in our study. Since the results of the questionnaire survey showed that—regardless of the type of Sunday when the shopping is done—the modal division consists of private car and walking [4,5], it was necessary to prepare matrices for both transport options in accordance with the previously presented speed models. This allowed us to determine the number of people from a given borough willing to travel to a given grocery shop either by car or on foot. On trading Sundays, grocery shopping was done, on average, by 5.6% women and 6.2% men, and on non-trading Sundays, the numbers amounted to 18.7% and 30.0%, respectively. The study excluded minors aged under 13, as they were not allowed to shop unaccompanied. The results of the survey showed that on trading Sundays, 65.4% of respondents walked to the shop, and this number grew to 95.2% for non-trading Sundays. As mentioned above, the rest of the respondents used a private car (either as drivers or passengers). To stress the importance of the spatial and physiognomic differentiation of the two groups of facilities (grocery stores and basic research units of the city) and their mutual spatial matching, functions of distance decay were introduced, as they allowed us to avoid a Boolean approach to the relationship (where a given facility could only be either accessible or not) and substituted with a changeable probability of such a relationship occurring. We assumed that the inclination to take a shopping trip depends equally on two factors—the type of food store and the number of grocery stores per surface area of a given basic research unit. We also assumed that the store type is directly related to the range of products on offer and the reliability of their availability. In other words, the higher the variables are, the greater the inclination to take a longer trip. As for the spatial density of stores in the vicinity of people’s homes, this factor is intended to reflect a growing inclination (and sometimes even a necessity) to take a longer trip by residents who have no retail facilities in their immediate neighbourhood. After all, residents of areas with low or zero density of shops are used to travelling greater distances even to buy basic groceries. The higher dispersion of people in the peripheral areas of the city makes it more difficult to tailor the spatial distribution of the retail offer accordingly so that it would meet the accessibility in vast and densely populated areas, e.g., the city centre or large housing estates. In such places, the offer is so rich and uniform that taking longer trips to buy food is significantly less justified [60,61]. This means that the higher the density of food stores in a given communal district, the greater the distance decay for grocery shopping for residents. These two factors enable us to make potential customers’ preferences significantly more realistic. When it comes to store formats, we attributed them with β coefficients of distance decay to curb the probability of a trip by half for the travel times presented in Table 3, regardless of the type of Sunday (trading or non-trading). The application of the fixed parameter of distance decay for both scenarios (restrictions and no restrictions) stems from the fact that it is generally assumed in the literature that the catchment area depends on a myriad of factors, which are usually related to retail space, offerings, the average expenditure, and location [62,63] (a review of the literature on major tools used to assess location and catchment area was compiled by Wood and Reynolds [64]). Since there are no studies of the impact of customer behaviour on the said factors in the Polish market, we do not feel entitled to differentiate the scope of the catchment areas in reference to the two main scenarios (trading or non-trading Sunday). Differences in travel time (related to location within the urban structure and lower supply on non-trading Sundays) were incorporated into β coefficients of distance decay, which means that the parameter was adjusted to basic spatial units on the basis of the density of retail facilities and the change in people’s inclination to cover higher distance decay in order to do their shopping, as identified in the questionnaire survey [4,5].
Regarding the spatial density of food stores, we applied β coefficients of distance decay that reduced trip probability by half for the travel times presented in Table 4 and differentiated them not only by mode of transport, but also by the differences recorded for trading and non-trading Sundays. The travel time at which the probability of a trip to a given store type drops by half was determined on the basis of two premises. The first was related to the density of retail facilities (the number of shops that are open in a given spatial unit), which was calculated for each basic spatial research unit. Next, we created five classes of density following the criterion of equal independent intervals for non-trading Sundays, trading Sundays, and for the analysed period (partial and absolute restrictions). For the middle range, we applied the average value of travel time (separately for pedestrians and car users), which was determined for trading and non-trading Sundays on the basis of the questionnaire survey [4,5]. The remaining intervals were, respectively, higher or lower by the quotient of the average value divided by the number of classes.
The function of distance decay takes the following form, according to Rosik [65]:
R = e x p β T i j
where:
  • R—distance decay;
  • β—coefficient of distance decay;
  • Tij—travel time between a borough i and a food store j.
Using the aforementioned premises, we were able to determine the numbers of potential customers who travelled from a given borough to a given food store, which included the factor of transport and buying behaviour typical for trading and non-trading Sundays:
F s = 0.5 · P i T s T i j R i · T i j R i + 0.5 · P i T s T i j R j · T i j R j
where:
  • Fs—total number of person-hours from a given borough i that placed load on a given food store j;
  • Pi—number of grocery shoppers in a given borough i;
  • Ts—shopping duration;
  • Tij—travel time between a given borough i and a given food store j;
  • Ri—distance decay with regard to food store density in a given borough i;
  • Rj—distance decay with regard to a given type of food type j;
  • 0.5—coefficient that equiponderates the weight of food store density in a given borough with the type of food store.
The applied method also takes into consideration the element of competition along with all food stores accessible to residents of a given borough, ‘linking’ potential customers with individual shops. This is done proportionally to the calculated trip probability, but in such a way that the aggregate number of customers should equal the number of potential customers that—according to the survey—do shopping on trading and non-trading Sundays. The quotient of the total retail space of a given shop divided by the cumulated number of person-hours for the shop allows us to determine its load, while the accessibility of retail space to residents of individual boroughs is the total sum of retail spaces per customer (calculated in the previous step). This means that the measure of accessibility for a given borough takes into account shop loads resulting from customer traffic from other districts for whom a given shop is accessible. Upon the incorporation of variables characterising transport and buying behaviour on trading and non-trading Sundays, all the calculations described above allow us to determine the quantitative and spatial scale of effects that the statutory retail restrictions have had on freedom in operating a business.

2.2.4. Stages of the Research Procedure

In order to accomplish the objectives established in the paper, we had to perform these calculations for eight scenarios, as shown in the matrix below (Table 5).
Firstly, we calculated the load of food stores for the two modes of transport for trading and non-trading Sundays within the basal period (scenarios 1 and 2). Once scenarios 3 and 5 were juxtaposed, we could determine the spatial differentiation of changes in the load of stores, their accessibility, and the modal division created by the retail restrictions in the early days of the statutory ban. Next, we had to verify if there were any changes in the load, accessibility, and model division nearly 2 years after the restrictions were introduced and expanded (from just one non-trading Sunday per month to every second non-trading Sunday a month). For this purpose, the results of scenarios 1 and 2 were compared with those of scenarios 5 and 6, while scenarios 3 and 4 were juxtaposed against 7 and 8.

3. Results

3.1. Possible Accessibility

When we only take into account the spatial distribution of the places where grocery-related supply and demand occurs, we must indicate that spatial accessibility to at least one shop within a 15-min drive would have been ensured to all Łódź residents in the basal and final period of the research if there had been no retail restrictions. Despite the fact that some shops were closed (those affected by the retail restrictions), 99.9% of residents were located within the 15-min travel isochrone for both analysed periods. A more distinct difference can be observed for trips taken on foot. When we analyse four scenarios of walking ranges (Table 5), the disparities between trading and non-trading Sundays are significantly more noticeable than for trips by car. In scenarios 2 and 6, 96.9% of Łódź residents who walked to the shop were within the 15-min isochrone, and in scenarios 4 and 8, these values were 88.3% and 88.4%, respectively. What we also observed were changes in cumulative accessibility, depending on whether a given shop was or was not affected by Sunday retail restrictions (Table 6).
Changes in temporal accessibility to grocery stores in Łódź for the analysed period are noticeable for both trading and non-trading Sundays. Notably, the accessibility decreases the further one travels away from the city centre, reaching its lowest values for peripheral areas. Naturally, these changes are also visible for trading and non-trading Sundays in each analysed period, and, in both cases, the accessibility of grocery stores in Łódź is noticeably worse for non-trading Sundays when the shopping trip is made by car (Figure 7).
The situation is similar for temporal accessibility to food stores in Łódź when the trip is made on foot. However, drops in accessibility for this mode of transport are smaller when we consider the scale of the whole city (Figure 8). This is connected to the fact that any liquidated grocery shops are replaced by others that are most often of only a slightly different type or format, which is confirmed by the analysis of accessibility to closed and open food stores in Łódź for the analysed period (Figure 9). Importantly, when it comes to accessibility for trips taken on foot, it must be stressed that residents of peripheral areas of Łódź, especially on non-trading Sundays, lack the opportunity to reach a retail facility within 15 min (Figure 10). Moreover, we could also venture to conclude that, on non-trading Sundays, car users who reside outside the city centre or large housing estates are excluded from using grocery shops.

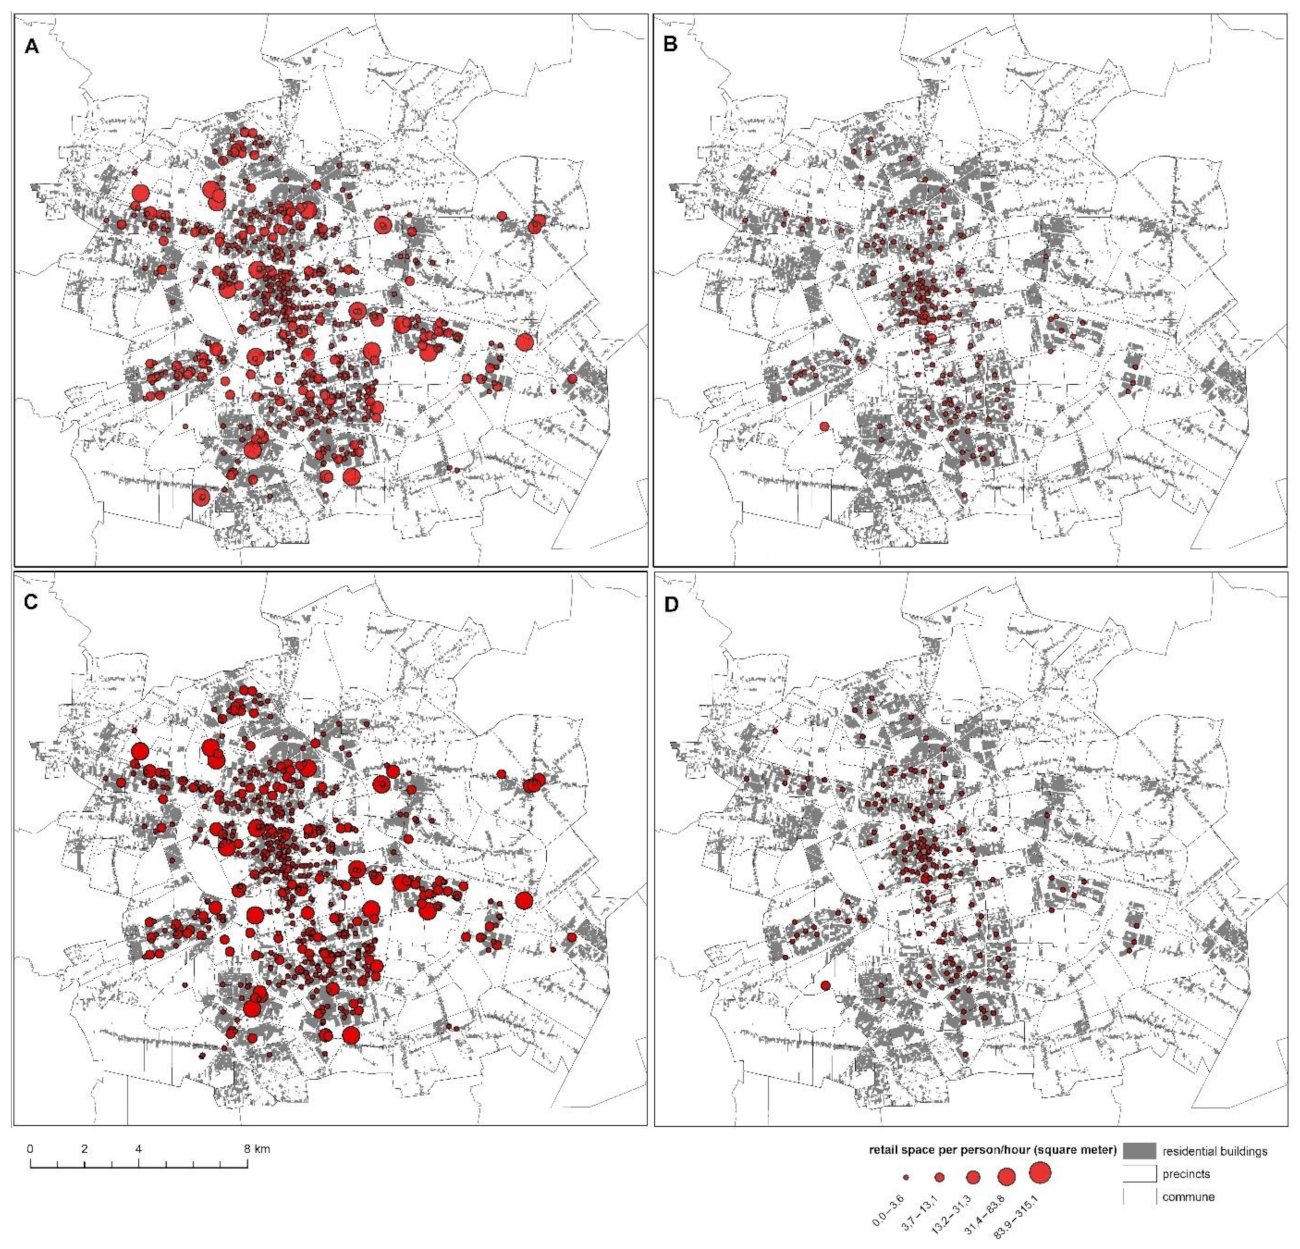
3.2. The Load of Retail Facilities
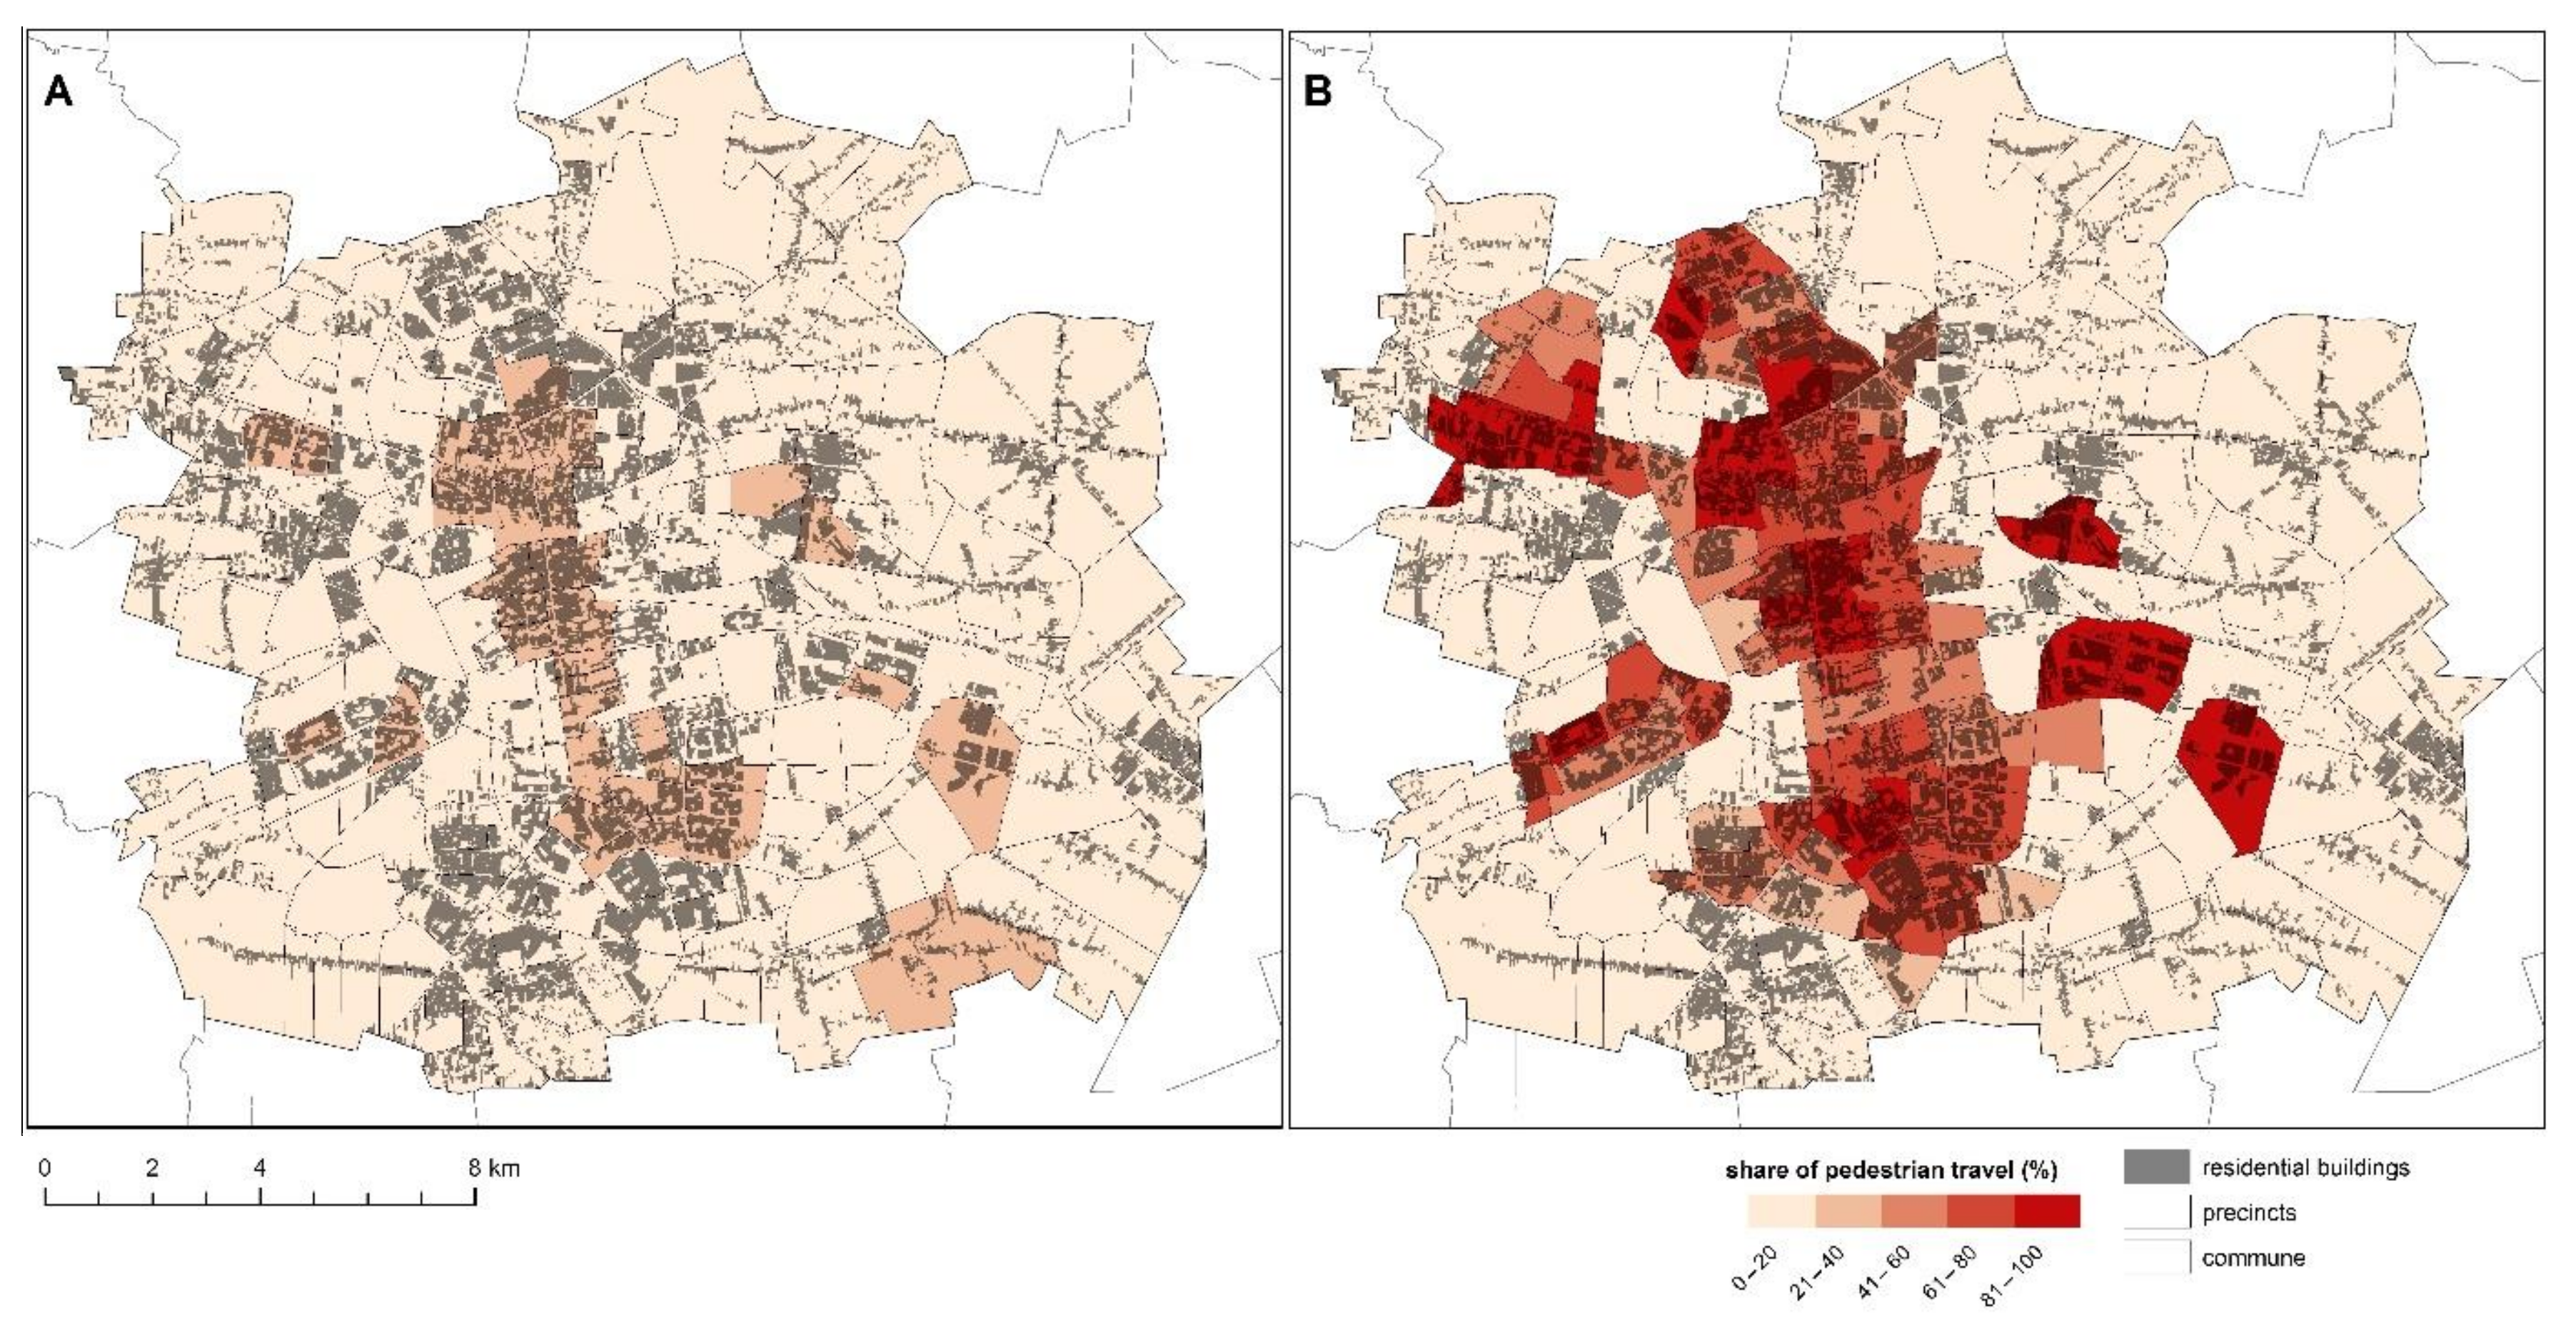
The statutory retail restrictions have had an impact on the load of grocery stores, with the net retail space per one person-hour of grocery shopping being significantly greater on trading Sundays (Figure 10). Primarily, this stems from the considerably reduced number of shops that can be open on non-trading Sundays in Poland, where there are very few exemptions from the Sunday retail ban. Other influencing factors are the type of store and the duration of shopping. On non-trading Sundays, small local shops are the most popular destinations, whereas on trading Sundays, it is shopping malls and centres that are more important. Additionally, shopping in smaller stores takes much less time—up to 30 min on average—while a visit to a mall usually lasts between 2 and 3 h [4]. The studies show that the different types of retail facilities are spatially differentiated in terms of their attractiveness. Not only do larger stores boast significantly greater retail space, but they also often provide free car parks and, importantly, offer a comprehensive range of groceries. For these reasons, they are considerably more attractive for consumers who prefer doing a more comprehensive shop under one roof. In consequence, they are more willing to cover greater distances to visit this type of retail facility. On the other hand, local shops demonstrate the reverse relative attractiveness—they are extremely attractive to local residents when it comes to quick shopping, while they remain less appealing to people who do not reside in their vicinity due to the noticeably limited assortment and the necessity to cover greater distances [6,66,67].

3.3. Modal Division

The fact that convenience stores are practically the only ones that can be open on non-trading Sundays translates into a rise in the importance of trips taken on foot within the modal division that we applied (Figure 11, Table 1).
As confirmed by Borowska-Stefańska et al. [4], most residents prefer to do their grocery shopping on Sundays in stores that are located within a short walking distance from home, regardless of whether it is a trading and non-trading day. Therefore, the percentage of local shops in the whole structure of grocery stores in Łódź is also the highest, followed by those convenience stores that are allowed to open on non-trading Sundays. Surprisingly, the number of these shops has decreased over the two analysed periods (Table 7, Figure 12). It seems likely that people have become ‘accustomed’ to changes resulting from the statutory restrictions, and as a result, the shopping that they customarily used to do on Sundays has already been replaced by other activities, and shopping-related mobility has been transferred to other days of the week. This was confirmed, for instance, by Cyrek [68], who focused on customers’ preferences regarding retail facilities following the introduction of retail restrictions on Sundays and public holidays (as well as some certain other days) in Poland with regard to the day of the week when they do grocery shopping. The research showed that in the case of groceries, the restrictions limited the percentage of customers who did shopping on Sunday, and found that they began to visit grocery stores after the weekend (mainly on Mondays and Tuesdays) to replenish their food supplies instead.

3.4. Actual Accessibility

At the beginning of the analysed period, retail space accessibility per one person-hour of grocery shopping in Łódź was virtually identical for the basic distribution of the city’s population on the north–south (slightly displaced to the east) and east–west axes (Figure 13). The comparative analysis of relative changes in this accessibility conducted for non-trading (during the basal period) and trading Sundays showed drops in those peripheral areas where there were practically no convenience stores, while relative growths were observed in the city centre, where—despite the high population density—the number of shops open on non-trading Sundays remained high. As stated above, the type of shop has an additional impact on residents’ inclination to cover greater distances. Namely, the inclination is shorter for smaller shops with limited assortment and shopping duration, so the larger the store, the longer the acceptable distance.
The change in type and distribution of grocery stores in the analysed period has contributed to the fact that the majority of the city’s areas have increased their accessibility to grocery retail trade when there are no restrictions (Figure 14A). The situation changes dramatically when grocery shopping has to be done on a non-trading Sunday (Figure 14B). Analyses show that, besides a few boroughs, nearly the whole population of the city experiences at least slightly worse access to grocery retail on Sundays with retail restrictions in force.

4. Discussion

Studies on the impact of changes in the freedom to trade on Sundays are carried out in the aftermath of shifts in the legal environment. As a rule, socio-economic changes associated with market deregulation in this respect tend to be more difficult to measure (greater statutory freedom to trade does not always translate directly into market reality) [69]. Nonetheless, research into the changes in the vector directed towards increasing the freedom to trade on Sundays yields a number of interesting observations (Table 8). Equally interesting, but less frequent (retail restrictions have been lifted in most European countries following the analysis of the needs of consumers and the national economy [12,70]), are observations related to the opposite direction of the change vector. They are characterised by a slightly less complex empirical picture of how shops operate (increasing regulation in this area has a more direct impact on market reality) and at the same time—as it is in the case of market deregulation—by a wide range of external effects of the introduced restrictions, which are difficult to measure.
Many studies focus on the impact of legislative changes related to the freedom to trade on Sunday on employment, prices, sales (volume, structure etc.), as well as market concentration and structure [74]. Few studies, however, directly address the spatial perspectives that seem to be of particular importance considering that the location of a shop determines its commercial success or failure [75]. Some spatial insights are provided by studies conducted in countries where the regulatory process has started recently. In Hungary, for instance, restrictions on Sunday trading have been found to lead to changes in consumer behaviour in terms of how often and when people go shopping, how they do it online, and how they allocate their spending, without causing any noticeable changes in the redistribution of retail turnover and expenditure [10]. Similar research has been conducted in Poland. Its main conclusions point to changes in the spatial [4,5] and transport behaviour [4] of residents faced with shops being closed on Sundays. These analyses fail to take into account another component strongly related to the spatial distribution of services. This is related to the issue of retail exclusion. However, in this context, the concept of exclusion does not always result from a total lack of opportunities to satisfy needs, but often from a lack of access to opportunities to satisfy them here and now. According to Kenyon et al. [76], a lack of accessibility is a key element of social exclusion, affecting many of its dimensions. In this context, the research results presented here indicate that restricting Sunday trading may result in retail inequality [77]. It may particularly affect persons who do not have motor vehicles. At the same time, the emergence of Sunday shopping deserts means that a greater proportion of motorists are forced to use their cars to do their shopping. In this respect, it does not support the basic assumptions of the idea of sustainable transport [78]. However, there is also the other side of the coin: the inability to make large purchases discourages customers from travelling far, which in turn may influence more frequent shopping in the neighbourhood. There is no need for mechanised means of transport to do it. In this respect, the regulations introduced may have a positive environmental impact, provided that previous Sunday consumption behaviour is shifted and linked to other daily activities as this may result in a reduction in transport work. The proposed research procedure reveals several limitations, which pose a challenge for further, more profound, analyses of the subject matter. First of all, we must bear in mind that the transport and buying behaviour of residents may have changed over the discussed period. Although another questionnaire survey would return results that constitute vast and interesting diagnostic material, a survey is a time-consuming and cost-intensive method of collecting data, which cannot be applied on a regular basis when funds are limited. Despite this, we still believe that it would be worth re-surveying residents to determine the evolution of their behaviour regarding Sunday shopping after a longer period of retail restrictions being in force.
Moreover, it is not advisable to unambiguously identify the changes in the number and type of food stores in the analysed period as being solely the effect of Sunday retail restrictions, since the decision to commence or terminate a business activity is usually conditioned by various factors, even if the legal and administrative ones may play a particularly important role. Equally multifactorial is the decision to select a specific location for a business. Therefore, it would also be beneficial to conduct a survey among entrepreneurs who newly opened or liquidated their food stores in the research period to determine the impact that Sunday restrictions had on their final decision.
When analysing transformations of load and accessibility of retail trade in the selected period, we assumed that the number, gender structure, and distribution of people did not undergo any changes. However, some fluctuations in these values may have occurred in the period of two years, e.g., related to migration. While changes in the transport system and the network of grocery retail trade could be captured for the lowest possible level of data aggregation, population data on this scale of spatial resolution remain extremely difficult to obtain.
Another issue is the border effect. Despite numerous attempts to mitigate its impact, it cannot be completely ignored, so one must take into account the limitation related to this issue, namely the modifiable areal unit problem. Even though profound knowledge of the spatio-functional structure allowed us to select optimum basic units for our study, the division that we applied is still burdened with some imperfections.
Finally, the research procedure focuses exclusively on trips between home and shops, which means that no other journeys were taken into account, e.g., travelling between a workplace and a given store. Since the analysis focuses on Sundays (which are primarily days off work) and grocery shops (mainly household-related shopping), we assumed that trips from locations other than home would have an impact on the final results of the study.

5. Conclusions

The main purpose of the article was to determine the impact of the introduction of a statutory restriction on Sunday trading on sustainable urban development in terms of identifying areas excluded from free access to such services. Sunday retail restrictions have contributed to changes in residents’ transport behaviour, which is particularly noticeable for daily mobility related to shopping. In this regard, it must be stated that the lack of accessibility to the discussed facilities concerns non-trading Sundays in particular and affects residents of peripheral areas of the city, especially those with no access to a private car.
The analysis of changes observed in the number, retail space, type, and distribution of grocery stores between the period of most lenient and stringent restrictions proved that the decision to terminate business activity taken by some retailers was not related to location. This is evidenced by the fact that in almost all locations where shops ‘disappeared’ or in their immediate vicinity, new grocery retail facilities appeared, but of a slightly different store type. The analysis of the number and retail space of separate types of grocery stores for the discussed periods points to a further expansion of discount supermarket chains on the Łódź retail market, which is by no means exceptional on a national scale.
Another objective was to scrutinise changes in the scale of exclusion from access to grocery stores concerning transport and buying behaviour resulting from the statutory retail restrictions. Our study highlights that transport exclusion from access to grocery stores on non-trading Sundays primarily affects people who walk to shops or live outside the city centre or outside any of the large housing estates.
The next cognitive objective was to determine the effects that the cooccurrence of changes in customer behaviour and the state of the network of shops have on accessibility to grocery stores when restrictions are in force. Residents have become at least partially accustomed to changes resulting from the introduction of statutory retail restrictions, and, as a result, any shopping that they customarily did on Sundays has already been replaced by other activities, with shopping-related mobility being transferred to other days of the week. When people do decide to shop on a non-trading Sunday, they mostly walk to the shop, which makes running a retail business within the so-called ‘problem areas’ (in too sparsely populated districts) economically unjustified for the keeper. For this reason, we can observe a continuous decline in the number of retail facilities in the peripheral areas, as opposed to a steady increase in the city centre and large housing estates, accompanied by a constant growth in the spatial polarisation of accessibility to grocery stores on Sundays.
The completion of the methodological objective resulted in the development of a method to analyse accessibility that incorporates such factors as changeability of transport (modal division, travel time), buying (shopping duration) behaviour, and spatio-functional differentiation of the researched area, which takes into account the factor of competitiveness between individual grocery stores.
The accomplishment of the objectives set in this study allowed us to answer the question posed in the title of this paper. Undoubtedly, the changes that result from the statutory Sunday retail restrictions have a spatial dimension. There are areas within the city where we can observe transport exclusion for residents who cannot easily do their grocery shopping. Since numerous studies show that an insufficient number of nearby stores makes people feel socially excluded, access to them seems crucial not only from an economic point of view, but also from the perspective of the social rhetoric. However, our analyses did not bring a clear-cut answer regarding the relationship between the Sunday retail restrictions and business activity, i.e., opening a grocery shop.

Author Contributions

Conceptualization, S.W.; methodology, S.W.; software S.W.; validation, M.B.-S., M.K. and S.W.; formal analysis, M.B.-S., M.K. and P.K., investigation, M.K. and M.B.-S.; resources, S.W. and M.K.; data curation, S.W.; writing—original draft preparation, M.B.-S., M.K., P.K. and S.W.; writing—review and editing, M.B.-S., M.K., P.K. and S.W.; visualisation, S.W.; supervision, M.B.-S. and S.W.; project administration, M.K. and S.W.; funding acquisition, S.W. and M.K. All authors have read and agreed to the published version of the manuscript.

Funding

This paper was produced in reference to the research projects no. 2019/33/N/HS4/01733 and 2019/35/D/HS4/00697, financed with the funds of the National Science Centre in Poland.

Institutional Review Board Statement

Not applicable.

Informed Consent Statement

Not applicable.

Data Availability Statement

Please refer to suggested Data Availability Statements in section “MDPI Research Data Policies” at https://www.mdpi.com/ethics (accessed on 24 November 2021).

Conflicts of Interest

The authors declare no conflict of interest.

References

  1. Szromnik, A. Handel i zakupy w niedzielę w opinii społecznej–studium porównawcze (cz. I). Handel Wewnętrzny 2017, 3, 409–422. [Google Scholar]
  2. Sugie, Y.; Zhang, J.; Fujiwara, A. A weekend shopping activity participation model dependent on weekday shopping behavior. J. Retail. Consum. Serv. 2003, 6, 335–343. [Google Scholar] [CrossRef]
  3. Karkula, M. Monitorowanie I Kontrola Łańcucha Dostaw: Koncepcja Supply Chain Control Tower I Jej Zastosowanie W. Pr. Nauk. Politech. Warsz. Transp. 2018, 120, 265–277. [Google Scholar]
  4. Borowska-Stefańska, M.; Kowalski, M.; Wiśniewski, S. Changes in urban transport behaviours and spatial mobility resulting from the introduction of statutory Sunday retail restrictions: A case study of Lodz, Poland. Morav. Geogr. Rep. 2020, 28, 29–47. [Google Scholar] [CrossRef]
  5. Borowska-Stefańska, M.; Kowalski, M.; Wiśniewski, S.; Szustowski, B.; Maczuga, M. The impact of statutory sunday trading restrictions on the choices of residents of a large polish city with regard to transport behaviours and mobility. Stud. Reg. I Lokal. 2020, 82, 33–59. [Google Scholar] [CrossRef]
  6. Chmielewski, J. Impact of Sunday Trade Ban on Traffic Volumes. In Scientific and Technical Conference Transport Systems Theory and Practice; Macioszek, E., Sierpiński, G., Eds.; Springer: Cham, Switzerland, 2019; pp. 231–241. [Google Scholar]
  7. Adamiec, J.; Grodzka, D. Społeczne uwarunkowania handlu w niedziele. Infos Zagadnienia Społezno-Gospod. 2017, 1, 1–4. [Google Scholar]
  8. Ochremiak, A. Jak wygląda zakaz handlu w niedziele w Europie. In Gazeta Prawna. 2018. Available online: https://serwisy.gazetaprawna.pl/praca-i-kariera/artykuly/1107239,zakaz-handlu-w-niedziele-w-europie.html (accessed on 17 February 2021).
  9. Grzesiuk, A. Handel w Niedziele-Analiza Porównawcza Rozwiązań w Krajach Europejskich. In Handel Wewnętrzny w Polsce w Latach 2011–2016; Instytut Badań Rynku, Konsumpcji i Koniunktur: Warszawa, Poland, 2016; pp. 455–465. [Google Scholar]
  10. Kovács, A.; Sikos, T.T. The Impact of Sunday Closure on Consumer Behavior. Rom. Rev. Reg. Stud. J. Cent. Reg. Geogr. 2016, 12, 39–50. [Google Scholar]
  11. Kim, W.; Hallsworth, A.G. Researcher Large format stores and the introduction of new Regulatory controls in South Korea. Int. Rev. Retail Distrib. Consum. Res. 2013, 23, 152–173. [Google Scholar] [CrossRef] [Green Version]
  12. Kim, W.; Lee, H.S. The effects of trading-hour regulations on large stores in Korea. J. Distrib. Sci. 2017, 15, 5–14. [Google Scholar] [CrossRef]
  13. Cass, N.; Shove, E.; Urry, J. Social exclusion, mobility and access. Sociol. Rev. 2005, 53, 539–555. [Google Scholar] [CrossRef]
  14. Martens, K. Transport Justice: Designing Fair Transportation Systems; Routledge: London, UK, 2016. [Google Scholar]
  15. Allen, J.; Farber, S. Planning transport for social inclusion: An accessibility-activity participation approach. Transp. Res. Part D Transp. Environ. 2020, 78, 102212. [Google Scholar] [CrossRef]
  16. Casas, I. Social exclusion and the disabled: An accessibility approach. Prof. Geogr. 2007, 59, 463–477. [Google Scholar] [CrossRef]
  17. Preston, J.; Rajé, F. Accessibility, mobility and transport-related social exclusion. J. Transp. Geogr. 2007, 15, 151–160. [Google Scholar] [CrossRef]
  18. Church, A.; Frost, M.; Sullivan, K. Transport and social exclusion in London. Transp. Policy 2000, 7, 195–205. [Google Scholar] [CrossRef]
  19. Milewska-Osiecka, K. Budownictwo Mieszkaniowe Aglomeracji Łódzkiej (Zróżnicowanie I Struktura Przestrzenna Po Roku 1994); Wydawnictwo Uniwersytetu Łódzkiego: Łódź, Poland, 2010. [Google Scholar]
  20. Borowska-Stefańska, M.; Kowalski, M.; Wiśniewski, S. Wewnętrzna samochodowa dostępność transportowa Łodzi w świetle pomiarów z inteligentnych systemów transportowych. Pr. Geogr. 2019, 159, 7–27. [Google Scholar] [CrossRef]
  21. Wolaniuk, A. Rozmieszczenie i Struktura Instytucji Metropolitalnych Łodzi w 2000 Roku. In Atlas Miasta Łodzi; Liszewski, S., Ed.; Łódzkie Towarzystwo Naukowe: Łódź, Poland, 2002. [Google Scholar]
  22. Dzieciuchowicz, J. Handel w Przestrzeni Wielkomiejskiej. Przykład Łodzi; Wydawnictwo Uniwersytetu Łódzkiego: Łódź, Poland, 2013. [Google Scholar]
  23. Kowalski, M.; Wiśniewski, S. Centrum handlowe jako czynnik ruchotwórczy w transporcie samochodowym–Przykład Portu Łódź. Prz. Geogr. 2017, 89, 617–639. [Google Scholar] [CrossRef] [Green Version]
  24. Kłosiewicz-Górecka, U. Zmiany w Sferze Handlu w Polsce w Latach 2010–2015; IBRKiK: Warszawa, Poland, 2016. [Google Scholar]
  25. Wilk, W. Miasta zbyt małe na handel z dyskontem. Acta Univ. Lodz. Folia Geogr. Socio-Oecon. 2013, 15, 21–37. [Google Scholar]
  26. Khattak, A.J.; Rodriguez, D. Travel behavior in neo-traditional neighborhood developments: A case study in USA. Transp. Res. Part A Policy Pract. 2005, 39, 481–500. [Google Scholar] [CrossRef]
  27. Oeding, D. Verkehrsbelastung und Dimensionierung von Gehwegen und Anderen Anlagen des Fussgengerkehrs; Technische. Hochschule Braunschweig Inst. fur Stadtbauwesen, Dipl.-Ing., Strassenbau und Strassenverkehrstechnik: Braunschweig, Germany, 1963. [Google Scholar]
  28. Older, S.J. Movement of pedestrians on footways in shopping streets. Traffic Eng. Control 1968, 10, 160–163. [Google Scholar]
  29. Navin, F.P.; Wheeler, R.J. Pedestrian flow characteristics. Traffic Eng. Inst. Traffic Engr. 1969, 39, 31–36. [Google Scholar]
  30. Tanaboriboon, Y.; Hwa, S.S.; Chor, C.H. Pedestrian characteristics study in Singapore. J. Transp. Eng. 1986, 112, 229–235. [Google Scholar] [CrossRef]
  31. Fruin, J. Pedestrian Planning and Design; Metropolitan Association of Urban Design and Environmental Planners: New York, NY, USA, 1971; pp. 182–195. [Google Scholar]
  32. Yu, M.F. Level of Service Design Standards for Non-Motorized Transport in Shanghai, China. Master’s Thesis, Asian Institute of Technology, Bangkok, Thailand, 1993. [Google Scholar]
  33. Zębala, J.; Ciępka, P.; Reza, A. Pedestrian acceleration and speeds. Probl. Forensic Sci. 2012, 91, 227–234. [Google Scholar]
  34. Komar, Z.; Wołek, C. Inżynieria Ruchu Drogowego: Wybrane Zagadnienia; Wydawnictwo Politechniki Wrocławskiej: Wrocław, Poland, 1994. [Google Scholar]
  35. Laxman, K.K.; Rastogi, R.; Chandra, S. Pedestrian flow characteristics in mixed traffic conditions. J. Urban Plan. Dev. 2010, 136, 23–33. [Google Scholar] [CrossRef]
  36. Kowalski, M.; Wiśniewski, S. Transport accessibility and mobility: A forecast of changes in the face of planned development of the network of expressways and motorways in Poland. Eur. Spat. Res. Policy 2019, 26, 151–176. [Google Scholar] [CrossRef] [Green Version]
  37. Rosik, P.; Pomianowski, W.; Komornicki, T.; Goliszek, S.; Szejgiec-Kolenda, B.; Duma, P. Regional dispersion of potential accessibility quotient at the intra-European and intranational level. Core-periphery pattern, discontinuity belts and distance decay tornado effect. J. Transp. Geogr. 2020, 82, 102554. [Google Scholar] [CrossRef]
  38. Bateman, I.J.; Garrod, G.D.; Brainard, J.S.; Lovett, A.A. Measurement, valuation and estimation issues in the travel cost method: A geographical information systems approach. J. Agric. Econ. 1996, 47, 191–205. [Google Scholar] [CrossRef]
  39. Bateman, I.J.; Lovett, A.A.; Brainard, J.S. Developing a methodology for benefit transfers using geographical information systems: Modelling demand for woodland recreation. Reg. Stud. 1999, 33, 191–205. [Google Scholar] [CrossRef]
  40. Bar-Gera, H. Evaluation of a cellular phone-based system for measurements of traffic speeds and travel times: A case study from Israel. Transp. Res. Part C Emerg. Technol. 2007, 15, 380–391. [Google Scholar] [CrossRef]
  41. Li, Q.; Zhang, T.; Wang, H.; Zeng, Z. Dynamic accessibility mapping using floating car data: A network-constrained density estimation approach. J. Transp. Geogr. 2011, 19, 379–393. [Google Scholar] [CrossRef]
  42. Wiśniewski, S. Teoretyczna i rzeczywista wewnętrzna dostępność transportowa Łodzi. Pr. I Stud. Geogr. 2016, 61, 95–108. [Google Scholar]
  43. Borowska-Stefańska, M.; Kowalski, M.; Wiśniewski, S. The measurement of mobility-based accessibility-the impact of floods on trips of various length and motivation. ISPRS Int. J. Geo-Inf. 2019, 8, 534. [Google Scholar] [CrossRef] [Green Version]
  44. Akcelik, R. The highway capacity manual delay formula for signalized intersections. ITE J. 1988, 58, 23–27. [Google Scholar]
  45. Śleszyński, P. A synthetic index of the spatio-temporal accessibility of communes in Poland. Geogr. Pol. 2016, 89, 567–574. [Google Scholar] [CrossRef] [Green Version]
  46. Komornicki, T.; Śleszyński, P.; Rosik, P.; Pomianowski, W. Dostępność Przestrzenna Jako Przesłanka Kształtowania Polskiej Polityki Transportowej; KPZK PAN: Warszawa, Poland, 2009. [Google Scholar]
  47. Bartosiewicz, B.; Pielesiak, I. Powiązania transportowe w Łódzkim Obszarze Metropolitalnym. In Spójność Terytorialna Łódzkiego Obszaru Metropolitalnego; Bartosiewicz, B., Marszał, T., Pielesiak, I., Eds.; Stud. KPZK PAN: Warszawa, Poland, 2012; pp. 105–137. [Google Scholar]
  48. Kulkarni, P.; Khatri, A.; Banga, P.; Shah, K. Automatic number plate recognition (anpr) system for indian conditions. In Proceedings of the IEEE 2009 19th International Conference Radioelektronika, Bratislava, Slovakia, 22–23 April 2009; pp. 111–114. [Google Scholar]
  49. Patel, C.; Shah, D.; Patel, A. Automatic Number Plate Recognition System (ANPR): A Survey. Int. J. Comput. Appl. 2013, 69, 21–33. [Google Scholar] [CrossRef]
  50. Bodger, M.; Ellison, J.; Parmar, J. Developing journey time performance indicators for the urban environment using ANPR technology. Traffic Eng. Control 2005, 46, 319–321. [Google Scholar]
  51. Dix, M.; Firth, D. Transport for London Congestion Charging--Scheme Developments and the Use of New Technology. In Proceedings of the 12th World Congress on Intelligent Transport SystemsITS AmericaITS JapanERTICO, San Francisco, CA, USA, 6–10 November 2005. [Google Scholar]
  52. Robinson, A.; Van Niekerk, A. Uses of ANPR data in traffic management and transport modelling. In Proceedings of the 33rd Annual Southern African Transport Conference, Pretoria, South Africa, 7–10 July 2014; pp. 96–106. [Google Scholar]
  53. Slinn, M.; Matthews, P.; Guest, P. Traffic Engineering Design; CRC Press: Boca Raton, FL, USA, 2006. [Google Scholar]
  54. Wiśniewski, S.; Borowska-Stefańska, M.; Kowalski, M.; Sapińska, P. Vulnerability of the accessibility to grocery shopping in the event of flooding. Transp. Res. Part D Transp. Environ. 2020, 87, 102510. [Google Scholar] [CrossRef]
  55. Huff David, L. Defining and estimating a trade area. J. Mark. 1964, 28, 34–38. [Google Scholar] [CrossRef]
  56. Wee, C.H.; Pearce, M.R. Patronage behavior toward shopping areas: A proposed model based on Huff’s model of retail gravitation. Adv. Consum. Res. 1985, 12, 592–597. [Google Scholar]
  57. Luo, W.; Qi, Y. An enhanced two-step floating catchment area (E2SFCA) method for measuring spatial accessibility to primary care physicians. Health Place 2009, 15, 1100–1107. [Google Scholar] [CrossRef] [PubMed]
  58. Luo, W.; Whippo, T. Variable catchment sizes for the two-step floating catchment area (2SFCA) method. Health Place 2012, 18, 789–795. [Google Scholar] [CrossRef] [PubMed]
  59. Wan, N.; Zou, B.; Sternberg, T. A three-step floating catchment area method for analyzing spatial access to health services. Int. J. Geogr. Inf. Sci. 2012, 26, 1073–1089. [Google Scholar] [CrossRef]
  60. Scheiner, J. Interrelations between travel mode choice and trip distance: Trends in Germany 1976–2002. J. Transp. Geogr. 2010, 18, 75–84. [Google Scholar] [CrossRef]
  61. Uncles, M.D.; Kwok, S. Generalizing patterns of store-type patronage: An analysis across major Chinese cities. Int. Rev. Retail Distrib. Consum. Res. 2008, 18, 473–493. [Google Scholar] [CrossRef]
  62. Campo, K.; Gijsbrechts, E. Should retailers adjust their micro-marketing strategies to type of outlet? An application to location-based store space allocation in limited and full-service grocery stores. J. Retail. Consum. Serv. 2004, 11, 369–383. [Google Scholar] [CrossRef]
  63. Wood, S.; McCarthy, D. The UK food retail “race for space” and market saturation: A contemporary review. Int. Rev. Retail Distrib. Consum. Res. 2014, 24, 121–144. [Google Scholar] [CrossRef] [Green Version]
  64. Wood, S.; Reynolds, J. Leveraging locational insights within retail store development? Assessing the use of location planners’ knowledge in retail marketing. Geoforum 2012, 43, 1076–1087. [Google Scholar] [CrossRef]
  65. Rosik, P. Dostępność Lądowa Przestrzeni Polski w Wymiarze Europejskim; IGiPZ PAN: Warszawa, Poland, 2012; Volume 233. [Google Scholar]
  66. Bell, D.R.; Lattin, J.M. Shopping behavior and consumer preference for store price format: Why “large basket” shoppers prefer EDLP. Mark. Sci. 1998, 17, 66–88. [Google Scholar] [CrossRef] [Green Version]
  67. De Beule, M.; Van den Poel, D.; Van de Weghe, N. An extended Huff-model for robustly benchmarking and predicting retail network performance. Appl. Geogr. 2014, 46, 80–89. [Google Scholar] [CrossRef]
  68. Cyrek, P. Diversification of Customer Shopping Styles as a Result of Changes in the Weekly Work Schedules of Retail Outlets. Mark. Sci. Res. Organ. 2020, 36, 45–60. [Google Scholar] [CrossRef]
  69. Skuterud, M. The impact of Sunday shopping on employment and hours of work in the retail industry: Evidence from Canada. Eur. Econ. Rev. 2005, 49, 1953–1978. [Google Scholar] [CrossRef]
  70. Genakos, C.; Danchev, S. Evaluating the Impact of Sunday Trading Deregulation. CEP Discuss. Pap. 2015, 1336, 1–25. [Google Scholar]
  71. Freathy, P.; Sparks, L. Sunday working in the retail trade. Int. J. Retail Distrib. Manag. 1993, 7, 3–9. [Google Scholar] [CrossRef]
  72. Khan, H. Sunday is the new Saturday: Sunday trading reforms and its effects on family-run SMEs, employees and consumers. J. Small Bus. Enterp. Dev. 2018, 25, 960–984. [Google Scholar] [CrossRef] [Green Version]
  73. Rochmińska, A. Centra handlowe-miejsca spędzania czasu wolnego przez łodzian. Acta Univ. Lodz. Folia Geogr. Socio-Oecon. 2011, 11, 1–12. [Google Scholar]
  74. Grzesiuk, A. Sunday Trading Ban in Poland: Reflection after Three Years. Eur. Res. Stud. J. 2021, 24, 233–242. [Google Scholar] [CrossRef]
  75. Salvaneschi, L. Location, Location, Location: How to Select the Best Site for Your Business; Oasis Press/PSI Research: Portland, OR, USA, 1996; p. 280. [Google Scholar]
  76. Kenyon, S.; Lyons, G.; Rafferty, J. Transport and social exclusion: Investigating the possibility of promoting inclusion through virtual mobility. J. Transp. Geogr. 2002, 10, 207–219. [Google Scholar] [CrossRef] [Green Version]
  77. Kolb, K.H. Retail Inequality: Reframing the Food Desert Debate; University of California Press: Oakland, CA, USA, 2021. [Google Scholar]
  78. May, A.D. Urban Transport and Sustainability: The Key Challenges. Int. J. Sustain. Transp. 2013, 7, 170–185. [Google Scholar] [CrossRef]
Figure 1. Distribution of housing in Łódź in 2021 against the background of basic research units. Source: own elaboration on the basis of the Database of Topographic Objects.
Remotesensing 13 04804 g001
Figure 2. Spatial differentiation of road network (A) and population (B) density in Łódź in 2021 by basic research units. Source: own elaboration based on the Database of Topographic Objects, OpenStreetMap, and the Local Data Bank of the Polish Central Statistical Office.
Remotesensing 13 04804 g002
Figure 3. The quantitative structure (A) and the structure of retail space (B) by food store format in Łódź in 2020 (N = 558).
Remotesensing 13 04804 g003
Figure 4. The quantitative structure (A) and the structure of retail space (B) by types of grocery stores that were liquidated in Łódź during the analysed period, and the quantitative structure (C) and the structure of retail space (D) by types of grocery stores that were newly opened in Łódź during the analysed period.
Remotesensing 13 04804 g004
Figure 5. Density of food stores in Łódź arranged by basic research units for trading Sundays in the basal (A) and final (B) period.
Remotesensing 13 04804 g005
Figure 6. Density of food stores in Łódź arranged by basic research units for non-trading Sundays in the basal (A) and final (B) period.
Remotesensing 13 04804 g006
Figure 7. Spatial differentiation of temporal accessibility to grocery stores in Łódź when the shopping trip is made by car on Sundays without retail restrictions (A,B) and on non-trading Sundays (C,D) during the basal (A,C) and final research period (B,D).
Remotesensing 13 04804 g007
Figure 8. Spatial differentiation of temporal accessibility to food stores in Łódź for trips taken on foot on trading (A,B) and non-trading Sundays (C,D) in the basal (A,C) and final research period (B,D).
Remotesensing 13 04804 g008
Figure 9. Spatial differentiation of accessibility to closed (A,C) and open (B,D) grocery stores in Łódź in the analysed period when the shopping trip is made by private car (A,B) and on foot (C,D).
Remotesensing 13 04804 g009
Figure 10. Spatial differentiation of the load of grocery stores in Łódź on trading (A,C) and non-trading Sundays (B,D) in the basal (A,B) and final research period (C,D).
Remotesensing 13 04804 g010
Figure 11. Spatial differentiation in percentage of trips to grocery stores taken on foot in Łódź on trading (A) and non-trading Sundays (B) in the basal period.
Remotesensing 13 04804 g011
Figure 12. Spatial differentiation of changes in the percentage of trips to grocery stores taken on foot in Łódź on trading (A) and non-trading Sundays (B) in the final research period when compared to basal period.
Remotesensing 13 04804 g012
Figure 13. Spatial differentiation of retail space per person-hour of grocery shopping in Łódź on trading Sundays (A), and its relative changes for a non-trading Sunday (B) during the basal period.
Remotesensing 13 04804 g013
Figure 14. Spatial differentiation of relative changes in accessibility to retail space per person-hour of grocery shopping in Łódź on trading Sundays (A), and its relative changes on a non-trading Sunday (B) in the final period when compared to the basal period.
Remotesensing 13 04804 g014
Table 1. Statistical characteristics of food store replacement in Łódź for the analysed period.
Store TypeIncidence (%)Average Distance (m)Average Retail Space of Closed Store (m2)Average Retail Space of New Store (m2)
convenience10.4600.1222.0100.0
discount supermarket chain29.21002.0450.0888.6
hypermarket2.1122.91255.01400.0
general food store29.21485.3322.4150.0
specialised food store8.3553.01754.3100.0
supermarket20.8444.7418.5549.5
Table 2. Average speeds of pedestrians based on empirical calculations.
Type of Pedestrian TrafficSpeed (km/h)Source
mixed traffic5.394Oeding [27]
customers in the shopping street4.718Older [28]
Students5.856Navin and Wheeler [29]
mixed traffic4.434Tanaboriboon et al. [30]
people using public transport4.884Fruin, [31]
mixed traffic4.527Yu [32]
women (aged 21–60)3.96–5.76Zębala et al. [33]
men (aged 21–60)4.32–6.48
mixed traffic of able-bodied adults3.96–5.04Komar and Wołek [34]
mixed traffic of children and disabled adults2.16–3.24
Source: own elaboration and Laxman et al. [35].
Table 3. Travel times to a given type of food store, above which the probability of taking the trip drops by 50%.
Type of Grocery StorePrivate Car
(Minutes)
Walking (Minutes)
hypermarket3020
supermarket2015
discount supermarket chain1010
cash and carry3020
general food store1010
specialised food store3020
convenience store55
Source: own elaboration based on the results of the questionnaire survey.
Table 4. Travel times (minutes) for grocery shopping trips from areas of a specific density of food stores at which trip probability drops by half in the applied scenarios.
Research PeriodTrading SundaysNon-Trading Sundays
Number of Shops per 1 haPrivate CarWalkingNumber of Shops per 1 haPrivate CarWalking
transitional period>0.1821911>0.10896
0.182–0.13726150.108–0.081138
0.136–0.09133190.08–0.0541710
0.09–0.04640230.053–0.0272112
<0.0464727<0.0272514
all restrictions in force>0.21911>0.09496
0.2–0.1526150.094–0.071138
0.149–0.133190.07–0.0471710
0.099–0.0540230.046–0.0242112
<0.054727<0.0242514
Source: own elaboration on the basis of the questionnaire survey.
Table 5. Matrix of scenarios in the study.
Trading SundaysNon-Trading Sundays
Private CarWalkingPrivate CarWalking
basal period1234
final period5678
Table 6. Changes in temporal accessibility to grocery shops in Łódź due to complete closure or new opening of retail facilities during the analysed period.
Mode of TransportFaster by 0 to 5 minFaster by 5 to 10 minSlower by 0 to 5 minSlower by 5 to 10 minWithin 15 min to Closed ShopsWithin 15 min to Open Shops
car18.8%0.4%16.0%1.1%99.9%99.9%
waking6.6%1.5%5.2%1.9%52.2%52.9%
Table 7. Summary statistics of the load of types of grocery stores in Łódź for the analysed scenarios, factoring in the modal division.
Store TypeTrading SundayNon-Trading Sunday
Quantitative StructureDemand Pattern—Trip by Private CarDemand Pattern—Trip Taken on FootPercentage of Load Related to Trip by Private Car in Total LoadPercentage of Load Related to Trip on Foot in Total LoadQuantitative StructureDemand Pattern—Trip Taken by CarDemand Pattern—Trip Taken on FootPercentage of Load Related to Trip by Private Car in Total LoadPercentage of Load Related to Trip on Foot in Total Load
basal periodhypermarket2.3%4.1%4.8%1.4%3.1%0.0%0.0%0.0%0.0%0.0%
supermarket10.6%15.0%13.8%5.2%9.0%0.0%0.0%0.0%0.0%0.0%
discount supermarket chain14.6%14.2%13.9%4.9%9.1%0.0%0.0%0.0%0.0%0.0%
cash and carry0.8%1.4%1.2%0.5%0.8%0.0%0.0%0.0%0.0%0.0%
general food store38.4%36.4%32.0%12.6%20.9%0.0%0.0%0.0%0.0%0.0%
specialised food store5.0%9.3%13.1%3.2%8.6%0.0%0.0%0.0%0.0%0.0%
convenience store28.3%19.6%21.2%6.8%13.9%100.0%100.0%100.0%4.8%95.2%
total100.0%100.0%100.0%100.0%100.0%100.0%100.0%100.0%
Change (Percentage Points)
final periodhypermarket−0.1−0.20.0−0.10.00.00.00.00.00.0
supermarket0.61.01.20.40.80.00.00.00.00.0
discount supermarket chain1.01.01.00.40.70.00.00.00.00.0
cash and carry0.00.00.00.00.00.00.00.00.00.0
general food store0.60.60.70.20.40.00.00.00.00.0
specialised food store−0.8−1.5−2.3−0.5−1.50.00.00.00.00.0
convenience store−1.4−0.9−0.7−0.3−0.50.00.00.00.00.0
Table 8. The impact of Sunday trading on businesses, employees, and consumers.
Impact of Sunday Trading on BusinessesImpact of Sunday Trading on EmployeesImpact of Sunday Trading on Consumers
NegativePositiveNegativePositiveNegativePositive
- increased operational cost
- increased labour
cost/premium pay
- increased total sales
- spread fixed cost over more days
- utilise facilities effectively
- meeting consumer and market demand
- erosion of family values (no possibility to spend quality time with loved ones)
- obligatory Sunday work
- no extra benefits for working on Sundays (no bonuses, days off in lieu)
- less time for relaxation
- possibility to earn extra money
- possibility to be granted an extra day off
- generate employment opportunities
- negative impact on religious commitments
- negative impact on family bonds
- greater freedom of choice
- possibility for people who work long hours during the week to shop
- possibility to spend leisure time in shopping centres
Source: own elaboration based on: Freathy and Sparks [71], Genakos and Danchev [70], Khan [72] Kovács and Sikos [10], Rochmińska [73]; Skuterud [69].
Publisher’s Note: MDPI stays neutral with regard to jurisdictional claims in published maps and institutional affiliations.

