Abstract
It is important to protect forest and grassland ecosystems because they are ecologically rich and provide numerous ecosystem services. Upscaling monitoring from local to global scale is imperative in reaching this goal. The SDG Agenda does not include indicators that directly quantify ecosystem health. Remote sensing and Geographic Information Systems (GIS) can bridge the gap for large-scale ecosystem health assessment. We systematically reviewed field-based and remote-based measures of ecosystem health for forests and grasslands, identified the most important ones and provided an overview on remote sensing and GIS-based measures. We included 163 English language studies within terrestrial non-tropical biomes and used a pre-defined classification system to extract ecological stressors and attributes, collected corresponding indicators, measures, and proxy values. We found that the main ecological attributes of each ecosystem contribute differently in the literature, and that almost half of the examined studies used remote sensing to estimate indicators. The major stressor for forests was “climate change”, followed by “insect infestation”; for grasslands it was “grazing”, followed by “climate change”. “Biotic interactions, composition, and structure” was the most important ecological attribute for both ecosystems. “Fire disturbance” was the second most important for forests, while for grasslands it was “soil chemistry and structure”. Less than a fifth of studies used vegetation indices; NDVI was the most common. There are monitoring inconsistencies from the broad range of indicators and measures. Therefore, we recommend a standardized field, GIS, and remote sensing-based approach to monitor ecosystem health and integrity and facilitate land managers and policy-makers.
1. Introduction
Forests and grasslands, the two major global ecosystems, account for 40.7% of the world’s terrestrial surface [1] and provide a multitude of ecosystem services, such as erosion control, climate regulation, nutrient cycling, raw materials [2], forage provision, habitat, and recreation [3]. Only 40% of the remaining forests have high landscape level-integrity [4] and 49.25% of the global grasslands are degraded [5]. Ecosystem health assessments (EHA) facilitate monitoring and protection of the ecological conditions of these ecosystems. One of the ecosystem health definitions is “the degree to which the integrity of the soil and the ecological processes of ecosystems are sustained” [6]. Various entities have proposed and used attributes and indicators to conduct EHA (e.g., [7,8,9,10]). A guidance document for the conservation of biological and ecological resources, written by Unnasch et al. [11] is a tool for the U.S. National Parks. Hansen and Phillips [12] developed a Wildland Health Index for the Greater Yellowstone Ecosystem, designed to communicate ecological integrity measures to decision-makers. Other examples include field guides for rangeland health assessment by partnerships [13] or governmental entities [14].
To accurately assess ecosystem health, certain attributes and indicators need to be monitored. Key ecological attributes are determined as the most pivotal to the resource’s persistence and are easily integrated into a conceptual or quantitative model [11]. The identification of key ecological attributes relies on their connection to existing management challenges (i.e., extreme climatic events, disease outbreaks, and others), which may have natural and anthropogenic consequences. These are defined as ecological stressors or ecosystem threats. Indicators are measurable, and assess the actual status of the key ecological attribute and provide signals of environmental problems [7,11]. Overall, there is a complex set of biotic and abiotic attributes for evaluating the resilience of a terrestrial ecosystem [15]. Concisely, each indicator corresponds to an ecological attribute and is quantified by direct measures or proxies. For example, “crown closure” and “average inter-tree distance” are two ecological measures of forest, which correspond to the “fire area/intensity regime” indicator and belong to the “disturbance” attribute [16]. “Soil pH” and “conductivity” indicators correspond to the “soils chemistry and structure” attribute of the grassland ecosystem [17].
Remote sensing and Geographic Information System (GIS) applications in ecosystem health monitoring are becoming more universal, overshadowing the limitations of traditional methods [18,19,20] and being able to monitor different spatio-temporal scales in a repetitive and objective manner [21]. Hunt et al. [22] emphasized the possibility of filling the information gaps between range managers and remote sensing experts since remote sensing has the ability to detect noxious rangeland plant species, and to estimate rangeland productivity and other rangeland properties (e.g., topography, surface roughness, landscape and vegetation patterns, bare soil coverage). Ding et al. [18] established a conceptual framework for regional EHA based on the use of remote sensing and GIS (MODIS, land cover, elevation, roads, etc.,) and computed a weighted ecosystem health index. Zlinszky et al. [20] introduced the use of remote sensing and GIS for habitat quality monitoring, while Li et al. [23] reviewed the application of remote sensing in ecosystem health. Nevertheless, only ecological indicators related to biotic interactions, composition, and structure were under consideration while hydrology, disturbance, soil chemistry and structure, and fragmentation also need to be assessed to have a dimensional ecosystem health assessment. Lausch et al. [21,24,25] developed an informative review about remote sensing-derived characteristics of forest health. However, these need to be transferrable into ecosystem indicators for ecologists who are not into the field of remote sensing. A systematic review that summarizes the ecological attributes, indicators, and measures that have been used for EHA in the two major global ecosystems (grasslands and forests) as well as their connection to remote sensing and GIS has not been conducted to our knowledge. A recent systematic review on ecosystem health examined 30-year trends of related publications, summarized popular subjects, journals, authors, and studies [26]. However, it did not include an in-depth analysis on specific ecosystem attributes and indicators, it did not focus on remote sensing and GIS tools, neither was there a breakdown by ecosystem type. This review aims: (1) to identify the prevalent ecological attributes, indicators, and measures for forest and grassland ecosystem health assessment; (2) to analyze the main stressors and threats of the two ecosystems, and (3) to analyze ecological attributes and indicators derived from remote sensing and GIS data for EHA.
It is evident that the numerous approaches for EHA lead to difficulties in larger scale assessments on the condition of ecosystems. There is lack of consistent monitoring and continuous assessment of management actions through standardized ecosystem attributes and indicators. Although the current sustainable development goal (SDG) indicators monitor sustainability in a consistent way around the world, there is a gap on indicators related to ecosystem health [27]. There are some indicators related to the forest ecosystem (e.g., indicators 15.1.1 and 15.2.1), which do not directly look at its condition; and other major ecosystems, such as grasslands, shrublands, and wetlands are missing. Having a common framework for ecological integrity measurements and EHA could benefit environmental management boards, and become a shareable communication tool among related stakeholders.
2. Materials and Methods
We reviewed literature from the database of USearch (University of Saskatchewan’s library database) and its linkages to Google Scholar, due to its in-text searching abilities. We only looked at English studies without year or publication type restrictions. The USearch database is connected to around 485 other databases (e.g., Web of Science, Academic Search Complete, Scopus, ScienceDirect). We used keywords related to the ecosystems under study (i.e., grassland and forest), expressions that refer to ecosystem health, variations of words related to indices, terms that are connected to the assessment of ecosystem health, and words related to remote sensing and GIS. The keyword combinations that were used included ((“ecosystem” OR “ecolog*” OR “forest” OR “grassland” OR “rangeland” OR “range”) AND (“health” OR “integrity” OR “resilience” OR “sustainability”) AND/OR (“indicator*” OR “index” OR “assessment” OR “condition” OR “framework” OR “monitoring”) AND/OR (“remote sensing” OR “GIS”). We also included separate searches that combined “remote sensing” OR “GIS” with specific ecosystem attributes or threats (e.g., “grassland vegetation composition”, “structural diversity”, “forest fire”, “erosion”). We further examined reference lists from study reports that were used in this systematic review and added literature to our list of potential studies. During study selection, we conducted initial in-text screening and retained those that fell within one of the terrestrial non-tropical biomes, as defined by Olson et al. [28]. These include the: (1) Temperate Broadleaf and Mixed Forests; (2) Temperate Coniferous Forests; (3) Boreal Forests/Taiga; (4) Temperate Grasslands, Savannas, and Shrublands, (5) Montane Grasslands and Shrublands, and (6) Tundra. Studies that were eligible for data extraction had to include one or a combination of the following; ecological attributes, indicators, measures, and stressors or threats.
2.1. Metadata Extraction
For each extractable study, a metadata record including information related to the variables defined in Table 1 was kept. The publication type consisted of seven categories: (1) review; (2) theoretical article; (3) indicator description; (4) fieldbook/guide; (5) explicit methods; (6) direct application (case study), and (7) report. The terrestrial biomes were separated into Olson’s [28] categorization, and excluded the tropical and subtropical biomes, the Mediterranean biome, desert biome, and mangroves. The scale of each study belonged to: (1) local (city or municipality); (2) regional (more than one municipality and up to several States); (3) transnational (more than one country and less than a continent); (4) continental/global. The extent of the study area was defined in square kilometers, and the resolution of spatial data in meters. The latitude and longitude were collected from the study in decimal degrees or from the centroid of the study location. If any of the metadata attributes were missing, they became “not applicable/available—NA”.

Table 1.
Metadata attributes collected for each study of this systematic review.
2.2. Data Extraction
We extracted data related to a number of variables (Figure 1, Table 2). Every study was separated into the forest or grassland ecosystem, and if it had information on ecosystem stressors, attributes, and indicators, these were noted down. Each indicator can be quantitative or qualitative, and field-based or remote-based. Qualitative indicators do not involve detailed quantitative measurements and are usually determined by looking at a site (visual assessment). It is suggested that only experts in the field should use this technique [29]. Quantitative indicators involve specific measurements (e.g., counts, percentages, etc.,), and are therefore considered to be more precise [30]. Combinations of both methods are also used [31].
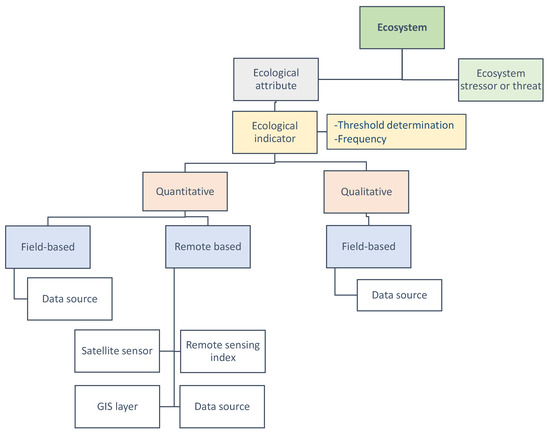
Figure 1.
Hierarchical structure of variables examined in this systematic review (GIS–Geographic Information System).
Table 2.
Extracted data variables collected for each study of this systematic review (RS–remote sensing, VI–vegetation index, GIS–Geographic Information System).
We further extracted information on the measurement frequency of the ecological indicators, the data source used, and on how different ecosystem health thresholds were defined. After the indicators are measured and assessed, they need to be compared to a specific threshold, which will define the ecosystem health condition of the indicator [32]. The threshold of ecosystem health is defined as “a boundary between ecological states of an ecosystem that, once crossed, is not easily reversible and results in the loss of capacity to produce commodities and satisfy values” [6]. This threshold can be defined in different ways; using the historic range of variation in the specific ecosystem as a reference [8,33], using a reference plant community which corresponds to how the ecosystem would look like in pristine conditions [29,34], or using the opinion of experts [35,36]. There are some limitations to using historical variation and reference plant communities in a changing climate, since the species that are found within each might change, however they might still provide essential ecosystem services that preserve its health [8]. Lastly, we collected information on the type of the remote sensing (RS) sensor, the RS name, vegetation indices (VIs) used in related studies, the GIS data, and any other type of additional data that were used. If specific measures or proxy values for an indicator were mentioned, these were also extracted.
To keep consistency in the data collection of ecological attributes and indicators, we chose an existing classification system [11] developed for the U.S. National Parks due to the detailed level in ecological attributes. We matched each studies’ information with this system. There are five Level-1 attributes, under which there are between two and nine Level-2 attribute classes for both forest and grassland (Table 3). A Level-3 was added when more information was provided.
Table 3.
Terrestrial ecosystem ecological attributes used for data extraction in this review (modified from Unnasch et al. [11]).
Although Unnasch’s study did not include specific indicators, it included characteristics that ecological indicators should have (Table A1). Based on these, we collected measurable indicators from the literature examined. The specific measurements for each of the indicators are the field measurements or proxy values, which might also have a Level 2 and 3, depending on the amount of detail provided. Moving further, we identified the ecological stressors and management concerns from every study. Unnasch et al. [11] identify direct ecosystem threats based on the International Union for Conservation of Nature (IUCN) and the Conservation Measures Partnership (CMP), and separate them into 11 general categories. After consultation with the Ministry of Parks, Culture and Sports (Saskatchewan, Canada), these were merged into broader ones (Table 4). The ecological stressors had three levels; Level 1 was more general, and Level 2 and 3 included several sub-stressors.
Table 4.
Ecosystem stressor classification system in this review (modified from Unnasch et al. [11]).
The summary measures used for the collected metadata and data attributes mainly included counts and percentages. We also used a world map for the spatial distribution of the studies that were reviewed and used collapsible tree diagrams to show the variety in ecological attributes, indicators, measures, and stressors for each ecosystem and for both. Duplicate entries were removed every time before the calculation of counts or percentages for every metadata and data attribute. For “GIS data”, we provide a summative table that includes common broader themes, and we describe the three main “Other data” categories. We used R for most analysis and last analysis was conducted manually.
Lastly, to assess the feasibility of integrating RS data in EHA for future regional and local studies, we developed tables to match each most important ecological indicator of each ecological attribute with a RS or GIS measure. We selected recent research studies (past 5–10 years.) from our established literature list. We matched the indicators with the most prominent stressors of each ecosystem, which were selected based on the top-down ranking of repeated occurrences. These were refined after consulting with the Saskatchewan Ministry of Parks, Culture and Sports (Canada). During the indicator selection process, a sensitivity assessment must be completed [37,38]. Once we identified the list of ecological indicators, we summarized how RS techniques can estimate these for the forest and grassland ecosystem (not all indicators can be estimated from RS).
2.3. Methodological Approach
The flow diagram of the final study selection is depicted in Figure 2. We found 176 potentially suitable studies. We reached 192 potential studies together with study reference searches (see “Potential_Studies.csv” openly available on Figshare https://doi.org/10.6084/m9.figshare.14850525, accessed on 14 August 2021). After accessing the full text of each study, we assessed them toward eligibility and excluded 29 studies that did either not contain the attributes of interest, fell outside of the predefined terrestrial biomes, or where not retrievable. Overall, 148 studies had extractable data (ecological attributes, indicators, measures, stressors), whereas 15 remaining studies included valuable theoretical information on the topic. The full list of studies together with the metadata and extracted data variables are openly available on Fighare https://doi.org/10.6084/m9.figshare.14850525 (accessed on 14 August 2021).
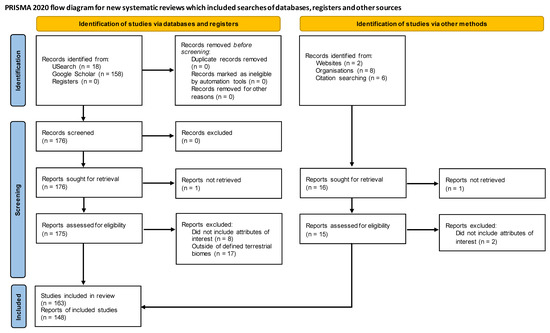
Figure 2.
Study selection flow diagram (re-use from Page et al. [39] with CC BY 4.0, found at http://prisma-statement.org/PRISMAStatement/FlowDiagram, accessed on 15 June 2021).
3. Results and Discussion
3.1. Metadata Results
Our studies span from 1949 to 2021 (Figure 3a), and have an increasing trend, with most belonging to 2018 (12 studies) and 2016 (11 studies). Most (71 studies) refer to direct applications of EHA, followed by theoretical articles (33 studies) and reviews (31 studies) that outline the specific methodology for completion of such (Figure 3b). There is an increase in studies from the year 2000 and after, with the addition of field book guides and indicator description studies and reports from 2002 and after (Figure S1). The large number of studies published in 2002 are potentially related to a conference from the Western Forestry Contractors’ Association (WFCA) that focused on “forest health and the silvicultural industry” in January 2003, British Columbia, Canada. Most studies form which we extracted data in 2002 were related to the forest ecosystem in Northern US and Canada. Seventeen studies come from books, governmental or provincial reports, and field books and field guides related to ecosystem health assessment. All others are journal papers published in 75 different journals. The top three most frequent journals include: (i) “Remote Sensing of Environment” (14 papers); (ii) “Remote Sensing” (10 papers), and (iii) “Forest Ecology and Management” (6 papers). Local studies represent the highest proportion (46.3%, with an increase after 2004, Figure S2), followed by regional studies (26.5%), while transnational studies are rare (5.4%) (Figure 3c).
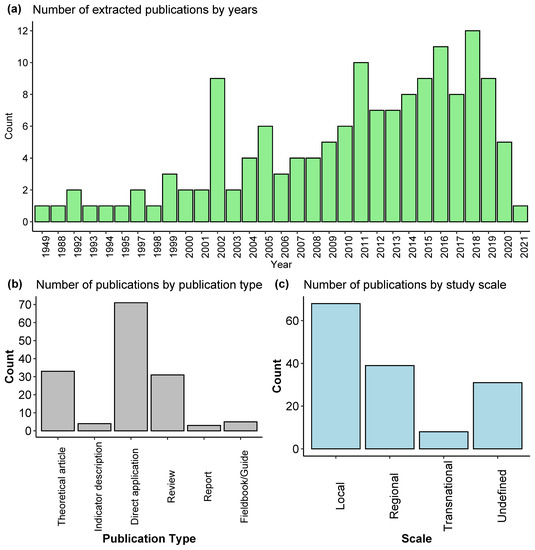
Figure 3.
Number of extracted publications by (a) year, (b) type, and (c) study scale.
The world map shows the location of each study (Figure 4). Although we made an effort to have broad spatial coverage, most studies fall in the North American Continent (50.3%), followed by Asia (19.0%), while only 11.6% of studies were located in Europe. There is an increase in studies from 2002 and after in North America, whereas slightly more studies appear in Asia after 2008, and in Europe after 2011 (Figure S3). Most of the terrestrial biomes studied are “Temperate grasslands, savannas, and shrublands” (33.5%) (Figure 5), with growing number of studies from 1995 and after (Figure S4). The lowest number of studies were in the “Montane Grasslands & Shrublands” (3.4%), and many studies did not explicitly define their biome (22.2%). There was one study that worked with multiple biomes.
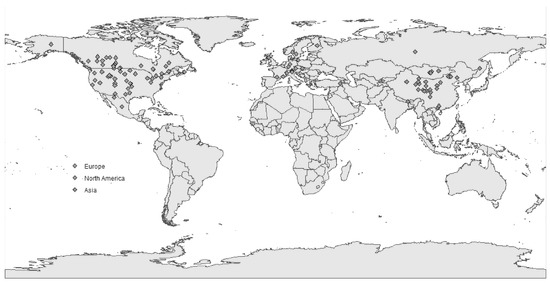
Figure 4.
Geographical distribution of case study locations by continent.
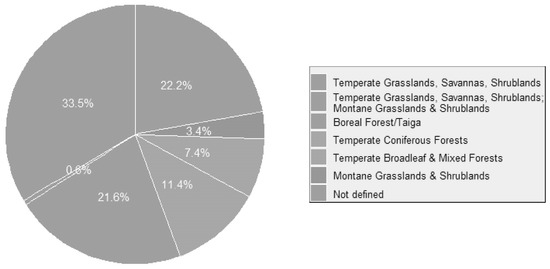
Figure 5.
Percentage of case studies by biome.
3.2. Extracted Data Results
The studies represented the forest and grassland ecosystem almost equally (36.3% and 37.7% respectively) (Figure 6b). Both forest and grassland studies show an increasing trend through time, however, forest studies already had higher representation in 2002, whereas the start of increasing grassland studies is only visible from 2004 and after (Figure S5). Some studies did not separate between ecosystems and included various combinations of the above, including shrubland (e.g., grassland and shrubland). Most indicators were quantitative (86.7%) with an increasing trend throughout the years, whereas fewer (4%) were qualitative (sporadic representation throughout the years) (Figure S6). The nature for 9.3% of indicators was not defined. The threshold determination method for the indicators used in each study is not clearly defined in most cases (89.7%). For the studies that report this information, historic range of variation prevails (4.1%) (Figure 6c). This method is used from 2005 and onward, while the reference plant community is used in both older (e.g., 1949) and newer studies (e.g., 2016). The use of expert opinion is more recent (starting from 2014). Furthermore, it is not always clear how often the proposed indicators have to be measured for an ecosystem health assessment. Some studies define a timespan, while others are vague and use “flexible” or “periodical”. In many cases (92.8%), this information is not defined (Figure 6a). When defined, a 1-year repeat-cycle is the most common approach (3.9% from 1997 to present).
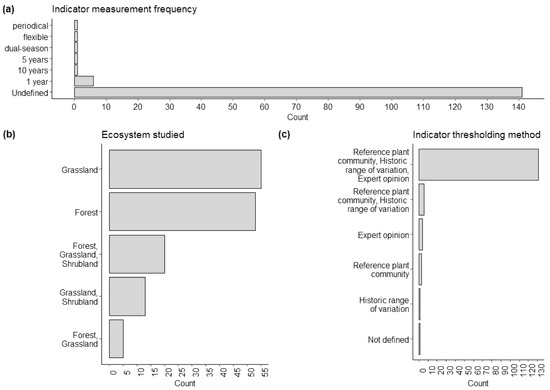
Figure 6.
Number of studies by (a) measurement frequency, (b) ecosystem, and (c) thresholding method.
3.2.1. Ecological/Management Stressor
We counted the Level 1 ecological stressors that existed in all studies (including both ecosystem types). The main stressors are related to “Disturbance regimes” (18.7%), followed by “Developments” (10.7%), while most studies (59.6%) did not define this (Figure 7a). “Disturbance regimes” appear to be a stressor from early on (since 1949) whereas “Developments” and “Pollution” occur from 1999 and after, followed by “Invasive & Other Problematic Species & Genes” (from 2004) and “Agriculture & Aquaculture” (since 2015) (Figure S7). For the forest and grassland ecosystem studies, these two main stressors remain the same, with “Disturbance regimes” taking up 19.1% and 19.2%, and “Developments” 12.2% and 9.2% respectively. However, “Pollution” is double more important than the remaining two stressors for the forest ecosystem (Figure S8a), and “Invasive & Other Problematic Species & Genes” is more than double more important than the other two remaining stressors for the grassland ecosystem (Figure S8b). The main Level 2 stressors related to “Disturbance” are “Climate change” (14.3%), followed by “Grazing” (13.5%) and “Fire regime” (7.5%). However, “Climate change” and “Fire regime” only appear in studies after the year 2000, whereas “Grazing” is considered a stressor in earlier studies (i.e., 1949, 1997) (Figure S9). Furthermore, “Insect infestation” and “Invasive species and noxious weeds” have similar importance (6.8%), however the last category only appears in studies after 2005 (Figure 7b, Figure S9). For the forest ecosystem, “Climate change” is also the most important Level 2 stressor (15.6%), while the second most important is “Insect infestation” (9.8%) (Figure S10a). On the other hand, for the grassland ecosystem, “Grazing” is the dominant stressor (21.8%) followed by “Climate change” (15.4%) (Figure S10b).
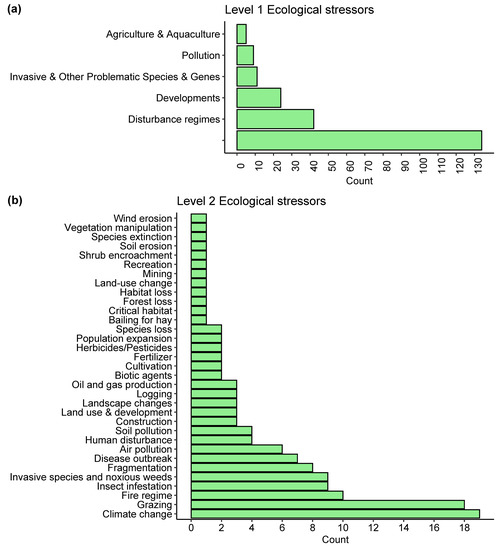
Figure 7.
Counts of (a) Level 1 ecological stressors for all examined studies, and (b) Level 2 ecological stressors for all studies where Level 1 stressors are defined in grassland and forest ecosystem.
All Level 1 stressor sub-categories are visible in the tree-diagram of Figure 8a. Most Level 2 categories are related to “Developments”, in which “Landscape changes” has most Level 3 stressors. “Disturbance regimes” have a high number of Level 2 stressor categories, in which “Climate change” has most Level 3 stressors for that category. By separating ecological stressors according to the ecosystem of study, we found almost equal amount of Level 2 stressors for the forest (23 in total) and grassland ecosystem (26 in total). For forests, “Developments” is the Level 1 ecological stressor that had the greatest number of Level 2 stressors, with “Disturbance regimes” ranking second (Figure 8b). The same stressors are the first and second most important for grasslands (Figure 8c). Unlike forests, in grasslands there are more stressors related to “Invasive & Other Problematic Species and Genes”.
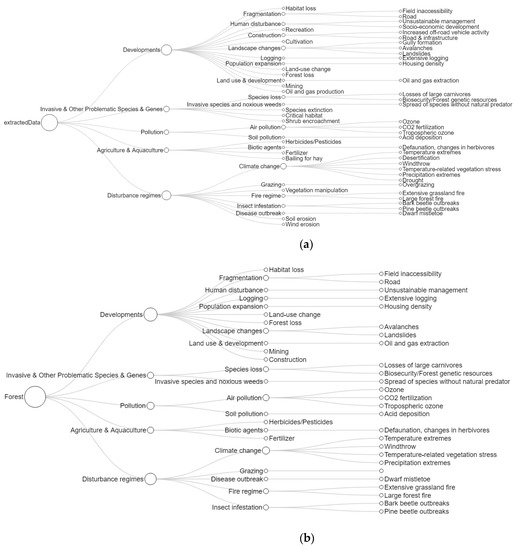

Figure 8.
Tree diagram of Level 1, 2, and 3 ecological stressors (a) for both forest and grassland ecosystem (b) for forest ecosystem, and (c) for grassland ecosystem.
In the regional context of North America, human development, including urban expansion, infrastructure, and land-use change, results in habitat fragmentation and losses of forest and grassland ecosystems. According to the World Bank statistics [40] the total population in North America has continuously increased over the past 70 years. Meanwhile, the Gross Domestic Product, Gross National Income, and Life Expectance at Birth have also increased. Beside the human factor, climate change has been a major ecological stressor. For example, this is a key factor that intensifies the consequences of wildfires. In the western United States, the number of large fires increased by nearly seven per year or yearly 355 km2 burned area increment during 1984–2011 [41]. In Canada, annual burned area significantly increased. However, fire characteristics (e.g., length of fire season, Forest Fire Weather Index) varied spatially because of the combined change in temperature and precipitation [33]. Another climate-change-derived problem is severely and frequently prolonged drought. Ecological studies were conducted locally in the U.S. forests [42] and grasslands [43] to monitor numerous ecological indicators and examine the negative impacts of drought to ecosystem health.
Sadly, climate change is a global concern that does not only occur in North America. In Asia, a desertification index was one of the two nature pressures which were inputs to the Pressure-State-Response model that assessed ecosystem health in an Inner Mongolia grassland in China [19]. Injured rubber trees from annual hurricanes in southern China have been assessed quantitatively with crown segmentation [44]. Results showed that these had decreased their leaf area and crown volume. Meanwhile, grassland resilience is negatively influenced from climate change, especially forage production. Noteworthy is the future prediction of changing land-use and climate on ecosystem services of mountain grasslands in Austria [45]. In addition to the stressors from human development, human activities also facilitated plant invasion through international trade and travel [46]. Moreover, ecological degradation (e.g., soil erosion and soil carbon sink alteration) is a consequence of unsuitable grazing systems in the long term. This problem is also challenging in Asian grasslands [47].
Sharing agreements together with annual discussion among related stakeholders (i.e., governments, local authorities, researchers, and ranchers) could guide toward better grazing strategies that not only maximize grazing outputs but also maintain healthy grasslands. A Grassland Management Plan was developed for Saskatchewan Landing Provincial Park for 2020–2030 by the Saskatchewan Ministry of Parks, Culture and Sport [48]. This is an example in which impacts of current grazing practices were analyzed before recommendations on grazing management strategy and optimum cattle carrying capacity were made.
3.2.2. Ecological Attributes and Ecological Indicators
To get a better overview of the ecological attributes and ecological indicators, we developed a tree diagram for all ecosystems and for each ecosystem separately (i.e., forest, grassland). Due to the numerous ecological indicators, we only analyze ecological attributes here. The Level 1 ecological attribute that has most Level 2 attributes for all ecosystems is the one that corresponds to “Biotic Interactions, Composition, Structure”, in which the Level 2 ecological attribute “Vegetation stratification & structure within patches” has the largest variety of ecological indicators. This shows that there is a wide range of measures for this specific attribute. The tree diagrams give an overview of the breath of attributes and indicators for each ecosystem. However, they are difficult to read due to the large amount of information and do not show the actual percentage that each attribute has over the examined studies. This is shown in Figure 9. “Biotic Interactions, Composition, Structure” has the highest number of Level 2 attributes and accounts for most concerns among the forest examined attributes (65.3%) (Figure 9a). This is followed by “Disturbance” (16.3%). There is a large gap between the highest-ranking Level 1 attribute and its followers.
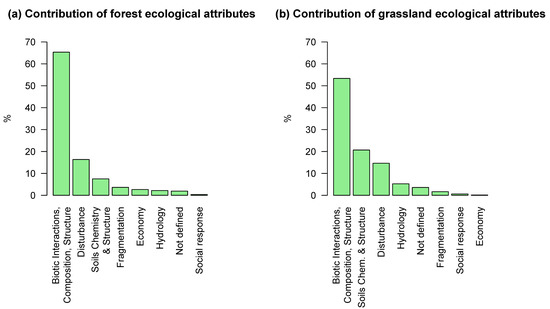
Figure 9.
Percentages of Level 1 ecological attributes per (a) forest ecosystem and (b) grassland ecosystem for all examined studies.
“Biotic Interactions, Composition, Structure”, also has the highest number of Level 2 attributes and contributes the most in the grassland studies (53.3%, Figure 9b). This Level 1 ecological attribute is used in transnational studies [21,25], regional studies [46,49,50], and local studies [51,52,53]. “Vegetation stratification & structure within patches” has the largest group of ecological indicators, followed by “Keystone species and/or functional groups”. The second most common Level 1 attribute for the grassland ecosystem is “Soil Chemistry & Structure”, which contributes more than double compared to forests (20.7%, Figure 9b). For the grassland system, the number of indicators for each attribute is lower, which shows higher consistency among studies. The use of indicators related to the “Biotic Interactions, Composition, Structure” attribute increases from 2001 and onward, even though it was used in the oldest study (in 1949) (Figure S11a). The following four ecological attributes only start being used more frequently after 2013 (Figure S11b–e).
The three prevalent ecological attributes for both forest and grassland ecosystems are: “Biotic Interactions, Composition, Structure”, “Soils Chemistry & Structure”, and “Disturbance” (Figure 9). For the grassland ecosystem, “Soil Chemistry & Structure” contributes more, whereas for forests, it is “Disturbance”. This agrees with current knowledge since soil stability is an important attribute of the grassland ecosystem that prevents soil exposure and erosion [54], maintains the potential productivity of rangelands, protects the soil, and supports stable long-term biomass production [13]. Soil degradation also affects nutrient cycling, seed germinations, seedling development, and many other ecological processes that are crucial parts of a grassland [6]. The prevalence of the “Disturbance” attribute in the forest ecosystem is mainly related to the larger number of indicators under “Fire area/intensity regime” (64 in number), compared to the grassland ecosystem (22 in number). It is known that fire disturbance is a management challenge due to soil degradation, species and habitat loss, and many other factors; however, it is also an important natural process for forest regeneration [55].
The contribution of each ecological attribute in the literature differs by ecosystem, which suggests that different weights should be applied to each ecosystem when developing an overall health score [56,57]. This approach is more difficult to take when it comes to ecosystem health indicators and measures. We extracted 856 different Level 1 indicators, for which only “aboveground biomass”, “soil moisture” and “species richness” were used ten times or more (17, 10, and 10 times respectively). Therefore, their selection should be based on specific criteria (Table A1). Similarly, we extracted 493 different Level 1 indicator measures, from which “aboveground biomass”, “bare ground cover”, “Net Primary Productivity”, and “soil moisture” were used nine times or more (13 times, and the rest 9 respectively).
For each ecosystem, we found alignment between the first five most contributing stressors and the main five ecological attributes detected from the literature. The order of this alignment is also noteworthy. The “Fragmentation” attribute has the fourth and fifth place for forest and grassland (Figure 9), while the related “Development” and “Agricultural” Level 1 stressors have second and fourth place for both ecosystems (Figure 7a). This is in line with the notion that ecosystem stressors and ecological attributes are connected [25,58,59]. The development of a standardized system that connects stressors for each ecosystem with specific indicators and measures would overcome the large inconsistencies that are currently observed for these variables. Adoption of such approaches by global monitoring initiatives, such as through the SDGs would be beneficial. Ecosystem managers would then be able to follow a straightforward approach after identifying the major stressors for their management area, and their documentation would aid in tracking global progress. Priority should be given to indicators that are used by other regional or national monitoring programs so that it is possible to combine data over multiple programs. The current review has tried to amalgamate such studies, which are representative of the Canadian ecosystems, and provides the first step toward regional/national EHA standardization. After selecting ecological indicators for each ecological attribute, one could develop a composite ecosystem health index to assess overall status and trends and engage with policy-makers and the public [32]. For larger scale studies that cover a whole province or nation, an integrated index is in many cases the only solution to make the large amount of data more digestible and interpretable by stakeholders.
3.2.3. Remote Sensing (RS) and GIS Attributes
More than half of our selected studies use RS to assess ecosystem health (53.1%). Almost half of these use long-term multispectral data (48.8%), such as Landsat (18.1%) and MODIS (12.6%) derived images (Figure 10a,b); hyperspectral sensors are also common (16.5%), followed by UAV and aerial imagery (13.4%), whereas LiDAR (11.0%) and Radar (10.2%) data are less commonly used (Figure 10a). In the 1990s only UAV and aerial imagery together with Radar sensors were used for EHA studies (Figure S12d,e), while multispectral, hyperspectral, and LiDAR data started being used from the years 2000, 2005, and 2009 respectively (Figure S12a–c). Some studies did not explicitly define the exact hyperspectral or aerial sensor they used. In regional studies, multispectral data are widely used, meanwhile hyperspectral data, aerial photos, and LiDAR are more frequently used in local studies. When looking at each ecosystem separately, LiDAR data is the second most frequently used RS type for forests (17.35) and hyperspectral data for grasslands (22.2%) after multispectral data (45.3% and 52.8% respectively) (Table A2). This is also reflected in the top ten RS sensors used in each ecosystem, with Landsat and MODIS being the most frequently used for both ecosystems. However, these only appear from 2001 and after (Figure S13a,b).
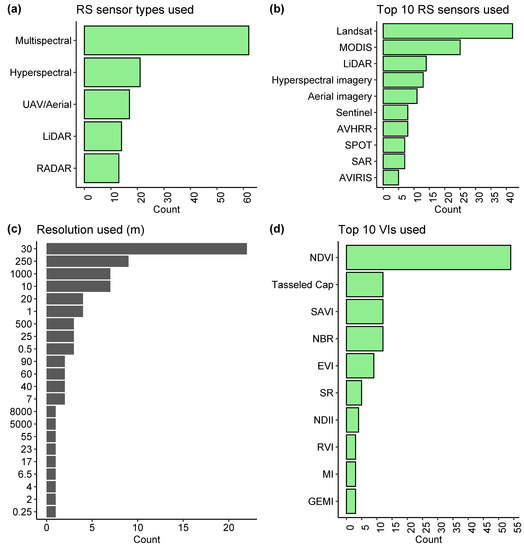
Figure 10.
Examined studies by (a) remote sensor (RS) type, (b) top ten RS sensors, (c) spatial resolution, and (d) top 10 vegetation indices (VIs) used to assess indicators of ecosystem health (studies that did not use RS sensors are excluded here).
Most studies (22 studies)) used a 30 m spatial resolution, which is connected to the long-term availability of the Landsat sensor (Figure 10c). The second and third most used spatial resolutions are 250 m (9 studies) and 1 km (7 studies), which are connected to the MODIS sensor. Lastly, the 10 m resolution, connected to Sentinel-2, has equal representation as the 1 km category (7 studies). This is likely to increase in the following years, since the Sentinel-2 sensor provides one of the highest spatial resolution products that are freely available for use from 2015 and onwards (which coincides with the Sentinel studies that span from 2016 and after, Figure S13c). The second most important resolution for forest ecosystem studies, after 30 m is 1000 m (17.4%), whereas for grasslands it is 250 m (12%) (Table A2). For both ecosystems, 10 m resolution is the third most frequent; however, it is more than two times more common in the grassland ecosystem compared to the forest ecosystem (10% vs. 3.6%). Overall, the four most common resolutions used all occurrences in studies that take place after the year 2000.
Vegetation indices (VIs), known as the second indicators of EHA [54] can be promising indices that apply the advancement of long-term and consistent data series for EHA. From the studies examined, only 17.7% of ecosystem health indicators were assessed with a VI. In these studies, there are 70 different remote sensing indices used. This shows a wide variety of indices, some of which might be more specific to certain indicators (e.g., burned area related BR, NBR). However, most indices are used only once. We therefore grouped the modified and original versions of VIs together (e.g., GNDVI and NDVI, GSAVI and SAVI) and present the ten most frequently used. The most common RS index is NDVI (Normalized Difference Vegetation Index) (31.0%), which outnumbers by far other RS indices, such as Tasseled Cap, NBR, and SAVI (each 6.9%), and the Enhanced Vegetation Index (EVI) (5.2%) (Figure 10d). These five indices are used from the year 2000 and after, with NDVI showing an increasing trend, while the other four indices are used sporadically throughout the years (Figure S14). For the forest ecosystem we see a slightly higher representation of the NBR and Tasseled Cap index (12.1% vs. 6.9% and 9.1 vs. 6.9% respectively), whereas the SAVI and EVI indices are more common for the grassland ecosystem (6.9% vs. 4% and 5.2% vs. 4%) (Table A2). We found a significant number of newly developed indices, either as modified versions of traditional VIs or recently invented ones to measure the specific ecological indicators. However, application of locally specified VIs to other areas is not practiced.
Almost half of the studies used some form of RS or GIS data for specific ecosystem health indicators. The largest part of these studies used long-term multispectral data at 30 m resolution. Only 13.4% of the extracted indicators were assessed with VIs, the majority of which was the NDVI index. The same patterns were found when looking at each ecosystem separately. However, the higher use of the NBR index in forest studies can be explained by the higher number of studies that look at “Fire area/intensity regime”, whereas the larger representation of the SAVI index in grassland studies could be attributed to its suitability to low density vegetation with soil exposure [60]. This lower vegetation density could be caused by either arid climate [61] or higher disturbance. Overall prevalence of the NDVI index is expected, since it is commonly used in a variety of study scales (i.e., transnational, regional, local) to represent green vegetation amount, net primary productivity in grasslands [51,62] and is also known as an indicator of forest degradation [50]. Based on a combination of MODIS NDVI time series and agricultural statistics, a MODIS-based mowing frequency index was introduced to examine the spatial patterns of grassland management intensity across 27 European countries [63]. MODIS NDVI was used to quantify the impacts of disease outbreak in Rio Grande National Forest and Southern New England, United States [64]. Moreover, other researchers chose the same remote sensing index to evaluate grassland ecosystem health in China [47] or to measure gross primary productivity, an ecological indicator of the Southern Alberta prairie [65]. Since the coarse spatial resolution of the MODIS sensor is not prefered in local studies, aerial photo/UAV NDVI can be used [66]. NDVI remains promising for future research as lower levels of this index could indicate unhealthy vegetation, lower biomass, or increases in bare ground.
Apart from using remote sensors and indices, several types of GIS data are also used. Most of these can be derived from RS, however, since these are used directly without the use of RS, we classified them in a separate category (Table 5). GIS data related to roads and fences have been used to assess the “Fragmentation” attribute [67,68]. Other GIS layers, such as those related to grazing units or GPS collars have been used for “Infestation and mass grazing” [69,70], while location occurrences of species and land use can be used to assess “Keystone species and/or functional types” [71]. Land cover and land use layers have been used under the “Disturbance” attribute, facilitating, for instance, change detection [18].
Table 5.
Common GIS datasets used in ecosystem health studies.
There are three “Other data” groups that have been used in ecosystem health studies. The most common group is meteorological data with regional or local temperature, precipitation, humidity, and radiation on different time bases (e.g., monthly, daily). A number of socioeconomic indicators are used to assess their effects on ecosystem health. Examples include, gross domestic product (GDP), population, level of urbanization, and food production. When agriculture and aquaculture is one of stressors to ecosystem health, researchers are concerned about the increase of agricultural and aquacultural activities and gather statistics from local administrations in this field (e.g., agricultural yield, irrigation areas, fertilizer amount).
3.3. Additional Analysis Results
Table 6, Table A3, Table A4 and Table A5 summarize how specific satellite sensors and their variables can be used to monitor ecological indicators under the “Biotic Interactions, Composition, and Structure”, “Soil Chemistry and Structure”, “Disturbance”, “Fragmentation”, and “Hydrology” attributes. RS makes it possible to estimate biophysical variables as well as energy fluxes and nutrient cycling [79]. In transnational and regional scales, the medium spatial resolution and long time series of Landsat imagery are beneficial for ecosystem health studies in grassland and forest. Finer spatial resolution satellite sensors (e.g., Sentinel-2) are more frequently used if there is no need for time series data. Costly satellite sensors are recommended for regional and local studies. The RS approach lessens the burden of fieldwork, although some is needed for training and validation. Consequently, the use of RS becomes a faster and cost-effective alternative, its methods are strictly quantitative and prevent potential biases from qualitative assessments and its overall approach is less destructive to the ecosystem [54].
Table 6.
Satellite sensors and derived indices to estimate ecological indicators of the “Biotic Interactions, Composition, and Structure” attribute in grassland and forest ecosystem.
The benefits of RS make its use for EHA an attractive method for key stakeholders, such as land managers and policymakers. With this review, we demonstrated the use of RS in EHA with the hope to inspire and encourage further research into this direction. Potential limitations are the spatial mismatch that can exist between the field-based plot data and the scale of the image pixel [54]. Nevertheless, not all indicators can be measured with RS (even less with freely available data), since they are limited by their resolution (spatial, spectral, temporal). This is especially true for fine-scale assessments (e.g., species-specific cover, soil chemistry, thickness of litter layer). These could be assessed from organized field-visits or crowdsourcing tools. Unfortunately, there is no detailed field book or guide that discusses which RS approaches should be used for which ecosystem indicators. This makes the implementation and consistency in the use of RS tools among regions a more complicated task. An initial attempt was made in this section. Future research through partnerships should be conducted toward these goals and stakeholders’ opinions should be used toward the determination of appropriate ecosystem health indicators and measures. This would ensure their successful monitoring, and would spur ongoing management adjustments. The role of stakeholders is key toward determining the ecosystem stressors based upon which each EHA is built.
3.4. Limitations
Although our systematic review was conducted with a broad variety of topic-related keywords in an extensive database, some relevant literature might not have been acquired. For instance, studies on specific forest or grassland types for ecosystem health assessment without the term “grassland” or “forest” could have been missed. Moreover, a longer timespan for searches (>4 months) might have resulted in more studies. Non-native English publications were not used, potentially leading to uncertainty in the representativeness of our final literature library, and to a bias in geographic location of studies (e.g., fewer studies in northern and southeast Asia) (Figure 4). Future studies could include more detailed keyword searches and studies in other languages. By implementing a common classification system for the ecological attributes (Table 3) and stressors (Table 4), there could be uncertainty in the classification. There might be variables from studies that do not entirely correspond to one of the established classes or each reviewer might interpret and classify a variable differently, potentially creating confusion. Future studies should try to quantify such uncertainties and biases to get a more reliable result on the contributions of the variables extracted in this review.
4. Conclusions
This systematic review shows that every ecosystem is characterized by different ecological attributes and a broad variety of indicators and measures, exposing inconsistencies in current EHA approaches. Nevertheless, each ecosystem stressor is well aligned with its main ecological attributes. The major stressor for the forest ecosystem is “climate change”, followed by “insect infestation”, while for grasslands it is “grazing”, followed by “climate change”. “Biotic interactions, composition, and structure” is the most important ecological attribute for both ecosystems. “Fire disturbance” is the second most important for forests, while for grasslands it is “Soil chemistry and structure”. Moreover, almost half of the examined studies used RS or GIS data for the estimation of indicators, a fact that encourages their future use in a more systematic way. Less than a fifth of studies used vegetation indices, from which NDVI was the most common. The development of a standardized EHA system among ecosystem types and protocols for use of earth observation and GIS data in EHA are major future suggestions. Nevertheless, not all indicators can be accurately estimated from RS and GIS data due to resolution constraints, and fieldwork remains important for validation purposes.
Supplementary Materials
The following are available online at https://www.mdpi.com/article/10.3390/rs13163262/s1. Figure S1: Extracted studies by year and publication type, (a) direct application, (b) fieldbook/guide, (c) indicator description, (d) report, (e) review, (f) theoretical article. Figure S2: Extracted studies by year and study scale, (a) local, (b) regional, (c) transnational. Figure S3: Extracted studies by year and continent, (a) Asia, (b) Europe, (c) North America. Figure S4: Extracted studies by year and top four biome types, (a) boreal forest/taiga, (b) temperate coniferous forests, (c) temperate grasslands, savannas, shrublands, (d) temperate broadleaf and mixed forests. Figure S5: Extracted studies by year and ecosystem, (a) forest, (b) grassland, (c) forest and grassland, (d) grassland and shrubland, (e) forest and grassland and shrubland. Figure S6: Extracted studies by year and indicator extraction method, (a) quantitative, (b) qualitative. Figure S7: Extracted studies by year and top five Level 1 ecological stressors, (a) disturbance regimes, (b) developments, (c) invasive and other problematic species and genes, (d) pollution, (e) agriculture and aquaculture. Figure S8: Number of extracted studies by Level 1 ecological stressors per ecosystem, (a) forest, (b) grassland. Figure S9: Extracted studies by year and top five Level 2 ecological stressors, (a) climate change, (b) grazing, (c) fire regime, (d) insect infestation, (e) invasive species and noxious weeds. Figure S10: Number of extracted studies by level 2 ecological stressors per ecosystem, (a) forest, (b) grassland. Figure S11: Extracted studies by year and top five most important Level 1 ecological attributes, (a) biotic interactions, composition, structure, (b) disturbance, (c) soils chemistry and structure, (d) hydrology, (e) fragmentation. Figure S12: Extracted studies by year and remote sensing type, (a) hyperspectral, (b) LiDAR, (c) multispectral, (d) UAV/Aerial, (e) Radar. Figure S13: Extracted studies by year and top three remote sensing sensors, (a) Landsat, (b) MODIS, (c) Sentinel. Figure S14: Extracted studies by year and top five vegetation indices, (a) NDVI, (b) Tasseled Cap, (c) SAVI, (d) NBR, (e) EVI.
Author Contributions
Conceptualization, T.C.; methodology, I.S., T.D.; formal analysis, T.D., I.S.; investigation, T.D., I.S.; writing—original draft preparation, I.S.; writing—review and editing, T.D., T.C., X.G.; visualization, T.D., I.S.; supervision, T.C., X.G., I.S.; project administration, I.S.; funding acquisition, T.C. All authors have read and agreed to the published version of the manuscript.
Funding
This research was funded by the Ministry of Parks, Culture and Sports, Government of Saskatchewan and the APC was funded by The Natural Sciences and Engineering Research Council of Canada (NSERC) under project number RFP# 2020LPU-PED and grant number RGPIN-201603960 respectively.
Institutional Review Board Statement
Not applicable.
Informed Consent Statement
Not applicable.
Data Availability Statement
The dataset analyzed and generated during this study are openly available in FigShare at https://doi.org/10.6084/m9.figshare.14850525 (accessed on 14 August 2021).
Acknowledgments
The authors would like to acknowledge Eric Lamb for providing the methodology for this systematic review based on his Plant Science 833 course at the University of Saskatchewan. The authors also thank the University of Saskatchewan for providing workspace materials and library usage. Lastly, the authors are grateful to the three anonymous reviewers for their guidance in improving the initial version of this manuscript.
Conflicts of Interest
Thuan Chu, Senior Landscape Ecologist at the Ministry of Parks, Culture and Sports, Saskatchewan is one of the authors and funders of this study. His role included contribution to the conceptualization, review, and editing of manuscript.
Appendix A
Table A1.
Criteria for ecosystem health indicator selection (in bold are the criteria that are covered by using remote sensing data).
Table A1.
Criteria for ecosystem health indicator selection (in bold are the criteria that are covered by using remote sensing data).
| Criterion | Details | Source |
|---|---|---|
| Assesses integrative ecosystem health | Vigor, organization, resilience | [65] |
| Describes the status of an ecosystem | Decline of nutrient pools, primary productivity, species diversity | [25,65,66] |
| Reflects function and structure of an ecosystem | Species composition, distribution, abundance, tolerance, adaptability, efficiency across different scales | [11,65,66,67,68] |
| Represents sustainability of human-coupled ecosystems | Biophysical and social-economic ecosystem services | [11,25,65,68] |
| Representative of the ecosystem and interpretable | Sensitive to stresses, strong scientific basis, quantifiable, expected responses to stress, corresponds to broad geographic extends, historical record available | [11,12,16,25,26,65,66,67,68] |
| Related to management goals | Easy to apply, cost-effective, integrative (summarizing many indicators), nondestructive to the ecosystem, potential for measurement continuity, not redundant, timely, retrospective, used by other monitoring programs, comprehensible, applicable to policy and management goals | [16,25,26,66,67,68] |
Table A2.
Percentage contributions of examined studies per ecosystem type by remote sensing (RS) type, top ten RS sensors, top five resolutions, and top five vegetation indices (VIs).
Table A2.
Percentage contributions of examined studies per ecosystem type by remote sensing (RS) type, top ten RS sensors, top five resolutions, and top five vegetation indices (VIs).
| Ecosystem Type | Forest | Grassland | ||
|---|---|---|---|---|
| RS type | ||||
| Multispectral | 45.3% | Multispectral | 52.8% | |
| LiDAR | 17.3% | Hyperspectral | 22.2% | |
| Hyperspectral | 13.3% | UAV/Aerial | 12.5% | |
| UAV/Aerial | 13.3% | Radar | 6.9% | |
| Radar | 10.7% | LiDAR | 5.6% | |
| Top 10 RS sensors | ||||
| Landsat | 20.9% | Landsat | 23.1% | |
| MODIS | 10.1% | MODIS | 17.9% | |
| LiDAR | 10.1% | Hyperspectral | 12.6% | |
| Aerial | 6.2% | Aerial | 5.3% | |
| AVHRR | 5.4% | AVHRR | 5.3% | |
| SPOT | 4.7% | Sentinel | 5.3% | |
| SAR | 3.9% | AVIRIS | 4.2% | |
| AVIRIS | 3.1% | LiDAR | 4.2% | |
| Hyperspectral | 3.1% | Digital Multispectral Imagery | 2.1% | |
| EnMAP | 2.30% | Hyperion | 2.1% | |
| Top 5 resolutions (m) | ||||
| 30 | 21.7% | 30 | 30.0% | |
| 1000 | 17.4% | 250 | 12.0% | |
| 10 | 3.6% | 10 | 10.0% | |
| 20 | 3.6% | 1000 | 3.6% | |
| 1 | 3.6% | 25 | 3.6% | |
| Top 10 VIs | ||||
| NDVI | 28.3% | NDVI | 31.0% | |
| NBR | 12.1% | NBR | 6.9% | |
| Tasseled Cap | 9.1% | SAVI | 6.9% | |
| EVI | 4.0% | Tasseled Cap | 6.9% | |
| SAVI | 4.0% | EVI | 5.2% | |
Table A3.
Satellite sensors and derived indices to estimate ecological indicators of the “Soil Chemistry and Structure” attribute in grassland and forest ecosystems.
Table A3.
Satellite sensors and derived indices to estimate ecological indicators of the “Soil Chemistry and Structure” attribute in grassland and forest ecosystems.
| Satellite Sensors | Independent Variable | Derived Ecosystem Health Indicator | Ecosystem Used | Field Measurements | Modeling Method | Example Study |
|---|---|---|---|---|---|---|
| TerraSAR-X COSMO-SkyMed SPOT Landsat | NDVI, LAI, FAPAR, FCOVER | Soil moisture content | Grassland | Soil moisture, soil roughness, LAI, FAPAR, FCOVER, biomass, vegetation water content, vegetation height, | Multi-layer perceptron neutral networks | El Hajj et al. [88] |
| LiDAR | DTW | Forest | Soil bulk density and chemicals, gravimetric water content, soil pH | Linear mixed-effect model | Sewell et al. [89] | |
| AirSAR AVIRIS Landsat | LTCG, Radar Cvv, Lhv, NDVI, EVI, PRI | Bare ground cover | Grassland | Canopy percentages | Break points and linear interpolation | Huang et al. [75] |
| RADAR ERS-1 JERS Landsat | Forest | Training sites’ GPS location for vegetation classification | Maximum likelihood classification | Ranson et al. [90] | ||
| ASTER | SAVI | Variation of erosion | Grassland | Vegetation height, vegetation cover, surface roughness length | Supervised maximum-likelihood classification | Reiche et al. [91] |
NDVI: Normalized Difference Vegetation Index, LAI: Leaf Area Index, FAPAR: Fraction of Absorbed Photosynthetically Active Radiation, FCOVER: Fraction Vegetation Cover, DTW: Depth-to-water Index, LTCG: Landsat Tasseled Cap Greenness, PRI: Photochemical Reflectance Index, SAVI: Soil Adjusted Vegetation Index.
Table A4.
Satellite sensors and derived indices to estimate ecological indicators of the “Disturbance” attribute in grassland and forest ecosystems.
Table A4.
Satellite sensors and derived indices to estimate ecological indicators of the “Disturbance” attribute in grassland and forest ecosystems.
| Satellite Sensors | Independent Variable | Derived Ecosystem Health Indicator | Ecosystem Used | Field Measurements | Modeling Method | Example Study |
|---|---|---|---|---|---|---|
| Sentinel-2 | SR, NDVI, EVI, RCI, NDVIn, PVIn, GSAVIn, MSAVIn, NDVIngreen, EVIn, EVI2n, MTVI1n, NDII7n, NDVIre2n, NDVIre3n | Grazing capacity and stocking rate | Grassland | Dried aboveground biomass | Resource Selection Functions and Multiple linear regression | Doan [69] |
| Sentinel-2 Landsat RADAR | NBR, NDVI, LST | Seasonal timing of disturbance | Grassland | Species identification, species abundance, soil samples | Vegetation species response capacity model | Adagbasa et al. [92] |
| Landsat MODIS | NBR | Forest | Decision tree analysis | Loboda et al. [93] | ||
| Landsat | NDVI, NPV, MASD, FVC | Disturbance intensity | Grassland | Aboveground biomass | Artificial neural networks and ANOVA | Li et al. [82] |
| MODIS Landsat | NBR, dNBR, RdNBR | Forest | Distributional statistics, Linear and Non-linear regression algorithms | Heward et al. [94] | ||
| Landsat MODIS | Band 7/Band 5, NDVI, NBR, dNBR, RdNBR, Kauth Thomas brightness—greenness—wetness | Disturbance extent | Forest | Residual organic layer depth | Random forest algorithm | Barrett et al. [95] |
| HyMAP Landsat | MSI, CRI1, GNDVI, ARI2, NDVI, NWI2, NSMI, GOSAVI, NPCI, TCARI, DI1 | Defoliation and tree mortality rate | Forest | Classification algorithms Naïve Bayes, Support Vector Machine, Decision tree analysis | Lausch et al. [21] |
SR: Simple Ratio, NDVI: Normalized Difference Vegetation Index, EVI: Enhanced Vegetation Index, RCI: Ratio Cover Index, NDVIn: Narrow Normalized Difference Vegetation Index, PVIn: Narrow Perpendicular Vegetation Index, GSAVIn: Narrow Green Normalized Difference Vegetation Index, MSAVIn: Narrow Modified Soil-adjusted Vegetation Index, NDVIngreen: Narrow Green Normalized Difference Vegetation Index, EVIn: Narrow Enhanced Vegetation Index, EVI2n: Narrow Enhanced Vegetation Index 2, MTVI1n: Narrow Modified Triangular Vegetation Index 1, NDII7n: Narrow Normalized Difference Infrared Index 7, NDVIre2n: Narrow Normalized Difference Vegetation Index red-edge 2, NDVIre3n: Narrow Normalized Difference Vegetation Index red-edge 3, NBR: Normalized Burn Ratio, LST: Land Surface Temperature, NPV: Non-photosynthetic Vegetation, MASD: Mean Absolute Spectral Dynamic, FVC: Fractional Vegetation Cover, dNBR: Difference NBR, RdNBR: Relativized dNBR, MSI: Moisture Stress Index, CRI1: Carotenoid Reflectance Index 1, GNDVI: Green NDVI, ARI2: Anthocyanin Reflectance Index 2, NWI2: Normalized Water Index 2, NSMI: Normalized Difference Soil Moisture Index, GOSAVI: Green Optimized SAVI, NPCI: Normalized Pigment Chlorophyll Ratio Index, TCARI: Transformed Chlorophyll Absorption Reflectance Index, DI1: Derivative Index.
Table A5.
Satellite sensors and derived indices to estimate ecological indicators of “Fragmentation” and “Hydrology” attributes in grassland and forest ecosystems.
Table A5.
Satellite sensors and derived indices to estimate ecological indicators of “Fragmentation” and “Hydrology” attributes in grassland and forest ecosystems.
| Satellite Sensors | Independent Variable | Derived Ecosystem Health Indicator | Ecosystem Used | Field Measurements | Modeling Method | Example Study |
|---|---|---|---|---|---|---|
| MODIS | NDVI | Landscape diversity index | Grassland | Improved Costanza model | Suo et al. [96] | |
| Digital Number values | Forest | Shannon Index, Simpson Index, Pielou evenness, Renyl Indices | Open-Source Program GRASS-GIS | Rocchini et al. [46] | ||
| Landsat Indian Remote Sensing satellite | Number of patches | Forest | Patch analysis | Pattison et al. [68] | ||
| Mean patch size | ||||||
| Linear forest clearings density | ||||||
| Edge density | ||||||
| Percent of land occupied/unoccupied by linear forest clearings (LFCs) | ||||||
| AVHRR | NDVI | Winter snow coverage | Grassland | Least-squares method | Wang & Qiao [86] |
NDVI: Normalized Difference Vegetation Index.
References
- UN FAO Global Land Cover—SHARE (GLC-SHARE). Land & Water. Available online: http://www.fao.org/land-water/land/land-governance/land-resources-planning-toolbox/category/details/en/c/1036355/ (accessed on 31 May 2021).
- Ninan, K.N.; Inoue, M. Valuing Forest Ecosystem Services: What We Know and What We Don’t. Ecol. Econ. 2013, 93, 137–149. [Google Scholar] [CrossRef]
- Lamarque, P.; Tappeiner, U.; Turner, C.; Steinbacher, M.; Bardgett, R.D.; Szukics, U.; Schermer, M.; Lavorel, S. Stakeholder Perceptions of Grassland Ecosystem Services in Relation to Knowledge on Soil Fertility and Biodiversity. Reg. Environ. Chang. 2011, 11, 791–804. [Google Scholar] [CrossRef]
- Grantham, H.S.; Duncan, A.; Evans, T.D.; Jones, K.R.; Beyer, H.L.; Schuster, R.; Walston, J.; Ray, J.C.; Robinson, J.G.; Callow, M.; et al. Anthropogenic Modification of Forests Means Only 40% of Remaining Forests Have High Ecosystem Integrity. Nat. Commun. 2020, 11, 1–10. [Google Scholar] [CrossRef] [PubMed]
- Gang, C.; Zhou, W.; Chen, Y.; Wang, Z.; Sun, Z.; Li, J.; Qi, J.; Odeh, I. Quantitative Assessment of the Contributions of Climate Change and Human Activities on Global Grassland Degradation. Environ. Earth Sci. 2014, 72, 4273–4282. [Google Scholar] [CrossRef]
- National Research Council. Rangeland Health: New Methods to Classify, Inventory, and Monitor Rangelands; National Academy Press: Washington, DC, USA, 1994; ISBN 0-309-04879-6. [Google Scholar]
- Dale, V.H.; Beyeler, S.C. Challenges in the Development and Use of Ecological Indicators. Ecol. Indic. 2001, 1, 3–10. [Google Scholar] [CrossRef] [Green Version]
- Wurtzebach, Z.; Schultz, C. Measuring Ecological Integrity: History, Practical Applications, and Research Opportunities. BioScience 2016, 66, 446–457. [Google Scholar] [CrossRef] [Green Version]
- Fancy, S.G.; Gross, J.E.; Carter, S.L. Monitoring the Condition of Natural Resources in US National Parks. Environ. Monit. Assess. 2009, 151, 161–174. [Google Scholar] [CrossRef]
- Faber-Langendoen, D. Monitoring Ecological Resources within U.S. National Parks: Developing “Vital Signs” of Ecological Integrity for the Northeast Temperate Network; US Department of Agriculture, Forest Service, Rocky Mountain Research Station: Fort Collins, CO, USA, 2006; Volume 42, pp. 614–622.
- Unnasch, R.S.; Braun, D.P.; Comer, P.J.; Eckert, G.E. The Ecological Integrity Assessment Framework: A Framework for Assessing the Ecological Integrity of Biological and Ecological Resources of the National Park System; Report to the National Park Service; The National Park Service: Washington, DC, USA, 2008.
- Hansen, A.J.; Phillips, L. Trends in Vital Signs for Greater Yellowstone: Application of a Wildland Health Index. Ecosphere 2018, 9, e02380. [Google Scholar] [CrossRef] [Green Version]
- Saskatchewan PCAP Greencover Committee. Rangeland Health Assessment: Native Grassland and Forest; Prairie Conservation Action Plan: Regina, SK, Canada, 2008. [Google Scholar]
- Adams, B.W.; Ehlert, G.; Stone, C.; Alexander, M.; Lawrence, D.; Willoughby, M.; Moisey, D.; Hincz, C.; Burkinshaw, A.; Richman, J.; et al. Rangeland Health Assessment for Grassland, Forest and Tame Pasture; AEP, Rangeland Resource Stewardship Section: Edmonton, AB, Canada, 2016; ISBN 978-1-4601-2748-1. [Google Scholar]
- Willis, K.J.; Jeffers, E.S.; Tovar, C. What Makes a Terrestrial Ecosystem Resilient? Science 2018, 359, 988–989. [Google Scholar] [CrossRef]
- Wulder, M.A.; White, J.C.; Alvarez, F.; Han, T.; Rogan, J.; Hawkes, B. Characterizing Boreal Forest Wildfire with Multi-Temporal Landsat and LIDAR Data. Remote. Sens. Environ. 2009, 113, 1540–1555. [Google Scholar] [CrossRef]
- Nasen, L.C.; Noble, B.F.; Johnstone, J.F. Environmental Effects of Oil and Gas Lease Sites in a Grassland Ecosystem. J. Environ. Manag. 2011, 92, 195–204. [Google Scholar] [CrossRef]
- Ding, Y.; Wang, W.; Cheng, X.; Zhao, S. Ecosystem Health Assessment in Inner Mongolia Region Based on Remote Sensing and GIS. Int. Arch. Photogramm. Remote Sens. Spat. Inf. Sci. 2008, 37, 1029–1034. [Google Scholar]
- Xiao, F.; Ouyang, H. Ecosystem Health and Its Evolution Indicator and Method. J. Nat. Resour. 2002, 2, 203–209. [Google Scholar]
- Zlinszky, A.; Heilmeier, H.; Balzter, H.; Czúcz, B.; Pfeifer, N. Remote Sensing and GIS for Habitat Quality Monitoring: New Approaches and Future Research. Remote Sens. 2015, 7, 7987–7994. [Google Scholar] [CrossRef] [Green Version]
- Lausch, A.; Erasmi, S.; King, D.J.; Magdon, P.; Heurich, M. Understanding Forest Health with Remote Sensing-Part I—A Review of Spectral Traits, Processes and Remote-Sensing Characteristics. Remote Sens. 2016, 8, 1029. [Google Scholar] [CrossRef] [Green Version]
- Hunt, E.R., Jr.; Everitt, J.H.; Ritchie, J.C.; Moran, M.S.; Booth, D.T.; Anderson, G.L.; Clark, P.E.; Seyfried, M.S. Applications and Research Using Remote Sensing for Rangeland Management. Photogram. Eng. Remote Sens. 2003, 69, 675–693. [Google Scholar] [CrossRef] [Green Version]
- Li, Z.; Xu, D.; Guo, X. Remote Sensing of Ecosystem Health: Opportunities, Challenges, and Future Perspectives. Sensors 2014, 14, 21117–21139. [Google Scholar] [CrossRef] [Green Version]
- Lausch, A.; Erasmi, S.; King, D.J.; Magdon, P.; Heurich, M. Understanding Forest Health with Remote Sensing-Part II—A Review of Approaches and Data Models. Remote Sens. 2017, 9, 129. [Google Scholar] [CrossRef] [Green Version]
- Lausch, A.; Borg, E.; Bumberger, J.; Dietrich, P.; Heurich, M.; Huth, A.; Jung, A.; Klenke, R.; Knapp, S.; Mollenhauer, H. Understanding Forest Health with Remote Sensing, Part III: Requirements for a Scalable Multi-Source Forest Health Monitoring Network Based on Data Science Approaches. Remote Sens. 2018, 10, 1120. [Google Scholar] [CrossRef] [Green Version]
- Yang, H.; Shao, X.; Wu, M. A Review on Ecosystem Health Research: A Visualization Based on CiteSpace. Sustainability 2019, 11, 4908. [Google Scholar] [CrossRef] [Green Version]
- Dickens, C.; McCartney, M.; Tickner, D.; Harrison, I.J.; Pacheco, P.; Ndhlovu, B. Evaluating the Global State of Ecosystems and Natural Resources: Within and Beyond the SDGs. Sustainability 2020, 12, 7381. [Google Scholar] [CrossRef]
- Olson, D.M.; Dinerstein, E.; Wikramanayake, E.D.; Burgess, N.D.; Powell, G.V.N.; Underwood, E.C.; D’amico, J.A.; Itoua, I.; Strand, H.E.; Morrison, J.C.; et al. Terrestrial Ecoregions of the World: A New Map of Life on Earth. BioScience 2001, 51, 933. [Google Scholar] [CrossRef]
- Pyke, D.A.; Herrick, J.E.; Shaver, P.; Pellant, M. Rangeland Health Attributes and Indicators for Qualitative Assessment. J. Range Manag. 2002, 55, 584–597. [Google Scholar] [CrossRef]
- Dyksterhuis, E.J. Condition and Management of Range Land Based on Quantitative Ecology. J. Range Manag. 1949, 2, 104–115. [Google Scholar] [CrossRef]
- Sheley, R.L.; James, J.J.; Vasquez, E.A.; Svejcar, T.J. Using Rangeland Health Assessment to Inform Successional Management. Invasive Plant Sci. Manag. 2011, 4, 356–366. [Google Scholar] [CrossRef]
- Parks Canada. Monitoring and Reporting Ecological Integrity in Canada’s National Parks-Volume 2: A Park-Level Guide to Establishing EI Monitoring. 2007. Available online: http://parkscanadahistory.com/publications/eim-guide-v2-e-2007.pdf (accessed on 10 November 2020).
- Environment and Climate Change Canada. Canadian Environmental Sustainability Indicators: Ecological Integrity of National Parks; Government of Canada: Gatineau, QC, Canada, 2019; ISBN 978-0-660-31303-0.
- U.S. Department of the Interior; Bureau of Land Management; National Science and Technology Center. Interpreting Indicators of Rangeland Health: Version 4; Branch of Publishing Services, Division of Science Integration, BLM National Business Center: Denver, CO, USA, 2005.
- Allison, C.D.; Baker, T.T.; Boren, J.C.; Wright, B.D.; Fernald, A. Monitoring Rangelands in New Mexico-Range, Riparian, Erosion, Water Quality, and Wildlife; Range Improvement Task Force, Agricultural Experiment Station, Cooperative Extension Service: Las Cruces, NM, USA, 2002; p. 62. [Google Scholar]
- Ismail, R. Remote Sensing of Forest Health: The Detection and Mapping of Pinus Patula Trees Infested by Sirex Noctilio. Ph.D. Thesis, University of Kwazulu-Natal, Durban, South Africa, 2008. [Google Scholar]
- Soyza, A.G.D.; Whitford, W.G.; Herrick, J.E. Sensitivity Testing of Indicators of Ecosystem Health. Ecosyst. Health 1997, 3, 44–53. [Google Scholar] [CrossRef]
- Dobbie, M.J.; Dail, D. Robustness and Sensitivity of Weighting and Aggregation in Constructing Composite Indices. Ecol. Indic. 2013, 29, 270–277. [Google Scholar] [CrossRef]
- Page, M.J.; McKenzie, J.E.; Bossuyt, P.M.; Boutron, I.; Hoffmann, T.C.; Mulrow, C.D.; Shamseer, L.; Tetzlaff, J.M.; Akl, E.A.; Brennan, S.E.; et al. The PRISMA 2020 Statement: An Updated Guideline for Reporting Systematic Reviews. BMJ 2021, n71. [Google Scholar] [CrossRef]
- The World Bank North America Data. Available online: https://data.worldbank.org/country/XU (accessed on 3 August 2021).
- Dennison, P.E.; Brewer, S.C.; Arnold, J.D.; Moritz, M.A. Large Wildfire Trends in the Western United States, 1984–2011. Geophys. Res. Lett. 2014, 41, 2928–2933. [Google Scholar] [CrossRef]
- Olthof, I.; King, D.J. Development of a Forest Health Index Using Multispectral Airborne Digital Camera Imagery. Can. J. Remote Sens. 2000, 26, 166–176. [Google Scholar] [CrossRef]
- Hoover, D.L.; Knapp, A.K.; Smith, M.D. Resistance and Resilience of a Grassland Ecosystem to Climate Extremes. Ecology 2014, 95, 2646–2656. [Google Scholar] [CrossRef] [Green Version]
- Yun, T.; Jiang, K.; Hou, H.; An, F.; Chen, B.; Li, W.; Xue, L. Rubber Tree Crown Segmentation and Property Retrieval Using Ground-Based Mobile LiDAR after Natural Disturbances. Remote Sens. 2019, 11, 903. [Google Scholar] [CrossRef] [Green Version]
- Schirpke, U.; Kohler, M.; Leitinger, G.; Fontana, V.; Tasser, E.; Tappeiner, U. Future Impacts of Changing Land-Use and Climate on Ecosystem Services of Mountain Grassland and Their Resilience. Ecosyst. Serv. 2017, 26, 79–94. [Google Scholar] [CrossRef] [PubMed]
- He, K.S.; Rocchini, D.; Neteler, M.; Nagendra, H. Benefits of Hyperspectral Remote Sensing for Tracking Plant Invasions. Divers. Distrib. 2011, 17, 381–392. [Google Scholar] [CrossRef]
- Qin, Z.; Xu, B.; Xin, X.; Zhou, Q.; Liu, J. Integration of Remote Sensing and GIS Technology to Evaluate Grassland Ecosystem Health in North China. In Proceedings of the IEEE International Geoscience and Remote Sensing Symposium, IGARSS 2004, Anchorage, AK, USA, 20–24 September 2004; Volume 6, pp. 4034–4037. [Google Scholar]
- Guo, X.; Doan, T.; Gross, D.; Chu, T. Grassland Management Plan Saskatchewan Landing Provincial Park; Ministry of Parks Culture and Sports: Regina, SK, Canada, 2020; p. 72.
- Foody, G.M.; Dash, J. Discriminating and Mapping the C3 and C4 Composition of Grasslands in the Northern Great Plains, USA. Ecol. Inform. 2007, 2, 89–93. [Google Scholar] [CrossRef]
- Meneses-Tovar, C.L. NDVI as Indicator of Degradation. Unasylva 2011, 238, 39–46. [Google Scholar]
- Guo, X.; Zhang, C.; Wilmshurst, J.F.; Sissons, R. Monitoring Grassland Health with Remote Sensing Approaches. Prairie Perspect. 2005, 8, 11–22. [Google Scholar]
- Wu, N.; Liu, A.; Wang, Y.; Li, L.; Chao, L.; Liu, G. An Assessment Framework for Grassland Ecosystem Health with Consideration of Natural Succession: A Case Study in Bayinxile, China. Sustainability 2019, 11, 1096. [Google Scholar] [CrossRef] [Green Version]
- Lyu, X.; Li, X.; Gong, J.; Wang, H.; Dang, D.; Dou, H.; Li, S.; Liu, S. Comprehensive Grassland Degradation Monitoring by Remote Sensing in Xilinhot, Inner Mongolia, China. Sustainability 2020, 12, 3682. [Google Scholar] [CrossRef]
- Xu, D.; Guo, X. Some Insights on Grassland Health Assessment Based on Remote Sensing. Sensors 2015, 15, 3070–3089. [Google Scholar] [CrossRef] [Green Version]
- Chu, T.; Guo, X. Remote Sensing Techniques in Monitoring Post-Fire Effects and Patterns of Forest Recovery in Boreal Forest Regions: A Review. Remote Sens. 2014, 6, 470–520. [Google Scholar] [CrossRef] [Green Version]
- Logan, M.; Hu, Z.; Brinkman, R.; Sun, S.; Sun, X.; Schaffelke, B. Ecosystem Health Report Cards: An Overview of Frameworks and Analytical Methodologies. Ecol. Indic. 2020, 113, 105834. [Google Scholar] [CrossRef]
- Zhang, H.; Sun, J.; Deng, W.; Peng, L. Ecosystem Health: Assessment Framework, Spatial Evolution, and Regional Optimization in Southwest China. Chin. Geogr. Sci. 2020, 30, 142–156. [Google Scholar] [CrossRef] [Green Version]
- Trumbore, S.; Brando, P.; Hartmann, H. Forest Health and Global Change. Science 2015, 349, 814–818. [Google Scholar] [CrossRef] [Green Version]
- Lemons, R. Understanding the Effects of Spatial and Temporal Scale on State and Transition Models Based Upon Remotely Sensed Data; ProQuest Dissertations Publishing; University of North Dakota: Grand Forks, ND, USA, 2018. [Google Scholar]
- Huete, A.R. A Soil-Adjusted Vegetation Index (SAVI). Remote Sens. Environ. 1988, 25, 295–309. [Google Scholar] [CrossRef]
- Ren, H.; Zhou, G.; Zhang, F. Using Negative Soil Adjustment Factor in Soil-Adjusted Vegetation Index (SAVI) for Aboveground Living Biomass Estimation in Arid Grasslands. Remote Sens. Environ. 2018, 209, 439–445. [Google Scholar] [CrossRef]
- Chen, J.; Chen, K.; Xu, J. Research on the Remote Sensing Monitoring of Grassland Productivity Based on TM-NDVI. Agric. Sci. Technol. Hunan 2011, 12, 119–122. [Google Scholar]
- Estel, S.; Mader, S.; Levers, C.; Verburg, P.H.; Baumann, M.; Kuemmerle, T. Combining Satellite Data and Agricultural Statistics to Map Grassland Management Intensity in Europe. Environ. Res. Lett. 2018, 13, 1–10. [Google Scholar] [CrossRef]
- Housman, I.W.; Chastain, R.A.; Finco, M.V. An Evaluation of Forest Health Insect and Disease Survey Data and Satellite-Based Remote Sensing Forest Change Detection Methods: Case Studies in the United States. Remote Sens. 2018, 10, 1184. [Google Scholar] [CrossRef] [Green Version]
- Wang, R.; Gamon, A.J.; Emmerton, A.C.; Springer, R.K.; Yu, R.; Hmimina, G. Detecting Intra- and Inter-Annual Variability in Gross Primary Productivity of a North American Grassland Using MODIS MAIAC Data. Agric. For. Meteorol. 2020, 281, 1–12. [Google Scholar] [CrossRef]
- Dash, J.P.; Watt, M.S.; Pearse, G.D.; Heaphy, M.; Dungey, H.S. Assessing Very High Resolution UAV Imagery for Monitoring Forest Health during a Simulated Disease Outbreak. ISPRS J. Photogramm. Remote Sens. 2017, 131, 1–14. [Google Scholar] [CrossRef]
- Heilman, G.E.; Strittholt, J.R.; Slosser, N.C.; Dellasala, D.A. Forest Fragmentation of the Conterminous United States: Assessing Forest Intactness through Road Density and Spatial Characteristics: Forest Fragmentation Can Be Measured and Monitored in a Powerful New Way by Combining Remote Sensing, Geographic Information Systems, and Analytical Software. BioScience 2002, 52, 411–422. [Google Scholar] [CrossRef] [Green Version]
- Pattison, C.A.; Quinn, M.S.; Dale, P.; Catterall, C.P. The Landscape Impact of Linear Seismic Clearings for Oil and Gas Development in Boreal Forest. Northwest Sci. 2016, 90, 340–354. [Google Scholar] [CrossRef]
- Doan, T.T.M. Application of Remote Sensing and GIS in Modelling Bison Carrying Capacity in Mixed-Grass Prairie. Master’s Thesis, University of Saskatchewan, Saskatoon, SK, Canada, 2019. [Google Scholar]
- Franke, J.; Keuck, V.; Siegert, F. Assessment of Grassland Use Intensity by Remote Sensing to Support Conservation Schemes. J. Nat. Conserv. 2012, 20, 125–134. [Google Scholar] [CrossRef]
- Lauver, C.L.; Busby, W.H.; Whistler, J.L. Testing a GIS Model of Habitat Suitability for a Declining Grassland Bird. Environ. Manag. 2002, 30, 88–97. [Google Scholar] [CrossRef]
- Hammi, S.; Simonneaux, V.; Cordier, J.B.; Genin, D.; Alifriqui, M.; Montes, N.; Auclair, L. Can Traditional Forest Management Buffer Forest Depletion? Dynamics of Moroccan High Atlas Mountain Forests Using Remote Sensing and Vegetation Analysis. For. Ecol. Manag. 2010, 260, 1861–1872. [Google Scholar] [CrossRef] [Green Version]
- Anderson, K.; Croft, H. Remote Sensing of Soil Surface Properties. Prog. Phys. Geogr. 2009, 33, 457–473. [Google Scholar] [CrossRef]
- Pasolli, L.; Asam, S.; Castelli, M.; Bruzzone, L.; Wohlfahrt, G.; Zebisch, M.; Notarnicola, C. Retrieval of Leaf Area Index in Mountain Grasslands in the Alps from MODIS Satellite Imagery. Remote Sens. Environ. 2015, 165, 159–174. [Google Scholar] [CrossRef]
- Huang, S.; Potter, C.; Crabtree, R.L.; Hager, S.; Gross, P. Fusing Optical and Radar Data to Estimate Sagebrush, Herbaceous, and Bare Ground Cover in Yellowstone. Remote Sens. Environ. 2010, 114, 251–264. [Google Scholar] [CrossRef]
- Powers, R.P.; Coops, N.C.; Morgan, J.L.; Wulder, M.A.; Nelson, T.A.; Drever, C.R.; Cumming, S.G. A Remote Sensing Approach to Biodiversity Assessment and Regionalization of the Canadian Boreal Forest. Prog. Phys. Geogr. 2013, 37, 36–62. [Google Scholar] [CrossRef]
- Wei, Y.; Wang, L. Simulating Alpine Vegetation Net Primary Productivity by Remote Sensing in Qinghai Province, China. J. Mt. Sci. 2014, 11, 967–978. [Google Scholar] [CrossRef]
- Roch, L.; Jaeger, J.A. Monitoring an Ecosystem at Risk: What Is the Degree of Grassland Fragmentation in the Canadian Prairies? Environ. Monit. Assess. 2014, 186, 2505–2534. [Google Scholar] [CrossRef]
- Zhang, H.; Sun, Y.; Chang, L.; Qin, Y.; Chen, J.; Qin, Y.; Du, J.; Yi, S.; Wang, Y. Estimation of Grassland Canopy Height and Aboveground Biomass at the Quadrat Scale Using Unmanned Aerial Vehicle. Remote Sens. 2018, 10, 851. [Google Scholar] [CrossRef] [Green Version]
- Bombrun, M.; Dash, J.P.; Pont, D.; Watt, M.S.; Pearse, G.D.; Dungey, H.S. Forest-Scale Phenotyping: Productivity Characterisation Through Machine Learning. Front. Plant Sci 2020, 11. [Google Scholar] [CrossRef]
- Xu, D.; Guo, X.; Li, Z.; Yang, X.; Yin, H. Measuring the Dead Component of Mixed Grassland with Landsat Imagery. Remote Sens. Environ. 2014, 142, 33–43. [Google Scholar] [CrossRef]
- Li, J.; Yang, X.; Jin, Y.; Yang, Z.; Huang, W.; Zhao, L.; Gao, T.; Yu, H.; Ma, H.; Qin, Z. Monitoring and Analysis of Grassland Desertification Dynamics Using Landsat Images in Ningxia, China. Remote Sens. Environ. 2013, 138, 19–26. [Google Scholar] [CrossRef]
- Matasci, G.; Hermosilla, T.; Wulder, M.A.; White, J.C.; Coops, N.C.; Hobart, G.W.; Zald, H.S. Large-Area Mapping of Canadian Boreal Forest Cover, Height, Biomass and Other Structural Attributes Using Landsat Composites and Lidar Plots. Remote Sens. Environ. 2018, 209, 90–106. [Google Scholar] [CrossRef]
- Das, D.; Banerjee, S.; John, R. Predicting the Distribution and Abundance of Invasive Plant Species in a Sub-Tropical Woodland-Grassland Ecosystem in Northeastern India. Plant Ecol. 2019, 220, 935–950. [Google Scholar] [CrossRef]
- Wallerman, J.; Nyström, K.; Bohlin, J.; Persson, H.J.; Soja, M.J.; Fransson, J.E. Estimating forest age and site productivity using time series of 3D remote sensing data. In Proceedings of the 2015 IEEE International Geoscience and Remote Sensing Symposium (IGARSS), Milan, Italy, 26–31 July 2015; IEEE: Piscataway, NJ, USA, 2015; pp. 3321–3324. [Google Scholar]
- Wang, J.; Xiao, X.; Bajgain, R.; Starks, P.; Steiner, J.; Doughty, R.B.; Chang, Q. Estimating Leaf Area Index and Aboveground Biomass of Grazing Pastures Using Sentinel-1, Sentinel-2 and Landsat Images. ISPRS J. Photogramm. Remote Sens. 2019, 154, 189–201. [Google Scholar] [CrossRef] [Green Version]
- Czerwinski, C.J.; King, D.J.; Mitchell, S.W. Mapping Forest Growth and Decline in a Temperate Mixed Forest Using Temporal Trend Analysis of Landsat Imagery, 1987–2010. Remote Sens. Environ. 2014, 141, 188–200. [Google Scholar] [CrossRef]
- El Hajj, M.; Baghdadi, N.; Zribi, M.; Belaud, G.; Cheviron, B.; Courault, D.; Charron, F. Soil Moisture Retrieval over Irrigated Grassland Using X-Band SAR Data. Remote Sens. Environ. 2016, 176, 202–218. [Google Scholar] [CrossRef] [Green Version]
- Sewell, P.D.; Quideau, S.A.; Dyck, M.; Macdonald, E. Long-Term Effects of Harvest on Boreal Forest Soils in Relation to a Remote Sensing-Based Soil Moisture Index. For. Ecol. Manag. 2020, 462, 117986. [Google Scholar] [CrossRef]
- Ranson, K.J.; Kovacs, K.; Sun, G.; Kharuk, V.I. Disturbance Recognition in the Boreal Forest Using Radar and Landsat-7. Can. J. Remote Sens. 2003, 29, 271–285. [Google Scholar] [CrossRef]
- Reiche, M.; Funk, R.; Zhang, Z.; Hoffmann, C.; Reiche, J.; Wehrhan, M.; Li, Y.; Sommer, M. Application of Satellite Remote Sensing for Mapping Wind Erosion Risk and Dust Emission-Deposition in Inner Mongolia Grassland, China. Grassl. Sci. 2012, 58, 8–19. [Google Scholar] [CrossRef]
- Adagbasa, E.G.; Adelabu, S.A.; Okello, T.W. Development of Post-Fire Vegetation Response-Ability Model in Grassland Mountainous Ecosystem Using GIS and Remote Sensing. ISPRS J. Photogramm. Remote Sens. 2020, 164, 173–183. [Google Scholar] [CrossRef]
- Loboda, T.V.; Zhang, Z.; O’Neal, K.J.; Sun, G.; Csiszar, I.A.; Shugart, H.H.; Sherman, N.J. Reconstructing Disturbance History Using Satellite-Based Assessment of the Distribution of Land Cover in the Russian Far East. Remote Sens. Environ. 2012, 118, 241–248. [Google Scholar] [CrossRef] [Green Version]
- Heward, H.; Smith, A.M.S.; Roy, D.P.; Tinkham, W.T.; Hoffman, C.M.; Morgan, P.; Lannom, K.O. Is Burn Severity Related to Fire Intensity? Observations from Landscape Scale Remote Sensing. Int. J. Wildland Fire 2013, 22, 910–918. [Google Scholar] [CrossRef]
- Barrett, K.; McGuire, A.D.; Hoy, E.E.; Kasischke, E.S. Potential Shifts in Dominant Forest Cover in Interior Alaska Driven by Variations in Fire Severity. Ecol. Appl. 2011, 21, 2380–2396. [Google Scholar] [CrossRef]
- Suo, A.-N.; Xiong, Y.-C.; Wang, T.-M.; Yue, D.-X.; Ge, J.-P. Ecosystem Health Assessment of the Jinghe River Watershed on the Huangtu Plateau. EcoHealth 2008, 5, 127–136. [Google Scholar] [CrossRef] [PubMed]
Publisher’s Note: MDPI stays neutral with regard to jurisdictional claims in published maps and institutional affiliations. |
© 2021 by the authors. Licensee MDPI, Basel, Switzerland. This article is an open access article distributed under the terms and conditions of the Creative Commons Attribution (CC BY) license (https://creativecommons.org/licenses/by/4.0/).