Abstract
It is common practice for unmanned aerial vehicle (UAV) flight planning to target an entire area surrounding a single rooftop’s photovoltaic panels while investigating solar-powered roofs that account for only 1% of the urban roof area. It is very hard for the pre-flight route setting of the autopilot for a specific area (not for a single rooftop) to capture still images with high overlapping rates of a single rooftop’s photovoltaic panels. This causes serious unnecessary data redundancy by including the surrounding area because the UAV is unable to focus on the photovoltaic panel installed on the single rooftop. The aim of this research was to examine the suitability of a UAV video stream for building 3-D ortho-mosaics focused on a single rooftop and containing the azimuth, aspect, and tilts of photovoltaic panels. The 3-D position accuracy of the video stream-based ortho-mosaic has been shown to be similar to that of the autopilot-based ortho-photo by satisfying the mapping accuracy of the American Society for Photogrammetry and Remote Sensing (ASPRS): 3-D coordinates (0.028 m) in 1:217 mapping scale. It is anticipated that this research output could be used as a valuable reference in employing video stream-based ortho-mosaics for widely scattered single rooftop solar panels in urban settings.
1. Introduction
Defects of solar panels such as snail trails, dust, and cracks can decrease the power generation efficiency of photovoltaic modules. Traditionally, the defects of solar modules have been measured by visual inspection and the I-V (electrical current intensity-voltage) curve test through direct contact with the panel. However, these are time- and cost-consuming methods to inspect an individual solar module since it requires manual investigation (for instance, climbing up the solar panels) that can only implement one module at one time. In this regard, the recent literature has claimed the applicability of unmanned aerial vehicle (UAV) thermal ortho-mosaics with thermal infrared (TIR) imagery for the inspection of solar panels to replace visual inspections and I-V curve tests due to cost- and time-effective characteristics of UAV [1,2]. Most urban solar panels are installed on the roof or top of buildings because the urban environment has a large number of empty rooftop spaces suitable for avoiding environmental concerns and loss of solar energy from shading effects. In the case of the U.S.A, roof-mounted solar panels were on 1.48% (2 million) of the total housing units in the country (140 million) in 2019 [3,4]. It has been established as a standard practice to use UAV still images acquired by autopilot supporting a vertical path flight trajectory for an urban solar panel survey that requires a fixed flight altitude, speed, flight route, and overlapping rates.
To detect the geometric defects of widely scattered individual photovoltaic panels in an urban setting, the UAV needs to build an accurate 3-D ortho-mosaic for a single rooftop containing the azimuth, aspect, and tilts of the photovoltaic panels. The general rule of thumb is to secure high quality thermal ortho-mosaics with high overlapping rates to detect the flaws of solar panels. However, it is very hard for an autopilot operated pre-flight route setting for a specific area (not for a single rooftop) to capture still images with high overlapping rates for a single rooftop’s photovoltaic panels. This causes serious unnecessary data redundancy by including the surrounding area. There is a significant limitation of a UAV autopilot, supporting a constant speed and altitude along a pre-determined specific area route, in securing images with sufficient overlap by focusing on the photovoltaic panel installed on a single urban rooftop. The typical urban solar panels are composed of six or fewer solar cells. Hence, the tie points are mostly constructed based on the non-solar panel area during the process of ortho-mosaic. This interference can be solved only by taking thermal images exclusively of the targeted solar panels according to the user’s needs while adjusting the number of frames. In the process of constructing the tie points, the unnecessary targets can cause noise on the thermal values and exterior orientation parameters such as direct measurements of distances, angles, positions, and areas of solar panels. It is impossible to obtain geometric information on a single rooftop using UAV autopilot operating on a pre-flight route setting for a specific area. It is not common sense for an autopiloted UAV to target an entire area surrounding a single rooftop’s photovoltaic panels to investigate solar-powered roofs that account for only 1% of the urban roof area.
Contrary to this, video streams contain numerous and unusual characteristics, different from the traditional still image, which can be highly advantageous for the imaging and monitoring of scattered objects. Unlike still imagery taken by a manual flight or autopilot with path flight (hereinafter, path flight), dynamic stereo coverage between individual frames is achieved with very abundant overlap within a single interval [5,6]. Scattered photovoltaic panels in the city can be covered by a single flight path of continuous video, with constant and overlapping ratios helping to achieve a better quality of 3-D ortho-mosaicking of small-scale urban photovoltaic panels [7]. Due to these strengths of video streams, these are widely applied to detect objects in diverse fields such as mapping forests, monitoring algal bloom in real-time or detecting pipelines, etc. [7,8,9]. Nonetheless, to the best of our knowledge, there is no research on whether thermal orthogonal images based on UAV video streams can replace 3-D ortho-mosaics, based on the use of autopilot with flight path plans, in detecting defects of small-scale solar panels located in an urban area [10]. Therefore, this study aims to evaluate the mapping accuracy of UAV video streams compared with still image-based 3-D ortho-mosaics, based on the use of autopilot with flight path plan, in monitoring the geometric defects of scattered, single, urban photovoltaic panels.
2. Materials and Methods
2.1. Study Area
The experimental target, building No.5, College of Engineering, is located in Kyungpook National University (KNU), Daegu, southeastern South Korea between UTM 52N 464629.303E–464710.518E and 3971627.159N–3971570.615N (Figure 1). University campuses are well known as small-scale city spaces because they exhibit high spatial variation, similar to city-specific landscapes that include a variety of buildings, such as those for lectures, dormitories, libraries, green space, and vehicle traffic areas [11,12,13]. KNU is part of the north administrative district in Daegu Metropolitan City, the third most populous city in South Korea, aiming to be the “Solar City” due to its sufficient solar radiations and little precipitation (annual net precipitation: 1064.4 mm, annual durations of precipitation: 9.7 h). The KNU shows similar characteristics to the central business district, i.e., commercial and business centers, thus still maintains the land-use patterns of a typical city center. In this regard, photovoltaic panels are scattered across KNU and installed on buildings with diverse principle uses similar to the city. In addition, KNU is located at the place which used to be a small mountain containing small hills, inclines, and flats. This shows the diverse landforms in the small area.
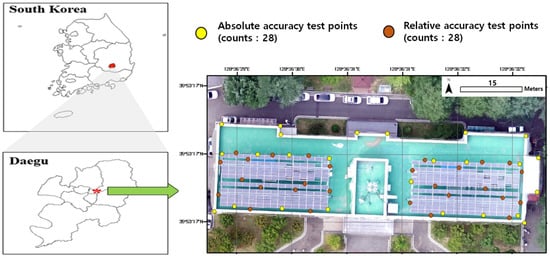
Figure 1.
The ortho-mosaics of study site: building No.5, College of Engineering, Kyungpook National University in Daegu, S. Korea.
In the city center, the residential photovoltaic panels installed on single residential buildings usually consist of less than six photovoltaic modules. Acquiring statistical credibility using these is hard due to the small numbers of sample data. In contrast, the photovoltaic panels in the KNU area consist of relatively sufficient numbers of photovoltaic modules to guarantee statistical confidence. Building No.2, College of Engineering, of KNU is surrounded intensively by diverse land use and land cover such as high- and low-rise buildings, dormitories, road networks, playgrounds, green spaces, and other mixed uses, which are presented in the city center [14]. Therefore, it is expected that the photovoltaic panels installed in university campuses can serve as a reference point for setting allowable errors or parameters for monitoring photovoltaic panels at a city-wide scale.
2.2. Data Collection
The UAV video was collected on 31 August 2019, when the solar zenith angle was highest (13:00 h) to avoid the shade and poor weather of the rainy season. The quadcopter DJI Matrice 200 V2 (a maximum flight altitude of 3000 m and maximum flight time of 24 min) was equipped with a Zenmuse XT2 camera (Figure 2; Table 1). Solar panels installed in the study area consisted of 60 cells, with 16 cm (width) × 16 cm (height). Ground sample distance (GSD) of UAV video can be calculated with a focal length of the camera, sensor width of the camera, flight height, image width, and image height as below (Equation (1))
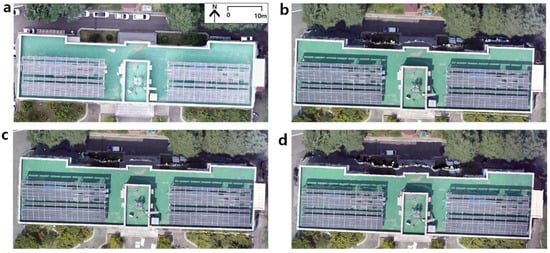
Figure 2.
UAV VIR ortho-video mosaic of the experimental site (building No.2, College of Engineering, at KNU) processed by Pix4d-Mapper. (a) ortho-mosaic collected by pre-determined path flight (b) 1 frame per 2.5 s (c) 1 frame per 4 s (d) 1 frame per 5.5 s.

Table 1.
Specifications of UAV and camera.
: the sensor width of the camera (mm)
: the focal length of the camera (mm)
: the flight height (m)
: the image width (pixels)
Since the camera specifications are fixed, the flight height is the major contributor to the GSD. For this reason, flight altitude was set as 100 m to get the best GSD (still imagery: 2.43 cm, video frame: 2.52 cm) that was able to detect the cells of individual solar panels in the study area and had sufficient space to fly freely above the solar panel. The video was captured at 30 frames per second in the DJI GO 4 setting with 1.6 m/s flight speed. We used the standard autopilot firmware, DJI OSDK (onboard software development kit) V3.8.1, embedded in the flight controller (NVIDIA Jetson TX2 and Intel Core i7-8550U) [15] and as commercial mission planning software (app for short). DJI OSDK V3.8.1 provides real-time data for all the electronics equipped in the UAV (Table 2) [16,17]. The commercial mission planning package, DroneDeploy, has a function operating the classical flight planning applied in large-format aerial photography. Further, it supports flexible flight missions to accommodate diverse project requirements. For example, perimeter 3D and Crosshatch 3D mission (double grid) were applied to fly over a rectangle but in both directions.
Table 2.
Sampling frequency of sensor data from OSDK V3.8.1 [16].
The raw UAV visible and infrared (VIR) video did not contain geometric information. However, DJI Matrice 200 provides the GPS file in SRT format, which contains the geometric information, captions, and timings per second. To extract the video imagery from the video (MOV file), we utilized the Video GeoTagger Pro. The video imageries were extracted in accordance with frame intervals of UAV video. The frame intervals were chosen as 2.5 s (1 frame per 2.5 s), 4 s (1 frame per 4 s), 5.5 s (1 frame per 5.5 s), which are in the range of ±10% of the overlapping rates found on autopilot with a flight path (80%). Generating the ortho-mosaic photo of individual frames was automatically performed using the photogrammetry software Pix4DMapper: (1) Initial processing (key points extraction, key points matching, camera model optimization, geolocation GPS/GCP); (2) Point cloud and mesh (point densification, 3-D textured mesh); (3) Digital Surface Model (DSM), ortho-mosaic and index. Pix4dMapper utilizes the structure from motion (SfM) technique, inferring 3-D information using overlapping images. SfM photogrammetry offers information required to construct 3-D images, such as focal length, camera type, and image size, from a set of corresponding points in two or more images without inputting ground control point (GCP) information [18,19].
An SfM algorithm was applied to reestablish the camera exposure position and motion trajectory for building a sparse point cloud. The sparse point cloud was then used for camera calibration, and a Multiview stereo (MVS) was utilized to build a dense point cloud, along with the Digital Surface Model (DSM) generation using reverse distance weight interpolation [20,21]. The photogrammetric block was processed in Pix4D with the number of 2-D and 3-D key point observations for bundle block adjustment (Table 3). Numbers of 3-D points and 2-D key point observations for bundle block adjustment were larger in the ortho-mosaic from path flight than the video frame-based ortho-mosaic due to the wider shooting area. In contrast, 2.5 s intervals of video frame-based ortho-mosaic showed the largest matched 2-D key points per image due to the highest degree of overlap (89.3%) (Table 2). Figure 3 presents the overlap status of the ortho-mosaic, with green areas showing overlap of more than five images for every pixel. Mostly, ortho-mosaics generated with the automatic path flight and video frame are green except for the borders and ortho-mosaics generated with 5.5 s interval video frame, indicating a high overlapping rate.
Table 3.
The point cloud evaluations of the ortho-mosaics of automatic path flight at different video frame intervals.
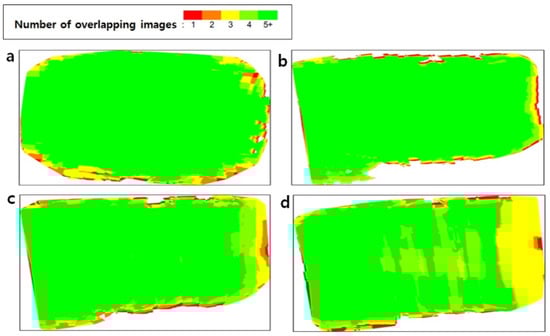
Figure 3.
Numbers of overlapping images in the point cloud. Green indicates the degree of overlap with more than five images, while red and yellow areas show a low degree of overlap resulting from the poor quality of imagery. (a) path flight (b) 1 frame per 2.5 s (c) 1 frame per 4 s (d) 1 frame per 5.5 s.
The GPS equipment (Trimble R8s) was used to verify the mapping accuracy and generate a UAV ortho-video mosaic of photovoltaic panels (Figure 4). Real-time kinematic positioning (RTK), based on the VRS (Virtual Reference Station), was used as a GPS receiver and mobile communication tool to send the GPS location of the station to the virtual control point server. The transmitted information in the VRS was recorded into three permanent observations to eliminate systematic errors, such as the effects of ionosphere and convection zone. In the VRS survey, GPS signals received not only L1C/A, L1C, L2C, and L5 signals but also GLONASS, SBAS, Galileo, and BeiDou signals. Location information was recorded only as the number of GPS satellites was 10 to 15, and the data interval was observed for more than 10 s with second intervals [22,23].
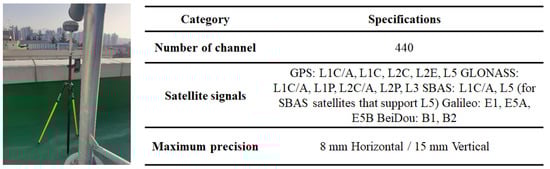
Figure 4.
Image of field survey with Trimble R8s for measuring RTK measurement point.
3. Results
There are several types of media used to present maps, such as paper maps, newspaper maps, screen maps, TV maps, and web maps. The traditional mapping media has moved beyond static and unilateral media to become an interactive, mobile, dynamic, and collaborative interface. Recently, smart devices have become the main interface of mapping due to the increasing multimodality and open data availability influencing human spatio-temporal behavior (e.g., navigation) [24]. Thereby, in this study, we used the map scale in terms of the screen map scale. A screen map scale can be defined as the ratio of distance measured upon a screen (in this study: 15” screen) to the actual distances. Acceptable error (minimum map accuracy) on the ground can be calculated by multiplying scale (Equation (2)) [25,26] and acceptable error on the map (Equation (3)) [27], as shown below
Monitor display scale = Screen map distance (15” screen: 33.21 cm)/Ground distance (7217 cm)
Acceptable error on the ground (in this study: 0.054 m) = map scale number (in this study: 217) × tolerable error (in this study: 0.25 mm).
The tolerable limitations vary with the diverse accuracy standards: North Atlantic Treaty Organization (NATO) Standard System for the Evaluation of Land Maps; United States Geological Survey National Mapping Accuracy Standard (USGS NMAS); American Society for Photogrammetry and Remote Sensing (ASPRS) [28]. The tolerable error of the ASPRS standard was applied since the ASPRS has the most conservative tolerable error at 0.25 mm [27]. Allowable RMSE can be calculated by dividing the acceptable error on the ground by the Z score probability occurrence. Conversion of accuracy standards into statistical analyses of the allowable RMSE requires that the confidence level be smaller than 1.96 times of the RMSE [29]. Therefore, allowable RMSE of points can be calculated by dividing the acceptable error on the ground (in this study: 0.054 m) (Figure 5) by 1.96. The allowable RMSE of the area can be inferred using probability error with Equations (4)–(6). The processed ortho-mosaics of the study area have the 1/217 scale with 0.028 m (distances, vertical accuracy) and 0.059 m2 (area) allowable RMSE.
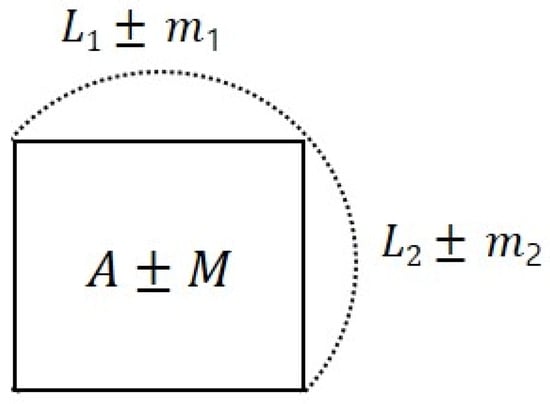
Figure 5.
Conceptual diagram for allowable RMSE of area.
: most probable value.
: allowable RMSE of points.
There are two different standards used to verify mapping accuracy. Absolute positional accuracy presents the location of points relating to all other points based on reference. Relative accuracy involves the comparative locations of objects regarding some other object or point. The absolute positional accuracy of ortho-mosaic mapping can be quantitatively evaluated by RMSE, which means the differences of the actual coordinates and estimated coordinates. Table 4 lists the RMSE of the estimated coordinates of photovoltaic panels and building boundaries in the ortho-mosaics, processed with different frame intervals extracted from the UAV video, and compared to the actual ground control points (GCPs). If the geometric accuracy of ortho-mosaics based on the UAV video could meet the allowable RMSE of the accuracy standard, it would provide the acceptability and reliability of this approach. RMSEs of building boundaries (unit: m) in individual ortho-mosaics are shown as 0.013–0.028 (path flight), 0.011–0.027 (1 frame per 2.5 s), 0.016–0.044 (1 frame per 4 s), and 0.17–0.046 (1 frame per 5.5 s). RMSEs of photovoltaic panel locations (unit: m) are shown as 0.001–0.064 (path flight), 0.004–0.039 (1 frame per 2.5 s), 0.012–0.073 (1 frame per 4 s), and 0.017–0.078 (1 frame per 5.5 s). RMSEs of the altitude of building boundaries (unit: m) are shown as 0.003–0.056 (path flight), 0.019–0.053 (1 frame per 2.5 s), 0.021–0.082 (1 frame per 4 s), and 0.022–0.095 (1 frame per 5.5 s). The mean RMSEs of path flight and 2.5 s interval frame of video (0.019), respectively, meet the absolute accuracy with the lower standard deviation of RMSE. In contrast, the mean RMSEs of 4 s and 5.5 s interval frame of video satisfy the allowable RMSE in building boundaries, but not in photovoltaic panel location (4 s: 0.030 m, 5.5 s: 0.035) or altitude of building boundaries (4 s: 0.041 m, 5.5 s: 0.052). This means that the ortho-video frames from 4 s and 5.5 s interval frames of the video were accurately able to ortho-mosaic the boundaries of the large-scale objects but had limitations on small objects, which require high spatial and geometric (X, Y, Z) resolutions and small minimum mapping units (Table 4).
Table 4.
Accuracy test of RMSE of absolute points from UAV video frame ortho-mosaic (unit: m).
The absolute accuracy itself could not present the overall accuracy of 3-D dimensional features such as photovoltaic panels since this is based on single points. Relative accuracy was measured by comparing individual features on the ortho-video frame with other features on the reconstructed model. The range of RMSEs in the distance between photovoltaic panels and building boundaries (unit: m) that appeared in individual ortho-mosaics are shown as 0.013–0.028 (path flight), 0.011–0.027 (1 frame per 2.5 s), 0.016–0.044 (1 frame per 4 s), and 0.17–0.046 (1 frame per 5.5 s). RMSEs of the distances between photovoltaic panel arrays are shown as 0.009–0.018 (path flight), 0.011–0.038 (1 frame per 2.5 s), 0.026–0.075 (1 frame per 4 s), and 0.002–0.106 (1 frame per 5.5 s). The range of RMSEs in detected photovoltaic panel size are presented as 0.001–0.031 (path flight), 0.011–0.027 (1 frame per 2.5 s), 0.011–0.048 (1 frame per 4 s), and 0.018–0.037 (1 frame per 5.5 s). The ortho-mosaics of path flight and 2.5 s interval frame of video meet the requirement for allowable RMSE in the relative accuracy test (Table 5).
Table 5.
Comparison of relative accuracy by the linear distance measurement and detected size of photovoltaic panel.
4. Discussion
Urban solar panels are small units composed of 6–8 solar cells scattered across the city, taking up under 2% of the total roof area. In this regard, pre-flight route settings of autopiloted UAVs for a single solar panel require larger and longer flight paths to gain more matched key points per imagery for further ortho-mosaicking. This style of flight planning becomes irrelevant, with widely scattered targets of urban solar panels, because of the inclusion of redundant areas in the shooting procedure. On the contrary, the video stream can focus exclusively and intensively on specific, single solar panels with shorter flight paths and flight times than an automatic flight with a pre-defined flight path. According to the results of this study, the flight path and shooting area for taking a video stream were three times less than autopilot with a pre-determined flight path; larger numbers of mean matched 2-D key points per image are displayed in video-based ortho-mosaics with higher overlapping rates. The 2.5 s video frame mosaic of photovoltaic panels had the highest overlapping rates and was well aligned to the coordinates of real-world ground points. The video-based ortho-mosaic was able to satisfy the ASPRS mapping accuracy standard for scattered single urban solar panels with low cost, labor, and time-saving.
Videos are recorded in a compressed format to save storage space and enhance data processing speed. For this reason, the number of pixels on video frames (3840 × 2160) is lower than photos (4000 × 3000). Thereby, the flight height of the UAV for videos has to be lower than that of the still photo to acquire a similar quality as photos. This paper was focused on evaluating the mapping accuracy of UAV video streams compared with still photos in monitoring the geometric defects of scattered single urban photovoltaic panels at the same flight height. Further research related to the image quality of video frames is required to develop the scattered urban solar panel detections using videos.
5. Conclusions
To the best of our knowledge, this study is the first research that arguably presents the appropriateness of video stream in detecting the geometric defects of photovoltaic panels scattered across a city center. The 2.5 s intervals of video frame-based ortho-mosaics accurately meet the allowable RMSE (0.028 m in this study) of the ASPRS mapping accuracy standard. As the video frame intervals go longer than 2.5 s (overlap ratio: 89.3%), the RMSEs of the video-based ortho-mosaics increase due to the lower overlap ratio. Our results investigated experimentally the minimum overlapping rates of a video frame that promised the absolute and relative accuracy at 1:217 map scale to construct ortho-mosaics for the detection of geometric defects from single urban photovoltaic panels. Albeit the wider intervals of video frame did not meet the allowable RMSE in this study, the RMSE of wider intervals such as 4 s (overlap ratio: 83.2%) and 5.5 s (overlap ratio: 77.3%) have sufficient overlapping rates and low enough RMSE for the construction and detection of photovoltaic panels in large map scales. The results of this study can be used as a realistic reference to determine the minimum overlapping rates of the video stream while identifying the geometric defects of single rooftop photovoltaic panels.
Author Contributions
Y.-S.H. and J.-S.U.; methodology, Y.-S.H.; software, Y.-S.H.; validation, S.S., J.-S.U., S.-I.P. and Y.-S.H.; formal analysis, Y.-S.H. and J.-S.U.; resources, Y.-S.H., S.S. and S.-I.P.; data curation, Y.-S.H. and S.S.; writing—original draft preparation, J.-S.U. and Y.-S.H.; writing—review and editing, Y.-S.H., S.S., S.-I.P. and J.-S.U.; visualization, Y.-S.H.; supervision, J.-S.U.; project administration, J.-S.U. and S.S.; funding acquisition, J.-S.U., S.S., S.-I.P. and Y.-S.H. All authors have read and agreed to the published version of the manuscript.
Funding
This work was supported by the National Research Foundation of Korea (NRF) grant funded by the Korea government (MSIT, NRF-2021R1F1A1051827).
Conflicts of Interest
The authors declare no conflict of interest.
References
- Lee, D.H.; Park, J.H. Developing Inspection Methodology of Solar Energy Plants by Thermal Infrared Sensor on Board Unmanned Aerial Vehicles. Energies 2019, 12, 2928. [Google Scholar] [CrossRef]
- Zhang, P.; Zhang, L.; Wu, T.; Zhang, H.; Sun, X. Detection and location of fouling on photovoltaic panels using a drone-mounted infrared thermography system. J. Appl. Remote Sens. 2017, 11, 016026. [Google Scholar] [CrossRef]
- United States Census Bureau. National and State Housing Unit Estimates: 2010 to 2019; United States Census Bureau: Suitland, MD, USA, 2019.
- Wood Mackenzie. U.S. Solar Market Insight: Q2 2020; Solar Energy Industries Association: Washington, DC, USA, 2020. [Google Scholar]
- Um, J.S.; Wright, R. A comparative evaluation of video remote sensing and field survey for revegetation monitoring of a pipeline route. Sci. Total Environ. 1998, 215, 189–207. [Google Scholar] [CrossRef]
- Um, J.S.; Wright, R. Video strip mosaicking: A two-dimensional approach by convergent image bridging. Int. J. Remote Sens. 1999, 20, 2015–2032. [Google Scholar] [CrossRef]
- Um, J.-S.; Wright, R. ‘Video Strip Mapping (VSM)’ for Time-sequential Monitoring of Revegetation of a Pipeline Route. Geocarto Int. 1999, 14, 24–35. [Google Scholar] [CrossRef]
- Seifert, E.; Seifert, S.; Vogt, H.; Drew, D.; van Aardt, J.; Kunneke, A.; Seifert, T. Influence of Drone Altitude, Image Overlap, and Optical Sensor Resolution on Multi-View Reconstruction of Forest Images. Remote Sens. 2019, 11, 1252. [Google Scholar] [CrossRef]
- Kislik, C.; Dronova, I.; Kelly, M. UAVs in Support of Algal Bloom Research: A Review of Current Applications and Future Opportunities. Drones 2018, 2, 35. [Google Scholar] [CrossRef]
- Um, J.-S. Evaluating patent tendency for UAV related to spatial information in South Korea. Spat. Inf. Res. 2018, 26, 143–150. [Google Scholar] [CrossRef]
- Robertson, S. Campus, City, Networks and Nation: Student-Migrant Activism as Socio-spatial Experience in Melbourne, Australia. Int. J. Urban Reg. Res. 2013, 37. [Google Scholar] [CrossRef]
- Srivanit, M.; Hokao, K. Evaluating the cooling effects of greening for improving the outdoor thermal environment at an institutional campus in the summer. Build. Environ. 2013, 66, 158–172. [Google Scholar] [CrossRef]
- Hwang, Y.-S.; Um, J.-S. Comparative Evaluation of Cool Surface Ratio in University Campus: A Case Study of KNU and UC Davis. KIEAE J. 2015, 15, 117–127. [Google Scholar] [CrossRef][Green Version]
- Park, S.-I.; Um, J.-S. Differentiating carbon sinks versus sources on a university campus using synergistic UAV NIR and visible signatures. Environ. Monit. Assess. 2018, 190, 652. [Google Scholar] [CrossRef] [PubMed]
- DJI. Manifold 2 Series User Guide v1.0; DJI: Shenzhen, China, 2019. [Google Scholar]
- DJI Developer. Telemetry. Available online: https://developer.dji.com/onboard-sdk/documentation/guides/component-guide-telemetry.html (accessed on 5 July 2021).
- Um, J.-S. Drones as Cyber-Physical Systems: Concepts and Applications for the Fourth Industrial Revolution, 1st ed.; Springer: Singapore, 2019. [Google Scholar] [CrossRef]
- Um, J.-S. Valuing current drone CPS in terms of bi-directional bridging intensity: Embracing the future of spatial information. Spat. Inf. Res. 2017, 25, 585–591. [Google Scholar] [CrossRef]
- Lee, J.-J.; Hwang, Y.-S.; Park, S.-I.; Um, J.-S. Comparative Evaluation of UAV NIR Imagery versus in-situ Point Photo in Surveying Urban Tributary Vegetation. J. Environ. Impact Assess. 2018, 27, 475–488. [Google Scholar] [CrossRef]
- Park, S.-I.; Hwang, Y.-S.; Um, J.-S. Estimating blue carbon accumulated in a halophyte community using UAV imagery: A case study of the southern coastal wetlands in South Korea. J. Coast. Conserv. 2021, 25, 38. [Google Scholar] [CrossRef]
- Liu, Y.; Zheng, X.; Ai, G.; Zhang, Y.; Zuo, Y. Generating a High-Precision True Digital Orthophoto Map Based on UAV Images. ISPRS Int. J. Geo-Inf. 2018, 7, 333. [Google Scholar] [CrossRef]
- Glenn, R.; Overbeck, J.R.; Heim, R. Color Indexed Elevation Maps for Flood-Vulnerable Coastal Communities in Western Alaska; State of Alaska, Department of Natural Resources, Division of Geological: Fairbanks, AK, USA, 2019. [Google Scholar]
- Liebermann, S.; Um, J.-S.; Hwang, Y.; Schlüter, S. Performance Evaluation of Neural Network-Based Short-Term Solar Irradiation Forecasts. Energies 2021, 14, 3030. [Google Scholar] [CrossRef]
- Kraak, M.-J.; Fabrikant, S.I. Of maps, cartography and the geography of the International Cartographic Association. Int. J. Cartogr. 2017, 3, 9–31. [Google Scholar] [CrossRef]
- Tobler, W. Resolution, Resampling, and All That. In Building Data Bases for Global Science; Taylor and Francis: London, UK, 1988. [Google Scholar]
- ICA. Multilingual Dictionary of Technical Terms in Cartography; Franz Steiner Verlag: Wiesbaden, Germany, 1973.
- ASPRS. ASPRS Accuracy Standards for Large-Scale Maps (Approval by the ASPRS Professional Practicing Division, March, 1990); The American Society for Photogrammetry and Remote Sensing: Bethesda, MA, USA, 1990. [Google Scholar]
- Mesas-Carrascosa, F.J.; Rumbao, I.C.; Berrocal, J.A.B.; Porras, A.G.-F. Positional Quality Assessment of Orthophotos Obtained from Sensors Onboard Multi-Rotor UAV Platforms. Sensors 2014, 14, 22394–22407. [Google Scholar] [CrossRef] [PubMed]
- NSDI. Geospatial Positioning Accuracy Standards Part 3: National Standard for Spatial Data Accuracy; NSDI: Reston, VA, USA, 1998. [Google Scholar]
Publisher’s Note: MDPI stays neutral with regard to jurisdictional claims in published maps and institutional affiliations. |
© 2021 by the authors. Licensee MDPI, Basel, Switzerland. This article is an open access article distributed under the terms and conditions of the Creative Commons Attribution (CC BY) license (https://creativecommons.org/licenses/by/4.0/).