1. Introduction
Although lakes only cover a small portion of the terrestrial surface, they can provide various important social and economic functions, such as freshwater storage, flood prevention, drought resisting, hydropower generation, industrial consumption, and agricultural production [
1]. In addition to their socioeconomic needs, lakes are also very important to ecosystems (e.g., biotic plants, animals, and micro-organisms) and biodiversity conservation [
2]. Water levels can characterize the temporal change of the earth’s surface water from local to global scales well, and it is a useful indicator for detecting the response of lakes to natural forces (e.g., runoff, glacier melting, precipitation, and evaporation) and human activities (e.g., damming, reservoir operation, irrigation, shoreline stabilization, and reclamation) [
3,
4,
5,
6,
7]. Therefore, accurate and complete datasets on lake level changes across the globe are fundamental to evaluate global water security for better supporting the United Nations’ Sustainable Development Goals on water resources and climate change [
8,
9,
10,
11,
12,
13].
However, in situ water level data only exist for a limited number of lakes with gauge stations in some specific regions around densely populated areas but are lacking in widely distributed remote areas around the world. In addition, some in situ water level data are difficult to obtain due to privacy concerns. Fortunately, benefiting from the global coverage, satellite altimeters make it possible to capture the spatial-temporal pattern of surface water levels worldwide [
5,
14,
15,
16,
17,
18,
19,
20]. Up until now, satellite altimeter data have been widely used to produce water level dataset for lakes from local to global scales. The traditional radar altimeter sensors (such as Topex/Poseidon, Jason, ENVISAT, ERS, CryoSat-2, Sentinel-3, and Sentinel-6) normally have relatively large footprints (from hundreds of meters to a few kilometers). Thus, with a very long-term dataset, the satellite radar altimeters were widely used for large lakes and reservoirs, especially those with areas greater than 100 km
2. To be specific, several widely used inland water level databases at a global scale have been produced from radar missions, e.g., HYDROWEB (
http://hydroweb.theia-land.fr/ (accessed on 27 January 2021)), G-REALM (
https://ipad.fas.usda.gov/cropexplorer/global_reservoir/ (accessed on 27 January 2021)), and DAHITI (
https://dahiti.dgfi.tum.de/en/ (accessed on 27 January 2021)). Although they are of great importance in many aspects [
21], the water levels of small lakes and reservoirs less than 1 km
2 are difficult to measure using traditional radar altimeter sensors due to nearby land interference.
The satellite laser altimeters, e.g., ICESat (Ice, Cloud, and land Elevation Satellite) and ICESat-2 have smaller footprints and relatively high vertical accuracy of a few tens of centimeters [
22,
23,
24,
25]. With a 70-m diameter footprint, the ICESat data were more suitable for calculating water levels in small lakes [
26]. However, due to the limited spatial coverage and sparse along-track footprints (with a 170-m interval), numerous small water bodies have a few observations. For current altimetry missions including both laser and radar altimeters (e.g., ICESat, Topex/Poseidon, Jason, Envisat, and SARAL), only along-track resolution is given. For the cross-track separation, the equatorial cross-track distance is used. The newly ICESat-2 photon-counting laser altimeter launched in 2018 has a footprint of less than 17 m, and the footprint interval in the along-track direction is only 0.7 m. With a six-beam configuration (including three strong and three weak beams), the ICESat-2 photon-counting lidar can provide six along-track surface profiles in the cross-track directions where it flies over [
27]. It means that ICESat-2 tends to have the ability to track water levels of more lakes. With these advantages, the ICESat-2 altimetry data can be used to better monitor global water level changes of surface water for not only large lakes but also smaller lakes with a size less than 1 km
2 [
10,
23,
28,
29]. Specifically, ICESat-2 ATL13 products provide observations of the inland water surface height and exhibit a great potential for monitoring global lake/reservoir water level changes benefiting from its global coverage. The performance of ATL13 products in water level estimation was investigated over 9 Swiss lakes by Berge-Nguyen et al. [
30] and 22 big lakes distributed on the earth by Frappart et al. [
31]. However, the performance of ATL13 products with a large number of lakes and reservoirs at a global scale is still not clear. Meanwhile, although laser altimeters have many advantages on water level observations of lakes and reservoirs, clouds and aerosol have an impact on the data quality due to the attenuation and scattering effect. This is a basic limitation of ICESat and ICESat-2 with respect to radar altimeters.
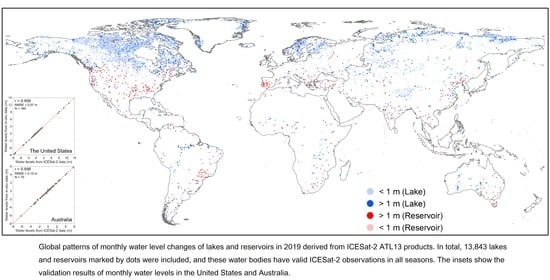
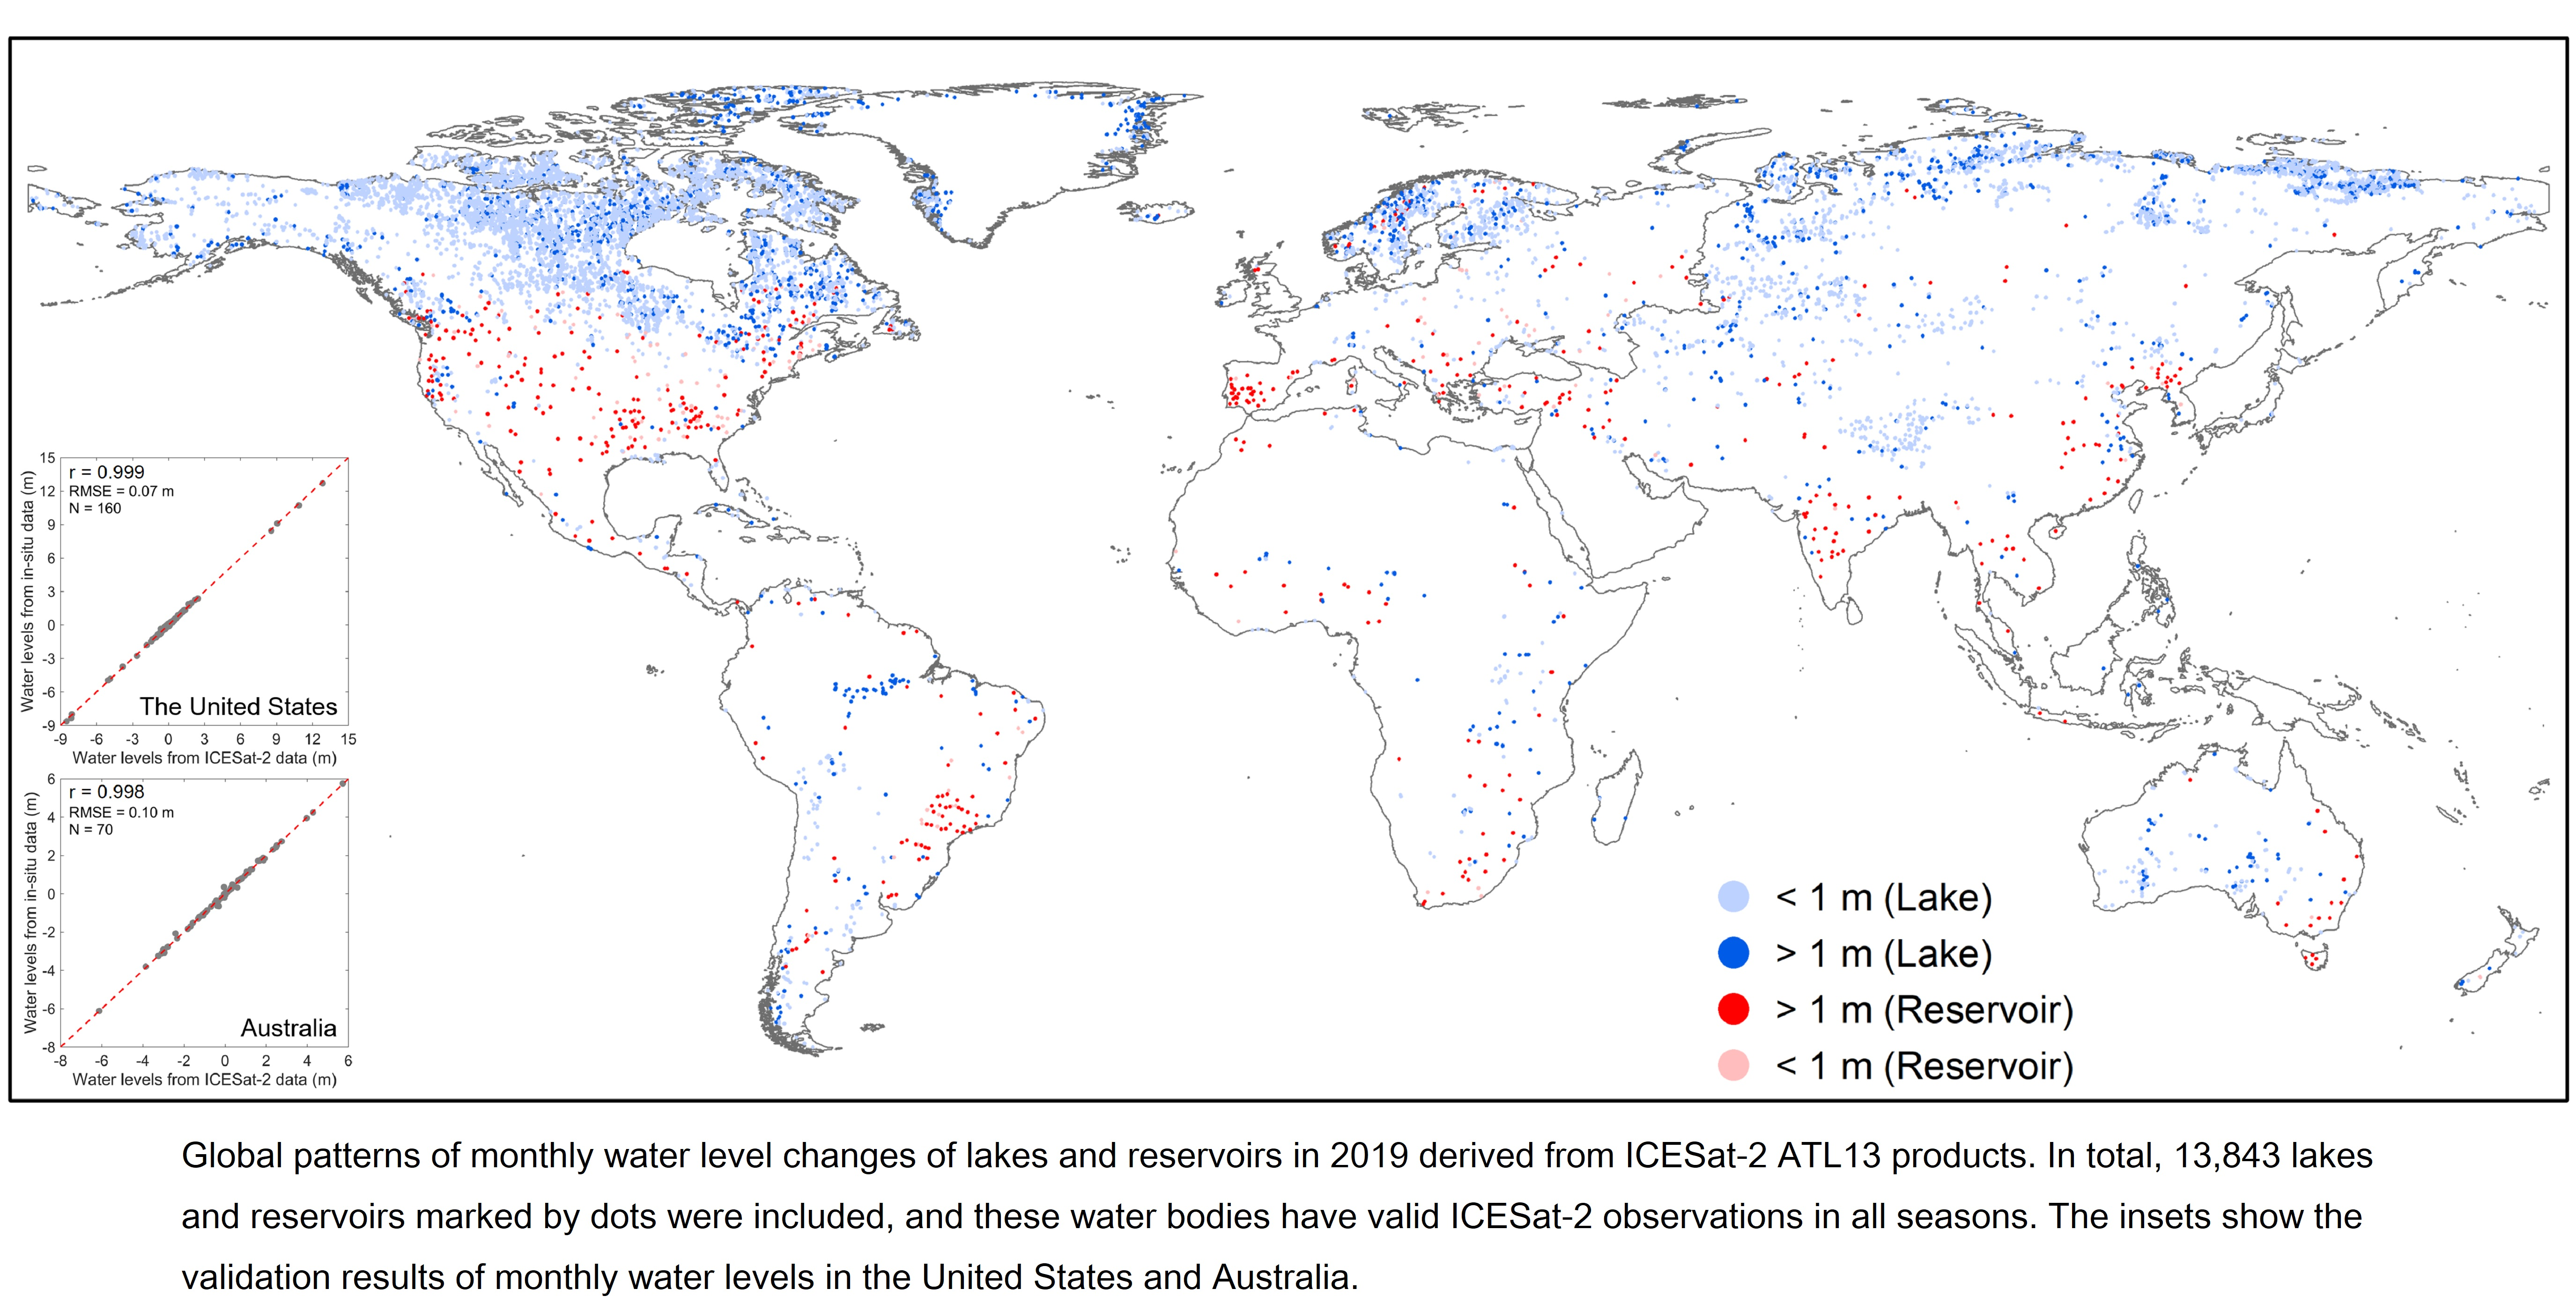
In this study, based on the newly released ICESat-2 ATL13 products, 13,843 surface water bodies (including 13,148 lakes and 695 reservoirs) with valid ICESat-2 observations in all seasons in 2019 were filtered from the HydroLAKES database, and the monthly water level changes of these lakes and reservoirs were estimated and assessed. First, a preliminary filter was applied based on data quality flags; second, all the lakes and reservoirs with available ICESat-2 data were selected based on the ID number provided in the ATL13 product; third, for each lake or reservoir, a median-based filter was applied to obtain the surface water level for all the satellite overpasses; fourth, monthly water level changes for all the lakes and reservoirs around the globe were estimated. In situ water levels of 21 lakes/reservoirs across the United States and 12 lakes/reservoirs across Australia were collected for validations. In addition, to quantitatively evaluate the different products of surface heights of ICESat-2, the monthly water levels and changes derived from ATL13 products in this study were compared with the similar results derived from ATL08 products in a recent study [
28].
2. Materials and Methods
The National Oceanic and Atmospheric Administration (NOAA) is performing regular updates and improvements of the coverage of the ICESat-2 laser product. All available ICESat-2 ATL13 products (version V003) were collected from the National Snow and Ice Data Center (NSIDC, Boulder, CO, USA) to obtain monthly water level changes for global lakes and reservoirs [
32]. The ATL13 product was masked by the HydroLAKES database, which was developed from many existing coastline and inland water databases. Based on the Algorithm Theoretical Basis Document (ATBD, Greenbelt, MD, USA) for the ATL13 product [
32], the WGS84 ellipsoidal heights h, the EGM2008 orthometric heights H, and the geoid N along the track are provided. Due to the gravity effect, the water level of large lakes/reservoirs is not a stable value when the ellipsoidal heights (that were normally used in many satellite altimetry data products) were used. As a result, the orthometric heights H with respect to the EGM2008 geoid were used in this study, where the gravity effect has been already considered. The results at various lakes of the world in this study were based on this vertical datum.
In 2019, 1336 ICESat-2 ATL13 datasets in total were available with millions of measurements. In this study, based on HydroLAKES with 1,427,688 water bodies, 753,495 water bodies were covered by ICESat-2 ATL13 products. First, the data quality flags in the ATL13 product were used to filter out bad quality observations. In general, six related flags are closely related to this study. Four flags were directly used to discard the invalid data. Specifically, the data with “qf_bckgrd” equal to 6 were deleted, which corresponds to the largest density of background photons in each segment and are normally captured at midday, i.e., the data with the lowest signal to noise ratio in which outliers are more likely to occur. The outliers in water surface observations introduce an elevation error when calculating the water level. The data with “qf_bias_em” equal to 3/−3 were discarded because these data have the largest electromagnetic bias, which normally indicates a higher water surface slope and is the most possible to introduce elevation error when calculating the water level [
33]. The data with “qf_bias_fit” equal to 3/−3 were deleted. In the ATL13 official document [
32], these data have the largest elevation bias of the fitted Gaussian centroids between the observed surface water histogram and integrated one. The data with “stdev_water_surf” larger than 2 were discarded, which indicates that the standard deviation of the water surface is larger than 2 m and definitely corresponds to an extremely large significant wave height (SWH) on the water surface of lakes. These four kinds of poor-quality data normally correspond to the circumstances of high background noises, bad and very shallow waters, large winds above water surface, and large water waves, respectively.
In addition to the above four flags (i.e., “qf_bckgrd”, “qf_bias_em”, “qf_bias_fit”, and “stdev_water_surf”), the cloud coverage (layer_flag_ATL09) and ice coverage (snow_ice_ATL09) were also considered [
32]. These two flags are both from the ATL09 atmosphere product [
34]. The ice coverage flag is from the NOAA daily snow/ice cover map and 0 = ice free water, 1 = snow free land, 2 = snow, and 3 = ice. When more than one overlap exists, the greatest value is assigned. As a result, this flag generally overestimates the ice coverage, and only a small part of the total data has the flag of 0 = ice free water. The cloud coverage flag (0 = without cloud, 1 = with cloud) is the combination of three flags in the ATL09 product (i.e., cloud_flag_atm, cloud_flag_ASR, and bsnow_con), which is basically related to the backscatter profile, surface reflectance, and blowing snow [
35]. As a result, this flag also slightly overestimates the cloud coverage.
Table 1 shows the statistics of the involved six data quality flags. HydroLAKES has 1,427,688 inland water bodies, in which 753,495 (approximately half) were covered by ICESat-2 ATL13 products in 2019. In
Table 1, after discarding the poor-quality data, the percentages of valid water bodies are different from the percentages of ICESat-2 valid observations because large water bodies occupy many more surface observations than the smaller ones. If the ice coverage flag (snow_ice) is involved, only 1% of the water bodies are left. Similarly, the cloud coverage flag (layer_flag) discarded approximately half of the total observations. As mentioned above, these two flags are overlapped by many flags, which may overestimate the bad quality percentages. In this study, these two flags were not used because in addition to flags, other filters will be further used to discard bad observations or water bodies. After discarding the poor-quality data based on the four flags, 593,076 water bodies remain (78.71% in the 753,495 water bodies covered by ATL13 products).
Second, ID numbers of lakes and reservoirs that were covered by valid ICESat-2 data were selected. ID numbers were provided by the HydroLAKES database, which contains the following various types of surface water: lake, reservoir, ephemeral water, river, estuary, bay, and coastal water. Note that only lakes and reservoirs were included in this study, i.e., 577,239 water bodies remain after this step. Third, for each lake/reservoir (via the ID number), all ICESat-2 valid data acquired at different dates were sequenced in acquisition time. A median-based filter was then applied to calculate the water levels of each lake or reservoir for each date (i.e., the time of the satellite overpass) [
23], which can effectively avoid the effect of ICESat-2 elevations of the shore around lakes, such as forest, shrub, and bare land. However, if the mean averaging method was adopted, it is likely that an overestimation of lake water levels would have occurred.
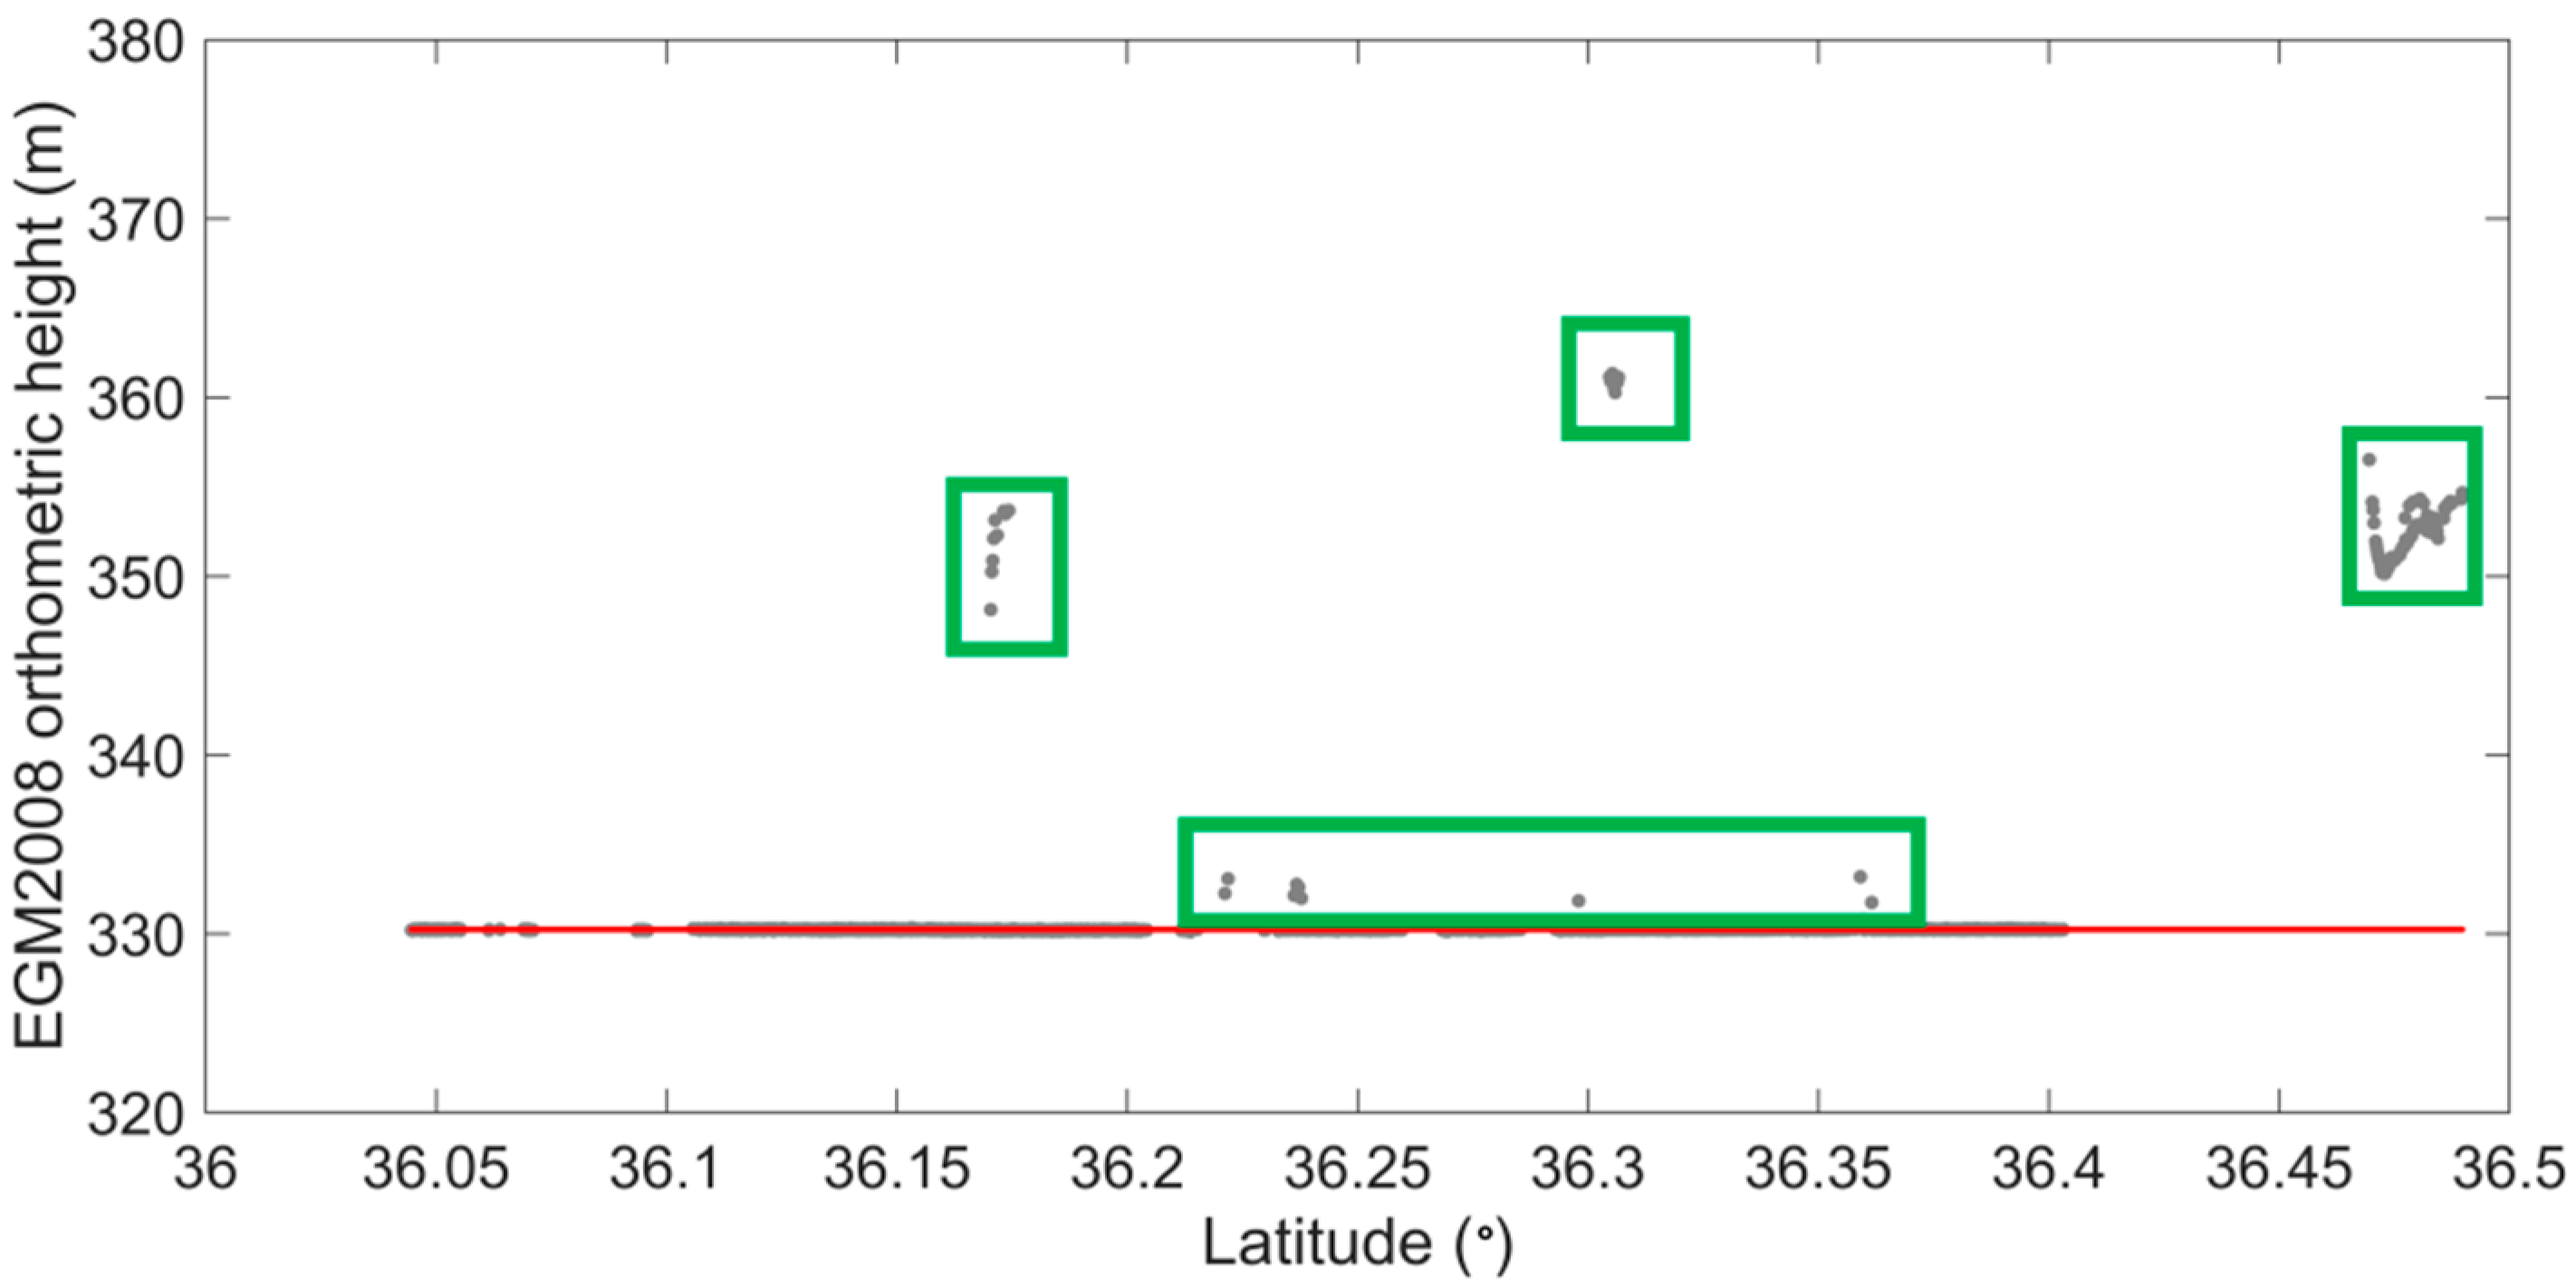
Figure 1 illustrates a sample of water level observations from ICESat-2 ATL13 products.
Figure 1 shows the outliers (gross errors) in a single day, where the ICESat-2 points in green boxes clearly demonstrate the interference by the shore (such as forest, shrub, and bare land) around or inside the lake. Fourth, water levels of all available lakes and reservoirs around the world were estimated for each month in 2019. For each lake or reservoir, monthly averaged water levels were calculated as the final results.
A lake/reservoir will be selected in this study when it has at least one-month observations in each season (i.e., from December to February, from March to May, from June to August, and from September to November). In addition, the monthly water level change of each lake/reservoir should be in a reasonable range, otherwise this lake/reservoir will be discarded, i.e., the change cannot exceed 50 m within a year. Using this criterion, we can avoid the possible observations backscattered from the cloud layer (because the cloud flag was not used), which normally has an elevation of several kilometers and introduces a significantly overestimated water level. After the above selecting procedures, only 13,843 (about 1% of the total 1,427,688 water bodies in HydroLAKES) lakes and reservoirs with all-season ICESat-2 ATL13 products were finally used for further analysis. Then, the offset between monthly water levels and annual water level (averaging twelve-month water levels) were removed to produce the relative monthly water levels. Based on the monthly water levels (i.e., water levels in 12 months), the monthly water level change was defined as the difference between the maximum water level and minimum water level of the months with available observations in 2019 [
10].
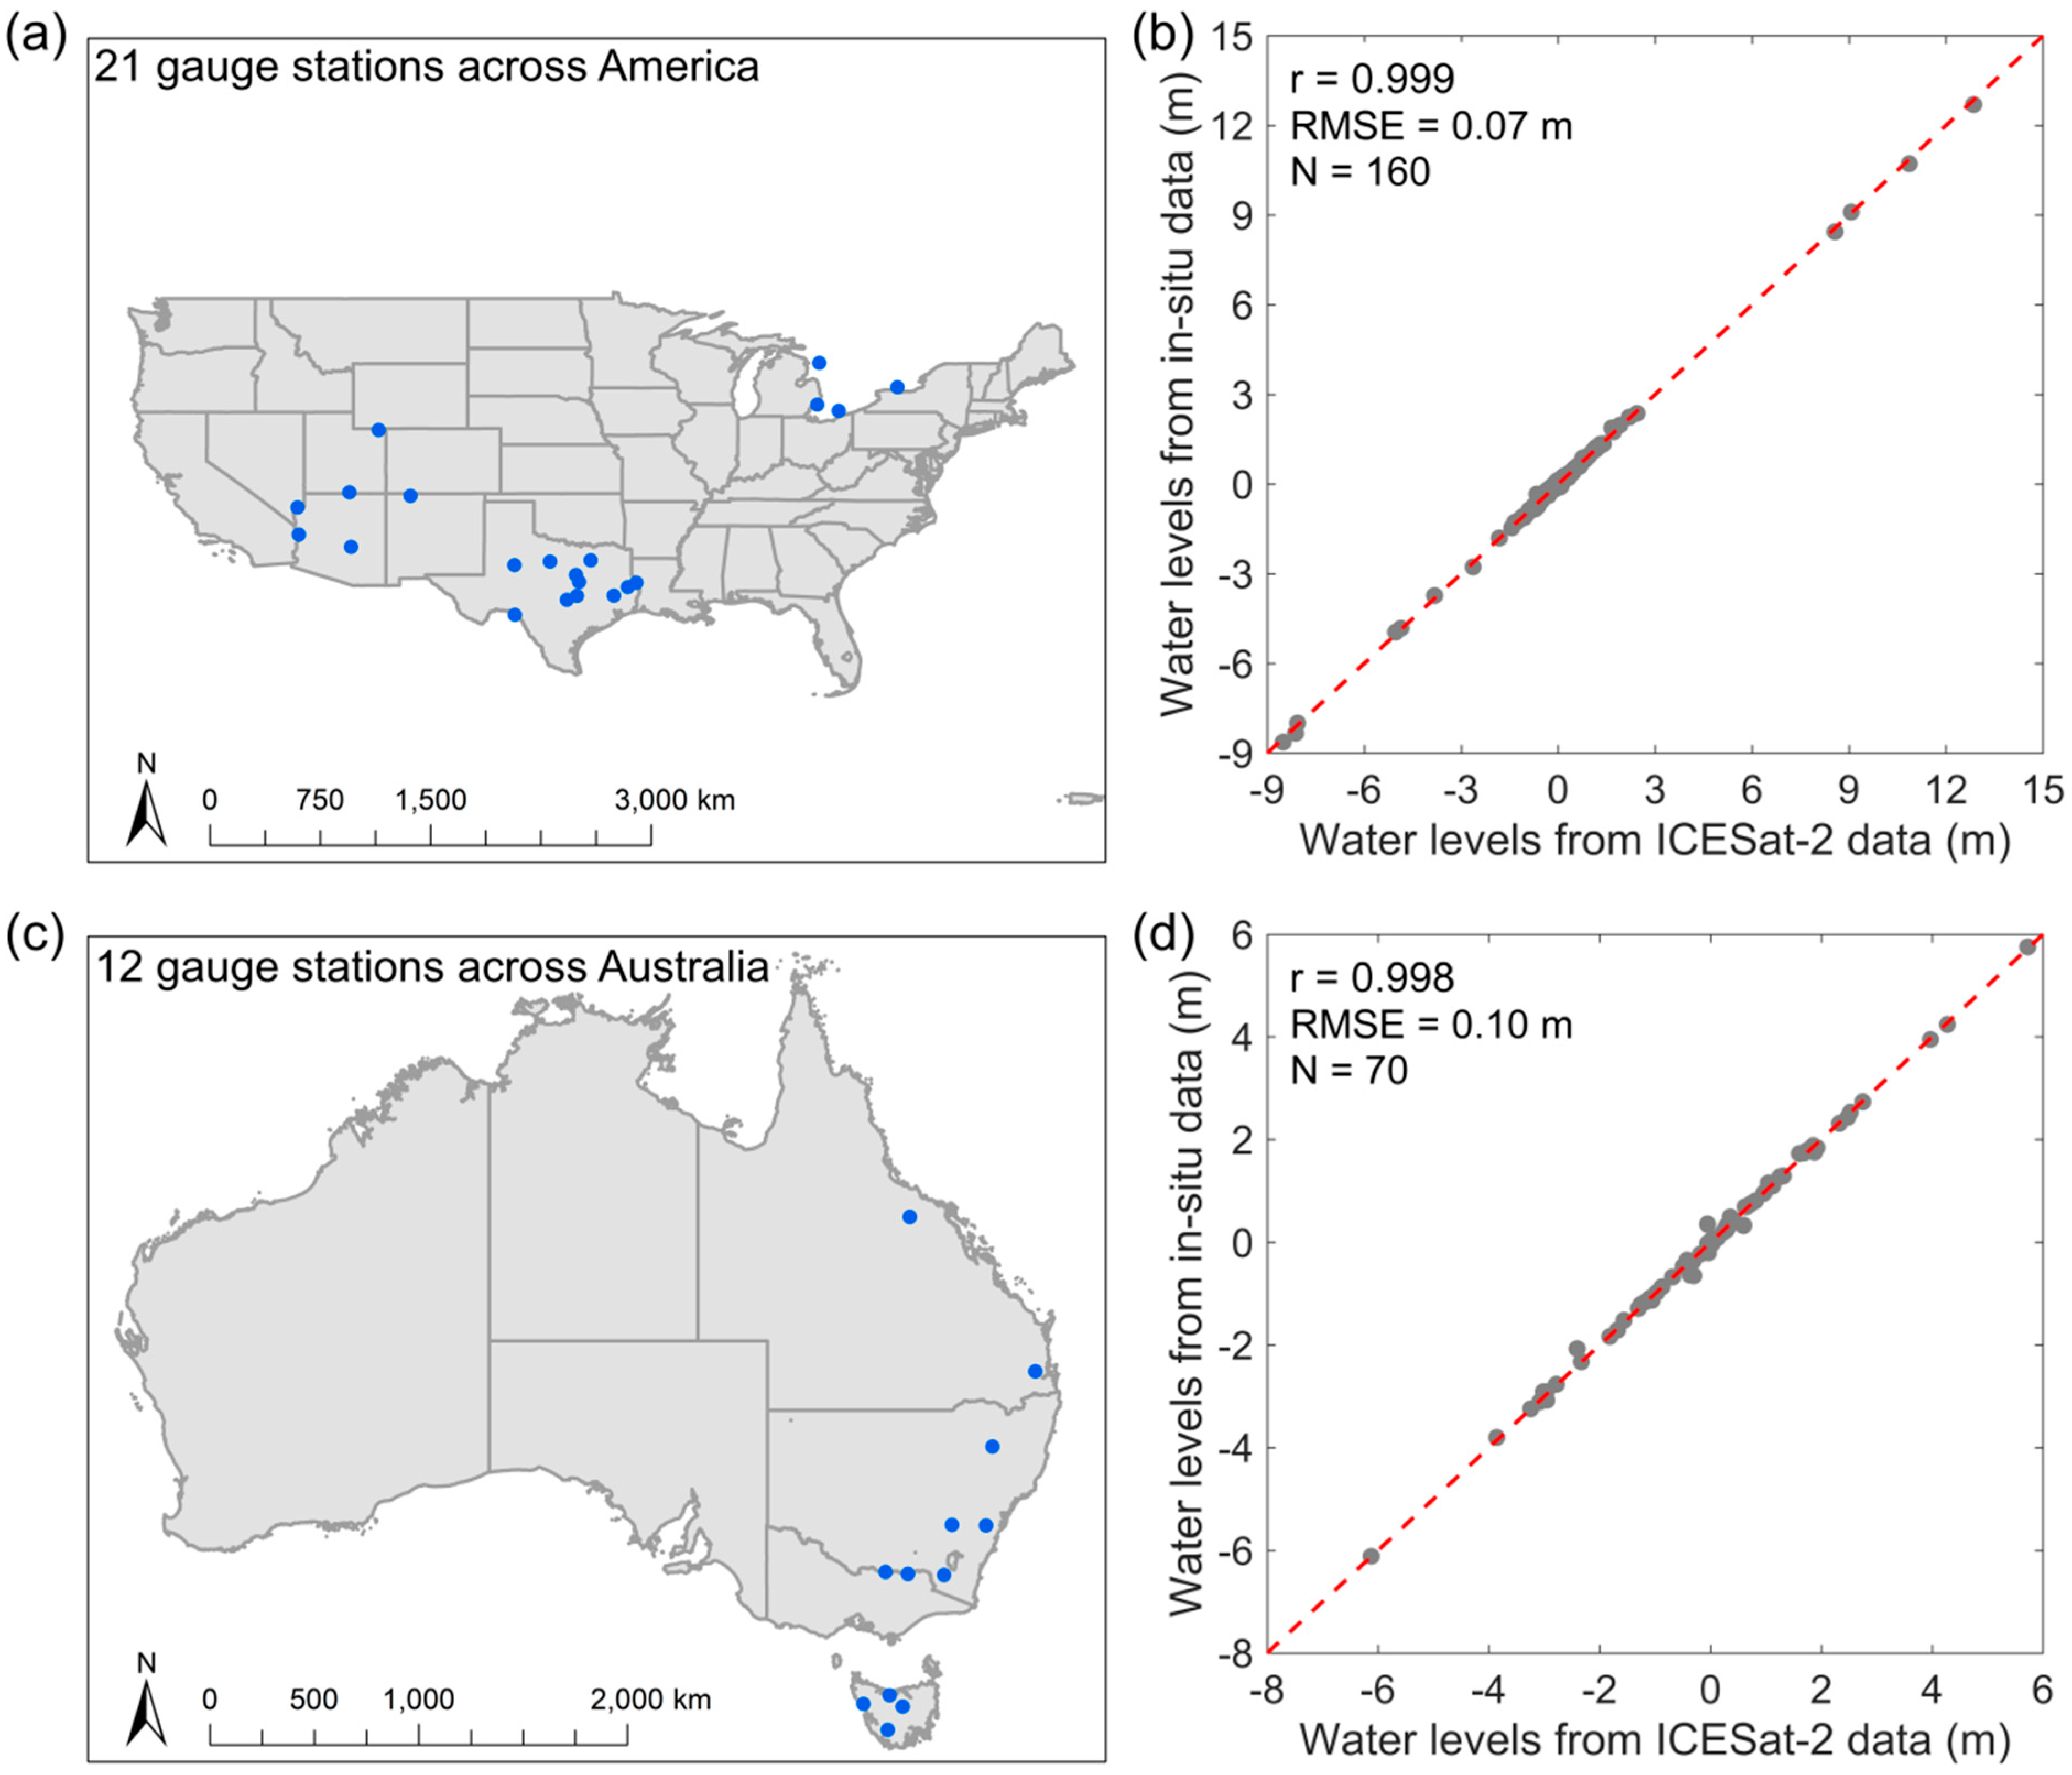
Comparisons between monthly averaged water levels derived from ATL13 products and in situ data of 33 lakes/reservoirs across the United States and Australia were performed to validate our produced water level results. The in situ water level data of 21 lakes/reservoirs across the United States were obtained from the National Oceanic and Atmospheric Administration website (
https://www.noaa.gov/ (accessed on 27 January 2021)), the website of Colorado River Water and Snowpack Data (
http://www.snowpack.water-data.com/ (accessed on 27 January 2021)), and the website of Water Date for Texas (
https://www.waterdatafortexas.org/reservoirs/ (accessed on 27 January 2021)). For 21 lakes/reservoirs with specific vertical datum across the United States, in situ water levels from ground-truth gauge stations were transformed from the NGVD29/NAVD88 to the EGM2008 orthometric heights via VDatum Tool (
https://vdatum.noaa.gov/vdatumweb/ (accessed on 27 January 2021)). The in situ water level data of 12 lakes/reservoirs across Australia were obtained from the Water Data Online website (
http://www.bom.gov.au/waterdata/ (accessed on 27 January 2021)). Unfortunately, these 12 ground-truth gauge stations do not provide the vertical datum for the in situ water level measurements. Across Australia, in situ water levels were processed into the EGM2008 orthometric heights by subtracting the offset between the ATL13-derived water levels and in situ measurements. The offset was equal to the difference between the mean of all available monthly ATL13-derived water levels and the mean of all available monthly in situ water levels. The in situ water level data corresponding to acquisition dates of ICESat-2 data were also processed to monthly water levels to compare with our results. Specifically, the Root Mean Square Error (RMSE) and correlation coefficient,
r, were calculated to quantify the comparisons between ICESat-2-derived water levels and in situ data for each water level gauge station.
Finally, the assessment of the monthly water level changes of lakes and reservoirs was conducted. The percentages of different lake sizes, different number of months with ICESat-2 data, and other statistical results (i.e., the standard deviation) of water levels were calculated for global lakes and reservoirs. Specifically, for each lake/reservoir, monthly averaged water levels were firstly calculated from valid ICESat-2 observations in each month, and then the standard deviation (Std) of these valid observations was calculated to further quantify the uncertainty of estimated lake monthly water levels and explore the impact of size of lakes and reservoirs on the monthly water level uncertainty. In addition, a recent ATL08-derived dataset [
28] was collected to conduct a comparison with our ATL13-derived results.
4. Discussion
The ATL08 and ATL13 products are the Level 3 dataset of ICESat-2 and generate from the Level 2 ATL03 dataset. ICESat-2 ATL13 products provide along-track inland and near shore water surface heights after the spatial screening using the water mask provided by HydroLAKES database (
https://www.hydrosheds.org/page/hydrolakes (accessed on 27 January 2021)), which integrated many widely used surface water datasets, e.g., Canadian hydrographic dataset (CanVec), Water Body Data (SWBD), MODerate resolution Imaging Spectro-radiometer (MODIS) MOD44W water mask, US National Hydrography Dataset (NHD), European Catchments and Rivers Network System (ECRINS), Global Lakes and Wetlands Database (GLWD), Global Reservoir and Dam database (GRanD), etc. The ATL08 product also provides the surface height for land and vegetation areas that include inland water bodies [
36,
37]. However, no spatial screening for surface water was conducted for the original ATL08 product, and, thus, many outliers from other land-covers (such as the bare land and vegetation) around the shore may exist in ATL08 products.
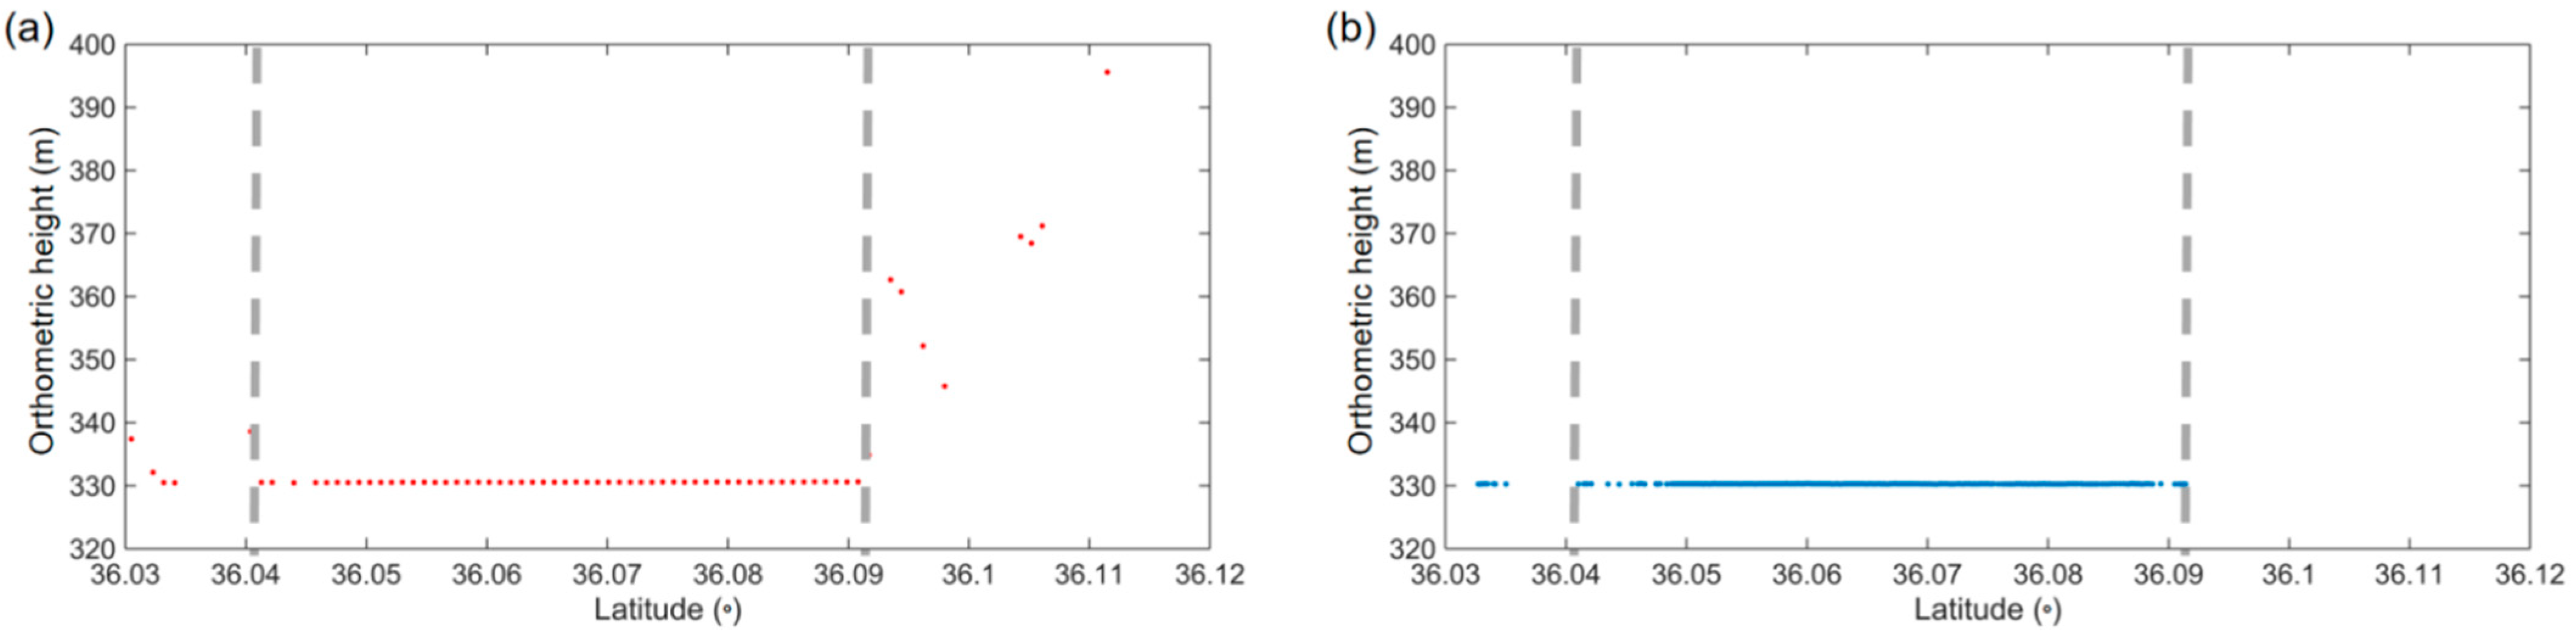
Figure 5 illustrates the observations of water surface heights from ATL08 and ATL13 products, where Lake Mead (i.e., the first lake in
Figure 6) in the United States was selected as an example. According to the Algorithm Theoretical Basis Document (ATBD) for the ATL08 and ATL13 products [
34,
36], ATL13 products provide the WGS84 ellipsoidal heights h, EGM2008 orthometric heights H (used in this study), and the geoid N along the track, whereas ATL08 products only provide the WGS84 ellipsoidal heights h.
It should be noted that, in
Figure 5, the WGS84 ellipsoidal heights from ATL08 products were transformed into orthometric heights (via the VDatum Tool) to make the ATL08 and ATL13 observations comparable. From
Figure 5, near the lake boundary (the vertical dash lines), the ATL08 product contains the observations on land surfaces, whereas the ATL13 product accurately captures the water surface heights. In addition, in the ATL13 product, the surface height is calculated for variable segment lengths of 100 signal photons for the strong and weak beam, whereas in the ATL08 product, the surface height is calculated for a fixed along-track length of 100 m. As a result, in
Figure 5b the along-track interval of surface height observations may be different in the ATL13 product. With a footprint interval of 0.7 m in the along-track direction, the density of surface height observations in the ATL13 product in
Figure 5b is normally larger than that in the ATL08 product in
Figure 5a, especially for the strong beam data.
In a recent study [
28], the WGS84 ellipsoidal heights from ATL08 products were used to analyze the global water level changes. Unlike their study, the main aim of this study is to investigate the availability of ICESat-2 ATL13 products in water level estimation. The difference between the ATL08-derived results in Cooley et al.’s study [
28] and the ATL13-derived results in this study was assessed and compared. As mentioned above, no spatial screening for surface water was conducted for ATL08 products, and in
Figure 5a, some outliers from other land-covers exist near the water surface. In Cooley et al.’s study, lake/reservoir boundaries were generated from the Global Surface Water Occurrence (GSWO) product [
38], and the spatial screening was conducted to separate the water surface heights. Specifically, the binarized GSWO pixel that corresponds to water surfaces in over 75% of the total observations over a 30-year period was regarded as water areas, and this mask was further used to discard the potential effect of land contamination. If the boundaries of lakes and reservoirs were produced, the spatial screening can be conducted to separate water surface heights.
For the selected 33 lakes and reservoirs with in situ measurements in the United States and Australia (in
Figure 3), 27 of the total 33 lakes and reservoirs were covered by the ATL08-derived water level results by Cooley et al. [
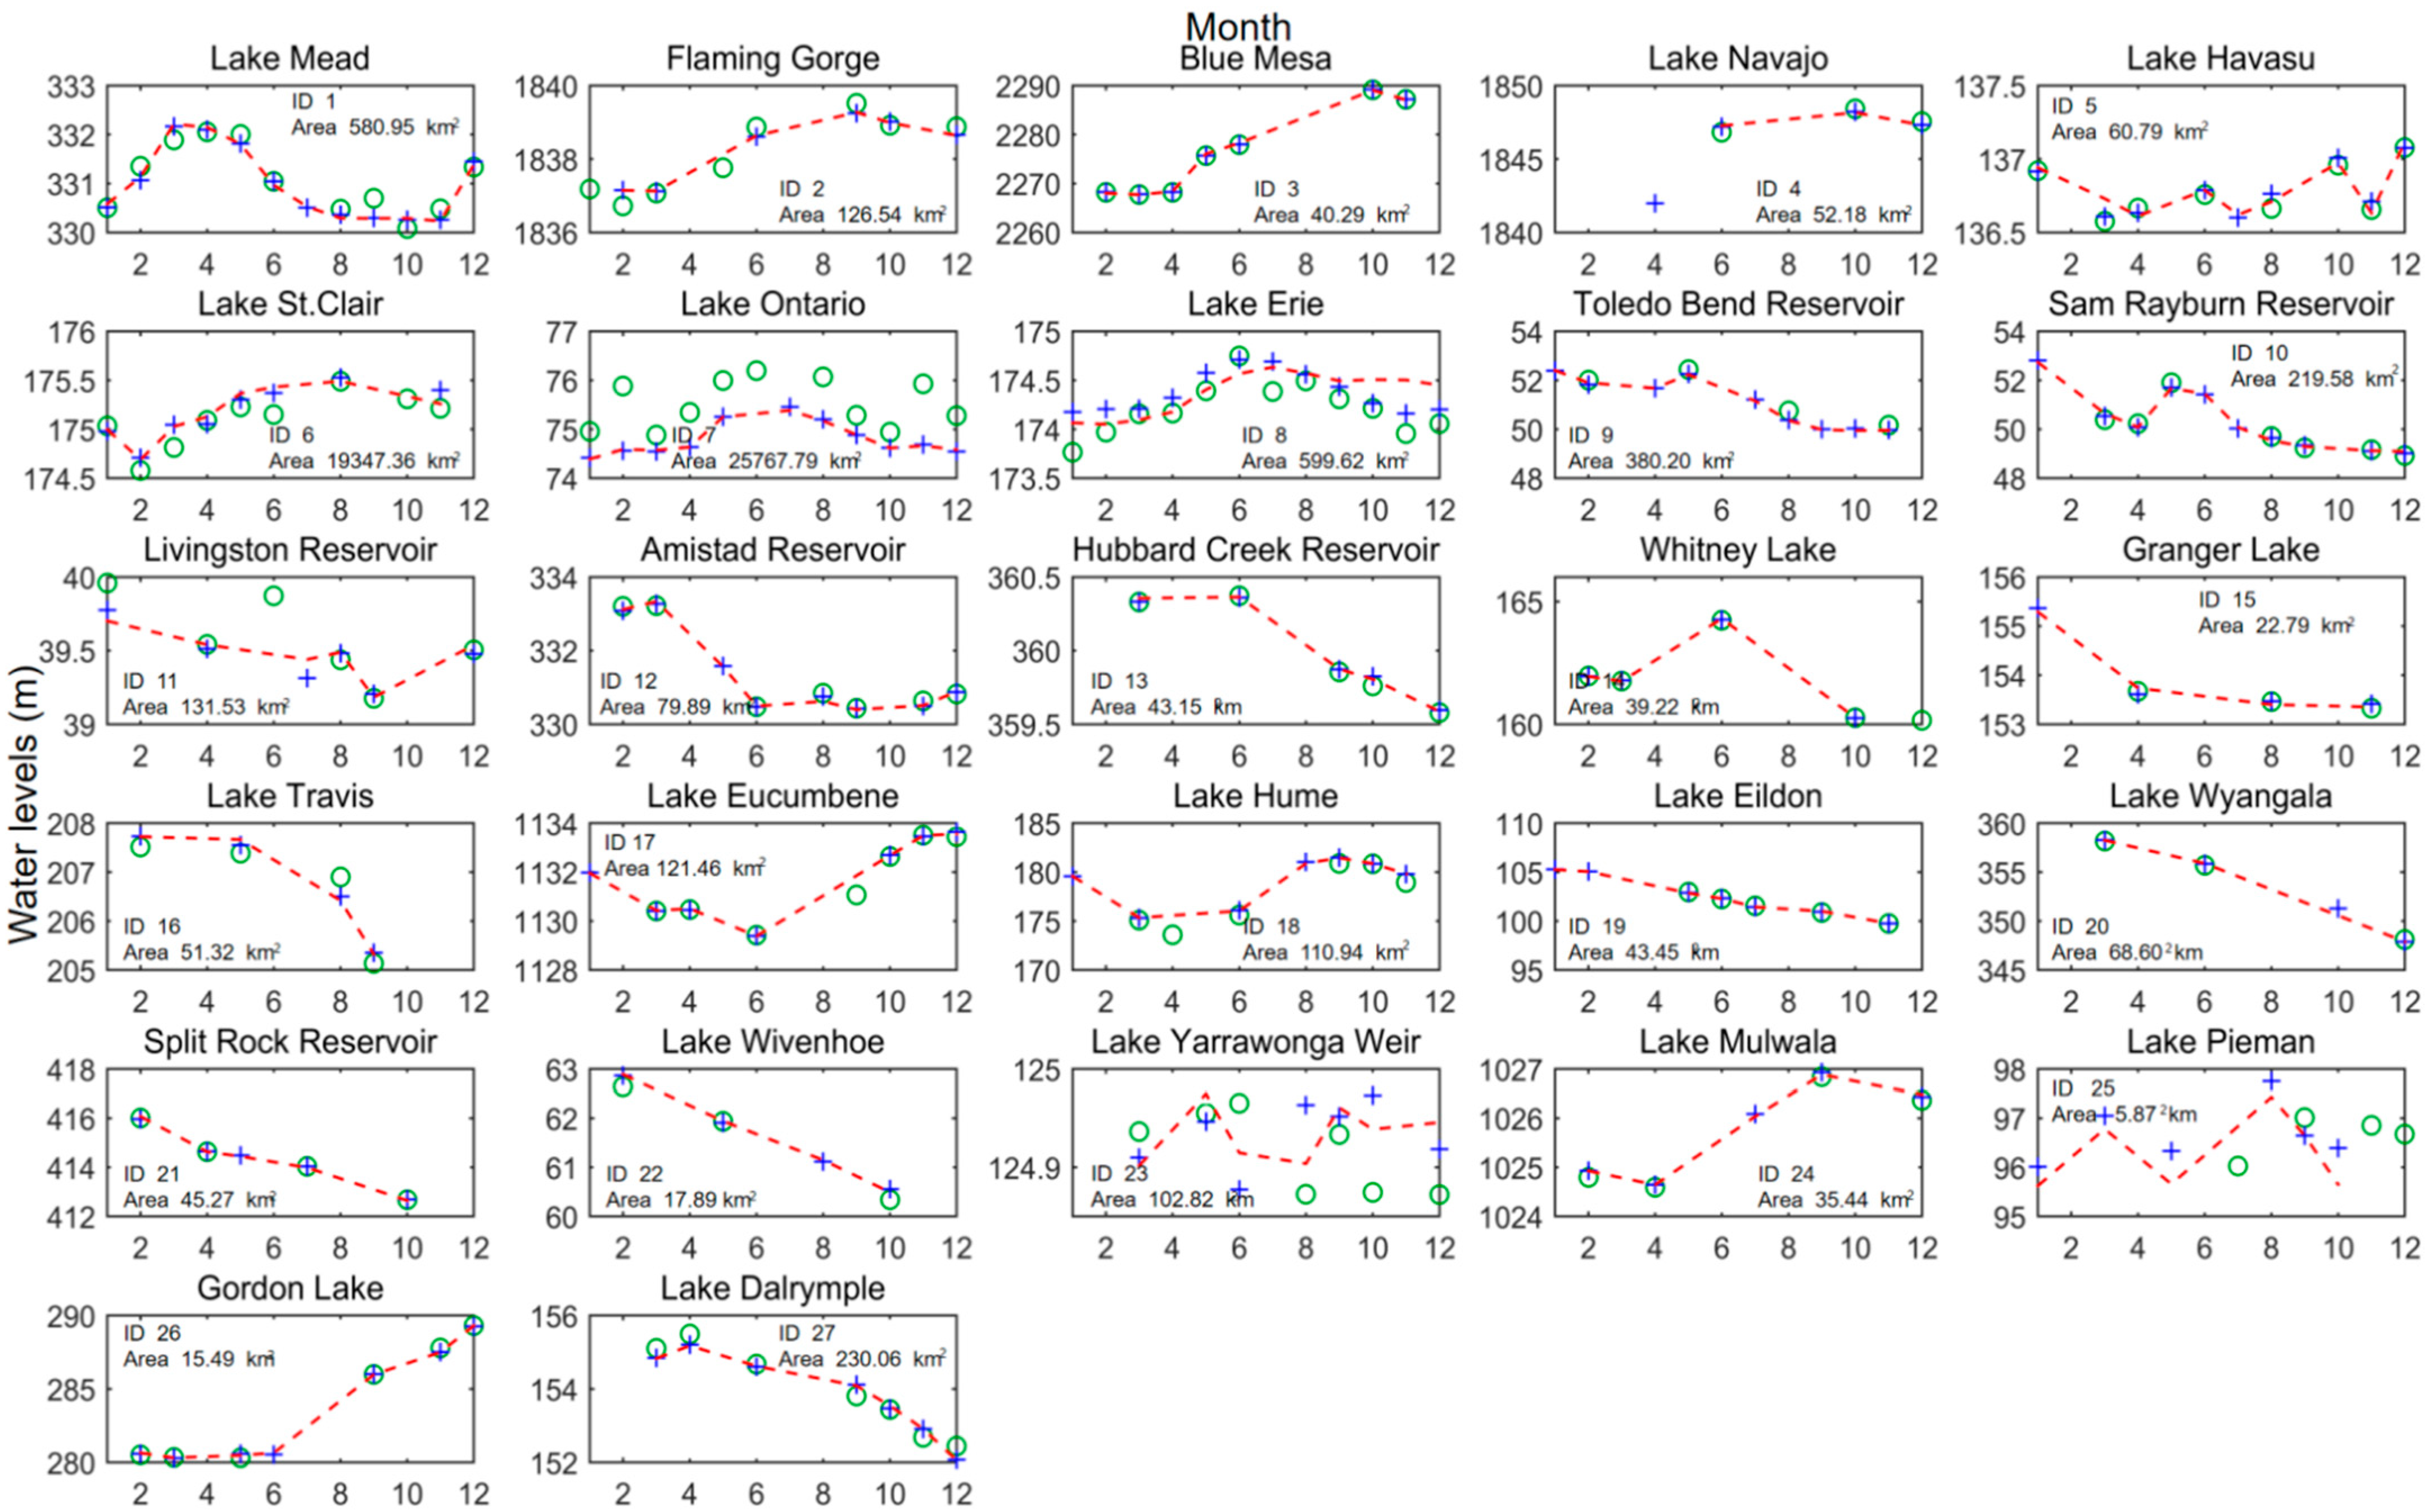
28]. Among them, 16 lakes and reservoirs were in the United States (ID: 1–16), and 11 lakes and reservoirs were in Australia (ID: 17–27). These 27 lakes/reservoirs, with available ATL13- and ATL08-derived water level results, were selected for comparisons and illustrated in
Figure 6, which exhibited a relatively good agreement. It should be noted that the water levels from ATL13 products in this study were based on orthometric heights with respect to the EGM2008 geoid, the water levels from ATL08 products calculated by Cooley et al. [
28] were originally based on the WGS84 ellipsoidal heights and transformed into orthometric heights via the VDatum Tool (
https://vdatum.noaa.gov/vdatumweb/ (accessed on 27 January 2021)).
In
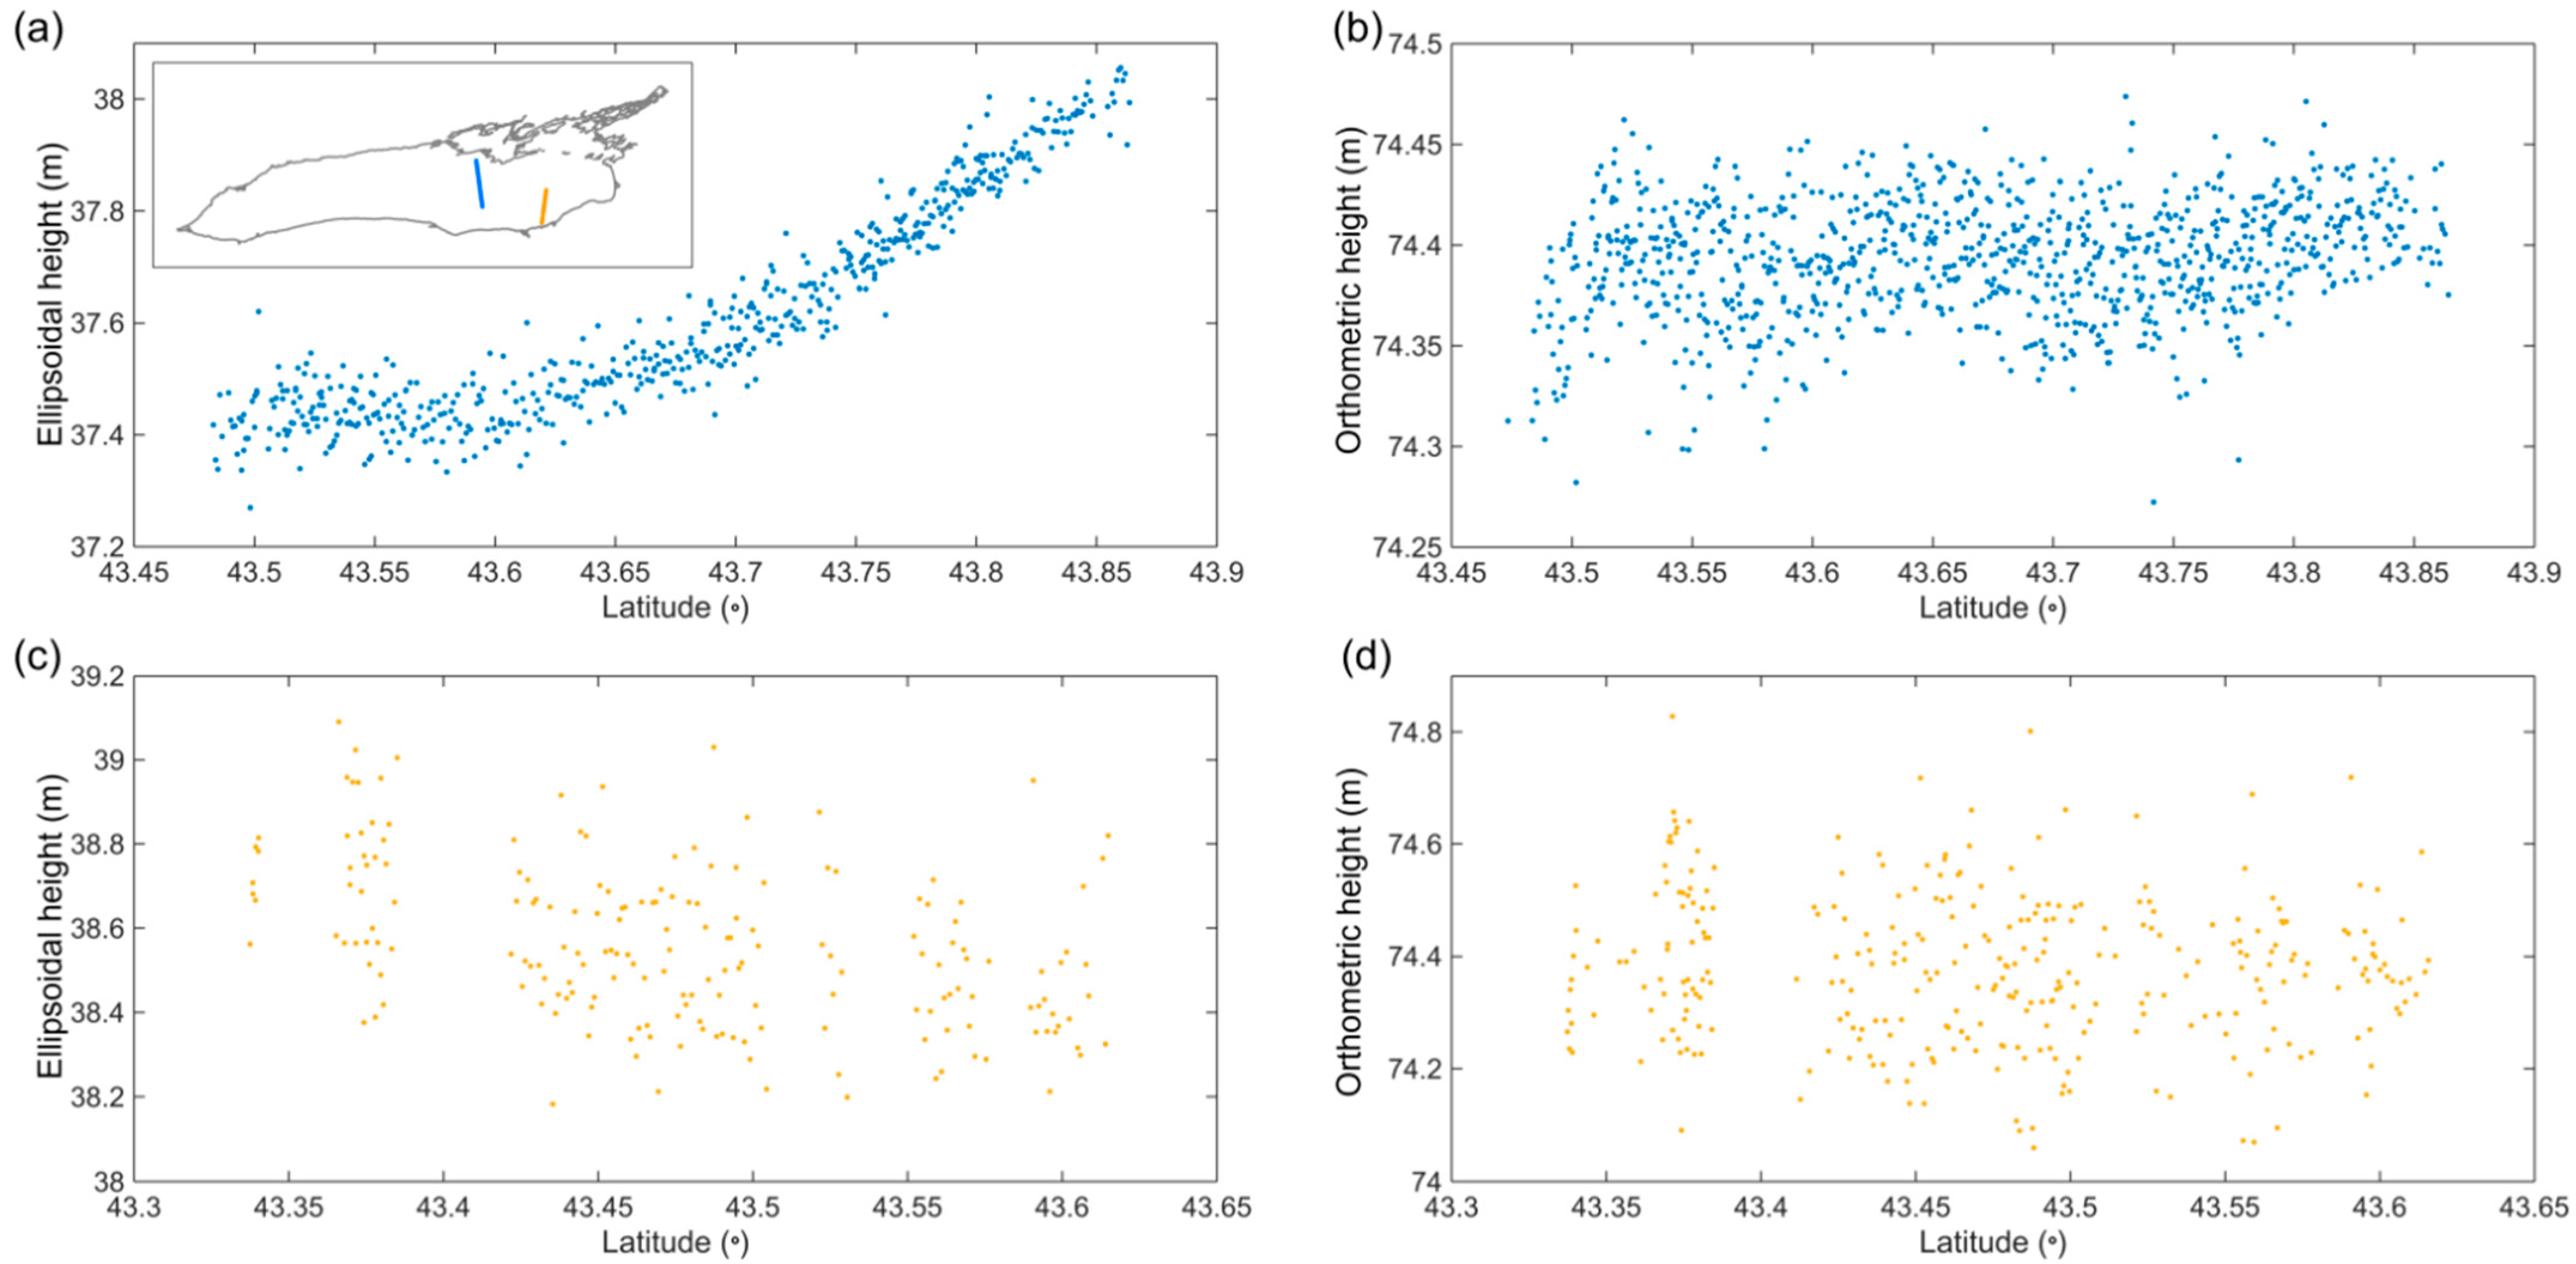
Figure 6, an obvious height bias between the ATL08-derived results and the in situ measurements exists in the seventh lake (i.e., Lake Ontario). To investigate this phenomenon,
Figure 7 demonstrates the observations from the ATL13 and ATL08 products in Lake Ontario, which clearly reflect the difference between ellipsoidal heights (by Cooley et al.) and orthometric heights (in this study). In
Figure 7a, on 5 January 2019, the elevation range of the lake water based on ellipsoidal heights is 0.79 m, i.e., the water level at the north end is higher than that at the south end. In
Figure 7b, on the same day, the elevation range of lake water based on orthometric heights is only 0.20 m. In addition, from
Figure 7b,d, the average orthometric heights of lake water on 5 January 2019 and 6 February 2019 were 74.39 and 74.38 m, respectively, which indicates a very slight difference. By comparison, from
Figure 7a,c, the average ellipsoidal heights of lake water on 5 January 2019 and 6 February 2019 were 37.61 and 38.56 m, respectively, which shows a significant difference of 0.95 m. This difference can well explain the height difference between January and February in Lake Ontario in
Figure 6, where the first green circle (January) has an orthometric height of approximately 75 m and the second green circle (February) has an orthometric height of nearly 76 m. The water level of Lake Ontario normally should have a slight change in the winter (i.e., between January and February). It can be explained that, due to the gravity effect that is not accounted for in ellipsoidal heights, the water level of large lakes/reservoirs is not a stable value.
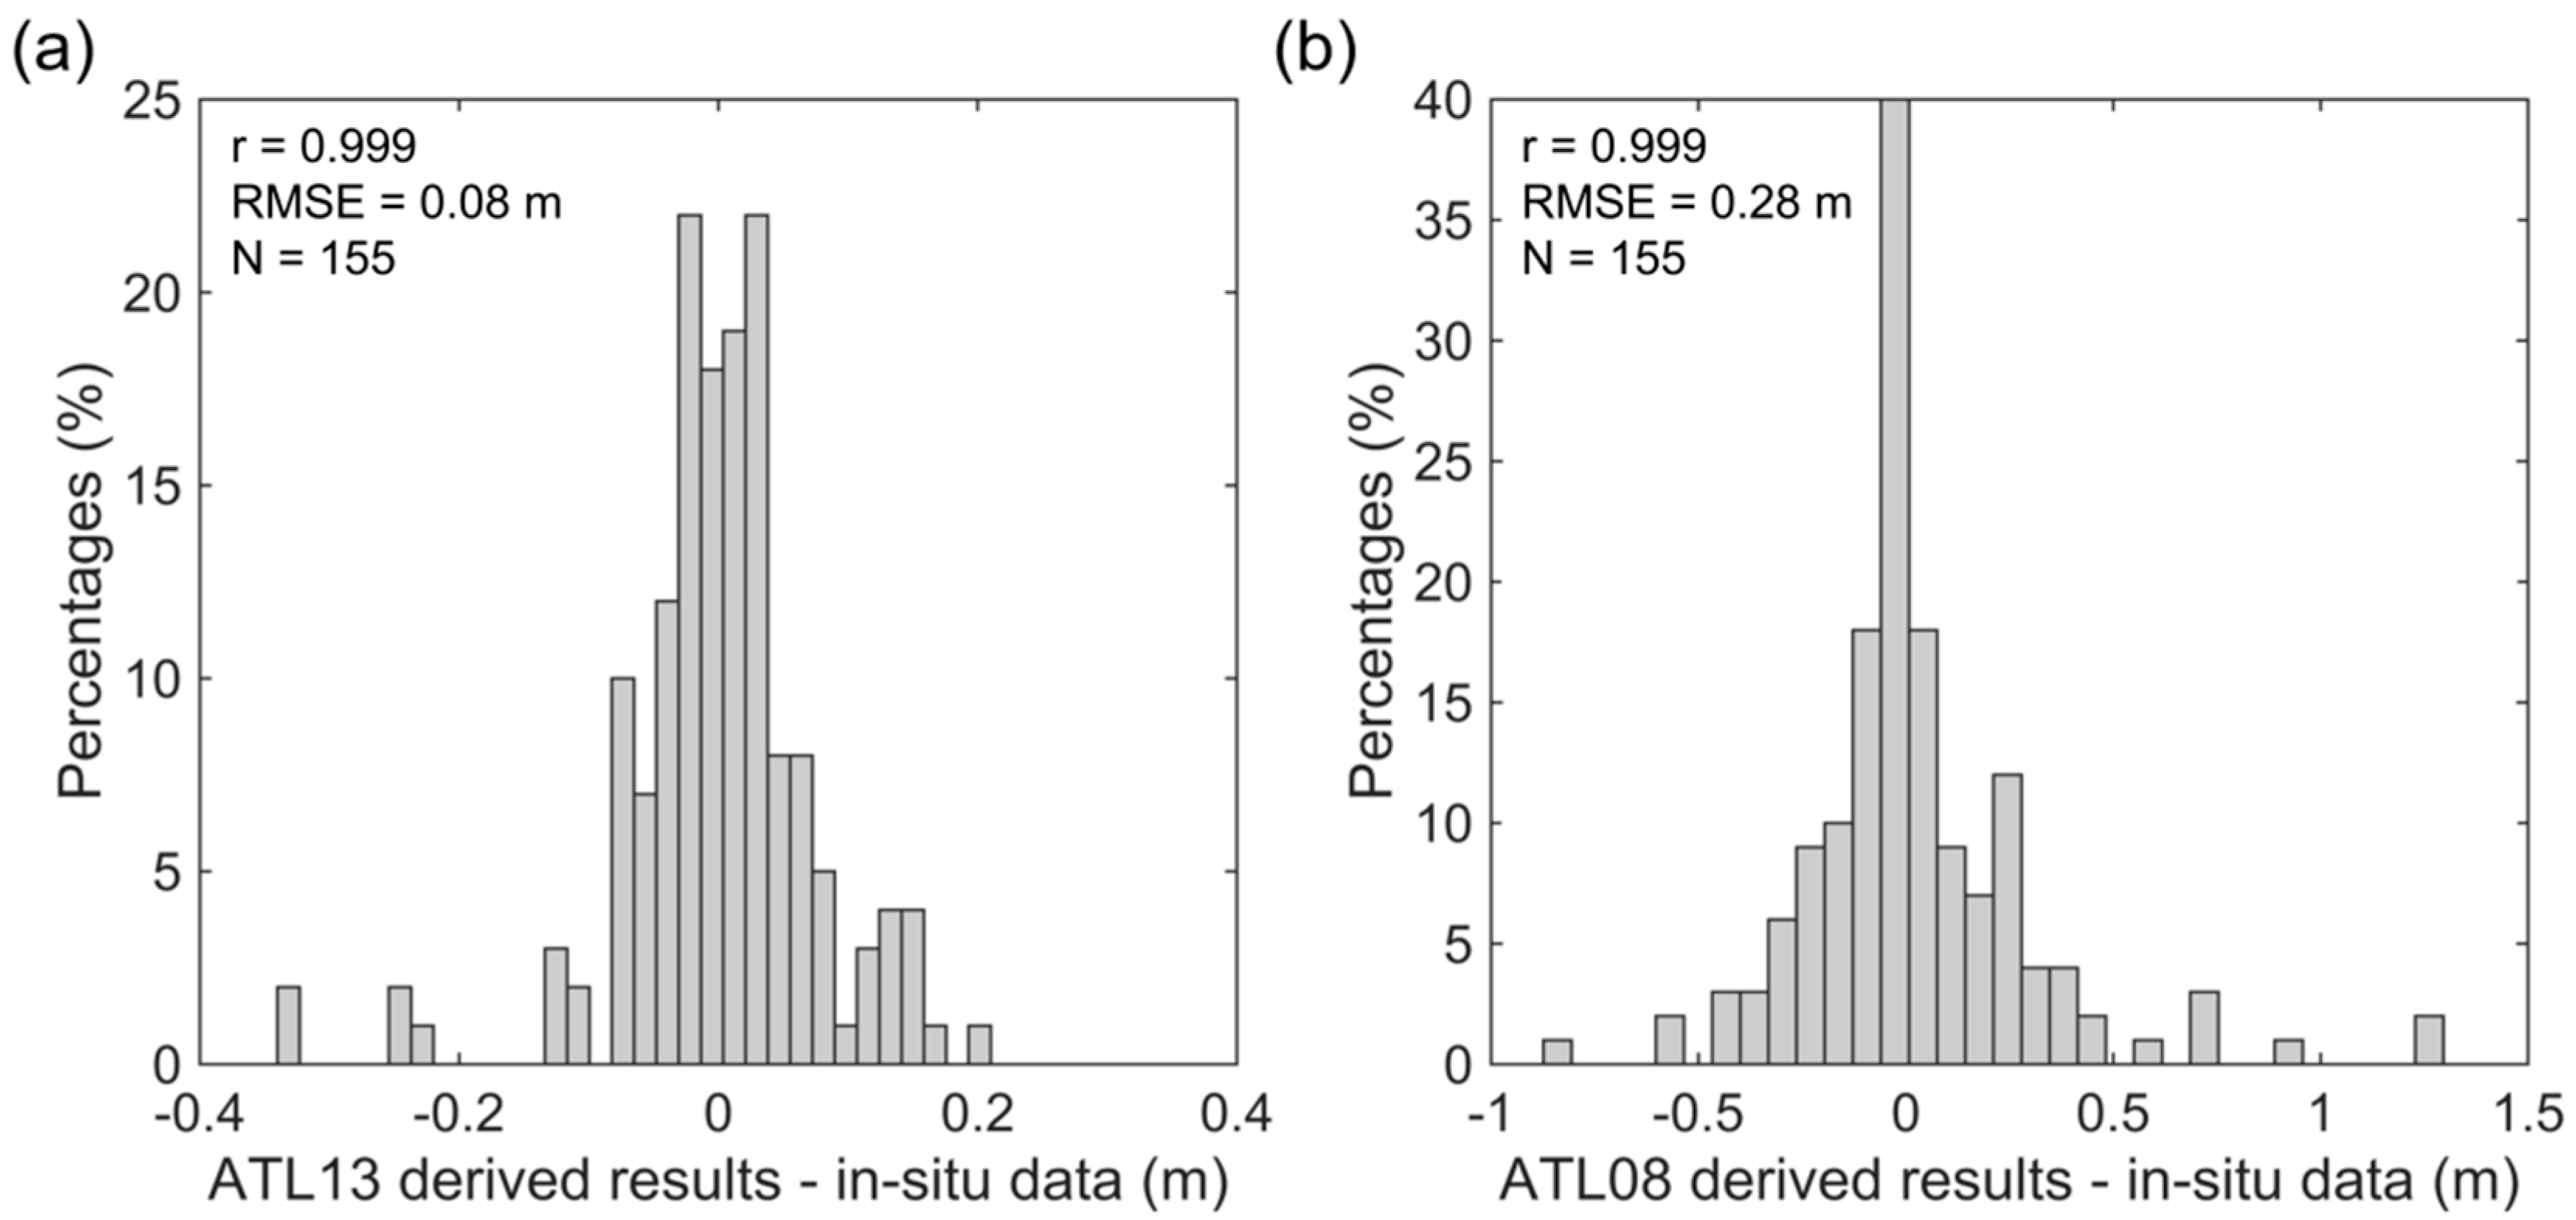
To quantitatively evaluate the accuracy of monthly water levels,
Figure 8a shows a comparison between the monthly water levels in 2019 from our ATL13-derived results and the in situ water level data, whereas
Figure 8b shows the comparison between the monthly water levels in 2019 from the ATL08-derived results [
28] and the in situ water level data for these 27 lakes/reservoirs in the United States and Australia.
Figure 8 indicates that both the ATL13 product and the ATL08 product can be used to estimate monthly water levels, but the water levels derived from ATL13 products (RMSE = 0.08 m, r = 0.999) exhibited a higher accuracy compared with water levels derived from ATL08 products (RMSE = 0.28 m, r = 0.999). After removing the result of the seventh lake (i.e., Lake Ontario) in
Figure 6, the RMSE of the remaining 26 lakes/reservoirs between water level changes from ATL08 products and in situ data is 0.20 m, which is better than the original value of 0.28 m. However, this value is still larger than the RMSE between the water level changes from ATL13 products and the in situ data.
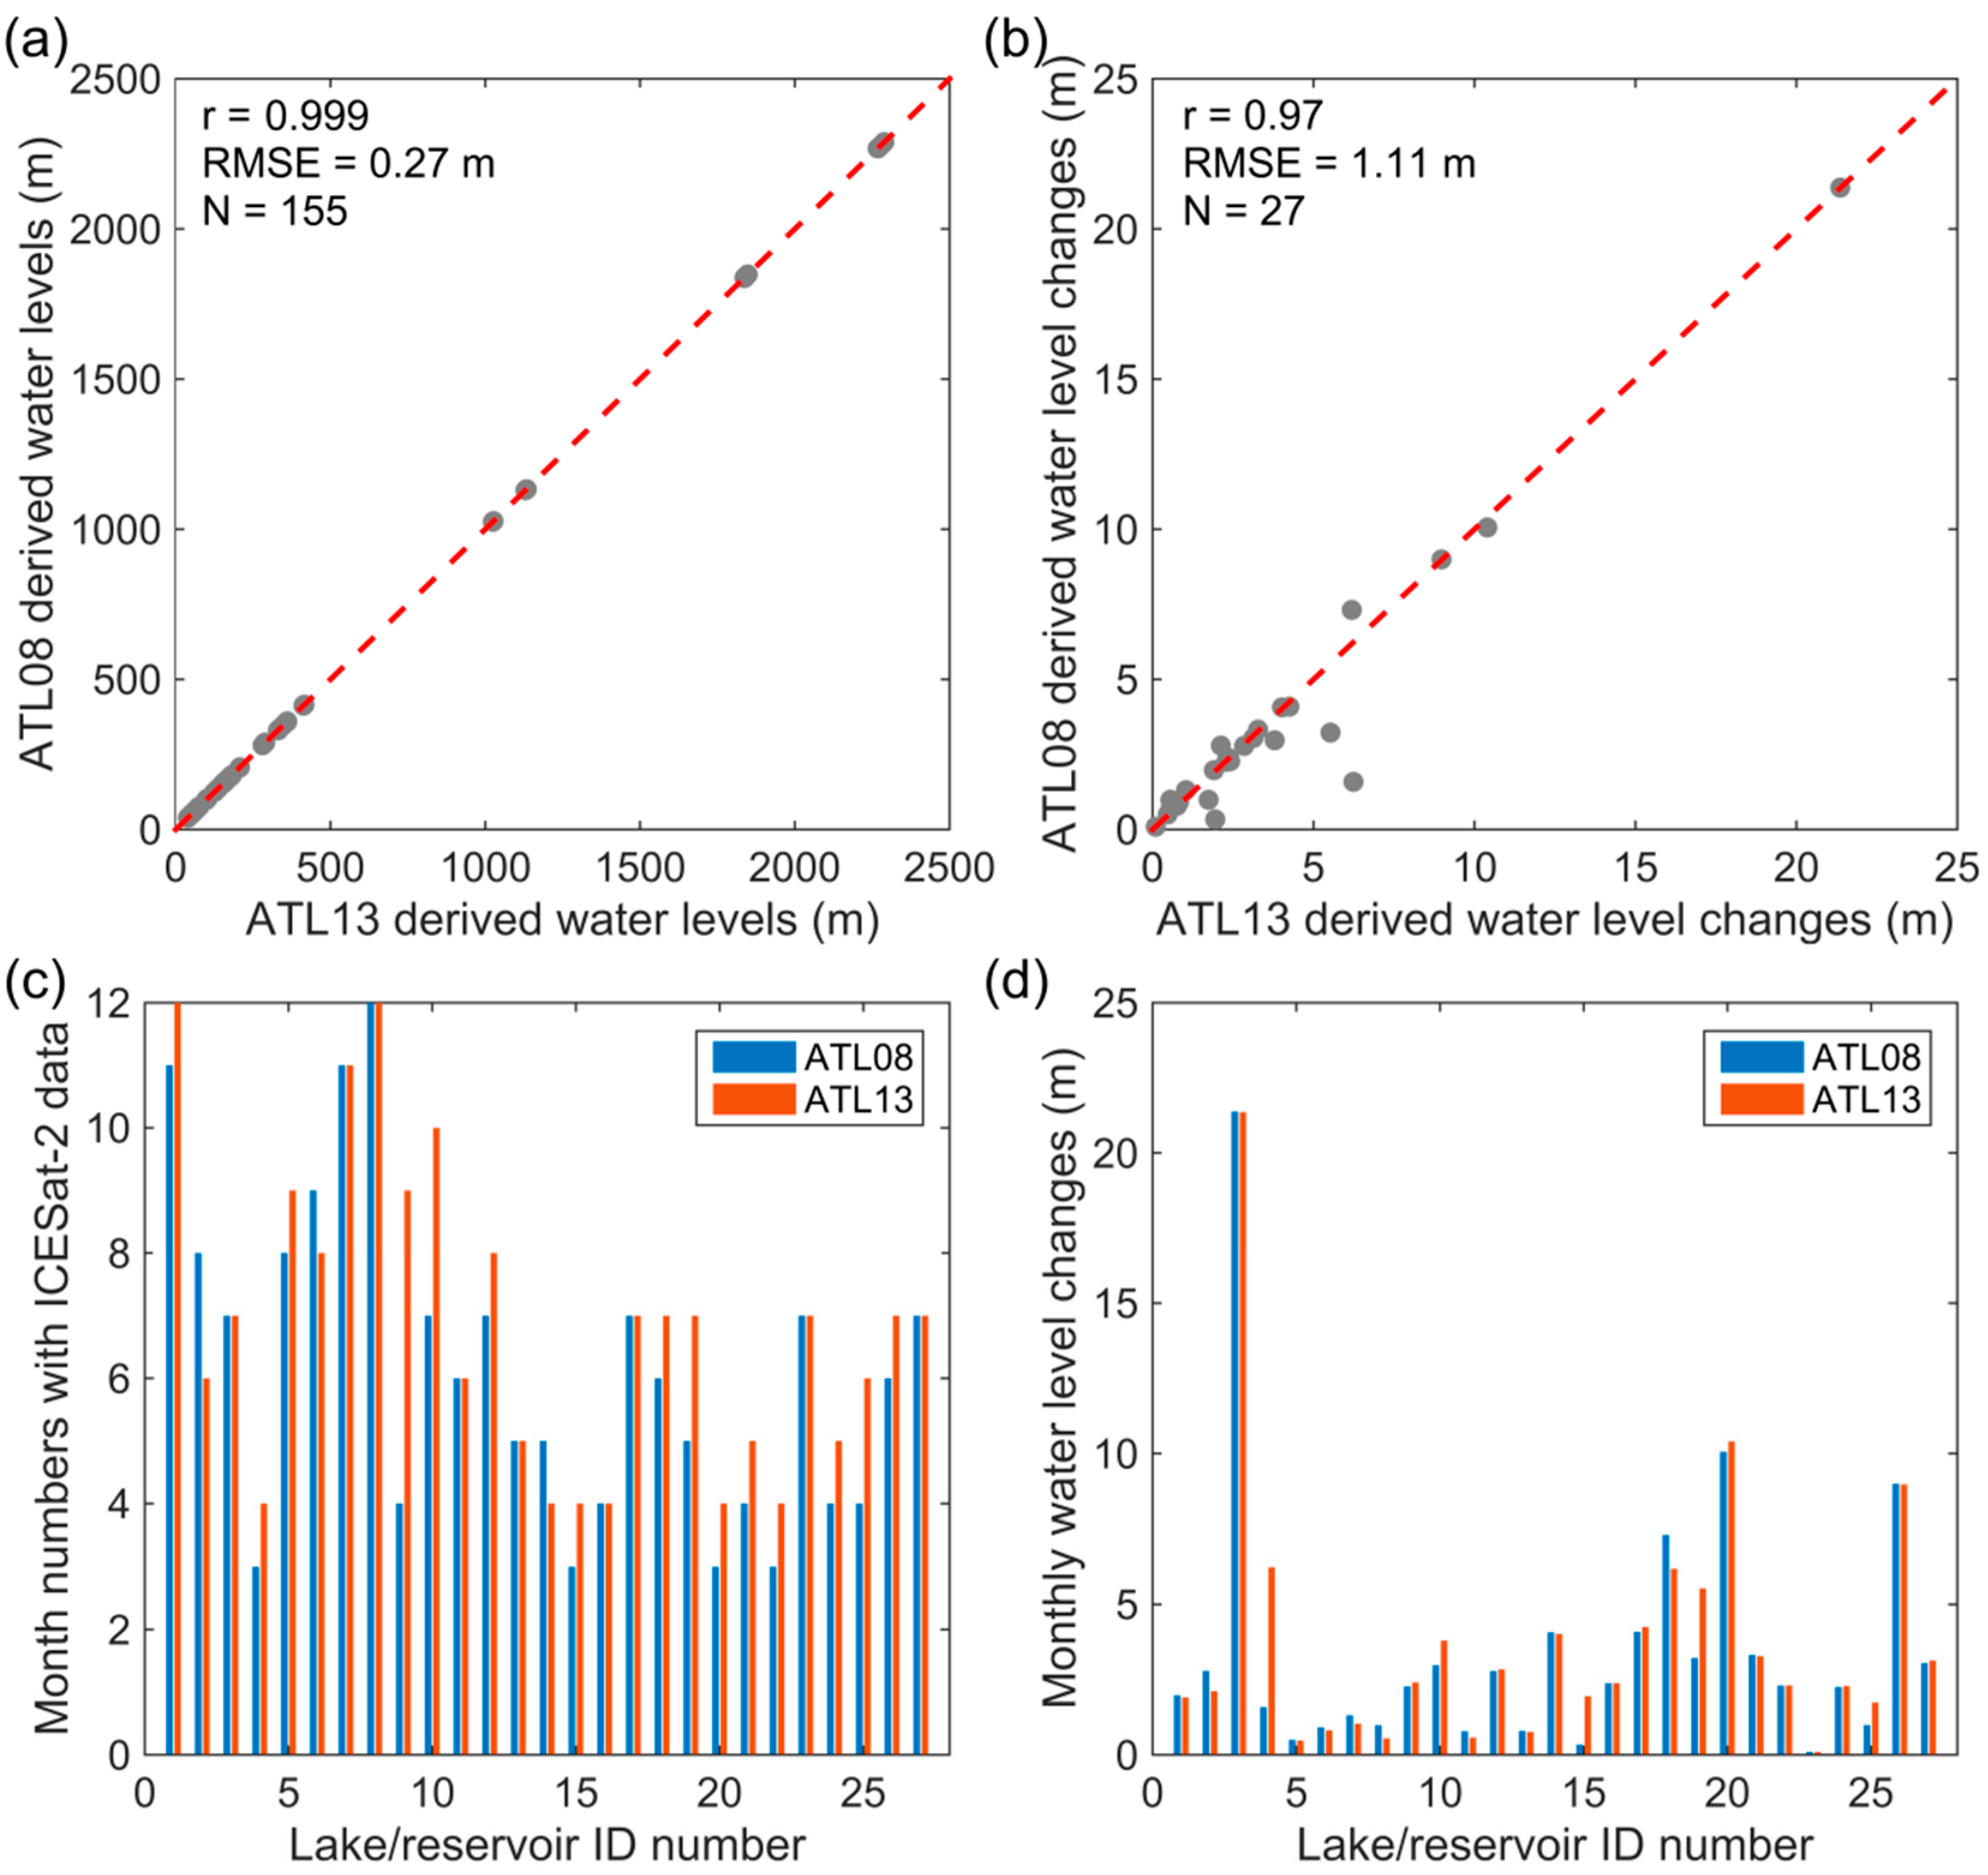
We also summarized the comparisons between the monthly water levels derived from the ATL08 and ATL13 products in
Figure 9. For the 27 selected lakes/reservoirs,
Figure 9a shows a scatter plot of 155 monthly water levels derived from the ATL08 and ATL13 products (corresponds to the intersection of the ATL08 and ATL13 results in
Figure 6), which exhibited an RMSE of 0.27 m and r of 0.999. In fact, this number (RMSE = 0.27 m) matches the 0.28-m RMSE of the ALT08 result well with respect to the in situ water levels in
Figure 8b.
Figure 9b shows a scatter plot of monthly water level changes of 27 lakes/reservoirs derived from the ATL08 and ATL13 products in 2019. From
Figure 9b, a general consistency can be observed between results from the two products.
Figure 9c shows the number of months with ICESat-2 data within a year in these 27 lakes/reservoirs, where the ATL08-derived results have a mean of 6.15 months and the ATL13 results have a mean of 6.85 months. As a result, in
Figure 9d, for the 27 selected lakes/reservoirs, the mean monthly water level changes derived from the ATL08 and ATL13 results were 3.46 and 3.76 m, respectively.
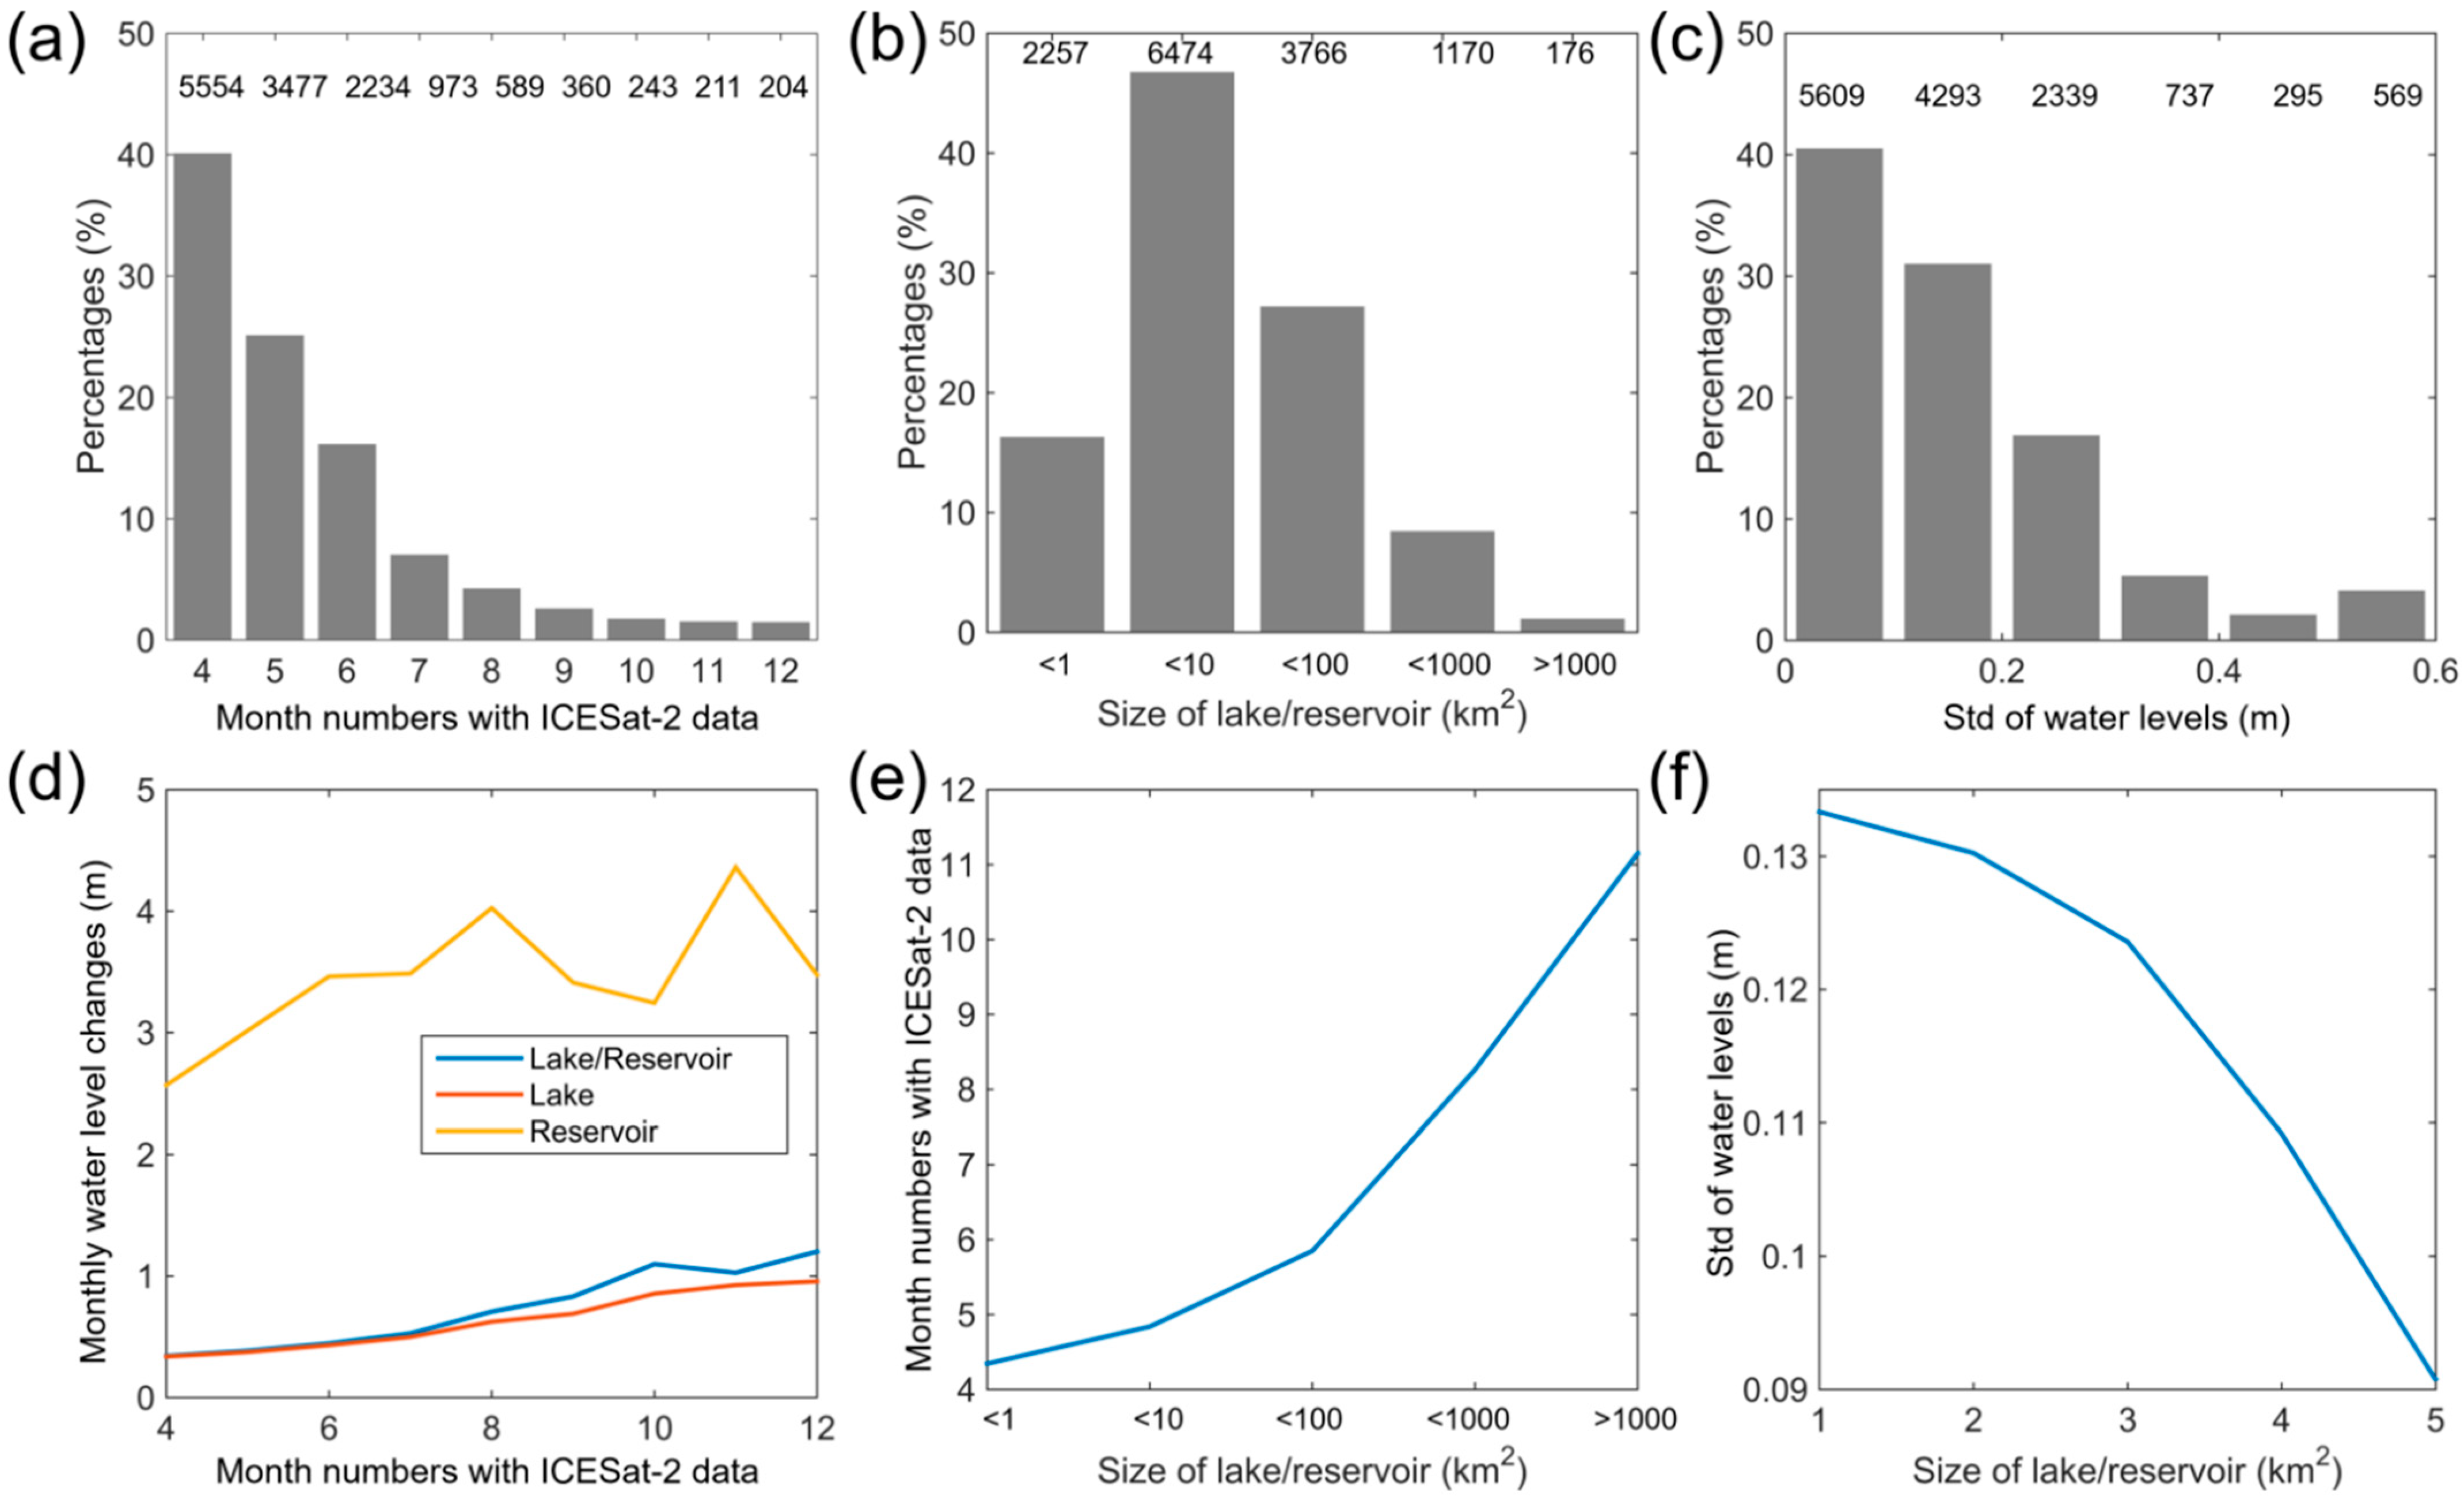
In this study, on average, there are 5.41 months of ICESat-2 observations within one year for these 13,843 lakes and reservoirs, which is significantly larger than 3.35 months of ICESat-2 observations in the study using ATL08 products [
28]. Regarding the difference between the number of months of water levels observed from the ATL13 and ATL08 products, the probable reason is that in our study, the HydroLAKES database that is imbedded in ATL13 products was used as the lake mask (i.e., the lake boundary) to select valid ICESat-2 observations. As mentioned above, the HydroLAKES integrates many widely used surface water datasets. In the previous study, using ATL08 products [
28], the GSWO product was used to produce the lake mask [
36]. Specifically, the binarized GSWO pixel that corresponds to water surfaces in over 75% of the total observations over a 30-year period was regarded as water areas (the lake mask). In reality, the GSWO applied a very critical criterion, which can underestimate the spatial extent of lakes and reservoirs and lose many valid ICESat-2 observations. In addition, in this study, the average valid number of months covered by ICESat-2 is 5.41 months and only 204 of 13,843 lakes and reservoirs had water levels in all months in 2019.
In
Section 3.3, we have found that a lake/reservoir covered by ICESat-2 data for a higher number of months within a year is more likely to better track the monthly water level change. The selection of lake/reservoir boundaries can influence the number of months with valid ICESat-2 observations, and further has an impact on estimating the monthly water level changes in one year. Specifically, in
Figure 9, the water level changes from the GSWO-based lake mask by Cooley et al. [
28] were lower than the results from the HydroLAKES-based lake mask in this study. It means that the ICESat-2-derived water level changes exhibited an underestimation across the globe, which needs to be improved in the future. Additionally, dynamic lake/reservoir boundaries derived from temporal consistent remote sensing imagery are urgently needed to better estimate water level changes [
38,
39,
40,
41]. In addition, owing to various natural processes and human activities, the water boundaries of lake/reservoir can change over time, which may influence the final water level results. In this study, monthly water levels were estimated from ATL13 products and the accuracy at the same temporal resolution (i.e., monthly averages) was evaluated using in situ measurements. However, the monthly averaged water levels may lose information arising from large water input (such as strong rain event and large runoff) and water output (such as large evaporation). Hence, it is needed to conduct future works on the combination of daily water levels and hydrological models for improving the ability to reveal hydrological phenomenon at a higher temporal resolution.
5. Conclusions
In this study, we provided a quantitative analysis on global lake/reservoir monthly water level changes and assessed the performance of ICESat-2 ATL13 products. Specifically, 1336 ICESat-2 ATL13 products were used to reveal monthly water level changes for global lakes and reservoirs in 2019. After the selecting procedures, only 13,843 (about 1% of the total 1,427,688 water bodies in HydroLAKES) lakes and reservoirs with all-season ICESat-2 ATL13 products were finally selected. With small footprints of less than 17 m and six laser tracks in the cross-track direction, ICESat-2 can obtain water surface observations and monitor water level changes for some small lakes and reservoirs (i.e., less than 1 km
2). In this study, the water level changes of 2257 lakes and reservoirs are smaller than 1 km
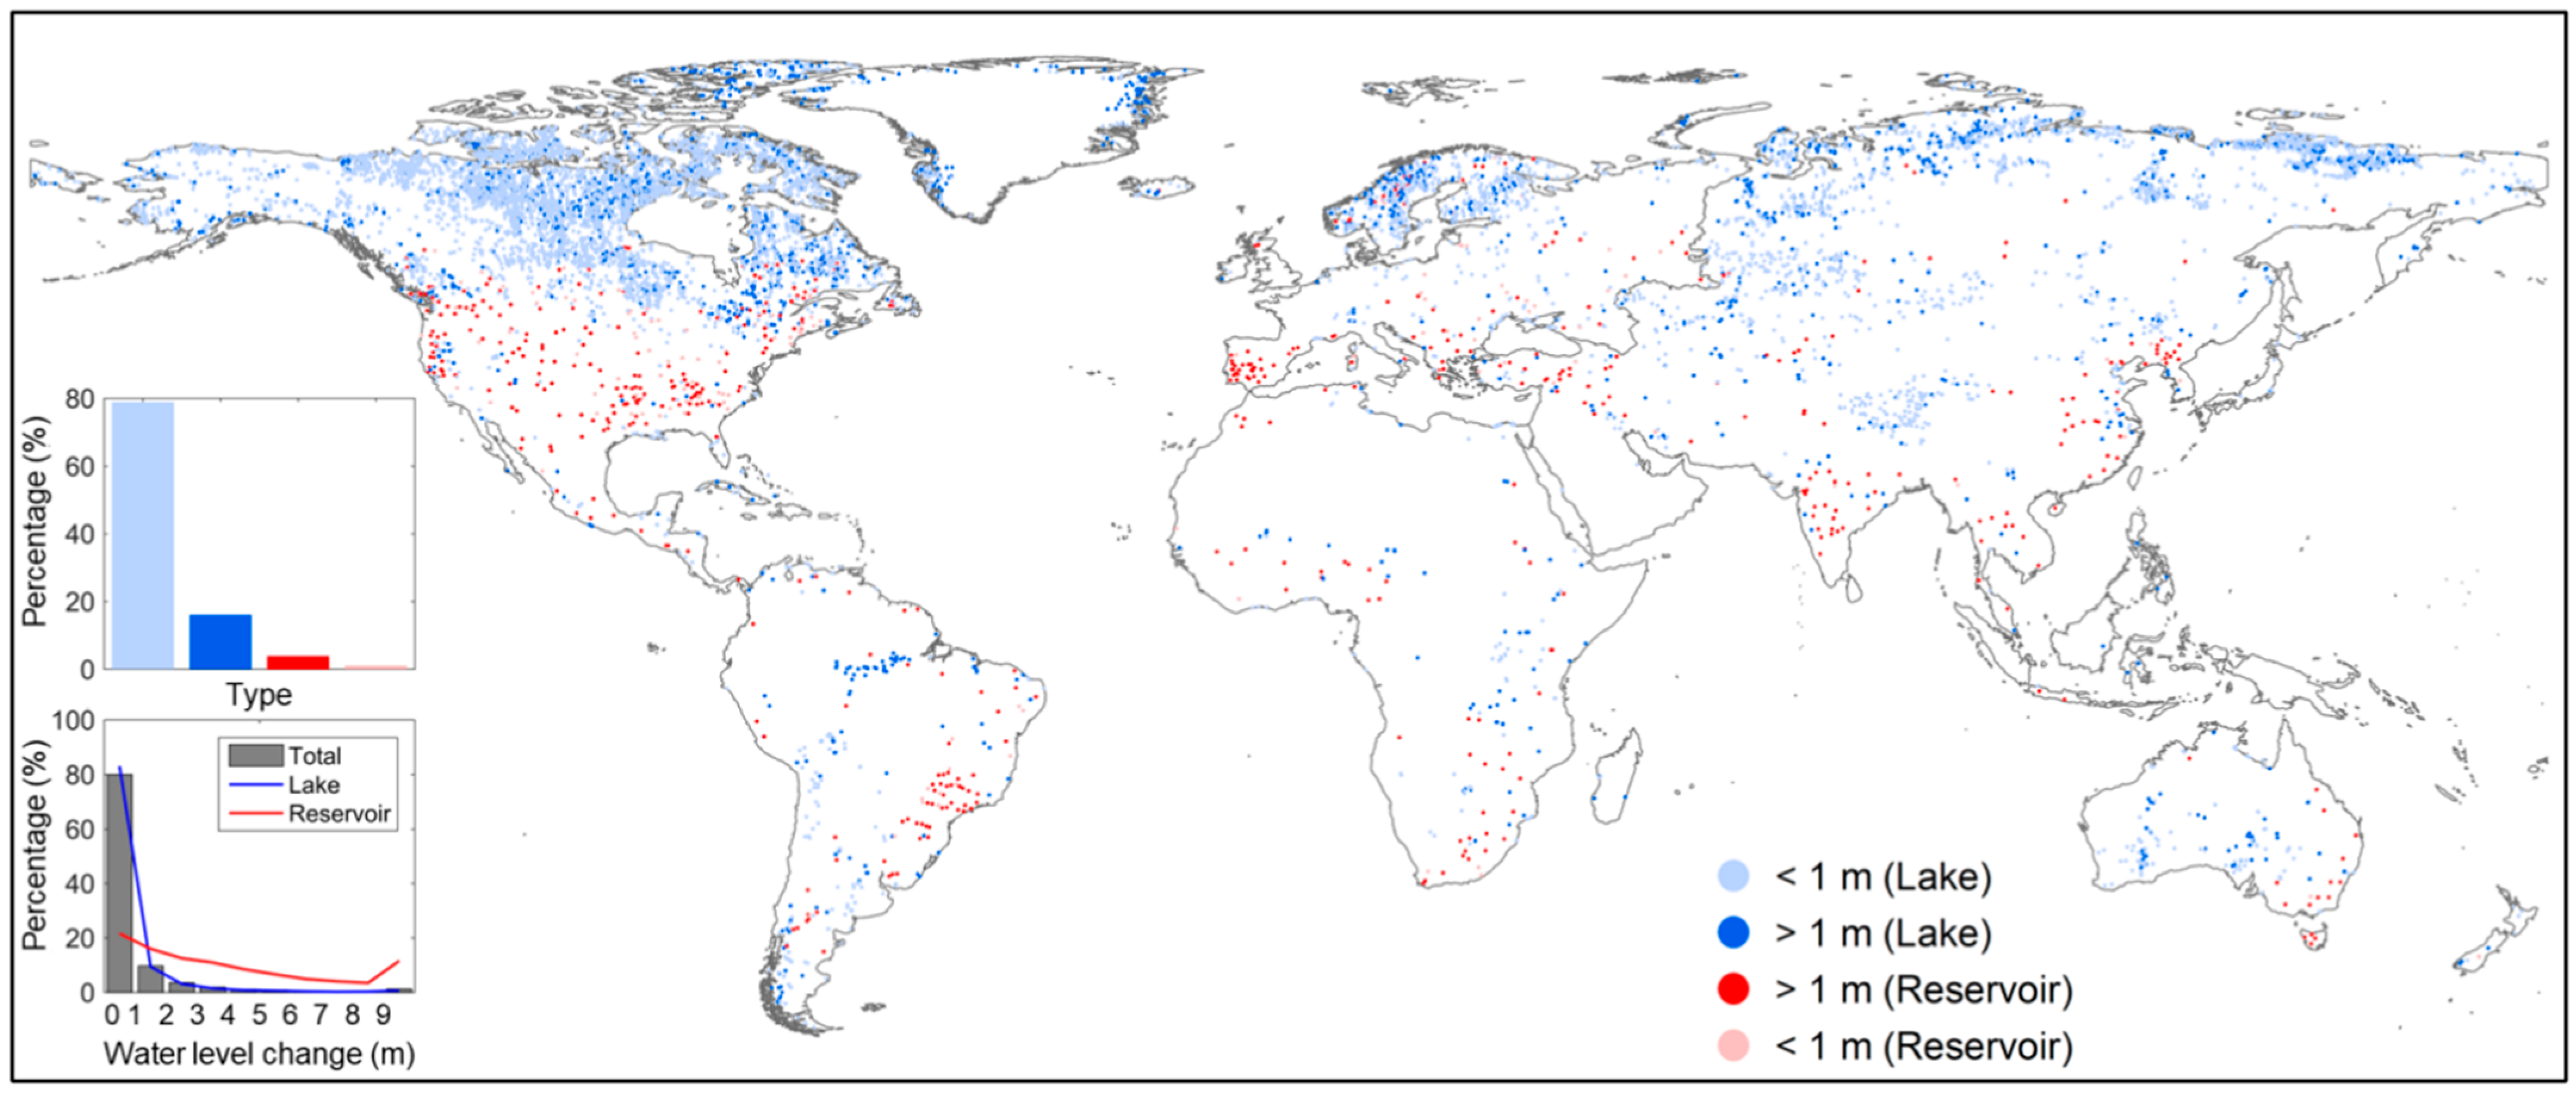
2, which occupies over 16% of the total 13,843 lakes and reservoirs. By comparing with the in situ water level data of 21 gauge stations across the United States and 12 gauge stations across Australia, we confirmed that the ATL13 product performed very well in estimating the monthly water levels (RMSE = 0.08 m, r = 0.999). For 13,148 global lakes in total, only 16.96% (2230) of lakes experienced monthly water level changes greater than 1 m. For 695 global reservoirs in total, 78.42% (545) of reservoirs experienced monthly water level changes greater than 1 m. Across the globe, the mean water level change of 13,148 lakes and 695 reservoirs are 0.81 and 4.28 m, respectively. In this study, on average, there are 5.41 months of ICESat-2 observations within one year for these 13,843 lakes and reservoirs, which is significantly larger than 3.35 months of ICESat-2 observations in another study using ATL08 products [
28]. A higher number of months covered by ICESat-2 is more likely to track the maximum and minimum water levels in one year. As a result, the results of the estimated monthly water level changes may be underestimated in this study.
According to our calculations, we found that water levels derived from ATL13 products exhibited a higher accuracy compared to ATL08 products. We took Lake Mead and Lake Ontario as an example to demonstrate the difference between the ATL08 and ATL13 products and investigated the influence on estimating water levels and changes. Compared to the ATL08 product, the ATL13 product was specifically processed for the Earth surface water; therefore, it has many advantages on water level monitoring. (1) With the help of the mask of inland water bodies, most noises induced by the land near boundaries of lakes and reservoirs were discarded. The ATL13 product can be directly used to estimate water levels of lakes and reservoirs without additional spatial screening, but a basic filter to further discard outliers is still recommended. (2) The orthometric height H from the ATL13 product is available and can be directly used. Due to the gravity effect that is not accounted for in ellipsoidal heights h, the water level of large lakes/reservoirs is not a stable value, especially for some great lakes with a large spatial extent. The difference between ellipsoidal heights h and orthometric heights H can be corrected by using a specific geoid model N as h = H + N, and the ATL13 is referenced to the EGM2008 geoid. The ATL08 product directly provides water surface observations on the WGS84 ellipsoidal height, which should be further corrected using the geoid N from the datasets along the track. In addition, the in situ water level data were normally measured on orthometric heights. (3) Several data quality parameters specific to water surfaces are included in the ATL13 product, which are not involved in the ATL08 product. In the future, remote sensing imagery can be used to produce accurate and timely boundaries for lakes and reservoirs corresponding to the acquisition time of ICESat-2 data to improve the estimation of water level changes. In addition, our study can be extended to obtain water level changes of rivers and sea level changes in coastal regions.


