
Feature Fusion Approach for Temporal Land Use Mapping in Complex Agricultural Areas

Abstract
:
1. Introduction
2. Data and Study Sites
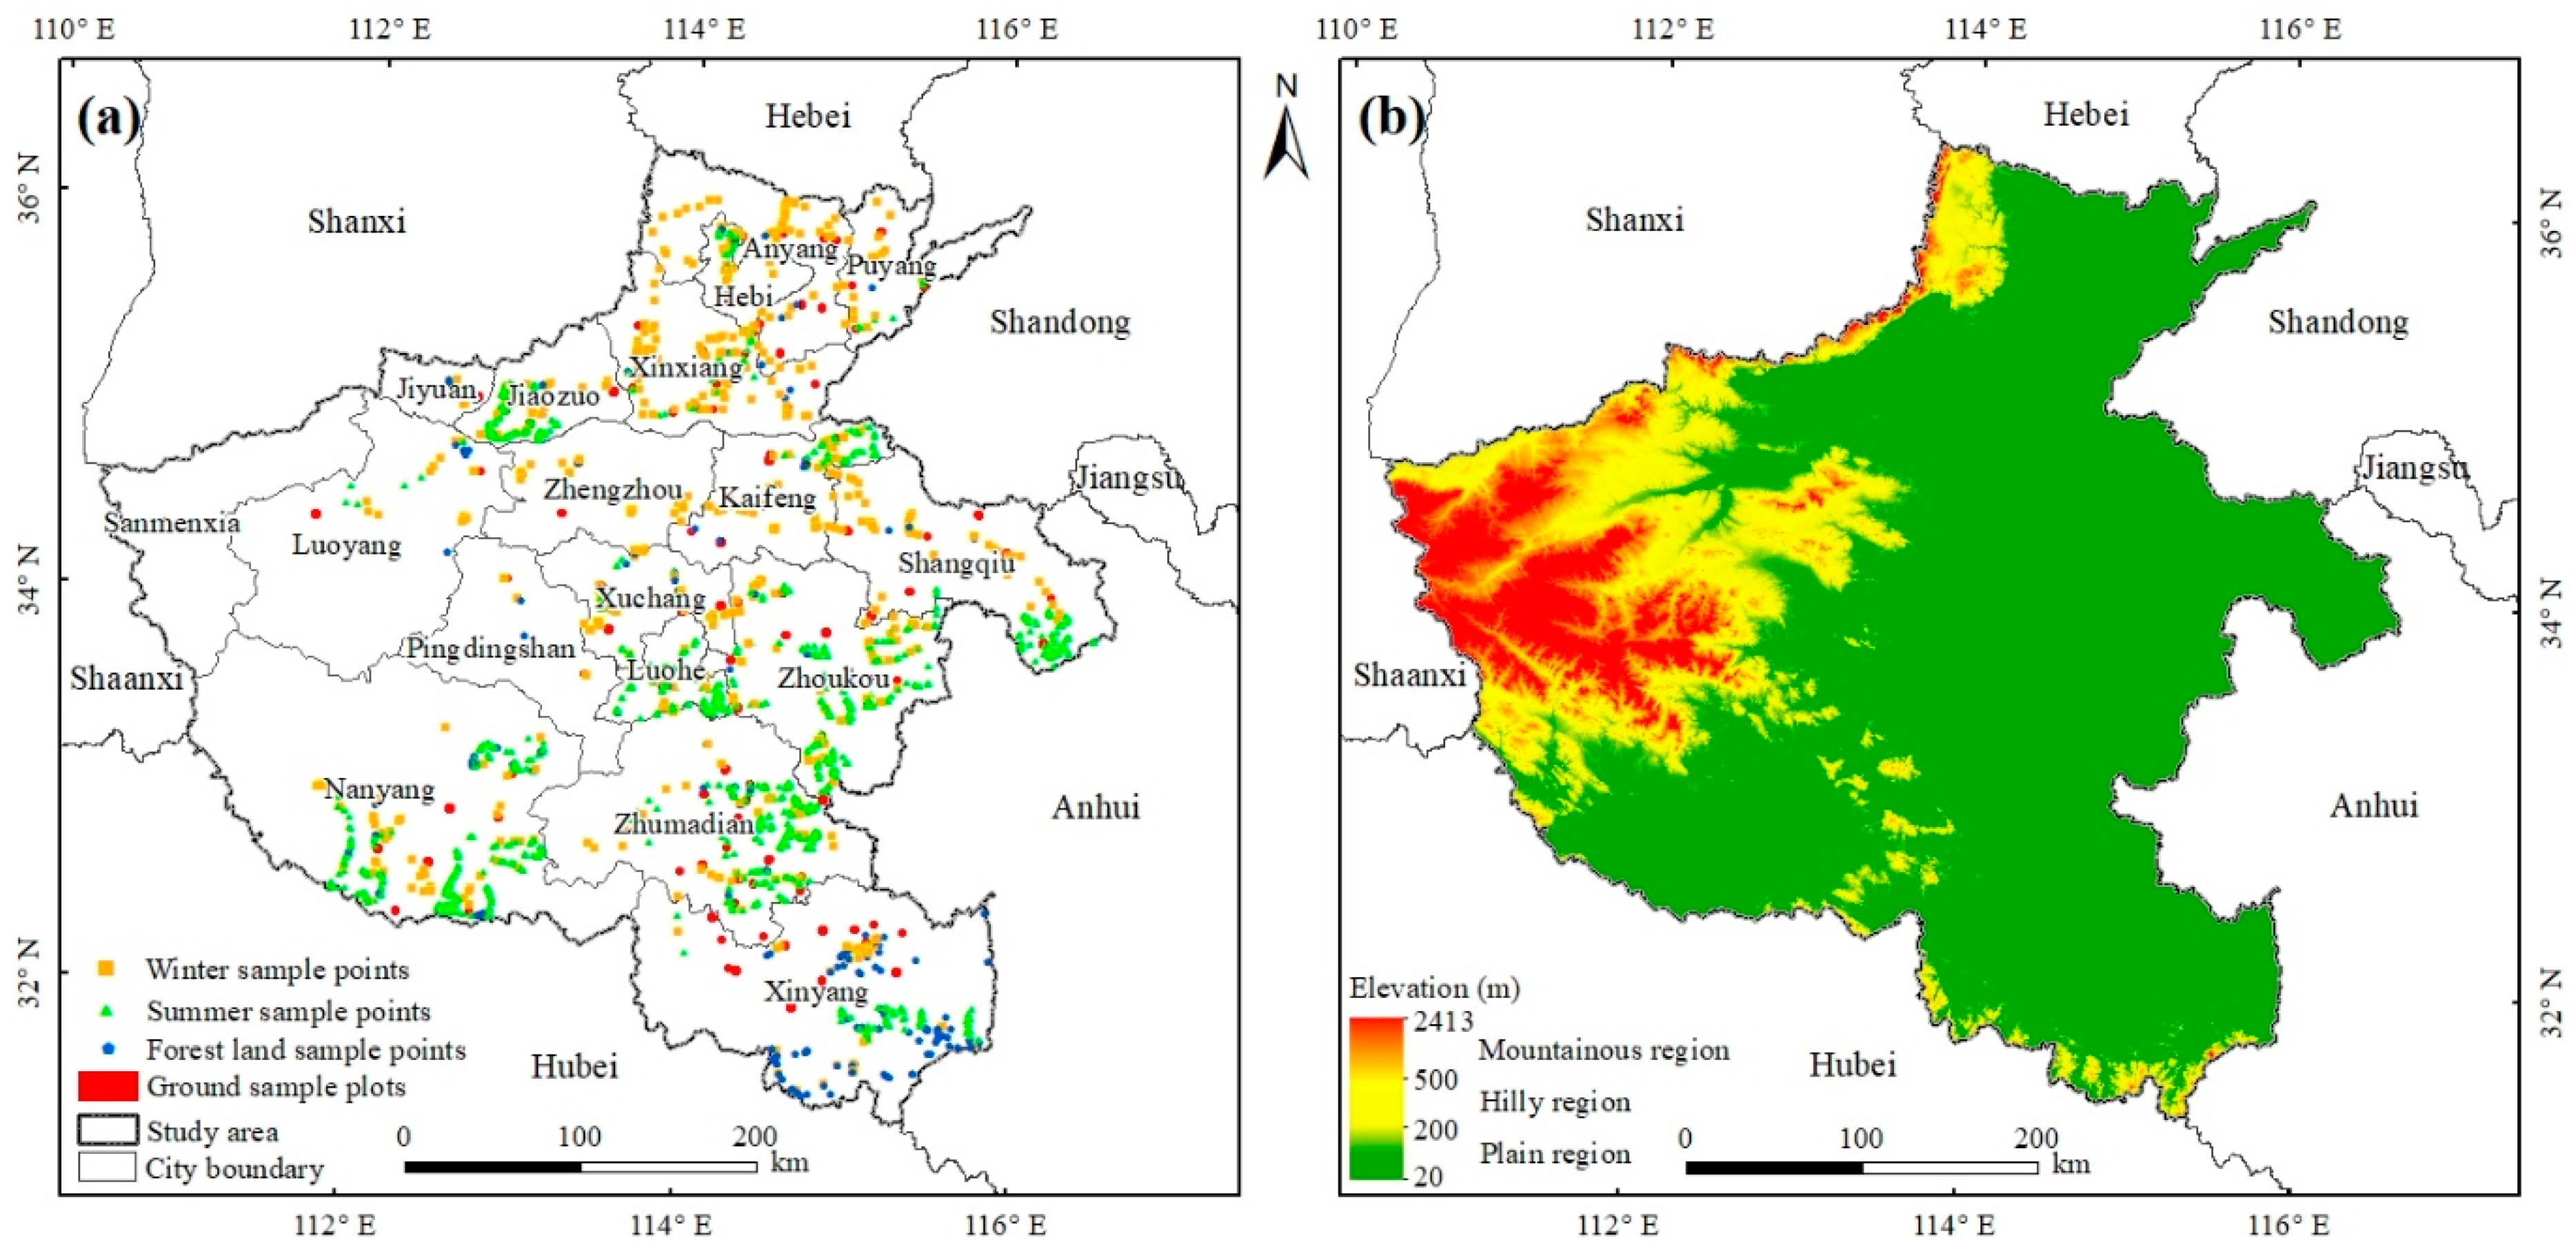
2.1. Study Sites
2.2. Dataset and Preprocessing
2.2.1. Sentinel-2 Data
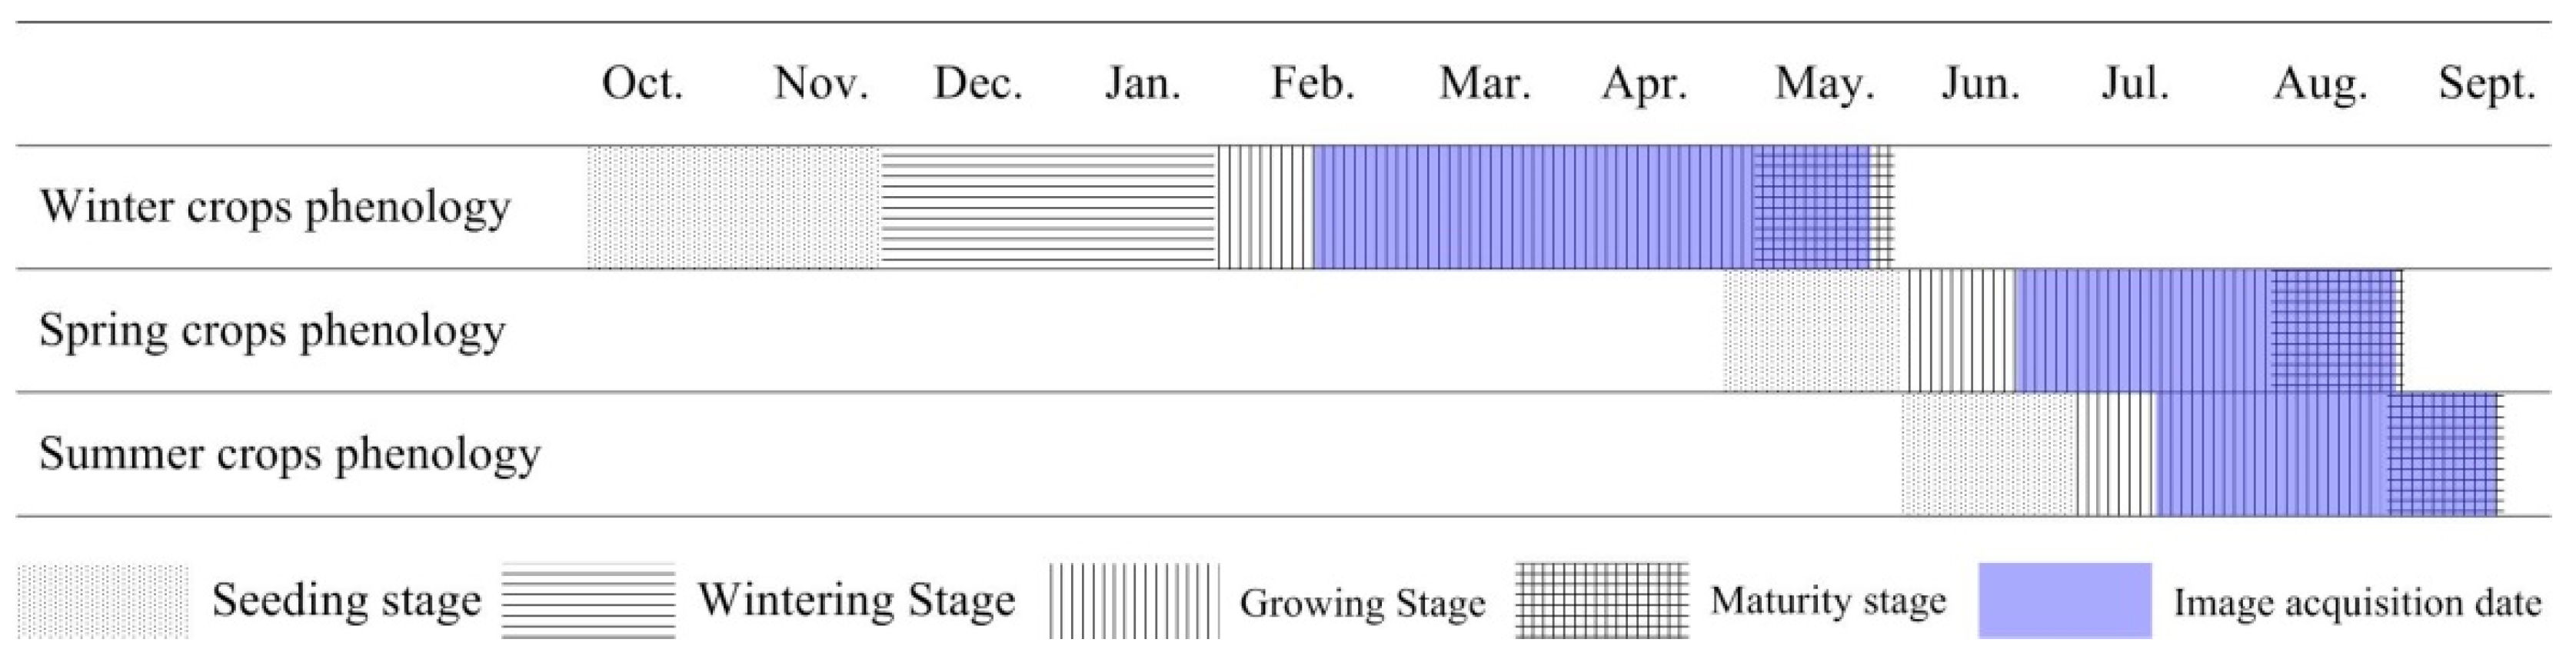
2.2.2. Crop Phenology
2.2.3. Sample Data
3. Methods
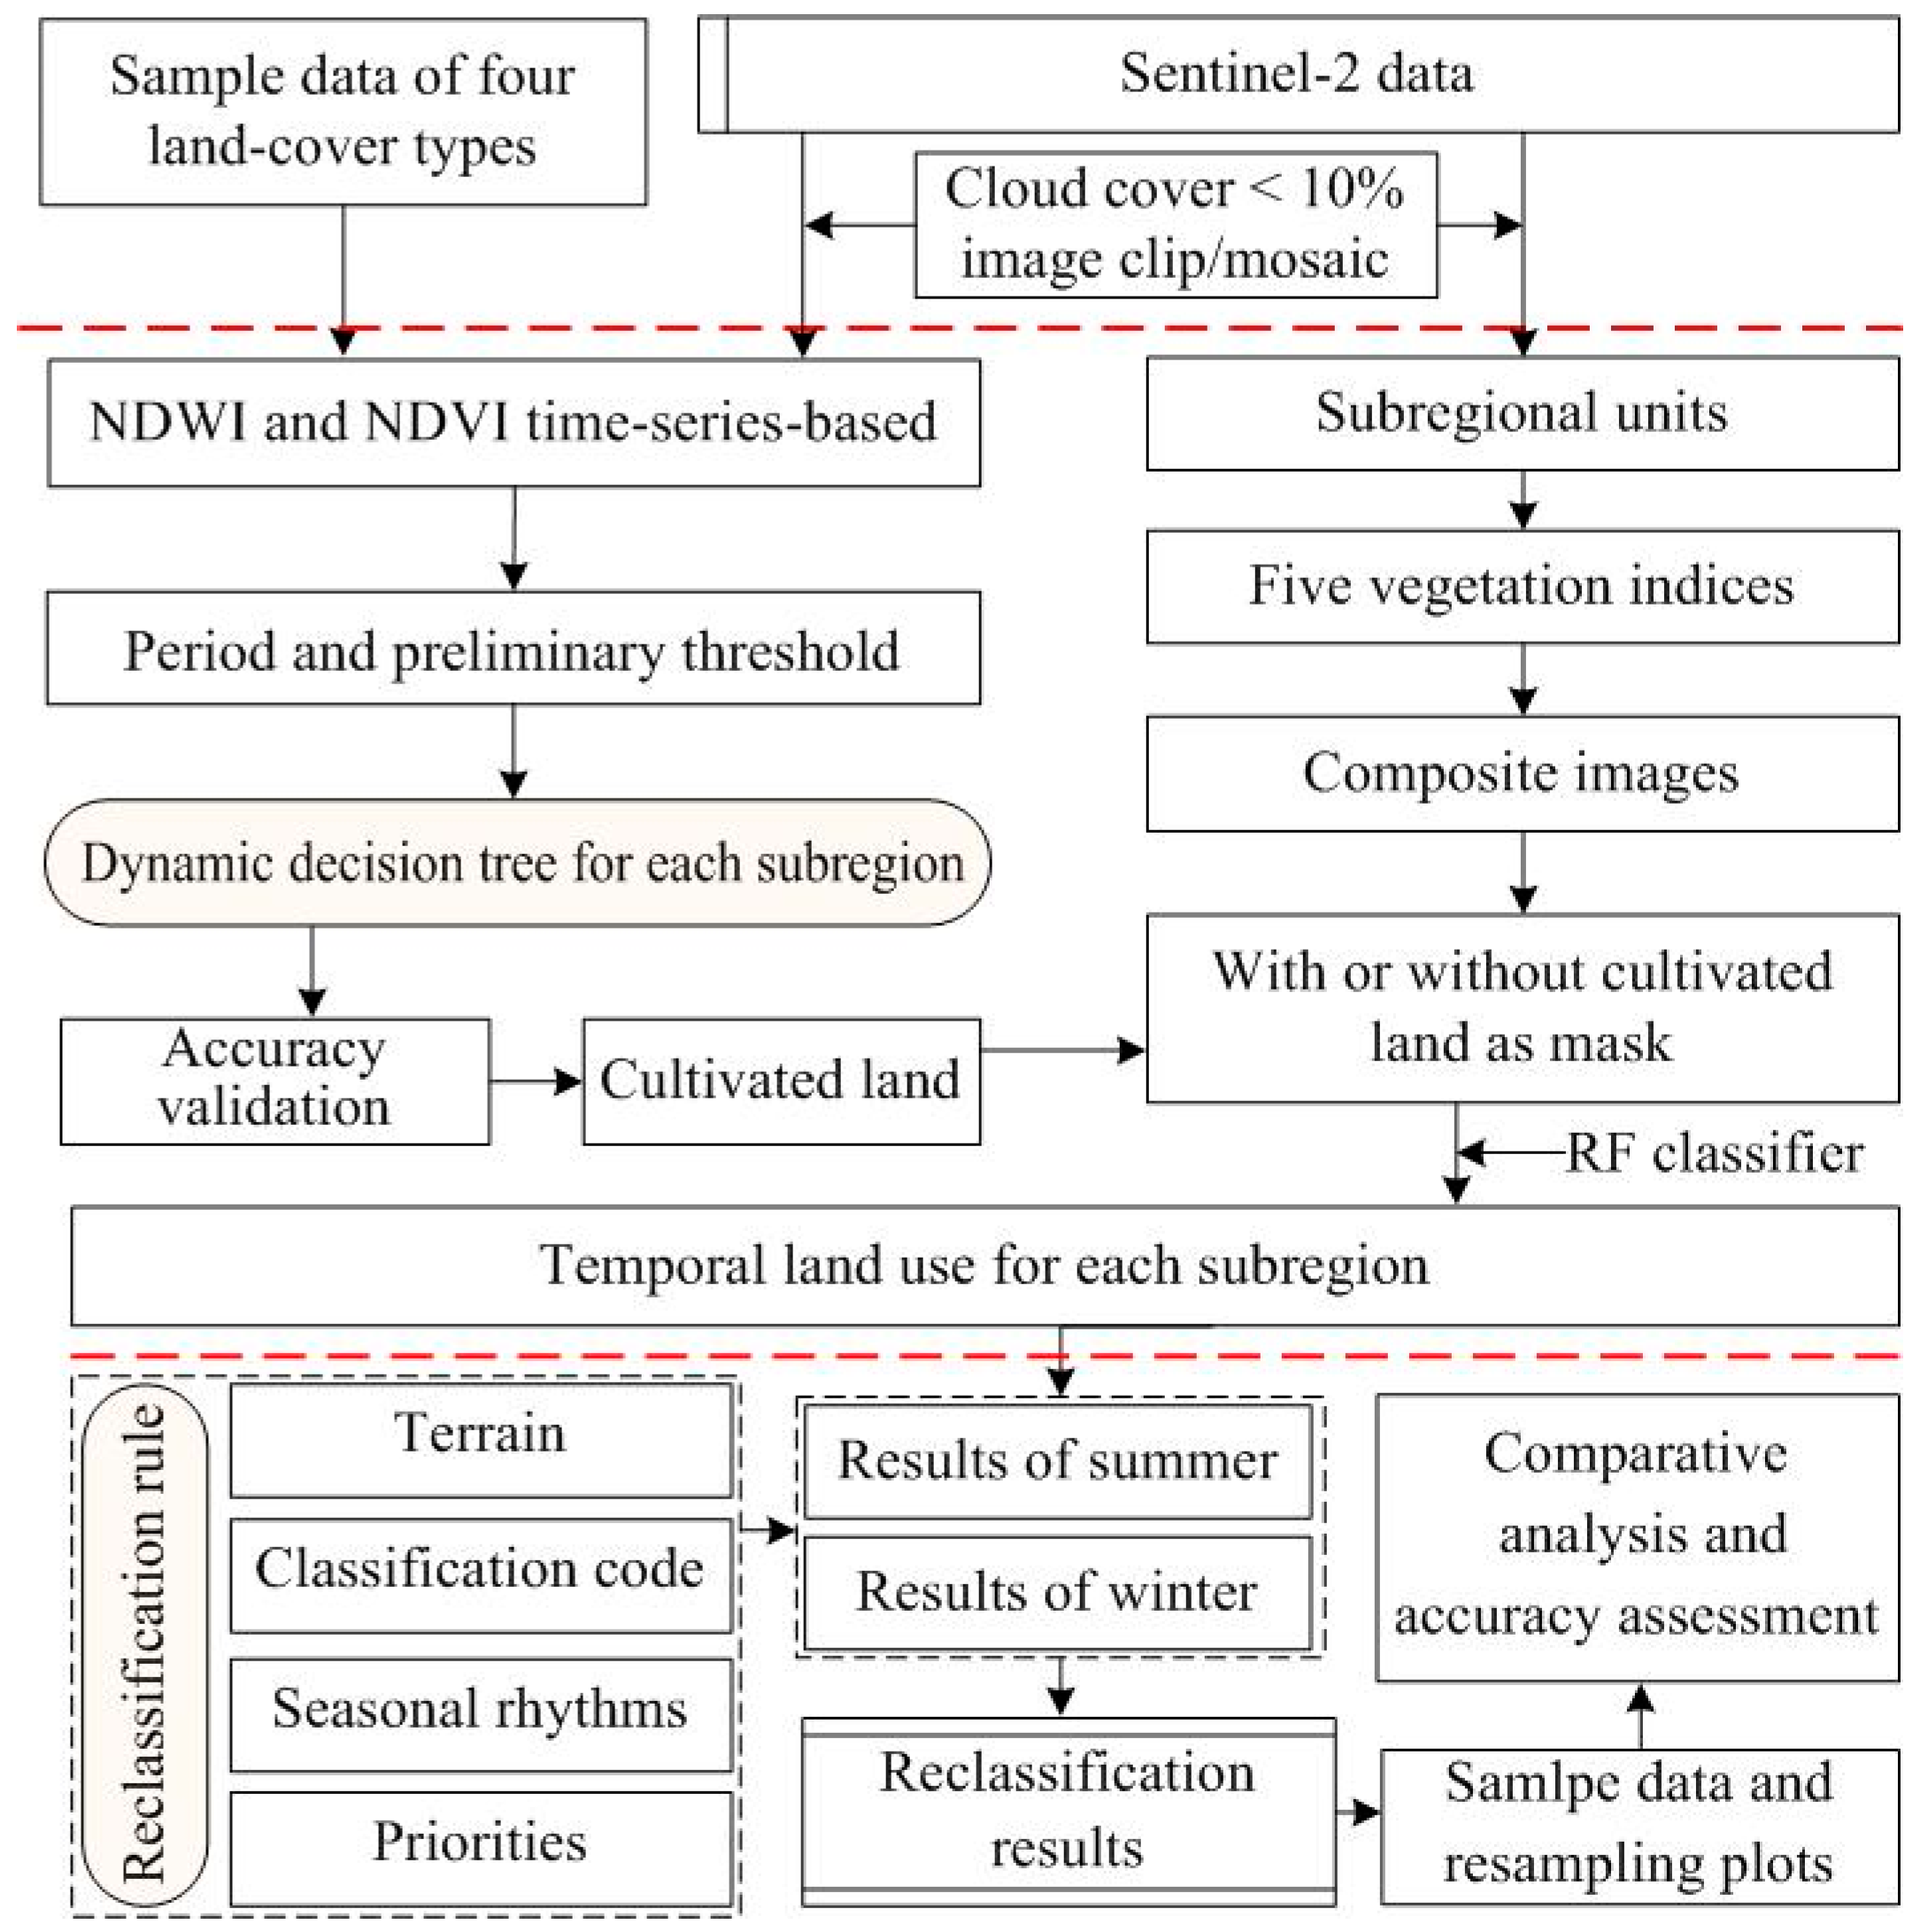
3.1. Overall Workflow
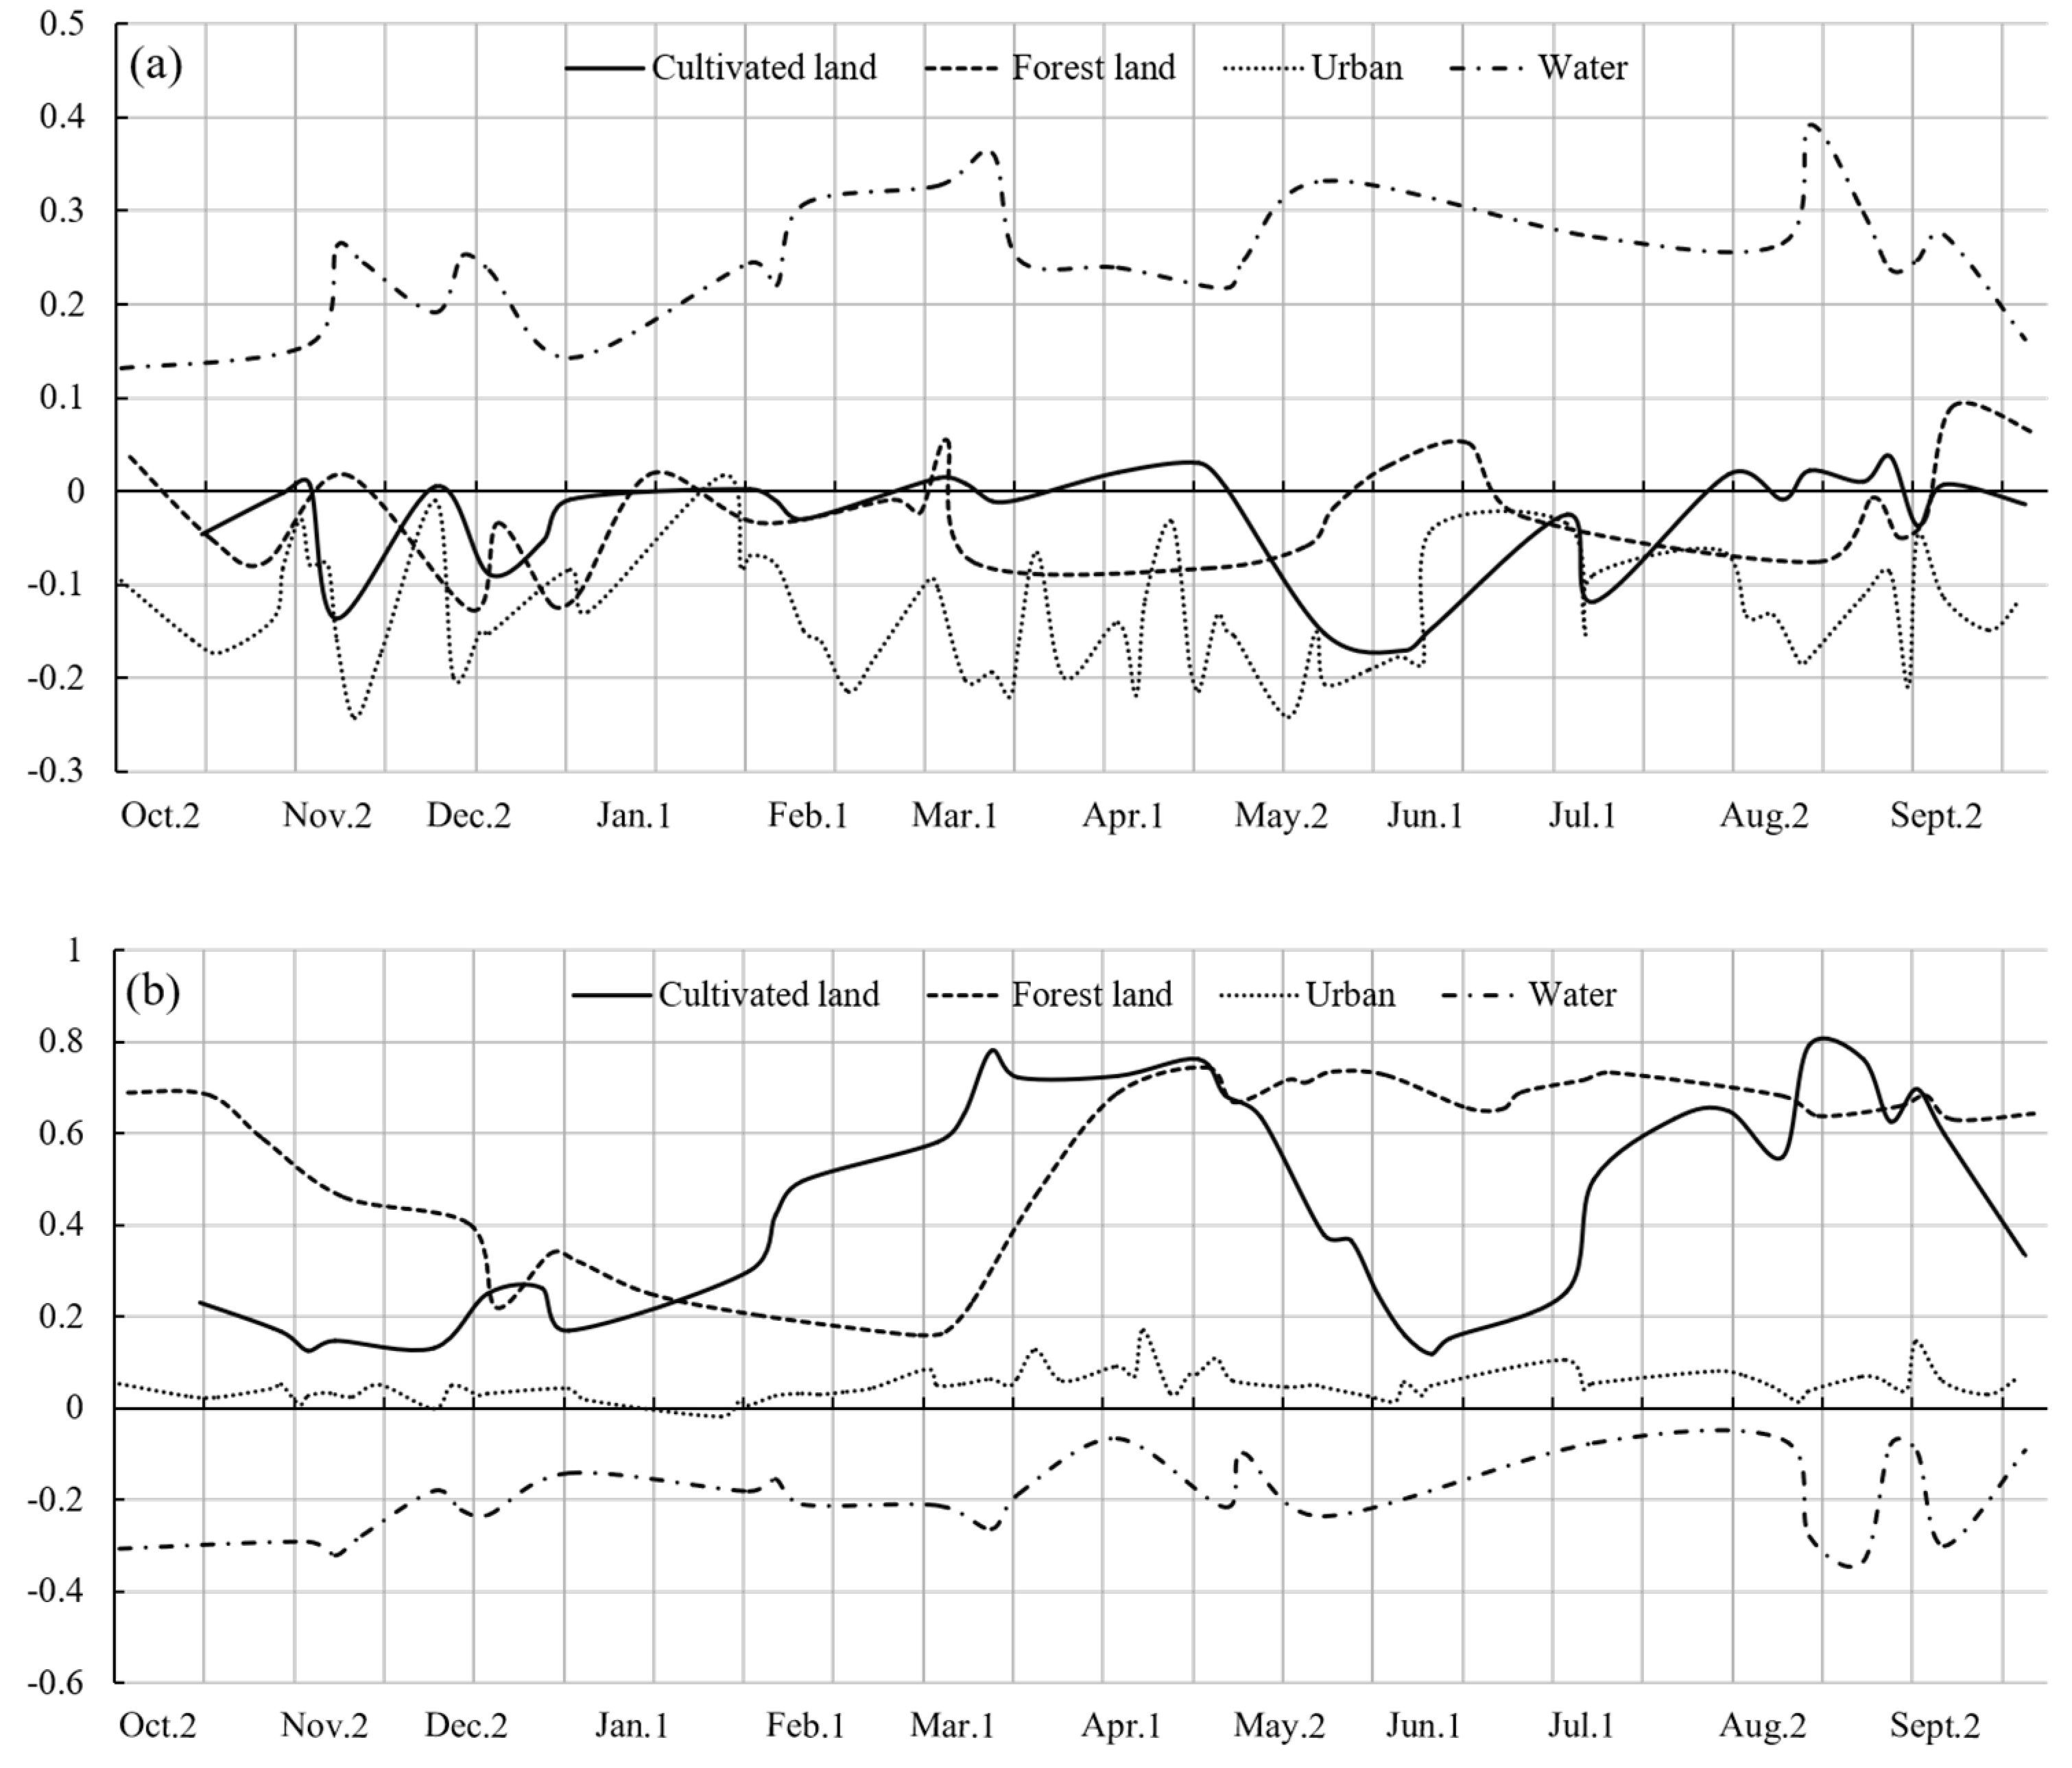
3.2. Time Series Feature Analysis and Dynamic Decision Tree Construction
3.3. Classification Algorithm and Evaluation Indicators
3.4. Feature Band Establishment and Importance Assessment
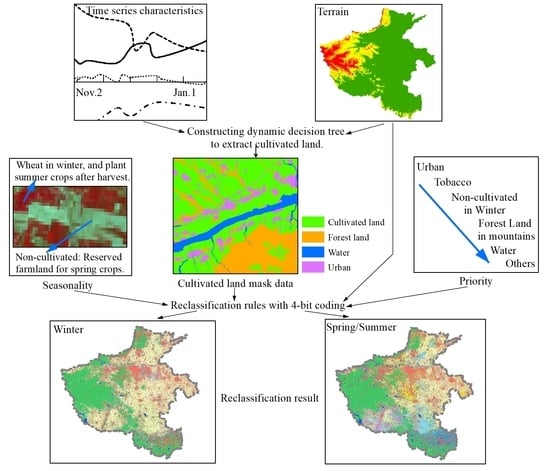
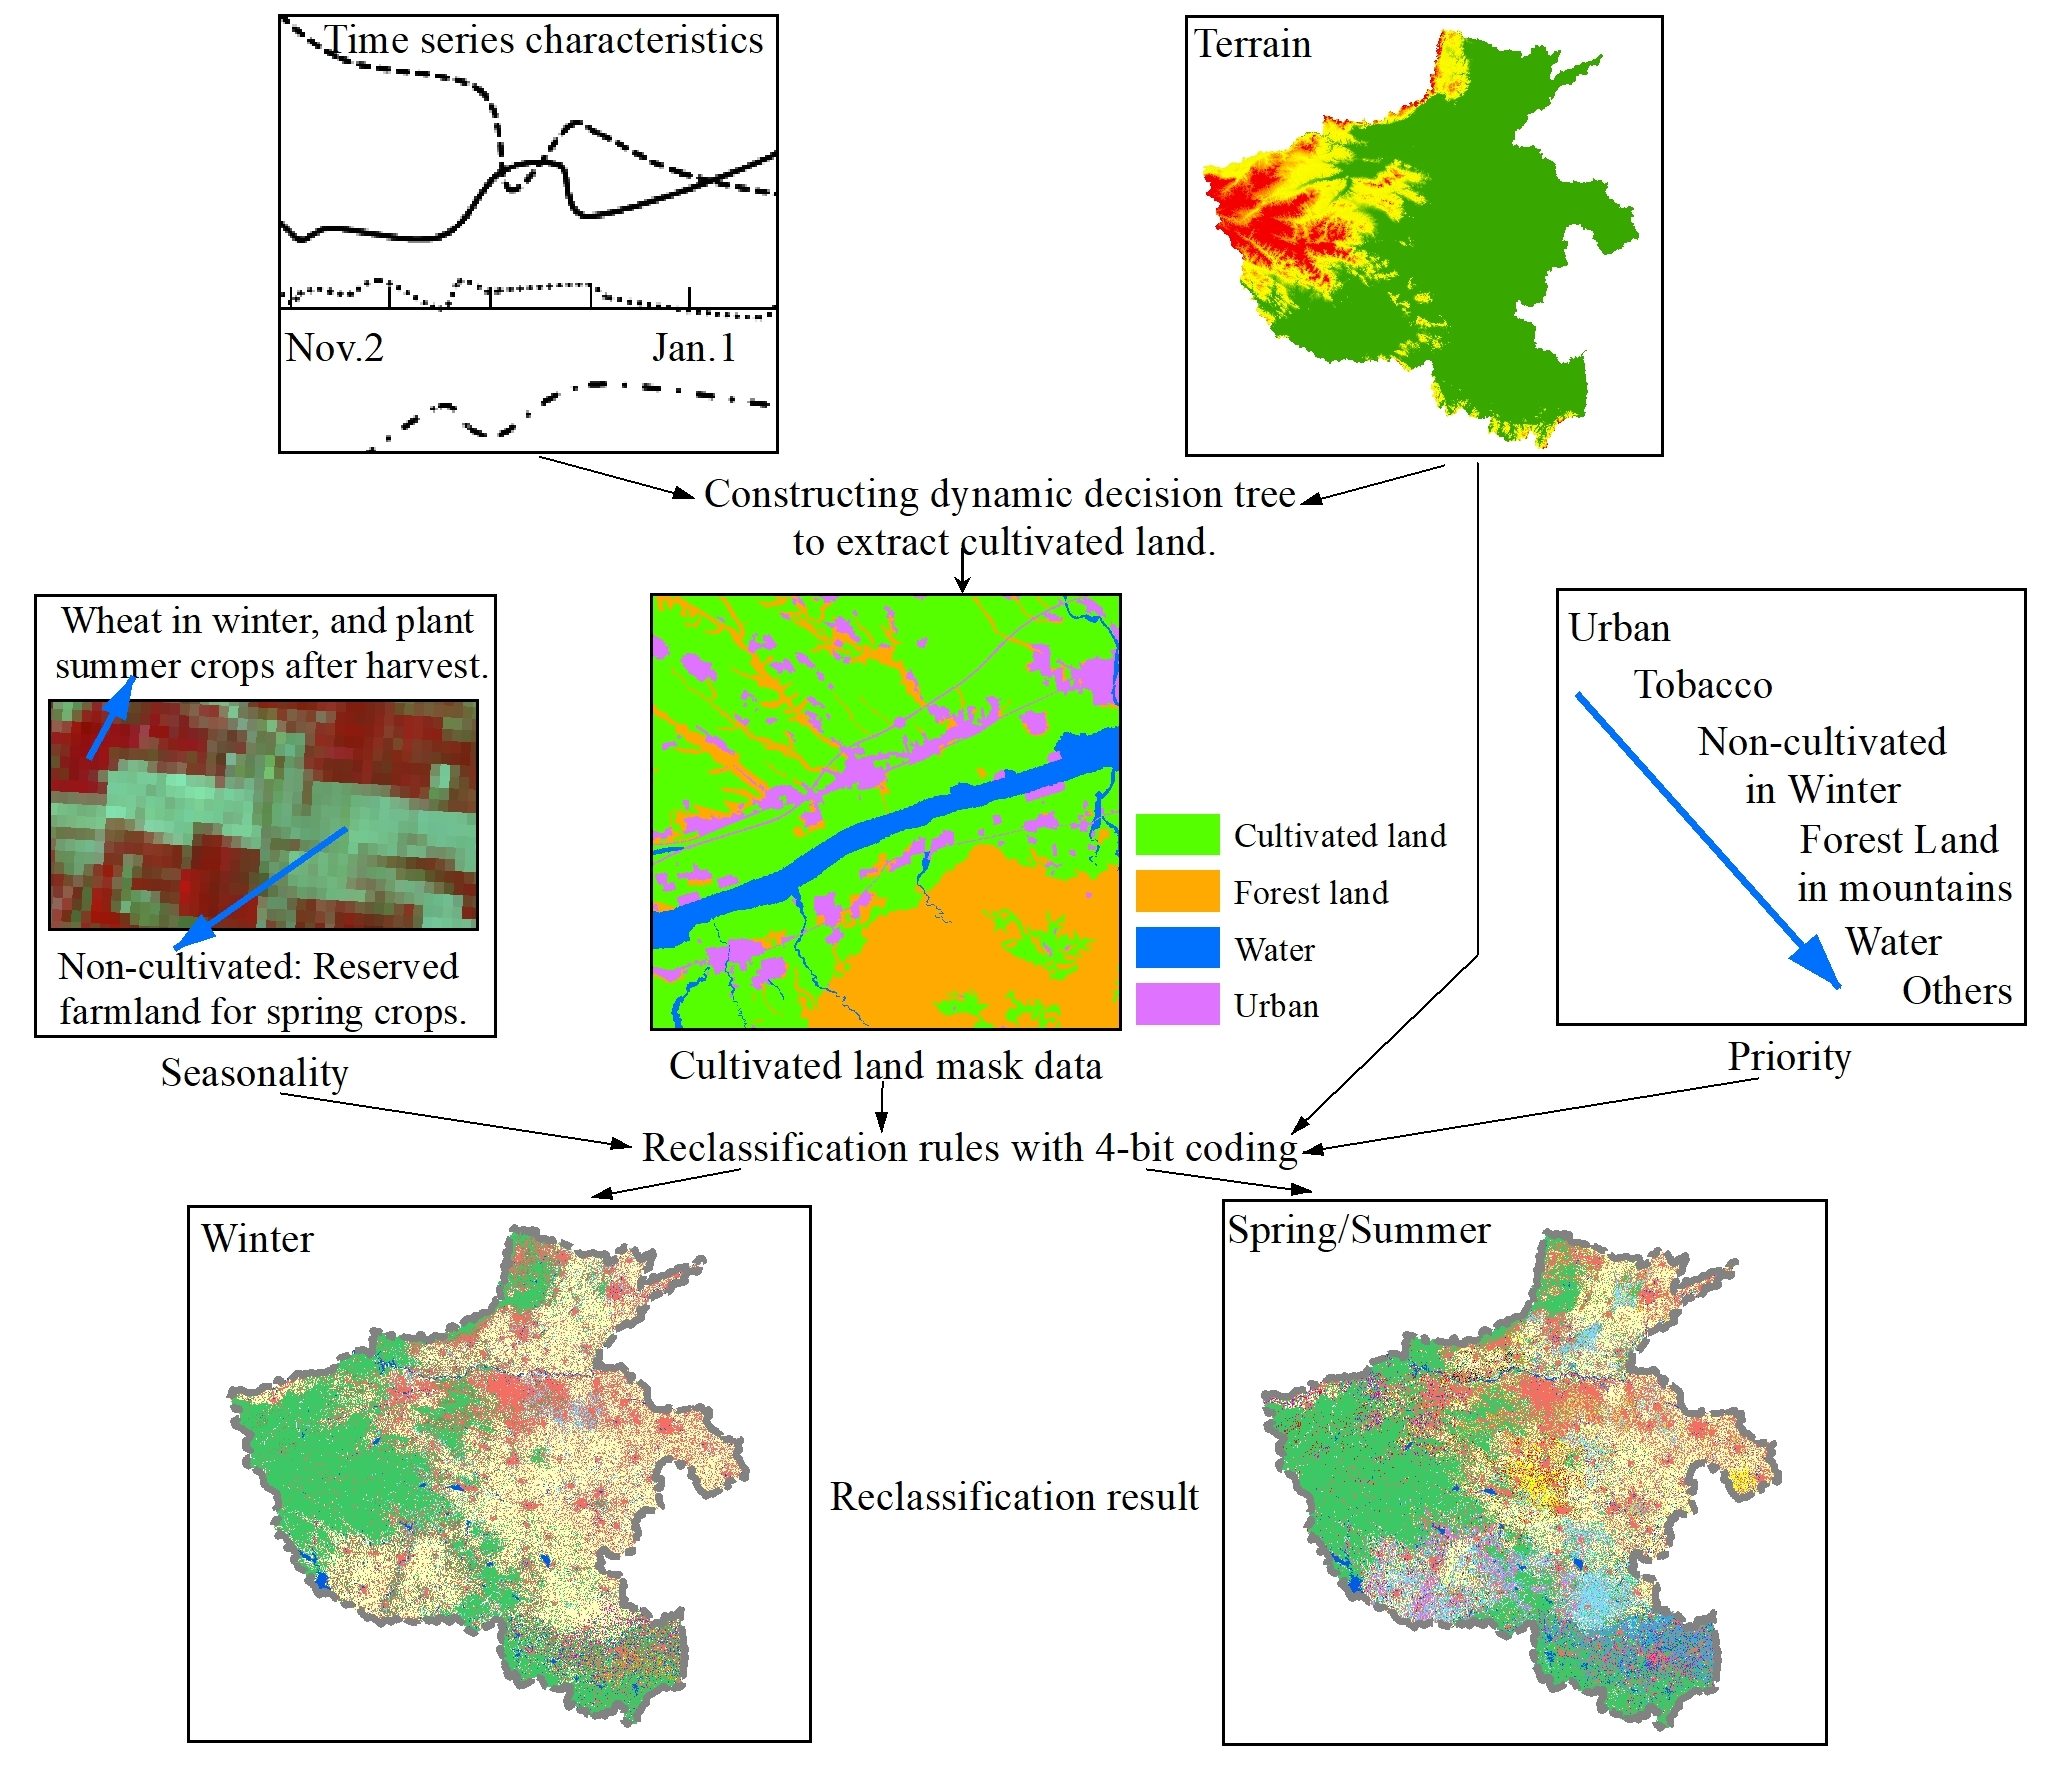
3.5. Reclassification by Fusion of Seasonal and Multiple Features
4. Results and Analysis
4.1. Accuracy Assessment Analyses
4.1.1. Overall Accuracy
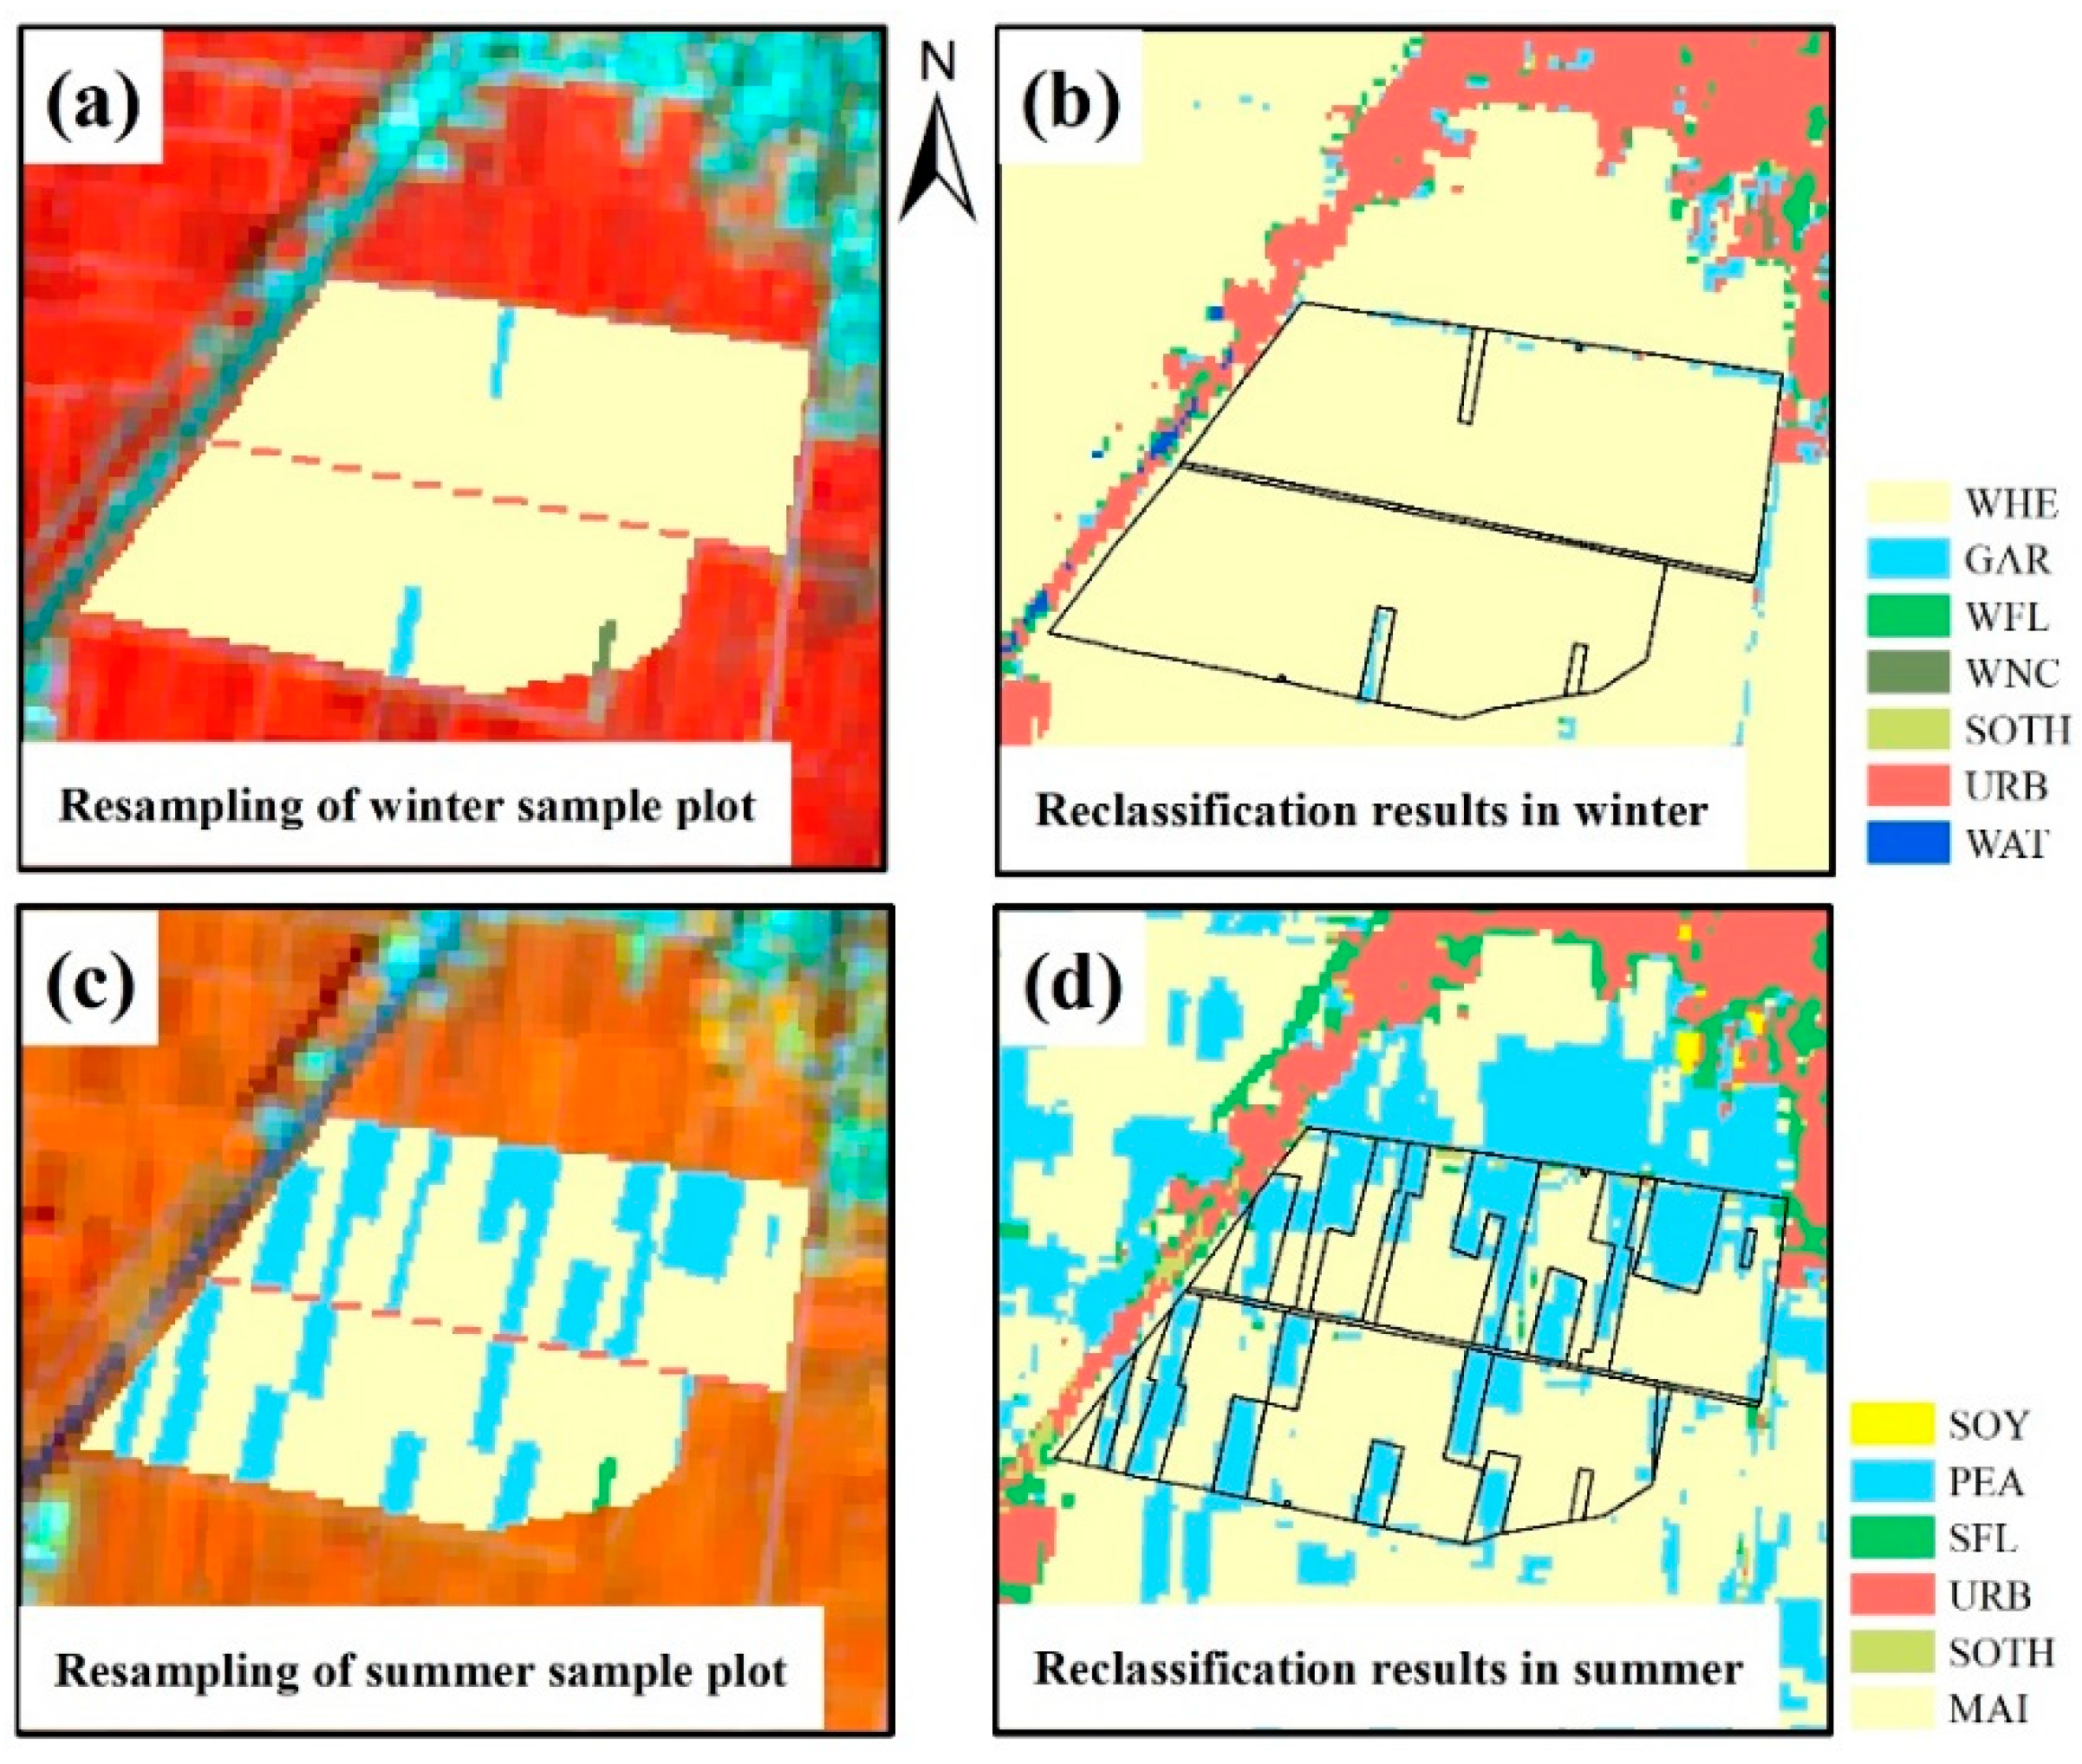
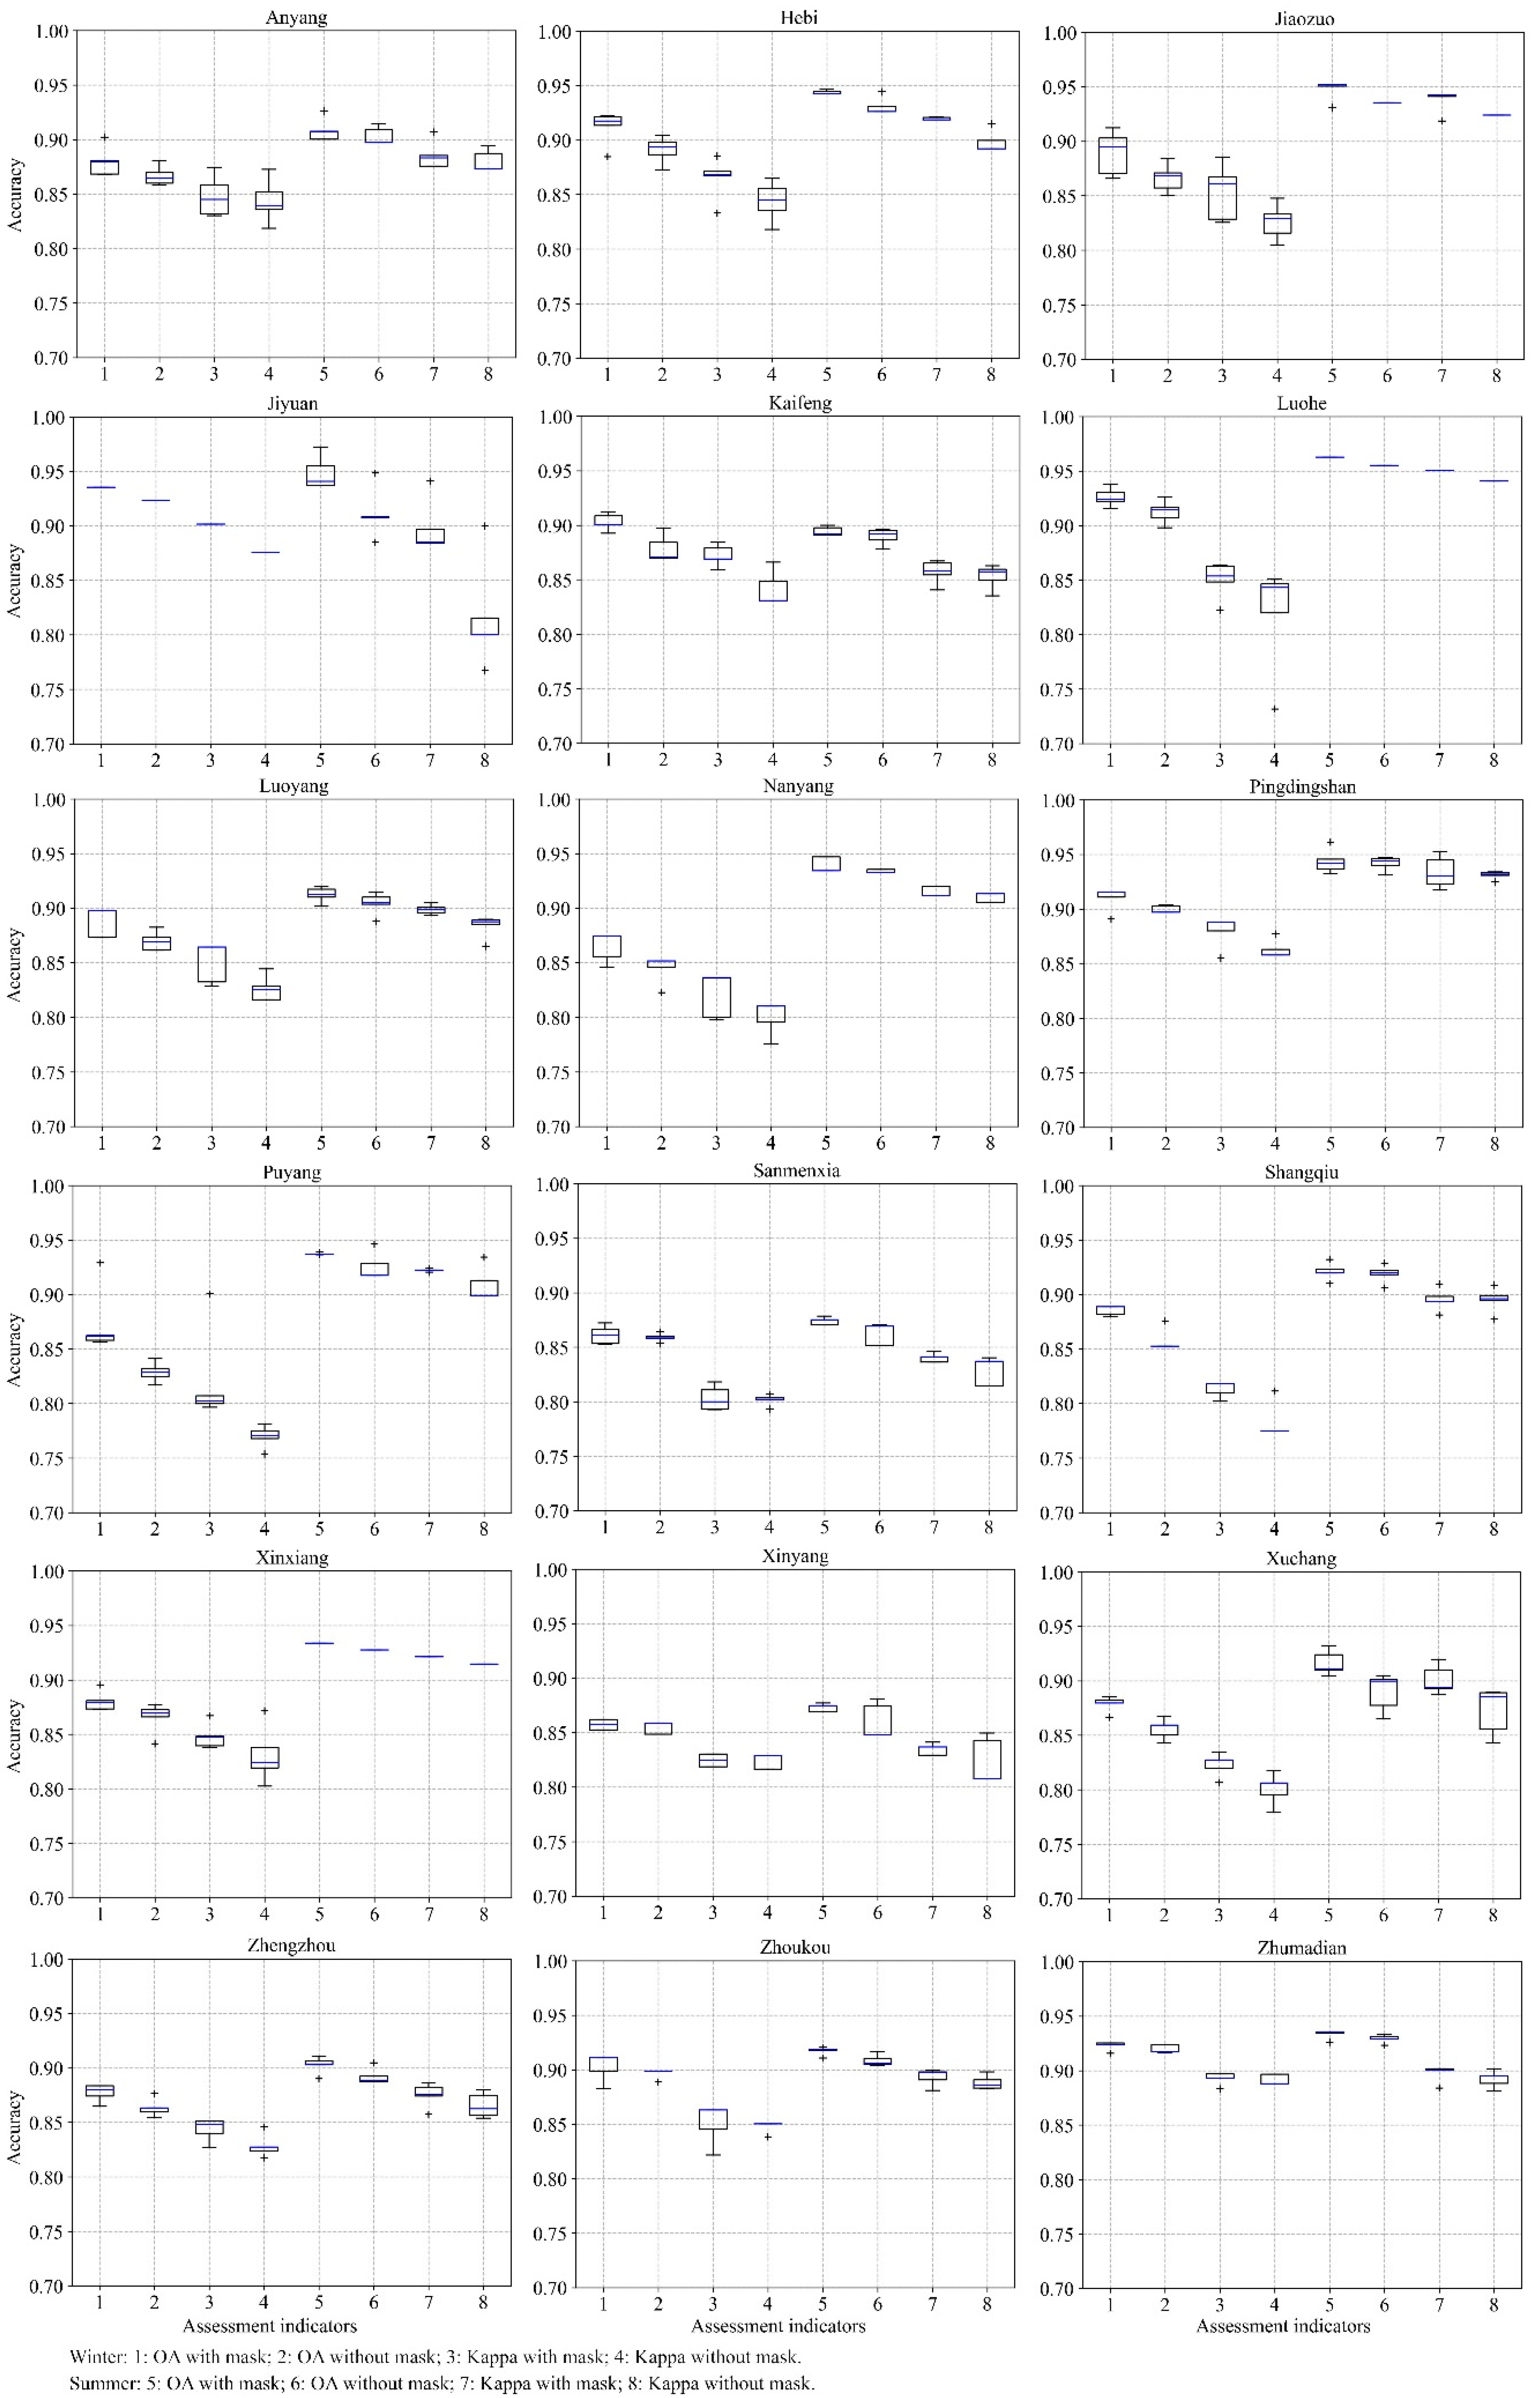
4.1.2. Comparison Analysis of Resampling Plots
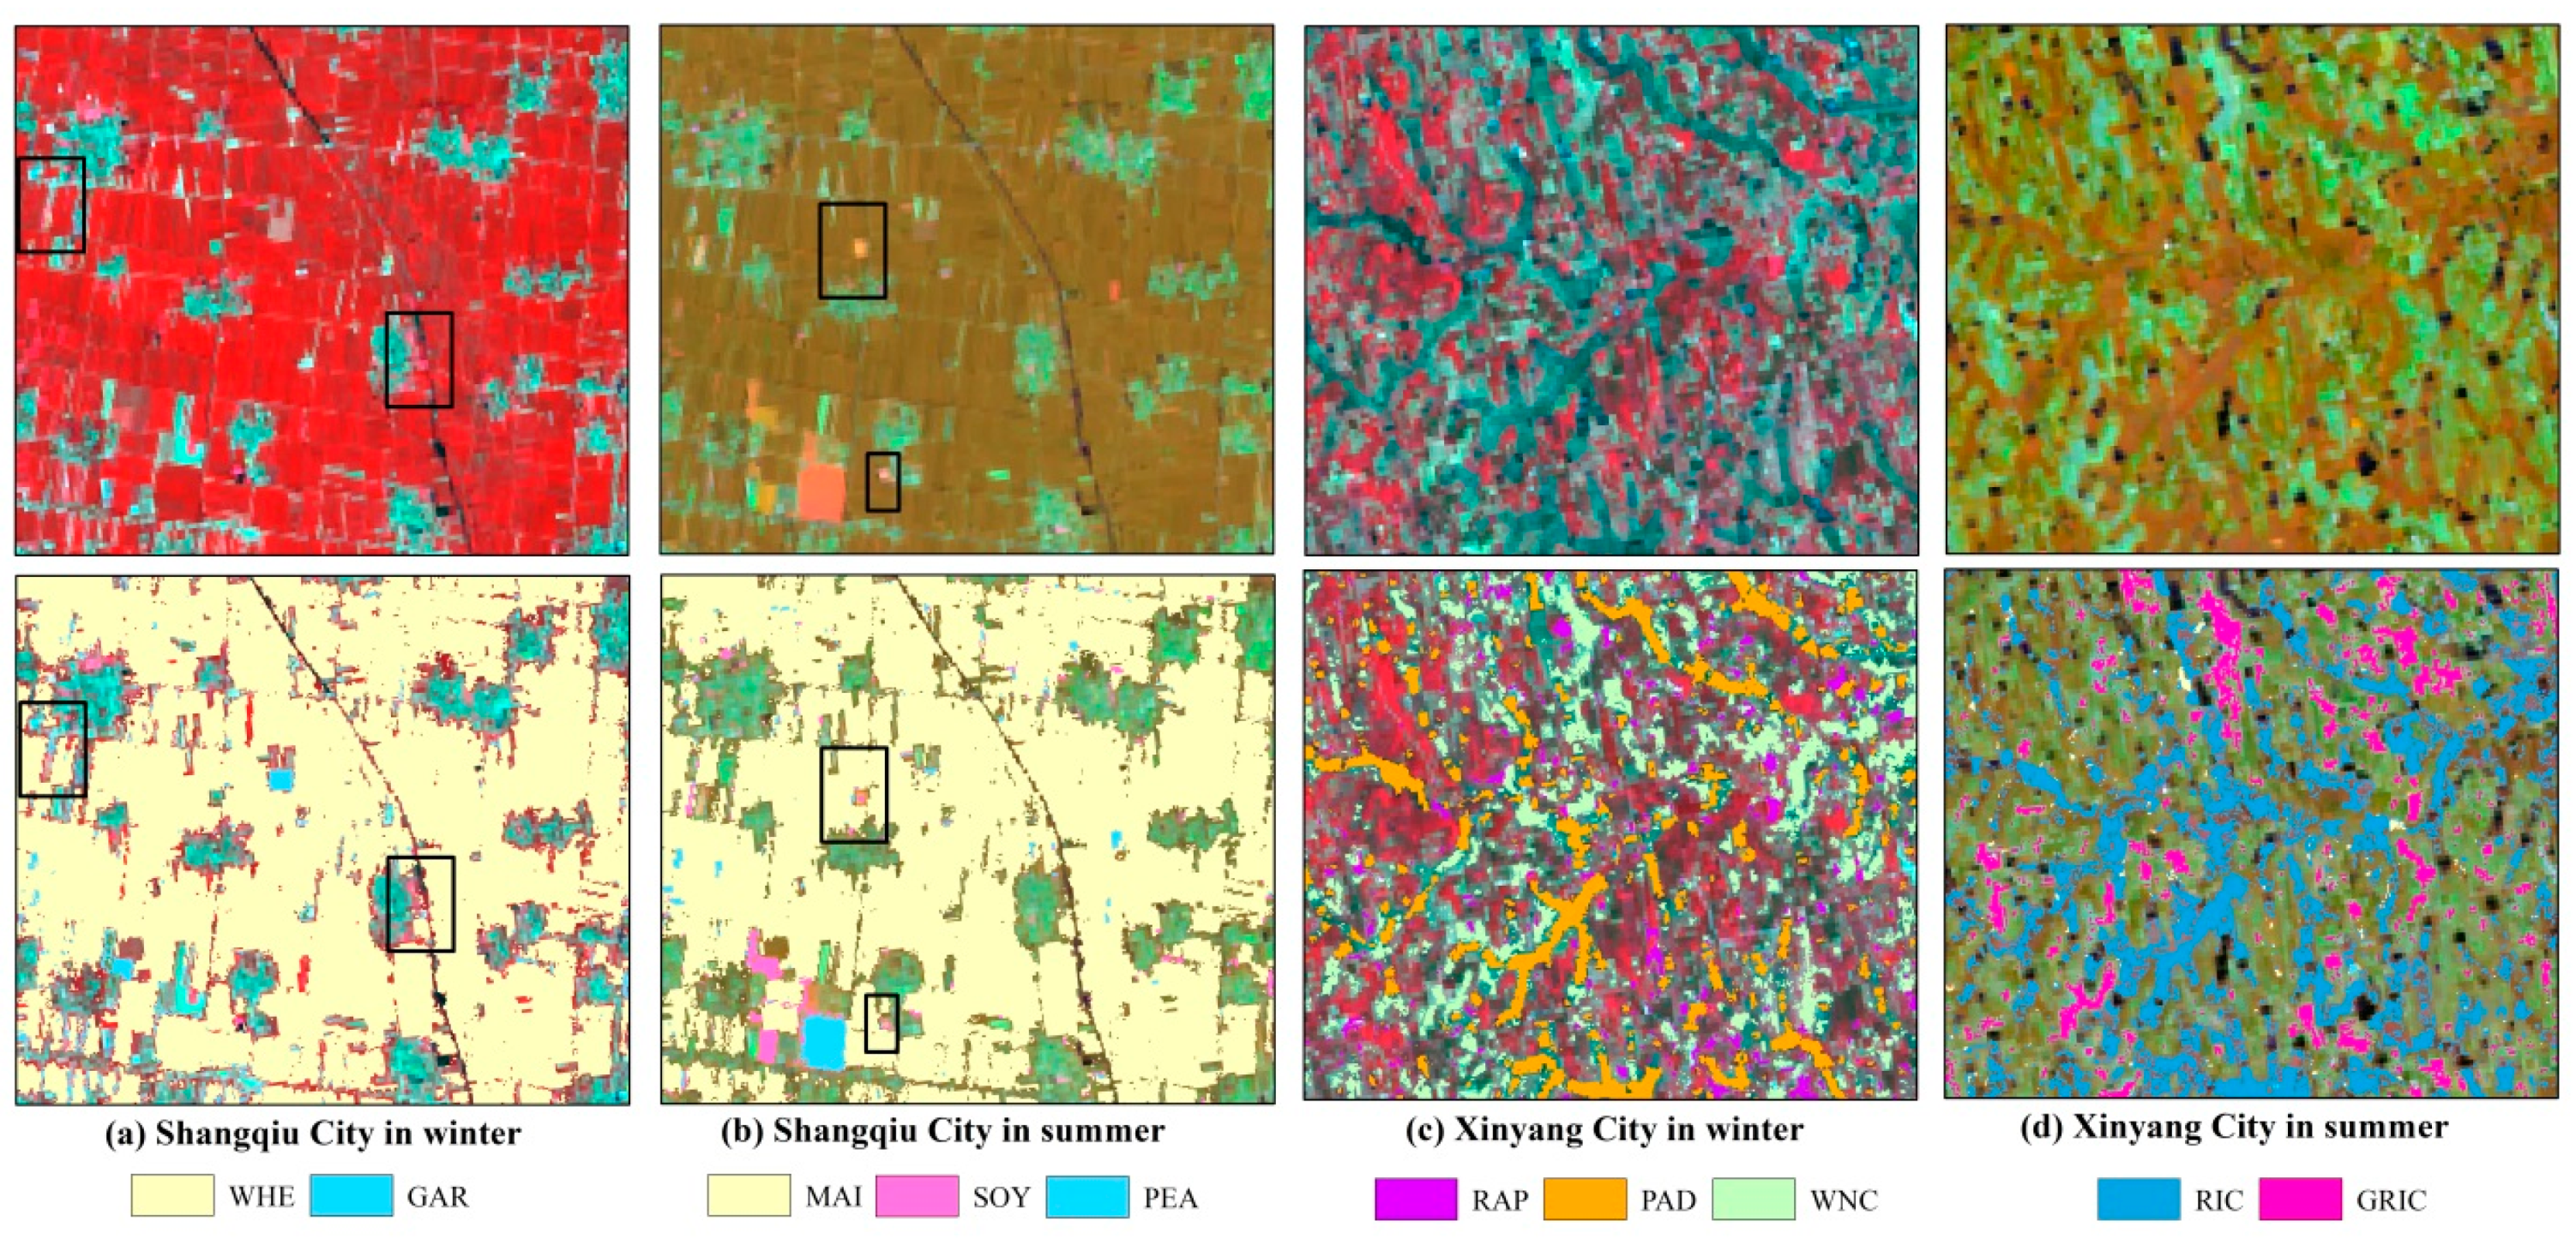
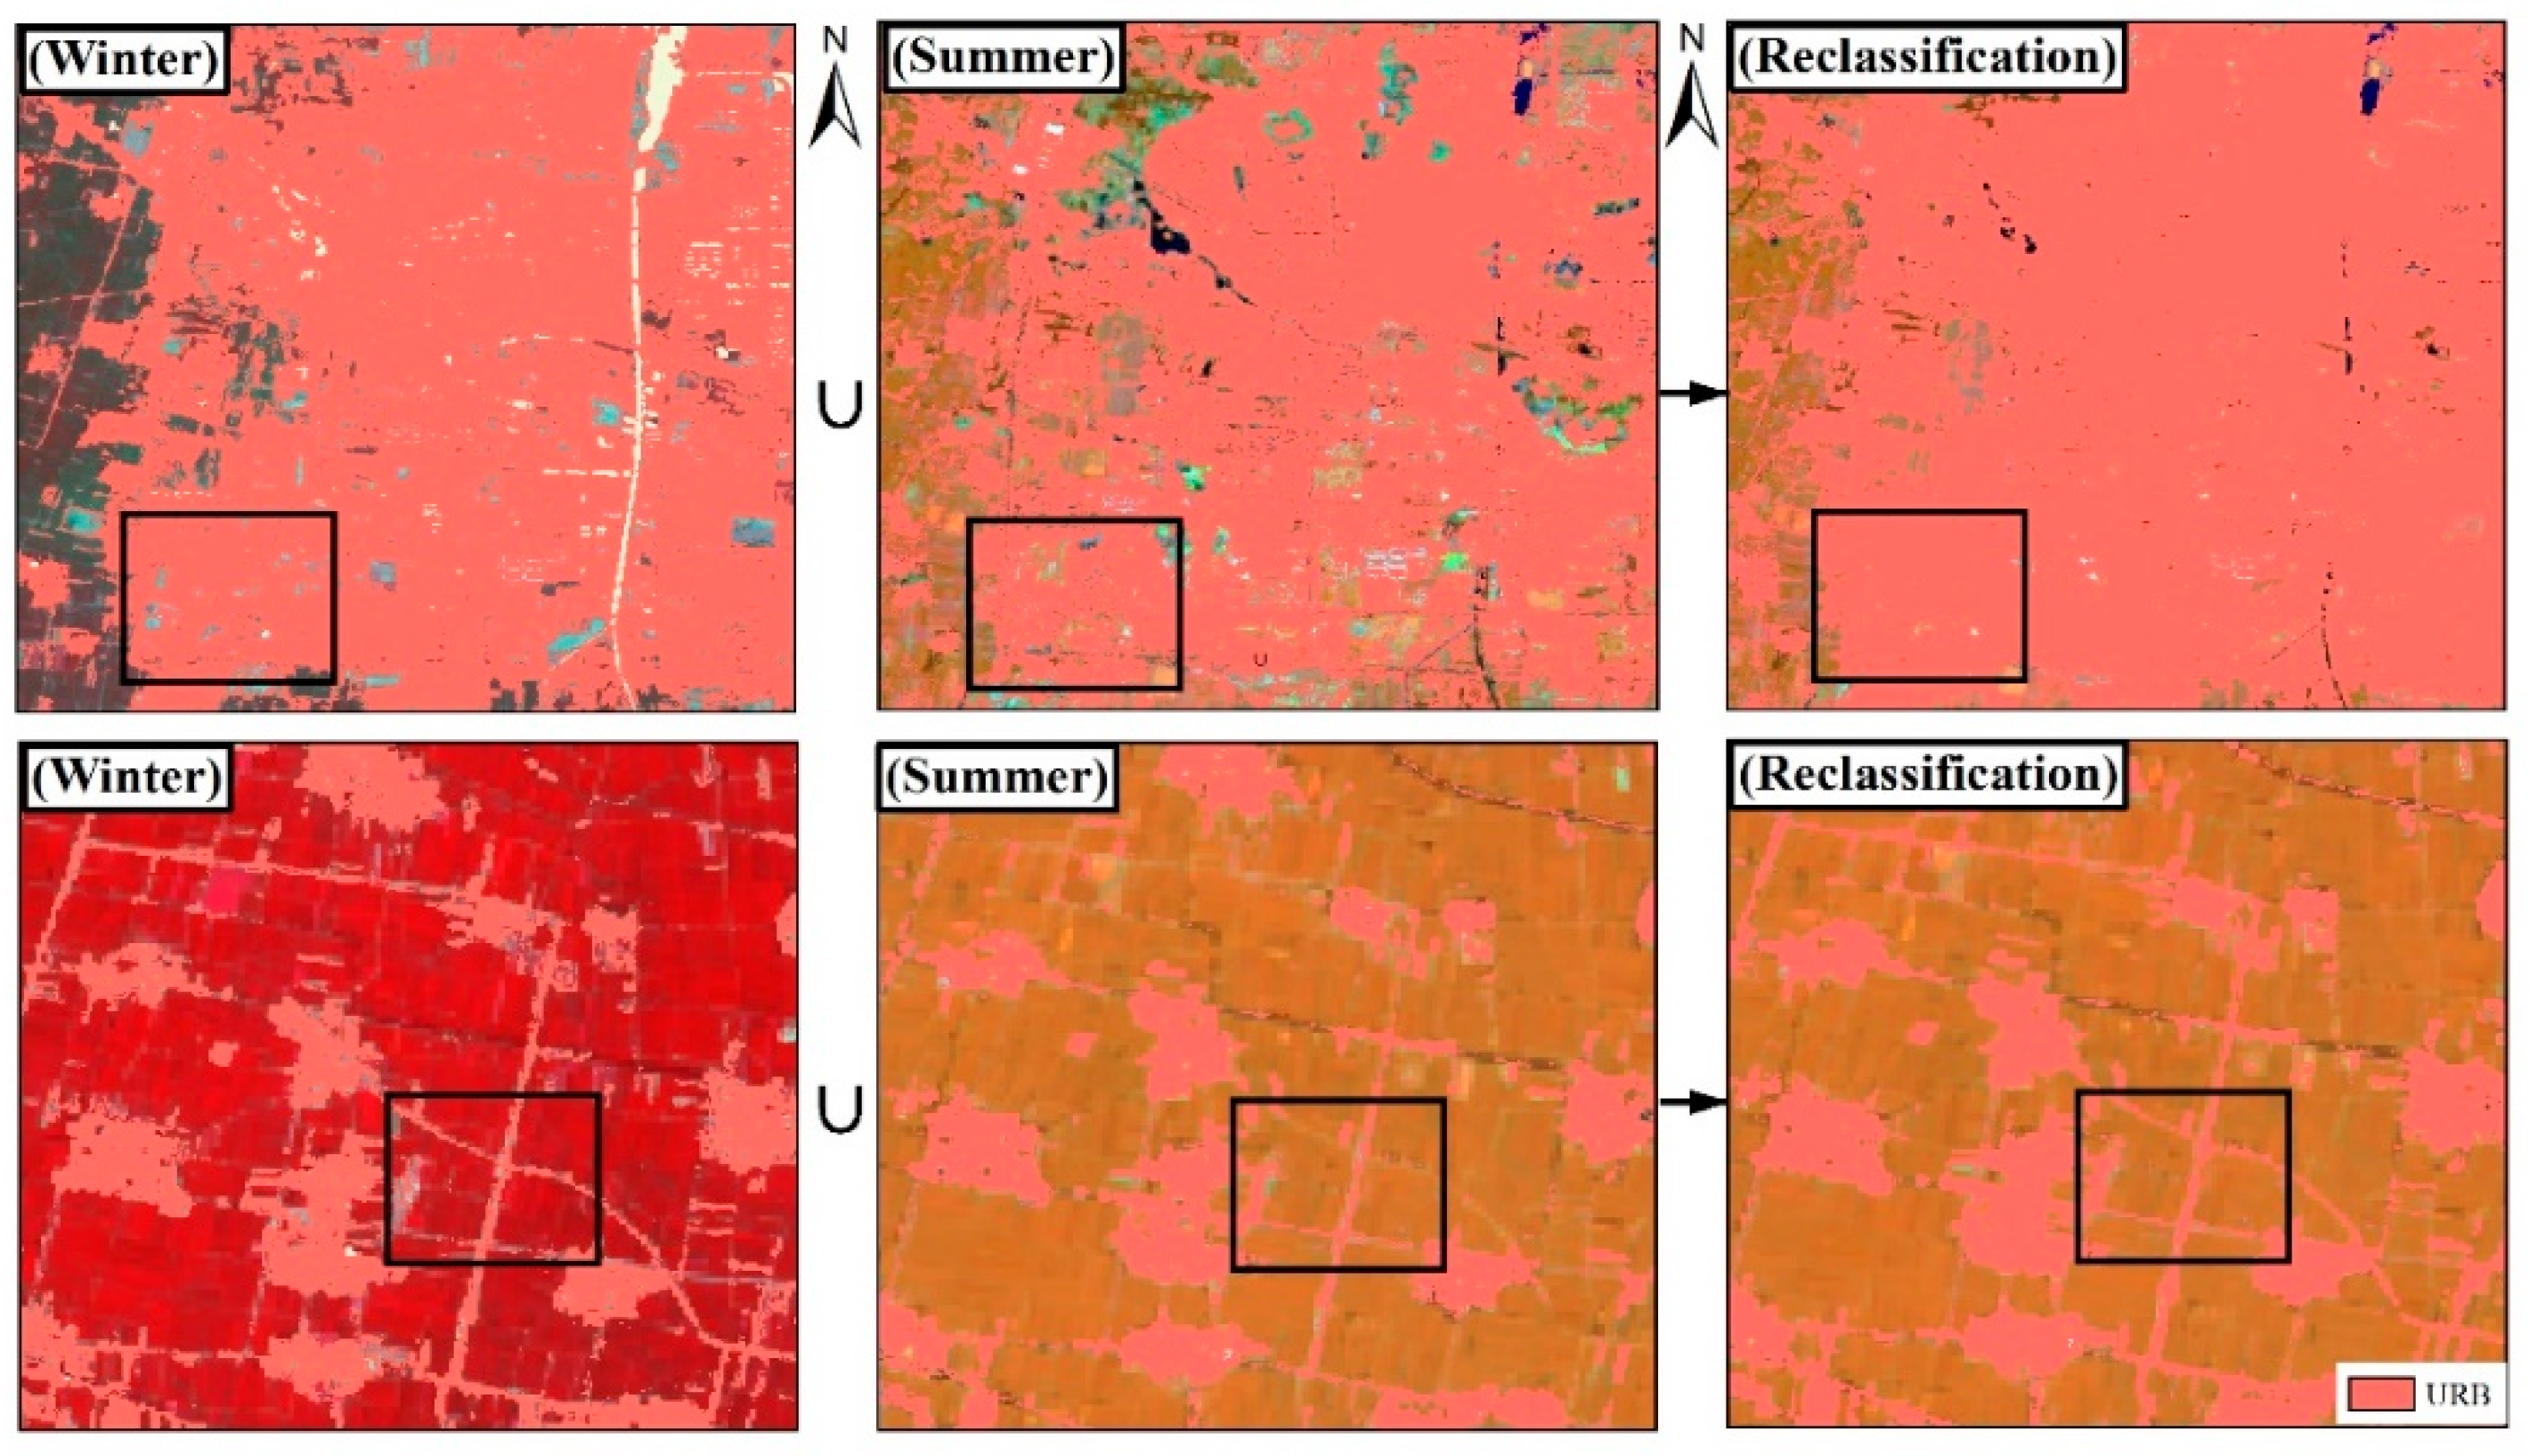
4.2. Reclassification of Multi-Temporal Crop Planting Structure
5. Discussion
5.1. Comparison of Classification Results
5.2. Dynamics and Rule Synthesis
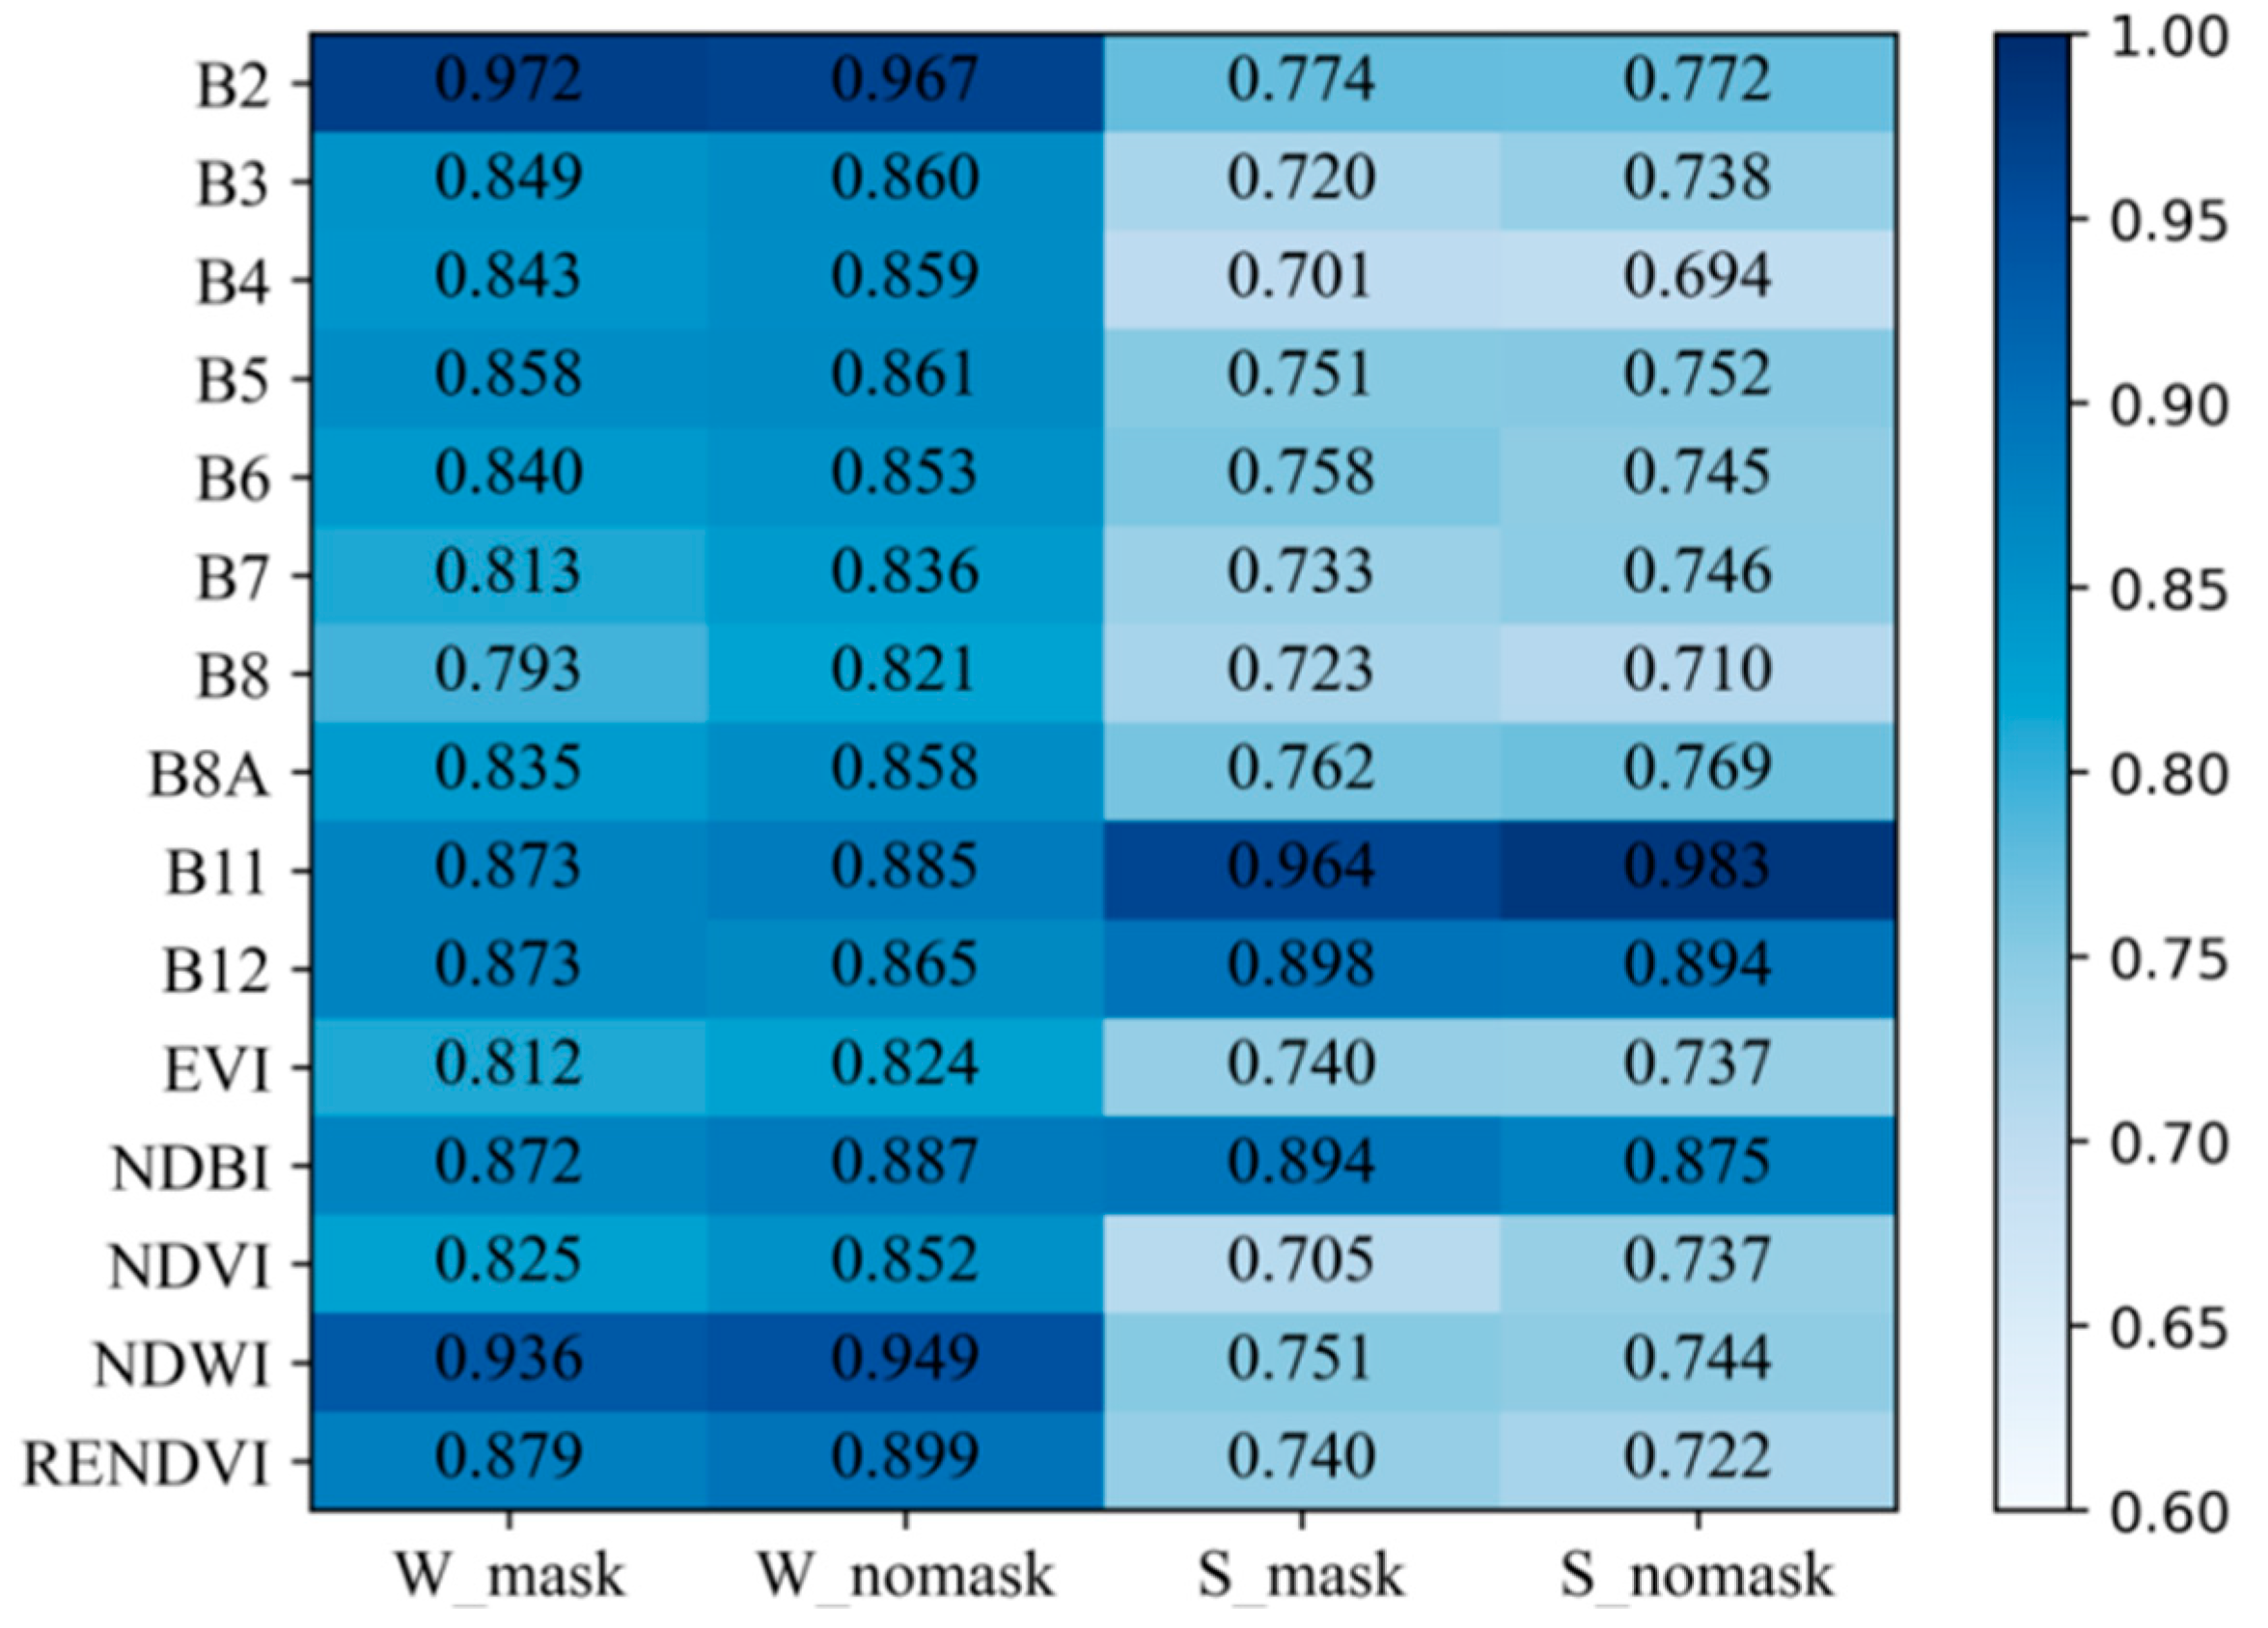
5.3. Differences in Feature Importance
5.4. Diversity of Accuracy Evaluation
5.5. Limitations and Future Perspectives
6. Conclusions
Author Contributions
Funding
Institutional Review Board Statement
Informed Consent Statement
Data Availability Statement
Acknowledgments
Conflicts of Interest
References
- Intergovernmental Panel on Climate Change. Special Report: Climate Change and Land. 2019. Available online: https://www.ipcc.ch/srccl/ (accessed on 12 November 2020).
- Ji, S.; Zhang, C.; Xu, A.; Shi, Y.; Duan, Y. 3D convolutional neural networks for crop classification with multi-temporal remote sensing images. Remote Sens. 2018, 10, 75. [Google Scholar] [CrossRef] [Green Version]
- Tang, H.; Wu, W.; Yang, P.; Zhou, Q.; Chen, Z. Recent progresses in monitoring crop spatial patterns by using remote sensing technologies. Sci. Agric. Sin. 2010, 43, 2879–2888. [Google Scholar]
- Sishodia, R.P.; Ray, R.L.; Singh, S.K. Applications of remote sensing in precision agriculture: A review. Remote Sens. 2020, 12, 3136. [Google Scholar] [CrossRef]
- Cai, Z.; Qian, W. Evaluation analysis and structural optimization of crop planting structure in Northeast China. Fresenius Environ. Bull. 2017, 26, 7327–7333. [Google Scholar]
- Begue, A.; Arvor, D.; Bellon, B.; Betbeder, J.; De Abelleyra, D.; Ferraz, R.P.D.; Lebourgeois, V.; Lelong, C.; Simoes, M.; Veron, S.R. Remote sensing and cropping practices: A review. Remote Sens. 2018, 10, 99. [Google Scholar] [CrossRef] [Green Version]
- Li, M.; Fu, Q.; Singh, V.P.; Liu, D.; Li, T.; Zhou, Y. Managing agricultural water and land resources with tradeoff between economic, environmental, and social considerations: A multi-objective non-linear optimization model under uncertainty. Agric. Syst. 2020, 178, 102685. [Google Scholar] [CrossRef]
- Khatami, R.; Mountrakis, G.; Stehman, S.V. A meta-analysis of remote sensing research on supervised pixel-based land-cover image classification processes: General guidelines for practitioners and future research. Remote Sens. Environ. 2016, 177, 89–100. [Google Scholar] [CrossRef] [Green Version]
- Liakos, K.G.; Busato, P.; Moshou, D.; Pearson, S.; Bochtis, D. Machine learning in agriculture: A review. Sensors 2018, 18, 2674. [Google Scholar] [CrossRef] [PubMed] [Green Version]
- Sánchez, N.; González-Zamora, A.; Martínez-Fernandez, J.; Piles, M.; Pablos, M. Integrated remote sensing approach to global agricultural drought monitoring. Agric. For. Meteorol. 2018, 259, 141–153. [Google Scholar] [CrossRef]
- Kaspar, H.; Annemarie, S.; Andreas, H.; Duong, H.N.; Jefferson, F. Mapping the expansion of boom crops in mainland southeast Asia using dense time stacks of Landsat data. Remote Sens. 2017, 9, 320. [Google Scholar]
- Wang, J.; Xiao, X.; Liu, L.; Wu, X.; Qin, Y.; Steiner, J.L.; Dong, J. Mapping sugarcane plantation dynamics in Guangxi, China, by time series Sentinel-1, Sentinel-2 and Landsat images. Remote Sens. Environ. 2020, 247, 111951. [Google Scholar] [CrossRef]
- Song, X.; Huang, W.; Hansen, M.C.; Potapov, P. An evaluation of Landsat, Sentinel-2, Sentinel-1 and MODIS data for crop type mapping. Sci. Remote Sens. 2021, 3, 100018. [Google Scholar] [CrossRef]
- Vuolo, F.; Neuwirth, M.; Immitzer, M.; Atzberger, C.; Ng, W. How much does multi-temporal Sentinel-2 data improve crop type classification? Int. J. Appl. Earth Obs. Geoinf. 2018, 72, 122–130. [Google Scholar] [CrossRef]
- Huang, Q.; Tang, H.; Zhou, Q.; Wu, W.; Wang, L.; Zhang, L. Remote-sensing based monitoring of planting structure and growth condition of major crops in Northeast China. Trans. Chin. Soc. Agric. Eng. 2010, 26, 218–223. [Google Scholar]
- Jia, K.; Wu, B.; Li, Q. Crop classification using HJ satellite multispectral data in the North China Plain. J. Appl. Remote Sens. 2013, 7, 73576. [Google Scholar] [CrossRef]
- Xiong, Y.; Zhang, Q. Cropping structure extraction with NDVI time-series images in the northern Tianshan Economic Belt. Arid Land Geogr. 2019, 42, 1105–1114. [Google Scholar]
- Holden, C.E.; Woodcock, C.E. An analysis of Landsat 7 and Landsat 8 underflight data and the implications for time series investigations. Remote Sens. Environ. 2016, 185, 16–36. [Google Scholar] [CrossRef] [Green Version]
- Tan, J.; Yang, P.; Liu, Z.; Wu, W.; Zhang, L.; Li, Z.; You, L.; Tang, H.; Li, Z. Spatio-temporal dynamics of maize cropping system in Northeast China between 1980 and 2010 by using spatial production allocation model. J. Geogr. Sci. 2014, 24, 397–410. [Google Scholar] [CrossRef]
- Mathur, A.; Foody, G.M. Crop classification by support vector machine with intelligently selected training data for an operational application. Int. J. Remote Sens. 2008, 29, 2227–2240. [Google Scholar] [CrossRef] [Green Version]
- Chance, E.W.; Cobourn, K.M.; Thomas, V.A. Trend detection for the extent of irrigated agriculture in Idaho’s Snake River Plain, 1984–2016. Remote Sens. 2018, 10, 145. [Google Scholar] [CrossRef] [Green Version]
- Sun, C.; Li, J.; Liu, Y.; Liu, Y.; Liu, R. Plant species classification in salt marshes using phenological parameters derived from Sentinel-2 pixel-differential time-series. Remote Sens. Environ. 2021, 256, 112320. [Google Scholar] [CrossRef]
- Zhao, J.; Zhong, Y.; Hu, X.; Wei, L.; Zhang, L. A robust spectral-spatial approach to identifying heterogeneous crops using remote sensing imagery with high spectral and spatial resolutions. Remote Sens. Environ. 2020, 239, 111605. [Google Scholar] [CrossRef]
- Li, M.; Ma, L.; Blaschke, T.; Cheng, L.; Tiede, D. A systematic comparison of different object-based classification techniques using high spatial resolution imagery in agricultural environments. Int. J. Appl. Earth Obs. Geoinf. 2016, 49, 87–98. [Google Scholar] [CrossRef]
- Lichtblau, E.; Oswald, C.J. Classification of impervious land-use features using object-based image analysis and data fusion. Computers, Environment and Urban Systems. Comput. Environ. Urban Syst. 2019, 75, 103–116. [Google Scholar] [CrossRef]
- Waldner, F.; Fritz, S.; Gregorio, A.D.; Defourny, P. Mapping priorities to focus cropland mapping activities: Fitness assessment of existing global, regional and national cropland maps. Remote Sens. 2015, 7, 7959–7986. [Google Scholar] [CrossRef] [Green Version]
- Cai, Y.; Guan, K.; Peng, J.; Wang, S.; Seifert, C.; Wardlow, B.; Li, Z. A high-performance and in-season classification system of field-level crop types using time-series Landsat data and a machine learning approach. Remote Sens. Environ. 2018, 210, 35–47. [Google Scholar] [CrossRef]
- Foody, G.M.; Campbell, N.; Trodd, N.; Wood, T. Derivation and applications of probabilistic measures of class membership from the maximum-likelihood classification. Photogramm. Eng. Remote Sens. 1992, 58, 1335–1341. [Google Scholar]
- Waheed, T.; Bonnell, R.B.; Prasher, S.O.; Paulet, E. Measuring performance in precision agriculture: CART—A decision tree approach. Agric. Water Manag. 2006, 84, 173–185. [Google Scholar] [CrossRef]
- Foody, G.M. Approaches for the production and evaluation of fuzzy land cover classifications from remotely-sensed data. Int. J. Remote Sens. 1996, 17, 1317–1340. [Google Scholar] [CrossRef]
- Cao, J.; Zhang, Z.; Zhang, L.; Luo, Y.; Li, Z.; Tao, F. Damage evaluation of soybean chilling injury based on Google Earth Engine (GEE) and crop modelling. J. Geogr. Sci. 2020, 30, 1249–1265. [Google Scholar] [CrossRef]
- Ran, G.; Wei, Y.; Gordon, H.; Amit, K. Detecting the boundaries of urban areas in India: A dataset for pixel-based image classification in Google Earth Engine. Remote Sens. 2016, 8, 634. [Google Scholar]
- Lin, L.; Hao, Z.; Post, C.J.; Mikhailova, E.A.; Yu, K.; Yang, L.; Liu, J. Monitoring land cover change on a rapidly urbanizing island using Google Earth Engine. Appl. Sci. 2020, 10, 7336. [Google Scholar] [CrossRef]
- Al-Shammari, D.; Fuentes, I.; Whelan, B.M.; Filippi, P.; Bishop, T.F.A. Mapping of cotton fields within-season using phenology-based metrics derived from a time series of Landsat imagery. Remote Sens. 2020, 12, 3038. [Google Scholar] [CrossRef]
- Ji, H.; Li, X.; Wei, X.; Liu, W.; Zhang, L.; Wang, L. Mapping 10-m resolution rural settlements using multi-source remote sensing datasets with the Google Earth Engine platform. Remote Sens. 2020, 12, 2832. [Google Scholar] [CrossRef]
- Pokhrel, I.; Kalra, A.; Rahaman, M.; Thakali, R. Forecasting of future flooding and risk assessment under CMIP6 climate projection in neuse river, North Carolina. Forecasting 2020, 2, 323–345. [Google Scholar] [CrossRef]
- Sun, J.; Yang, Y.; Liu, Y.; Chen, C.; Rao, W.; Bai, Y. Univariate time series classification using information geometry. Pattern Recognit. 2019, 95, 24–35. [Google Scholar] [CrossRef]
- Brinkhoff, J.; Hornbuckle, J.; Barton, J.L. Assessment of aquatic weed in irrigation channels using UAV and satellite imagery. Water 2018, 10, 1497. [Google Scholar] [CrossRef] [Green Version]
- Zhang, J.; Okin, G.S.; Zhou, B. Assimilating optical satellite remote sensing images and field data to predict surface indicators in the Western U.S.: Assessing error in satellite predictions based on large geographical datasets with the use of machine learning. Remote Sens. Environ. 2019, 233, 111382. [Google Scholar] [CrossRef]
- Ma, L.; Li, M.; Ma, X.; Cheng, L.; Du, P.; Liu, Y. A review of supervised object-based land-cover image classification. ISPRS J. Photogramm. Remote Sens. 2017, 130, 277–293. [Google Scholar] [CrossRef]
- Vieira, M.A.; Formaggio, A.R.; Rennó, C.D.; Atzberger, C.; Aguiar, D.A.; Mello, M.P. Object based image analysis and data mining applied to a remotely sensed Landsat time-series to map sugarcane over large areas. Remote Sens. Environ. 2012, 123, 553–562. [Google Scholar] [CrossRef]
- Grabska, E.; Frantz, D.; Ostapowicz, K. Evaluation of machine learning algorithms for forest stand species mapping using Sentinel-2 imagery and environmental data in the Polish Carpathians. Remote Sens. Environ. 2020, 251, 112103. [Google Scholar] [CrossRef]
- Waske, B.; Benediktsson, J.A. Fusion of support vector machines for classification of multisensor data. IEEE Trans. Geosci. Remote Sens. 2007, 45, 3858–3866. [Google Scholar] [CrossRef]
- Breiman, L. Random forests. Mach. Learn. 2001, 45, 5–32. [Google Scholar] [CrossRef] [Green Version]
- Pal, M. Random forest classifier for remote sensing classification. Int. J. Remote Sens. 2005, 26, 217–222. [Google Scholar] [CrossRef]
- Carter, C.; Liang, S. Evaluation of ten machine learning methods for estimating terrestrial evapotranspiration from remote sensing. Int. J. Appl. Earth Obs. Geoinf. 2019, 78, 86–92. [Google Scholar] [CrossRef]
- Li, Y.; Chen, W. A comparative performance assessment of ensemble learning for credit scoring. Mathematics 2020, 8, 1756. [Google Scholar] [CrossRef]
- Pareeth, S.; Karimi, P.; Shafiei, M.; Fraiture, C. Mapping agricultural landuse patterns from time series of Landsat 8 using random forest based hierarchial approach. Remote Sens. 2019, 11, 601. [Google Scholar] [CrossRef] [Green Version]
- Son, N.T.; Chen, C.F.; Chen, C.R.; Guo, H.Y. Classification of multitemporal Sentinel-2 data for field-level monitoring of rice cropping practices in Taiwan. Adv. Space Res. 2020, 65, 1910–1921. [Google Scholar] [CrossRef]
- Dempewolf, J.; Adusei, B.; Becker-Reshef, I.; Hansen, M.; Potapov, P.; Khan, A.; Barker, B. Wheat yield forecasting for Punjab Province from vegetation index time series and historic crop statistics. Remote Sens. 2014, 6, 9653–9675. [Google Scholar] [CrossRef] [Green Version]
- Chang, J.; Hansen, M.C.; Pittman, K.; Carroll, M.; DiMiceli, C. Corn and soybean mapping in the United States using MODIS time-series data sets. Agron. J. 2007, 99, 1654–1664. [Google Scholar] [CrossRef]
- Zhai, Y.; Wang, N.; Zhang, L.; Hao, L.; Hao, C. Automatic crop classification in Northeastern China by improved nonlinear dimensionality reduction for satellite image time series. Remote Sens. 2020, 12, 2726. [Google Scholar] [CrossRef]
- Wen, Y.; Shang, S.; Rahman, K. Pre-constrained machine learning method for multi-year mapping of three major crops in a large irrigation district. Remote Sens. 2019, 11, 242. [Google Scholar] [CrossRef] [Green Version]
- Liu, J.; Zhong, S.; Liang, W. Extraction on crops planting structure based on multi-temporal Landsat8 OLI images. Remote Sens. Technol. Appl. 2015, 30, 775–783. [Google Scholar]
- Liu, J.; Wang, L.; Teng, F.; Yang, L.; Gao, J.; Yao, B.; Yang, F. Impact of red-edge waveband of RapidEye satellite on estimation accuracy of crop planting area. Trans. Chin. Soc. Agric. Engin. 2016, 32, 140–148. [Google Scholar]
- NBS. National Statistical Yearbook. 2019. Available online: http://www.stats.gov.cn/tjsj/ndsj/2019/indexch.htm (accessed on 20 October 2020).
- HPBS. Henan Statistical Yearbook. 2019. Available online: http://oss.henan.gov.cn/sbgt-wztipt/attachment/hntjj/hntj/lib/tjnj/2019/zk/indexch.htm (accessed on 20 October 2020).
- Jin, X.; Li, Z.; Feng, H.; Ren, H.; Li, S. Deep neural network algorithm for estimating maize biomass based on simulated Sentinel 2A vegetation indices and leaf area index. Crop. J. 2020, 8, 87–97. [Google Scholar] [CrossRef]
- Zhang, M.; Su, W.; Fu, Y.; Zhu, D.; Xue, J.; Huang, J.; Wang, W.; Wu, J.; Yao, C. Super-resolution enhancement of Sentinel-2 image for retrieving LAI and chlorophyll content of summer corn. Eur. J. Agron. 2019, 9, 125938. [Google Scholar] [CrossRef]
- Zhang, T.; Su, J.; Liu, C.; Chen, W. Potential bands of Sentinel-2A satellite for classification problems in precision agriculture. Int. J. Autom. Comput. 2019, 16, 16–26. [Google Scholar] [CrossRef] [Green Version]
- Kumar, S.; Jain, K. A multi-temporal Landsat data analysis for land-use/land-cover change in Haridwar Region using remote sensing techniques. Procedia Comput. Sci. 2020, 171, 1184–1193. [Google Scholar] [CrossRef]
- Firozjaei, M.; Kiavarz, M.; Homaee, M.; Arsanjani, J.; Alavipanah, S. A novel method to quantify urban surface ecological poorness zone: A case study of several European cities. Sci. Total Environ. 2020, 11, 143755. [Google Scholar]
- Gao, F.; Anderson, M.; Daughtry, C.; Karnieli, A.; Hively, D.; Kustas, W. A within-season approach for detecting early growth stages in corn and soybean using high temporal and spatial resolution imagery. Remote Sens. Environ. 2020, 242, 111752. [Google Scholar] [CrossRef]
- Tobler, W. A computer movie simulating urban growth in the Detroit Region. Econ. Geogr. 1970, 46, 234–240. [Google Scholar] [CrossRef]
- Wang, Q.; Shi, W.; Li, Z.; Peter, M.A. Fusion of Sentinel-2 images. Remote Sens. Environ. 2016, 187, 241–252. [Google Scholar] [CrossRef] [Green Version]
- Li, Z.; Angela, E.; Sun, Q.; Liu, Y.; Shuai, Y.; Wang, Z.; Peter, B.; Crystal, S. Preliminary assessment of 20-m surface albedo retrievals from sentinel-2A surface reflectance and MODIS/VIIRS surface anisotropy measures. Remote Sens. Environ. 2018, 8, 352–365. [Google Scholar] [CrossRef]
- Loozen, Y.; Rebel, K.T.; Jong, S.M.; Lu, M.; Karssenberg, D. Mapping canopy nitrogen in European forests using remote sensing and environmental variables with the random forests method. Remote Sens. Environ. 2020, 247, 111933. [Google Scholar] [CrossRef]
- Gibson, R.; Danaher, T.; Hehir, W.; Collins, L. A remote sensing approach to mapping fire severity in south-eastern Australia using Sentinel 2 and random forest. Remote Sens. Environ. 2020, 240, 111702. [Google Scholar] [CrossRef]
- Wangchuk, S.; Bolch, T. Mapping of glacial lakes using Sentinel-1 and Sentinel-2 data and a random forest classifier: Strengths and challenges. Sci. Remote Sens. 2020, 2, 100008. [Google Scholar] [CrossRef]
- Belgiu, M.; Bijker, W.; Csillik, O.; Stein, A. Phenology-based sample generation for supervised crop type classification. Int. J. Appl. Earth Obs. Geoinf. 2020, 95, 102264. [Google Scholar] [CrossRef]
- Congalton, R.G. Review of assessing the accuracy of classifications of remotely sensed data. Remote Sens. Environ. 1991, 37, 35–46. [Google Scholar] [CrossRef]
- Bandaru, V.; Yaramasu, R.; Koutilya, P.N.V.R.; He, J.; Fernando, S.; Sahajpal, R.; Wardlow, B.D.; Suyker, A.; Justice, C. PhenoCrop: An integrated satellite-based framework to estimate physiological growth stages of corn and soybeans. Remote Sens. Environ. 2020, 247, 111933. [Google Scholar] [CrossRef]
- Forkuor, G.; Conrad, C.; Thiel, M.; Landmann, T.; Barry, B. Evaluating the sequential masking classification approach for improvingcrop discrimination in the Sudanian Savanna of West Africa. Comput. Electron. Agric. 2015, 118, 380–389. [Google Scholar] [CrossRef]
- Lim, J.; Kim, K.; Jin, R. Tree species classification using Hyperion and Sentinel-2 data with machine learning in South Korea and China. Int. J. Geo-Inf. 2019, 8, 150. [Google Scholar] [CrossRef] [Green Version]
- Shao, Y.; Lunetta, R.S. Comparison of support vector machine, neural network, and CART algorithms for the land-cover classification using limited training data points. ISPRS J. Photogramm. Remote Sens. 2012, 70, 78–87. [Google Scholar] [CrossRef]
- Mafanya, M.; Tsele, P.; Botai, J.; Manyama, P.; Swart, B.; Monate, T. Evaluating pixel and object-based image classification techniques for mapping plant invasions from UAV derived aerial imagery: Harrisia pomanensis as a case study. ISPRS J. Photogramm. Remote Sens. 2017, 129, 1–11. [Google Scholar] [CrossRef] [Green Version]
- Nanki, S.; Edzer, P.; Gilberto, C. Using Google Earth Engine to detect land cover change: Singapore as a use case. Eur. J. Remote Sens. 2018, 51, 486–500. [Google Scholar]
- Gorelick, N.; Hancher, M.; Dixon, M.; Ilyushchenko, S.; Thau, D.; Moore, R. Google Earth Engine: Planetary-scale geospatial analysis for everyone. Remote Sens. Environ. 2017, 202, 18–27. [Google Scholar] [CrossRef]
- Peña-Barragán, J.M.; Ngugi, M.K.; Plant, R.E.; Six, J. Object-based crop identification using multiple vegetation indices, textural features and crop phenology. Remote Sens. Environ. 2011, 115, 1301–1316. [Google Scholar] [CrossRef]
- Veloso, A.; Mermoz, S.; Bouvet, A.; Le Toan, T.; Planells, M.; Dejoux, J.-F.; Ceschia, E. Understanding the temporal behavior of crops using sentinel-1 and sentinel-2-like data for agricultural applications. Remote Sens. Environ. 2017, 199, 415–426. [Google Scholar] [CrossRef]
- Erinjery, J.J.; Singh, M.; Kent, R. Mapping and assessment of vegetation types in the tropical rainforests of the Western Ghats using multispectral Sentinel-2 and SAR Sentinel-1 satellite imagery. Remote Sens. Environ. 2018, 216, 345–354. [Google Scholar] [CrossRef]
- Yi, Z.; Jia, L.; Chen, Q. Crop classification using multi-temporal Sentinel-2 data in the Shiyang River Basin of China. Remote Sens. 2020, 12, 4052. [Google Scholar] [CrossRef]
- James, T.; Schillaci, C.; Lipani, A. Convolutional neural networks for water segmentation using Sentinel-2 red, green, blue (RGB) composites and derived spectral indices. Int. J. Remote Sens. 2021, 42, 5338–5365. [Google Scholar] [CrossRef]
- Chaves, M.; Picoli, M.C.A.; Sanches, I. Recent applications of Landsat 8/OLI and Sentinel-2/MSI for land use and land cover mapping: A systematic review. Remote Sens. 2020, 12, 3062. [Google Scholar] [CrossRef]
- Patrick, G.; Claas, N.; Patrick, H. Intra-annual reflectance composites from Sentinel-2 and Landsat for national-scale crop and land cover mapping. Remote Sens. Environ. 2019, 220, 135–151. [Google Scholar]
- Liu, Y.; Wang, X.; Qian, J. Crop Distribution Extraction Based on Sentinel Data. In Proceedings of the 2021 International Conference on Power Grid System and Green Energy (PGSGE 2021), Wuhan, China, 26–28 March 2021; p. 02081. [Google Scholar] [CrossRef]
- Gu, J.; Congalton, R.G. Analysis of the impact of positional accuracy when using a single pixel for thematic accuracy assessment. Remote Sens. 2020, 12, 4093. [Google Scholar] [CrossRef]


| Band | Central Wavelength (nm) | Resolution (m) | Spectral Region |
|---|---|---|---|
| B1 | 443.9(S2A)/442.3(S2B) | 60 | Aerosols |
| B2 | 496.6(S2A)/492.1(S2B) | 10 | Blue |
| B3 | 560(S2A)/559(S2B) | 10 | Green |
| B4 | 664.5(S2A)/665(S2B) | 10 | Red |
| B5 | 703.9(S2A)/703.8(S2B) | 20 | Red edge 1 |
| B6 | 740.2(S2A)/739.1(S2B) | 20 | Red edge 2 |
| B7 | 782.5(S2A)/779.7(S2B) | 20 | Red edge 3 |
| B8 | 835.1(S2A)/833(S2B) | 10 | Near infrared (NIR) |
| B8A | 864.8(S2A)/864(S2B) | 20 | Red edge 4 |
| B9 | 945(S2A)/943.2(S2B) | 60 | Water vapor |
| B10 | 1373.5(S2A)/1376.9(S2B) | 60 | Cirrus |
| B11 | 1613.7(S2A)/1610.4(S2B) | 20 | Shortwave infrared spectral range 1 (SWIR1) |
| B12 | 2202.4(S2A)/2185.7(S2B) | 20 | Shortwave infrared spectral range 2 (SWIR2) |
| QA10 | — | 10 | — |
| QA20 | — | 20 | — |
| QA60 | — | 60 | Cloud mask |
| Sowing Season | Landcover Types | Abbreviation | Classification Code | Description | Percentage in Sample Plots (%) | Sample Points |
|---|---|---|---|---|---|---|
| Winter | Wheat | WHE | 1 | Wheat pixels during the observation period | 65.33% | 347 |
| Garlic | GAR | 2 | Planting methods for mulching plastic | 6.81% | 28 | |
| Forest Land | WFL | 3 | Tea garden and nursery stock planted on cultivated land, as well as forests | 3.23% | 42 | |
| Non-cultivated | WNC | 4 | Reserved farmland for spring crops | 11.65% | 52 | |
| Others | WOTH | 5 | Winter vegetables, such as carrots, spinach, plastic shed vegetables and others | 0.44% | 32 | |
| Water | WAT | 7 | Water bodies such as ditches and ponds | 2.05% | — | |
| Rape | RAP | 8 | Minor and scattered planting area | 0.64% | 2 | |
| Paddy field | PAD | 9 | Crops are not planted for some reasons after harvesting rice in Xinyang City | — | 5 | |
| Spring/ Summer | Soybean | SOY | 1 | Concentrated planting in Xuchang City and Yongcheng City | 5.15% | 239 |
| Rehmannia | REH | 2 | Chinese herbal medicine, mainly planted in Wenxian County, Jiaozuo City | 0.44% | 9 | |
| Peanut | PEA | 3 | Peanut pixels during the observation period | 14.98% | 670 | |
| Forest Land | SFL | 4 | Tea garden and nursery stock planted on cultivated land, as well as forests | 5.21% | 182 | |
| Non-cultivated | SNC | 5 | Bare or idle land during the observation period | 0.02% | 3 | |
| Water | WAT | 7 | Water bodies such as ditches and ponds | 1.11% | — | |
| Others | SOTH | 8 | Pepper, melon, yam, plastic shed vegetables, and others | 6.12% | 191 | |
| Rice | RIC | 9 | It is mainly planted in southern Henan Province | 9.53% | 67 | |
| Tobacco | TOB | 10 | Small amount of planting in a few areas | 2.03% | 29 | |
| Maize | MAI | 11 | A major crop widely planted in summer | 45.13% | 292 | |
| Sesame | SES | 12 | Concentrated planting in Zhumadian City and Zhoukou City | 0.43% | 57 | |
| Millet | MIL | 13 | Concentrated planting in Sanmenxia City | — | 4 | |
| Glutinous rice | GRIC | 14 | Concentrated planting in Xinyang City, and its harvest time is about 15 days earlier than rice | — | 3 | |
| Urban | URB | 6 | Land for construction, such as houses and roads | 9.85% | — |
| City | Area Ratio of Different Terrain Regions (%) | NDVI-Based Threshold between Forest Land and Cultivated Land | Image Acquisition Date for Crop Extraction 2020/mm/dd | |||
|---|---|---|---|---|---|---|
| Plain | Hill | Mountainous | Winter | Summer | ||
| Anyang | 67.26 | 23.74 | 9.00 | 0.49 | 03/28–04/20 | 08/10–09/04 |
| Hebi | 79.58 | 18.08 | 2.34 | 0.49 | 04/07–04/17 | 08/10–09/04 |
| Jiyuan | 21.81 | 49.30 | 28.89 | 0.49 | 04/05–05/12 | 08/10–09/04 |
| Jiaozuo | 81.27 | 10.34 | 8.39 | 0.50 | 03/28–04/17 | 08/17–09/04 |
| Kaifeng | 100.00 | — | — | 0.47 | 03/20–05/12 | 08/17–09/04 |
| Luoyang | 8.14 | 39.24 | 52.62 | 0.49 | 03/18–05/17 | 08/10–09/04 |
| Luohe | 100.00 | — | — | 0.48 | 04/12–05/02 | 09/04 |
| Nanyang | 56.15 | 26.57 | 17.28 | 0.52 | 04/12–05/17 | 08/10–09/04 |
| Pingdingshan | 56.27 | 34.15 | 9.58 | 0.49 | 03/28–05/02 | 08/10–09/04 |
| Puyang | 100.00 | — | — | 0.48 | 04/07–05/02 | 08/17–09/04 |
| Sanmenxia | <0.01 | 13.61 | 86.38 | 0.50 | 02/10–04/28 | 08/26–09/02 |
| Shangqiu | 100.00 | — | — | 0.48 | 03/20–04/24 | 08/17–09/06 |
| Xinxiang | 87.28 | 5.96 | 6.76 | 0.48 | 03/28–04/17 | 08/17–09/04 |
| Xinyang | 86.72 | 11.10 | 2.18 | 0.51 | 03/20–05/02 | 08/10–09/06 |
| Xuchang | 87.40 | 11.41 | 1.19 | 0.48 | 04/07–05/02 | 08/10–09/04 |
| Zhengzhou | 60.54 | 31.13 | 8.33 | 0.48 | 04/22–05/02 | 08/10–09/04 |
| Zhoukou | 100.00 | — | — | 0.48 | 04/12–05/02 | 08/10–09/04 |
| Zhumadian | 92.38 | 7.19 | 0.43 | 0.51 | 04/09–05/12 | 08/10–09/04 |
| Season | Land Types | Pixel Numbers of Reclassification Results | Pixel Numbers of Resampling Plots | Proportion |
|---|---|---|---|---|
| Winter | WHE | 190,630 | 198,578 | 96.00% |
| GAR | 23,022 | 20,695 | 111.24% | |
| WFL | 14,440 | 9722 | 148.53% | |
| WNC | 27,252 | 35,146 | 77.54% | |
| WOTH | 1342 | 1331 | 100.83% | |
| URB | 38,512 | 29,838 | 129.07% | |
| WAT | 6303 | 6181 | 101.97% | |
| RAP | 1892 | 1905 | 99.32% | |
| Summer | SOY | 12,740 | 15,608 | 81.62% |
| REH | 1560 | 1355 | 115.13% | |
| PEA | 40,443 | 44,875 | 90.12% | |
| SFL | 21,012 | 15,741 | 133.49% | |
| SNC | 1 | 48 | 2.08% | |
| SOTH | 23,195 | 18,637 | 124.46% | |
| RIC | 25,222 | 28,658 | 88.01% | |
| URB | 38,512 | 29,838 | 129.07% | |
| WAT | 4244 | 3335 | 127.26% | |
| TOB | 6854 | 6144 | 111.56% | |
| MAI | 127,928 | 137,860 | 92.80% | |
| SES | 1682 | 1297 | 129.68% |
| Landcover Types | WFL | URB | WAT | WHE | WNC | GAR | PAD | RAP | WOTH | |||||
| Winter | 31.36 | 22.95 | 2.30 | 32.22 | 6.14 | 4.18 | 0.42 | 0.38 | 0.05 | |||||
| Landcover Types | SFL | URB | WAT | MAI | PEA | RIC | SOTH | SOY | TOB | MIL | GRIC | SES | REH | SNC |
| Summer | 34.58 | 22.95 | 2.61 | 21.34 | 6.67 | 2.58 | 2.41 | 2.00 | 1.07 | 0.51 | 0.42 | 0.38 | 0.10 | 0.01 |
| Spring | — | — | — | 0.68 | 1.69 | — | — | — | — | — | — | — | — | — |
| Crop Types | WHE | MAI | PEA | RIC and GRIC | SOY | TOB | ||||||||
| Reclassification results | 32.22 | 22.02 | 8.63 | 3.00 | 2.00 | 1.07 | ||||||||
| Results in 2018 | 34.37 | 23.47 | 7.20 | 3.72 | 2.31 | 0.57 | ||||||||
Publisher’s Note: MDPI stays neutral with regard to jurisdictional claims in published maps and institutional affiliations. |
© 2021 by the authors. Licensee MDPI, Basel, Switzerland. This article is an open access article distributed under the terms and conditions of the Creative Commons Attribution (CC BY) license (https://creativecommons.org/licenses/by/4.0/).
Share and Cite
Wang, L.; Wang, J.; Qin, F. Feature Fusion Approach for Temporal Land Use Mapping in Complex Agricultural Areas. Remote Sens. 2021, 13, 2517. https://doi.org/10.3390/rs13132517
Wang L, Wang J, Qin F. Feature Fusion Approach for Temporal Land Use Mapping in Complex Agricultural Areas. Remote Sensing. 2021; 13(13):2517. https://doi.org/10.3390/rs13132517
Chicago/Turabian StyleWang, Lijun, Jiayao Wang, and Fen Qin. 2021. "Feature Fusion Approach for Temporal Land Use Mapping in Complex Agricultural Areas" Remote Sensing 13, no. 13: 2517. https://doi.org/10.3390/rs13132517
APA StyleWang, L., Wang, J., & Qin, F. (2021). Feature Fusion Approach for Temporal Land Use Mapping in Complex Agricultural Areas. Remote Sensing, 13(13), 2517. https://doi.org/10.3390/rs13132517