Abstract
This paper reviewed a set of twenty-one original and innovative papers included in a special issue on UAVs for vegetation monitoring, which proposed new methods and techniques applied to diverse agricultural and forestry scenarios. Three general categories were considered: (1) sensors and vegetation indices used, (2) technological goals pursued, and (3) agroforestry applications. Some investigations focused on issues related to UAV flight operations, spatial resolution requirements, and computation and data analytics, while others studied the ability of UAVs for characterizing relevant vegetation features (mainly canopy cover and crop height) or for detecting different plant/crop stressors, such as nutrient content/deficiencies, water needs, weeds, and diseases. The general goal was proposing UAV-based technological solutions for a better use of agricultural and forestry resources and more efficient production with relevant economic and environmental benefits.
1. Introduction
Global plant production faces the major challenge of sustainability under the constraint of a rapidly growing world population and the gradual depletion of natural resources. In this context, remote sensing can play a fundamental role in changing the production model by developing and implementing new technologies for vegetation monitoring (e.g., advanced sensors and remote platforms, powerful algorithms, etc.) that will lead to higher yields, while also obtaining more sustainable and environmentally friendly food and plant products [1]. Among the recent innovations, the unmanned aerial vehicles (UAVs) or drones have demonstrated their suitability for timely tracking and assessment of vegetation status due to several advantages, as follows: (1) they can operate at low altitudes to provide aerial imagery with ultra-high spatial resolution allowing detection of fine details of vegetation, (2) the flights can be scheduled with great flexibility according to critical moments imposed by vegetation progress over time, (3) they can use diverse sensors and perception systems acquiring different ranges of vegetation spectrum (visible, infrared, thermal), (4) this technology can also generate digital surface models (DSMs) with three-dimensional (3D) measurements of vegetation by using highly overlapping images and applying photo-reconstruction procedures with the structure-from-motion (SfM) technique [2]. The UAVs are therefore a cost-effective tool for obtaining high spatial resolution 3D data of plants and trees that are not feasible with airborne or satellite platforms [3], filling the gap between ground-based devices and these other traditional remote sensing systems. In addition, the UAV-based digital images can be an efficient alternative to data collected with manual fieldwork, which is often arduous, involves destructive sampling, and may provide inconsistent and subjective information. As a result of these strengths, the UAVs are becoming very suitable platforms for agroforestry applications [4,5], such as vegetation characterization and mapping [6], land management [7], environmental monitoring [8], and especially to address diverse precision agriculture objectives [9] and plant phenotypic characterization in breeding programs [10,11].
The large amount of detailed data embedded in UAV imagery requires the development and application of powerful analysis procedures capable of extracting information related to the structural and biochemical composition of vegetation that provides a better understanding of relevant plant traits. Traditional statistical analysis, such as linear classifiers, spatial statistics, or extrema estimators, and pixel-based image analysis are commonly used [12]. However, advanced procedures such as the object-based image analysis (OBIA) paradigm, computer vision techniques, and machine learning algorithms further exploit the advantages of the UAV [13,14], enabling rapid and accurate vegetation analysis and, consequently, helping end-users (e.g., farmers, advisors, and public administrations) in the decision-making process of agricultural and forestry management.
Given the increased interest for new investigations and advances in the areas of UAV technology and UAV-based image processing/analysis in agricultural and forest scenarios, this Special Issue (SI) collected a set of twenty-one original and innovative articles that showed several applications of the UAVs for vegetation monitoring in order to deepen our understanding of these ecosystems. The SI includes the recent scientific contributions organized according to three general categories: (1) type of the sensor employed and, additionally, vegetation index (VI) applied, (2) technological goals pursued, in terms of UAV configuration and specifications, and issues related to image spatial resolution, computation, artificial intelligence, and image processing algorithms, and (3) agroforestry applications, which involved novel UAV-based data-driven approaches for monitoring vegetation features in certain critical dates, measuring plant trails over time for crop dynamics studies, and detecting and modeling biotic (weeds, disease) and abiotic (water, nutrition deficiencies) stress factors. These three categories shared the common objective of proposing new methods and techniques to achieve better use of agricultural and forestry resources and more efficient production with relevant economic and environmental benefits.
2. Sensors and Vegetation Indices Used
A wide range of sensors is available for vegetation monitoring, which can be grouped into visible light (i.e., sensitive to the red, green, blue wavebands, also known as RGB cameras), multispectral, hyperspectral, and thermal. The selection of the proper sensor should be made according to specific agricultural or forestry objectives, i.e., for vegetation characterization (e.g., measuring vegetation features and plant traits) or for assessing certain variables associated to plant production (e.g., nutrient content/deficiencies and water stress) and plant protection (e.g., weed detection and disease diagnosis) issues (Figure 1). For example, RGB and multispectral sensors were selected to determine canopy cover (CC), also known as fractional canopy/vegetation cover or vegetation coverage, where the main challenge consisted of separating vegetation from the background by performing simple linear regression models [15,16,17]. RGB and multispectral sensors were used to monitor crop dynamics, as these sensors allowed building DEMs through a photogrammetric SfM process, then calculating crop height (CH) values, and finally performing morphological procedures [18,19,20]. These two sensors are cheaper and easier to use than thermal and hyperspectral sensors, and do not require a complex calibration phase, so they proved to be optimal for assessing plant structural traits.
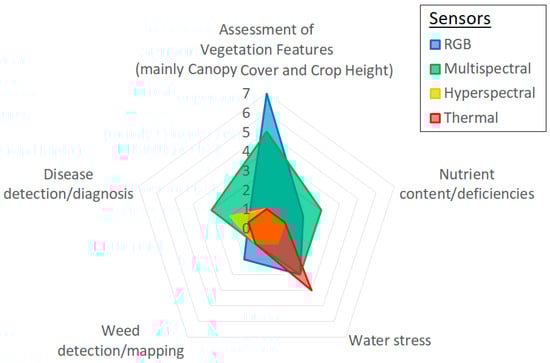
Figure 1.
Sensors used in the experiments performed in this SI according to agricultural and forestry objectives.
The RGB and multispectral sensors were also suitable for the target of identifying abiotic stress (e.g., Nitrogen (N) content/deficiencies), although this goal required detecting subtle changes in leaf pigment contents, for which it is necessary to employ more complex procedures, such as machine learning (ML) or partial least squares regressions (PLSR) algorithms. Similar approaches were followed for water deficiencies causing effects on chlorophyll content and organization in the mesophyll and leaf structure. It was possible to address this goal using RGB and thermal-based VIs [21] or multispectral sensors and convolutional neural networks (CNNs) [22]. It is also common to use thermal sensors since water stress causes stomatal closure that reduces transpiration and evaporative cooling and increases temperature [23]. In this way, data from thermal sensors were combined with RGB [21] or multispectral sensors [24,25] to take advantage of the information provided in different areas of the spectrum and the higher spatial resolution of such sensors.
Regarding the assessment of plant biotic stress, the RGB sensors were used to detect weed patches at mid- to late-season using CNN models [26]. However, narrower bandwidth spectral data were required to detect changes in the biochemical and biophysical parameters caused by diseases and, in some cases, texture features (TFs) to improve the diagnosis accuracy. Thus, multispectral and hyperspectral sensors were used for mapping disease occurrence [27,28,29]. The red-edge information was also relevant for this goal, so regardless of the sensor selected, the images should contain information in this specific spectral region.
It is worth noting that vegetation indices (VIs) were also widely used in many investigations on vegetation monitoring (Table 1), as they enhance the spectral differences of vegetation at specific wavelengths. The applications of the VIs used in this SI are discussed further in Section 4.

Table 1.
Vegetation indices (VIs) applied in the papers published in this special issue.
3. Research Focused to Technological Goals
Development and validation of new technologies and computational procedures for vegetation monitoring requires the definition of the optimal flight and sensor configuration, appropriate data format, workflow specifications, and innovative analysis methods that lead to the generation of scientific knowledge on vegetation condition and management. Therefore, this section describes the contributions partially or entirely focused to technological goals, including issues on UAV flight operations, spatial resolution requirements, and computation and data analytics.
3.1. UAV Flight Operations
UAV flight is the first step for image acquisition. Designing a UAV route, i.e., a mission planning or a flight planning, is a critical task requiring several parameters. The quality and viability of acquired imagery and data will largely depend on those operation parameters and on how the flights are performed. The configuration of flight mission and the specifications of the UAV employed must be evaluated in detail and adapted to each specific objective, particularity in the case of agronomical applications [32]. In this regard, Jiang et al. (2020) [31] evaluated the influence of flight altitude, solar zenith angle (SZA), and time of day (TOD) for NDVI calculation at different paddy rice growth levels. The results indicated that both SZA and TOD—which is logical since SZAs depend on the TOD—had the most significant impact on estimated NDVI values following a directly proportional relation. For a flight altitude below 100 m, the correlation with estimated NDVI was inversely proportional for maximum and mean values, while minimum NDVIs increased with higher flight altitude values. In addition, the most accurate reflectivity, and thus the estimated NDVI values, were achieved at the smaller SZA.
The UAVs can also suffer from stability problems, such as shaking or imprecise geographic coordinates (X-Y), which are more pronounced when UAV is piloted manually. They are caused by wind perturbations or improper attitude stabilization, resulting in georeferencing problems with consequent complications for vegetation mapping. Therefore, it is important to ensure a robust stabilization system that provides high-quality image data and, thus, improves the precision of the image registration algorithms. Colorado et al. (2020) [30] developed a novel UAV stabilization control called BS+DAF (backstepping + desired angular acceleration function) to reduce angular wind-induced disturbances. The BS+DAF consisted of a nonlinear trajectory-tracking controller that adds aerodynamics information to control yaw, producing roll and pitch acceleration commands to reduce sudden angular acceleration changes due to external perturbations as those caused by wind. Therefore, precise angular stabilization can be maintained during flight, resulting in a more quality image acquisition and registration. These authors also proved that better correlations in canopy N estimations were obtained when the BS+DAF controller was implemented in the UAV flights.
3.2. Spatial Resolution Requeriments
Flight altitude is a critical parameter in remote image acquisition, as it has strong implications in image spatial resolution, flight duration, spatial coverage, and computational cost of the image processing tasks [33,34]. Lower altitudes result in images with finer spatial resolution, but require longer flights and demand higher computational times for image processing [35]. Therefore, evaluation of flight altitude and spatial resolution was a central point in some investigations of this SI [16,24,27,29,36], being a usual objective to resample UAV images to spatial resolutions similar to those of common satellites, e.g., 5 m of Rapideye, 10 m of Sentinel-2, and 30 m of LANDSAT, in order to study the potential of using such satellite platforms instead of UAV for specific agro-forestry goals. Thus, Iizuka et al. (2019) [16] discovered that CC estimation was affected by spatial resolution and coarser resolutions showed stronger correlation with manually delineated data in an RGB orthomosaic, concluding that the satellite images could be feasible for this purpose. These authors explained that variability decreases when finer data is aggregated to a larger unit, thus increasing correlations. However, Nassar et al. (2020) [24] demonstrated that a very high spatial resolution is necessary to use the Two-Source Energy Balance with a dual temperature (TSEB2T) model for successfully estimating evapotranspiration (ET). The authors argued that the selected spatial resolution should be fine enough to discriminate plant canopy and soil temperature, as they evaluated multiple spatial domain scales (3.6, 7.2, 14.4, and 30 m), leading them to conclude that the current satellites were not suitable for this application, especially those with spatial resolution of 30 m or broader, e.g., Landsat.
Image resampling approaches were also carried out in experiments for disease detection, where spatial resolution is a crucial factor as disease-induced biological symptoms are subtle and only detectable at high resolution values. Thus, Guo et al. (2021) [29] and Ye et al. (2020) [27] evaluated several pixel sizes to select the optimal resolution for mapping disease areas, yielding 0.01 m for yellow rust in wheat and a minimum of 0.5 m in the case of Fusarium wilt in banana, respectively. In addition, Zhang et al. (2020) [36] explored the influence of image spatial resolution on the segmentation process prior to identify N deficiency in rapeseed fields, concluding that the optimal value by using the U-Net convolutional neural network architecture will depend on the target size and stating an appropriate patch size of 256x256 pixels in the purple rapeseed leaves.
3.3. Computation and Data Analytics
Innovations in data analytics are also contributing to overcome diverse challenges in agroforestry scenarios, especially regarding to the implementation of computational advances that speed up the processing times and of new algorithms that provide timely and accurate analysis to assist in complex studies and decision-making processes. One of the disciplines most involved in this progress is artificial intelligence (AI) and, in particular, ML tools such as support vector machine (SVM), random forest (RF), and CNNs algorithms that can solve complex matters using datasets from multiple sources and helping to discover hidden rules and patterns in such large datasets.
Machefer et al. (2020) [37] developed a novel algorithm for counting and sizing potato and lettuce plants based on a deep learning (DL) approach. Their all-in-one algorithm was an adaptation of Mask R-CNN architecture that combined segmentation, plant delineation and counting tasks, avoiding an additional ”patching” step and simplifying the computational complexity. This approach was compared to a computer vision baseline showing better accuracy results for CNN-based method in both crops. Another example of ML techniques was applied by Fu et al. (2021) [38], who estimated winter wheat biomass during several growth stages using multiscale spectral features and TFs and least squares support vector machine (LSSVM) and partial least squares regressions (PLSR) analysis algorithms. The authors determined the optimal TFs for biomass estimation by combining two-dimensional (2D) Gabor filters and gray-level co-occurrence matrix (GLCM) analyses. The author argued that this method performed better using multiscale textures than single-scale textures, and concluded that biomass estimation did not significantly improve using hyperspectral data, showing that LSSVM regression with proper multiscale textural features was an optimal and simpler alternative to hyperspectral-based methods. Bhatnagar et al. (2020) [39] also compared several ML models, but included DL and segmentation algorithms to map raised bog vegetation communities using RGB and TFs. Based on these performances, RF with graph cut as segmentation technique was selected as the best ML classifier. The ResNet50 CNN with the SegNet semantic segmentation architecture was selected for DL. Although slightly better accuracy was reached with ResNet50- SegNet, these authors recommended RF-graph cut for ecotopes mapping, as DL required more dataset training, computation time, and hardware power.
4. Research Focused to Agroforestry Applications
4.1. Assessment of Vegetation Features
Canopy cover (CC), or the proportion of unit area covered by the vertical projection of plant canopy, is an important indicator of plant development, biomass, light interception, photosynthesis activity, and evapotranspiration partitioning [40,41]. Since CC has traditionally been determined using tedious and imprecise manual procedures, the development of an accurate and rapid remote-sensing based tool to measure this vegetation feature has been often a goal in agroforestry. In addition, UAV imagery can generate DSMs and 3D point clouds using photo-reconstruction and artificial vision techniques to provide the height information (or Z-value) at each coordinate (X,Y) as a basis for calculating the CH values of vegetation. Thus, this SI reports on several studies to assess these features and its temporal variation over the growing season for monitoring vegetation or crop dynamics with UAV-based RGB and multispectral images [15,16,17,18,19,20].
Ashapure et al. (2019) [15] computed CC over the cotton growing season using a model that combined an RGB-based VI with a morphological closing tool, which consisted of a combined dilation and erosion operation to remove the small holes, while keeping the separation boundary intact. The RGBVI was selected to be the most efficient VI for this purpose. These authors showed that the CC estimation model based VI alone was very unstable and failed to identify the canopy when the cotton leaves changed color after ripening. However, applying a morphological closure operation significantly improved the estimation, which led them to conclude that the proposed RGB-based CC model provides an affordable alternative to multispectral-based approaches, which rely on more sophisticated and expensive sensors.
In other study, Iizuka et al. (2019) [16] employed RGB and multispectral data to compute CC of several land uses/land covers in Indonesia peatland forest, including Acacia trees and other types of forests with rapid land transitions. The first step consisted of generating a map of land uses by applying the Multilayer-Perceptron (MLP) classification to the RGB images. Then, the VI that best computed the CC for each land use was selected, resulting in ReNDVI for Acacia and NDVI for grass/shrubs and non-vegetation classes. These authors stated that UAVs’ multispectral information can quickly quantify CC in tropical forests, especially those of fast-growing Acacia that can rapidly change land conditions.
Following a similar approach, Lima-Cueto et al. (2019) [17] quantified CC in olive orchards, where cover crops are a critical agro-environmental conservation technique for improving soil fertility and water retention, as well as reducing water erosion. They employed a multispectral sensor to calculate VIs related to ground-truth cover crops at different densities. They showed that the capacity of the evaluated VIs to quantified CC depends on the amount of cover crops and the range of cover density intervals, i.e., the width of the intervals into which the complete series of densities was divided. This investigation reported the IRVI as the most sensitive VI for a cover interval range of 15–25%, although the IRVI, NRVI, NDVI, GNDVI, and SAVI were valid for differentiating the complete series of densities when the interval rose to 30%.
Borra-Serrano et al. (2020) [18] combined multi-temporal RGB-UAV data with curve fitting to obtain biologically interpretable parameters of a large set of soybean genotypes and derived phenotypic parameters like growth rate, weed suppression, determinacy, and senescence. First, CC and CH were estimated from each flight date based on the ExG and the 90th percentile of the crop height model (CHM) values, respectively. Then, multi-temporal data were adjusted to the sigmoid growth functions Gompertz for CC and Beta for CH. In addition, these authors developed a model to predict seed yield for estimating full maturity, i.e., when each accession reached the R8 stage.
Heidarian Dehkordi et al. (2020) [19] shown another approach to extract multi-temporal CC and CH from several VI and CHM, respectively. These authors also derived crop growth and health maps from RGB and multispectral images by K-means algorithms. These maps were used to monitor crop dynamics and assess century-old biochar’s impacts on winter wheat crop performance at the canopy scale over the growing season. In addition, they studied the impact on the predicted multispectral crop yield based on the s-CCI and the NDRE indices (Table 1), which exhibited a significant correlation with crop harvest data. Their results showed a significant positive impact of century-old biochar on the winter wheat CC and CH over time, but no impact on harvested crop yield was found.
Zan et al. (2020) [20] showed another example of monitoring crop dynamic from RGB-UAV imagery with a method to detect and quantify maize tassels in the flowering stage by combining machine learning algorithms and morphological methods. Once the RGB images were taken, a RF algorithm was used to identify and classify tassel pixels, finding tassels of any size and unconnected regions. A refining process based on morphological procedures was performed to remove small objects and to connect pixels producing potential tassel region candidates. Then, VGG16 neural network was used to remove false positives. Their results showed that the tassel can be detected at any stages, although the accuracy was affected by the tasseling development, reporting higher accuracy for late tasseling than for middle and early stages. Finally, these authors also calculated the tassel branch number by an endpoint detection method based on the tassel skeleton.
4.2. Evaluation of Stressor on Vegetation
The biotic and abiotic stressors such as nutrition and water deficiencies and pests (including plagues, diseases, and weeds) can drastically reduce the quality and quantity of vegetation production and crop yield. In fact, the overall impact of the pathogens affecting crop health is estimated to reduce global production by about 40% [42]. The stress factors cause changes in plant physiology and morphology that result in variations in canopy reflectance that can be potentially monitored with UAVs and imaging sensors [43,44]. Therefore, this SI collected papers on the use of UAVs to assess those factors affecting both crop production (e.g., N content/deficiencies and water stress/needs) and crop protection (weed and disease detection/diagnosis) aspects. Many of the cited papers utilized the vegetation features mentioned in the point 4.1., together with various data analytic approaches mentioned in the point 3.3.
4.2.1. Assessment of Nitrogen Content/Deficiencies
Nitrogen is an essential plant nutrient for the growth and yield of crops. Leaf N is directly related to the chlorophyll content, which is a key indicator of photosynthetic capacity and nutrient status. Zhang et al. (2020) [36] developed a method to monitor crop N stress in winter oilseed rape using UAV RGB imagery and ML-based segmentation. Their method consisted in discriminating the rapeseed leaves with purple color, a symptom of N deficiency, using a binary semantic segmentation process and, then, relating the purple leaf area ratio to the N content of the plants. The authors tested five image segmentation approaches at the pixel level for the extraction of the purple rapeseed leaves during the seedling stage. The CNN U-Net model with a patch size of 256 x 256 pixels reported the best results. A negative exponential regression analysis was established between measured N content and estimated purple leaf ratios (leaf pixels over the total pixels) under four N application levels. This method proved to be sensitive to low-medium N application; however, the sensitivity was reduced for N levels over 150 kg/ha.
A ML approach was also employed by Colorado et al. (2020) [30] to monitor canopy N in rice crops with multispectral UAV imagery. The approach was evaluated during the dry season at three rice growth stages: vegetative, reproductive, and ripening. As a preliminary phase, the authors proposed an automated GrabCut image segmentation method, which is an improvement of the regular GrabCut one [45], that adds a guided filtering refinement step to extract the rice canopy pixel data. Next, several ML algorithms accurately correlated ground-truth leaf chlorophyll measurements and canopy N estimates via VIs. The successful ML algorithms were multi-variable linear regressions (MLR), SVM, and artificial neural networks (ANN), which showed that MSAVI, GNDVI, and NDVI have a strong correlation with canopy N at any growth stages. Finally, the authors also proved that these good correlations improve with the implementation of a stabilization control during UAV flight operations.
Similarly, Qiao et al. (2020) [46] described a segmentation-based method to estimate chlorophyll content at different maize growth stages using multispectral imagery. They showed different segmentation results that produced variations in the extraction of maize canopy parameters, with the wavelet method as the best output. Next, a maize canopy chlorophyll content model was developed using VIs from the segmented images. The research demonstrated the importance of image segmentation to remove the soil background and highlight the spectral reflectance of crop canopy for N detection purposes.
4.2.2. Assessment of Water Stress
Fresh water is a finite and scarce resource in many regions of the world. Therefore, determining how much water the plant needs is crucial for efficient crop, water, and irrigation management. Freeman et al. (2019) [22] used multispectral images and cloud-based artificial intelligence for the early detection of water stress in ornamental horticultural plants. Images containing the plants in three types of water stress situations (high, low, and non-stressed) were analyzed by the IBM Watson Visual Recognition platform, a deep CNN hosted in the cloud. The generated models were able to identify the plants with early water stress, i.e., after 48 hours of water deprivation in most of the studied species. In addition, early indicators of stress after 24 hours of water suppression were found for the Buddleia plants. This research opens up the opportunity of identifying water needs in large datasets through cloud-hosted artificial intelligence services.
De Swaef et al. (2021) [21] evaluated the drought tolerance of three common types of forage species (Festuca arundinacea, diploid, and tetraploid Lolium perenne) with VIs from RGB and thermal imaging. The methodology was tested in five UAV flight dates throughout the summer, which overlapped with visual breeder score-taking. Pearson correlation showed better results between breeder scores and visual-based VIs than with thermal indices, with H from the hue-saturation-value (HSV) color space and NDLab from CIELab color space (Table 1) being the best. These VIs and MGRVI also displayed broad-sense high heritability, i.e., the total variation proportion that may be attributed to genotype variation. This research showed the use of UAV-based RGB-VIs as an efficient alternative to breeder scores for drought tolerance.
In other research conducted by Ellsäßer et al. (2020) [25], RGB and thermal UAV imagery and meteorological data were used to estimate sap flux and leaf stomatal conductance, key inputs for water balance, and plant transpiration assessments. The experiment was conducted in an oil palm plantation, where oil palm (Elaeis guineensis) and other several forest tree species (Peronema canescens, Archidendron pauciflorum, Parkia speciosa, and Shorea leprosula) usually appear. These authors tested linear statistical and ML approaches to build the prediction models using in-situ measured transpiration and estimated data. For both parameters, RF model achieved the best accuracy, being less robust for stomatal conductance. R2 values for sap flux prediction were close to or higher than 0.8 for forest species and 0.58 for palms, however, the model accuracies were moderate (60%) and low (38%) for forest species and palms, respectively. Therefore, image-based variables and meteorological observations used as input to the RF algorithm could be an alternative to sap flux manual measurements only for same of the evaluated species, especially Parkia speciosa and Archidendron pauciflorum.
In order to model the radiative and convective flux exchanges between soil and canopy for ET estimation, Nassar et al. (2020) [24] tested the TSEB2T model in vineyard using multispectral and thermal images, including a step of mapping canopy and soil temperature. The TSEB2T inputs were calculated from images, as follows: Leaf Area Index (LAI) using a genetic programming model and ground measurements, CH extracted from the DSM and DTM, CC and canopy width (CW) based on NDVI imagery, and canopy and soil/substrate temperature (Tc and Ts, respectively) by averaging the temperature of pixels classified as pure soil and pure canopy based on a linear land surface temperature (LST)-NDVI model. The validation results showed a close agreement of TSEB2T output and ground-truth measurements if spatial image resolution was high enough to discriminate plant canopy and soil temperatures.
4.2.3. Weed Detection and Mapping
Weeds compete with crops for soil resources, thus reducing crop yield and creating a weed seed bank that germinates the following season, increasing the weed-crop competition problem. Weeds are often distributed in patches within fields, which allows designing site-specific weed management (SSWM) strategies to adjust applications according to the weed patches distribution [47]. In this area, Veeranampalayam et al. (2020) [26] evaluated two objects detection-based CNN models and RGB images for mid-to-late season weed identification in soybean fields. Two feature extractors were also evaluated in both NN models, (Faster RCNN and the Single Shot Detector (SSD)), concluding that Inception v2 performs better than Mobilenet v2. Moreover, the result showed that Faster RCNN is the best NN model in terms of weed detection accuracy and inference time compared to SDD and the patch-based CNN, a pre-trained network used for validation. Therefore, due to the rapid and accurate performance for weed detection at mid-late stage, Faster RCNN proves to be a suitable solution for near real-time weed detection. A process improvement could consist of removing manual tasks by using OBIA multiresolution segmentation approach instead, thus automating the process, leading to a real-time processing.
4.2.4. Disease Detection/Diagnosis
Numerous studies on disease detection have been carried out at the leaf scale [48]; however, more research needs to scale up at the canopy level to monitor disease in large areas. Mapping at the field scale would control disease effects through proper management strategies, such as site-specific control tactics. Ye et al. (2020) [27] established a method for mapping Fusarium wilt in bananas with multispectral imagery and VIs. Once the more suitable VIs were selected based on an independent t-test analysis, the Binary Logistic Regression (BLR) method was used to relate healthy and infested samples for each selected VIs. The CIgreen, CIRE, NDVI, and NDRE indices (Table 1) were able to identify healthy and diseased trees, with CIRE exhibiting the best performance. Infestation maps were performed with the BLR equation obtained for CIRE. Moreover, the importance of the red-edge information in the discrimination was highlighted.
Wang et al. (2020) [28] developed a non-supervised method for cotton root rot (CRR) detection with the novelty of the individual identification of CRR-infected plants using multispectral images. This plant-by-plant (PBP) method consists of a segmentation process based on the Superpixel algorithm, which creates multi-pixel pieces (super-pixel), approximately single plant zones, based on shape, color, texture, etc. Then, a classification was performed using k-means algorithms to achieve a two-class super-pixel classification, i.e., CRR and healthy zones. The results highlighted the importance of the segmentation process, as the accuracy increased when it was carried out as a prior step to the classification phase. Compared to conventional supervised methods, the PBP achieved better classifications with the best accuracy parameters in terms of overall accuracy, kappa coefficient and commission errors, and high values in the omission errors. Also, the fungicide treatment based on the PBP-infestation map allowed a high-precision treatment of CRR with a mortality percentage similar to conventional treatment rates.
Finally, Guo et al. (2021) [29] added TFs to VIs extracted from the hyperspectral images to address the wheat yellow rust mapping at different infection stages. To develop the PLSR model for each infection stage, VIs, TFs, and a combination of them were tested and compared to ground truth severity data described by the disease index (DI). Finally, the VI-TF combination, composed of mean (MEA1 and MEA2), variance (VAR2), contrast (CON2), NDVI, SIPI, PRI, PSRI, and MSR, was selected for the PLSR model performance in each infection period, as they achieved the highest accuracy in every stage. The performance accuracy was affected by the infection stage, such that the infection period increased, monitoring accuracy increased, with high values for mid- and late-infection periods, and poor for early ones. Thus, wheat yellow rust infestation maps could be created based on the PLSR model and the VIs and TF selected.
5. Conclusions
The investigations included in this SI proved the wide scope of UAVs in very diverse applications, both in agricultural and forestry scenarios, ranging from the characterization of relevant vegetation features to the detection of plant/crop stressors.
The RGB and multispectral sensors were particularly effective for assessing canopy cover, crop height, growth rate, determinacy, senescence, and maize tassel branch number, among other plant traits. The studies with multispectral sensors also revealed the best vegetation indices for assessing stresses caused by nutrients and water (e.g., NDVI) or by biological agents such as weeds and diseases (e.g., NDRE, CIgreen). The hyperspectral sensors were focused on disease detection, given the ability of these sensors to observe spectral differences at certain wavelengths that are sensitive to biochemical and biophysical changes caused by plant disease. Finally, the research applied the thermal sensors mainly for water stress measures, aiming to develop efficient irrigation systems by optimizing water use at the crop field scale.
A detailed reading of this SI leads us to note some limitations and opportunities of UAVs for vegetation monitoring. UAVs can acquire immense spatial and temporal information of crops and forest areas, although they cannot currently measure all the desired plant traits, most of the measurements being indirect and requiring a rigorous calibration process. Data calibration with downwelling/incident light sensors has already been standardized for multispectral sensors, but there is not a good solution for thermal cameras yet. In addition, there is a problem of flight length and battery duration in UAVs for large areas, so in such cases it could be proposed solutions combined with satellite imagery. The coarser spatial resolution of such images could be an obstacle in certain applications, so new studies combining both UAV and satellite platforms should be pursued.
Regarding data analytics, the machine/deep learning (ML/DL) algorithms are becoming increasingly popular in vegetation characterization, although the large amount of training data they require, as well as their high computational cost, should be carefully considered. Therefore, such powerful methods may not be really necessary in all applications, and in any case, it would be interesting to deepen into generalization issues, i.e., the use of training data from specific locations in other scenes or environments, thus making better use of the data obtained. In this respect, it would be beneficial to adapt the scientific procedures presented here to simpler analytical packages and easy-to-use tools for everyone (not only for remote sensing and data science researchers), thus widening the opportunities for vegetation monitoring and crop/forest management from a practical perspective.
Author Contributions
All authors of this review article have contributed equally to its conceptualization, writing, review, and editing. All authors have read and agreed to the published version of the manuscript.
Funding
This research was funded by the project AGL2017-83325-C4-1R of Agencia Española de Investigación (AEI) and Fondo Europeo de Desarrollo Regional (FEDER). The contribution of Dr. Shi and Dr. Maja were supported by the Nebraska Agricultural Experiment Station through the Hatch Act capacity funding program (Accession Number 1011130) and Project No. SC-1700543 from the USDA National Institute of Food and Agriculture, respectively. This work also represents a contribution to the CSIC Thematic Interdisciplinary Platform PTI TELEDETECT (https://pti-teledetect.csic.es/ (accessed on 27 May 2021)).
Institutional Review Board Statement
Not applicable.
Informed Consent Statement
Not applicable.
Data Availability Statement
The data presented in this study are available in the research articles displayed all along the text or summarized in Table 1.
Conflicts of Interest
The authors declare no conflict of interest.
References
- Ahmad, A.; Ordoñez, J.; Cartujo, P.; Martos, V. Remotely Piloted Aircraft (RPA) in Agriculture: A Pursuit of Sustainability. Agronomy 2021, 11, 7. [Google Scholar] [CrossRef]
- Dandois, J.P.; Ellis, E.C. High Spatial Resolution Three-Dimensional Mapping of Vegetation Spectral Dynamics Using Computer Vision. Remote Sens. Environ. 2013, 136, 259–276. [Google Scholar] [CrossRef]
- de Castro, A.I.; Peña, J.M.; Torres-Sánchez, J.; Jiménez-Brenes, F.M.; Valencia-Gredilla, F.; Recasens Guinjuan, J.; López-Granados, F. Mapping Cynodon Dactylon Infesting Cover Crops with an Automatic Decision Tree-OBIA Procedure and UAV Imagery for Precision Viticulture. Remote Sens. 2020, 12, 56. [Google Scholar] [CrossRef]
- Dainelli, R.; Toscano, P.; Di Gennaro, S.F.; Matese, A. Recent Advances in Unmanned Aerial Vehicle Forest Remote Sensing—A Systematic Review. Part I: A General Framework. Forests 2021, 12, 327. [Google Scholar] [CrossRef]
- Olson, D.; Anderson, J. Review on Unmanned Aerial Vehicles, Remote Sensors, Imagery Processing, and Their Applications in Agriculture. Agron. J. 2021, 1–22. [Google Scholar] [CrossRef]
- Torres-Sánchez, J.; Peña, J.M.; de Castro, A.I.; López-Granados, F. Multi-Temporal Mapping of the Vegetation Fraction in Early-Season Wheat Fields Using Images from UAV. Comput. Electron. Agric. 2014, 103, 104–113. [Google Scholar] [CrossRef]
- Librán-Embid, F.; Klaus, F.; Tscharntke, T.; Grass, I. Unmanned Aerial Vehicles for Biodiversity-Friendly Agricultural Landscapes-A Systematic Review. Sci. Total Environ. 2020, 732, 139204. [Google Scholar] [CrossRef]
- Manfreda, S.; McCabe, M.F.; Miller, P.E.; Lucas, R.; Pajuelo Madrigal, V.; Mallinis, G.; Ben Dor, E.; Helman, D.; Estes, L.; Ciraolo, G.; et al. On the Use of Unmanned Aerial Systems for Environmental Monitoring. Remote Sens. 2018, 10, 641. [Google Scholar] [CrossRef]
- Maes, W.H.; Steppe, K. Perspectives for Remote Sensing with Unmanned Aerial Vehicles in Precision Agriculture. Trends Plant Sci. 2019, 24, 152–164. [Google Scholar] [CrossRef]
- Yang, G.; Liu, J.; Zhao, C.; Li, Z.; Huang, Y.; Yu, H.; Xu, B.; Yang, X.; Zhu, D.; Zhang, X.; et al. Unmanned Aerial Vehicle Remote Sensing for Field-Based Crop Phenotyping: Current Status and Perspectives. Front. Plant Sci 2017, 8, 1111. [Google Scholar] [CrossRef] [PubMed]
- Shi, Y.; Thomasson, J.A.; Murray, S.C.; Pugh, N.A.; Rooney, W.L.; Shafian, S.; Rajan, N.; Rouze, G.; Morgan, C.L.S.; Neely, H.L.; et al. Unmanned Aerial Vehicles for High-Throughput Phenotyping and Agronomic Research. PLoS ONE 2016, 11, e0159781. [Google Scholar] [CrossRef] [PubMed]
- Hassler, S.C.; Baysal-Gurel, F. Unmanned Aircraft System (UAS) Technology and Applications in Agriculture. Agronomy 2019, 9, 618. [Google Scholar] [CrossRef]
- Rehman, T.U.; Mahmud, S.; Chang, Y.K.; Jin, J.; Shin, J. Current and Future Applications of Statistical Machine Learning Algorithms for Agricultural Machine Vision Systems. Comput. Electron. Agric. 2019, 156, 585–605. [Google Scholar] [CrossRef]
- Chen, G.; Weng, Q.; Hay, G.J.; He, Y. Geographic Object-Based Image Analysis (GEOBIA): Emerging Trends and Future Opportunities. GIScience Remote Sens. 2018, 55, 1–24. [Google Scholar] [CrossRef]
- Ashapure, A.; Jung, J.; Chang, A.; Oh, S.; Maeda, M.; Landivar, J. A Comparative Study of RGB and Multispectral Sensor-Based Cotton Canopy Cover Modelling Using Multi-Temporal UAS Data. Remote Sens. 2019, 11, 2757. [Google Scholar] [CrossRef]
- Iizuka, K.; Kato, T.; Silsigia, S.; Soufiningrum, A.Y.; Kozan, O. Estimating and Examining the Sensitivity of Different Vegetation Indices to Fractions of Vegetation Cover at Different Scaling Grids for Early Stage Acacia Plantation Forests Using a Fixed-Wing UAS. Remote Sens. 2019, 11, 1816. [Google Scholar] [CrossRef]
- Lima-Cueto, F.J.; Blanco-Sepúlveda, R.; Gómez-Moreno, M.L.; Galacho-Jiménez, F.B. Using Vegetation Indices and a UAV Imaging Platform to Quantify the Density of Vegetation Ground Cover in Olive Groves (Olea Europaea L.) in Southern Spain. Remote Sens. 2019, 11, 2564. [Google Scholar] [CrossRef]
- Borra-Serrano, I.; De Swaef, T.; Quataert, P.; Aper, J.; Saleem, A.; Saeys, W.; Somers, B.; Roldán-Ruiz, I.; Lootens, P. Closing the Phenotyping Gap: High Resolution UAV Time Series for Soybean Growth Analysis Provides Objective Data from Field Trials. Remote Sens. 2020, 12, 1644. [Google Scholar] [CrossRef]
- Heidarian Dehkordi, R.; Burgeon, V.; Fouche, J.; Placencia Gomez, E.; Cornelis, J.-T.; Nguyen, F.; Denis, A.; Meersmans, J. Using UAV Collected RGB and Multispectral Images to Evaluate Winter Wheat Performance Across a Site Characterized by Century-Old Biochar Patches in Belgium. Remote Sens. 2020, 12, 2504. [Google Scholar] [CrossRef]
- Zan, X.; Zhang, X.; Xing, Z.; Liu, W.; Zhang, X.; Su, W.; Liu, Z.; Zhao, Y.; Li, S. Automatic Detection of Maize Tassels from UAV Images by Combining Random Forest Classifier and VGG16. Remote Sens. 2020, 12, 3049. [Google Scholar] [CrossRef]
- De Swaef, T.; Maes, W.H.; Aper, J.; Baert, J.; Cougnon, M.; Reheul, D.; Steppe, K.; Roldán-Ruiz, I.; Lootens, P. Applying RGB- and Thermal-Based Vegetation Indices from UAVs for High-Throughput Field Phenotyping of Drought Tolerance in Forage Grasses. Remote Sens. 2021, 13, 147. [Google Scholar] [CrossRef]
- Freeman, D.; Gupta, S.; Smith, D.H.; Maja, J.M.; Robbins, J.; Owen, J.S.; Peña, J.M.; de Castro, A.I. Watson on the Farm: Using Cloud-Based Artificial Intelligence to Identify Early Indicators of Water Stress. Remote Sens. 2019, 11, 2645. [Google Scholar] [CrossRef]
- Gago, J.; Douthe, C.; Coopman, R.E.; Gallego, P.P.; Ribas-Carbo, M.; Flexas, J.; Escalona, J.; Medrano, H. UAVs Challenge to Assess Water Stress for Sustainable Agriculture. Agric. Water Manag. 2015, 153, 9–19. [Google Scholar] [CrossRef]
- Nassar, A.; Torres-Rua, A.; Kustas, W.; Nieto, H.; McKee, M.; Hipps, L.; Stevens, D.; Alfieri, J.; Prueger, J.; Alsina, M.M.; et al. Influence of Model Grid Size on the Estimation of Surface Fluxes Using the Two Source Energy Balance Model and SUAS Imagery in Vineyards. Remote Sens. 2020, 12, 342. [Google Scholar] [CrossRef] [PubMed]
- Ellsäßer, F.; Röll, A.; Ahongshangbam, J.; Waite, P.-A.; Hendrayanto; Schuldt, B.; Hölscher, D. Predicting Tree Sap Flux and Stomatal Conductance from Drone-Recorded Surface Temperatures in a Mixed Agroforestry System—A Machine Learning Approach. Remote Sens. 2020, 12, 4070. [Google Scholar] [CrossRef]
- Veeranampalayam Sivakumar, A.N.; Li, J.; Scott, S.; Psota, E.; Jhala, A.J.; Luck, J.D.; Shi, Y. Comparison of Object Detection and Patch-Based Classification Deep Learning Models on Mid- to Late-Season Weed Detection in UAV Imagery. Remote Sens. 2020, 12, 2136. [Google Scholar] [CrossRef]
- Ye, H.; Huang, W.; Huang, S.; Cui, B.; Dong, Y.; Guo, A.; Ren, Y.; Jin, Y. Recognition of Banana Fusarium Wilt Based on UAV Remote Sensing. Remote Sens. 2020, 12, 938. [Google Scholar] [CrossRef]
- Wang, T.; Thomasson, J.A.; Isakeit, T.; Yang, C.; Nichols, R.L. A Plant-by-Plant Method to Identify and Treat Cotton Root Rot Based on UAV Remote Sensing. Remote Sens. 2020, 12, 2453. [Google Scholar] [CrossRef]
- Guo, A.; Huang, W.; Dong, Y.; Ye, H.; Ma, H.; Liu, B.; Wu, W.; Ren, Y.; Ruan, C.; Geng, Y. Wheat Yellow Rust Detection Using UAV-Based Hyperspectral Technology. Remote Sens. 2021, 13, 123. [Google Scholar] [CrossRef]
- Colorado, J.D.; Cera-Bornacelli, N.; Caldas, J.S.; Petro, E.; Rebolledo, M.C.; Cuellar, D.; Calderon, F.; Mondragon, I.F.; Jaramillo-Botero, A. Estimation of Nitrogen in Rice Crops from UAV-Captured Images. Remote Sens. 2020, 12, 3396. [Google Scholar] [CrossRef]
- Jiang, R.; Wang, P.; Xu, Y.; Zhou, Z.; Luo, X.; Lan, Y.; Zhao, G.; Sanchez-Azofeifa, A.; Laakso, K. Assessing the Operation Parameters of a Low-Altitude UAV for the Collection of NDVI Values Over a Paddy Rice Field. Remote Sens. 2020, 12, 1850. [Google Scholar] [CrossRef]
- Torres-Sánchez, J.; López-Granados, F.; De Castro, A.I.; Peña-Barragán, J.M. Configuration and Specifications of an Unmanned Aerial Vehicle (UAV) for Early Site Specific Weed Management. PLoS ONE 2013, 8, e58210. [Google Scholar] [CrossRef]
- de Castro, A.I.; Ehsani, R.; Ploetz, R.; Crane, J.H.; Abdulridha, J. Optimum Spectral and Geometric Parameters for Early Detection of Laurel Wilt Disease in Avocado. Remote Sens. Environ. 2015, 171, 33–44. [Google Scholar] [CrossRef]
- Peña, J.M.; Torres-Sánchez, J.; Serrano-Pérez, A.; de Castro, A.I.; López-Granados, F. Quantifying Efficacy and Limits of Unmanned Aerial Vehicle (UAV) Technology for Weed Seedling Detection as Affected by Sensor Resolution. Sensors 2015, 15, 5609–5626. [Google Scholar] [CrossRef]
- Gómez-Candón, D.; De Castro, A.I.; López-Granados, F. Assessing the Accuracy of Mosaics from Unmanned Aerial Vehicle (UAV) Imagery for Precision Agriculture Purposes in Wheat. Precision Agric. 2014, 15, 44–56. [Google Scholar] [CrossRef]
- Zhang, J.; Xie, T.; Yang, C.; Song, H.; Jiang, Z.; Zhou, G.; Zhang, D.; Feng, H.; Xie, J. Segmenting Purple Rapeseed Leaves in the Field from UAV RGB Imagery Using Deep Learning as an Auxiliary Means for Nitrogen Stress Detection. Remote Sens. 2020, 12, 1403. [Google Scholar] [CrossRef]
- Machefer, M.; Lemarchand, F.; Bonnefond, V.; Hitchins, A.; Sidiropoulos, P. Mask R-CNN Refitting Strategy for Plant Counting and Sizing in UAV Imagery. Remote Sens. 2020, 12, 3015. [Google Scholar] [CrossRef]
- Fu, Y.; Yang, G.; Song, X.; Li, Z.; Xu, X.; Feng, H.; Zhao, C. Improved Estimation of Winter Wheat Aboveground Biomass Using Multiscale Textures Extracted from UAV-Based Digital Images and Hyperspectral Feature Analysis. Remote Sens. 2021, 13, 581. [Google Scholar] [CrossRef]
- Bhatnagar, S.; Gill, L.; Ghosh, B. Drone Image Segmentation Using Machine and Deep Learning for Mapping Raised Bog Vegetation Communities. Remote Sens. 2020, 12, 2602. [Google Scholar] [CrossRef]
- Trout, T.J.; Johnson, L.F.; Gartung, J. Remote Sensing of Canopy Cover in Horticultural Crops. HortScience 2008, 43, 333–337. [Google Scholar] [CrossRef]
- Ostos-Garrido, F.J.; de Castro, A.I.; Torres-Sánchez, J.; Pistón, F.; Peña, J.M. High-Throughput Phenotyping of Bioethanol Potential in Cereals Using UAV-Based Multi-Spectral Imagery. Front. Plant Sci. 2019, 10, 948. [Google Scholar] [CrossRef] [PubMed]
- Oerke, E.-C. Crop Losses to Pests. J. Agric. Sci. 2006, 144, 31–43. [Google Scholar] [CrossRef]
- Mahlein, A.-K. Plant Disease Detection by Imaging Sensors–Parallels and Specific Demands for Precision Agriculture and Plant Phenotyping. Plant Dis. 2015, 100, 241–251. [Google Scholar] [CrossRef] [PubMed]
- Messina, G.; Modica, G. Applications of UAV Thermal Imagery in Precision Agriculture: State of the Art and Future Research Outlook. Remote Sens. 2020, 12, 1491. [Google Scholar] [CrossRef]
- Rother, C.; Kolmogorov, V.; Blake, A. “GrabCut”: Interactive Foreground Extraction Using Iterated Graph Cuts. ACM Trans. Graph. 2004, 23, 309–314. [Google Scholar] [CrossRef]
- Qiao, L.; Gao, D.; Zhang, J.; Li, M.; Sun, H.; Ma, J. Dynamic Influence Elimination and Chlorophyll Content Diagnosis of Maize Using UAV Spectral Imagery. Remote Sens. 2020, 12, 2650. [Google Scholar] [CrossRef]
- de Castro, A.I.; Jurado-Expósito, M.; Peña-Barragán, J.M.; López-Granados, F. Airborne Multi-Spectral Imagery for Mapping Cruciferous Weeds in Cereal and Legume Crops. Precis. Agric. 2012, 13, 302–321. [Google Scholar] [CrossRef]
- Ferentinos, K.P. Deep Learning Models for Plant Disease Detection and Diagnosis. Comput. Electron. Agric. 2018, 145, 311–318. [Google Scholar] [CrossRef]

Publisher’s Note: MDPI stays neutral with regard to jurisdictional claims in published maps and institutional affiliations. |
© 2021 by the authors. Licensee MDPI, Basel, Switzerland. This article is an open access article distributed under the terms and conditions of the Creative Commons Attribution (CC BY) license (https://creativecommons.org/licenses/by/4.0/).