Abstract
Surface particulate matter with an aerodynamic diameter of <2.5 μm (PM2.5) and column-integrated aerosol optical depth (AOD) exhibits substantial diurnal, daily, and yearly variabilities that are regionally dependent. The diversity of these temporal variabilities in urban and rural areas may imply the inherent mechanisms. A novel time-series analysis tool developed by Facebook, Prophet, is used to investigate the holiday, seasonal, and inter-annual patterns of PM2.5 and AOD at a rural station (RU) and an urban station (UR) in Beijing. PM2.5 shows a coherent decreasing tendency at both stations during 2014–2018, consistent with the implementation of the air pollution action plan at the end of 2013. RU is characterized by similar seasonal variations of AOD and PM2.5, with the lowest values in winter and the highest in summer, which is opposite that at UR with maximum AOD, but minimum PM2.5 in summer and minimum AOD, but maximum PM2.5 in winter. During the National Day holiday (1–7 October), both AOD and PM2.5 holiday components regularly shift from negative to positive departures, and the turning point generally occurs on October 4. AODs at both stations steadily increase throughout the daytime, which is most striking in winter. A morning rush hour peak of PM2.5 (7:00–9:00 local standard time (LST)) and a second peak at night (23:00 LST) are observed at UR. PM2.5 at RU often reaches minima (maxima) at around 12:00 LST (19:00 LST), about four hours later (earlier) than UR. The ratio of PM2.5 to AOD (η) shows a decreasing tendency at both stations in the last four years, indicating a profound impact of the air quality control program. η at RU always begins to increase about 1–2 h earlier than that at UR during the daytime. Large spatial and temporal variations of η suggest that caution should be observed in the estimation of PM2.5 from AOD.
1. Introduction
Beijing, the capital of China, has frequently suffered from worsening air pollution episodes, especially in recent years [1,2,3,4]. For example, a widespread and long-lasting extreme air pollution event in January of 2013 triggered a deep public concern about air pollution and its hazardous effects on human health [5,6,7], which, to some extent, fostered the establishment of a national air quality network and the release of hourly air quality to the public from the beginning of 2013 (http://www.cnemc.cn/). Dramatic changes of PM2.5 (ground-level ambient fine particulate matter with an aerodynamic diameter not exceeding 2.5 µm) concentrations in Beijing were widely reported, in which stagnant weather and chemical reactions worked together to result in an explosive growth of PM2.5, for example from a few µg m−3 to dangerously high levels (1000 µg m−3)within several hours or in a few days [8,9,10]. The diurnal and seasonal variability of PM2.5 in the Beijing urban area has been studied based on observations of 1–3 years, which showed diurnal maxima during the latter half of the night to early morning and a seasonal peak in winter [11,12].
Aerosol optical depth (AOD), the column-integrated aerosol extinction, has widely been suggested as a proxy for PM2.5 [13,14,15]. The sun photometer is an effective remote sensing tool to observe AOD accurately and validate satellite-derived AOD products. The AOD uncertainty of the Aerosol Robotic Network (AERONET [16], https://aeronet.gsfc.nasa.gov/) is 0.01~0.02 [17]. Diurnal variation of AOD based on 15 years worthy of AERONET observation data in the North China Plain (NCP) showed that AOD increased gradually from early morning to later afternoon [18]. Based on long-term observations of 50 China Aerosol Remote Sensing Network (CARSNET) sites, Che et al. [19] found that annual mean AOD at 440 nm (AOD 440nm) increased from remote/rural sites (0.12) to urban sites (0.79).
As the government has implemented strict emission regulations and set absolute targets for limiting coal consumption to improve air quality in recent years, improvements in average levels of PM2.5 and AOD would be expected [20,21]. Unfavorable weather is a key external cause of air pollution, which may counteract the major efforts currently underway to reduce emissions. A slowdown of air pollution emission would partly influence regional haze by the local interactions between aerosol and the boundary layer [22,23,24]; furthermore, aerosol would impact haze in North China by influencing the East Asian winter monsoon through ocean, sea ice, and cloud feedbacks [25,26]. Therefore, one would expect a remarkable inter-annual variability and secular trend of PM2.5 and AOD as a result of those complex interactions.
With large spatial coverage, repeated measurements, and accessible accuracy, satellite AOD retrievals are applicable for estimating PM2.5 concentrations. PM2.5 is technically measured as dry particle mass near the surface, while AOD is light extinction by aerosol in the whole atmospheric column [27]. The AOD-PM2.5 relationship is affected by external factors such as aerosol size, aerosol vertical profile, and relative humidity, which show a highly spatiotemporal variability. As a matter of fact, the contrast in the seasonality of AOD and PM2.5 was revealed in Beijing urban areas [28] and in NCP [29]. Therefore, it is still crucial to explore the spatial and temporal variations of the AOD-PM2.5 relationship [30,31,32].
Using collocated hourly PM2.5 and AOD datasets spanning more than 10 years at Beijing urban (UR) and rural (RU) stations, the objective of this study is to present a closer look at the temporal variabilities of PM2.5 and AOD, as well as their relationship at diurnal to inter-annual scales. Similarities and differences in the long-term temporal variabilities of PM2.5 and AOD at UR and RU are thoroughly investigated. Given the fact that conventional time-series analysis approaches are insufficient to analyze complex changes of PM2.5 and AOD, we use a newly developed forecasting model by Facebook, namely Prophet, to achieve this goal [33,34]. Adopting a generalized additive model (GAM), Prophet is fast in its fitting procedure and robust to large outliers, missing values, and dramatic changes. It can also model multiple periods of seasonality simultaneously [35]. These features make it attractive for the analysis of PM2.5 and AOD.
2. Materials and Methods
2.1. Stations and Data
Urban ground-based PM2.5 and AOD observations are from the U.S. Embassy in Beijing (39.95°N 116.46°E) and the AERONET Beijing site (39.98°N 116.38°E), respectively (Figure 1). Rural PM2.5 data are collected at Shangdianzi station (SDZ, 40.65°N 117.12°E), the regional atmosphere watch station in NCP. The measurements are conducted on the south slope of a hill (293 m ASL) at SDZ that is surrounded by sparsely populated small villages. SDZ is one of the Chinese Aerosol Research Science Network (CARSNET) [19] stations that has regularly measured AOD by using a sun photometer since 2004. At UR, hourly PM2.5 data measured by the beta-attenuation monitor (BAM) range from April 2008 to December 2018, and AERONET Version 3 cloud screened and quality assured level 2.0 data range from March 2004 to May 2018. At RU, hourly PM2.5 data measured by the tapered element oscillating microbalance method (TEOM) range from January 2005 to October 2018, and the CARSNET Level 2.0 AOD data range from March 2004 and October 2017. BAM heats air to around 20 °C, while TEOM keeps the temperature at around 50 °C [36]. Inter-comparison of PM2.5 concentrations has shown a good agreement between BAM and TEOM, but the latter is slightly lower than the former [37], possibly because TEOM is sensitive to losses of semi-volatile components during the heating process of the air sample [38].
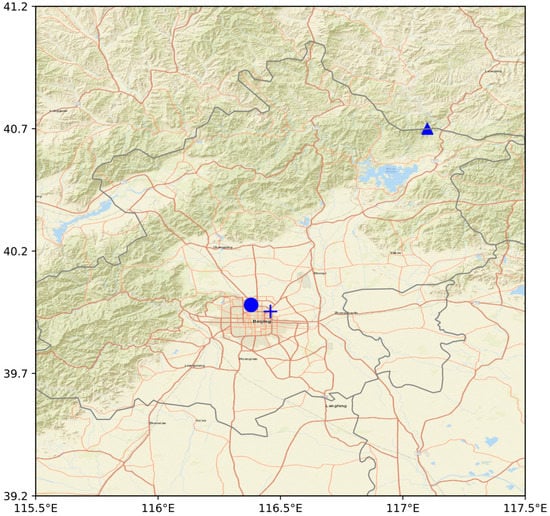
Figure 1.
Locations of the urban station (UR, plus for PM2.5 and circle for aerosol optical depth (AOD)) and the rural station (RU, triangle) in Beijing.
To match the wavelength of the widely-used Moderate Resolution Imaging Spectroradiometer (MODIS) AOD, the ground-level AOD at 550 nm is interpolated from AOD measurements at the two nearest wavelengths (generally from 440 and 870 nm) using the Angstrom exponent. PM2.5 data are discarded if missing hourly measurements exceed 12 during a day. Only days with 20 or more instantaneous AOD measurements, the first record earlier than 10:30 LST (local standard time) and the last record later than 15:00 LST, are used for the analysis of diurnal variability. Since the diurnal variability of clean days with low AOD values is likely overwhelmed by that of polluted days with high AOD values if absolute values are used in the diurnal analysis, we adopted the percentage departure from the daily mean to describe the diurnal variation [39]:
where represents the variable (AOD or PM2.5 measurements or PM2.5/AOD) on day i at hour j. m represents total hourly measurements each day.
The conversion factor η is also analyzed because it is essential for PM2.5 estimation from AOD [40]. η, the aerosol mass extinction capability in reality, is a function of aerosol size, aerosol type, relative humidity, etc.
2.2. The Prophet Method
The Prophet method is used to detect the temporal variabilities of AOD and PM2.5 from the daily to the secular trend. Prophet was originally designed to smooth and forecast business data encountered on Facebook. Fully considering the basic features of business time-series, i.e., piecewise trends, seasonality, holidays known in advance, and a reasonable number of missing values or outliers, a time-series can be decomposed into three major components, i.e., secular trend, seasonality, and holidays, as well as an error term [34].
The terms in the right-hand side are the trends in linear or logistic growth (g(t)), periodic patterns (s(t): e.g., yearly seasonality), the effects of holidays (h(t)), and changes that cannot be expressed by the model (the error term ).
Prophet uses Fourier series to describe s(t). t represents the date, and P is the length of the period (e.g., P is selected as 365.25 for yearly data). In this study, we utilize the default value of N since Taylor and Letham [34] demonstrated that these values perform well for most issues (i.e., N = 10 for yearly components).
Holiday effects on pollution are usually due to changes in emissions from traffic and industrial activities [37,41]. For example, urban areas of Beijing always show a decrease of traffic congestion due to large population outflow on national holidays, especially during the National Day and Spring Festival. This pattern would be expected to be similar year after year. Therefore, holidays may provide non-negligible and regular shocks to air quality [42].
On September 18, 1999, China’s State Council issued the “Golden Week” holiday system, in which there are three seven-day national holidays each year, i.e., Spring Festival, May Day, and the National Day. On December 16, 2007, China adjusted the legal holiday and released the revised “Regulation on Public Holidays for National Annual Festivals and Memorial Days”. May Day’s Golden Week was replaced by a three-day holiday. Instead, extra three-day national holidays for traditional festivals are released including Tomb-Sweeping Day, the Dragon Boat Festival, and the Mid-Autumn Festival [43]. All national holidays during 2004-2018 are listed in Table A1 and incorporated into Prophet.
2.3. Emission Inventory
We also collected the monthly total emissions of PM2.5 [44], sulfur dioxide (SO2), and nitrogen oxides (NOx) [45] over the Beijing area (115.2°E–117.2°E, 39.2°N–41.2°N) from Peking University (http://inventory.pku.edu.cn/). The oxidation of atmospheric NOx and SO2 will produce secondary PM2.5. The inventories (spatial resolution of 0.1° × 0.1°) consist of six sectors. This emission inventories are calculated by a bottom-up approach covering 1960–2014.
3. Results
3.1. General Picture of AOD and PM2.5 Time-Series
The time-series of daily AOD and PM2.5 values are shown in Figure 2. Annual average AOD values were 0.59 ± 0.10 (2004–2018) and 0.36 ± 0.12 (2004–2017), and PM2.5 concentrations were 85.4 ± 17.1 (2008–2018) and 42.6 ± 9.7 (2005–2018) µg m−3 at UR and RU, respectively. At least 46.5% and 15.0% of daily mean PM2.5 concentration exceeded the ambient air quality standards of China (GB 3095–2012, 75 µg m−3) at UR and RU, respectively. Both AOD and PM2.5 showed decreasing trends in recent years at UR and RU, which will be explored in detail below. Furthermore, PM2.5 at RU was closely correlated to that at UR with a correlation coefficient (R) of 0.80 (Table A2). A relatively larger R (0.88) was also derived for AOD. This high agreement indicated a coherent variation of aerosol pollution in a fairly large area [46,47].
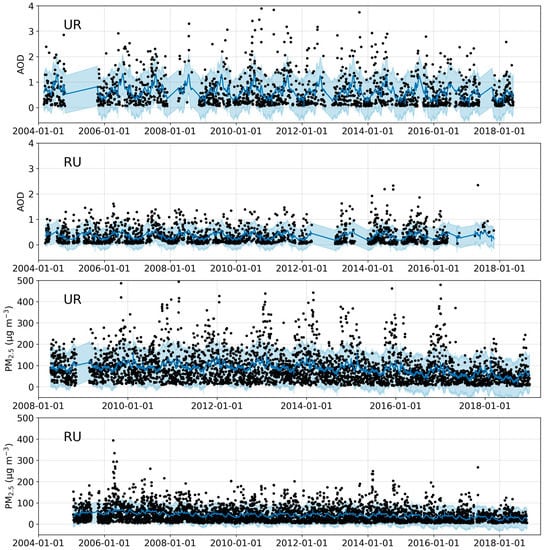
Figure 2.
Daily AOD and PM2.5 concentration time-series at UR and RU. The solid dark blue line is the fitted value of time-series at the 95% confidence interval (light blue area).
3.2. Secular Trends of AOD and PM2.5 Concentrations
Figure 3 illustrates the annual trends of AOD and PM2.5 concentrations at UR and RU. AOD at UR showed a steady decreasing tendency with a decrease of 0.10 during 2007–2018. AOD and PM2.5 at RU increased slightly during 2004–2006, but a steady decreasing tendency was observed thereafter in response to clean air policies [48]. The effects of policies are evidenced by emission changes over the Beijing area in Figure 4, which showed that total emissions of PM2.5 and NOx started to decrease at the beginning of 2007. For PM2.5, there was an encouraging changing point near 2014 at both stations, with PM2.5 at UR and RU decreasing by 19.6% and 16.0% (22 and 7 µg m−3) by the end of 2015, respectively. The steady improvement in PM2.5 level since 2014 coincides with the “Clean Air Action Plan” implemented at the end of 2013, indicating the effectiveness of these measures on the control of the PM2.5 pollution level. However, AOD kept the same decreasing tendencies since 2007. This result implied that the air pollution control measures exerted a much larger effect on surface level PM2.5 concentration than AOD.
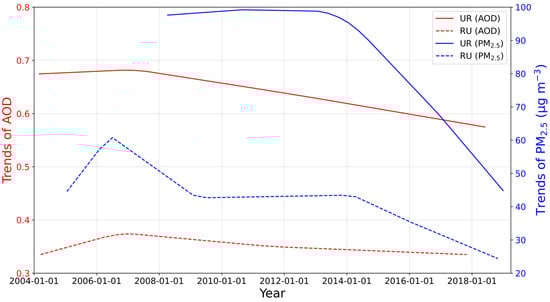
Figure 3.
Trends of AOD (red) and PM2.5 concentrations (blue) at the urban station (solid lines) and rural station (dashed lines).
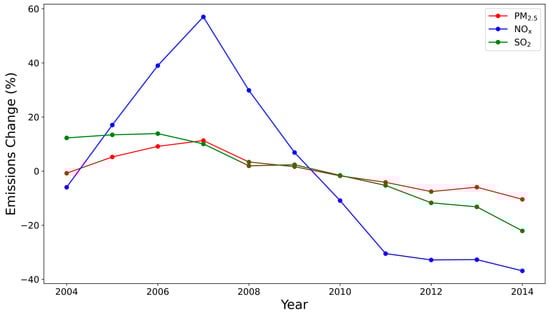
Figure 4.
Annual variations in total emissions of PM2.5, sulfur dioxide (SO2), and nitrogen oxide (NOx) averaged for the Beijing area (115.2°E–117.2°E, 39.2°N–41.2°N). Percentage changes are calculated against the average value during 2004–2014.
3.3. Seasonality
The seasonality of AOD and PM2.5 at UR was the opposite, with maximum AOD, but minimum PM2.5 in summer and vice versa in winter (Figure 5). Fueled by solar radiation in summer, aerosols can be transported to a high level of the atmosphere. This can result in a decrease of PM2.5 at UR. However, the frequent occurrence of a strong temperature inversion in winter prevents air pollution from penetrating the upper free convective layer, leading to higher surface level PM2.5 concentrations [22,28]. The larger AOD values in summer were also discovered over NCP by Qu et al. [49]. Based on multi-source meteorological data, including the vertical profile of the aerosol extinction coefficient, relative humidity, and wind from reanalysis data, Qu et al. [49] deduced that higher AOD in summer was likely because of greater aerosol hygroscopic growth under a hot and humid environment, a higher planetary boundary layer height (PBLH) that resulted in transporting more aerosol particles to a higher level, and the advection of the summer monsoon from the eastward open topographical basin (further reading of meteorological analysis can be found in [49]).

Figure 5.
Seasonality components of AOD (red) and PM2.5 concentrations (blue) at UR (solid lines) and RU (dashed lines).
On the contrary, RU was characterized by similar seasonal variations of AOD and PM2.5 (higher values in spring and summer while lower values in winter). Higher PM2.5 at RU in spring and summer was likely related to natural emissions of PM2.5, i.e., dust events in spring and biomass burning events in June [50]. Furthermore, one more outstanding feature at RU is that observations were made on the south slope of a hill (293 m), and the frequent occurrence of a strong near surface inversion in winter may prevent the transport of local human emissions to the top of the hill.
3.4. Holiday Effects
Consistent holiday effects on PM2.5 and AOD were not observed in most cases (Figure A1 and Figure A2) except during the seven-day National Day holiday. This was likely because the effect of the three days off in most circumstances on PM2.5 and AOD was blurred by a non-periodic weather effect that should dominantly determine the short-term day-to-day variability of AOD and PM2.5. An interesting result was derived during the seven-day National Day holiday, i.e., the components of AOD and PM2.5 nearly always shifted from negative to positive values during 1 October to 7 October (Figure 6). This phenomenon was associated with the annual cycle between the summer and winter monsoons in East Asia. At the beginning of October, the East Asian summer monsoon (EASM) moves southward, and Beijing is gradually dominated by the East Asian winter monsoon (EAWM) [51]. Subsequently, there will be a temperature inversion leading to a more stable atmosphere, and the pollutants near the surface cannot spread to high levels. Meanwhile, because people in Beijing take car trips to nearby provinces at the beginning of the holiday, this would result in a reduction of traffic flow downtown. High traffic inflows at the end of holidays, on the contrary, are likely to contribute to increasing air pollution [52].
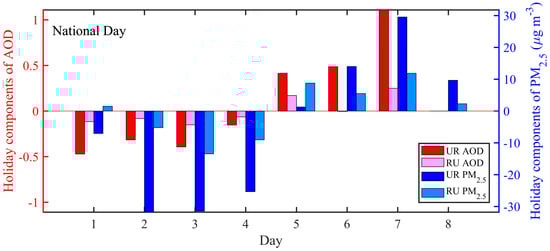
Figure 6.
Holiday components of AOD (red) and PM2.5 (blue) for urban and rural stations. The components are averaged over years when data are available.
3.5. Diurnal Variation of PM2.5 and AOD
At UR, AOD steadily increased throughout the daytime. The temporal evolution of the boundary layer height after sunrise led to the column-integrated aerosol concentration increasing because more aerosols were transported into the troposphere (Figure 7). Larger secondary aerosols which were not directly from the planet’s surface (such as sulfate and organic aerosol), formation in the afternoon as air temperature increases and hygroscopic growth would also contribute to this daytime AOD variability. At RU, AOD remained stable or decreased slightly from dawn to ~11:00 LST and, afterwards, increased with a comparable (in autumn and winter) or larger (spring and summer) rate to sunset as compared to that at UR. Daytime AOD variabilities showed seasonal dependence, with magnitudes varying from ~20% in summer (minima) to ~40% in winter (maxima).
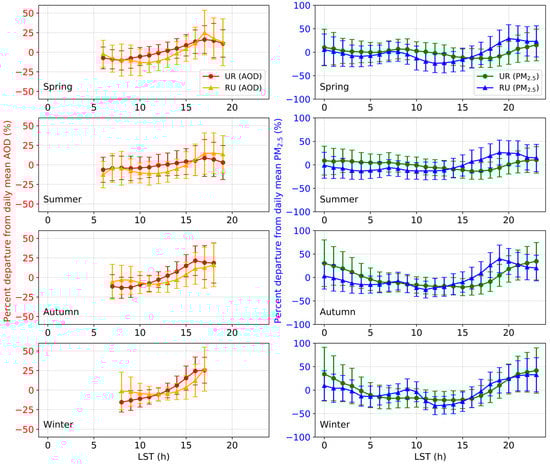
Figure 7.
Diurnal variation of AOD (red for UR, orange for RU) and PM2.5 (green for UR, blue for RU) as the percent departure from the daily mean at UR (circle) and RU (triangle). The error bar is ± one standard deviation of the mean. LST, local standard time.
An expected morning rush hour (7:00–9:00 LST) enhancement of PM2.5 at UR was only clearly discerned in spring (increase by ~8%). On the contrary, this feature was always observed at RU, which was very likely due to cooking rather than traffic emissions. PM2.5 concentrations decreased to the minima in the afternoon, i.e., 15:00–16:00 LST, when generally, the planetary boundary layer height reaches its maximum at UR. It is interesting to note that the minimum PM2.5 was observed at 11:00–12:00 LST at RU. Analysis of wind direction showed that it shifted from southeasterly to southwesterly wind at 11:00 LST [50]. Considering that the RU is surrounded by hills except to the southwest with local emissions, southwesterly winds would advect pollutants (primary and secondary aerosols) from the southern plain to the sampling site. Therefore, PM2.5 concentrations at RU began to increase earlier than UR as a result of the change in wind direction. The maxima of PM2.5 generally occurred at 23:00 LST at UR, which occurred earlier at RU (19:00–20:00 LST). From midnight towards dawn, PM2.5 concentrations fell again because of the reduction in human activities.
Note that the daytime variability of PM2.5 from 11:00 LST to sunset kept pace with that of AOD at RU, which indicated that PM2.5 there was weakly impacted by the temporal evolution of the boundary layer height. That is to say, the temporal variability of PM2.5 was dominantly determined by the formation of aerosols in the atmosphere or the transport of dust and biomass burning aerosols, which resulted in a coherent temporal variation of PM2.5 and AOD, from daytime to seasonal scales. On the contrary, the daytime evolution of PM2.5 was nearly opposite that of AOD at UR.
3.6. PM2.5 and AOD Relationship
One of the most prominent features of the secular trend of η was that it decreased remarkably since ~ 2015 at both stations (Figure 8). The secular trends of η before ~2015 differed between UR and RU. η remained nearly stable during 2008 to 2015 at UR; however, η decreased from 2004 to 2011 and then increased in 2015 at RU. It is interesting to note that the decreasing η since ~2015 was accompanied by the fact that both AOD and PM2.5 decreased (Figure 3).
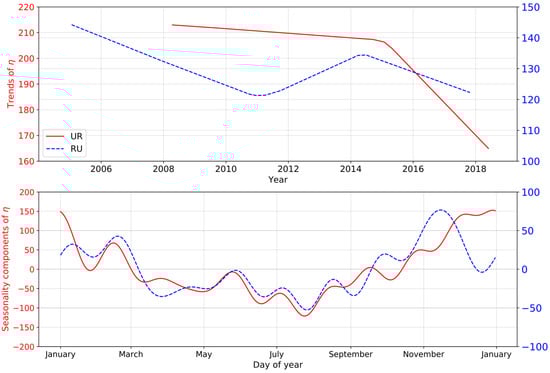
Figure 8.
Trends and seasonality components of the ratios (PM2.5 mass concentration to AOD, η) for urban (red solid line) and rural (blue dashed line) stations.
Though the seasonality components of individual variables (AOD and PM2.5) were different at UR and RU, η shared nearly the same seasonal variation at both stations, i.e., usually lower in summer (minima in August) and higher in winter (maxima in January at UR and December at RU). Greater PM2.5, but lesser AOD were observed in winter at UR, which resulted in the largest η [32]. At RU, AOD seasonality was substantially greater than that of PM2.5 and the maximum AOD occurred in summer (Figure 5); therefore, it was natural to observe the minimum η in summer.
Figure 9 presents the diurnal variation of η and R between hourly AOD and PM2.5 as the percent departure from the daily mean. η decreased from sunrise to about 14:00 LST; afterwards, η increased slightly until sunset. This pattern was always observed in each season, although it varied slightly between seasons and stations. η at RU always began to increase a few hours (1−2 h) earlier than that at UR, which was due to the earlier increase of PM2.5 concentrations at RU (Figure 7). Hourly η at 11:00 LST, the Terra overpass time, was within the daytime mean η by a few percent; however, η at 14:00 LST, the Aqua overpass time, was systematically smaller than the daytime mean value by 10–20%. Hourly PM2.5 was significantly correlated with AOD, which showed little seasonal and station dependence. R generally varied from 0.6 to 0.8.
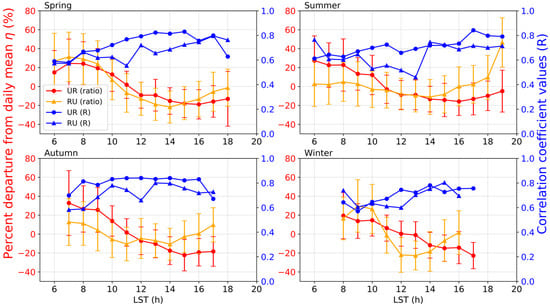
Figure 9.
Diurnal variation of the ratios (PM2.5 to AOD, η) as the percent departure from the daily mean at UR and RU stations (red for UR and orange for RU). The correlation coefficient values (R) between AOD and PM2.5 for each hour are in blue color. The lower-left text is the daily mean of each line. The error bar is ± one standard deviation of the mean.
4. Discussion
For the interpretation of the seasonality in Section 3.3, it would be more comprehensive if the corresponding meteorological fields (e.g., humidity, wind, pressure, etc.) were analyzed. Meanwhile, a trajectory analysis combined with a high resolution emission inventory may help us understand the advection of pollutants [53]. In this study, column AOD data were used to investigate the relationship with the surface PM2.5 massive concentrations. However, a detailed interpretation of the internal mechanisms of η requires more supporting data, e.g., chemical composition variation and meteorological variables. For example, the aerosol particles aloft have more of a contribution to AOD than the ground PM2.5 concentrations. Further, a conversion from column to ground-level AOD using the planetary boundary layer height, relative humidity information, and the vertical aerosol profile should improve the AOD-PM2.5 relationship [27].
Satellite estimation of PM2.5 is mainly based on the AOD-PM2.5 relationship established by collocated AOD-PM2.5 pairs by using simple regression or complex machine learning methods. As shown above, η at each station had distinct temporal variations from the annual to diurnal scale. Therefore, temporal missing values of AOD-PM2.5 pairs may lead to a large bias of the relationship during these days. It should also be noted that PM2.5 estimated from Aqua AOD (overpass time ~14:00 LST) would have systematically underestimated the daytime mean value (Figure 9). In spatial terms, larger magnitudes of each η component at UR remind us that the AOD-PM2.5 relationship varies by location. For better PM2.5 estimation, one is filling the AOD missing values, and the other is utilizing more variables, such as aerosol type, relative humidity, and wind, to build a more sophisticated AOD-PM2.5 model. Future work aims at applying a chemical transport model like the Goddard Earth Observing System (GEOS) Chemistry transport model (GEOS-CHEM) to study the impacting factors of AOD-PM2.5 and explore the internal mechanism.
5. Conclusions
In a brief overview, we applied Facebook Prophet, a newly-developed and powerful procedure, to analyze the secular trend, seasonality, and holiday components of AOD and PM2.5 concentrations, as well as the ratio of PM2.5 to AOD at two representative stations in Beijing, i.e., a rural station and an urban station. The main conclusions are summarized as follows.
Annual average values of PM2.5 and AOD at RU were almost 1.6 and 2.0 times as large as those at RU, respectively. Trend analysis revealed a coherent turning point of PM2.5 at both stations, i.e., PM2.5 has decreased remarkably since the end of 2013 as a result of the implementation of the air pollution control program.
The seasonal variation of PM2.5 was similar to that of AOD at RU, i.e., greater AOD and PM2.5 in summer and smaller values in winter, while the PM2.5 seasonality (greater/lesser in winter/summer) was opposite that of AOD (greater/lesser in summer/winter) at UR.
Holiday effects on AOD and PM2.5 concentrations were not discerned in most circumstances; however, a consistent holiday effect on PM2.5 and AOD was observed during the seven-day National Day holiday.
Diurnal variations of AOD and PM2.5 were larger at UR than at RU. PM2.5 at RU reached minima/maxima four hours later/earlier (at around 11:00–12:00/19:00 LST) than UR for all seasons except in winter.
Based on the ratio between PM2.5 and AOD, we found that the trends of η began to decrease in 2015 for both stations. η shared nearly the same seasonal variation at both stations, i.e., usually lower in summer and higher in winter. The diurnal cycle of η featured a decreasing tendency from sunrise to about 14:00 LST and an increasing tendency toward sunset.
Author Contributions
Conceptualization, D.F. and X.X.; data curation, Z.S., W.P., Z.M., W.Q. and H.Z.; formal analysis, D.F. and Z.S.; funding acquisition, X.X.; Methodology, D.F.; writing—original draft, D.F. and X.X.; writing—review and editing, X.Z., Y.W., M.D., W.Q., H.C. and X.X. All authors have read and agreed to the published version of the manuscript.
Acknowledgments
This work was supported by the national key research and development program of China (2016YFC0200403) and the National Science Foundation of China (91644217, 41475138).
Conflicts of Interest
We confirm that the manuscript was approved by all named authors and declare that we have no financial nor personal relationships with other people or organizations that could inappropriately influence our work.
Appendix A

Table A1.
List of China holidays.
Table A1.
List of China holidays.
| Year | New Year’s Day | Sprig Festival | Tomb-Sweeping Day | Labor Day | Dragon Boat Festival | Mid-Autumn Festival | National Day |
|---|---|---|---|---|---|---|---|
| 2004 | 2004/01/01 (1) 1 | 2004/01/22 (7) | NAN | 2004/05/01 (7) | NAN | NAN | 2004/10/01 (7) |
| 2005 | 2005/01/01 (3) | 2005/02/09 (7) | NAN | 2005/05/01 (7) | NAN | NAN | 2005/10/01 (7) |
| 2006 | 2006/01/01 (3) | 2006/01/29 (7) | NAN | 2006/05/01 (7) | NAN | NAN | 2006/10/01 (7) |
| 2007 | 2007/01/01 (3) | 2007/02/18 (7) | NAN | 2007/05/01 (7) | NAN | NAN | 2007/10/01 (7) |
| 2008 | 2007/12/30 (3) | 2008/02/06 (7) | 2008/04/04 (3) | 2008/05/01 (3) | 2008/06/07 (3) | 2008/09/13 (3) | 2008/10/01 (7) |
| 2009 | 2009/01/01 (3) | 2009/01/25 (7) | 2009/04/04 (3) | 2009/05/01 (3) | 2009/05/28 (3) | NAN | 2009/10/01 (8) 2 |
| 2010 | 2010/01/01 (3) | 2010/02/13 (7) | 2010/04/03 (3) | 2010/05/01 (3) | 2010/06/06 (3) | 2010/09/20 (3) | 2010/10/01 (7) |
| 2011 | 2011/01/01 (3) | 2011/02/02 (7) | 2011/04/03 (3) | 2011/05/01 (3) | 2011/06/04 (3) | 2011/09/10 (3) | 2011/10/01 (7) |
| 2012 | 2012/01/01 (3) | 2012/01/22 (7) | 2012/04/02 (3) | 2012/04/29 (3) | 2012/06/22 (3) | NAN | 2012/09/30 (8) 2 |
| 2013 | 2013/01/01 (3) | 2013/02/09 (7) | 2013/04/04 (3) | 2013/04/29 (3) | 2013/06/10 (3) | 2013/09/19 (3) | 2013/10/01 (7) |
| 2014 | 2014/01/01 (1) 1 | 2014/01/31 (7) | 2014/04/05 (3) | 2014/05/01 (3) | 2014/05/31 (3) | 2014/09/06 (3) | 2014/10/01 (7) |
| 2015 | 2015/01/01 (3) | 2015/02/18 (7) | 2015/04/05 (3) | 2015/05/01 (3) | 2015/06/20 (3) | 2015/09/27 (3) | 2015/10/01 (7) |
| 2016 | 2016/01/01 (3) | 2016/02/07 (7) | 2016/04/02 (3) | 2016/04/30 (3) | 2016/06/09 (3) | 2016/09/15 (3) | 2016/10/01 (7) |
| 2017 | 2017/01/01 (3) | 2017/01/27 (7) | 2017/04/03 (3) | 2017/05/01 (3) | 2017/05/28 (3) | NAN | 2017/10/01 (8) 2 |
| 2018 | 2017–12-30 (3) | 2018/02/15 (7) | 2018/04/05 (3) | 2018/05/01 (3) | 2018/6/16 (3) | 2018/09/22 (3) | 2018/10/01 (7) |
1 In 2004 and 2014, New Year’s Day had only one day off. 2 In 2009, 2012, and 2017, National Day had 8 days off since the Mid-Autumn Festival was combined. The number in parentheses is the number of days off. NAN here refers to the day off does not exist.
Table A2.
Correlation coefficients# among PM2.5, AOD, and emissions.
Table A2.
Correlation coefficients# among PM2.5, AOD, and emissions.
| UR PM2.5 | RU PM2.5 | UR AOD | RU AOD | PM2.5 Emission | NOx Emission | SO2 Emission | |
|---|---|---|---|---|---|---|---|
| UR PM2.5 | 1.00 | 0.80 | 0.88 | 0.75 | 0.54 (0.20) | 0.28 (0.53) | 0.72 (0.07) |
| RU PM2.5 | 0.80 | 1.00 | 0.82 | 0.88 | 0.85 | 0.83 | 0.78 |
| UR AOD | 0.88 | 0.82 | 1.00 | 0.88 | 0.91 | 0.86 | 0.88 |
| RU AOD | 0.75 | 0.88 | 0.88 | 1.00 | 0.85 | 0.88 | 0.56 (0.07) |
| PM2.5 emission | 0.54 (0.20) | 0.85 | 0.91 | 0.85 | 1.00 | 0.97 | 0.88 |
| NOx emission | 0.28 (0.53) | 0.83 | 0.86 | 0.88 | 0.97 | 1.00 | 0.80 |
| SO2 emission | 0.72 (0.07) | 0.78 | 0.88 | 0.56 (0.07) | 0.88 | 0.80 | 1.00 |
# The correlation coefficients are calculated based on the yearly mean values of time-series. The relatively poor relationship between emissions data and UR PM2.5 is associated with insufficient valid data pairs (PM2.5 records began in 2008, while emissions data ended in 2014). p-values greater than 0.01 are presented in parentheses, and all others are less than 0.01.

Figure A1.
Holiday components of AOD and PM2.5 at the urban and rural stations. The components are averaged every four years (2004–2007 and 2008–2011) when data are available. NY, SF, TS, LD, DBF, MAF, and ND represent New Year’s Day, Spring Festival, Tomb-Sweeping Day, Labor Day, Dragon Boat Festival, Mid-Autumn Festival, and National Day. Bars in red, pink, blue, and light blue refer to holiday components of urban AOD, rural AOD, urban PM2.5, and rural PM2.5, respectively.


Figure A2.
Same as Figure A1, except that the components are averaged over 2012–2015 (left) and 2016–2018 (right).
Figure A2.
Same as Figure A1, except that the components are averaged over 2012–2015 (left) and 2016–2018 (right).

References
- Huang, R.-J.; Zhang, Y.; Bozzetti, C.; Ho, K.-F.; Cao, J.-J.; Han, Y.; Daellenbach, K.R.; Slowik, J.G.; Platt, S.M.; Canonaco, F.; et al. High secondary aerosol contribution to particulate pollution during haze events in China. Nature 2014, 514, 218–222. [Google Scholar] [CrossRef] [PubMed]
- Zhang, J.; Reid, J.S.; Alfaro-Contreras, R.; Xian, P. Has China been exporting less particulate air pollution over the past decade? Geophys. Res. Lett. 2017, 44, 2941–2948. [Google Scholar] [CrossRef]
- Wang, X.; Wei, W.; Cheng, S.; Li, J.; Zhang, H.; Lv, Z. Characteristics and classification of PM2.5 pollution episodes in Beijing from 2013 to 2015. Sci. Total Environ. 2018, 612, 170–179. [Google Scholar] [CrossRef] [PubMed]
- Yan, R.; Yu, S.; Zhang, Q.; Li, P.; Wang, S.; Chen, B.; Liu, W. A heavy haze episode in Beijing in February of 2014: Characteristics, origins and implications. Atmos. Pollut. Res. 2015, 6, 867–876. [Google Scholar] [CrossRef]
- Bi, J.; Huang, J.; Hu, Z.; Holben, B.N.; Guo, Z. Investigating the aerosol optical and radiative characteristics of heavy haze episodes in Beijing during January of 2013. J. Geophys. Res. Atmos. 2014, 119, 9884–9900. [Google Scholar] [CrossRef]
- Sun, L.; Xia, X.; Wang, P.; Zhang, R.; Che, H.; Deng, Z.; Fei, Y.; Ran, L.; Meng, X.; Xia, X.; et al. Surface and column-integrated aerosol properties of heavy haze events in January 2013 over the North China plain. Aerosol Air Qual. Res. 2015, 15, 1514–1524. [Google Scholar] [CrossRef]
- Ji, D.; Li, L.; Wang, Y.; Zhang, J.; Cheng, M.; Sun, Y.; Liu, Z.; Wang, L.; Tang, G.; Hu, B.; et al. The heaviest particulate air-pollution episodes occurred in northern China in January, 2013: Insights gained from observation. Atmos. Environ. 2014, 92, 546–556. [Google Scholar] [CrossRef]
- Che, H.; Xia, X.; Zhu, J.; Li, Z.; Dubovik, O.; Holben, B.; Goloub, P.; Chen, H.; Estelles, V.; Cuevas-Agulló, E.; et al. Column aerosol optical properties and aerosol radiative forcing during a serious haze-fog month over North China Plain in 2013 based on ground-based sunphotometer measurements. Atmos. Chem. Phys. 2014, 14, 2125–2138. [Google Scholar] [CrossRef]
- Wang, Y.S.; Yao, L.; Wang, L.L.; Liu, Z.R.; Ji, D.S.; Tang, G.Q.; Zhang, J.K.; Sun, Y.; Hu, B.; Xin, J.Y. Mechanism for the formation of the January 2013 heavy haze pollution episode over central and eastern China. Sci. China Earth Sci. 2014, 57, 14–25. [Google Scholar] [CrossRef]
- Wang, L.; Zhang, N.; Liu, Z.; Sun, Y.; Ji, D.; Wang, Y. The Influence of Climate Factors, Meteorological Conditions, and Boundary-Layer Structure on Severe Haze Pollution in the Beijing-Tianjin-Hebei Region during January 2013. Adv. Meteorol. 2014, 2014, 685971. [Google Scholar] [CrossRef]
- Chen, W.; Tang, H.; Zhao, H. Diurnal, weekly and monthly spatial variations of air pollutants and air quality of Beijing. Atmos. Environ. 2015, 119, 21–34. [Google Scholar] [CrossRef]
- Li, R.; Li, Z.; Gao, W.; Ding, W.; Xu, Q.; Song, X. Diurnal, seasonal, and spatial variation of PM2.5 in Beijing. Sci. Bull. 2015, 60, 387–395. [Google Scholar] [CrossRef]
- Wang, J.; Christopher, S.A. Intercomparison between satellite-derived aerosol optical thickness and PM2.5 mass: Implications for air quality studies. Geophys. Res. Lett. 2003, 30, 2095. [Google Scholar] [CrossRef]
- Pu, Q.; Yoo, E. Spatio-temporal modeling of PM2.5 concentrations with missing data problem: A case study in Beijing. Int. J. Geogr. Inf. Sci. 2020, 34, 423–447. [Google Scholar] [CrossRef]
- Spatial, E.R.; Data, U.S.; Information, L.U.; Liu, Y.; Paciorek, C.J.; Koutrakis, P. Estimating regional spatial and temporal variability of PM2.5 concentrations using satellite data, meteorology, and land use information. Environ. Health Perspect. 2009, 117, 886–892. [Google Scholar]
- Holben, B.N.; Eck, T.F.; Slutsker, I.; Tanré, D.; Buis, J.P.; Setzer, A.; Vermote, E.; Reagan, J.A.; Kaufman, Y.J.; Nakajima, T.; et al. AERONET-A federated instrument network and data archive for aerosol characterization. Remote Sens. Environ. 1998, 66, 1–16. [Google Scholar] [CrossRef]
- Eck, T.F.; Holben, B.N.; Reid, J.S.; Dubovik, O.; Smirnov, A.; O’Neill, N.T.; Slutsker, I.; Kinne, S.; Neill, N.T.O.; Slutsker, I.; et al. Wavelength dependence of the optical depth of biomass burning, urban, and desert dust aerosols. J. Geophys. Res. Atmos. 1999, 104, 31333–31349. [Google Scholar] [CrossRef]
- Song, Z.; Fu, D.; Zhang, X.; Han, X.; Song, J.; Zhang, J.; Wang, J.; Xia, X. MODIS AOD sampling rate and its effect on PM2.5 estimation in North China. Atmos. Environ. 2019, 209, 14–22. [Google Scholar] [CrossRef]
- Che, H.; Xia, X.; Zhao, H.; Dubovik, O.; Holben, B.N.; Goloub, P.; Cuevas-Agulló, E.; Estelles, V.; Wang, Y.; Zhu, J.; et al. Spatial distribution of aerosol microphysical and optical properties and direct radiative effect from the China Aerosol Remote Sensing Network. Atmos. Chem. Phys. 2019, 19, 11843–11864. [Google Scholar] [CrossRef]
- Li, X.; Qiao, Y.; Shi, L. Has China’s war on pollution slowed the growth of its manufacturing and by how much? Evidence from the Clean Air Action. China Econ. Rev. 2019, 53, 271–289. [Google Scholar] [CrossRef]
- Zheng, Y.; Xue, T.; Zhang, Q.; Geng, G.; Tong, D.; Li, X.; He, K. Air quality improvements and health benefits from China’s clean air action since 2013. Environ. Res. Lett. 2017, 12, 114020. [Google Scholar] [CrossRef]
- Li, Z.; Guo, J.; Ding, A.; Liao, H.; Liu, J.; Sun, Y.; Wang, T.; Xue, H.; Zhang, H.; Zhu, B. Aerosol and boundary-layer interactions and impact on air quality. Natl. Sci. Rev. 2017, 4, 810–833. [Google Scholar] [CrossRef]
- Che, H.; Gui, K.; Xia, X.; Wang, Y.; Holben, B.N.; Goloub, P.; Cuevas-Agulló, E.; Wang, H.; Zheng, Y.; Zhao, H.; et al. Large contribution of meteorological factors to inter-decadal changes in regional aerosol optical depth. Atmos. Chem. Phys. 2019, 19, 10497–10523. [Google Scholar] [CrossRef]
- Miao, Y.; Li, J.; Miao, S.; Che, H.; Wang, Y.; Zhang, X.; Zhu, R.; Liu, S. Interaction Between Planetary Boundary Layer and PM2.5 Pollution in Megacities in China: A Review. Curr. Pollut. Rep. 2019, 5, 261–271. [Google Scholar] [CrossRef]
- Wang, H.; Chen, H.; Liu, J. Arctic Sea Ice Decline Intensified Haze Pollution in Eastern China Arctic Sea Ice Decline Intensified Haze Pollution in Eastern China. Atmos. Ocean. Sci. Lett. 2015, 8, 1–9. [Google Scholar]
- Lou, S.; Yang, Y.; Wang, H.; Smith, S.J.; Qian, Y.; Rasch, P.J. Black Carbon Amplifies Haze Over the North China Plain by Weakening the East Asian Winter Monsoon. Geophys. Res. Lett. 2019, 46, 452–460. [Google Scholar] [CrossRef]
- Lin, C.; Li, Y.; Yuan, Z.; Lau, A.K.H.; Li, C.; Fung, J.C.H. Using satellite remote sensing data to estimate the high-resolution distribution of ground-level PM2.5. Remote Sens. Environ. 2015, 156, 117–128. [Google Scholar] [CrossRef]
- Xia, X.A.; Chen, H.B.; Wang, P.C.; Zhang, W.X.; Goloub, P.; Chatenet, B.; Eck, T.F.; Holben, B.N. Variation of column-integrated aerosol properties in a Chinese urban region. J. Geophys. Res. 2006, 111, 1–10. [Google Scholar] [CrossRef]
- Xu, G.; Jiao, L.; Zhao, S.; Cheng, J. Spatial and temporal variability of PM2.5 concentration in China. Wuhan Univ. J. Nat. Sci. 2016, 21, 358–368. [Google Scholar] [CrossRef]
- Guo, J.; Xia, F.; Zhang, Y.; Liu, H.; Li, J.; Lou, M.; He, J.; Yan, Y.; Wang, F.; Min, M.; et al. Impact of diurnal variability and meteorological factors on the PM2.5-AOD relationship: Implications for PM2.5 remote sensing. Environ. Pollut. 2017, 221, 94–104. [Google Scholar] [CrossRef]
- Ma, X.; Wang, J.; Yu, F.; Jia, H.; Hu, Y. Can MODIS AOD be employed to derive PM2.5 in Beijing-Tianjin-Hebei over China? Atmos. Res. 2016, 181, 250–256. [Google Scholar] [CrossRef]
- Yang, Q.; Yuan, Q.; Yue, L.; Li, T.; Shen, H.; Zhang, L. The relationships between PM2.5 and aerosol optical depth (AOD) in mainland China: About and behind the spatio-temporal variations. Environ. Pollut. 2019, 248, 526–535. [Google Scholar] [CrossRef]
- Borowik, G.; Wawrzyniak, Z.M.; Cichosz, P. Time series analysis for crime forecasting. In Proceedings of the 2018 26th International Conference on Systems Engineering (ICSEng), Sydney, Australia, 18–20 December 2018; pp. 1–10. [Google Scholar]
- Taylor, S.J.; Letham, B. Forecasting at Scale. Am. Stat. 2018, 72, 37–45. [Google Scholar] [CrossRef]
- Zhao, N.; Liu, Y.; Vanos, J.K.; Cao, G. Day-of-week and seasonal patterns of PM2.5 concentrations over the United States: Time-series analyses using the Prophet procedure. Atmos. Environ. 2018, 192, 116–127. [Google Scholar] [CrossRef]
- Mukherjee, A.; Toohey, D.W. A study of aerosol properties based on observations of particulate matter from the U.S. Embassy in Beijing, China. Earth’s Future 2016, 4, 381–395. [Google Scholar] [CrossRef]
- Jiang, Q.; Sun, Y.L.; Wang, Z.; Yin, Y. Aerosol composition and sources during the Chinese Spring Festival: Aerosol composition and sources during the Chinese Spring Festival: Fireworks, secondary aerosol, and holiday effects. Atmos. Chem. Phys. 2014, 15, 6023–6034. [Google Scholar] [CrossRef]
- Schwab, J.J.; Felton, H.D.; Rattigan, O.V.; Demerjian, K.L. New York state urban and rural measurements of continuous PM2.5 Mass by FDMS, TEOM, and BAM. J. Air Waste Manag. Assoc. 2006, 56, 372–383. [Google Scholar] [CrossRef]
- Smirnov, A.; Holben, B.N.; Eck, T.F.; Slutsker, I.; Chatenet, B.; Pinker, R.T. Diurnal variability of aerosol optical depth observed at AERONET (Aerosol Robotic Network) sites. Geophys. Res. Lett. 2002, 29, 30-1–30-4. [Google Scholar] [CrossRef]
- Van Donkelaar, A.; Martin, R.V.; Brauer, M.; Kahn, R.; Levy, R.; Verduzco, C.; Villeneuve, P.J. Global estimates of ambient fine particulate matter concentrations from satellite-based aerosol optical depth: Development and application. Environ. Health Perspect. 2010, 118, 847–855. [Google Scholar] [CrossRef]
- Feng, J.; Yu, H.; Su, X.; Liu, S.; Li, Y.; Pan, Y.; Sun, J. Chemical composition and source apportionment of PM2.5 during Chinese Spring Festival at Xinxiang, a heavily polluted city in North China: Fireworks and health risks. Atmos. Res. 2016, 182, 176–188. [Google Scholar] [CrossRef]
- Tan, P.H.; Chou, C.; Liang, J.Y.; Chou, C.C.K.; Shiu, C.J. Air pollution “holiday effect” resulting from the Chinese New Year. Atmos. Environ. 2009, 43, 2114–2124. [Google Scholar] [CrossRef]
- Shen, H.; Wang, Q.; Ye, C.; Liu, J.S. The evolution of holiday system in China and its influence on domestic tourism demand. J. Tour. Future 2018, 4, 139–151. [Google Scholar] [CrossRef]
- Huang, Y.; Shen, H.; Chen, H.; Wang, R.; Zhang, Y.; Su, S.; Chen, Y.; Lin, N.; Zhuo, S.; Zhong, Q.; et al. Quantification of global primary emissions of PM2.5, PM10, and TSP from combustion and industrial process sources. Environ. Sci. Technol. 2014, 48, 13834–13843. [Google Scholar] [CrossRef]
- Huang, T.; Zhu, X.; Zhong, Q.; Yun, X.; Meng, W.; Li, B.; Ma, J.; Zeng, E.Y.; Tao, S. Spatial and Temporal Trends in Global Emissions of Nitrogen Oxides from 1960 to 2014. Environ. Sci. Technol. 2017, 51, 7992–8000. [Google Scholar] [CrossRef]
- Fu, D.; Xia, X.; Wang, J.; Zhang, X.; Li, X.; Liu, J. Synergy of AERONET and MODIS AOD products in the estimation of PM2.5 concentrations in Beijing. Sci. Rep. 2018, 8, 2–9. [Google Scholar] [CrossRef]
- Xia, X.; Chen, H.; Goloub, P.; Zong, X.; Zhang, W.; Wang, P. Climatological aspects of aerosol optical properties in North China Plain based on ground and satellite remote-sensing data. J. Quant. Spectrosc. Radiat. Transf. 2013, 127, 12–23. [Google Scholar] [CrossRef]
- Gui, K.; Che, H.; Wang, Y.; Wang, H.; Zhang, L.; Zhao, H.; Zheng, Y.; Sun, T.; Zhang, X. Satellite-derived PM2.5 concentration trends over Eastern China from 1998 to 2016: Relationships to emissions and meteorological parameters. Environ. Pollut. 2019, 247, 1125–1133. [Google Scholar] [CrossRef]
- Qu, W.; Wang, J.; Zhang, X.; Sheng, L.; Wang, W. Opposite seasonality of the aerosol optical depth and the surface particulate matter concentration over the north China Plain. Atmos. Environ. 2016, 127, 90–99. [Google Scholar] [CrossRef]
- Zhao, X.; Zhang, X.; Xu, X.; Xu, J.; Meng, W.; Pu, W. Seasonal and diurnal variations of ambient PM2.5 concentration in urban and rural environments in Beijing. Atmos. Environ. 2009, 43, 2893–2900. [Google Scholar] [CrossRef]
- Yang, X.; Li, D.-L. Determination on the Boundary Belt of Subtropical Winter Monsoon in East Asia and Its Variance Characteristic. Plateau Meteorol. 2012, 31, 668–675. [Google Scholar]
- Zheng, Y.; Che, H.; Zhao, T.; Zhao, H.; Gui, K.; Sun, T.; An, L.; Yu, J.; Liu, C.; Jiang, Y.; et al. Aerosol optical properties observation and its relationship to meteorological conditions and emission during the Chinese National Day and Spring Festival holiday in Beijing. Atmos. Res. 2017, 197, 188–200. [Google Scholar] [CrossRef]
- Lolli, S.; Khor, W.Y.; Matjafri, M.Z.; Lim, H.S. Monsoon season quantitative assessment of biomass burning clear-sky aerosol radiative effect at surface by ground-based lidar observations in Pulau Pinang, Malaysia in 2014. Remote Sens. 2019, 11, 2660. [Google Scholar] [CrossRef]


© 2020 by the authors. Licensee MDPI, Basel, Switzerland. This article is an open access article distributed under the terms and conditions of the Creative Commons Attribution (CC BY) license (http://creativecommons.org/licenses/by/4.0/).