Article

Land Cover Trends in South Texas (1987–2050): Potential Implications for Wild Felids

by
Jason V. Lombardi
*,
Humberto L. Perotto-Baldivieso
and
Michael E. Tewes
Caesar Kleberg Wildlife Research Institute, Texas A&M University-Kingsville, Kingsville, TX 78363, USA
*
Author to whom correspondence should be addressed.
Remote Sens. 2020, 12(4), 659; https://doi.org/10.3390/rs12040659
Submission received: 2 January 2020 / Revised: 11 February 2020 / Accepted: 13 February 2020 / Published: 17 February 2020
(This article belongs to the Special Issue Remote Sensing and Geospatial Approaches for Landscape Ecology)

Abstract

:
The Rio Grande Delta and surrounding rangelands in Texas has become one of the fastest urbanizing regions in the United States over the last 35 years. We assessed how land cover trends contributed to the large-scale processes that have driven land cover change since 1987. We classified LANDSAT imagery from 1987 to 2016 to quantify different rates of land cover change and used housing density scenarios to project changes in the amount and spatial distribution of woody cover until 2050 and its potential impact on wild felid habitat. Since 1987, woody cover increased from 3.9% along with patch and edge density, whereas mean patch area and Euclidean nearest neighbor decreased. Closer inspection revealed that woody encroachment of small patches (<1 ha) was the leading cause of woody cover increase by a magnitude of 4, with an observed significant skewness and kurtosis in the frequency distribution of patch size across years. By 2050, urbanization will be the dominant landscape type and at least 200 km2 of woody cover may be lost, thereby affecting felid populations in South Texas. These results provide important information for predicting future woody cover fragmentation and its potential impact on the connectivity of wild felid populations.

Graphical Abstract

1. Introduction

Deforestation and degradation of native vegetation for agricultural land use and urbanization have had profound global effects on wildlife [1,2]. The human footprint on the natural landscape is unprecedented with more than 40% of the land surface affected by agriculture (i.e., crops and livestock) [1,3,4]. The global extent of urban lands increased by 58,000 km2 from 1970 to 2000, with the largest area of change occurring within North America [4]. Today, more than three billion people live in urbanized areas worldwide, with mid-century projections expected to surpass four billion [5,6]. As habitat fragmentation and degradation rates increase, the ability of certain wildlife species to survive or disperse into new areas will be affected [7].
In North America, the rate of urbanization and habitat fragmentation is currently outpacing the rate of land preservation and human population growth rate [5]. As habitats become fragmented, generalist carnivores such as coyotes (Canis latrans), raccoons (Procyon lotor), and red foxes (Vulpes vulpes) can exploit rapidly changing areas [5,8]. However, carnivores that have specialized habitat requirements such as the ocelot (Leopardus pardalis) and Canada lynx (Lynx canadensis) [9,10,11] and large home ranges (e.g., mountain lion [Puma concolor] and jaguar [Panthera onca]; [12,13,14]) are often most at risk. In southern California, increasing urban development, increased traffic volumes, and increased road construction has been linked to genetic isolation and lack of gene flow in mountain lion populations [15,16]. Further, persistence and connectivity among jaguar populations have been severely limited due to deforestation caused by agriculture, human development, and rangeland conversion [7,14,17].
In the early 1900s, five felid species were known to occupy the Rio Grande Delta and adjacent rangelands in South Texas: ocelot, bobcat (Lynx rufus), jaguar, mountain lion and jaguarundi (Puma yagouaroundi) [18]. The population statistics for these species in the early to mid-1900s are not known, but all felids were extensively hunted and trapped [18]. Today, ocelots are now endangered, and less than 80 remain in two small isolated populations in Kenedy, Willacy, and Cameron counties in South Texas [9,10]. Despite continued opportunistic trapping and hunting on private rangelands, bobcats are the most abundant felid whereas mountain lions are rare in many parts of South Texas [19,20,21].
Ocelots, bobcats, and mountain lions in Texas are dependent on large patches of woody cover [19,20,22]. Bobcats are generalists, and occur in mixed forests, thornshrub, riparian corridors and floodplains, coastal prairies, pastures, and developed areas [8,19,23]. Ocelots occur across a wide range of ecosystems [24], but they are considered a forest interior species and prefer larger patches (mean patch area = 9.2 ha) of dense woody vegetation communities with 95% vertical cover and 85% horizontal canopy cover in South Texas [19,22]. However, unlike bobcats and mountain lions, ocelots are not commonly observed near urban areas in South Texas [22], possibly due to lack of natural corridors and preferred habitat types.
The Rio Grande Delta region, including the cities of Harlingen, Brownsville, and McAllen, are among the most rapidly growing urban centers in the United States [21,25,26,27]. Historically, increases in row-crop agriculture, livestock production, and urbanization spurred the removal of native woody vegetation, which has transformed the Rio Grande Delta into the third most productive cropland in the United States [21]. An estimated 95% of native vegetation was lost during the early to mid-twentieth century in the Lower Rio Grande Valley [28]. From 1930 to 1983, Cameron County lost 91% of its native woodlands [29]. From 1983 to 2003, native woodlands in Cameron and Hidalgo counties remained unchanged despite increases in urbanization [27]. However, no region-wide assessment of woody cover has been conducted since the mid-1980s.
Conversion of natural land cover (e.g., native rangelands) to cropland and pasture has been linked to losses in genetic diversity and population decline for ocelots across their northern geographic range [9,17,21]. Rapid expansions of road networks are leading to increases in road-caused mortality of wildlife, especially felids in South Texas [21,30]. To help address these issues, conservation organizations, academic institutions, federal and state agencies, and private landowners often work together to identify drivers of habitat loss and to preserve habitat in certain areas where it will assist populations and increase gene flow [7,11,15,21].
Assessing land cover trends over the past 30 years will contribute to our understanding of the large-scale processes that have driven land cover change in the Rio Grande Delta and surrounding rangelands since the late 1980s. Long-term availability of LANDSAT imagery [27,31] combined with housing density projections [32] enables an estimate of past, present and future land cover change and future land cover change and their potential impact on felid populations in these areas. Our results will provide biologists and decision-makers with a baseline to develop landscape-level strategies to address habitat requirements for wild felids in Texas, as well as a wide variety of other species (e.g. raccoons, coyotes, and grey fox [Urocyon cinereoargenteus]). Therefore, the specific goals of this research are to:
1)
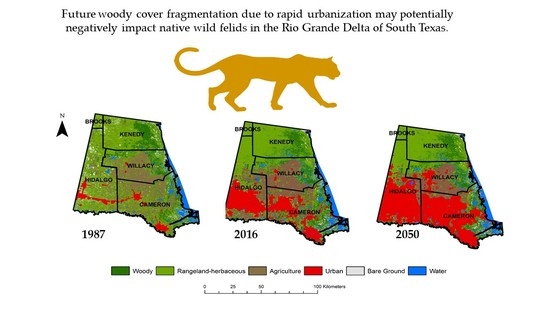
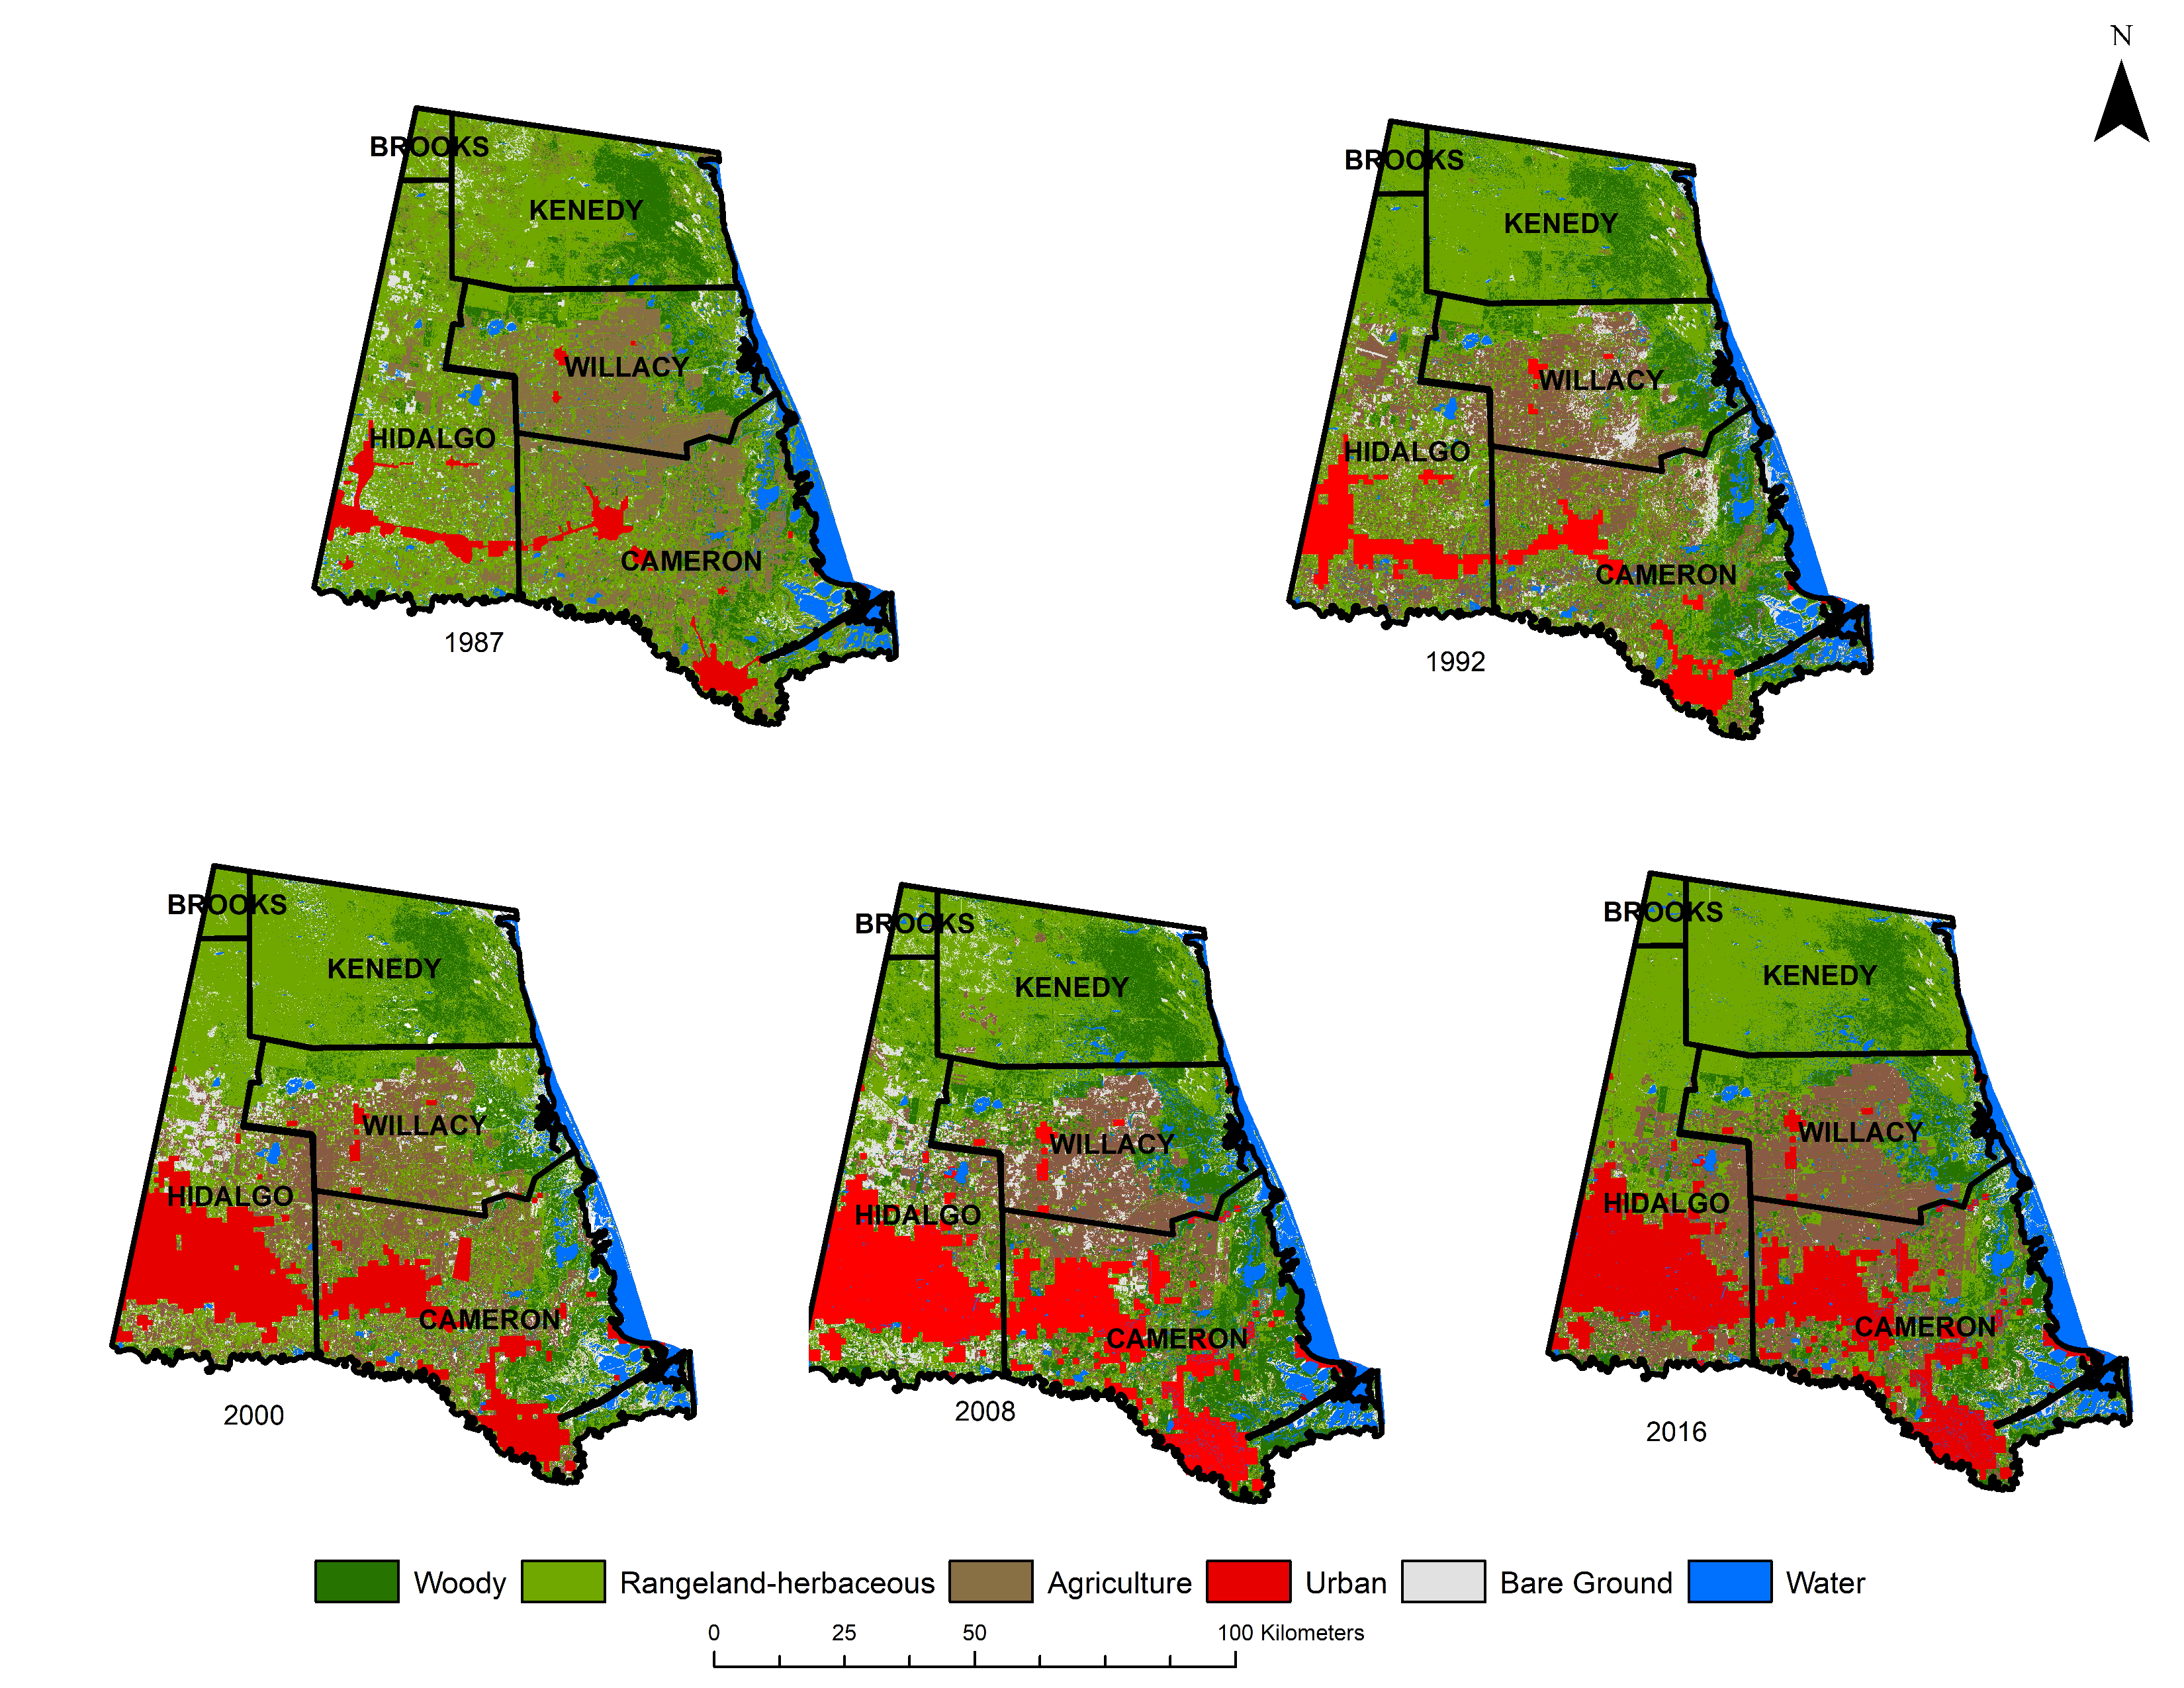
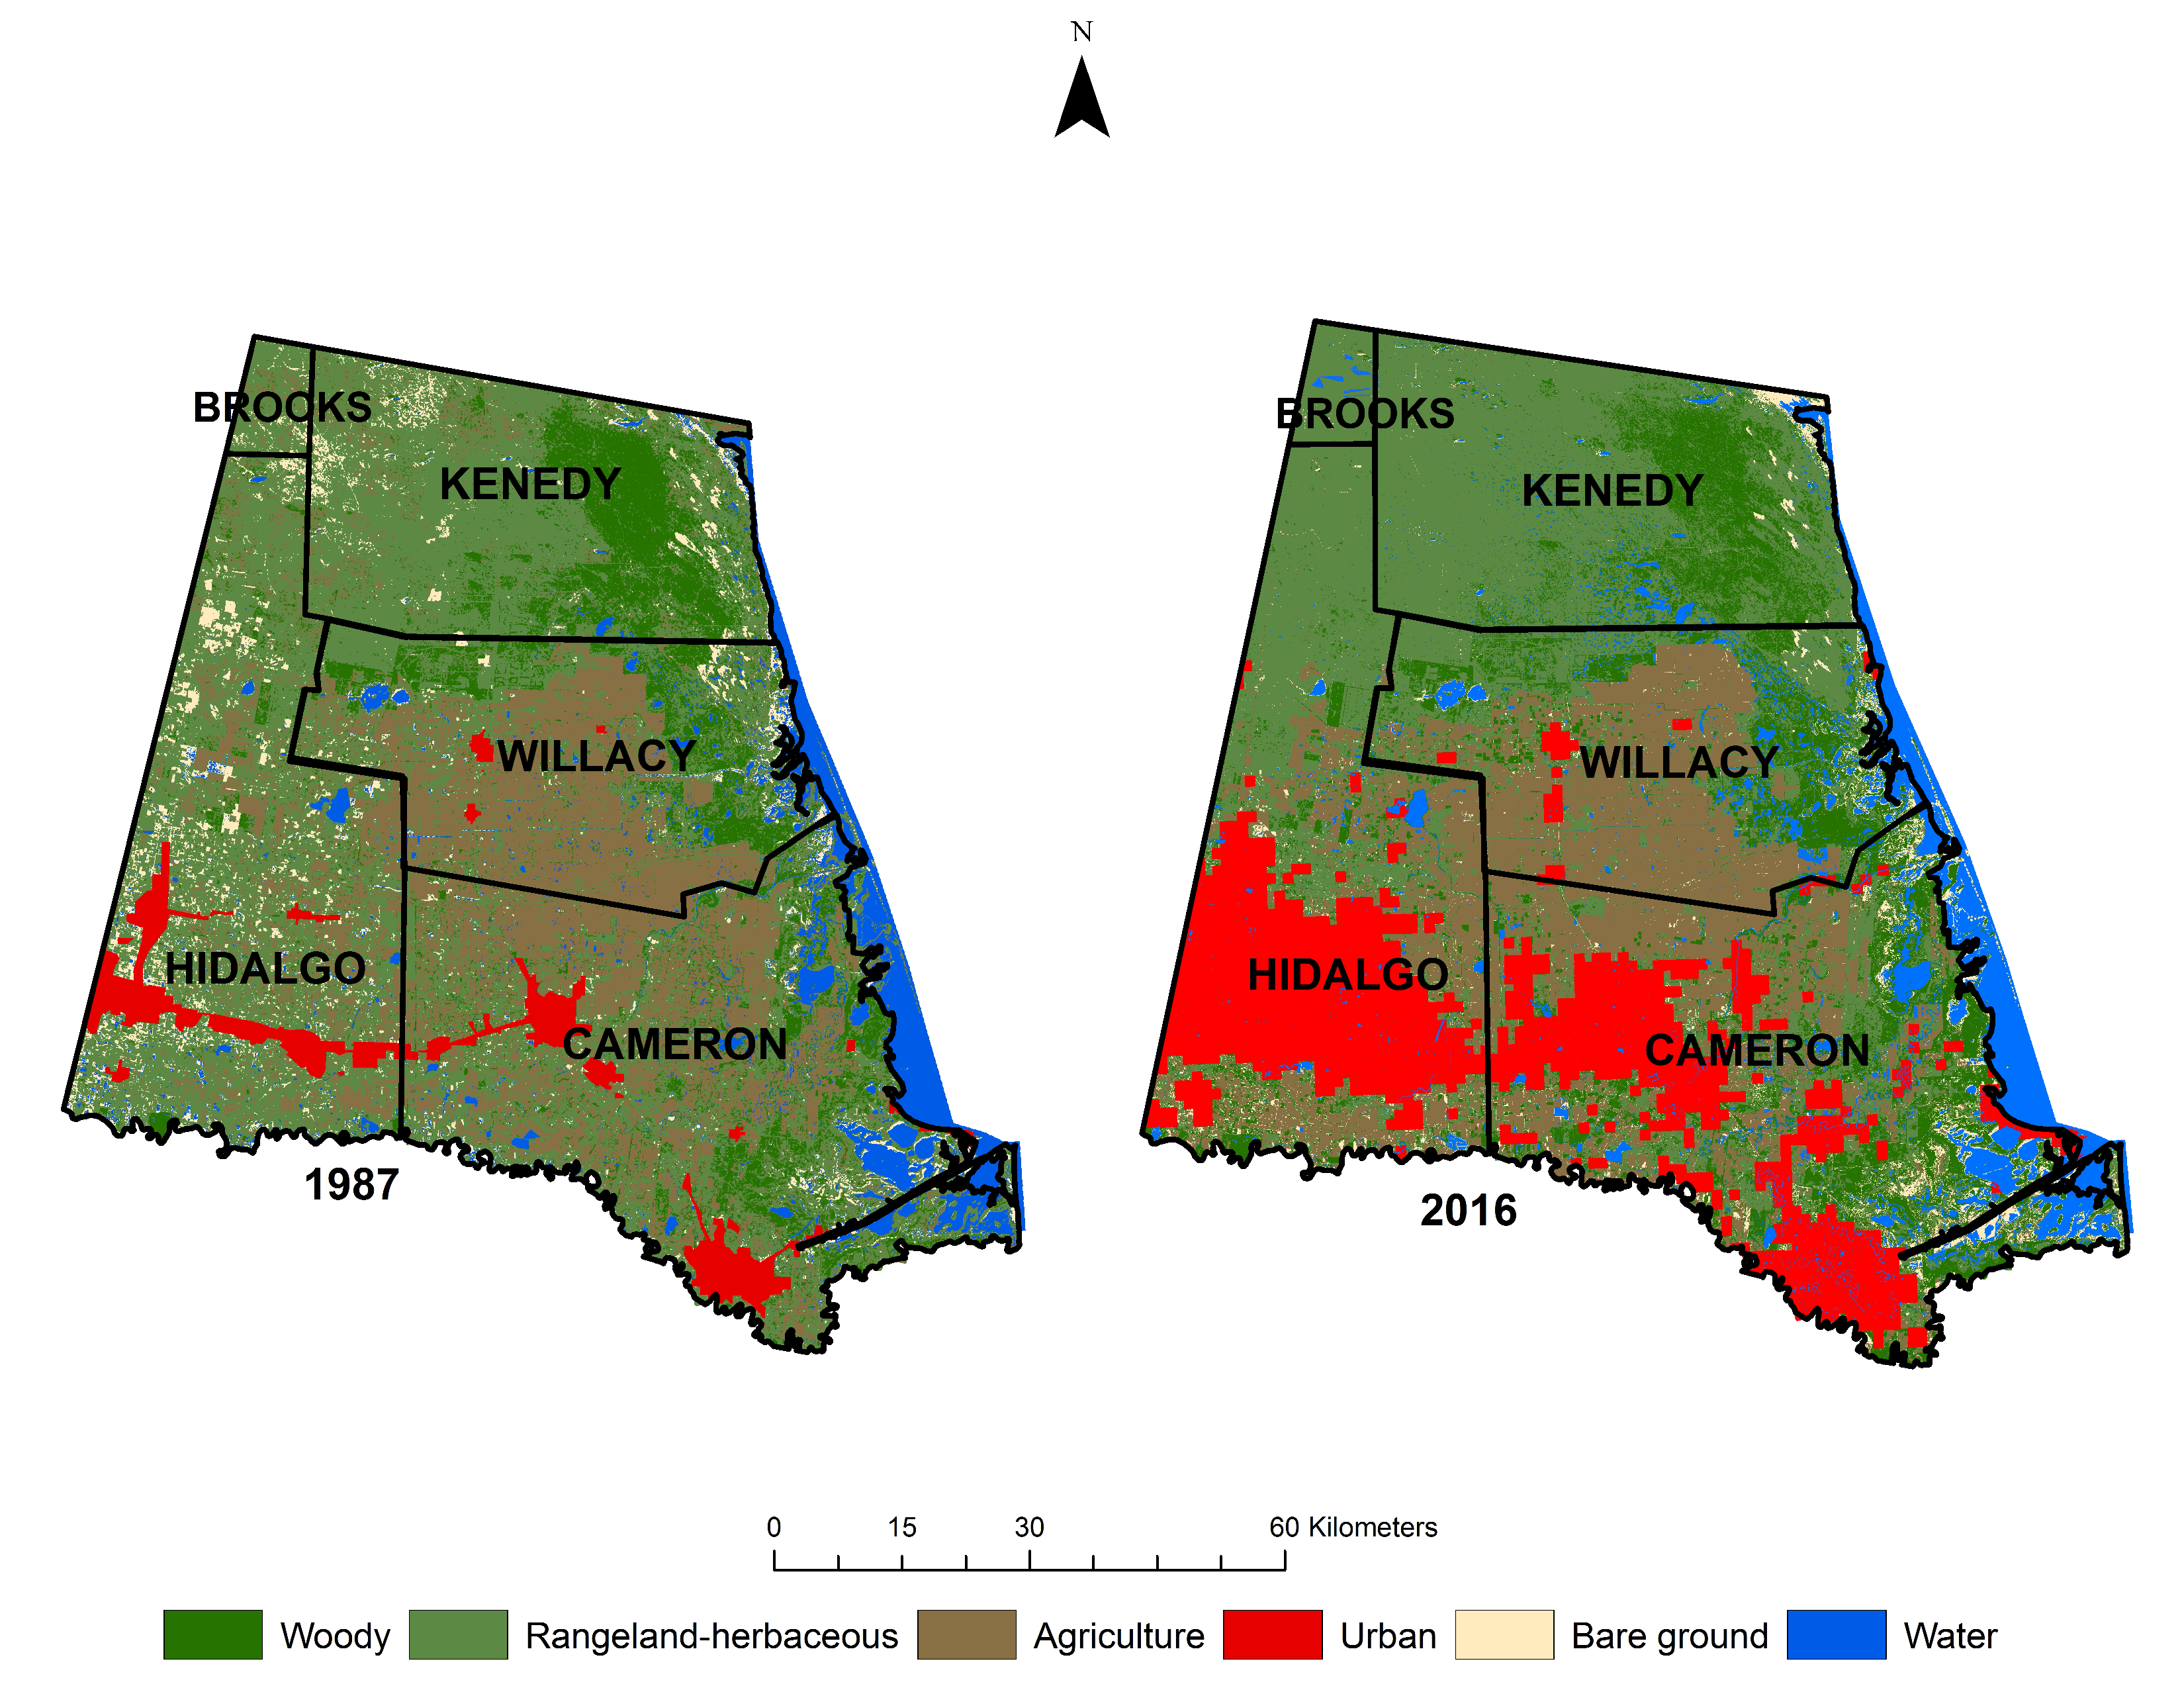
Perform a land use land cover analysis to assess the extent and change of woody cover in the Rio Grande Delta and surrounding rangelands of Texas from 1987 to 2016.
2)
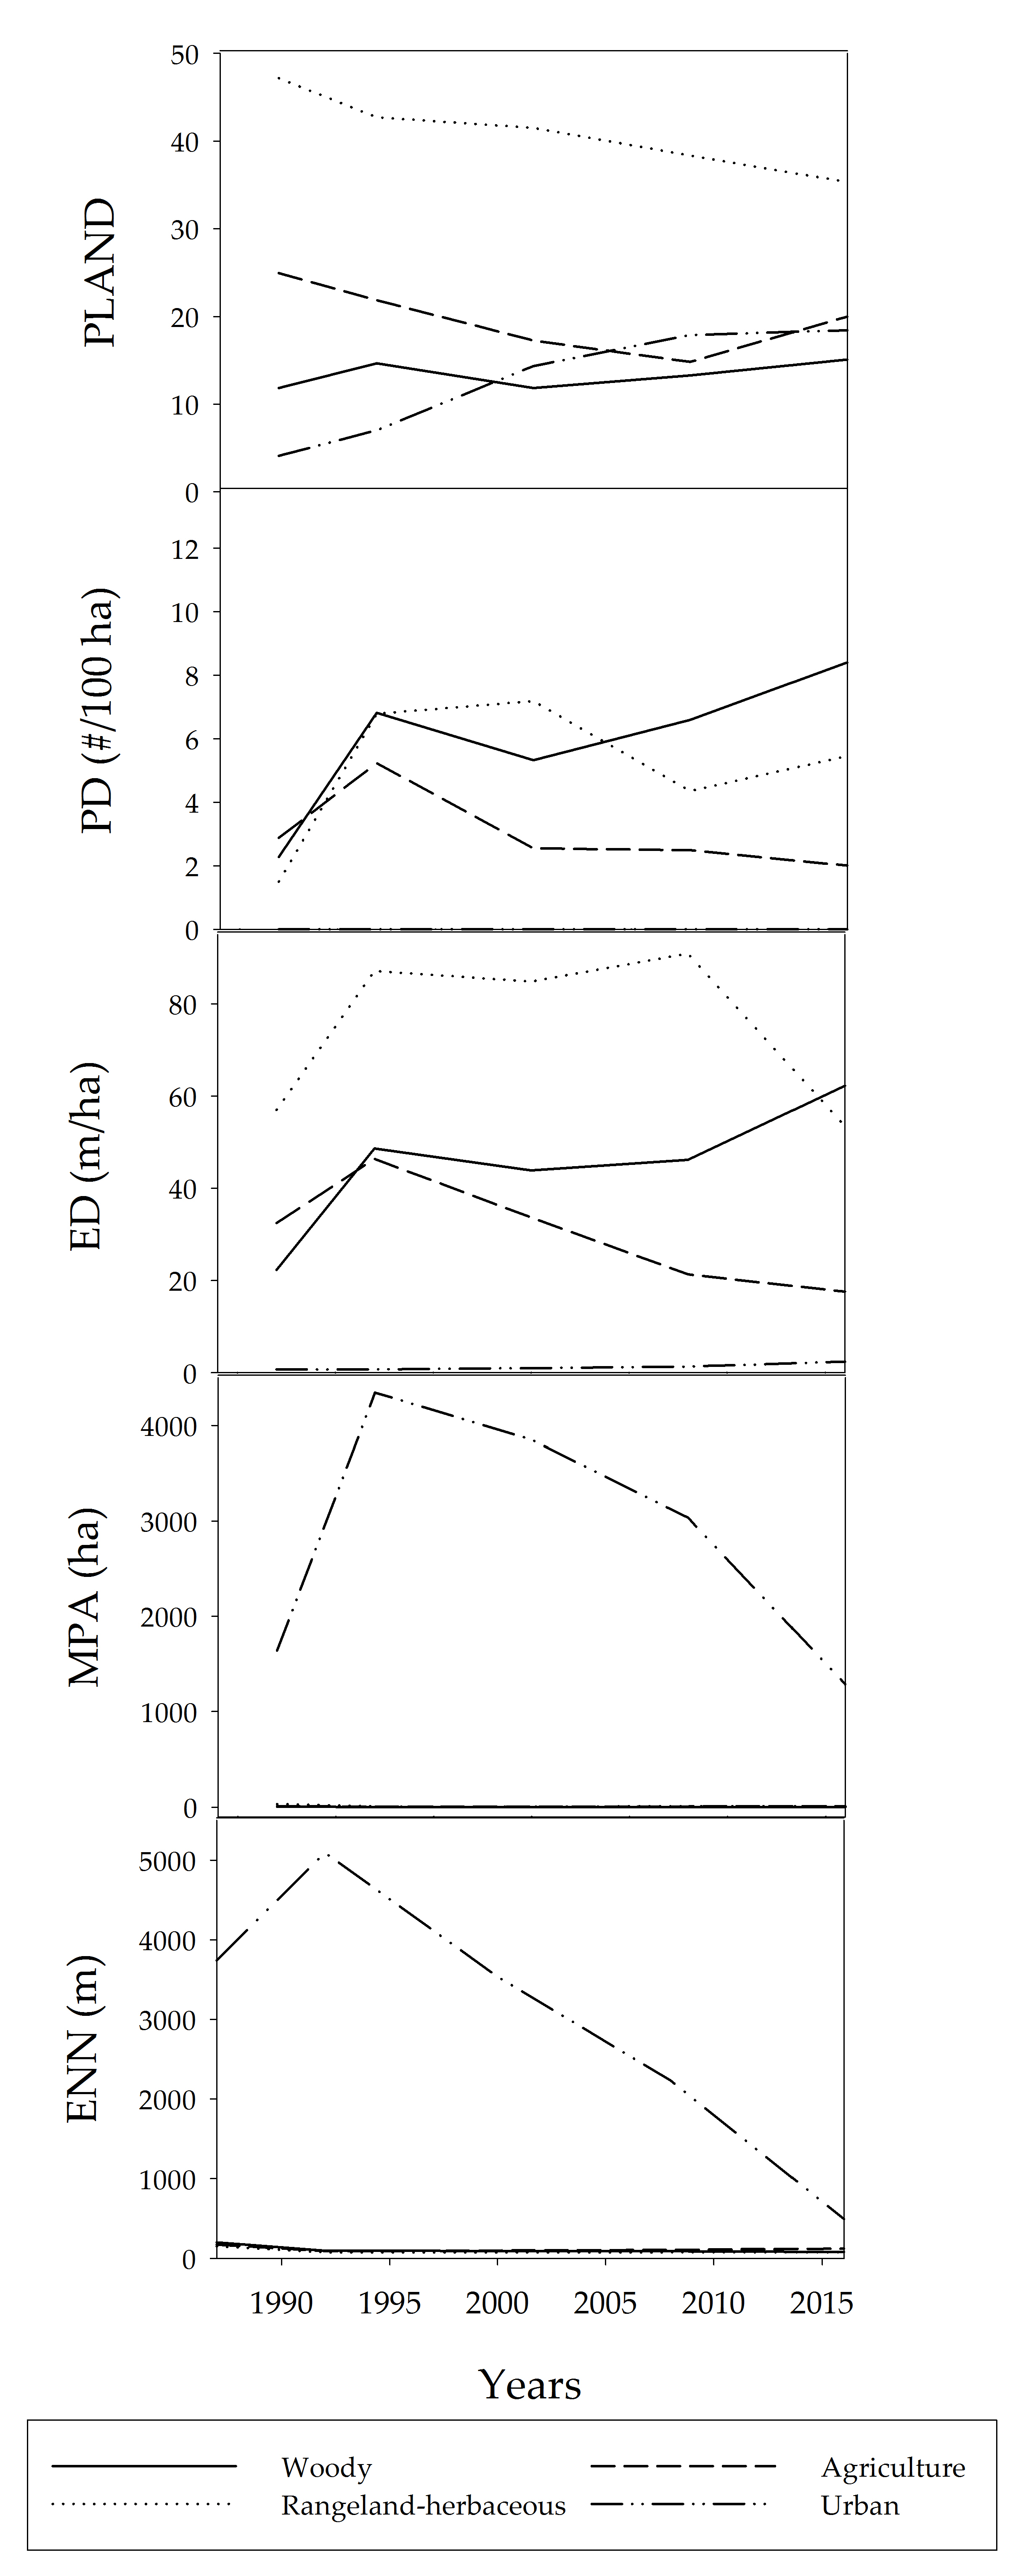
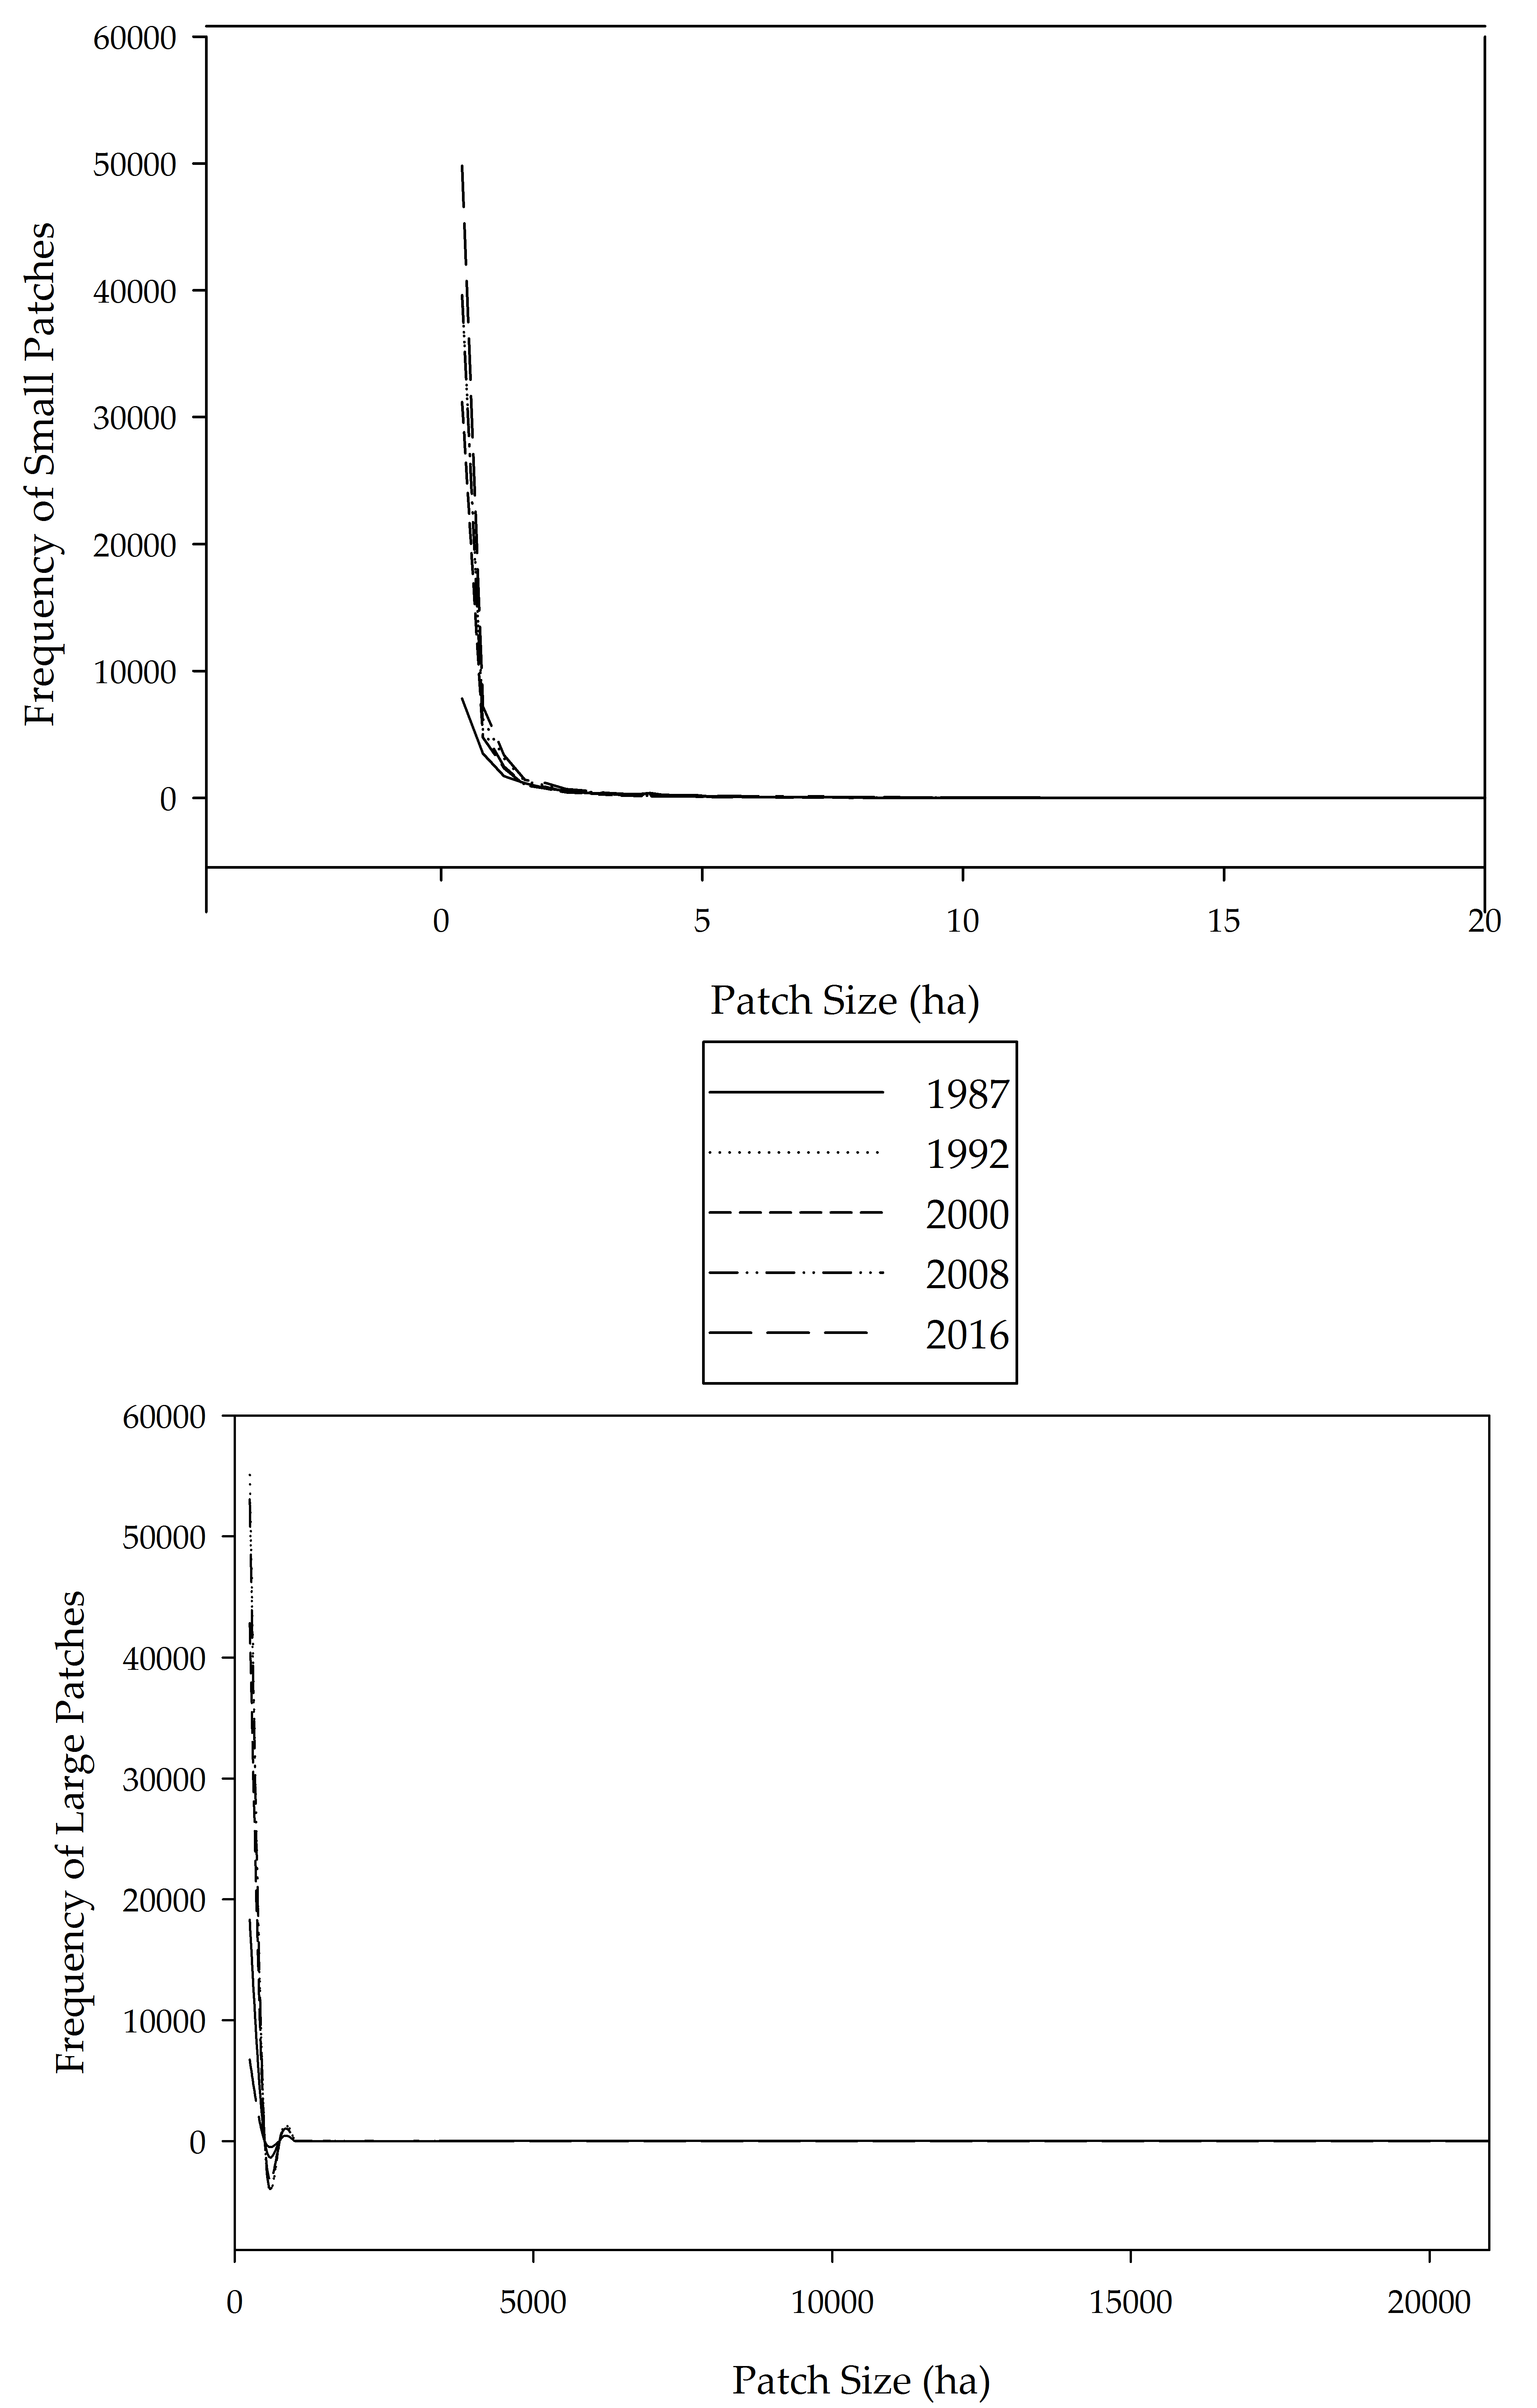
Quantify the spatial and temporal distribution of woody cover to determine the extent of potential fragmentation that has occurred since 1987.
3)
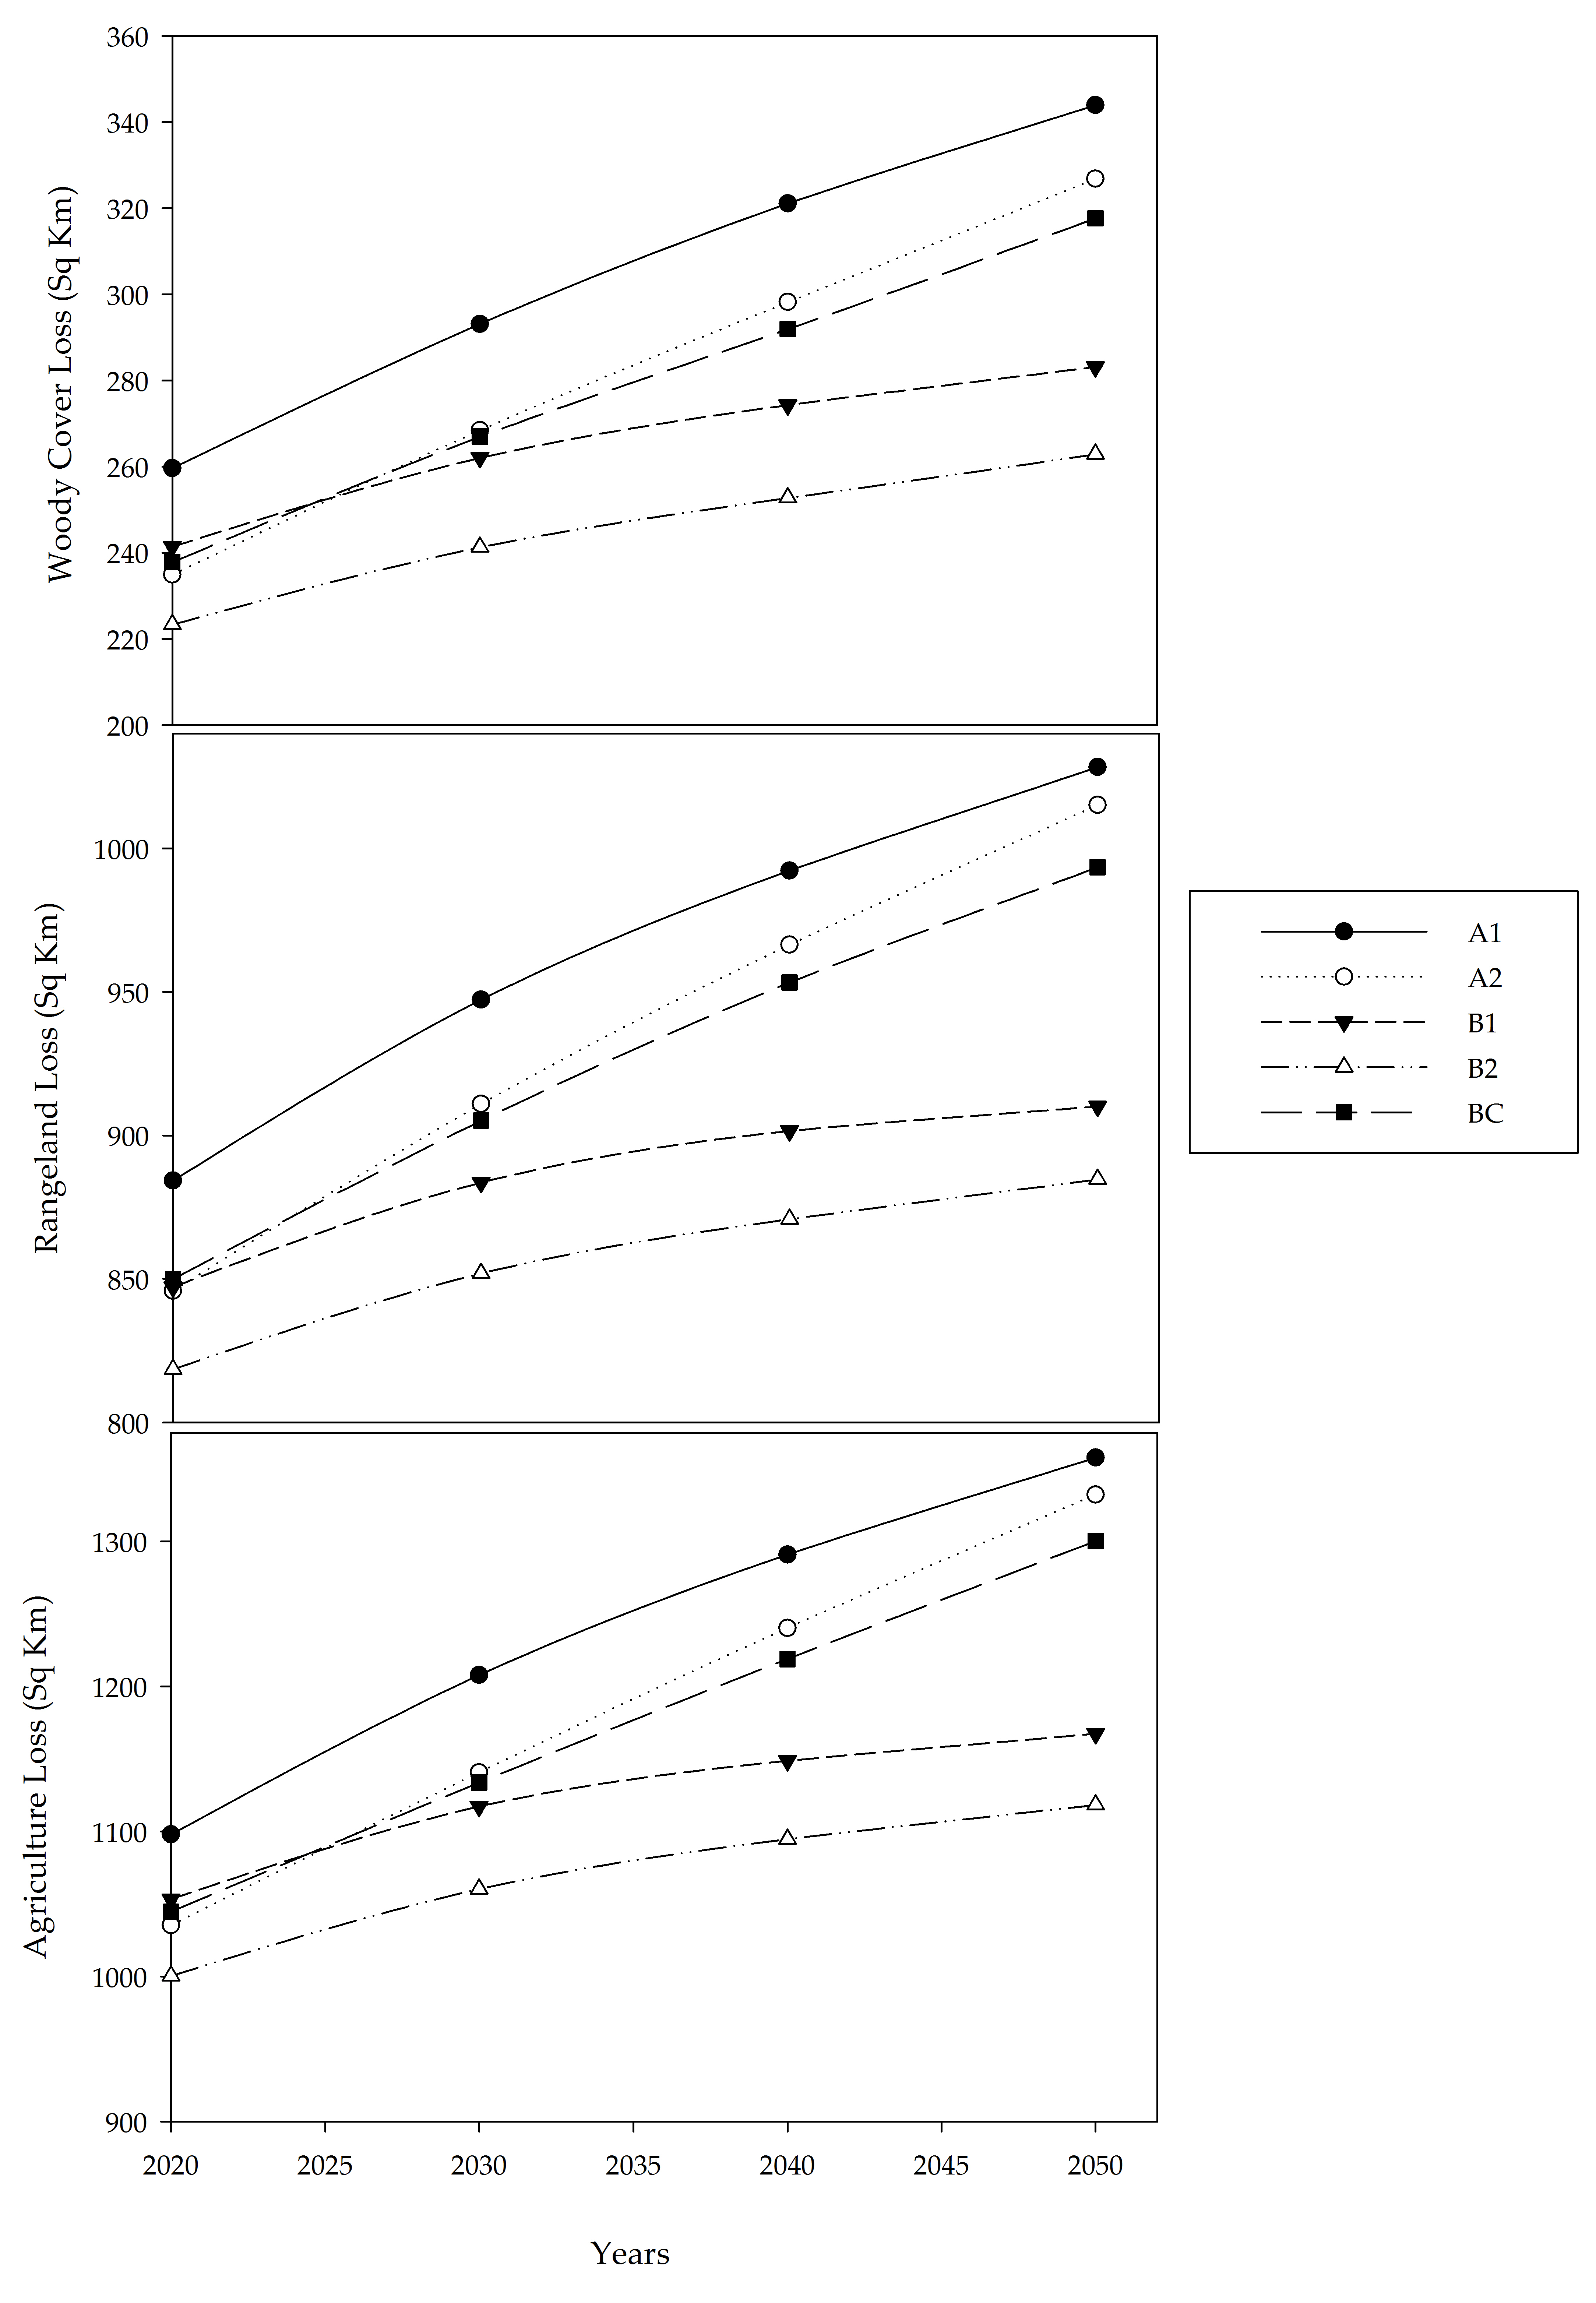
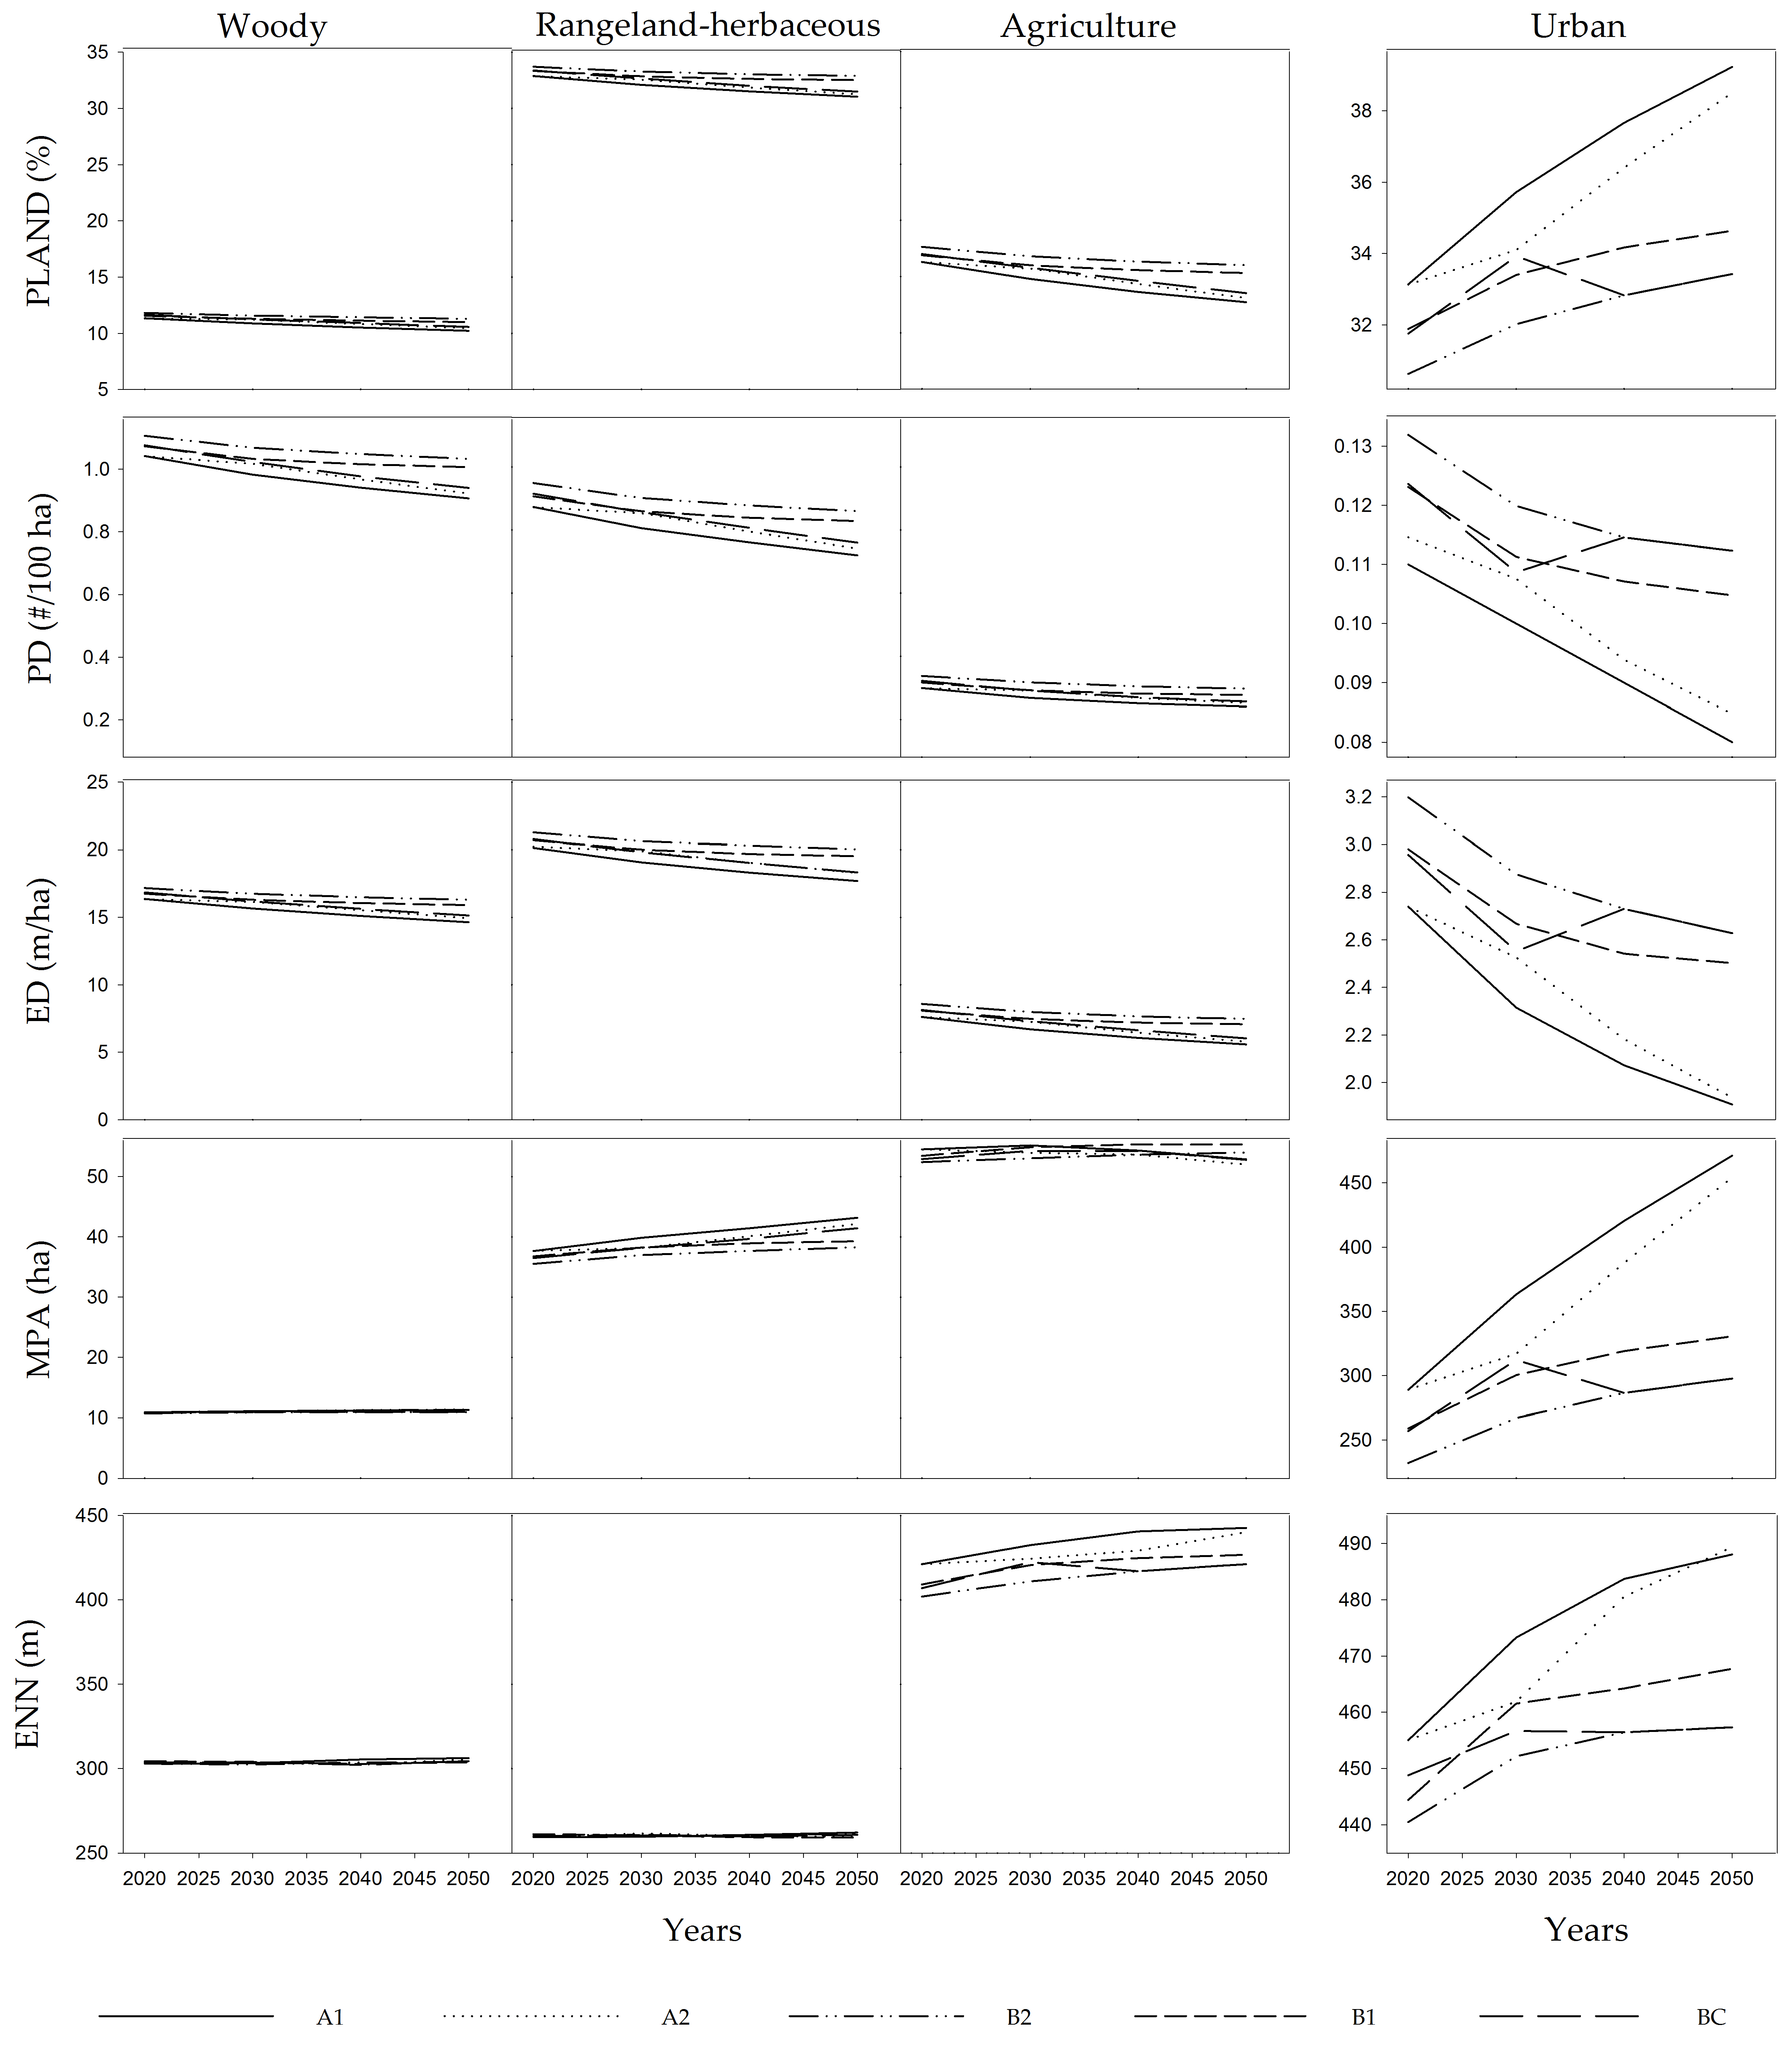
Predict future trends in land cover change from 2020 to 2050 based on housing density projection models and discuss its potential effects on native felid populations.

2. Materials and Methods

This study was focused in the Rio Grande Delta and surrounding rangelands of South Texas (i.e., southern Kenedy, Willacy, Cameron, southeastern Brooks, and eastern Hidalgo counties) (10,065 km2) (Figure 1). The major land cover types include low to high density urban development, urban green space (e.g., maintained parks and reserves), open water, barren land, pasture, crops, woody, and emergent herbaceous wetlands, thornshrub and live oak (Quercus virginiana) forests [33]. This region is located within the Laguna Madre Barrier Islands and Coastal Marshes, Coastal Sand Plain, and the Lower Rio Grande Valley ecoregion [34], which has a semi-arid subtropical climate (10 °C to 36 °C) [21]. The mean annual precipitation in eastern South Texas is 837 mm, with lesser amounts in the winter than the summer and greater amounts near the coast [35].
We classified urban and non-urban cover types in the Rio Grande Delta and surrounding rangelands for 1987, 1992, 2000, 2008, and 2016. Land cover types were classified using LANDSAT 5 satellite imagery for 1987, 1992, 2000, and 2008, and LANDSAT 8 satellite imagery for 2016 [22,27]. We downloaded one LANDSAT image during March and May of each year analyzed from the US Geological Survey Global Visualization Viewer. We selected this time of the year because the number of images with no cloud cover was the highest during this time period. We obtained U.S. Census Urban Area spatial data from the Texas Natural Resources Information System (TNRIS, Austin, TX) and then manually digitized urban areas in ArcGIS 10.5.1 to match the study area to account for differences in urban extent for each focal year (i.e., 1987, 1992, 2000, 2008, and 2016).
We conducted an unsupervised image classification in ERDAS IMAGINE (Hexagon Geospatial, Norcross, GA, USA) and classified the image into six categories: urban areas (residential, commercial, industrial areas and impervious surfaces); agricultural land (citrus, cotton, and other croplands); rangeland-herbaceous (rangelands, Texas Gulf Coast Prairie, grasslands and non-woody areas along the coast and within urbanized areas); woody cover (live oak forest, thornshrub, and forested wetlands); water (e.g., inland lagunas, streams, canals, reservoirs, estuaries, bays, tidal marshes, and the Laguna Madre); and barren lands (bare soil, beaches, inland sand dunes, mixed barren lands, oil fields, and exposed rocky areas) [36]. These categories were selected as they are relevant to wild felid studies in the region [20,22,37]. Further, ocelots and bobcats have been observed using woody communities next to coastal prairie, inland sand dunes, cropland, and urbanization [19,20,22,38]. An accuracy assessment was conducted in ArcMap 10.5.1 for each year analyzed based on 200 random points, where each image was considered satisfactory once accuracy reached 85% [22,36]. We first conducted an accuracy assessment with the 2016 image and verified it against knowledge of the landscape based on concurrent fieldwork in the region, high-resolution aerial imagery, and Google Maps following similar recently developed approaches [39,40]. Once we were able to identify the different categories in 2016, we used the same approach for the previous year and we used Google Earth, National Agriculture Imagery Program historical imagery to evaluate land cover in the study area. Once we obtained an accuracy >85% we classified the remaining imagery using 2016 as the reference image in terms of land cover types to identify land cover in previous years. We then ran the 200 random points for our accuracy assessment. We merged urban and non-urban rasters for each year analyzed into one mosaic image [36].
Land cover change analyses were conducted to determine the rate of change from 1987 to 2016 for urban areas, agricultural land, woody, and rangeland-herbaceous areas. We used the combine function in ArcMap 10.5.1 to examine trends and detect changes between each period and over 29 years. A new change map was generated to display the overall rate of change from 1987 to 2016 [41]. To assess changes in landscape structure, we conducted a spatial analysis in FRAGSTATS 4.2 and examined five class metrics: percentage of landscape (PLAND; %), patch density (PD; # patches/100 ha), edge density (ED; m/ha), mean patch area (MPA; ha) and Euclidean distance to nearest neighbor (ENN; m) for areas classified as woody, urban, rangeland-herbaceous and agriculture [7,22]. We also examined two patch metrics: patch size (PS, ha) and landscape shape index (SI) for woody cover for each year analyzed [7,42].
We tested whether the patch size and landscape shape index of woody areas were different between years by using a two-sample Kolmogorov–Smirnov Z test [42]. Following this, we compared means for each year to examine the mean patch size, standard error, and skewness and kurtosis for each yearly distribution. Skewness and kurtosis increased each year, thus, we ran a patch-level analysis and examined 98% of large and small patches. Frequency distributions were classified based on small patches (0.4–20 ha) and large patches (100–21,300 ha).
To examine future trends in the land cover change in the study area, we used five housing density scenarios, including one baseline [32]. Housing density scenarios were chosen because they integrate bi-national immigration/emigration, economic, population growth and environmental factors for each scenario, all which influence land cover change differently [32]. Scenarios used for this study include rapid economic development, slow population growth and high global integration (A1), slower rate of economic growth with reduced flow of people across international border regions (A2), globally-integrated world similar to A1 but greater emphasis on environmentally sustainable economic growth (B1), regionally-orientated world of moderate population growth and local solutions to environmental and economic problems (B2), and baseline (BC) [32]. Commercial and industrial development and low-high density housing types were merged into one urban cover type (32). Housing density scenarios were developed by Bierwagan et al. [43] based on a pair of axes: economic and environmental development and globalization vs. regionalization. Each scenario used a spatially explicit regional growth model, which estimated the quantity of additional residential units needed in each county to meet the demand specified by the growth model’s population projections, which were based on a ratio of residences to census block populations. This dynamic growth model accounts for changes in demographic characteristics based on different scenarios and spatially allocated housing units compared to the county-level historic growth patterns, the spatial pattern of land ownership and travel time [43]. We merged these scenarios with 2016 classified imagery to quantify changes in landscape structure (PLAND, PD, ED, MPA, and ENN) for woody, rangeland-herbaceous, agriculture and urban land cover types every 10 years from 2020 to 2050. With these combined layers, we were able to quantify the amount of land cover lost for each land cover type between 2020 and 2050 in 10-year intervals.

3. Results

The mean land cover composition change was 36% for every 8-year period and 52% of the region remained unchanged from 1987 to 2016 (Figure 2). The largest impact on woody cover was rangeland-herbaceous conversion. From 1987 to 2000, urbanization had the greatest impact on rangeland-herbaceous (30.8% change) and woody cover (4.1%). From 2000 to 2008, the greatest factor for woody cover loss and fragmentation was rangeland-herbaceous conversion (42.3%) and agricultural conversion (4.9%). From 2008 to 2016, the largest change detected was the agricultural conversion of rangeland-herbaceous areas and subsequent rangeland-herbaceous conversion of woody areas.
From 1987 to 2016, woody cover increased from 1187 km2 (11.9%) to 1519 km2 (15.1%). Rangeland-herbaceous decreased from 4831 km2 (48%) to 3563 km2 (35.4%), agricultural area decreased from 2415 km2 (24.9%) to 2013 km2 (20.0%) and urban land cover increased from 493 km2 (4.1%) to 1851 km2 (18.4%). For woody cover types, ED and PD increased across the study area and ENN decreased from 201.7 m (SD = 142.2 m) to 82.0 (SD = 55.2 m) (Figure 3). Urban land cover increased by 14.3%, but woody cover mean patch area decreased by 30.4% (Figure 3). Upon closer inspection, woody cover patch size decreased from 5.18 to 2.29 ha and shape index values decreased from 1.21 to 1.13 ha (Table 1). Woody cover structure was significantly different amongst years (Table 2). Distribution of small woody cover patches (< 1 ha) increased from 7818 to 39,506 patches from 1987 to 1992, and to 59,335 patches in 2016 (Figure 4). From 1987 to 2008, 99.9% of large patches were <100 ha and this increased to 100% by 2016 (Figure 3).
Of the five economic scenarios driving housing density, scenario A1 would have the greatest impact on woody cover habitat fragmentation and thus wild felid habitat in the Rio Grande Delta and surrounding rangeland (Figure 5 and Figure 6) In this scenario, urban PLAND is projected to increase by 6.1% from 2020 to 2050, which represents a 300% increase over the baseline scenario (Figure 6). In the A1 scenario, agriculture will produce the greatest change in PLAND, and all cover types will decline, except for urban areas. Patch and edge density of all other cover types in A1 will decrease, while MPA and ENN will increase with the greatest changes observed in urban land cover (Figure 6). The largest remaining patches of woody cover will be found on private lands in Kenedy and Willacy counties in scenarios A1, A2, B1, and B2, with smaller patches located in state parks, national wildlife refuges, and conservation tracts (Figure 7). However, scenario B2 is the least destructive scenario for landscape fragmentation and wild felid habitat in the Rio Grande Delta and surrounding rangelands (Figure 6).

4. Discussion

Recent changes that have occurred in the Rio Grande Delta and surrounding rangelands suggest that natural vegetation land cover in the US-Mexico border area may be lost for good and may limit wildlife species that depend on them for habitat in these areas. Urban development has increased from 4.1% to 18.4% between 1987 and 2016 and by 2050 is projected to increase between 33.4% and 39.2%. This sharp increase in urban cover types over the next 30 years, will undo recent gains in woody cover that have occurred in small patches. The extent and distribution of woody cover in areas along the border are projected to continue to degrade and will likely become highly fragmented, with a few small exceptions, primarily due to urbanization and the impending United States-Mexico border fence, as well as from agriculture or rangeland-herbaceous conversion. Many of the public- and privately-owned natural areas along the border will likely be enclosed by urban development over the next 30 years.
Since 1987, woody cover has increased but agriculture conversion spurred by rapid urbanization along the United States-Mexico border has led to changes in woody cover landscape structure, particularly near urban areas in the southeastern portion of the Rio Grande Delta. We observed minor changes in landscape structure in the rangelands in the northern half as compared to the southern half of the study area. Natural revegetation and habitat restoration efforts from 1987 to 2016 may have contributed to sharp increases in small patches of woody cover since 1987, however, large patches (>100 ha) of woody cover with embedded patches of dense woody cover that are preferred by ocelots are now absent, which corroborates previous findings [10,22,44].
Woody cover in the northeastern part of the study area retains the largest remaining patches of woody cover (e.g., thornshrub and live oak forests) in the region. However, the lack of patches >100 ha indicates the need to increase the spatial distribution of woody cover in the region as this area is estimated to hold 80% of the current breeding population of ocelots in the United States. Increasing landscape connectivity and the size of large woody patches is critical for felid populations [7,15,16,38,44]. Loss of large patches of natural habitat and reduced connectivity among preferred habitat patches have deleterious effects on felid populations in North and South America [12,13,45,46]. Incentives for ocelot conservation and recovery should be applied to increasing large patches of woody cover that may also support bobcats, mountain lions and other species such as gray fox, and coyotes that rely on large undisturbed habitat tracts [8,15,45,46,47]. Further, these results and scenarios may be used as the baseline to support the formulation of effective conservation strategies for continued woody cover restoration for ocelots and other endangered species in the region.
We hypothesize that the Rio Grande Delta near the United States-Mexico border lacks adequate woody cover with embedded patches of preferred ocelot habitat [19] to support or enhance population viability [10,27,30] over the next 30 years. Our results indicate that gains in small patches of woody cover are potentially a result of woody plant encroachment, probably due to browsing/grazing regimes, fire, climate, or habitat restoration in the region [48]. Even if current trends continue, these gains will not be enough to offset the projected losses in woody cover due to expanding urbanization.
Losses in woody cover and embedded dense woody communities due to expanding urban development observed in the southern portions of the study area may have provided conditions for a precipitous decline in ocelots, as reported in earlier studies [9,10,27,49]. Janecka et al. [9] reported that the isolation of preferred habitat and fragmentation of surrounding woody patches has led to genetic divergence among ocelots in Texas and northeastern Mexico and a statistically significant difference in the genetic structure and diversity between the two ocelot populations found in the eastern part of the study area. To date, there are not been a single successful dispersal event between the two U.S. ocelot populations and at the current pace, urban expansion around the last remnant woody patches in the southeastern half of our study area may further reduce the likelihood of successful dispersal in the future [50]. Furthermore, bobcats occurring along the Rio Grande River have already exhibited genetic divergence compared to bobcats occurring in the northern half of the study area, likely due to reduced connectivity among habitat patches. These negative effects are likely to increase, as bobcats are sensitive to roads, elevated levels of human development, and require large patches of natural cover and riparian corridors for movement and dispersal [8,23,44,45,51]. Habitat loss and fragmentation, whether related to expanding urban areas and road networks or woody and rangeland-herbaceous conversion to agriculture, will continue to form barriers to the dispersal and gene flow of wild felids [10,17,52].
Increases in human population, denser road networks, and related traffic volumes also will contribute to road mortality for ocelots and bobcats [21,37,38,51]. Despite reaching high densities adjacent to urban areas, bobcats require large patches of natural habitat [8,12,23,45] and will often select against areas with roads within their home range [45,46,47]. Vehicle collisions in fragmented areas are an important cause of bobcat [45,52] and ocelot [30] mortality.
Five scenarios incorporating housing density projections from 2020 to 2050 combined with 2016 land cover classification predict increased habitat loss and fragmentation for wild felids over the same period. This study predicts that urban areas will replace agriculture as the dominant land cover type by 2050. Scenarios A1, A2, B1, and B2 predict that urban coverage in the study area (e.g., cities of Brownsville, Harlingen-San Benito, McAllen, Edinburg and the proximate communities) will merge into one extensive urbanized area. If combined with adjacent cities in the Mexican state of Tamaulipas, this urban expansion would create one of the largest metropolitan areas in North America [21]. Each scenario forecasts loss and fragmentation of woody cover, particularly in the southern half of the study area but unlike the change observed since 1987, the future driver of change will primarily be urbanization. Conversely, remaining large patches of woody cover within the northeastern rangelands of the study area are projected to remain intact, thus potentially providing a suitable condition for wild felid habitat, and partly counteracting/offsetting the effects of urban development and future woody cover loss.
Protection and creation of wildlife corridors have been occurring in the study area [21], providing corridors south towards the Rio Grande River. However, these will probably not benefit ocelot populations, as woody patches near the border are highly isolated by cropland and urbanization, which has prevented dispersal events despite two ocelots being documented along the Rio Grande River during the last 35 years [10,50]. Notably, the closest known Mexican ocelot population is in the Sierra Tamaulipas National Protected Area [53], which is more than 190 km south of the United States-Mexico border. As urbanization increases in the Rio Grande Delta, these corridors will likely become intermittent islands amongst a matrix of roads and development. Some corridors that are not isolated and maintain some conservation value may benefit from habitat restoration of areas once cleared for agriculture and rangeland to help increase connectivity and woody patch size. Additionally, we hypothesize that corridors located near urban areas may increase exposure to rodenticides [54] and will potentially increase the rate of infectious diseases from domestic animals to felids [55,56]. However, without access to large source habitats on each end of the corridors, these long linear vegetation communities may also serve as ecological traps or habitat sinks for ocelots, bobcats, and other mammals, thus increasing mortality [15]. Ecological traps and habitat sinks should be identified within the interior of the Rio Grande Delta and near the border with the Mexican state of Tamaulipas, which has also experienced intensive urbanization and agricultural conversion potentially exceeding what we observed in this study in the United States [17,21,57]. Therefore, highly urbanized areas on each side of the border are not suitable for sensitive or wide-ranging predators but may be used by generalist species such as raccoons and coyotes [8,17].

5. Conclusions

The Rio Grande Delta in South Texas is one of the fastest-growing urban areas. Humans have altered ecosystems in the region since the late 1800s, with rangeland conversion, agriculture, and recently, urban sprawl. Our study shows that habitat for wild felids, particularly ocelots and mountain lions, is no longer available along the United States-Mexico border within our study area. While habitat may be available in the northern rangelands surrounding the Rio Grande Delta, large tracts of habitat will be required to maintain the two viable ocelot populations in the US. Our results corroborate previous research and suggest that patch-level analyses used with class-level landscape metrics can be a powerful tool in understanding the underlying processes of land cover change, particularly with the urbanizing of wildlands.

Author Contributions

Conceptualization, J.V.L., H.L.P.-B., and M.E.T.; methodology, J.V.L., H.L.P.-B.; formal analysis, J.V.L.; investigation, J.V.L.; resources, J.V.L., H.L.P.-B.; data curation, J.V.L.; writing—original draft preparation, J.V.L.; writing—review and editing, J.V.L., H.L.P.-B., and M.E.T., supervision, M.E.T., and H.L.P.-B.; project administration, J.V.L., H.L.P.-B., and M.E.T. All authors have read and agreed to the published version of the manuscript.

Funding

This research received no external funding.

Acknowledgments

We thank the Caesar Kleberg Wildlife Research Institute, Texas A&M University–Kingsville for logistical support and J.M. Mata for providing technical support over the course of this project. The Betty and George Coates Endowed Fellowship in Habitat Research, P.M. Plant, the South Texas Quail Coalition, Houston Safari Club, B.F. Vaughn III, Tim and Karen Hixon Foundation, and R. Barrientos provided financial support to J.V.L. for this research. This manuscript was greatly improved from comments by A.M. Foley, L.A. Brennan, L.I. Grassman, and anonymous reviewers. This manuscript is #18-114 of the Caesar Kleberg Wildlife Research Institute.

Conflicts of Interest

The authors declare no conflict of interest.

References

  1. Sanderson, E.W.; Jaiteh, M.; Levy, M.A.; Redford, K.H.; Wannebo, A.V.; Woolmer, G. The human footprint and the last of the wild: The human footprint is a global map of human influence on the land surface, which suggests that human beings are stewards of nature, whether we like it or not. BioScience 2002, 52, 891–904. [Google Scholar] [CrossRef]
  2. McKinney, M.L. Effects of urbanization on species richness: A review of plants and animals. Urban Ecosyst. 2008, 11, 161–176. [Google Scholar] [CrossRef]
  3. Foley, J.A.; DeFries, R.; Asner, G.P.; Barford, C.; Bonan, G.; Carpenter, S.R.; Chapin, F.S.; Coe, M.T.; Daily, G.C.; Gibbs, H.K.; et al. Global consequences of land use. Science 2005, 309, 570–574. [Google Scholar] [CrossRef] [PubMed] [Green Version]
  4. Seto, K.C.; Fragkias, M.; Güneralp, B.; Reilly, M.K. A meta-analysis of global urban land expansion. PLoS ONE 2011, 6. [Google Scholar] [CrossRef] [PubMed]
  5. Gehrt, S.D. The urban ecosystem. In Urban Carnivores; Gehrt, S.D., Riley, S.P.D., Cypher, B.L., Eds.; The John Hopkins University Press: Baltimore, MD, USA, 2010; pp. 1–12. [Google Scholar]
  6. United Nations. World Urbanization Prospects: The 2014 Revision Highlights. United Nations Department of Economic and Social Affairs; Population Division: New York, NY, USA, 2014. [Google Scholar]
  7. Zemanova, M.A.; Perotto-Baldivieso, H.L.; Dickins, E.L.; Gill, A.B.; Leonard, J.P.; Wester, D.B. Impact of deforestation on habitat connectivity thresholds for large carnivores in tropical forests. Ecol. Process 2017. [Google Scholar] [CrossRef] [Green Version]
  8. Lombardi, J.V.; Comer, C.E.; Scognamillo, D.G.; Conway, W.C. Coyote, fox, and bobcat response to anthropogenic and natural landscape features in a small urban area. Urban Ecosyst. 2017, 20, 1239–1248. [Google Scholar] [CrossRef]
  9. Janečka, J.E.; Tewes, M.E.; Laack, L.L.; Caso, A.; Grassman, L.I., Jr.; Haines, A.M.; Shindle, D.M.; Davis, B.W.; Murphy, W.J.; Honeycutt, R.L. Reduced genetic diversity and isolation of remnant ocelot populations occupying a severely fragmented landscape in southern Texas. Anim. Conserv. 2011, 14, 608–619. [Google Scholar] [CrossRef]
  10. Janečka, J.E.; Tewes, M.E.; Davis, I.A.; Haines, A.M.; Caso, A.; Blankenship, T.L.; Honeycutt, R.L. Genetic differences in the response to landscape fragmentation by a habitat generalist, the bobcat, and a habitat specialist, the ocelot. Conserv. Genet. 2016, 17, 1093–1108. [Google Scholar] [CrossRef]
  11. Squires, J.R.; DeCesare, N.J.; Olson, L.E.; Kolbe, J.A.; Hebblewhite, M.; Parks, S.A. Combining resource selection and movement behavior to predict corridors for Canada lynx at their southern range periphery. Biol. Conserv. 2013, 157, 187–195. [Google Scholar] [CrossRef]
  12. Crooks, K.R. Relative sensitivities of mammalian carnivores to habitat fragmentation. Conserv. Biol. 2002, 16, 488–502. [Google Scholar] [CrossRef]
  13. Beier, P.; Riley, S.P.D.; Sauvajot, R.M. Mountain lions (Puma concolor). In Urban Carnivores; Gehrt, S.D., Riley, S.P.D., Cypher, B.L., Eds.; The John Hopkins University Press: Baltimore, MD, USA, 2010; pp. 141–156. [Google Scholar]
  14. Olsoy, P.J.; Zeller, K.A.; Hicke, J.A.; Quigley, H.B.; Rabinowitz, A.R.; Thornton, D.H. Quantifying the effects of deforestation and fragmentation on a range-wide conservation plan for jaguars. Biol. Conserv. 2016, 203, 8–16. [Google Scholar] [CrossRef]
  15. Riley, S.P.D.; Serieys, L.E.; Pollinger, J.P.; Sikich, J.A.; Dalbeck, L.; Wayne, R.K.; Ernest, H.B. Individual behaviors dominate the dynamics of an urban mountain lion population isolated by roads. Curr. Biol. 2014, 24, 1989–1994. [Google Scholar] [CrossRef] [PubMed] [Green Version]
  16. Ernest, H.B.; Vickers, T.W.; Morrison, S.A.; Buchalski, M.R.; Boyce, W.M. Fractured genetic connectivity threatens a southern California puma (Puma concolor) population. PLoS ONE 2014, 9. [Google Scholar] [CrossRef] [PubMed] [Green Version]
  17. Mora, F. Nation-wide indicators of ecological integrity in Mexico: The status of mammalian apex-predators and their habitat. Ecol. Indic. 2017, 82, 94–105. [Google Scholar] [CrossRef]
  18. Schmidly, D.J.; Bradley, R.D. The Mammals of Texas, 7th ed.; University of Texas Press: Austin, TX, USA, 2016. [Google Scholar]
  19. Horne, J.S.; Haines, A.M.; Tewes, M.E.; Laack, L.L. Habitat partitioning by sympatric ocelots and bobcats: Implications for recovery of ocelots in southern Texas. Southwest Nat. 2009, 54, 119–126. [Google Scholar] [CrossRef]
  20. Hernandez-Santin, L.; Harveson, P.M.; Harveson, L.A. Suitable habitats for cougars (Puma concolor) in Texas and Northern Mexico. Southwest Nat. 2012, 57, 314–319. [Google Scholar] [CrossRef]
  21. Leslie, D.M., Jr. An International Borderland of Concern: Conservation of Biodiversity in the Lower Rio Grande Valley (No. 2016-5078); US Geological Survey: Reston, VA, USA, 2016.
  22. Jackson, V.L.; Laack, L.L.; Zimmerman, E.G. Landscape metrics associated with habitat use by ocelots in south Texas. J. Wildl. Manag. 2005, 69, 733–738. [Google Scholar] [CrossRef]
  23. Young, J.K.; Golla, J.M.; Broman, D.; Blakenship, T.; Heilbrun, R. Estimating density of an elusive carnivore in urban areas: Use of spatially explicit capture-recapture models for city-dwelling bobcats. Urban Ecosyst. 2019, 22, 507–512. [Google Scholar] [CrossRef]
  24. Hunter, L. Carnivores of the World, 2nd ed.; Princeton University Press: Princeton, NJ, USA, 2019. [Google Scholar]
  25. Huang, Y.; Fipps, G.; Lacey, R.E.; Thomson, S.J. Landsat satellite multi-spectral image classification of land cover and land use changes for GIS-based urbanization analysis in irrigation districts of Lower Rio Grande Valley of Texas. Appl. Remote Sens. J. 2011, 2, 27–36. [Google Scholar]
  26. Brown, D.J.; Schultz, A.D.; Dixon, J.R.; Dickerson, B.E.; Forstner, M.R. Decline of red-eared sliders (Trachemys scripta elegans) and Texas spiny softshells (Apalone spinifera emoryi) in the Lower Rio Grande Valley of Texas. Chelonian Conserv. Biol. 2012, 11, 138–143. [Google Scholar] [CrossRef]
  27. Haines, A.M.; Leu, M.; Svancara, L.K.; Scott, J.M.; Reese, K.P. A theoretical approach to using human footprint data to assess landscape level conservation efforts. Conserv. Lett. 2008, 1, 165–172. [Google Scholar] [CrossRef]
  28. Collins, K. Status and Management of Native South Texas Brushlands; U.S. Department of the Interior, U.S. Fish and Wildlife Service, Ecological Service Office: Corpus Christi, TX, USA, 1984. [Google Scholar]
  29. Tremblay, T.A.; White, W.A.; Raney, J.A. Native woodland loss during the mid-1900s in Cameron County, Texas. Southwest Nat. 2005, 50, 479–482. [Google Scholar] [CrossRef]
  30. Haines, A.M.; Tewes, M.E.; Laack, L.L.; Grant, W.E.; Young, J.H. Evaluating recovery strategies for an ocelot (Leopardus pardalis) population in the United States. Biol. Conserv. 2005, 126, 512–522. [Google Scholar] [CrossRef]
  31. Wulder, M.A.; White, J.C.; Goward, S.N.; Masek, J.G.; Irons, J.R.; Herold, M.; Cohen, W.B.; Loveland, T.R.; Woodcock, C.E. Landsat continuity: Issues and opportunities for land cover monitoring. Remote Sens. Environ. 2008, 112, 955–969. [Google Scholar] [CrossRef]
  32. United States Environmental Protection Agency (EPA). Updates to the Demographic and Spatial Allocation Models to Produce Integrated Climate and Land Use Scenarios (ICLUS) (Final Report, Version 2); U.S. Environmental Protection Agency: Washington, DC, USA, 2017.
  33. US Geological Survey Gap Analysis Program (GAP). National Land Cover Version 2.0. US Geological Survey. Available online: http://gapanalysis.usgs.gov/ (accessed on 15 October 2016).
  34. Bailey, R.G.; Cushwa, C.T. Ecoregions of North America; US Fish and Wildlife Service: Fort Collins, CO, USA, 1981.
  35. Norwine, J.; Kuruvilla, J. The Changing Climate of South Texas, 1900–2100: Problems and Prospects, Impacts and Implications. In Center for Research Excellence in Science and Technology-Research on Environmental Sustainability in Semi-Arid Coastal Areas; Texas A&M University–Kingsville: Kingsville, TX, USA, 2007. [Google Scholar]
  36. Jensen, J.R. Introductory Digital Image Processing: Remote Sensing Perspective, 4th ed.; Prentice-Hall: Upper Saddle River, NJ, USA, 2016. [Google Scholar]
  37. Cain, A.T.; Tuovila, V.R.; Hewitt, D.G.; Tewes, M.E. Effects of a highway and mitigation projects on bobcats in southern Texas. Biol. Conserv. 2003, 114, 189–197. [Google Scholar] [CrossRef]
  38. Haines, A.M.; Tewes, M.E.; Laack, L.L.; Horne, J.S.; Young, J.H. A habitat-based population viability analysis for ocelots (Leopardus pardalis) in the United States. Biol. Conserv. 2006, 132, 424–436. [Google Scholar] [CrossRef]
  39. Pulighe, G.; Baiocchi, V.; Lupia, F. Horizontal accuracy assessment of very high-resolution Google Earth images in the city of Rome, Italy. Int. J. Digit. Earth 2016, 9, 342–362. [Google Scholar] [CrossRef]
  40. Mata, J.M.; Perotto-Baldivieso, H.L.; Hernández, F.; Grahmann, E.D.; Rideout-Hanzak, S.; Edwards, J.T.; Page, M.T.; Shedd, T.M. Quantifying the spatial and temporal distribution of tanglehead (Heteropogon contortus) on South Texas rangelands. Ecol. Process. 2018, 7. [Google Scholar] [CrossRef] [Green Version]
  41. Hepcan, Ç.C.; Turan, I.A.; Özkan, M.B. Monitoring land use change in the Çeşme coastal zone, Turkey using aerial photographs and satellite imaging. Land Degrad. Dev. 2011, 22, 326–333. [Google Scholar] [CrossRef]
  42. Perotto-Baldivieso, H.L.; Wu, X.B.; Peterson, M.J.; Smeins, F.E.; Silvy, N.J.; Schwertner, T.W. Flooding-induced landscape changes along dendritic stream networks and implications for wildlife habitat. Landsc. Urban Plan. 2011, 99, 115–122. [Google Scholar] [CrossRef]
  43. Bierwagen, B.G.; Theobald, D.M.; Pyke, C.R.; Choate, A.; Groth, P.; Thomas, J.V.; Morefield, P. National housing and impervious surface scenarios for integrated climate impact assessments. Proc. Natl. Acad. Sci. USA 2010, 10, 20887–20892. [Google Scholar] [CrossRef] [PubMed] [Green Version]
  44. Tewes, M.E.; Everett, D.D. Status and distribution of the endangered ocelot and jaguarundi in Texas. In Cats of the World: Biology, Conservation, and Management; Miller, S.D., Ed.; National Wildlife Federation: Washington, DC, USA, 1986. [Google Scholar]
  45. Litvatis, J.A.; Reed, G.C.; Carroll, R.P.; Litvatis, M.K.; Tash, J.; Mahard, T.; Broman, D.J.; Callahan, C.; Ellingwood, M. Bobcats (Lynx rufus) as a model organism to investigate the effects of roads on wide-ranging carnivores. Environ. Manag. 2015, 55, 1366–1376. [Google Scholar] [CrossRef] [PubMed]
  46. Poessel, S.A.; Burdett, C.L.; Boydston, E.E.; Lyren, L.M.; Alonso, R.S.; Fisher, R.N.; Crooks, K.R. Roads influence movement and home ranges of a fragmentation-sensitive carnivore, the bobcat, in an urban landscape. Biol. Conserv. 2014, 180, 224–232. [Google Scholar] [CrossRef]
  47. Riley, S.P.D.; Sauvajot, R.M.; Fuller, T.K.; York, E.C.; Kamradt, D.A.; Bromley, C.; Wayne, R.K. Effects of urbanization and habitat fragmentation on bobcats and coyotes in southern California. Conserv. Biol. 2003, 17, 566–576. [Google Scholar] [CrossRef] [Green Version]
  48. Archer, S.R.; Anderson, E.M.; Predick, K.I.; Schwinning Steidl, R.J.; Woods, S.R. Woody plant encroachment: Causes and consequences. In Rangeland Systems; Briske, D., Ed.; Springer Series on Environmental Management; Springer: Cham, Switerland, 2017. [Google Scholar]
  49. Harveson, P.M.; Tewes, M.E.; Anderson, G.L.; Laack, L.L. Habitat use by ocelots in south Texas: Implications for restoration. Wildl. Soc. Bull. 2004, 32, 948–954. [Google Scholar] [CrossRef]
  50. Tewes, M.E. Clinging to survival in the borderlands: Ocelots face dwindling habitat and growing isolation. The Wildlife Professional Sept/Oct. 2017, pp. 26–29. Available online: https://www.eastfoundation.net/media/46869/twp-ocelot-article.pdf (accessed on 1 February 2020).
  51. Young, J.K.; Golla, J.M.; Draper, J.P.; Broman, D.; Blakenship, T.; Heilbrun, R. Space use and movement of urban bobcats. Animals 2019, 9, 275. [Google Scholar] [CrossRef] [PubMed] [Green Version]
  52. Tigas, L.A.; Van Vuren, D.H.; Sauvajot, R.M. Behavioral responses of bobcats and coyotes to habitat fragmentation and corridors in an urban environment. Biol. Conserv. 2002, 108, 299–306. [Google Scholar] [CrossRef]
  53. Stasey, W.C. Evaluating Translocation Strategies for Ocelot in the Tamaulipan Biotic Province. Ph.D. Dissertation, Texas A&M University-Kingsville, Kingsville, TX, USA, 2012. [Google Scholar]
  54. Serieys, L.E.; Armenta, T.C.; Moriarty, J.G.; Boydston, E.E.; Lyren, L.M.; Poppenga, R.H.; Crooks, K.R.; Wayne, R.K.; Riley, S.P.D. Anticoagulant rodenticides in urban bobcats: Exposure, risk factors and potential effects based on a 16-year study. Ecotoxicology 2015, 24, 844–862. [Google Scholar] [CrossRef] [PubMed]
  55. Franklin, S.P.; Troyer, J.L.; Terwee, J.A.; Lyren, L.M.; Boyce, W.M.; Riley, S.P.D.; Roelke, M.E.; Crooks, K.R.; Vandewoude, S. Frequent transmission of immunodeficiency viruses among bobcats and pumas. J. Virol. 2007, 81, 10961–10969. [Google Scholar] [CrossRef] [PubMed] [Green Version]
  56. Bevins, S.N.; Carver, S.; Boydston, E.E.; Lyren, L.M.; Alldredge, M.; Logan, K.A.; Riley, S.P.D.; Fisher, R.N.; Vickers, T.W.; Boyce, W.; et al. Three pathogens in sympatric populations of pumas, bobcats, and domestic cats: Implications for infectious disease transmission. PLoS ONE 2012, 7. [Google Scholar] [CrossRef] [PubMed]
  57. Instituto Nacional de Estadística y Geografía (INEGI). Anuario Estadístico y Geográfico de los Estados Unidos Mexicanos 2016; Instituto Nacional de Estadística y Geografía: Ciudad de México, México, 2016. [Google Scholar]
Figure 1. Rio Grande Delta and surrounding rangeland study area in southeastern Brooks, Kenedy, Willacy, Cameron, and eastern Hidalgo counties, South Texas, USA (10,065 km2).
Remotesensing 12 00659 g001
Figure 2. Comparison of 1987, 1992, 2000, 2008, and 2016 land cover (i.e., woody cover, rangeland-herbaceous cover, agriculture, urban areas, bare ground and water) in the Rio Grande Delta and surrounding rangeland study area (10,065 km2) in South Texas, United States.
Remotesensing 12 00659 g002
Figure 3. Percentage of landscape (PLAND; %), patch density (PD; # patches/100 ha), edge density (ED; m/ha), mean patch area (MPA; ha), and Euclidean distance to nearest neighbor patch (ENN; m) for woody, rangeland-herbaceous, agriculture, and urban cover types from 1987 to 2016 in the Rio Grande Delta and surrounding rangeland study area (10,065 km2) in South Texas, United States.
Remotesensing 12 00659 g003
Figure 4. Comparison of the frequency distribution for 98% of small (<20 ha) and large (<21,300 ha) woody patches from 1987 to 2016 in the Rio Grande Delta and surrounding rangeland study area (10,065 km2) in South Texas, United States.
Remotesensing 12 00659 g004
Figure 5. Projected losses (km2) of woody, rangeland-herbaceous, and agriculture cover types from 2020 to 2050 for two economically-driven housing density scenarios (A1 and A2), two environmentally-friendly economic housing density scenarios (B1, B2), and a baseline scenario (BC) based on current LANDSAT imagery of the Rio Grande Delta and surrounding rangeland study area (10,065 km2) in South Texas, United States.
Remotesensing 12 00659 g005
Figure 6. Percentage of landscape (PLAND, %), patch density (PD; # patches/100 ha), edge density (ED; m/ha), mean patch area (MPA; ha), and Euclidean distance to nearest neighbor (ENN; m) for woody, rangeland-herbaceous, agriculture and urban cover types from 2020 to 2050 for two economically-driven housing density scenarios (A1 and A2), two environmentally-friendly economic housing density scenarios (B1, B2), and a baseline scenario (BC) based on current LANDSAT imagery of the Rio Grande Delta and surrounding rangeland study area (10,065 km2) in South Texas, United States.
Remotesensing 12 00659 g006
Figure 7. Comparison of 2016 land cover types (i.e., woody, rangeland-herbaceous, agriculture, urban, bare, and water) and projected land cover in 2050 (based on the US Environmental Protection Agency’s rapid economic development, slow population growth and high global integration housing density scenario [A1]) in the Rio Grande Delta and surrounding rangeland study area (10,065 km2) in South Texas, United States.
Remotesensing 12 00659 g007
Table 1. Comparison of means, standard error of mean (MSE), range, sample size (n), kurtosis, kurtosis standard error (KSE), skewness, and skewness standard error skewness (SSE) for patch size (PS; ha) and patch shape index (SI) of woody cover in the Rio Grande Delta and surrounding rangeland study area (10,065 km2) in South Texas, United States in 1987, 1992, 2000, 2008, and 2016.
Year NRangeMeanMSEKurtosisKSESkewnessSSE
1987PS18,3480.09–32,927.405.181.8316,941.250.04128.060.02
SI18,3481.00–34.561.210.01789.560.0417.820.02
1992PS55,1210.09–22,036.052.150.4927,139.990.02155.500.01
SI55,1211.00–83.931.270.013,037.530.0234.060.01
2000PS42,8780.09–21,107.972.220.5626,976.000.02154.980.01
SI42,8781.00–83.891.310.011,889.180.0228.720.01
2008PS53,1040.09–19,960.782.290.4429,340.980.02157.600.01
SI53,1041.00–64.051.1250.011,443.300.0223.990.01
2016PS36,1040.09–1470.311.580.2536,140.200.02174.450.01
SI36,1041.00–126.971.320.014,312.140.0240.580.01
Table 2. Two-sample Kolmogorov–Smirnov Z test values for woody patch size (PS; ha) and patch shape index (SI) from 1987 to 2016 in the Rio Grande Delta and surrounding rangeland study area (10,065 km2) in South Texas, United States.
1987–19921992–20002000–20082008–2016
PSSIPSSIPSSIPSSI
Kolmogorov–Smirnov Z77.205.101.703.9630.646.5031.325.50
Asymp. Sig (2-tailed)0.000.000.010.000.000.000.000.00

