Abstract
Defining stream channels in a watershed is important for assessing freshwater habitat availability, complexity, and quality. However, mapping channels of small tributary streams becomes challenging due to frequent channel change and dense vegetation coverage. In this study, we used an Unmanned Aerial Vehicle (UAV) and photogrammetry method to obtain a 3D Digital Surface Model (DSM) to estimate the total in-stream channel and channel width within grazed riparian pastures. We used two methods to predict the stream channel boundary: the Slope Gradient (SG) and Vertical Slope Position (VSP). As a comparison, the same methods were also applied using low-resolution DEM, obtained with traditional photogrammetry (coarse resolution) and two more LiDAR-derived DEMs with different resolution. When using the SG method, the higher-resolution, UAV-derived DEM provided the best agreement with the field-validated area followed by the high-resolution LiDAR DEM, with Mean Squared Errors (MSE) of 1.81 m and 1.91 m, respectively. The LiDAR DEM collected at low resolution was able to predict the stream channel with a MSE of 3.33 m. Finally, the coarse DEM did not perform accurately and the MSE obtained was 26.76 m. On the other hand, when the VSP method was used we found that low-resolution LiDAR DEM performed the best followed by high-resolution LiDAR, with MSE values of 9.70 and 11.45 m, respectively. The MSE for the UAV-derived DEM was 15.12 m and for the coarse DEM was 20.78 m. We found that the UAV-derived DEM could be used to identify steep bank which could be used for mapping the hydrogeomorphology of lower order streams. Therefore, UAVs could be applied to efficiently map small stream channels in order to monitor the dynamic changes occurring in these ecosystems at a local scale. However, the VSP method should be used to map stream channels in small watersheds when high resolution DEM data is not available.
1. Introduction
Freshwater ecosystems provide critical habitat for insects, amphibians and other wildlife. Many terrestrial species travel through or settle for a short period of their life cycles in these areas as they seek suitable shelter [1,2]. The riverine forest provides an important niche for many wildlife species and is also used as a travel corridor for other species, such as birds and small mammals [3,4,5,6]. The shoreline vegetation offers shade and wind protection that helps regulate water temperature and increases the dissolved oxygen concentration [7,8,9,10].
One of the most important physical indicators related to freshwater ecosystem assessments is stream location and stream bank condition. In order to evaluate the environmental condition of riparian corridors, it is necessary to quantify vegetation coverage and stream bank morphologic characteristics (stream bed slope and sinuosity) and predict bank erosion rates [11,12,13]. The presence and distribution patterns of specific plant species growing on stream banks are closely related to fluvial geomorphic processes, bankfull discharge and natural dynamics occurring in these areas [14,15]. Additionally, the distribution of herbaceous plant species, woody shrubs and tree species can significantly influence the hydromorphic roughness of the floodplain. It can also affect the transition between the main channel and the floodplain, and modify the dynamics of flood waves [16,17,18].
The removal of streamside vegetation due to land use activities, such as cattle grazing, can lead to dramatic changes in stream channel size and morphology. Previous studies concluded that grazing activities not only trigger increases in sediment load, but also cause channel incision and widening [19,20,21]. As a consequence, the effects of increased turbidity and channel widening can severely affect channel morphology and threat fish habitat.
In order to apply management strategies to mitigate the environmental concerns in these areas, the first step is to pinpoint the bank slope position, which can serve as the starting point of further analysis of stream conditions and water quality. Satellite-derived imagery and images obtained with traditional high-altitude aerial photography have been widely used since they cover broad areas. However, the vegetation overhanging on top of a stream channel can partially shade the stream’s boundaries and make it difficult to ascertain the exact location of boundaries. This fact becomes particularly exacerbated over small streams where image resolution becomes the limiting factor [22,23].
Digital elevation models (DEMs) have been widely used as a source for landscape modelling and solving various environmental problems, as an alternative to satellite-derived imagery. The accuracy of DEMs could have a major impact on the quality of DEM-derived landscape matrices, including surface drainage patterns and channel geomorphology prediction [24,25]. In addition to DEM accuracies, the resolution of DEMs is also critically important for the mapping of small streams and narrow conduits in floodplains. Therefore, coarse-resolution DEMs obtained with traditional photogrammetry cannot preserve fine topographical terrain features, such as small stream channels, bank locations and bank slopes [26,27,28,29,30]. Additionally, water level fluctuations coupled with stream erosion and sedimentation processes over time can lead the datasets derived from aerial photography to be rapidly outdated, since they are unable to reflect these changes periodically [31,32,33].
High-resolution LiDAR (Light Detection and Ranging) DEMs can provide more detail to detect and locate microtopographic features at the sub-meter scale [34,35,36]. Therefore, they have been used as a source to implement mitigation strategies at critical locations to prevent pollutant transfer and increase pollutant retention [37,38]. However, LiDAR presents some drawbacks: the dataset production can be costly due to the expensive sensors employed, and the broad geographical areas covered require lengthy software processing times and the need of trained personnel. As a consequence, LiDAR datasets are updated periodically every five years, or longer, which is insufficient to accurately capture the frequent changes often occurring in freshwater ecosystems.
Latest developments in computer science have developed dynamic algorithms capable of data-driven decisions, i.e., Machine Learning (ML), which have been applied to environmental sciences [39,40,41]. With the help of ML technology, Islam et al. [42] found that higher resolutions of image and elevation detail could have generated more accurate data for environmental risk assessment. Martinez-Santos et al. [43] used Random Forest (RF) and Super Vector Machines (SVM) to predict and classify the presence of water bodies. Whilst the algorithm performed well over flat areas, the authors reported some imprecisions over ridges due to the absence of accurate DEMs [43].
Recent advances, availability and affordability of Unmanned Aerial Vehicles (UAV) coupled with computer algorithms have made their usage a cost-effective alternative to Airborne Laser Scanning (ALS) [44,45,46]. Manfreda et al. [47] pointed out that UAVs could be used as the connection device between field observations and spatiotemporal constraints, which could remarkably improve environmental monitoring over small low-order streams.
The integration of a UAV-derived Digital Terrain Model (DTM) can consistently improve the classification accuracy of (1) land cover/image classification and (2) change detection [48,49,50]. In this sense, Schumann et al. [51] used UAVs to generate a bare-Earth model and extract floodplain and river cross-section geometries of a small stream in the U.S. They concluded that UAVs were precise and could extract highly detailed topographical data over significantly small scales. Chen et al. [52] compared satellite, LiDAR and UAV-derived DEMs to estimate the vertical errors among these topographic models in order to assess their feasibility in water balance estimations over a wetland area. They concluded that photogrammetric UAVs were a cost-efficient approach for bathymetry estimations.
The proliferation of UAV-based remote sensing techniques has been applied for monitoring and managing natural and sensitive ecosystems, such as peat bogs. For example, Lendzioch et al. [53] sampled groundwater levels (GWL) and soil moisture (SM) in two different locations in Czechia. They concluded that UAV-based thermal data estimations combined with DSMs can accurately predict spatial distribution of these GWL and SM parameters on peat bogs.
In order to predict stream channel geomorphology, several authors have used different algorithms to locate abrupt changes in channel slope, or areas of rough terrain, using DEMs as a source. Meng et al. [54] elaborated an algorithm called Vertical Slope Position (VSP) which produced realistic delineations of small-scale catchment areas, flow channels, depressions and wet areas. Based on this algorithm, the soil saturation is predicted to be higher in areas close in elevation to their assigned surface water, which decreases the VSP. Thereby, the VSP has been implemented to delineate hydrologic sensitive areas (HSAs) and critical source areas (CSAs) in agricultural catchments, with especial detail in areas intersecting the stream [37]. Cartwright and Diehl [55] used the Slope Gradient (SG) to classify Topographic Position Index (TPI) and predict steep bank slope areas sensitive to geomorphic instability and estimate indicators associated with fluvial erosion risk. They concluded that highly localized areas of high profile curvature and steep slope were probably excessively small to be resolved by 1 m DEMs.
Based on these previous studies, we believe that UAVs could be used as a cost-effective method to map the stream geomorphology and channel boundaries in small watersheds and provide this critical landscape structure parameter that was not easily available in the past. The main aim of this study is to assess the feasibility of precisely mapping lower order stream bank locations with UAV in comparison to LiDAR. We used two algorithms to map the bank location: (i) Slope Gradient (SG) and (ii) Vertical Slope Position (VSP). The accuracies of these two methods in predicting stream bank location were assessed using four different DEMs: a UAV-derived DEM and three provincial DEM sources; (1) Traditional coarse resolution DEM; (2) LiDAR at 1.2 pulses m−2; and (3) LiDAR at 6 pulses m−2.
2. Materials and Methods
2.1. Study Area
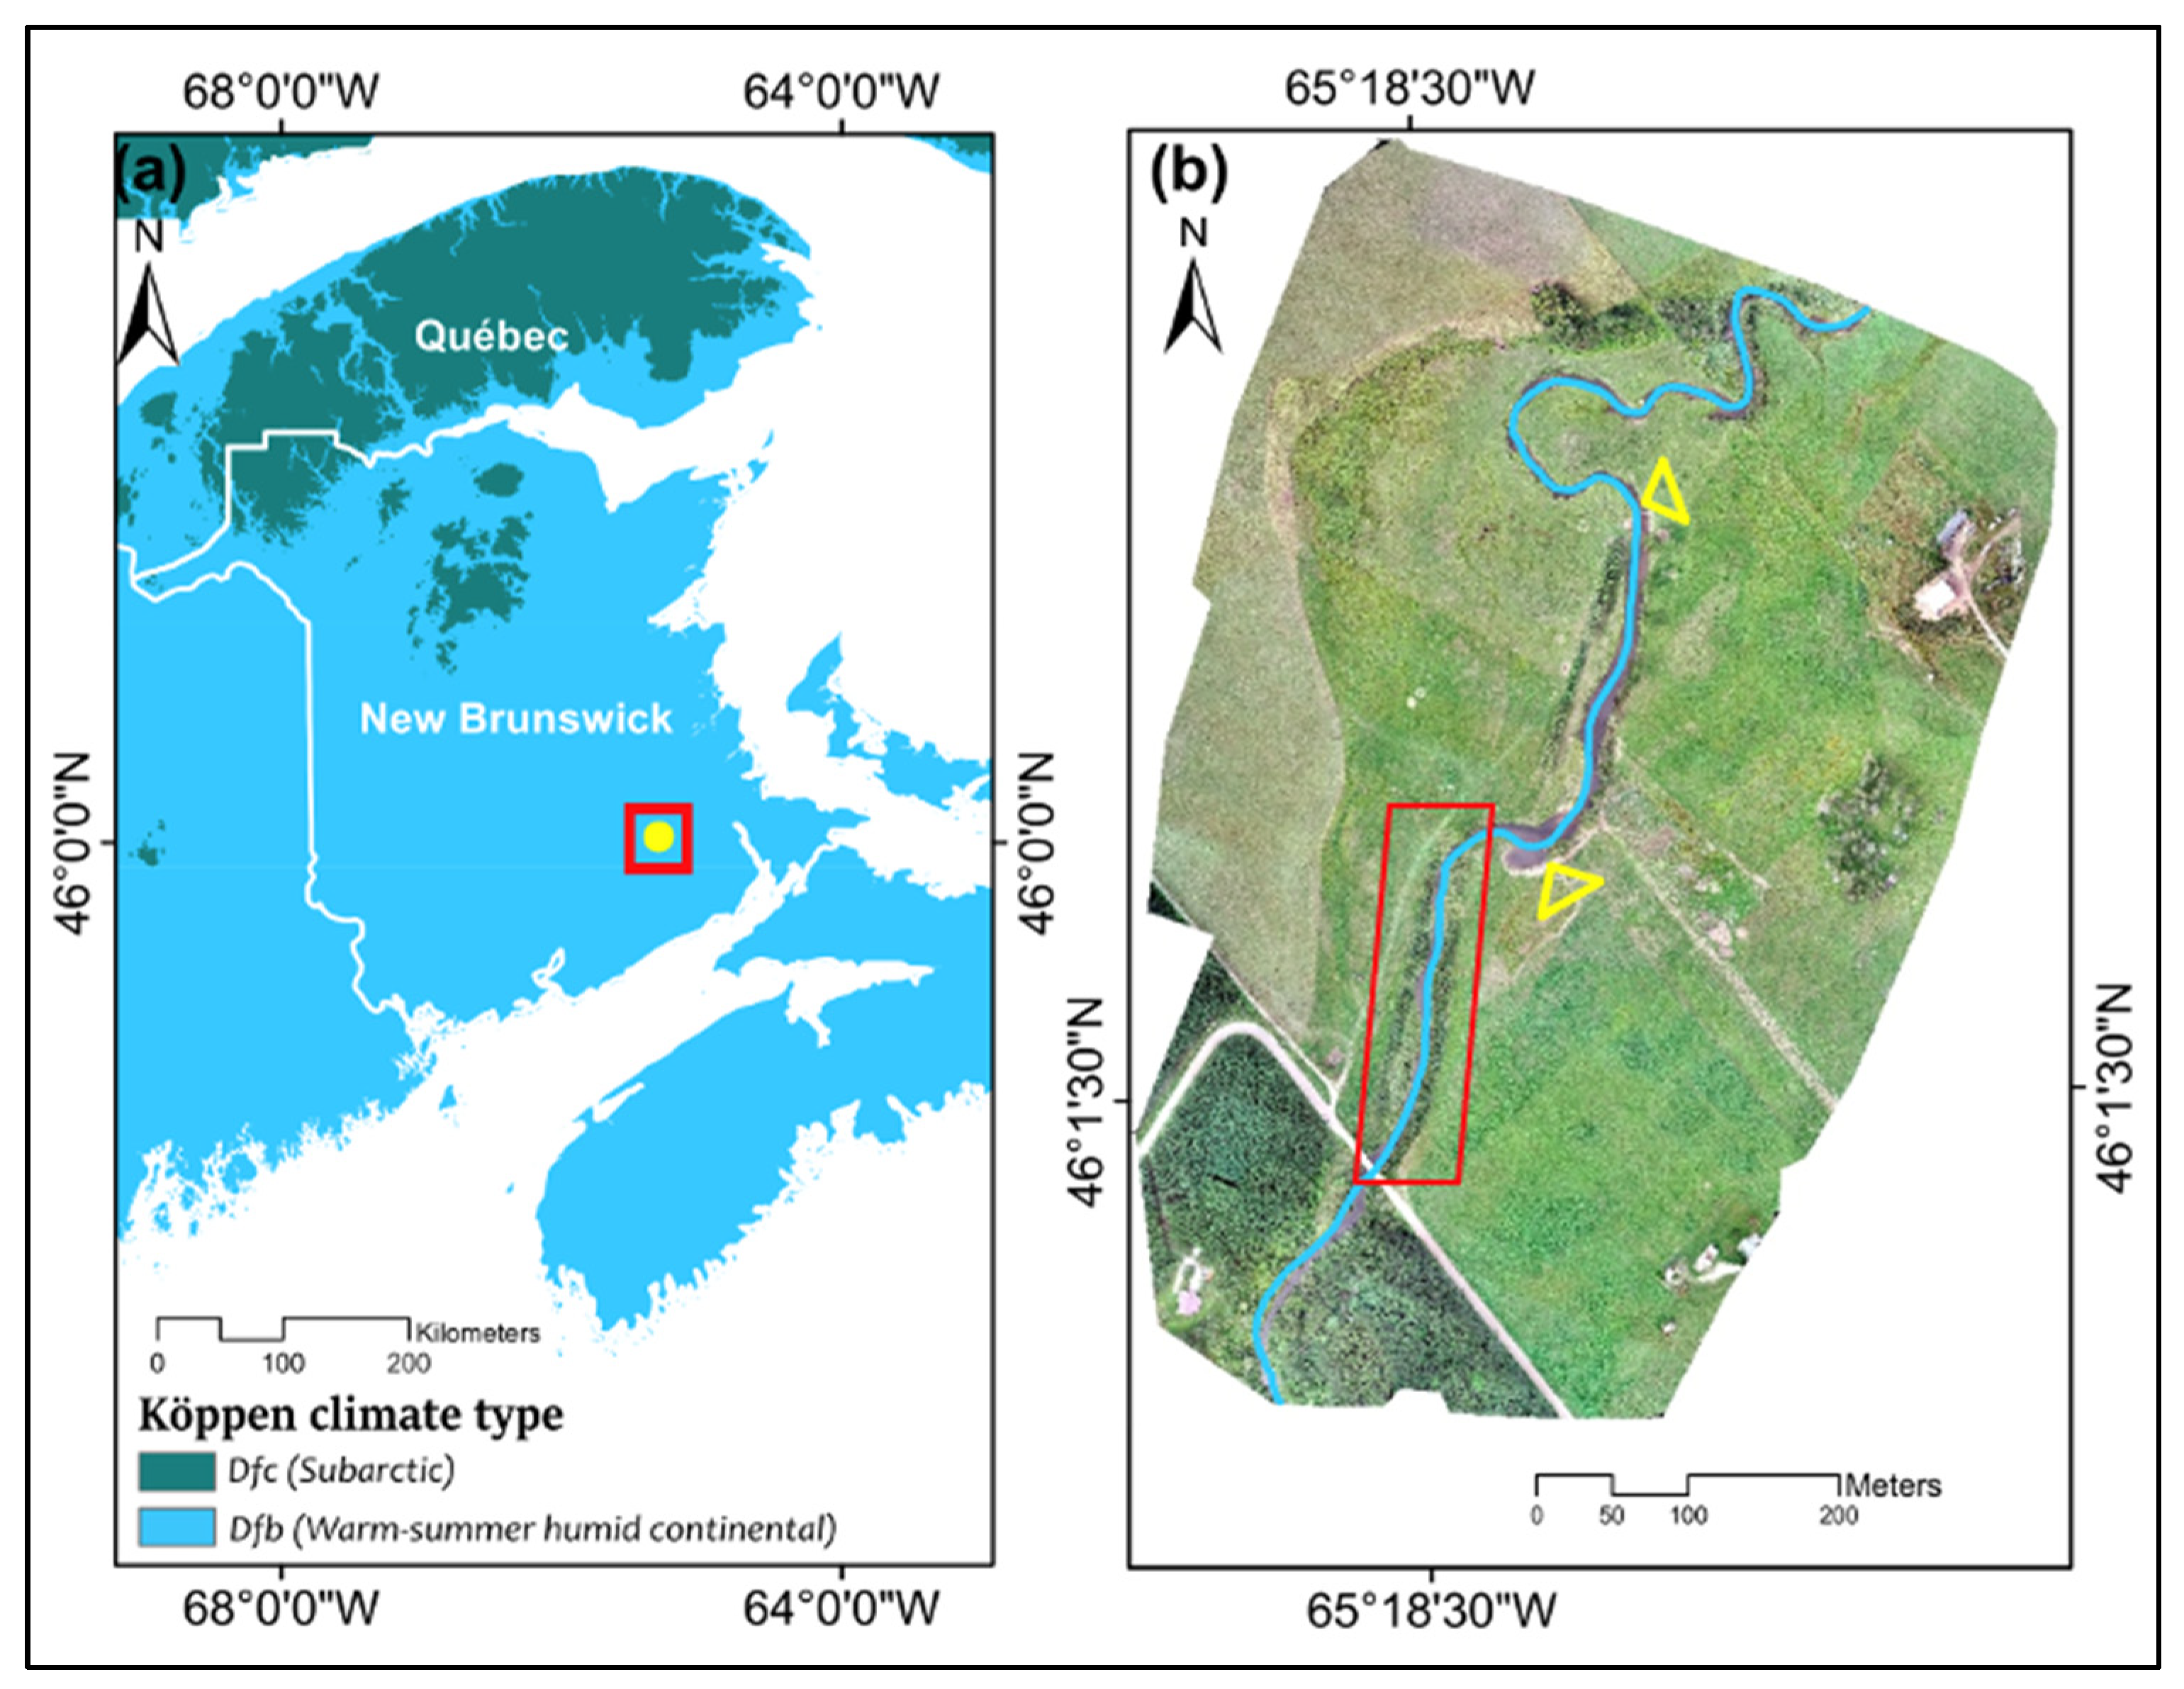
The study was conducted at the Ridge Brook Watershed, which is a small sub-watershed of the Canaan River Watershed in southeastern New Brunswick, Canada (46°01′29.0′′ N, 65°18′32.5′′ W; Figure 1). The climate in this Canadian maritime province is considered warm-summer humid continental (categorized as Dfb in the Köpen-Geiger system classification; Figure 1), with freezing snowy winters and warm summers. The cold winter is generally caused by air masses coming from interior coupled with cold currents coming from the sea. Temperatures are expected to drop to −30 °C or even lower. Summer highs are expected around 32 °C, most likely in the southern part of the province. Precipitation is distributed throughout the year, with expected amounts of 1300 mm over the southern coast, and about half of total precipitation is in the form of snow.
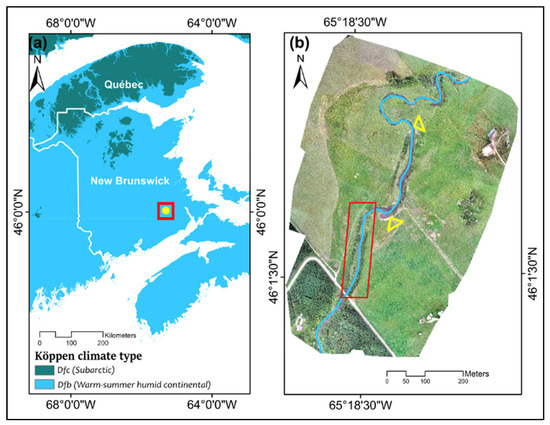
Figure 1.
(a) Köppen-Geiger climate types of Atlantic Canada and the location of The Ridge Brook sub-watershed within the province of New Brunswick (NB, Canada); and (b) the location of the study area (Hicksville settlement, Havelock, NB). In red, the area covered by the bioengineered buffer. Yellow triangles show common areas where cattle cross the stream. The stream follows a South to North direction.
The sub-watershed where the study was conducted covers an area of 7020 ha, with a small-scale limestone extraction operation near the small town of Havelock. The soil type has been classified as Luvisolic, which is commonly found in depressions with poorly drained sites coupled with Regosolic soils. These soils may have an Ah or Ae horizons as top mineral horizons. An Ah horizon is enriched with organic matter often combined with eluvial platy A horizons (Ae). Often, silicate clay has been leached by percolating water to illuvial horizons (Bt) of clay deposition and organic matter storage in imperfectly drained sites. Therefore, Luvisols are typically well supplied with base cations, such as calcium and magnesium, and have loamy or clay-dominated soil textures. Clay in Bt horizon can be restrictive to air and water movement as well as to root growth. These types of soils are often classified as rapidly to imperfectly drained (Canadian soil classification system). The pH detected in the field is close to 5.5. In agriculture area, mix crops, including grasses, barley and legumes, are commonly observed.
The stream bank is mostly dominated by reed canary grass (Phalaris arundinacea), Joe-pye weed (Eutrochium purpureum), horse tails (Equisetum sp) and cattails (Typha sp) as the herbaceous layer. On the other hand, speckled alder (Alnus incana), green alder (Alnus viridis), red osier dogwood (Cornus sericea) and willows (Salix sp) dominated the woody shrub strata. The upstream riverine area adjacent to the farm is surrounded by two sections of planted conifer species, red pine (Pinus resinosa) and Jack pine (Pinus banksiana). These planted species may increase the acidity of the soil in the natural riparian forest, located in the southernmost part of the study area.
Over the past decades, the stream assessments of the Canaan River have reported tremendous development pressures due to forestry and agricultural activities, which have affected the quality and quantity of the adjacent water bodies. Within the study area cattle had access to the stream as a watering source which partially removed the streamside vegetation. As a consequence, sedimentation of sand and gravel deposits increased in stream which led to degradation of water and habitat quality. After a detailed fluvial geomorphic assessment, a bioengineered buffer zone was implemented over a decade ago to re-align the channel based on the natural hydraulic characteristics. This bioengineering buffer zone project added stability to the stream and allowed the recovery of the riverine corridor close to natural condition. Natural pool/riffle spacing was developed, allowing fish to move freely through this section of the brook during any flow conditions, which led to a progressive recovery of aquatic habitat for salmonids. However, due to the lack of an off-stream watering system for cattle and absence of a dedicated livestock crossing, vegetation is still removed from grazing activities over the streamside areas outside of the bioengineered buffer.
2.2. Data Collection and Data Processing
In order to delineate the riverbank and estimate the channel surface area, four different types of datasets obtained with different methods and resolutions were applied: (1) UAV-derived DEM; (2) coarse resolution DEM, obtained with traditional photogrammetry; (3) LiDAR-derived DEM at 1.2 pulses m−2; (4) LiDAR-derived DEM at 6 pulses m−2.
2.2.1. Unmanned Aerial Vehicle (UAV) and Sensors
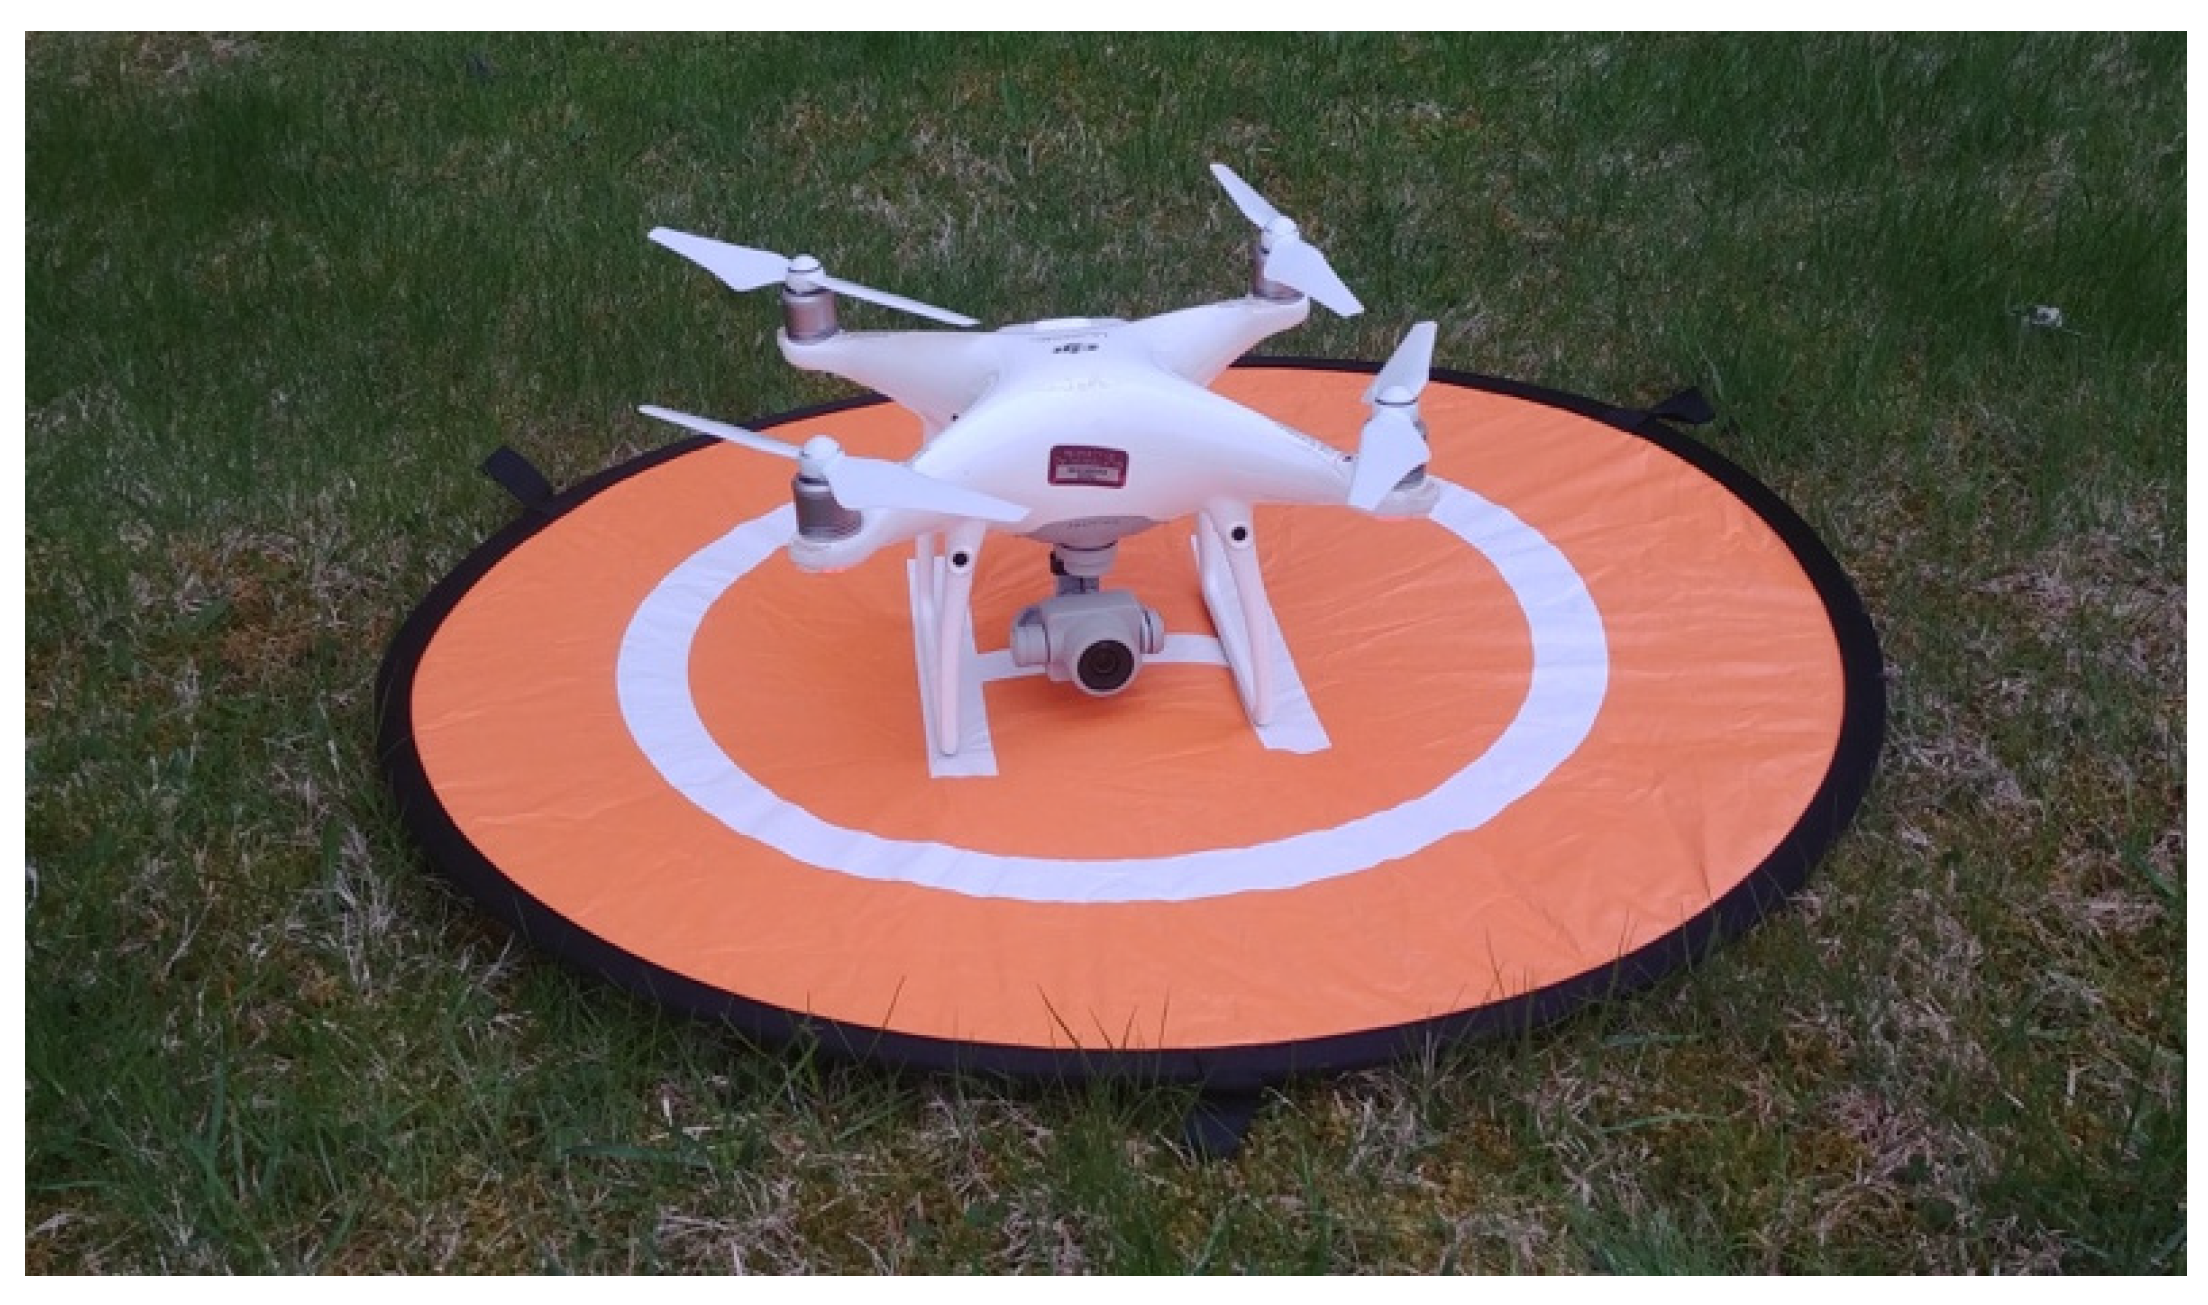
A DJI Phantom 4 Pro (Nanshan, Shenzhen, China; Da-Jiang Innovations, SZ DJI Technology Co., LTD; Figure 2) was used for this study. The Phantom 4 Pro is a vertical takeoff and landing aircraft with total payload of 1388 g including battery and camera. This UAV uses four 2312S Brushless motors powered by a 15.2 V battery with a cruising speed of 72.0 km h−1 (s-mode) and a maximum climb speed of 6 m s−1. The maximum wind speed resistance is up to 10.0 m s−1. The reported transmission range with no obstruction f or interference is up to 7000 m and the maximum service ceiling is 6000 m asl. The stated maximum flight time with a single battery is 30 min. In our tests, we observed a practical flight time of nearly 25 min, depending on wind speed and temperature (<10 km h−1; >4 °C).
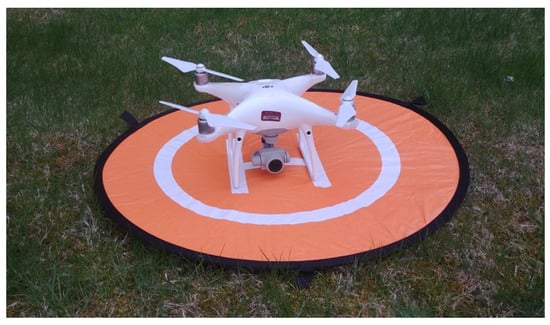
Figure 2.
The DJI Phantom 4 Pro set up in the field.
The onboard camera is a 1” complementary metal oxide semiconductor (CMOS) with 20M effective pixels (5472 × 3648). The lens has a field of view (FOV) of 84° and the focal length is 8.8 mm/24 mm (35 mm format equivalent) f/2.8–f/11 auto focus at 1 m–∞. During the flight, the image trigger can be activated automatically in autopilot flight mode, with simultaneous timestamps. The sensor registers either vertical images captured at nadir angle, for 2D maps, or off-nadir angles (up to 90 degrees) for 3D Digital Surface Model (DSM) reconstructions. Due to its multiple satellite position navigation system (GPS & GLONASS), the aircraft can automatically record GPS locations. Images and metadata are automatically stored with a 64 GB Lexar high performance 633x MicroSDXC UHS-I Secure Digial Card (SD-Card).
This DJI Phantom 4 Pro was chosen due to its recognized camera stability [56,57]. This UAV outperformed other UAVs (e.g., DJI Mavic Pro, DJI Matrice 210 and DJI Inspire 1) tested in a previous study led by Rogers et al. [58]. It provided the highest prediction accuracy in four of the six land covers tested (forest, vines, bare soil and mowed grass). This study also stated that the Phantom 4 Pro provided the best balance between size and sensor resolution. Kuželka and Surový [59] concluded that the images acquired with this UAV had higher quality and detail than DJI Mavic Pro due to its larger sensor and higher sensor resolution.
2.2.2. UAV Data Collection
Parallel flight grid missions were programmed in order to collect images with the UAV. We used a side image and frontal overlap rate of 80%, during pre-leaf conditions to cover 36 ha, in May 2019. We acquired 1027 images in two flights, with an average flight speed of 7 m s−1 at near-ground elevation (80 m); all images were captured at nadir camera angle. Wind speed was less than 10 km h−1 during flight time and the sky was partially overcast, with few clouds and low sunlight intensity. This particular season provided the best field conditions to obtain aerial images of the stream, since the stream bank’s herbaceous vegetation was still snow-flattened, but without residual snow cover on the ground. This helped to reduce the potential elevation error caused by the height of streamside vegetation observed during summer and fall. Therefore, no seasonal analysis was performed.
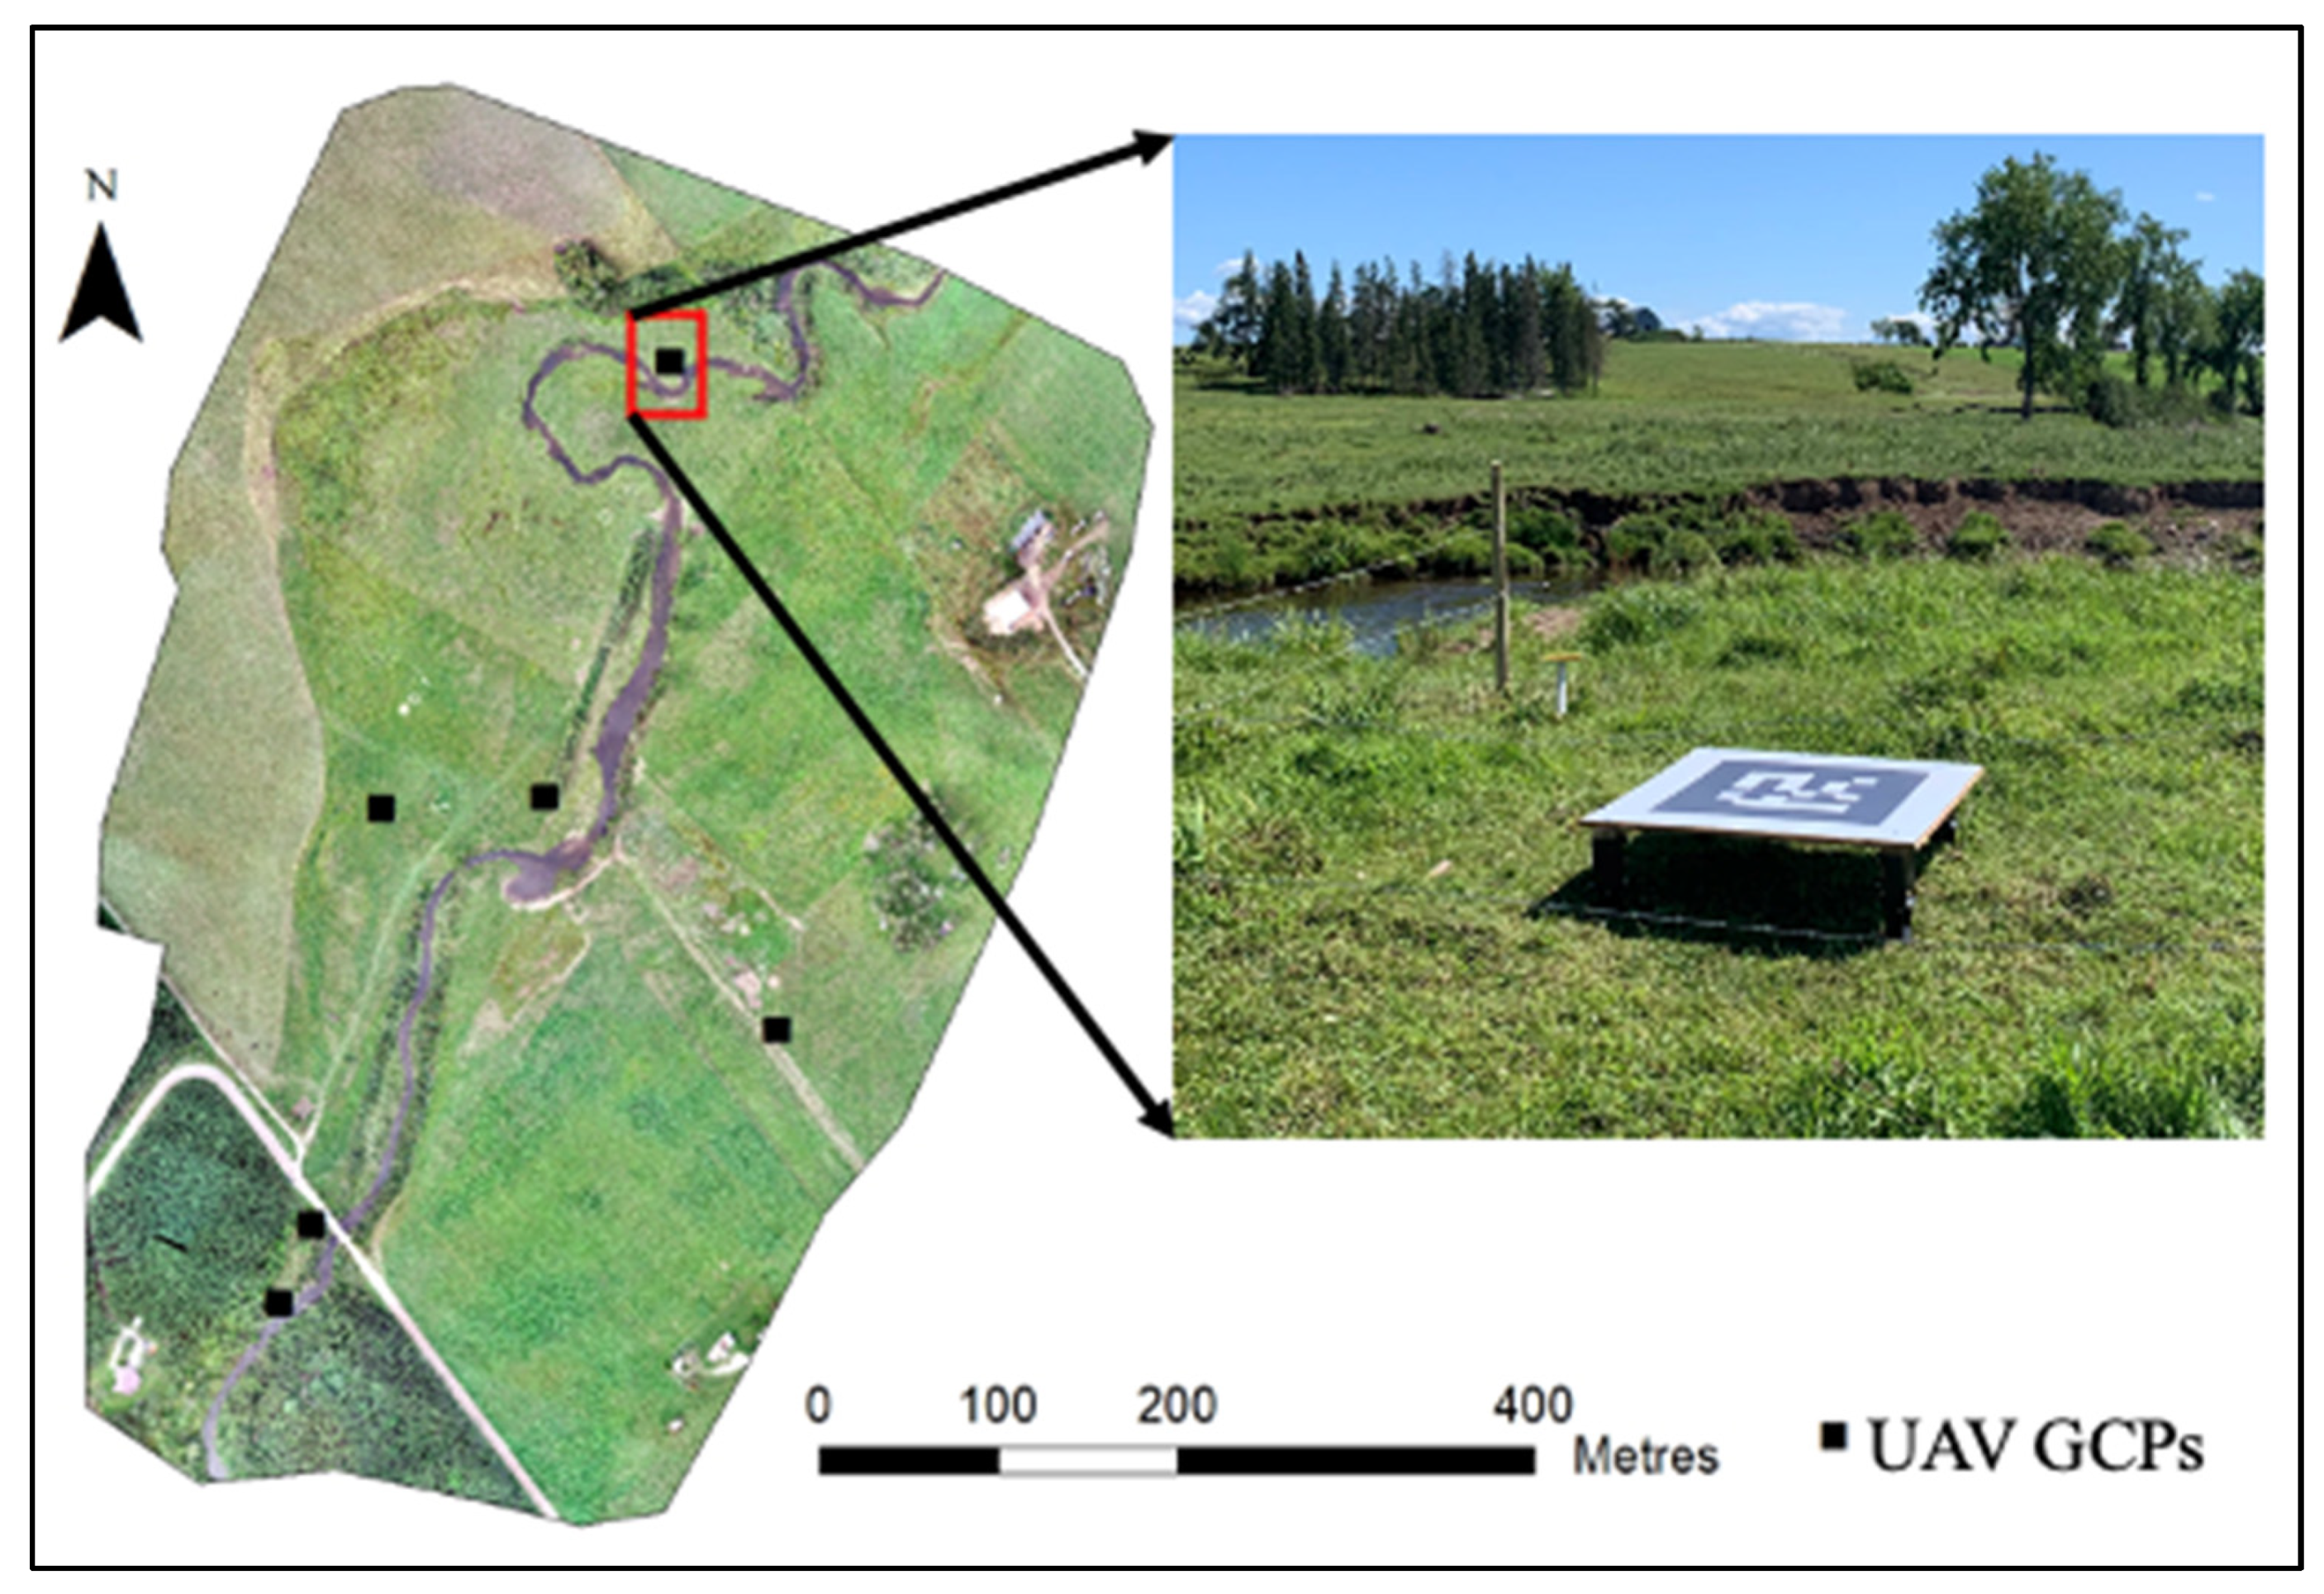
The captured images were processed under the Structure-from-Motion (SfM) algorithm to generate geo-rectified orthomosaic images using software package Pix4D 4.4 (Prilly, Switzerland; Pix4D S.A.). The latitude, longitude and altitude (WGS84 projection) recorded in metadata with onboard GPS of UAV were used to position the aerial photos first. Common points from different images in the overlap areas were used as keypoints to build a 3D projected point through aero-triangulation [60]. In order to improve the software image stitching, 10 manual tie points (mtps) were added in the planted forest area upstream. Additional errors originating from lens distortion, GPS position error, aircraft attitude uncertainty and errors in time domain can lead to decreased accuracy in the relative UAV map geolocation [61]. Therefore, the overall geolocation was corrected using the target coordinates as checkpoints, acquired with handheld GPS as relative accuracy [62]. Six ground control markers (square targets of 1.44 m2) were equally distributed across the site and at the boundaries of the study area, including next to the watercourse at different elevations (Figure 3). In order to mark the positions of the panels with geometrical precision, a ground control point (GCP) of each target’s corners was recorded with a Trimble Geoexplorer 6000 Series handheld GPS for georeferencing accuracy. For each record, the GPS device was connected to a minimum of 16 satellites available and the precision observed during the geolocation acquisition was 10 cm. The GPS was placed on a static position for 30 s on each GCP using Real Time Kinematics (RTK) mode.
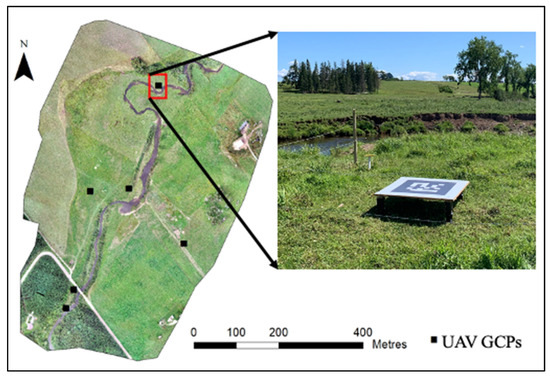
Figure 3.
Distribution of the GCPs in the study area.
2.2.3. Point Cloud Editing
Overall, the software can automatically classify different land uses, such as pastures, road, buildings, high vegetation and roads, with acceptable accuracy. However, finer manual classification was undertaken in order to correct potential 3D point punctual misclassifications of ground or vegetation, to avoid errors in the digital ground surface model [63]. In addition to the error caused by stream bank vegetation, another source of error was found within the stream channel. This was potentially caused by floating objects moving on the water’s surface as well as light/illumination changes between images captured at different times (i.e., reflection, absorption and refraction). In some areas, the UAV camera could penetrate the water surface and captured the stream bed, while in other high-reflection conditions the light could not penetrate the water’s surface. This is a common source of error, or noise, in the estimation of surface elevation [46,64]. For these reasons, points classified as water were removed in order to reduce the elevation uncertainties for the estimation of the stream channel, the triangulation, and the effects on the quality of the DEM [64]. The resulting point cloud had an average density of 833 points m−2 and it was further interpolated at 0.3 m resolution, using the LAStools commercial software suite (Martin Isenburg, LAStools-efficient tools for LiDAR processing).
2.3. Traditional DEM and LiDAR DEMs
The coarse resolution DEM obtained with traditional photogrammetry was acquired from the Service New Brunswick (SNB; http://www.snb.ca/geonb1/e/dc/catalogue-E.asp, accessed on 1 July 2021). The accuracy of a single elevation point was approximately 2.5 m and the spacing between the elevation points was nearly 70 m on average, with increased density in more complex terrain areas. We generated a DEM at a 2 m cell size using the Inverse Distance Weighted (IDW) interpolation method.
The LiDAR DEMs were obtained from SNB geographic database. The point cloud density of the LiDAR dataset collected in 2013 was 1.2 points m−2, with horizontal accuracy of 0.3 m and vertical accuracy of 0.133 m at 95% confidence level. The point cloud density of the LiDAR dataset collected in 2018 was 6 points m−2, with horizontal accuracy of 0.20 m and vertical accuracy was RMSE Z = 10.5 cm, equating to ±20.6 cm at 95% confidence level.
It is essential to remove points being classified as water when processing LiDAR DEM. The elevations of water points (such as depressions) are lower than their surroundings, and as such the overall accuracy of the interpolated surface between points may decrease if a significant number of these points are present but not resolved. Thus, the LiDAR hydrologic enhancement correction was applied prior to DEM generation, as recommended by previous researchers [65,66]. The DEM raster was generated with Natural Neighbor interpolation with 30 cm resolution.
2.4. Stream Network
Spatial hydrology tools of ArcGIS (10.5) were used to generate stream networks using the previously described DEMs as inputs. For the coarse resolution DEM, “stream burning” of the provincially field-mapped open drainage channel network (SNB Geospatial Database) was used to lower cells in the interpolated DEM to invigorate overland flow through mapped feature locations [27]. The resolution of this topographic model was excessively coarse to capture and represent narrow topographic features such as stream channels due to surface generalizations of the terrain [67,68].
Although LiDAR- and UAV-derived DEMs do not require stream burning due to high point cloud density, hydro-conditioning was still required to remove local depressions created by natural or artificial landscape features. The eight-direction flow model (D8 algorithm [69]) was used to derive the flow network and calculate the flow accumulation. The minimum flow initiation threshold for flow accumulation was set as 4 ha (equivalent to 444,444 DEM cells for high-resolution DEMs and 2500 cells for coarse DEMs), to remove seasonal streams from the map and to geographically represent drainage of only the main channel with average water flows year-round.
2.5. Stream Channel Boundary Prediction Methods
In this study, two methods were used to represent stream hydrogeomorphology and to predict stream channel boundaries: the Slope Gradient (SG) and the Vertical Slope Position (VSP). The Slope Gradient method assumes that a marked degree of change in elevation along the land/water interface could be detected by the steep slope of a stream bank, and this abrupt steep slope could be detected with high-resolution DEMs. Average zone slope threshold values were extracted by overlaying a line feature that intersected the land/water border predicted by the DEM. Due to the relatively small extent of interest, it was assumed that the natural slope gradient was negligible and this was the average value used. With “ground” class selected in high-resolution point clouds (LiDAR and UAV), the area between both stream bank sides would be estimated as water surface, in the particular time of data collection, for each data source. In higher-resolution datasets, target raster zones were cleaned (filtered) by a series of raster functions to (1) remove small zones (using shrink function), (2) perform an area-based threshold of remaining zones (region group and zonal geometry functions) and (3) expand remaining zones back to their original extent.
The Vertical Slope Position (VSP) is defined as the elevation differences between the land and the nearest water surface and calculated by integrating the elevation difference for each cell alone to the nearest water body [54]:
where “d” is the distance between two adjacent cells (m) and “s” is slope steepness (m m−1).
The groundwater table thresholds set in DEMs are representative of the depth to water or elevation difference to water. Cells with a VSP below a threshold value were classified as stream channel and the threshold value was calibrated with field data.
2.6. Field-Validation and Statistical Analysis
The Trimble Geoexplorer 6000 GPS unit (10 cm accuracy) was used to record the stream bank location in RTK mode with a minimum of 16 satellites available and a reported error of 10 cm. We recorded the location where herbaceous emergent aquatic species were found. The distribution and density of these plant species could be used as an indicator of the most representative long term processes occurring on the stream bank [14,15]. In sections where high dense riparian vegetation impeded proper human access to the stream, 150 singular GPS waypoints were collected to complete the field delineation. In addition, we also measured 25 field-cross sections selecting the areas partially covered by the dense canopy where the human access was difficult. Within a distance of 1.04 km of the stream surveyed, field-cross sections ranged from 5.5 m in the partially restored area to 19 m in the widest section of the stream, near the section where cattle grazed more intensely.
The LiDAR hydrologic enhancement correction, detailed previously, reduced the natural land features, such as rock outcrops and small stream islands, detected by LiDAR within the stream channel. This fact isolated the slope gradient maximal change detection towards the longitudinal narrow boundary and improved its prediction. We obtained the same effect by removing the points classified as water from the UAV point cloud.
For the VSP map, different elevation thresholds were tested in order to maximize the correctness and minimize both errors of omission (false negative) and commission (false positive) by using the field-validated GPS transect as a reference.
The receiver operating characteristic (ROC) curves optimized the trade-off between the false positive rate (error) and the true positive rate in predicting the stream boundary, at various threshold settings (shown as cumulative probability [70,71]). Intervals of 0.5 m of error were used to estimate the correctness (cumulative probability extracted from ROC curves) of each DEM, in order to determine the percentage of agreement between the predicted and observed stream bank locations. Mean squared errors (MSE) were used to measure of the degree of agreement between predicted and observed stream bank locations:
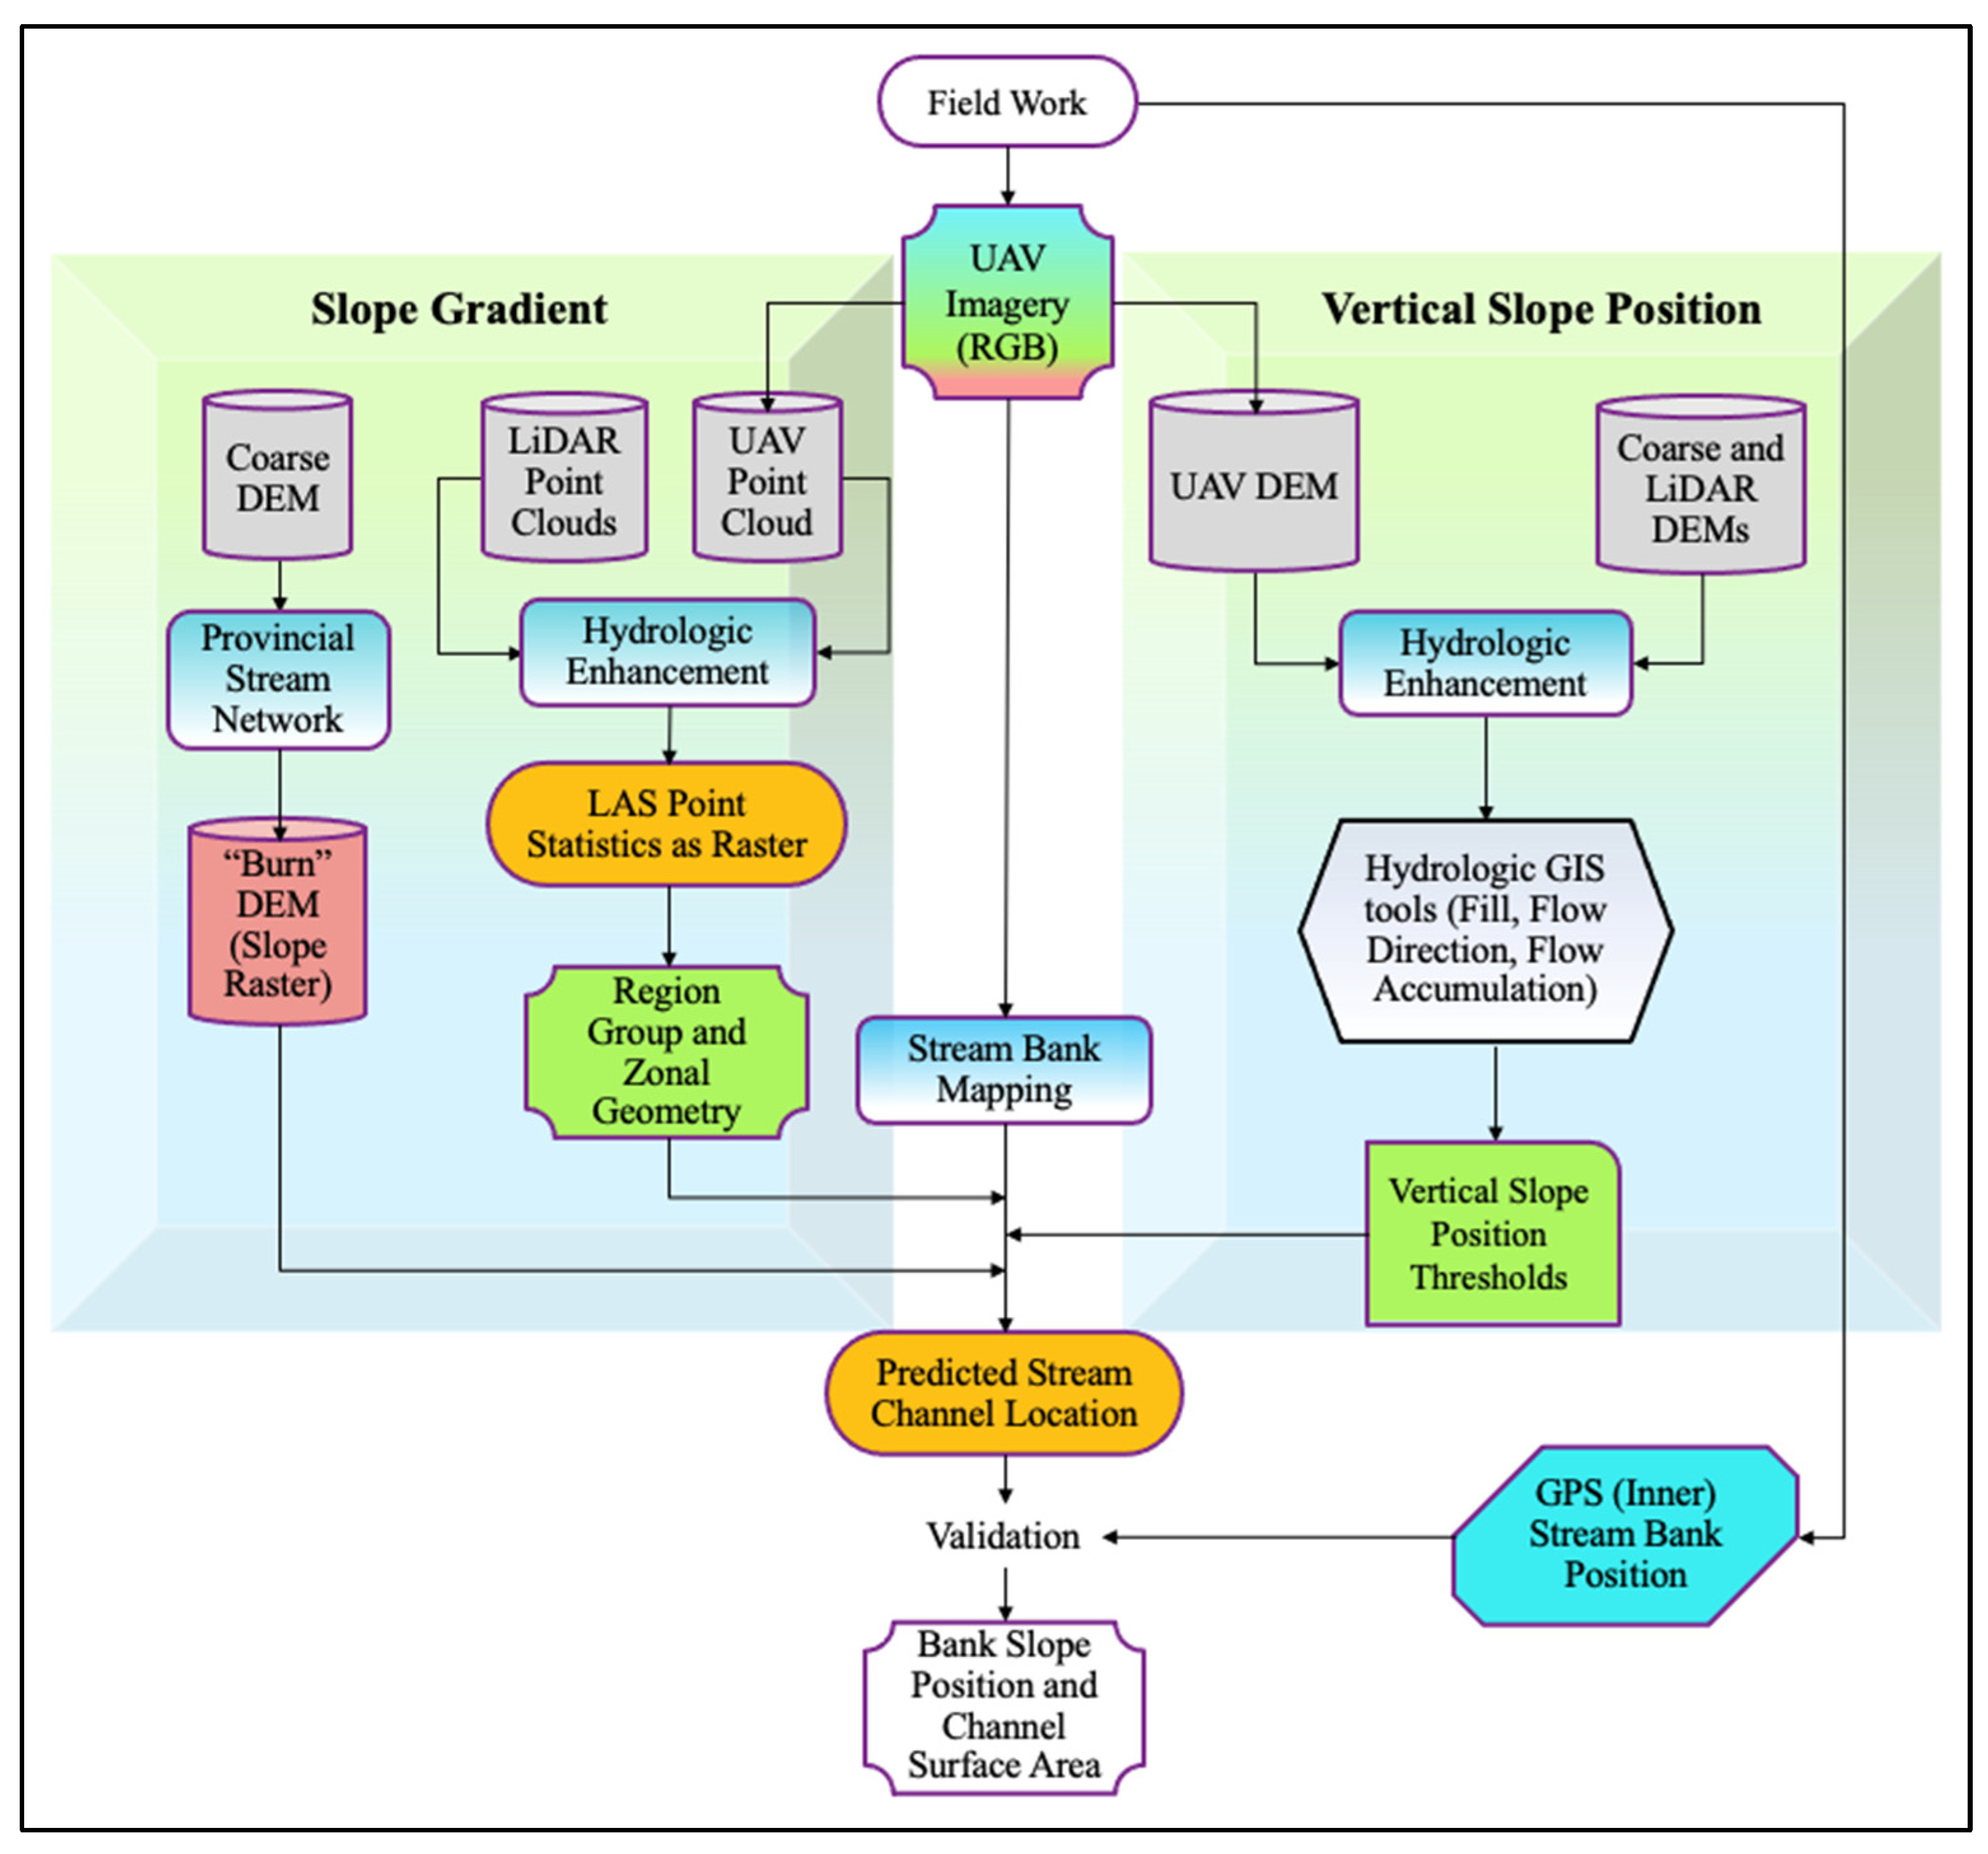
where is the vector of observed values (precise location recorded with GPS) of the i variable predicted and are the predicted DEM values, measured in meters. Figure 4 summarizes the methodology used in this study.
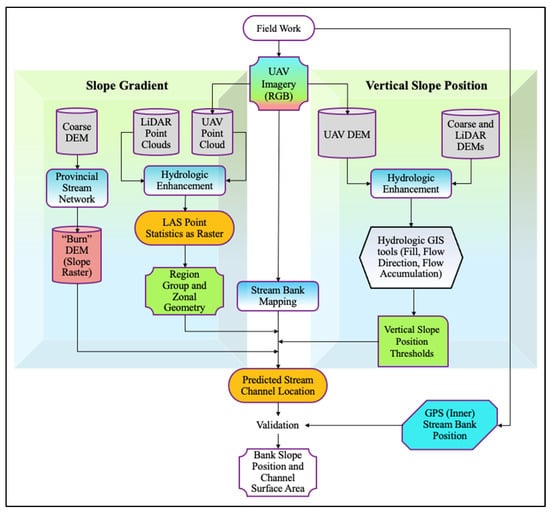
Figure 4.
Flow chart for mapping of stream bank location and channel surface area with coarse, LiDAR and UAV-derived DEMs.
Mean relative error (MRE) was used as the second indicator to assess the goodness of fit:
The Kling-Gupta Efficiency (KGE) proposed by Kling et al. [72] was calculated to measure the goodness-of-fit. This indicator has been widely used in recent years to ensure that the bias and variability ratios were not cross-correlated [73,74]:
where PC corresponds to the Pearson Coefficient value, mo is the average of observed values and mp is average of predicted (DEM) values. The standard deviation of observed values is represented as sdo and standard deviation of predicted values is represented in sdp.
3. Results
3.1. UAV-Derived DEM Geolocation Accuracy
Since the Phantom 4 Pro was capable of automatically recording GPS locations, we used this product as the relative geolocation. However, adverse factors such as lens distortion, GPS position error, aircraft attitude uncertainty and errors in time domain can lead to decreased accuracy in the relative UAV map geolocation, as reported by Fabian et al. [61]. Therefore, the overall geolocation was corrected using the target coordinates as checkpoints, acquired with handheld GPS as relative accuracy. The elevation Root Mean Squared Error (RMSE) for these GCPs was 0.075 m, and the horizontal RMSE for longitude and latitude were 0.078 and 0.066 m, respectively. These results indicate high precision between the measured coordinates (GCPs registered in the field) compared with the software-calculated position. Elevation ranges predicted for each DEM for the study area can be seen in a previous study [62], where the same elevation sources were used.
3.2. Stream Channel Boundaries Prediction by Slope Gradient Method
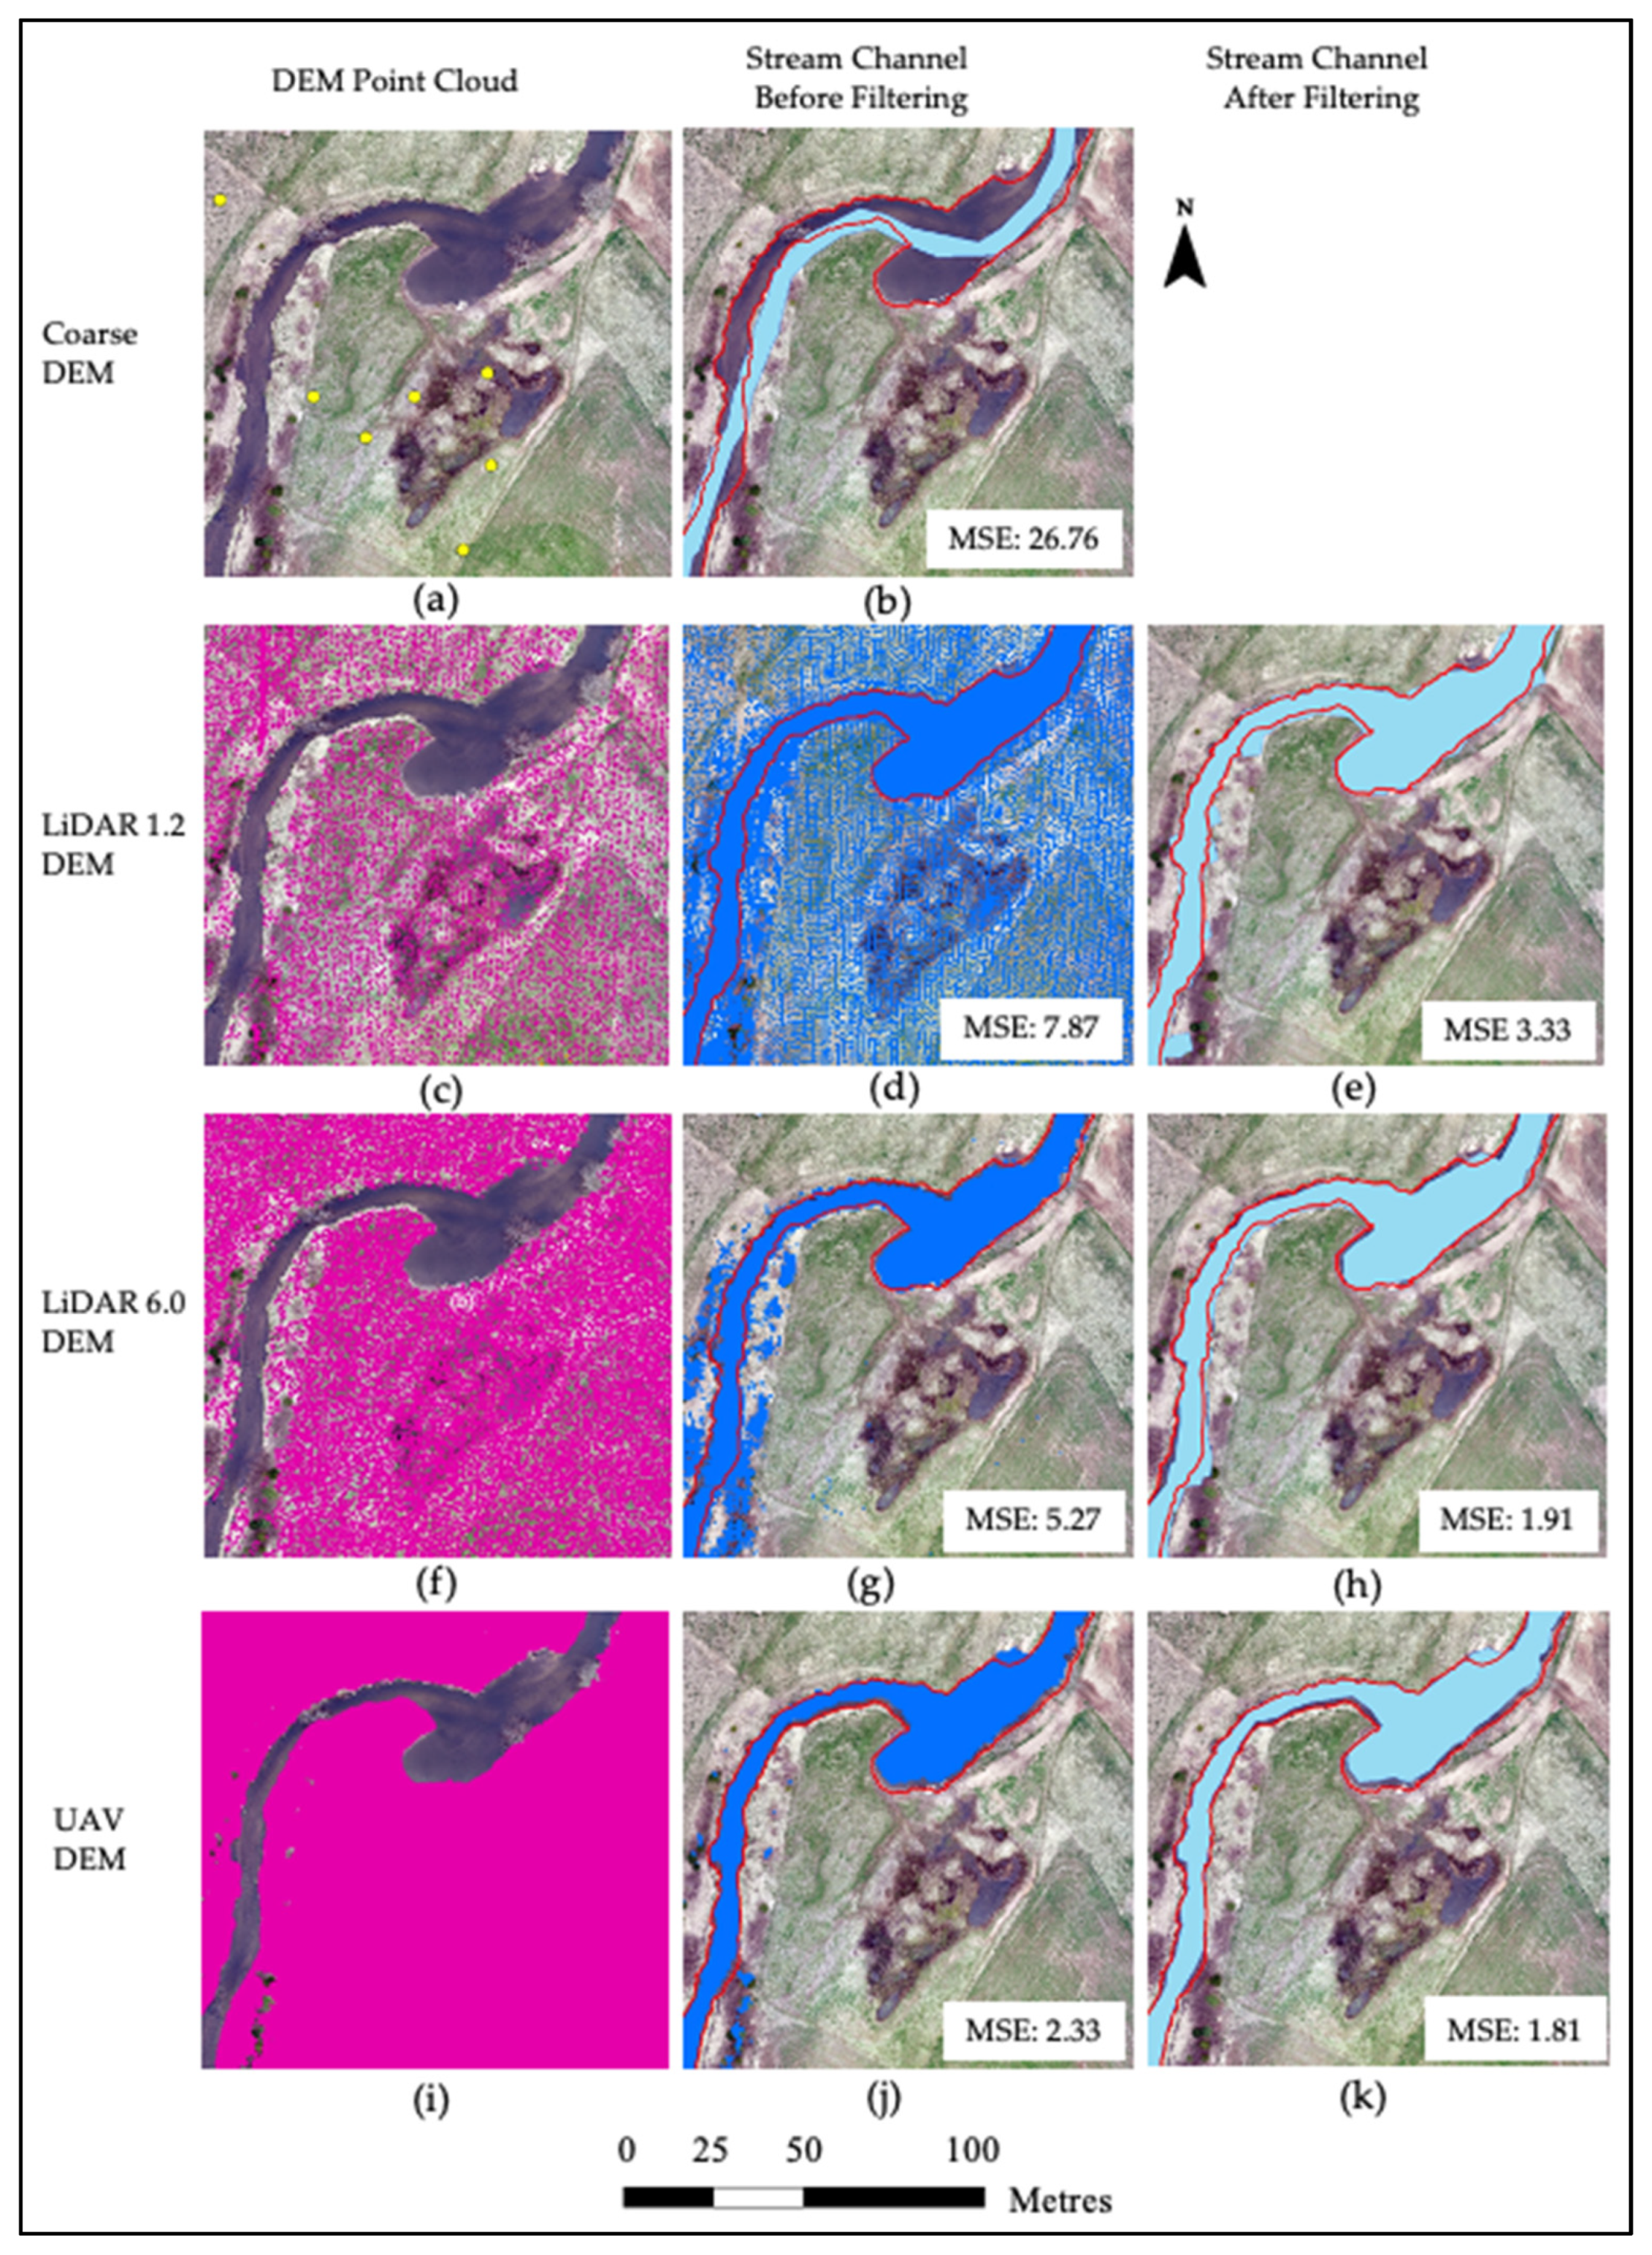
The stream bank predicted using the Slope Gradient method is shown in Figure 5. As shown, the highest density among these datasets can be observed in the UAV point cloud (Figure 5i). This dataset covered the entire study area except for a few narrow sections (empty gaps) due to presence of high vegetation located by the streamside. The LiDAR 6.0 also covered the entire study area (Figure 5f), except the area where the high vegetation of the bioengineered buffer was found. Conversely, due to the remarkably lower density of points collected by LiDAR 1.2 (Figure 5c), the portions of ground without data increased significantly. The coarse-resolution DEM was not only unable to determine the location of the stream bank’s boundaries (Figure 5a) but also insufficient to reflect the width changes along the flow network with acceptable accuracy just by visual assessment.
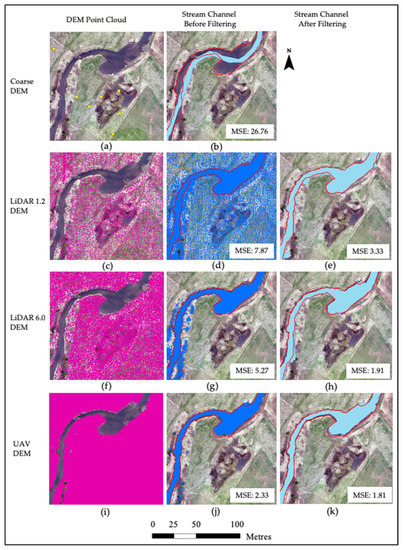
Figure 5.
Point clouds (“ground” class) of the four different DEM sources are represented in (a) coarse DEM, (c) LiDAR 1.2, (f) LiDAR 6.0 and (i) UAV. Stream channels predicted with Slope Gradient method before applying the Region Group filter represented in (b) for coarse DEM, (d) LiDAR 1.2, (g) LiDAR 6.0, (j) UAV and after applying the Region Group filter represented in (e) for LiDAR 1.2, (h) LiDAR 6.0 and (k) UAV.
Before filtering, the channel predicted by the LiDAR 1.2 DEM was significantly more accurate than that of the coarse DEM (Figure 5d). However, there were considerable isolated pocket areas in riparian zones being classified as stream channel based on LiDAR 1.2 DEM. This fact resulted in a significant overestimation of the stream bank boundary. After filtering, the prediction accuracy was significantly improved because those isolated pocket areas were eliminated. However, there were still remarkable errors in area with fenced riparian zones and the predicted stream channels resulted considerably wider (light blue areas in Figure 5e) compared to the field-mapped stream channel within red lines.
The stream bank delineated with LiDAR 6.0 DEM resulted in a smoother and more explicit channel compared with that of LiDAR 1.2 (Figure 5h). However, errors in area with fenced riparian zones and predicted stream channels were still considerably wider than field mapped stream channel, which was similar to the stream channel predicted by LiDAR 1.2. The stream channel predicted by the UAV-derived DEM was more accurate than LiDAR 1.2 and LiDAR 6.0, even before the filtering method was applied (Figure 5j).
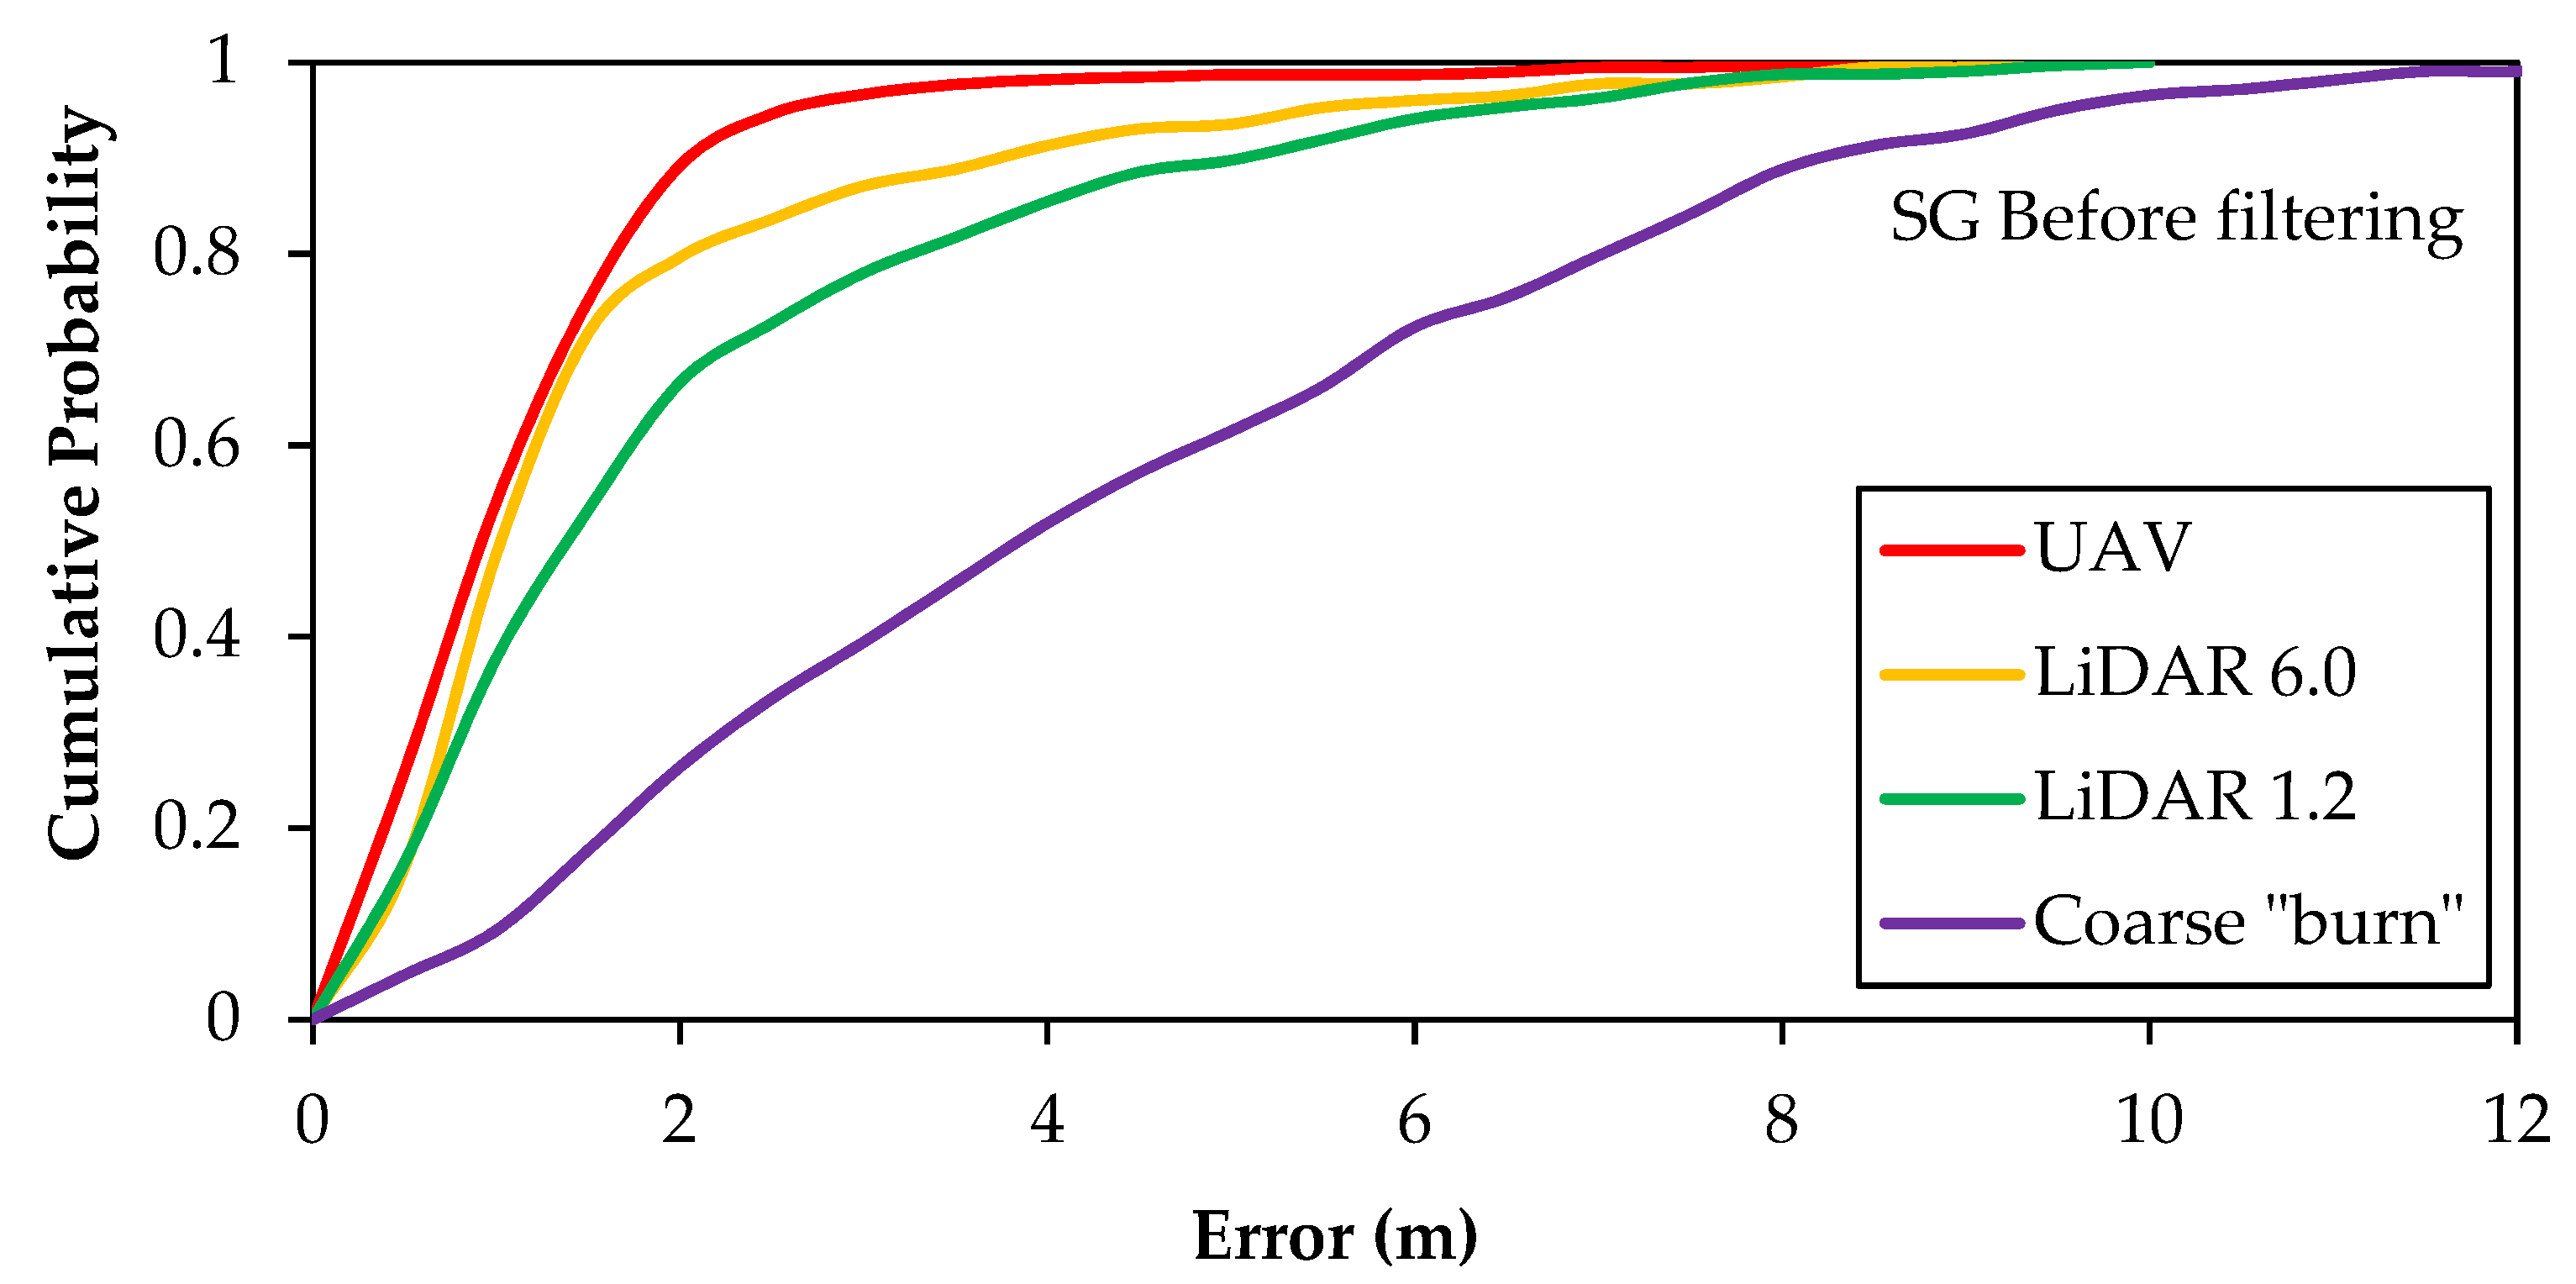
The cumulative probabilities (correctness) of the stream channel boundary predicted before filtering are shown in Figure 6. Channel boundary was predicted with 89% accuracy within an error of 2 m for the UAV-derived DEM, compared with the accuracy of 80% and 67% for the LiDAR 6.0 and LiDAR 1.2 DEMs, respectively. For the coarse DEM, the accuracy was only 26% for the probability of estimating the stream channel within 2 m of error.
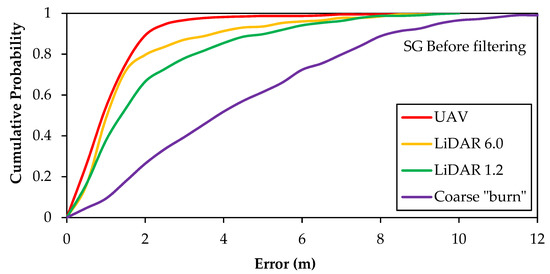
Figure 6.
Receiver Operating Characteristic (ROC) curves representing cumulative probability of the Slope Gradient in predicting stream channel associated to error (m) prior to applying filter.
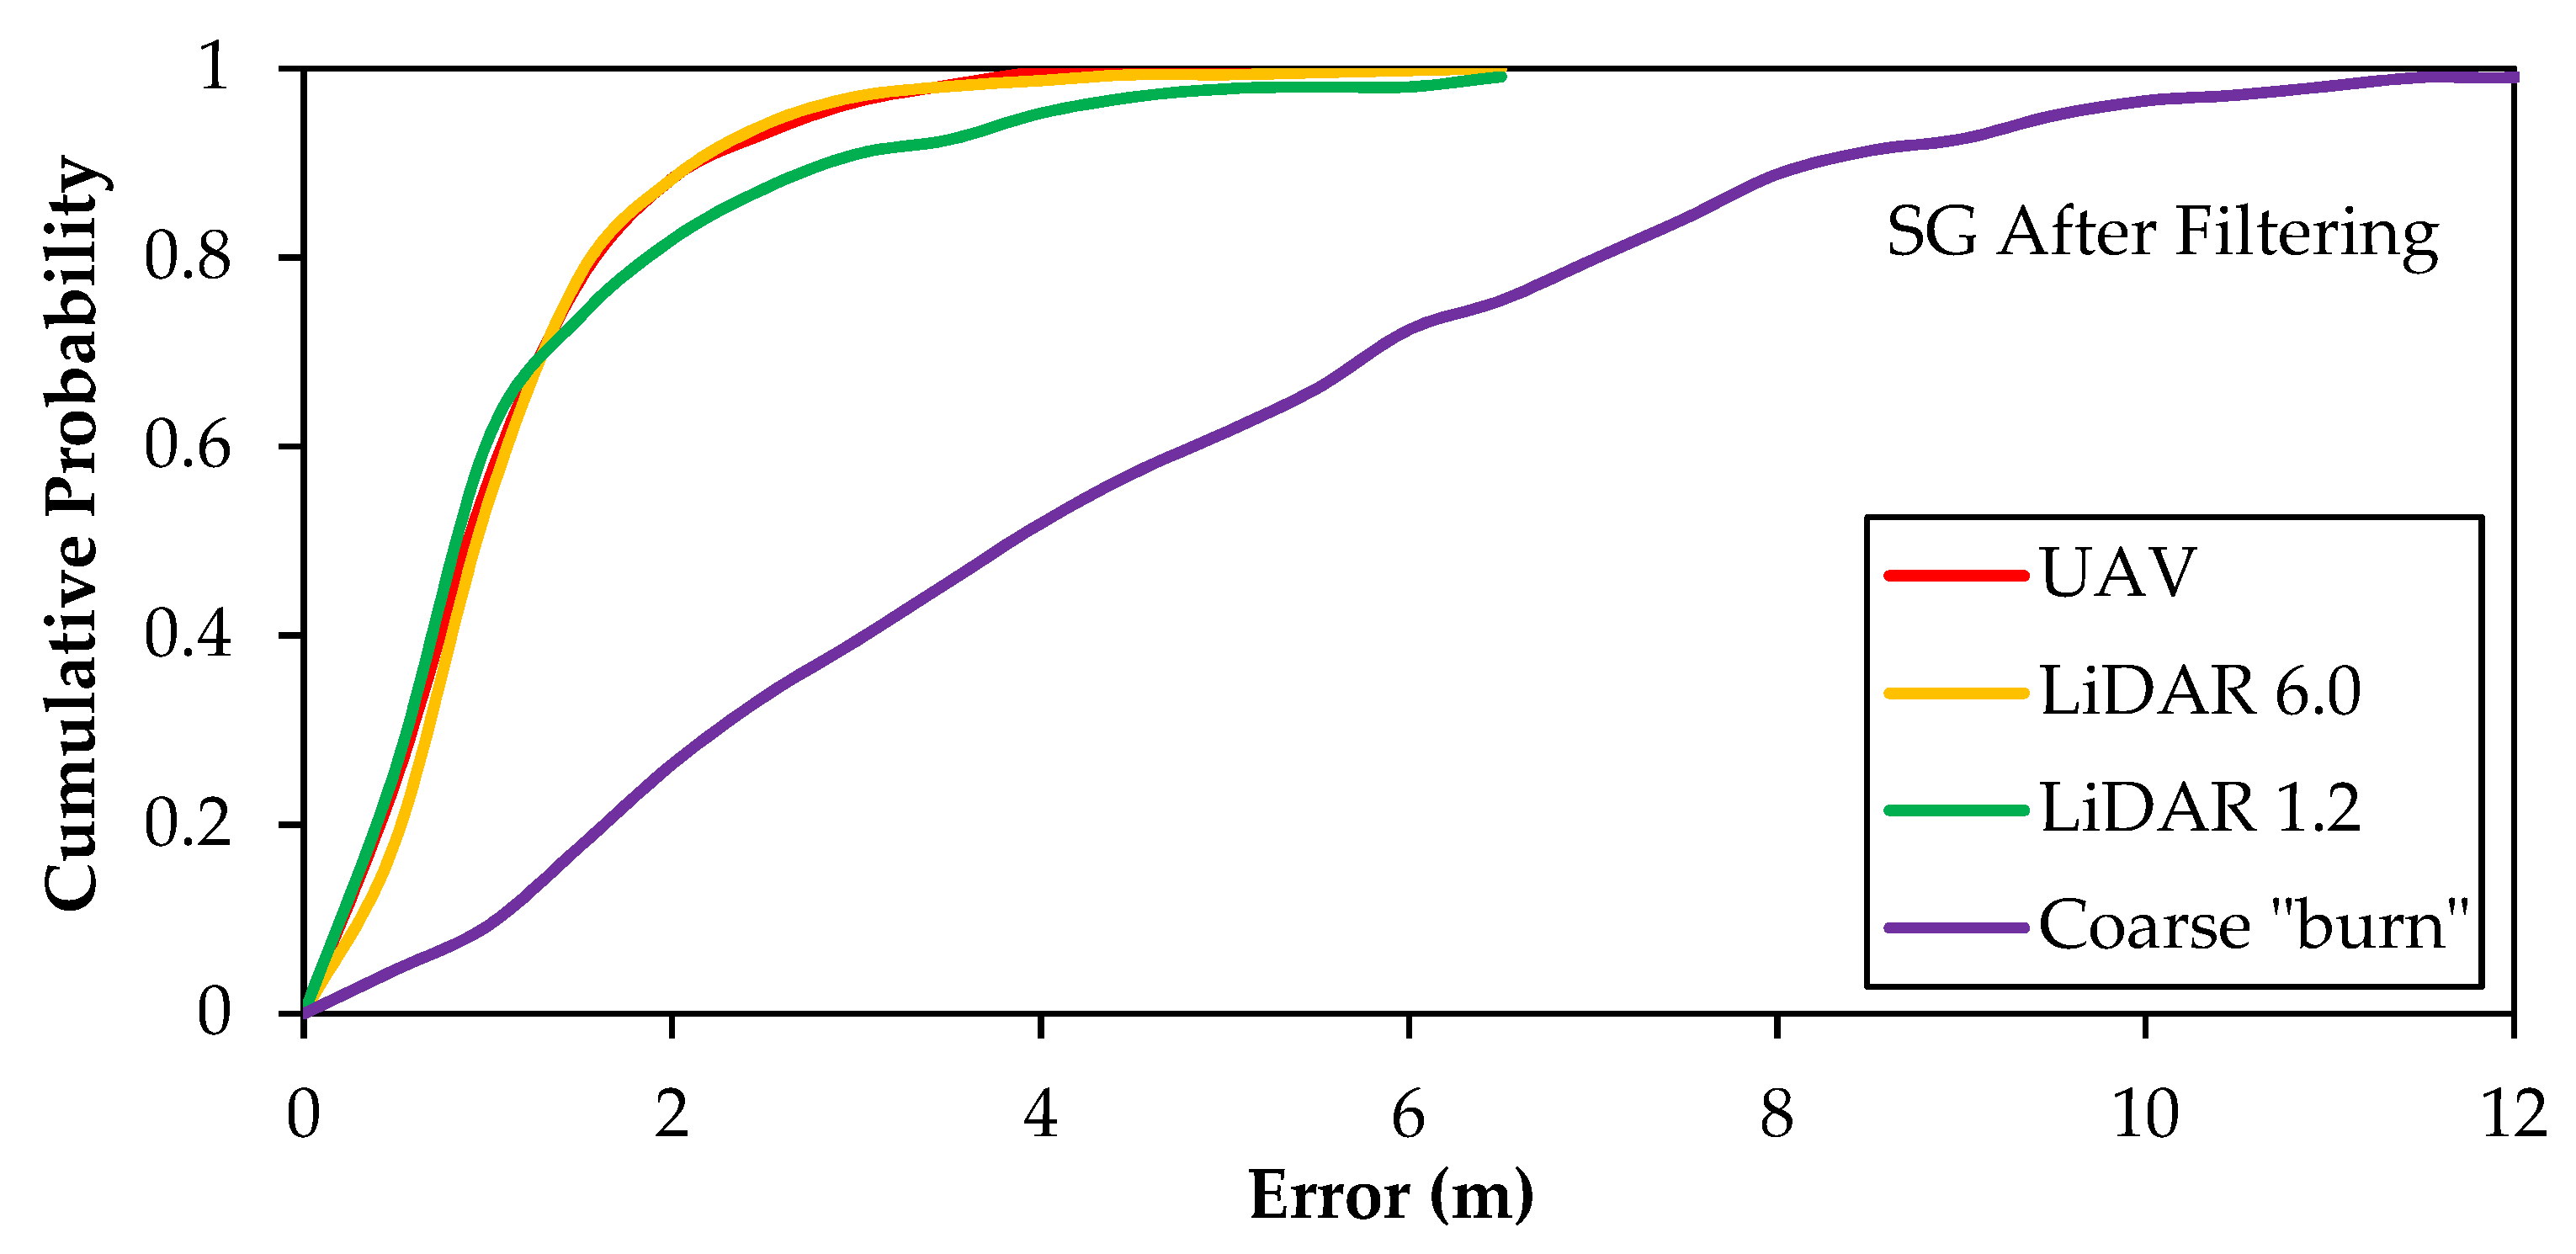
The cumulative probabilities (correctness) of stream channel boundary predicted after filtering are shown in Figure 7. After application of filtering, channel boundary predicted by the LiDAR 6.0-derived DEM had a probability of 88% within an error of 2 m, which represents an increase of 8% with respect to the same probability before applying the filter. A fact worth mentioning is the improvement experienced by the LiDAR 1.2-derived DEM, which was able to predict the stream bank boundary with a probability of 82% within an error of 2 m. This represents an increase of 15% in accuracy with respect to the same probability prior to applying the filter. However, the percentage of improvement post applying the filter did not change substantially for the UAV-derived DEM compared to LiDAR, since the filter did not increase the accuracy significantly.
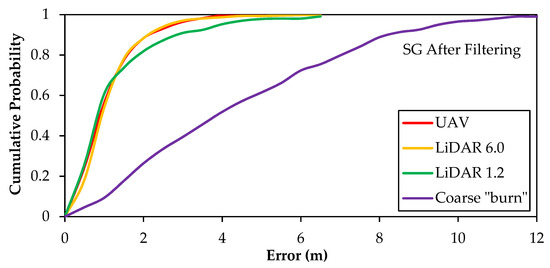
Figure 7.
Receiver Operating Characteristic (ROC) curves representing cumulative probability of the Slope Gradient in predicting stream channel associated to error (m) after filtering.
Mean relative errors (MRE) and Kling-Gupta efficiencies (KGE) regarding the stream bank prediction for each DEM can be seen in Table 1. As shown, the coarse DEM registered the highest mean relative error (0.50) of all the topographic models used, and predicted the stream bank boundary with the lowest KG efficiency of only 34%. These results agree with the MSE values obtained previously, due to the low resolution of this elevation model. Among the high-resolution DEMs, the UAV-derived DEM predicted the stream bank boundary with an efficiency of 82%, followed by LiDAR 6.0 (KGE = 70%), prior to applying the filter. The LiDAR 1.2 was able to predict the stream bank boundary with an accuracy of 67% before applying the filter.

Table 1.
Mean Squared Errors (MSE), Mean Relative Errors (MRE) and Kling-Gupta Efficiencies (KGE) before filtering (BF) and after filtering (AF) for each DEM; (N/A = not applicable).
The KG efficiencies improved significantly after applying the Region Group filter. When the LiDAR 1.2 was used as a source the KGE value increased by 13%, from 67% to 80%, which reduced the MRE error by, practically, 0.1 units. A similar trend was observed in the LiDAR 6.0, where the KGE increased by 15%, from 70% to 85%. In this case, the MRE was reduced from 0.24 to 0.15 post applying the filter. The changes observed for the UAV-derived DEM were not as significant, and the MRE value was reduced from 0.17 to 0.14 post filtering. Nonetheless, the KGE achieved the highest precision among the high-resolution DEMs with 86%.
3.3. Stream Channel Boundaries Prediction by Vertical Slope Position (VSP)
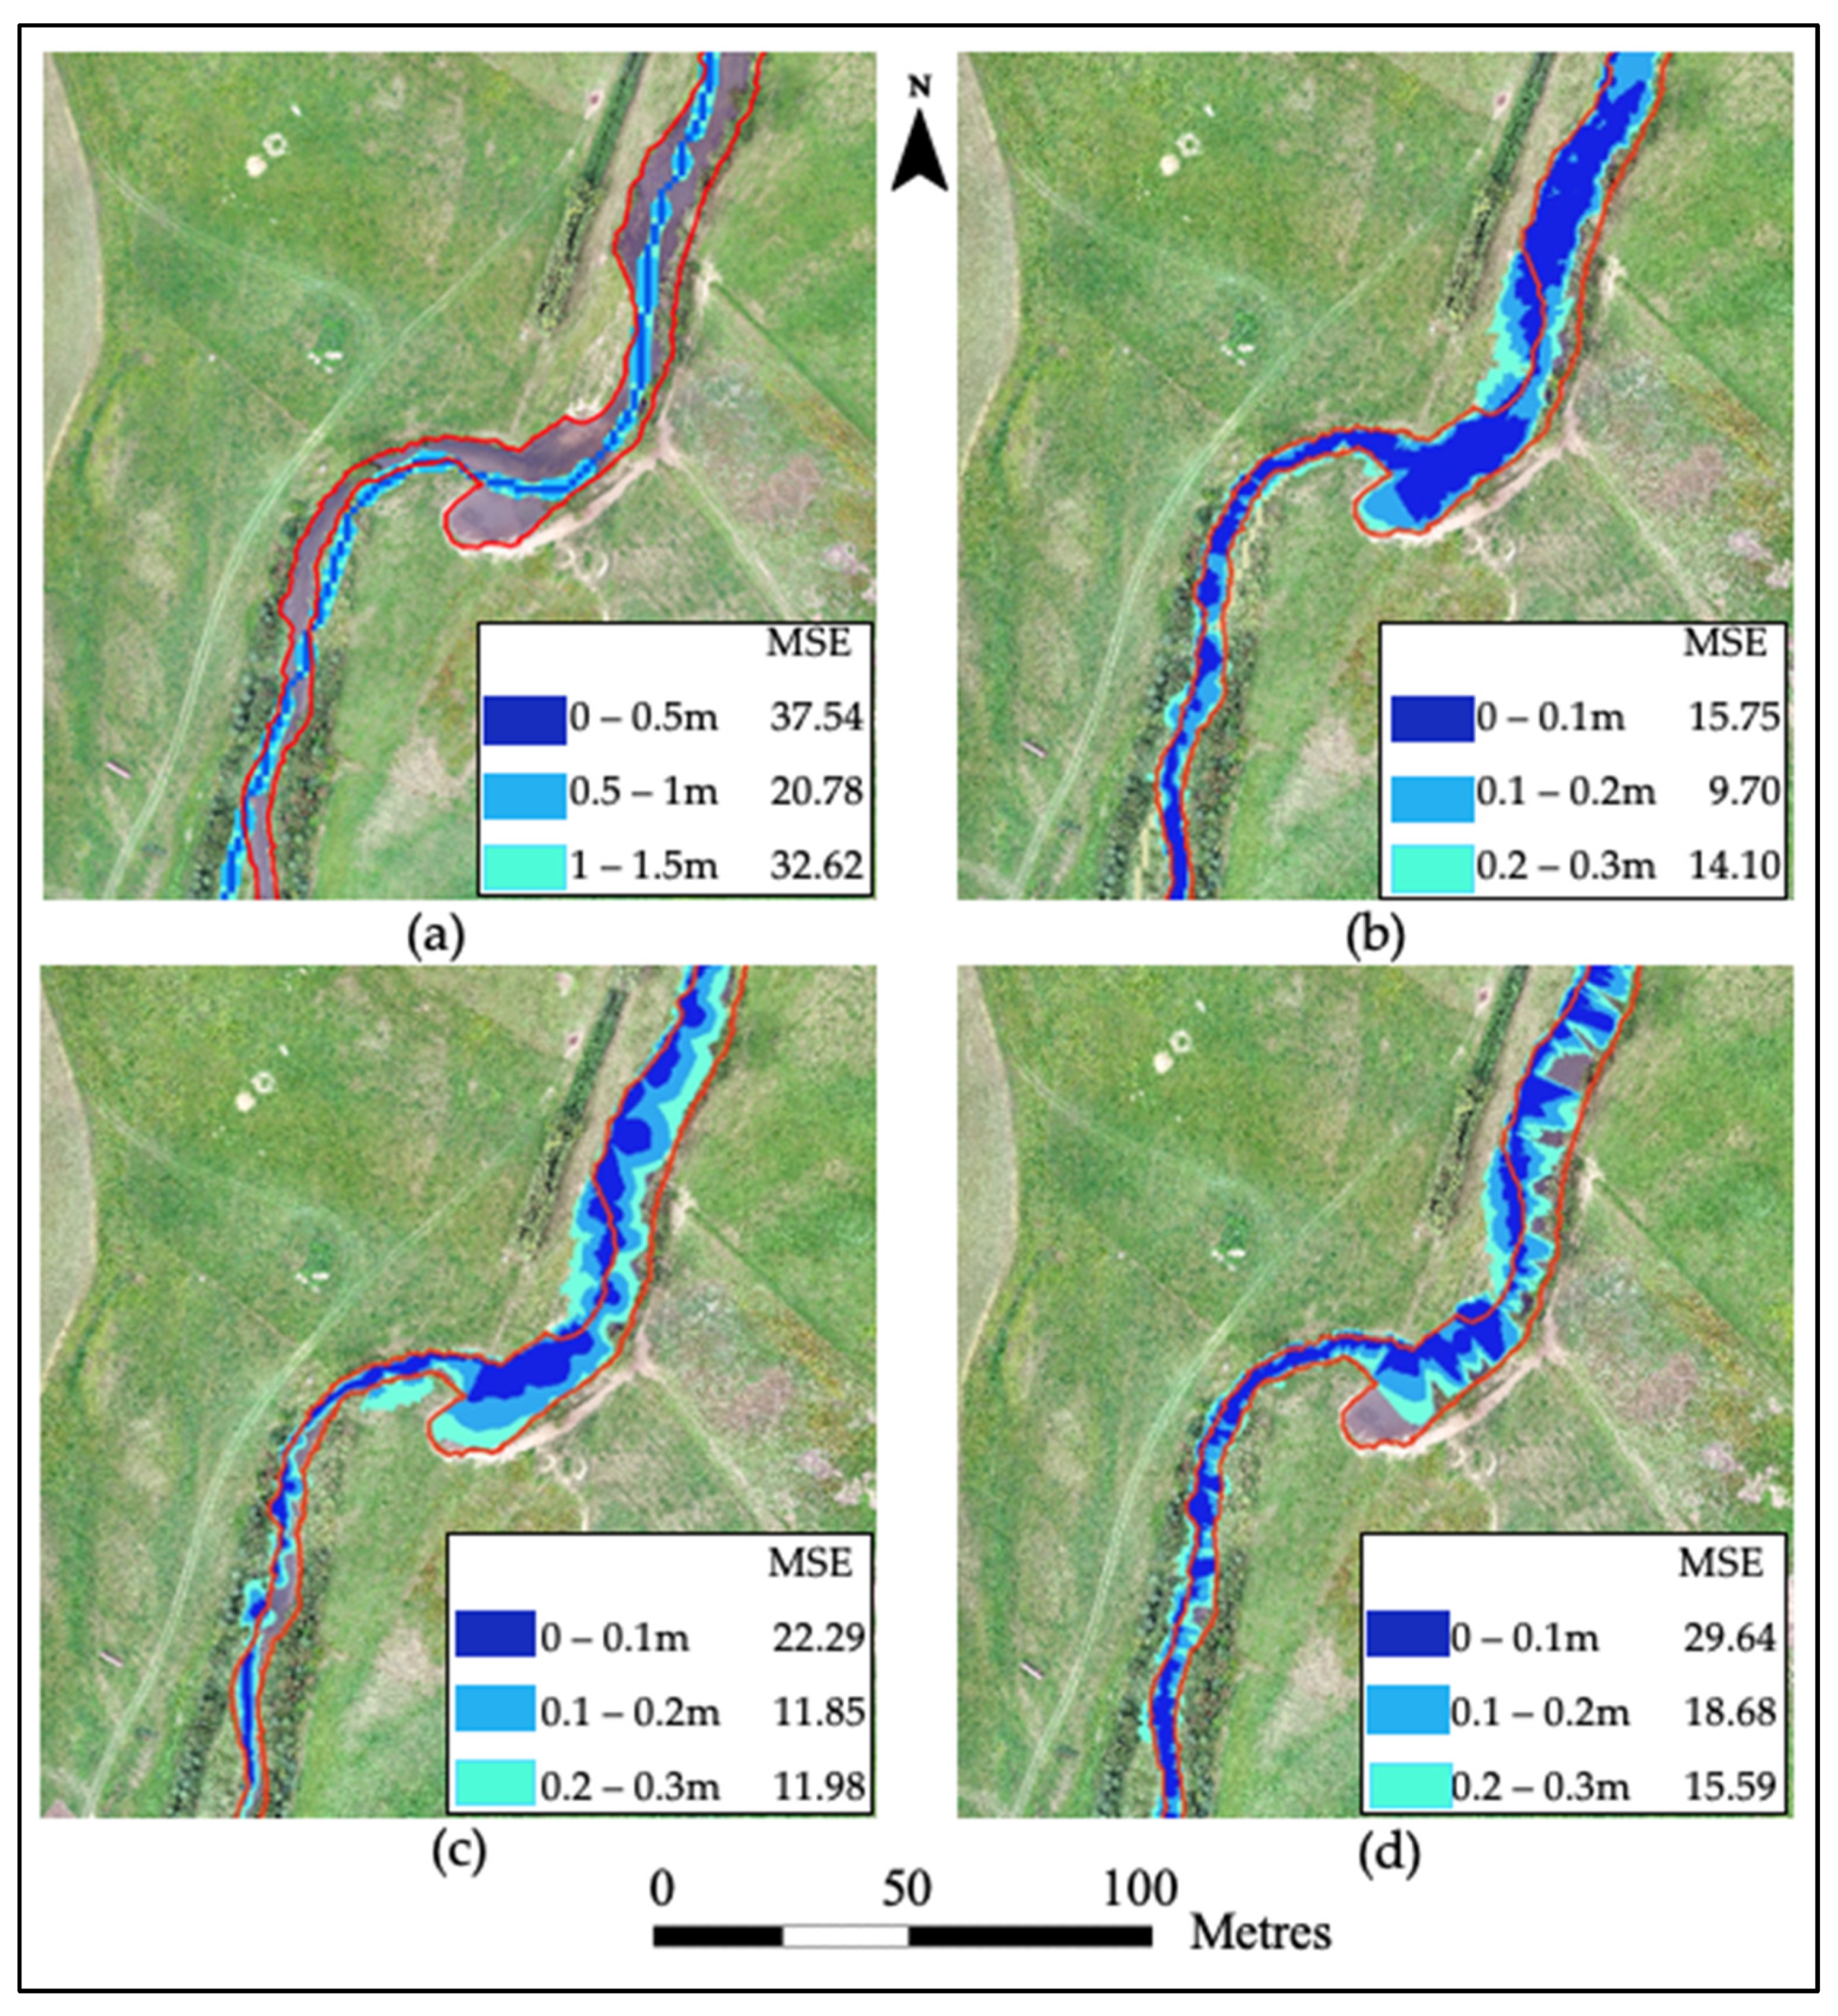
The stream channel, classified with the VSP thresholds method, is shown in Figure 8. With VSP = 0.2 m threshold, the MSE between predicted and actual stream channel was 9.70 for LiDAR 1.2, which was the optimal threshold for this dataset. With the same VSP threshold, the MSE was 11.85 for LiDAR 6.0 and 18.68 for the UAV-derived DEM. The optimal threshold for LiDAR 6.0 and UAV was 0.25 m with MSE = 11.45 and MSE = 15.12, respectively. For the coarse resolution DEM, MSE was 20.78 using 1.0 m as optimal classification threshold and 32.62 with 1.5 m as threshold classifier.
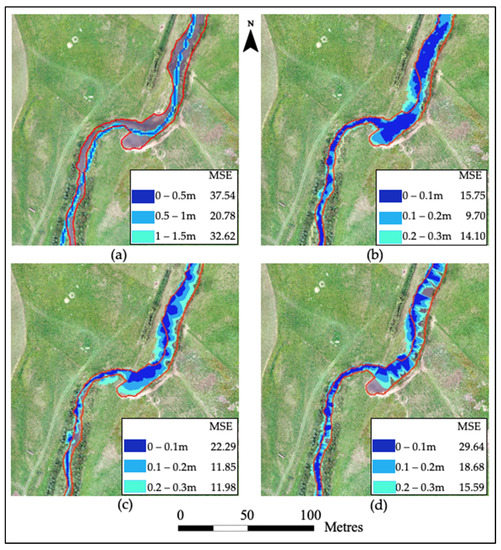
Figure 8.
Results for the VSP thresholds tested in order to predict the channel surface overlayed on a UAV image using (a) Coarse DEM; (b) LiDAR 1.2; (c) LiDAR 6.0 and (d) UAV with the corresponding mean squared errors (MSE) in meters. In red lines, the field-validated stream bank location.
In general, predicted errors measured with MSE were substantially higher than that of the Slope Gradient method for all high-resolution DEM sources (9.70 to 15.12 compared to 1.81 to 3.33). Nonetheless, the results for the coarse-resolution DEM improved when the VSP method was applied (from 26.76 to 20.78). With the Slope Gradient method, the UAV-derived DEM produced the best results, followed by LiDAR 6.0 and LiDAR 1.2. However, with the VSP method the LiDAR 1.2 DEM performed the best, followed by the LiDAR 6.0 and UAV-derived DEMs. A related point to consider is the MSE obtained for the coarse DEM was fairly close to the performance of the UAV-derived DEM. This result indicated that the VSP method is not as sensitive to DEM accuracy and resolution compared to the Slope Gradient method. Based on the visual assessment of the image (Figure 8), the coarse DEM appeared to be more accurate over the narrow section of the stream than in the wider section without dense vegetation cover along the stream bank (Figure 8a). Similar performance was observed when the UAV-derived DEM was used as a source, where higher discrepancies were observed in areas with open water sections of the stream (Figure 8d).
As reflected by MSE values, LiDAR 1.2 provided high agreement with the VSP method and was able to predict the area occupied by the stream channel better than LiDAR 6.0. This was especially true in the narrowest section of the stream, located at the bottom section of Figure 8b. We also noticed that with the VSP method, the UAV-derived, DEM-predicted stream channels did not agree with the field survey, and this was especially true in the widest section of the stream channel. This is likely due to DEM errors caused by light reflection of water surfaces due to the lack of high vegetation coverage on the stream bank (Figure 8d).
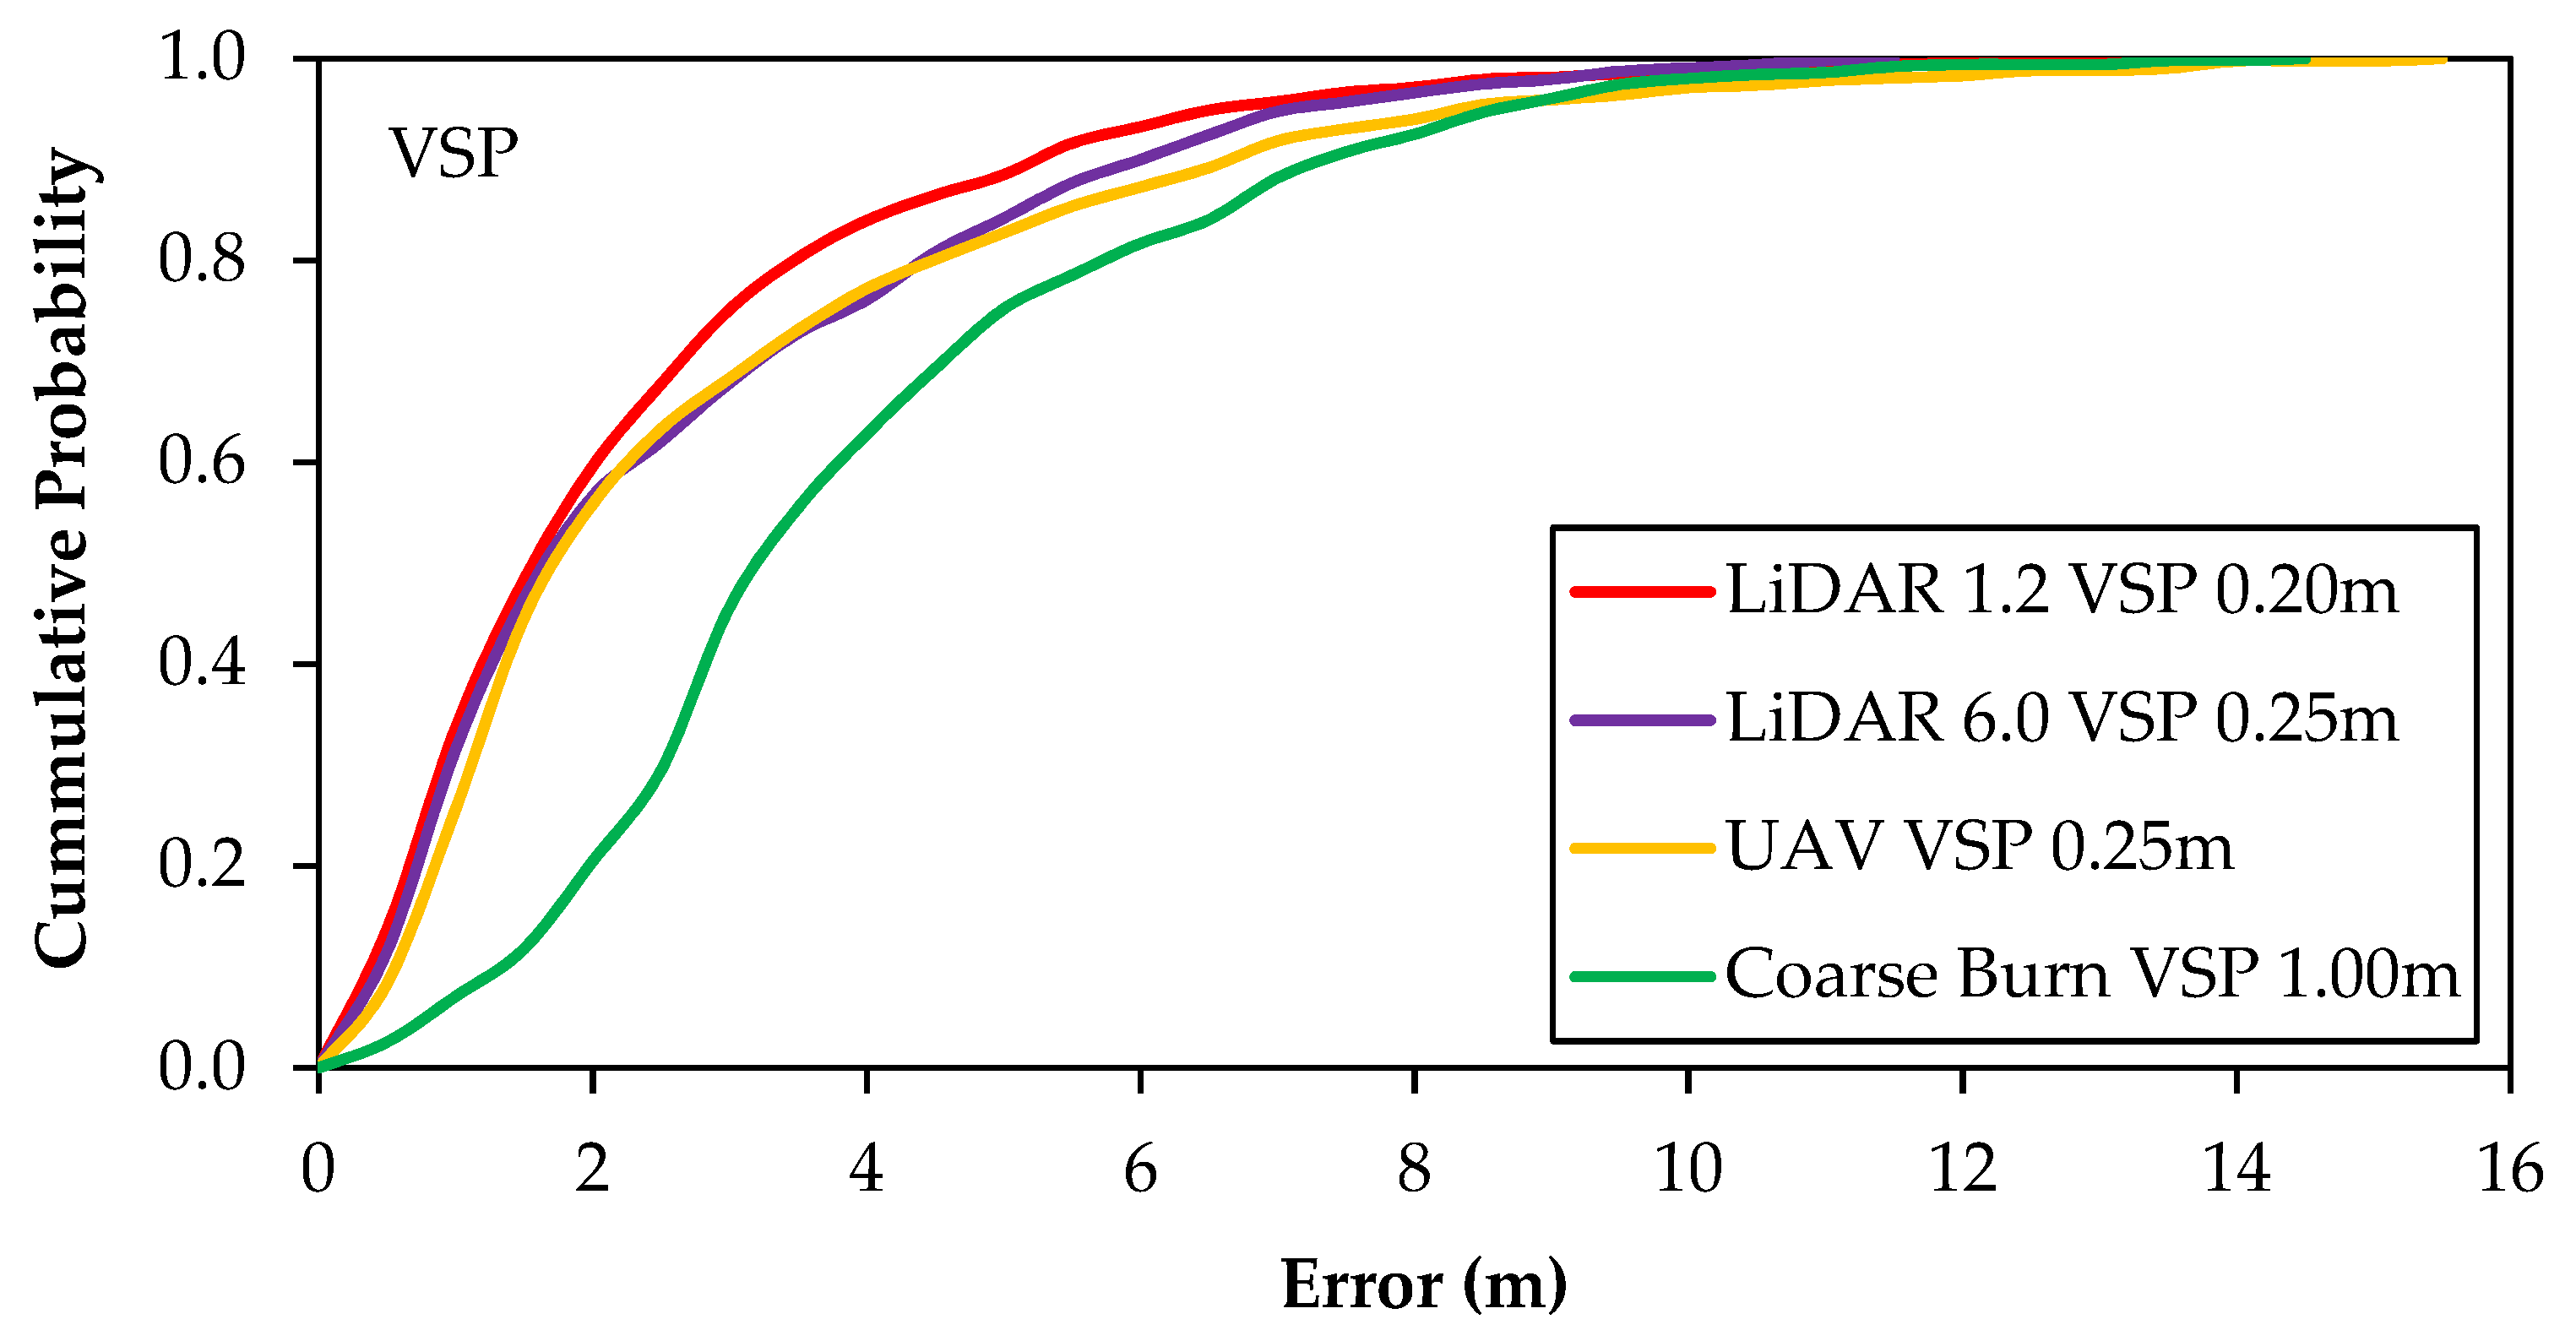
Receiver Operating Characteristic curves also confirmed that the VSP did not perform as accurate as the SG when high resolution DEMs were used as a source (Figure 9). As shown, the LiDAR 1.2 provided the most reliable estimation and was able to predict the channel surface with 60% agreement within an error of 2 m. When the LiDAR 6.0 was used as a source the probability of defining the stream bank with this topographic model was 57% within an error of 2 m. The UAV-derived DEM was able to predict the stream channel with a probability of 56% with the same reported error of 2 m. When the coarse DEM was used as a source, the probability of intersecting the stream edge was 20% within an error of 2 m.
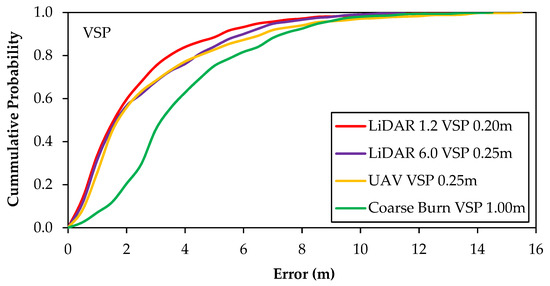
Figure 9.
Receiver Operating Characteristic (ROC) curves representing the accuracy of the optimal Vertical Slope Position (VSP) thresholds in mapping the channel surface using the following DEMs: Coarse DEM, LiDAR 1.2, LiDAR 6.0 and UAV.
Results for the MRE and KGE for each of the VSP thresholds tested for each DEM can be seen in Table 2. As shown, the coarse DEM was unable to precisely detect the stream bank’s location. When this topographic model was used as a source, the boundaries of the stream were predicted with an accuracy of 28% using 1 m as a VSP threshold. The MRE for this cut-off point was remarkably high, at 0.45.

Table 2.
Mean Squared Errors (MSE), Mean Relative Errors (MRE) and Kling-Gupta Efficiencies (KGE) for each VSP threshold tested; (N/A = not applicable).
Among the high-resolution DEMs, LiDAR 1.2 was able to predict the stream bank with higher precision, followed by the LiDAR 6.0- and UAV-derived DEMs. When the LiDAR 1.2 was used, the VSP predicted the location of this parameter with a precision of 67% when the VSP threshold used was 0.20 m. When LiDAR 6.0 was used, the optimal efficiency (63%) was registered with a threshold of 0.25 m of depth. With this breakpoint, the boundaries of the stream bank were predicted within an error of 0.29 when this DEM was used as a source. Finally, the same threshold proved optimal for the UAV-derived DEM and was able to predict the stream bank’s location with an accuracy of 53%.
4. Discussion
4.1. Slope Gradient Method
Based on the results obtained, the Slope Gradient derived from the coarse DEM did not provide accurate results when predicting the stream’s boundaries. This can be explained by the significantly lower number of points recorded in this dataset used to derive the DEM (Figure 5) compared to higher-resolution DEMs. This reflects its inability to locally adjust the grid size to the dimensions of the topographic land surface features and resulted in its unsuitability for the parameterization of precise drainage features, a situation exacerbated in low relief landscapes [75]. The absolute elevation accuracy of this provincial topographic model was reported to be 2.5 m, which makes it unable to accurately represent average elevation change per pixel [37,76].
Conversely, the UAV achieved the highest accuracy of all data sources, followed by high-resolution LiDAR 6.0 and LiDAR 1.2. This is likely due to the higher point cloud density generating a more precise topographic model (DEM). Furthermore, the UAV-derived DEM was obtained during the leaf-off conditions and snow-flattened stream bank vegetation, which could potentially increase the precision. Additionally, due to more sunlight penetrating these vegetated areas, the land/water boundaries were particularly discernible and represented this edge accurately. This result indicated that the accuracy of the Slope Gradient method to identify the stream channel is highly dependent on the DEM’s resolution and accuracy; this is in agreement with results reported by previous researchers [27,77,78,79]. In general, these studies found that higher-quality vertical information resulted in appreciable improvements in the smooth representation of subtle topographic surfaces, more precise delineations of hydrologically relevant parameters and more appropriate model outputs. The findings of this study provide evidence that UAVs can be applied to monitor stream bank shift, erosion and sedimentation processes over time. It could be used as a suitable means to address the limitations of field-based approaches (resource constraints and land-access restrictions) for stream bank assessments [64,80,81].
We observed that LiDAR (both 1.2 and 6.0) tended to overestimate the stream bank location in areas, partially those covered by high vegetation. This is likely caused by insufficient ground elevation points due to vegetation coverage. On the other hand, the stream edge was slightly underestimated in areas covered by herbaceous species. This can be explained by the season when LiDAR was acquired; LiDAR sources were acquired in summer during leaf-on conditions, when the stream’s herbaceous vegetation was denser and taller compared with early spring. Therefore, LiDAR-derived DEMs performed slightly less accurately in detecting exact land/water boundaries.
4.2. Vertical Slope Position Method
Similar to the Slope Gradient method, the coarse DEM acquired with traditional aerial photographs did not perform as precisely when predicting the stream’s boundaries compared to higher-resolution sources used. This is likely due to the lack of topographic detail (Figure 5a). However, VSP-predicted stream channels were substantially more accurate than the Slope Gradient method, with MSE = 20.78 vs. 26.76 m. We observed that the accuracy of the VSP method decreased dramatically for all higher-quality DEMs, from LiDAR 1.2 to UAV-derived DEMs. These results seem to agree with the findings reported in previous studies; very high-resolution DEMs may also become inappropriate for groundwater flow predictions [82,83]. Groundwater paths are assumed to follow more general landscape topographies rather than small-scale surface variations. Thus, smoother topography represented in LiDAR 1.2 performed better to represent near-surface flow pathways and water table positions [84,85].
The VSP method with the UAV-derived DEM as data source performed better over the bioengineered buffer but failed to predict the correct stream boundary in sections with wider channels. These mismatches can be caused by two factors: (i) mapping the stream in areas partially covered by the canopy proved the main disadvantage of photogrammetry, since the camera could not penetrate the dense canopy and would not detect the ground surface elevation [86,87]. As a consequence, these canopy-shaded areas would have either unprecise elevation estimations or would have been classified as areas with missing data. This would lead to a significant reduction of data point information in these specific areas. Thus, the photogrammetric software was unable to create sufficient terrain points in these particular areas and became less accurate when interpolating the DEM, as reported by previous studies [64,81,88]. Secondly, (ii) imagery acquired during daylight hours led to some distortion when flying the UAV over water surfaces, since water has a tendency to selectively reflect, refract or absorb light. This would increase the noise in the section of open water. As a result of these low-quality photogrammetry sections, the stream channel became significantly more distorted and uneven.
5. Conclusions
This study assessed the feasibility of using a UAV to map the stream geomorphology and stream banks over an agricultural watershed. The accuracy of the UAV-derived DEM was also compared with other commonly used DEMs including high-density LiDAR, low-density LiDAR and traditional high-altitude, orthophoto-derived coarse-resolution DEM. Two methods were used to predict stream channel surface areas, namely the Slope Gradient and Vertical Slope Position methods.
When the Slope Gradient method was used, the UAV-derived DEM achieved the highest accuracy in the mapping of the stream channel and defining the stream bank locations, with a MSE of 2.33 m (KGE = 82%), followed by LiDAR 6.0 (MSE = 5.27 and KGE = 70%) and LiDAR 1.2 (MSE = 7.87 m and KGE = 67%). The coarse-resolution DEM was unable to accurately predict this parameter and the error was significantly higher, at MSE = 26.76 m (KGE = 34%). The application of a filtering method to post-process the classified topographic model could significantly improve the prediction accuracy for LiDAR-based DEMs. The value of the MSE reduced from 7.87 to 3.33 (KGE = 80%) for LiDAR 1.2, and from 5.27 to 1.91 (KGE = 85%) for LiDAR 6.0. The value of MSE for the UAV-derived DEM was modestly reduced from 2.33 to 1.81 (KGE = 86%).
We found that the VSP method performed comparably with the Slope Gradient method in the mapping of the stream channel and determining the bank locations. Interestingly, we observed a decrease in accuracy among the higher-resolution DEMs tested. The LiDAR 1.2 was able to predict the stream bank with a MSE of 9.70 m (KGE = 67%), followed by LiDAR 6.0 (MSE = 11.45 and KGE = 64%) and UAV-derived DEM (MSE = 15.12 and KGE = 53%). Similar to the Slope Gradient, the coarse-resolution DEM was unable to predict the stream boundaries and the MSE was 20.78 m (KGE = 28%).
The present work indicated that a UAV-derived DEM could be used to predict bank slope positions using the Slope Gradient as classifier for lower-order streams, with higher accuracy than airborne high point cloud density LiDAR. As opposed to LiDAR, UAVs have the capability of accurately defining the matrix of this ecosystem, from water surface, stream bank, riparian zone and uplands. However, highly densely vegetated areas could lead to errors due to the limitations of the photogrammetry method of the UAV in detecting bare ground under dense canopy.
Author Contributions
Conceptualization, J.G., F.-R.M. and K.L.; methodology, F.-R.M. and J.G.; software, J.O.; validation, J.G.; formal analysis, J.G. and K.L.; investigation, J.G.; resources, B.R.; data curation, F.-R.M. and S.L.; writing—original draft preparation, J.G.; writing—review and editing, K.L. and B.R.; visualization, S.L.; supervision, F.-R.M., S.L. and P.A.; project administration, B.R.; funding acquisition, B.R. and F.-R.M. All authors have read and agreed to the published version of the manuscript.
Funding
This research was funded by Agriculture and Agri-Food Canada (AAFC).
Institutional Review Board Statement
Not applicable.
Informed Consent Statement
Informed consent was obtained from Amalia David and Robert Hicks, since the research was undergone over substantial part of their owned property.
Data Availability Statement
The raw/processed data required to reproduce these findings cannot be shared at this time as the data is also part of an ongoing study.
Acknowledgments
This study was funded by Agriculture and Agri-Food Canada. The first author is grateful for the financial support provided by the Fredericton Research and Development Centre (FRDC) in New Brunswick. Special thanks are given to Louis-Pierre Comeau, Amalia David, and Robert Hicks, farm crews, and summer student Madisyn Harper for their dedicated field/lab assistance.
Conflicts of Interest
The authors declare no conflict of interest.
References
- Forman, R. Changing mosaics. In Land Mosaics: The Ecology of Landscapes and Regions; Cambridge University Press: Cambridge, UK, 1995. [Google Scholar]
- Wipfli, M.S. Terrestrial invertebrates as salmonid prey and nitrogen sources in streams: Contrasting old-growth and young-growth riparian forests in southeastern Alaska, USA. Can. J. Fish. Aquat. Sci. 1997, 54, 1259–1269. [Google Scholar] [CrossRef]
- Naiman, R.J.; Steel, E.A.; West, S.D. Use of woody debris piles by birds and small mammals in a riparian corridor. Northwest Sci. 1999, 73, 1. [Google Scholar]
- Osbourne, J.D.; Anderson, J.T.; Spurgeon, A.B. Effects of habitat on small—Mammal diversity and abundance in West Virginia. Wildl. Soc. Bull. 2005, 33, 814–822. [Google Scholar] [CrossRef]
- Peak, R.G.; Thompson, F.R., III. Factors affecting avian species richness and density in riparian areas. J. Wildl. Manag. 2006, 70, 173–179. [Google Scholar] [CrossRef]
- Rykken, J.J.; Moldenke, A.R.; Olson, D.H. Headwater riparian forest—Floor invertebrate communities associated with alternative forest management practices. Ecol. Appl. 2007, 17, 1168–1183. [Google Scholar] [CrossRef]
- Lanini, J.; Sridhar, V.; Sansone, A.L.; LaMarche, J.; Lettenmaier, D.P. Reply to Discussion by John D. Fox, Jr. 1: “Prediction of Stream Temperature in Forested Watersheds” 2. JAWRA J. Am. Water Resour. Assoc. 2004, 40, 1661–1662. [Google Scholar] [CrossRef]
- Caissie, D. The thermal regime of rivers: A review. Freshw. Biol. 2006, 51, 1389–1406. [Google Scholar] [CrossRef]
- Garner, G.; Malcolm, I.A.; Sadler, J.P.; Hannah, D.M. What causes cooling water temperature gradients in a forested stream reach? Hydrol. Earth Syst. Sci. 2014, 18, 5361–5376. [Google Scholar] [CrossRef] [Green Version]
- Kalny, G.; Laaha, G.; Melcher, A.; Trimmel, H.; Weihs, P.; Rauch, H.P. The influence of riparian vegetation shading on water temperature during low flow conditions in a medium sized river. Knowl. Manag. Aquat. Ecosyst. 2017, 418, 5. [Google Scholar] [CrossRef] [Green Version]
- Bohn, C. Biological importance of streambank stability. Rangel. Arch. 1986, 8, 55–56. [Google Scholar]
- Johansen, K.; Grove, J.; Denham, R.; Phinn, S.R. Assessing stream bank condition using airborne LiDAR and high spatial resolution image data in temperate semirural areas in Victoria, Australia. J. Appl. Remote Sens. 2013, 7, 073492. [Google Scholar] [CrossRef] [Green Version]
- Tufekcioglu, M.; Schultz, R.C.; Isenhart, T.M.; Kovar, J.L.; Russell, J.R. Riparian land-use, stream morphology and streambank erosion within grazed pastures in Southern Iowa, USA: A catchment-wide perspective. Sustainability 2020, 12, 6461. [Google Scholar] [CrossRef]
- Biedenharn, D.S.; Copeland, R.R.; Thorne, C.R.; Soar, P.J.; Hey, R.D.; Watson, C.C. Effective Discharge Calculation: A Practical Guide; Engineer Research and Development Center: Vicksburg, MS, USA, 2000. [Google Scholar]
- Loučková, B. Vegetation–landform assemblages along selected rivers in the Czech Republic, a decade after a 500-year flood event. River Res. Appl. 2012, 28, 1275–1288. [Google Scholar] [CrossRef]
- Tabacchi, E.; Lambs, L.; Guilloy, H.; Planty-Tabacchi, A.M.; Muller, E.; Decamps, H. Impacts of riparian vegetation on hydrological processes. Hydrol. Process. 2000, 14, 2959–2976. [Google Scholar] [CrossRef]
- Forzieri, G.; Castelli, F.; Preti, F. Advances in remote sensing of hydraulic roughness. Int. J. Remote Sens. 2012, 33, 630–654. [Google Scholar] [CrossRef]
- Apollonio, C.; Petroselli, A.; Cornelini, P.; Manzari, V.; Preti, F.; Grimaldi, S. Riparian vegetation as a marker for bankfull and management discharge evaluation: The case study of Rio Torbido river basin (central Italy). J. Agric. Eng. 2021, 52, 2. [Google Scholar]
- Evans, D.; Gibson, C.; Rossell, R. Sediment loads and sources in heavily modified Irish catchments: A move towards informed management strategies. Geomorphology 2006, 79, 93–113. [Google Scholar] [CrossRef]
- Magner, J.A.; Vondracek, B.; Brooks, K.N. Grazed riparian management and stream channel response in southeastern Minnesota (USA) streams. Environ. Manag. 2008, 42, 377–390. [Google Scholar] [CrossRef] [Green Version]
- Zaimes, G.N.; Tufekcioglu, M.; Schultz, R.C. Riparian land-use impacts on stream bank and gully erosion in agricultural watersheds: What we have learned. Water 2019, 11, 1343. [Google Scholar] [CrossRef] [Green Version]
- Morisawa, M. Accuracy of determination of stream lengths from topographic maps. Eos Trans. Am. Geophys. Union 1957, 38, 86–88. [Google Scholar] [CrossRef]
- Chorley, R.; Dale, P. Cartographic problems in stream channel delineation. Cartography 1972, 7, 150–162. [Google Scholar] [CrossRef]
- Scannavino, J.; Perez-Kuroki, A.; Ghobakhlou, A.; Sallis, P.; Shanmuganathan, S.; Cruvinel, P. Spatial variability on soil pH gradient: A case study in vineyards. In Proceedings of the 19th International Congress on Modelling and Simulation (MODSIM2011), Perth, Australia, 12–16 September 2011. [Google Scholar]
- Woodrow, K.; Lindsay, J.B.; Berg, A.A. Evaluating DEM conditioning techniques, elevation source data, and grid resolution for field-scale hydrological parameter extraction. J. Hydrol. 2016, 540, 1022–1029. [Google Scholar] [CrossRef]
- Garbrech, J.; Mart, L. Grid size dependency of parameters extracted. Comput. Geosci. 1994, 20, 85–87. [Google Scholar] [CrossRef]
- Zhang, W.; Montgomery, D.R. Digital elevation model grid size, landscape representation, and hydrologic simulations. Water Resour. Res. 1994, 30, 1019–1028. [Google Scholar] [CrossRef]
- Dietrich, W.E.; Reiss, R.; Hsu, M.L.; Montgomery, D.R. A process-based model for colluvial soil depth and shallow landsliding using digital elevation data. Hydrol. Process. 1995, 9, 383–400. [Google Scholar] [CrossRef]
- Hengl, T. Finding the right pixel size. Comput. Geosci. 2006, 32, 1283–1298. [Google Scholar] [CrossRef]
- Sørensen, R.; Seibert, J. Effects of DEM resolution on the calculation of topographical indices: TWI and its components. J. Hydrol. 2007, 347, 79–89. [Google Scholar] [CrossRef]
- Smart, R.; Soulsby, C.; Cresser, M.; Wade, A.; Townend, J.; Billett, M.; Langan, S. Riparian zone influence on stream water chemistry at different spatial scales: A GIS-based modelling approach, an example for the Dee, NE Scotland. Sci. Total Environ. 2001, 280, 173–193. [Google Scholar] [CrossRef]
- Abood, S.A.; Maclean, A.L.; Mason, L.A. Modeling riparian zones utilizing DEMS and flood height data. Photogramm. Eng. Remote Sens. 2012, 78, 259–269. [Google Scholar] [CrossRef]
- Fernández, D.; Barquín, J.; Álvarez-Cabria, M.; Peñas, F. Quantifying the performance of automated GIS-based geomorphological approaches for riparian zone delineation using digital elevation models. Hydrol. Earth Syst. Sci. 2012, 16, 3851–3862. [Google Scholar] [CrossRef] [Green Version]
- Lane, S.; Reaney, S.; Heathwaite, A.L. Representation of landscape hydrological connectivity using a topographically driven surface flow index. Water Resour. Res. 2009, 45. [Google Scholar] [CrossRef] [Green Version]
- Buchanan, B.; Falbo, K.; Schneider, R.; Easton, Z.; Walter, M. Hydrological impact of roadside ditches in an agricultural watershed in Central New York: Implications for non-point source pollutant transport. Hydrol. Process. 2013, 27, 2422–2437. [Google Scholar] [CrossRef]
- Thomas, I.; Jordan, P.; Shine, O.; Fenton, O.; Mellander, P.-E.; Dunlop, P.; Murphy, P.N. Defining optimal DEM resolutions and point densities for modelling hydrologically sensitive areas in agricultural catchments dominated by microtopography. Int. J. Appl. Earth Obs. Geoinf. 2017, 54, 38–52. [Google Scholar] [CrossRef] [Green Version]
- Murphy, P.; Ogilvie, J.; Arp, P. Topographic modelling of soil moisture conditions: A comparison and verification of two models. Eur. J. Soil Sci. 2009, 60, 94–109. [Google Scholar] [CrossRef]
- Doody, D.; Archbold, M.; Foy, R.; Flynn, R. Approaches to the implementation of the Water Framework Directive: Targeting mitigation measures at critical source areas of diffuse phosphorus in Irish catchments. J. Environ. Manag. 2012, 93, 225–234. [Google Scholar] [CrossRef]
- Haupt, S.E.; Pasini, A.; Marzban, C. Artificial Intelligence Methods in the Environmental Sciences; Springer Science & Business Media: Berlin/Heidelberg, Germany, 2008. [Google Scholar]
- Hsieh, W.W. Machine Learning Methods in the Environmental Sciences: Neural Networks and Kernels; Cambridge University Press: Cambridge, UK, 2009. [Google Scholar]
- Thessen, A. Adoption of machine learning techniques in ecology and earth science. One Ecosyst. 2016, 1, e8621. [Google Scholar] [CrossRef]
- Islam, A.R.M.T.; Talukdar, S.; Mahato, S.; Ziaul, S.; Eibek, K.U.; Akhter, S.; Pham, Q.B.; Mohammadi, B.; Karimi, F.; Linh, N.T.T. Machine learning algorithm-based risk assessment of riparian wetlands in Padma River Basin of Northwest Bangladesh. Environ. Sci. Pollut. Res. 2021, 28, 34450–34471. [Google Scholar] [CrossRef]
- Martínez-Santos, P.; Aristizábal, H.; Díaz-Alcaide, S.; Gómez-Escalonilla, V. Predictive mapping of aquatic ecosystems by means of support vector machines and random forests. J. Hydrol. 2021, 595, 126026. [Google Scholar] [CrossRef]
- Fonstad, M.A.; Dietrich, J.T.; Courville, B.C.; Jensen, J.L.; Carbonneau, P.E. Topographic structure from motion: A new development in photogrammetric measurement. Earth Surf. Process. Landf. 2013, 38, 421–430. [Google Scholar] [CrossRef] [Green Version]
- Escobar Villanueva, J.R.; Iglesias Martínez, L.; Pérez Montiel, J.I. DEM generation from fixed-wing UAV imaging and LiDAR-derived ground control points for flood estimations. Sensors 2019, 19, 3205. [Google Scholar] [CrossRef] [Green Version]
- Jeziorska, J. UAS for wetland mapping and hydrological modeling. Remote Sens. 2019, 11, 1997. [Google Scholar] [CrossRef] [Green Version]
- Manfreda, S.; McCabe, M.F.; Miller, P.E.; Lucas, R.; Pajuelo Madrigal, V.; Mallinis, G.; Ben Dor, E.; Helman, D.; Estes, L.; Ciraolo, G. On the use of unmanned aerial systems for environmental monitoring. Remote Sens. 2018, 10, 641. [Google Scholar] [CrossRef] [Green Version]
- Zhang, Q.; Qin, R.; Huang, X.; Fang, Y.; Liu, L. Classification of ultra-high resolution orthophotos combined with DSM using a dual morphological top hat profile. Remote Sens. 2015, 7, 16422–16440. [Google Scholar] [CrossRef] [Green Version]
- Aguilar, F.J.; Rivas, J.R.; Nemmaoui, A.; Peñalver, A.; Aguilar, M.A. UAV-based digital terrain model generation under leaf-off conditions to support teak plantations inventories in tropical dry forests. A case of the coastal region of Ecuador. Sensors 2019, 19, 1934. [Google Scholar] [CrossRef] [Green Version]
- Yao, H.; Qin, R.; Chen, X. Unmanned aerial vehicle for remote sensing applications—A review. Remote Sens. 2019, 11, 1443. [Google Scholar] [CrossRef] [Green Version]
- Schumann, G.J.-P.; Muhlhausen, J.; Andreadis, K.M. Rapid mapping of small-scale river-floodplain environments using UAV SfM supports classical theory. Remote Sens. 2019, 11, 982. [Google Scholar] [CrossRef] [Green Version]
- Chen, S.; Johnson, F.; Drummond, C.; Glamore, W. A new method to improve the accuracy of remotely sensed data for wetland water balance estimates. J. Hydrol. Reg. Stud. 2020, 29, 100689. [Google Scholar] [CrossRef]
- Lendzioch, T.; Langhammer, J.; Vlček, L.; Minařík, R. Mapping the groundwater level and soil moisture of a montane peat bog using UAV monitoring and machine learning. Remote Sens. 2021, 13, 907. [Google Scholar] [CrossRef]
- Meng, F.-R.; Castonguay, M.; Ogilvie, J.; Murphy, P.; Arp, P. Developing a GIS-based flow-channel and wet areas mapping framework for precision forestry planning. In Proceedings of the IUFRO Precision Forestry Symposium, Stellenbosch, South Africa, 5–10 March 2006; pp. 43–55. [Google Scholar]
- Cartwright, J.M.; Diehl, T.H. Automated Identification of Stream-Channel Geomorphic Features from High-Resolution Digital Elevation Models in West Tennessee Watersheds; US Geological Survey: Menlo Park, CA, USA, 2017.
- Shamshiri, R.R.; Hameed, I.A.; Balasundram, S.K.; Ahmad, D.; Weltzien, C.; Yamin, M. Fundamental research on unmanned aerial vehicles to support precision agriculture in oil palm plantations. Agric. Robots-Fundam. Appl. 2018, 91–116. [Google Scholar]
- Krisanski, S.; Taskhiri, M.S.; Turner, P. Enhancing methods for under-canopy unmanned aircraft system based photogrammetry in complex forests for tree diameter measurement. Remote Sens. 2020, 12, 1652. [Google Scholar] [CrossRef]
- Rogers, S.R.; Manning, I.; Livingstone, W. Comparing the spatial accuracy of Digital Surface Models from four unoccupied aerial systems: Photogrammetry versus LiDAR. Remote Sens. 2020, 12, 2806. [Google Scholar] [CrossRef]
- Kuželka, K.; Surový, P. Mapping forest structure using UAS inside flight capabilities. Sensors 2018, 18, 2245. [Google Scholar] [CrossRef] [PubMed] [Green Version]
- Wolf, R.; Dewitt, A. Elements of Photogrammetry with Application in GIS, 3rd ed.; The University of Wisconsin: Madison, WI, USA, 2000. [Google Scholar]
- Fabian, A.J.; Klenke, R.; Truslow, P. Improving UAV-Based Target Geolocation Accuracy through Automatic Camera Parameter Discovery. In Proceedings of the AIAA Scitech 2020 Forum, Orlando, FL, USA, 6–10 January 2020; p. 2201. [Google Scholar]
- Grau, J.; Liang, K.; Ogilvie, J.; Arp, P.; Li, S.; Robertson, B.; Meng, F.-R. Improved Accuracy of Riparian Zone Mapping Using Near Ground Unmanned Aerial Vehicle and Photogrammetry Method. Remote Sens. 2021, 13, 1997. [Google Scholar] [CrossRef]
- Poppenga, S.K.; Worstell, B.B.; Stoker, J.M.; Greenlee, S.K. Using Selective Drainage Methods to Extract Continuous Surface Flow from 1-Meter Lidar-Derived Digital Elevation Data; US Geological Survey: Menlo Park, CA, USA, 2010.
- Hashemi-Beni, L.; Jones, J.; Thompson, G.; Johnson, C.; Gebrehiwot, A. Challenges and opportunities for UAV-based digital elevation model generation for flood-risk management: A case of princeville, north carolina. Sensors 2018, 18, 3843. [Google Scholar] [CrossRef] [PubMed] [Green Version]
- Wu, H.; Liu, C.; Zhang, Y.; Sun, W. Water feature extraction from aerial-image fused with airborne LIDAR data. In Proceedings of the 2009 Joint Urban Remote Sensing Event, Shanghai, China, 20–22 May 2009; pp. 1–7. [Google Scholar]
- Brzank, A.; Heipke, C. Classification of Lidar Data into water and land points in coastal areas. Int. Arch. Photogramm. Remote Sens. Spat. Inf. Sci. 2006, 36, 197–202. [Google Scholar]
- Ostman, A. Accuracy estimation of digital elevation data banks. Photogramm. Eng. Remote Sens. 1987, 53, 425–430. [Google Scholar]
- Hancock, G.R. The use of digital elevation models in the identification and characterization of catchments over different grid scales. Hydrol. Process. Int. J. 2005, 19, 1727–1749. [Google Scholar] [CrossRef]
- O’Callaghan, J.F.; Mark, D.M. The extraction of drainage networks from digital elevation data. Comput. Vis. Graph. Image Process. 1984, 28, 323–344. [Google Scholar] [CrossRef]
- Fawcett, T. An introduction to ROC analysis. Pattern Recognit. Lett. 2006, 27, 861–874. [Google Scholar] [CrossRef]
- Ariza López, F.J.; Atkinson Gordo, A.D. Analysis of some positional accuracy assessment methodologies. J. Surv. Eng. 2008, 134, 45–54. [Google Scholar] [CrossRef]
- Kling, H.; Fuchs, M.; Paulin, M. Runoff conditions in the upper Danube basin under an ensemble of climate change scenarios. J. Hydrol. 2012, 424, 264–277. [Google Scholar] [CrossRef]
- Thirel, G.; Andréassian, V.; Perrin, C.; Audouy, J.-N.; Berthet, L.; Edwards, P.; Folton, N.; Furusho, C.; Kuentz, A.; Lerat, J. Hydrology under change: An evaluation protocol to investigate how hydrological models deal with changing catchments. Hydrol. Sci. J. 2015, 60, 1184–1199. [Google Scholar] [CrossRef]
- Pool, S.; Vis, M.; Seibert, J. Evaluating model performance: Towards a non-parametric variant of the Kling-Gupta efficiency. Hydrol. Sci. J. 2018, 63, 1941–1953. [Google Scholar] [CrossRef]
- Coverages, D. Landscape Drainage Analyses. Photogramm. Eng. Remote Sens. 1995, 61, 519–522. [Google Scholar]
- Gyasi-Agyei, Y.; Willgoose, G.; De Troch, F.P. Effects of vertical resolution and map scale of digital elevation models on geomorphological parameters used in hydrology. Hydrol. Process. 1995, 9, 363–382. [Google Scholar] [CrossRef]
- Sonneveld, M.; Schoorl, J.; Veldkamp, A. Mapping hydrological pathways of phosphorus transfer in apparently homogeneous landscapes using a high-resolution DEM. Geoderma 2006, 133, 32–42. [Google Scholar] [CrossRef]
- Buchanan, B.; Fleming, M.; Schneider, R.; Richards, B.; Archibald, J.; Qiu, Z.; Walter, M. Evaluating topographic wetness indices across central New York agricultural landscapes. Hydrol. Earth Syst. Sci. 2014, 18, 3279–3299. [Google Scholar] [CrossRef] [Green Version]
- Petrasova, A.; Mitasova, H.; Petras, V.; Jeziorska, J. Fusion of high-resolution DEMs for water flow modeling. Open Geospat. Data Softw. Stand. 2017, 2, 1–8. [Google Scholar] [CrossRef] [Green Version]
- Tian, J.; Wang, L.; Li, X.; Gong, H.; Shi, C.; Zhong, R.; Liu, X. Comparison of UAV and WorldView-2 imagery for mapping leaf area index of mangrove forest. Int. J. Appl. Earth Obs. Geoinf. 2017, 61, 22–31. [Google Scholar] [CrossRef]
- Rahman, M.M.; McDermid, G.J.; Strack, M.; Lovitt, J. A new method to map groundwater table in peatlands using unmanned aerial vehicles. Remote Sens. 2017, 9, 1057. [Google Scholar] [CrossRef] [Green Version]
- Kuo, W.L.; Steenhuis, T.S.; McCulloch, C.E.; Mohler, C.L.; Weinstein, D.A.; DeGloria, S.D.; Swaney, D.P. Effect of grid size on runoff and soil moisture for a variable-source-area hydrology model. Water Resour. Res. 1999, 35, 3419–3428. [Google Scholar] [CrossRef] [Green Version]
- Emanuel, K. Increased global tropical cyclone activity from global warming: Results of downscaling CMIP5 climate models. Proc. Natl. Acad. Sci. USA 2013, 110, 219–312. [Google Scholar] [CrossRef] [Green Version]
- Marklund, L. Topographic Control of Groundwater Flow. Ph.D. Thesis, KTH Royal Institute of Technology, Stockholm, Sweden, 2009. [Google Scholar]
- Gillin, C.P.; Bailey, S.W.; McGuire, K.J.; Prisley, S.P. Evaluation of LiDAR-derived DEMs through terrain analysis and field comparison. Photogramm. Eng. Remote Sens. 2015, 81, 387–396. [Google Scholar] [CrossRef] [Green Version]
- Alidoost, F.; Arefi, H. Comparison of Uas-Based Photogrammetry Software for 3D Point Cloud Generation: A Survey over a Historical Site. ISPRS Ann. Photogramm. Remote Sens. Spat. Inf. Sci. 2017, 4, 55–61. [Google Scholar] [CrossRef] [Green Version]
- Skarlatos, D.; Vlachos, M. Vegetation removal from UAV derived DSMS, using combination of RGB and NIR imagery. In Proceedings of the ISPRS TC II Mid-term Symposium “Towards Photogrammetry 2020”, Riva del Garda, Italy, 4–7 June 2018. [Google Scholar]
- van Iersel, W.; Straatsma, M.; Addink, E.; Middelkoop, H. Monitoring height and greenness of non-woody floodplain vegetation with UAV time series. ISPRS J. Photogramm. Remote Sens. 2018, 141, 112–123. [Google Scholar] [CrossRef]
Publisher’s Note: MDPI stays neutral with regard to jurisdictional claims in published maps and institutional affiliations. |
© 2021 by the authors. Licensee MDPI, Basel, Switzerland. This article is an open access article distributed under the terms and conditions of the Creative Commons Attribution (CC BY) license (https://creativecommons.org/licenses/by/4.0/).

