Next Article in Journal
Unplanned Natural Experiments: The Case of Remote Sensing of Primary Production and Its Environmental Correlations in the Negev
Previous Article in Journal
Spatio-Temporal Evaluation of Water Storage Trends from Hydrological Models over Australia Using GRACE Mascon Solutions
 
 
Correction published on 15 March 2021, see Remote Sens. 2021, 13(6), 1115.
Article

Recent Ground Subsidence in the North China Plain, China, Revealed by Sentinel-1A Datasets

1
Key Laboratory of Mechanism, Prevention and Mitigation of Land Subsidence, Capital Normal University, Beijing 100048, China
2
Beijing Laboratory of Water Resources Security, Capital Normal University, Beijing 100048, China
3
College of Resources Environment and Tourism, Capital Normal University, Beijing 100048, China
4
Observation and Research Station of Groundwater and Land Subsidence in Beijing-Tianjin-Hebei Plain, Beijing 100048, China
*
Author to whom correspondence should be addressed.
Remote Sens. 2020, 12(21), 3579; https://doi.org/10.3390/rs12213579
Submission received: 1 October 2020 / Revised: 28 October 2020 / Accepted: 29 October 2020 / Published: 31 October 2020
(This article belongs to the Section Environmental Remote Sensing)

Abstract

:
Groundwater resources have been exploited and utilized on a large scale in the North China Plain (NCP) since the 1970s. As a result of extensive groundwater depletion, the NCP has experienced significant land subsidence, which threatens geological stability and infrastructure health and exacerbates the risks of other geohazards. In this study, we employed multi-track Synthetic Aperture Radar (SAR) datasets acquired by the Sentinel-1A (S1A) satellite to detect spatial and temporal distributions of surface deformation in the NCP from 2016 to 2018 based on multi-temporal interferometric synthetic aperture radar (MT-InSAR). The results show that the overall ground displacement ranged from −165.4 mm/yr (subsidence) to 9.9 mm/yr (uplift) with a standard variance of 28.8 mm/yr. During the InSAR monitoring period, the temporal pattern of land subsidence was dominated by a decreasing tendency and the spatial pattern of land subsidence in the coastal plain exhibited an expansion trend. Validation results show that the S1A datasets agree well with levelling data, indicating the reliability of the InSAR results. With groundwater level data, we found that the distribution of subsidence in the NCP is spatially consistent with that of deep groundwater depression cones. A comparison with land use data shows that the agricultural usage of groundwater is the dominant mechanism responsible for land subsidence in the whole study area. Through an integrated analysis of land subsidence distribution characteristics, geological data, and previous research results, we found that other triggering factors, such as active faults, precipitation recharge, urbanization, and oil/gas extraction, have also impacted land subsidence in the NCP to different degrees.

Graphical Abstract

1. Introduction

Groundwater constitutes the main water supply and meets more than 70% of the water needs in the North China Plain (NCP), a major agricultural base and industrial base in China [1]. Similar to several areas around the world [2,3,4,5,6,7,8,9,10,11], the NCP has experienced rapid land subsidence in association with extensive groundwater withdrawal. Moreover, rapid urbanization, increased dynamic and static loads, and the development of underground spaces have also impacted the occurrence of land subsidence to various degrees [12,13,14,15], and these factors also contribute to land subsidence in the NCP [16,17,18,19,20]. Land subsidence threatens the safety of urban infrastructure, increases the risk of urban waterlogging, exacerbates the impacts of sea-level rise on coastal areas, and even affects regional water security. Hence, subsidence monitoring and analysis are vital for detecting potential hazards and for maintaining sustainable regional development.
Subsidence in the NCP has previously been monitored using extensometers, levelling measurements, and global positioning system (GPS) measurements with high precision and space-time restrictions [19,21,22]. Compared with these point-based geodetic methods, interferometric synthetic aperture radar (InSAR) has the ability to monitor large-scale ground subsidence throughout the day under all weather conditions with millimeter-scale precision. The development of multi-temporal InSAR (MT-InSAR) addressed the limitations of traditional InSAR technology, such as temporal decorrelation, spatial decorrelation, and atmospheric delay. Accordingly, variants of the MT-InSAR technique, such as persistent scatterer InSAR (PS-InSAR) [23,24] and small baseline subset (SBAS) [25], have been successfully leveraged to analyze the time-series characteristics of land subsidence. Hence, considering the advantages of InSAR, this technique has been widely used to monitor subsidence areas throughout the NCP [26,27,28,29,30,31,32,33]. However, detailed InSAR subsidence studies always focus on specific sites, often Beijing, Tianjin, and Cangzhou. As a result, the spatial extent, magnitude, and temporal evolution of land subsidence elsewhere in the NCP have not been investigated.
The purpose of this paper is to fill this knowledge gap regarding land subsidence in the NCP by using the InSAR technique. The Sentinel-1A (S1A) satellite provides free C-band data with a swath width of 250 km; with these data, it is feasible to overcome the sparse data coverage and to perform large-scale subsidence monitoring. In this study, we apply the PS-InSAR technique to 3 ascending tracks acquired from 2016 to 2018 by the S1A satellite to obtain time-series displacements across the NCP and to detect the distribution of surface deformation therein. Then, to provide new insights into land subsidence in the NCP, we analyze the temporal and spatial evolution characteristics of and the main factors influencing land subsidence in this region.
The remainder of this paper is organized as follows. Section 2 introduces the history of land subsidence in the NCP and describes the study site. The Synthetic Aperture Radar (SAR) datasets and InSAR time-series method used in this study are presented in Section 3. Section 4 shows the InSAR results and the validation results. Finally, the discussion and conclusions of this study are provided in Section 5 and Section 6, respectively.

2. Study Area

The NCP is an alluvial-proluvial plain formed from sediments carried by the Yellow River, Luanhe River, and Haihe River and covers the region between 34°46′N, 112°30′E and 40°25′N, 119°30′E, spanning a total area exceeding 140,000 km2. The NCP has a typical warm, semi-humid continental monsoon climate with a mean annual precipitation of 500–700 mm. The plain consists of the piedmont alluvial-proluvial plain (PP), central alluvial-lacustrine plain (CP), and littoral plain (LP) with quaternary deposit thicknesses ranging from 150 to 600 m [34]. The hydrogeological cross section A-A’ from Shijiazhuang to Bohai Bay is illustrated in Figure 1b. The quaternary aquifers underlying the NCP are divided into four groups (Table 1): aquifer 1 is an unconfined aquifer at depths of 10–50 m, and aquifer 2 is a shallow confined aquifer at depths of 120 to 210 m, whereas aquifer 3 (depths of 250–310 m) and aquifer 4 (depths of 350–550 m) are confined and defined as deep groundwater [34,35,36]. Hereafter, the shallow aquifer refers collectively to aquifers 1 and 2. From the PP to the CP and LP, the aquifer systems generally vary from a single aquifer comprising sandy gravel to multiple aquifers composed of sand separated by silt or clay layers [37].
The first record of subsidence in the NCP was discovered in Tianjin by a levelling survey conducted in 1923. Before 1954, the NCP subsided in only parts of Beijing and Tianjin, and the annual subsidence velocity reached only a few millimeters. However, groundwater has been used as a major source of water since 1970; consequently, groundwater levels have fallen at alarming rates due to excessive exploitation [38]. Between 1975 and 1995, the average water table of both the shallow aquifer and the deep aquifer in some areas declined over 6 m and 23 m, respectively [39]. In response, land subsidence developed rapidly, extending from cities to rural areas [37]. The measured maximum accumulative displacement reached 800 mm from 1975 to 1995. As reported by the China Geological Survey (CGS), by the end of 2013, 42.3% and 10.8% of the total area of the NCP exhibited a subsidence velocity in excess of 20 mm/yr and 50 mm/yr, respectively (http://www.cigem.cgs.gov.cn). Among these areas, 90% of subsidence was distributed in Beijing, Tianjin, and Hebei and the cumulative subsidence in some parts exceeded 3 m [40]. In this study, we focus on land subsidence in the northwestern NCP, which includes the entire plain area around Beijing, Tianjin, and Hebei.

3. SAR Data and MT-InSAR Processing

The SAR datasets employed herein are composed of three tracks of images acquired by S1A, a C-band Earth observation satellite with a 12-day repeat cycle that launched on 3 April 2014. This study utilizes 404 S1A SAR ascending orbit images (tracks 40, 142, and 69) acquired with vertical-vertical (VV) polarization in interferometric wide swath (IW) mode between 2016 and 2018. In IW Terrain Observation with Progressive Scan (TOPS) mode, S1A has a spatial resolution of 5 × 20 m and a swath width of 250 km (https://sentinel.esa.int/). Detailed parameters of the S1A data are shown in Table 2.
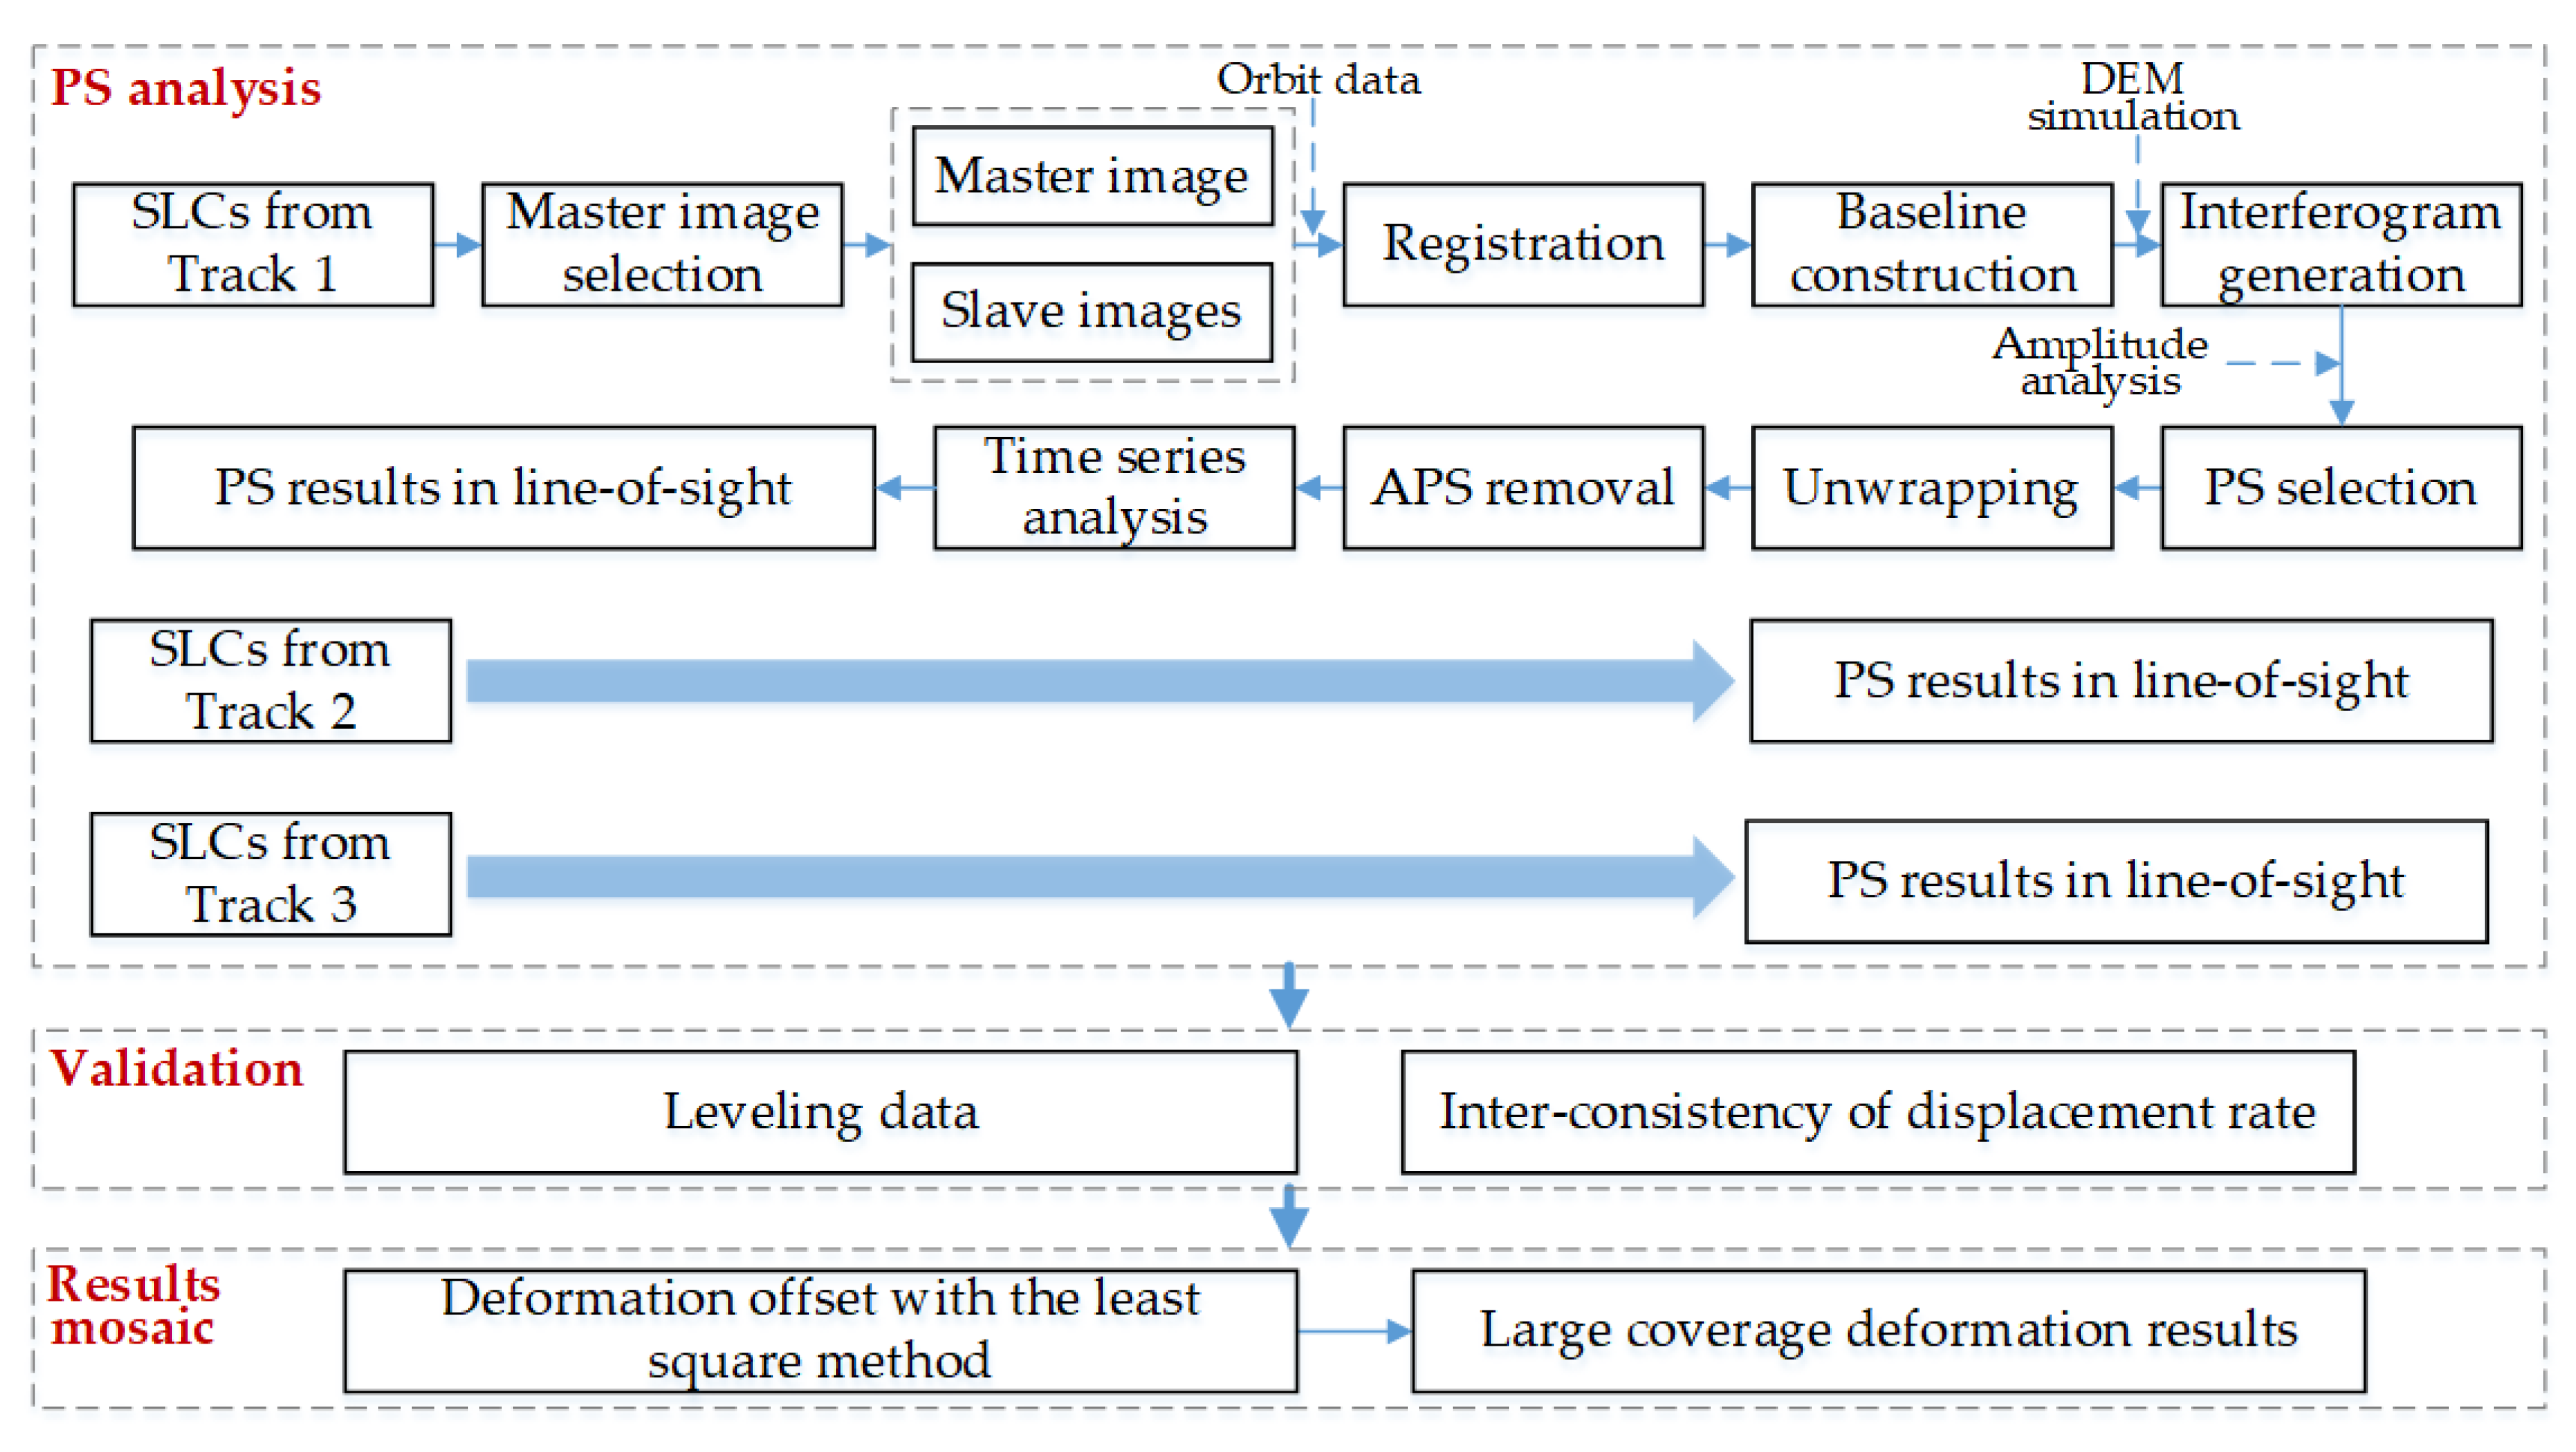
To measure the time-series surface deformation throughout the NCP, the persistent scatterer (PS) technique is applied to the images from each track of SAR data by SARProZ processing software (refer to https://www.sarproz.com/). The main processing steps (Figure 2) are as follows: master image selection, SAR data registration, digital elevation model (DEM) simulation, interferogram generation, PS selection with an amplitude stability index (ASI) threshold, atmospheric phase screen (APS) estimation and removal, and time-series deformation estimation. A DEM from the Shuttle Radar Topography Mission (SRTM) (http://dds.cr.usgs.gov/srtm/) with a 90-m resolution is used to remove the topographic phase. In addition, to ensure high coherence and stability, the PS candidates are chosen by employing an ASI better than 0.8. A previous study showed that the horizontal deformation within the NCP occurs with a relatively low velocity of 1.57–1.93 mm/yr with GPS observations [42,43]. Hence, we neglect the horizontal deformation and convert the line-of-sight (LOS) deformation into the vertical displacement by using Equation (1) [44]:
d v = d L o s c o s θ
where d v is the vertical displacement, d L o s is the LOS displacement, and θ is the incidence angle. Then, the vertical displacements are validated with ground levelling data.
To generate a broad-coverage deformation velocity map, we need to mosaic the results from the three S1A tracks. However, multi-track SAR datasets are measured along different LOSs, and the locations of the detected pixels in each dataset also vary. Therefore, to accurately construct a broad-coverage subsidence velocity map, we guarantee three considerations. First, the LOS deformation from different tracks should be converted into vertical deformation. In this study, the area covered by track 142 is chosen as the reference area because it shares the same region as that with the data from the other two tracks. The incidence angles (Table S1) on track 142 and track 40 in the overlapping area are approximately 33.72° and 43.75°, respectively; similarly, the incidence angles on track 142 and track 69 in the overlapping area are approximately 43.77° and 33.67°, respectively. Each PS point from the three datasets is converted into the vertical deformation by Equation (1) according to the abovementioned incidence angles. Second, the locations of the PS points detected from each dataset differ in the overlapping area; accordingly, a nearest-neighbor search is used to match the PS points in the overlapping area from different tracks. Third, the least square method is used to calculate the deformation offset in the overlapping area between two neighboring tracks. Finally, the results from the three S1A tracks can be mosaicked by compensating for the mean offset.

4. Results

4.1. Land Subsidence in the NCP during the Observation Period

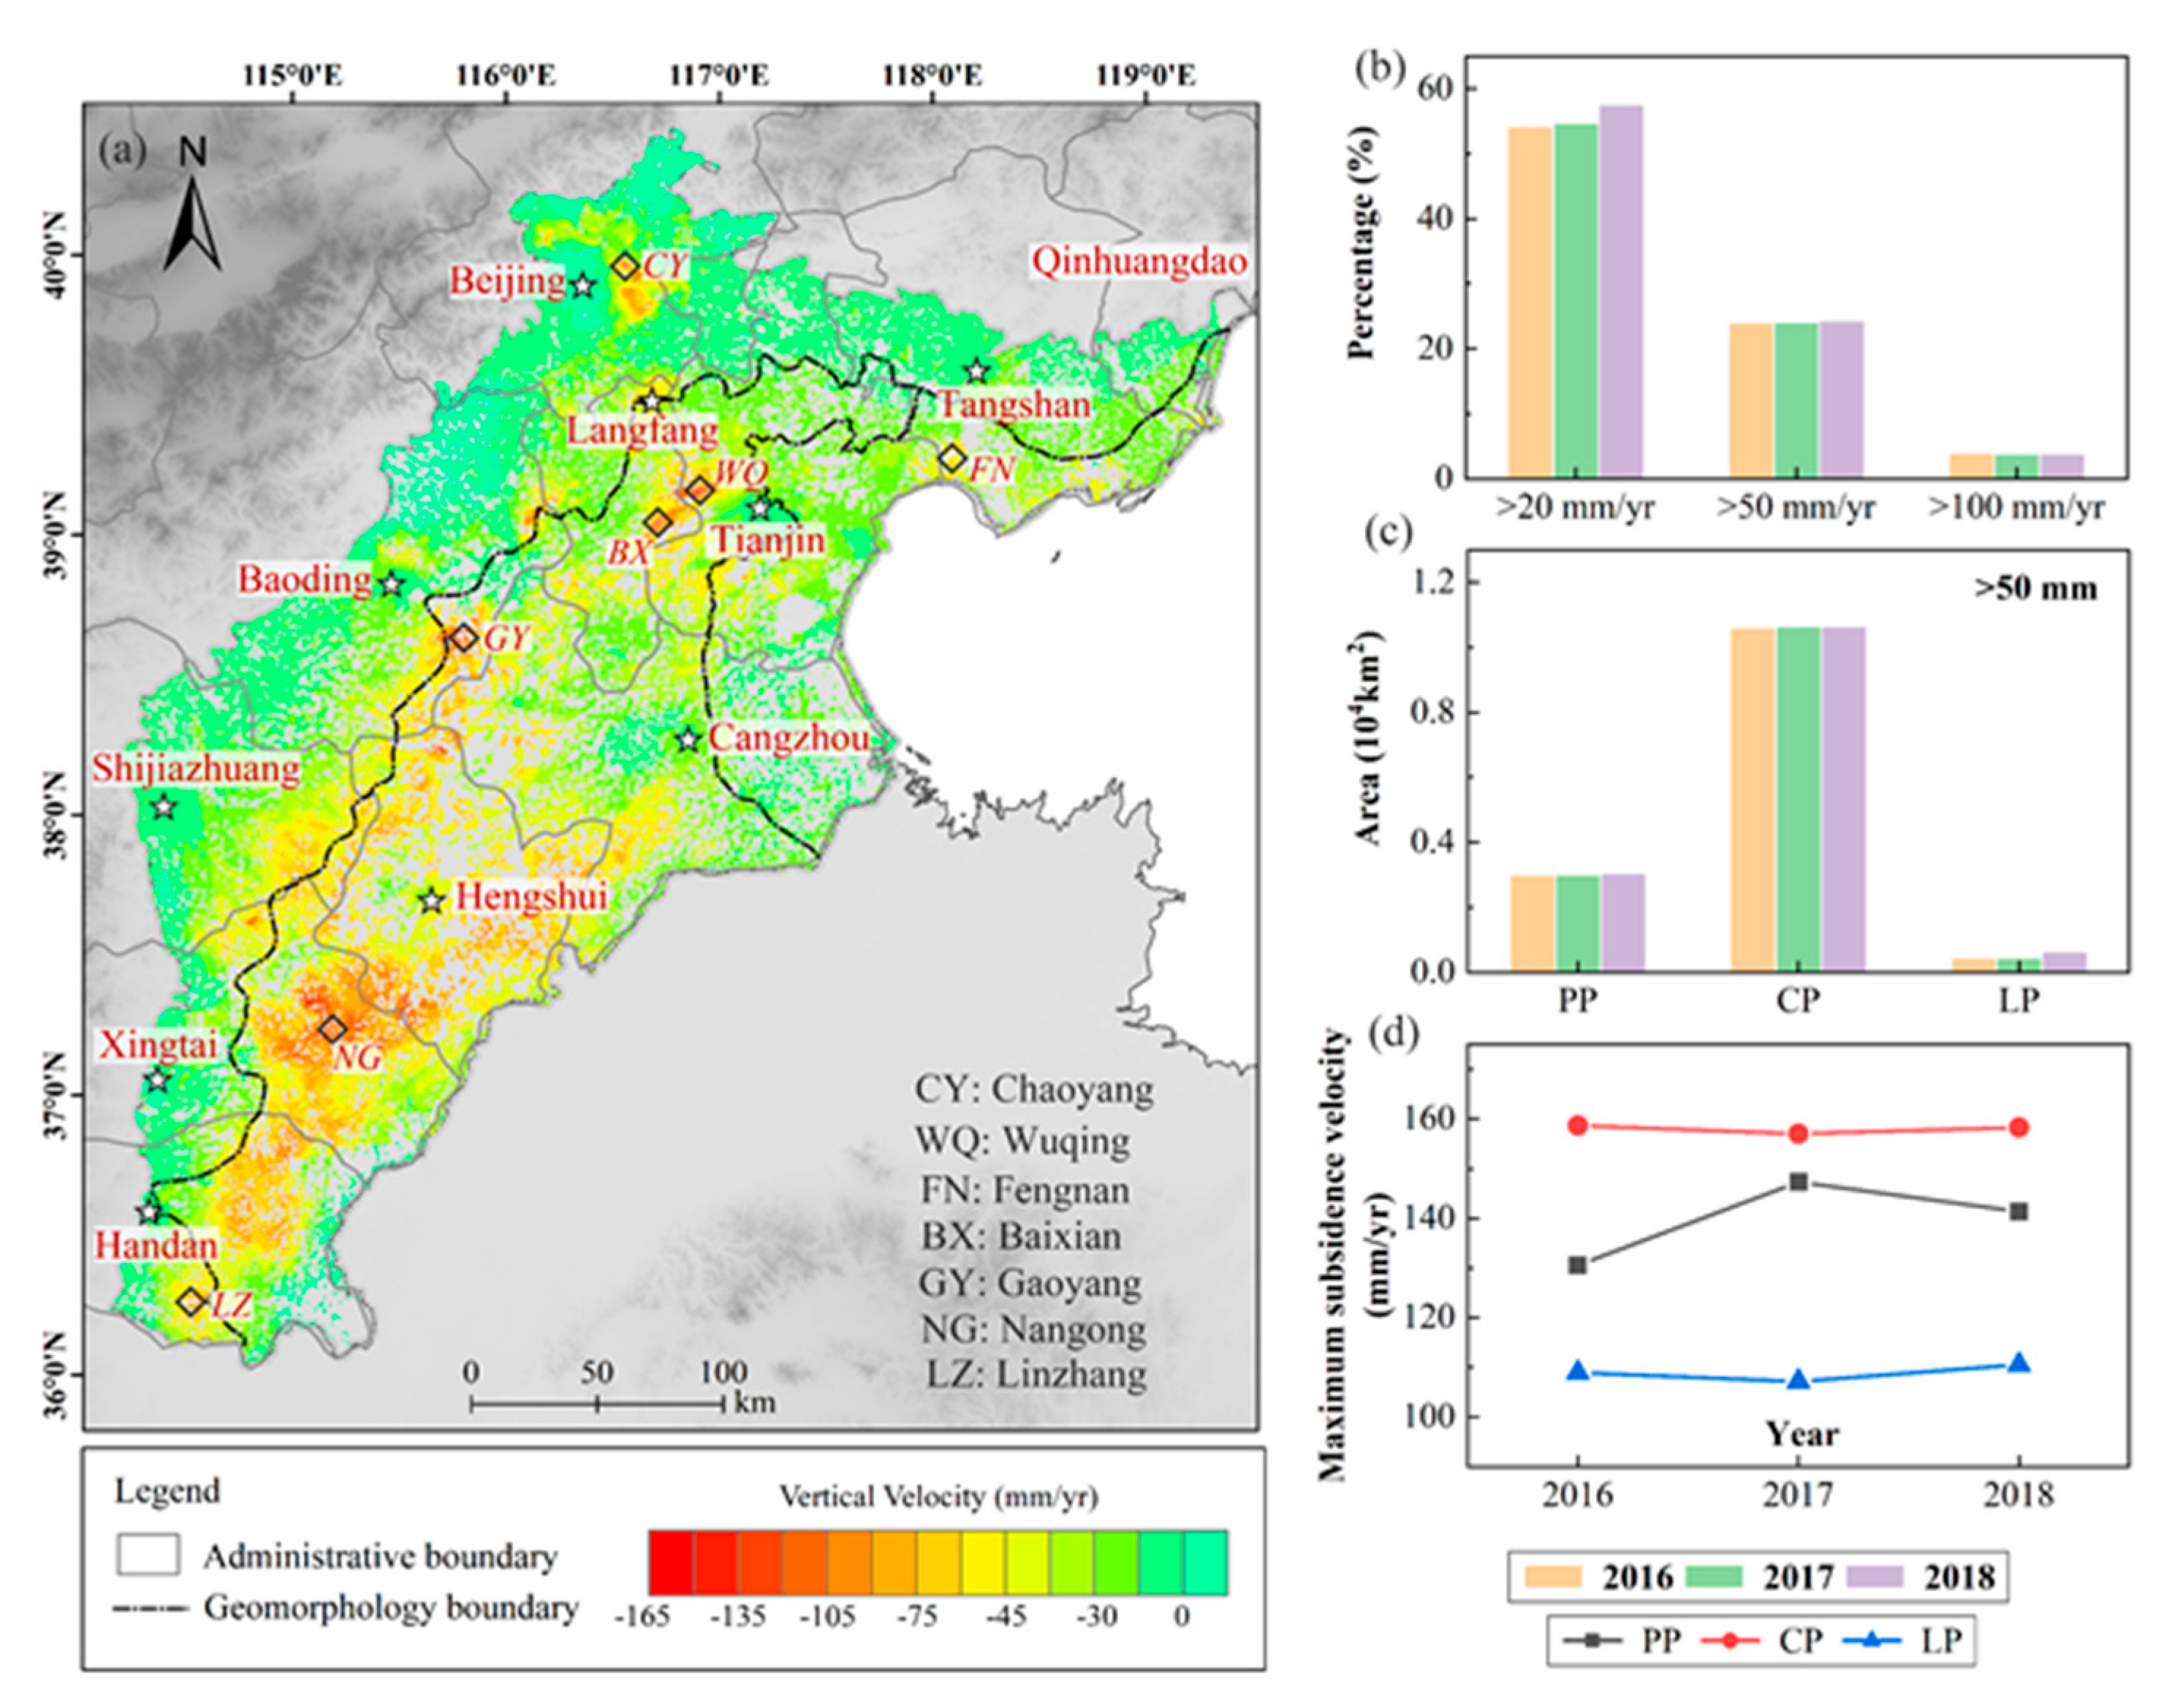
We applied the PS-InSAR technique to the S1A datasets from 2016 to 2018 to investigate the ground deformation behavior in the NCP. To produce a broad-coverage deformation velocity map, we mosaicked the results from the three S1A tracks by compensating for the offset in the overlapping areas. Figure 3 shows the overall displacements derived from the S1A datasets by using the PS-InSAR technique in the NCP. The results reveal regions of significant subsidence mainly to the southeast and southwest of the PP, the southwest and east of the LP, and most of the CP. The overall displacement rate ranges from −165.4 mm/yr (where negative values denote subsidence) to 9.9 mm/yr (with positive values indicating uplift) with a standard variance of 28.8 mm/yr (during the acquisition of S1A data).
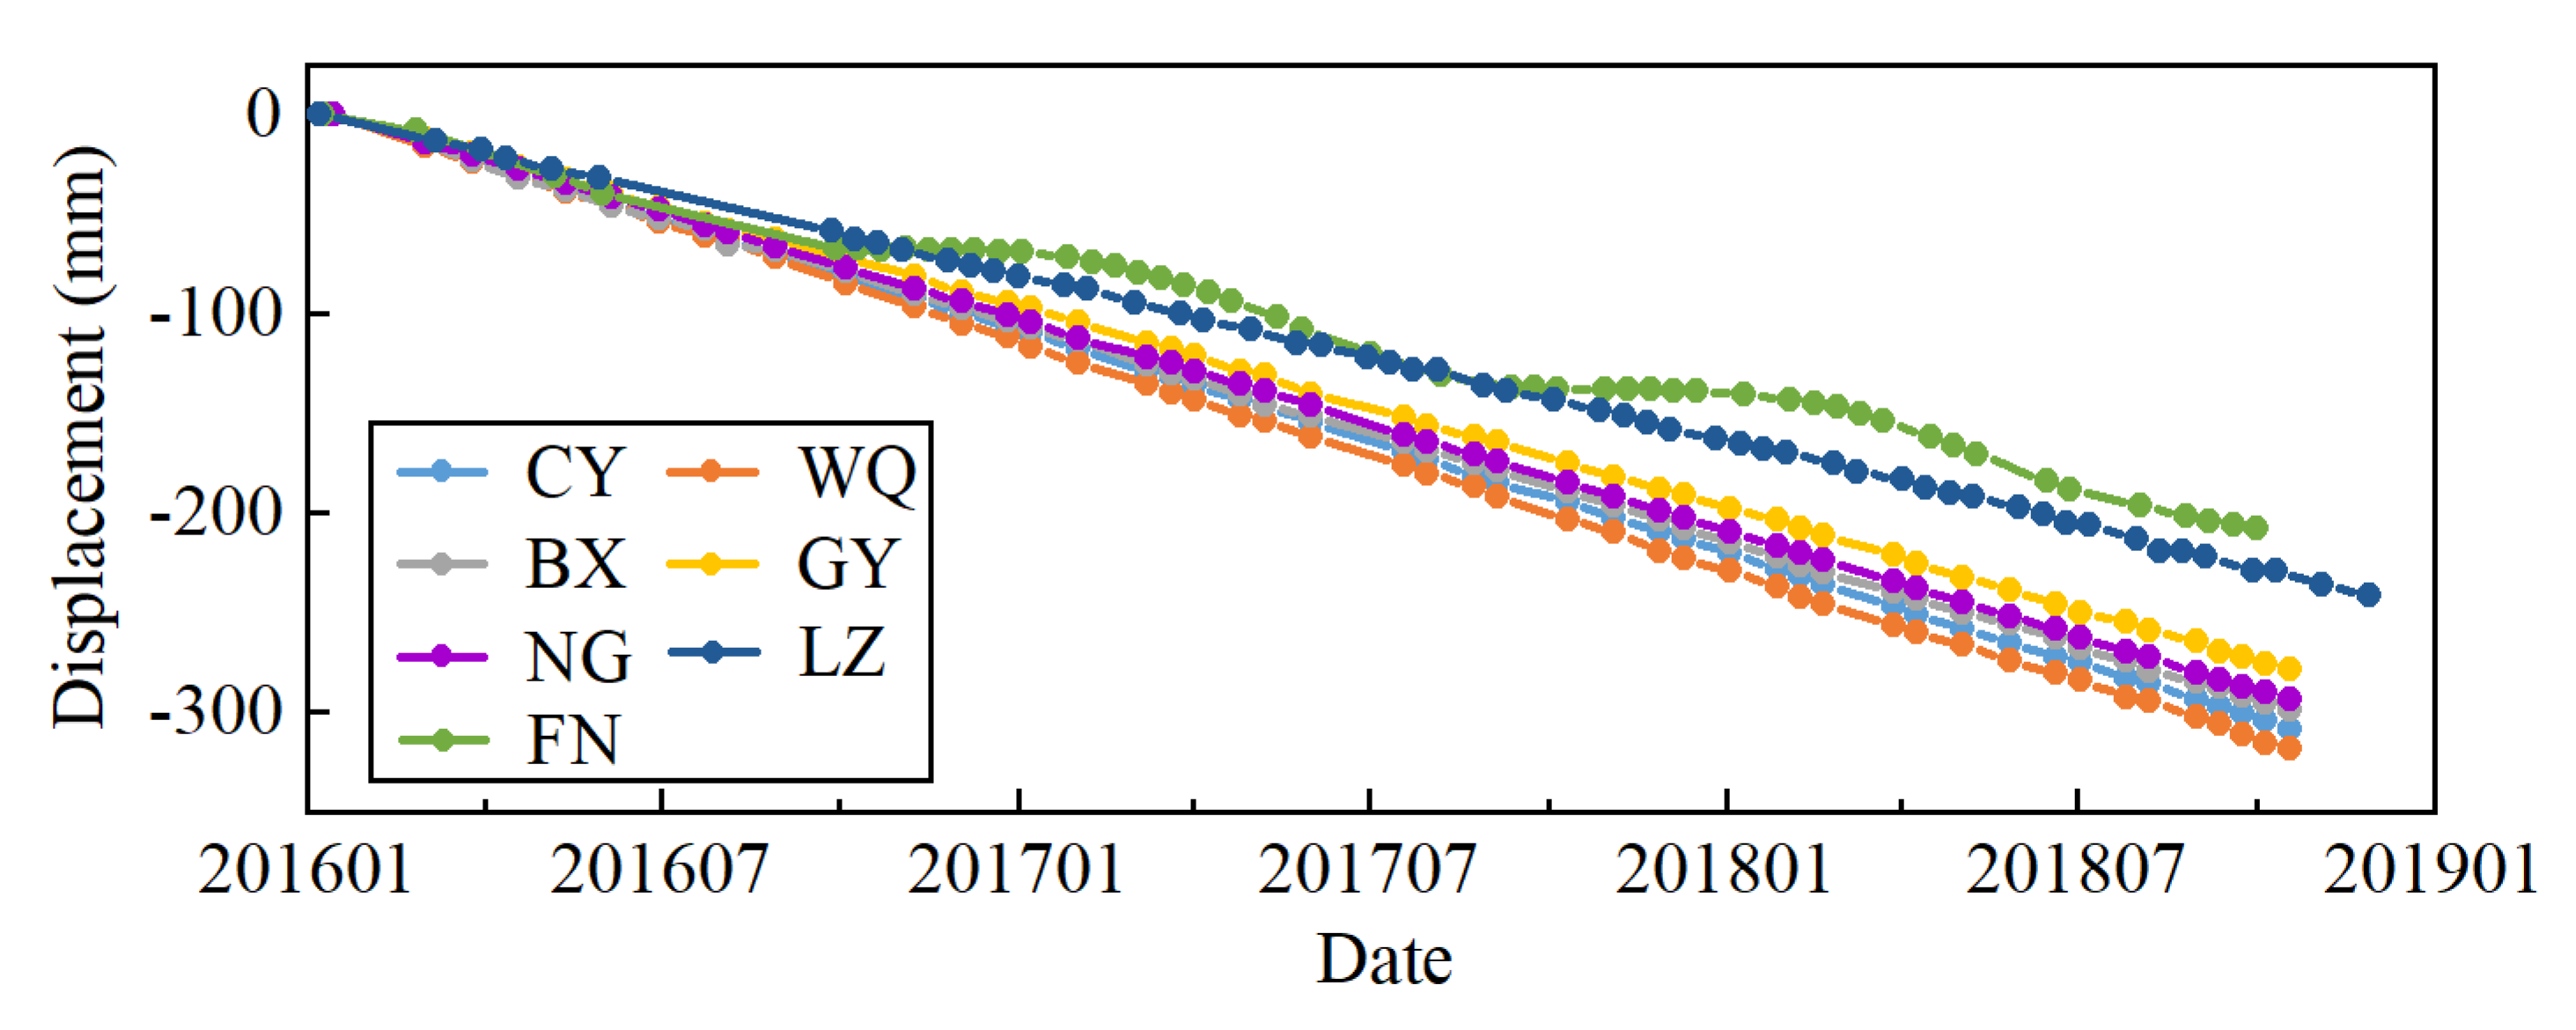
A total of 1,426,967 PS points was detected in the study area. Points with velocities higher than 20, 50, and 100 mm/yr accounted for 53.9%, 23.9%, and 3.6% of the total points, respectively. From 2016 to 2018, the percentage of points with land subsidence rates above 20 mm increased from 53.8% to 57.2%, while the percentage of points with subsidence rates over 100 mm presented a slight decreasing trend (Figure 3b). PS points with subsidence rates over 50 mm/yr accounted for 23.7%, 23.8%, and 24% of the total points during 2016, 2017, and 2018, respectively. During the observation period, the total area with a subsidence rate greater than 50 mm/yr reached 1.4 × 10⁴ km2. We further calculated the area of subsidence exceeding 50 mm among the three sub-plains, and the results are presented in Figure 3c. In the PP, the area with subsidence greater than 50 mm presented a slight increase with an increase of 1.5% from 2016 to 2018. In the CP, the area with subsidence exceeding 50 mm presented a relatively stable tendency, constituting an increase of 0.3% between 2016 and 2018. Compared with 2016, the area with subsidence greater than 50 mm in the LP increased significantly in 2018 (an increase of 33.8%). From 2016 to 2018, the maximum subsidence rate was relatively stable in the CP and LP (Figure 3d). In the PP, the maximum subsidence rate first increased and then decreased. Figure 4 shows an example of the accumulative time-series displacements at selected points. For example, the accumulative subsidence at CY and WQ exceeded 30 cm in 3 years; the time-series displacements at most selected points are similarly dominated by a permanent decreasing trend with minor nonlinear variations. In contrast, the time-series displacements at FN are characterized by significant seasonal variations: from September to January of the following year, the subsidence disappears or even rebounds (uplifts), after which the surface continues to subside.
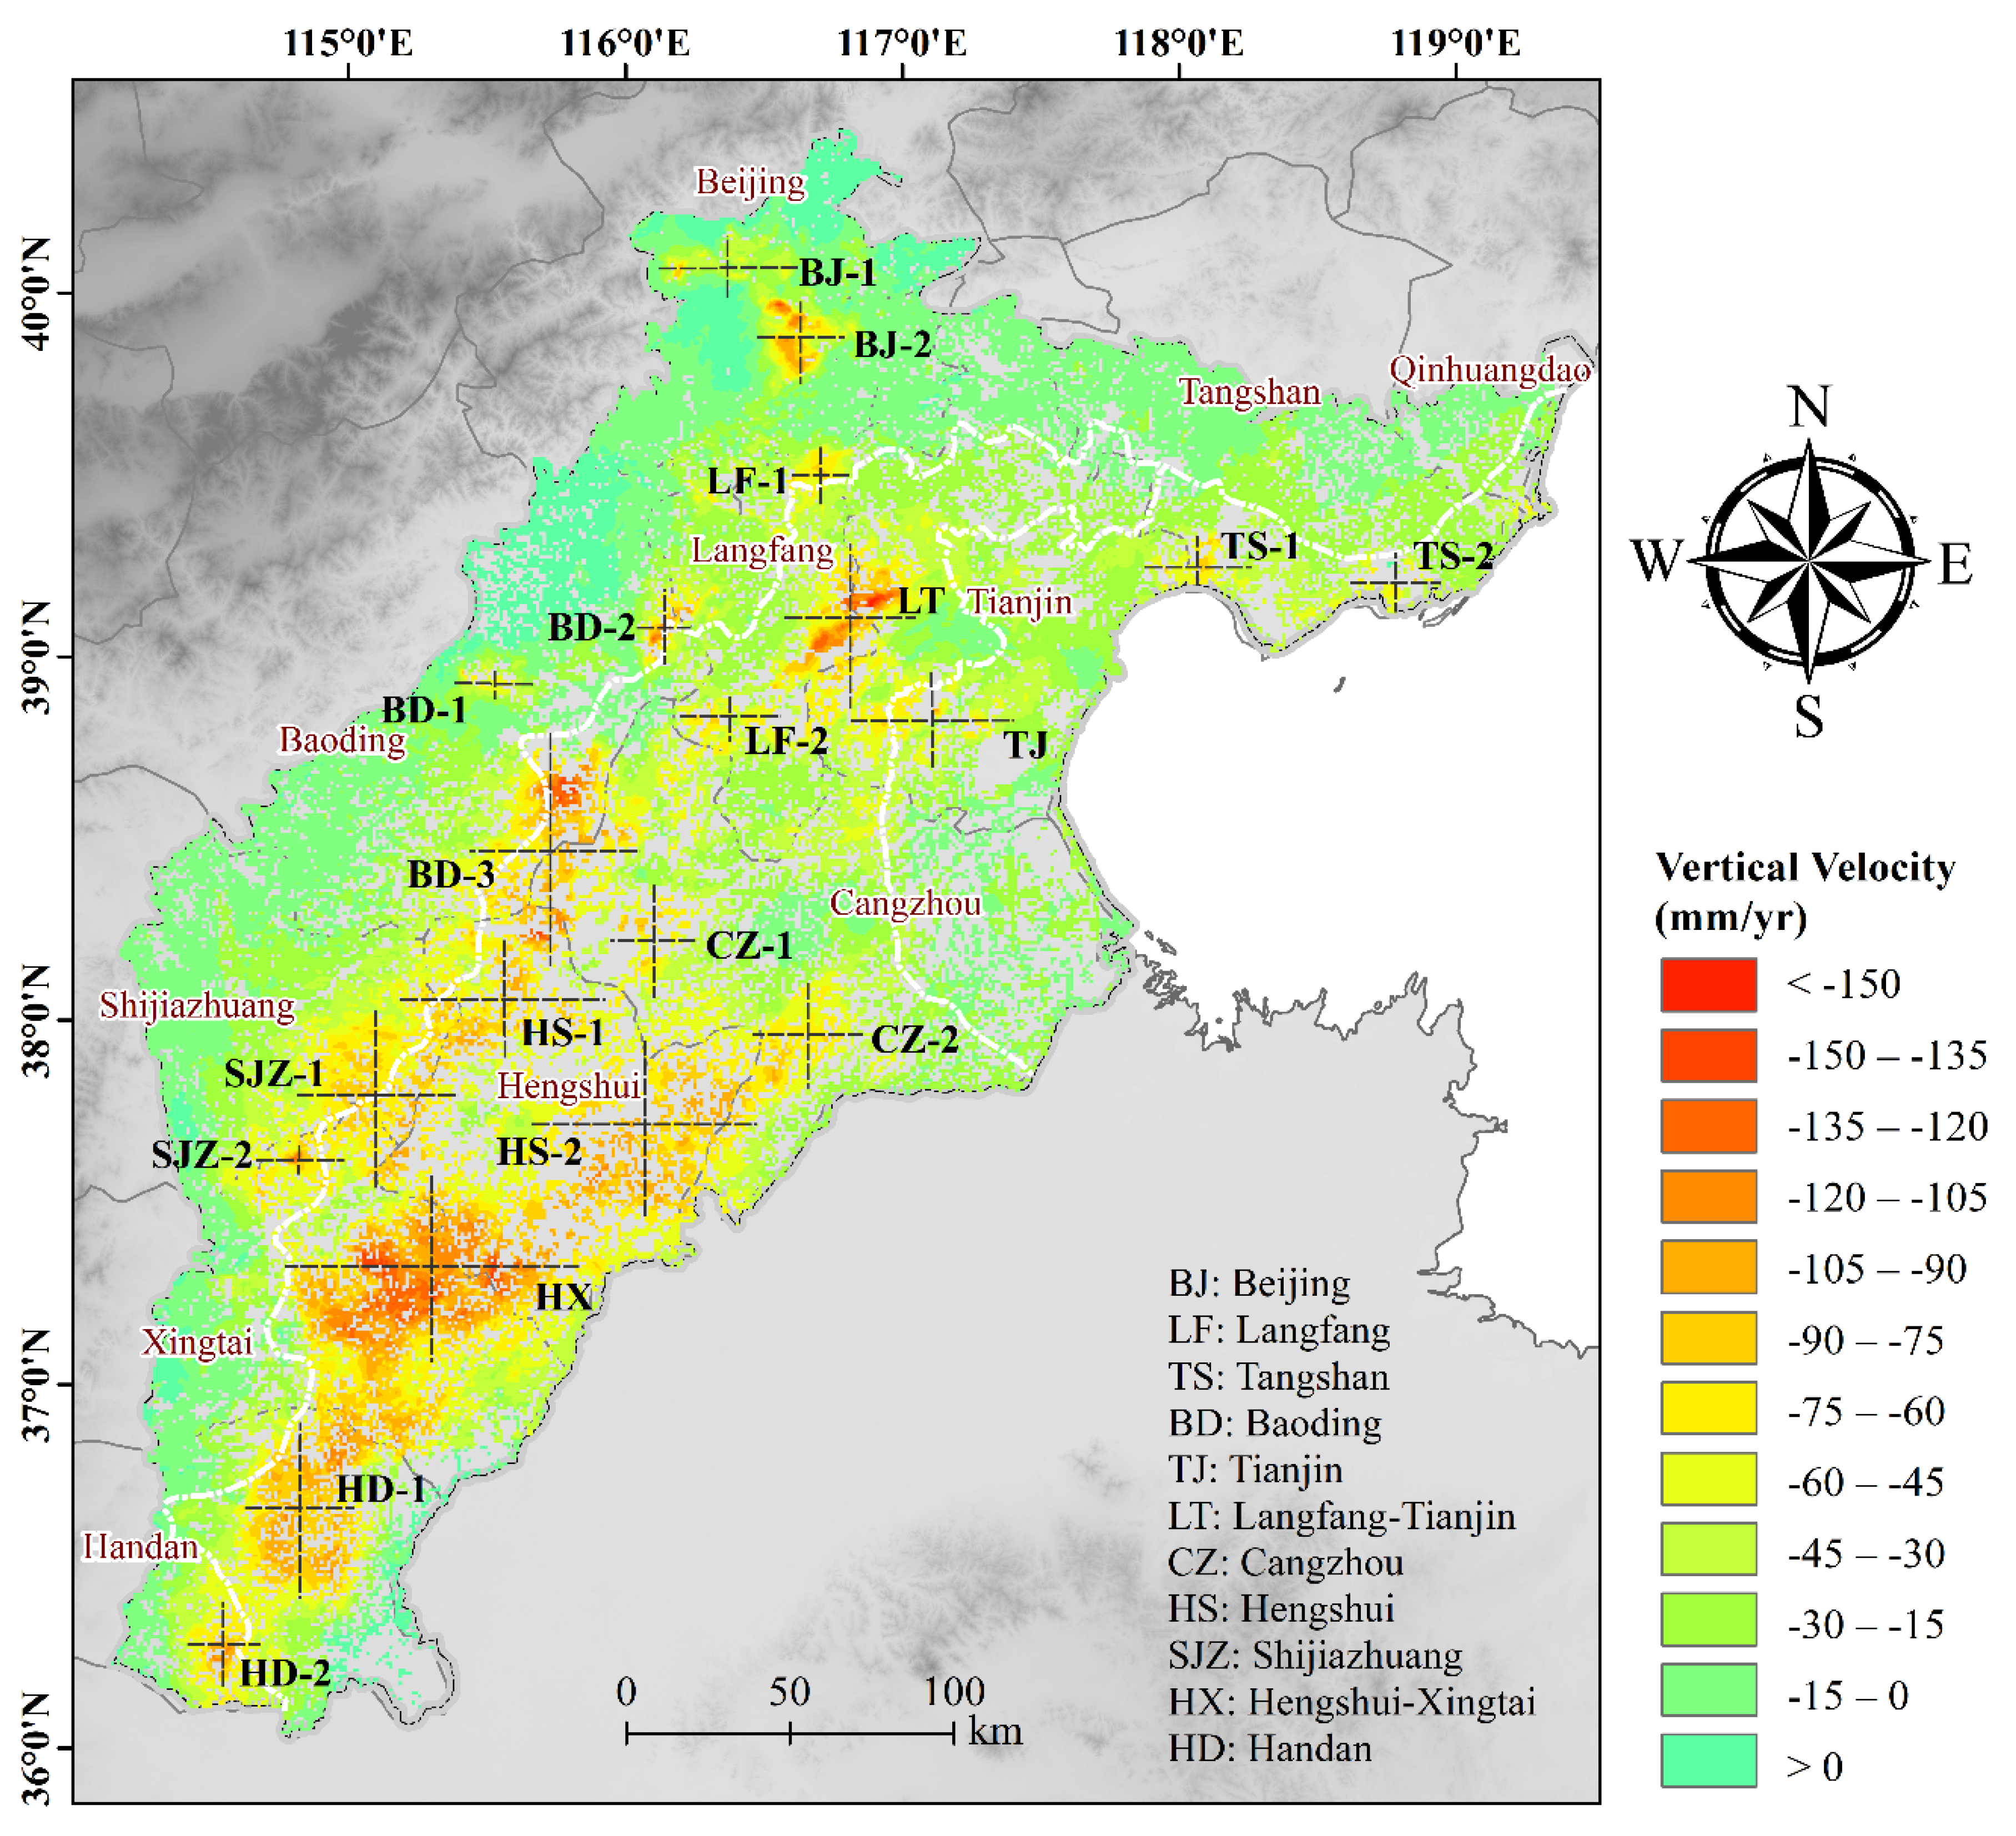
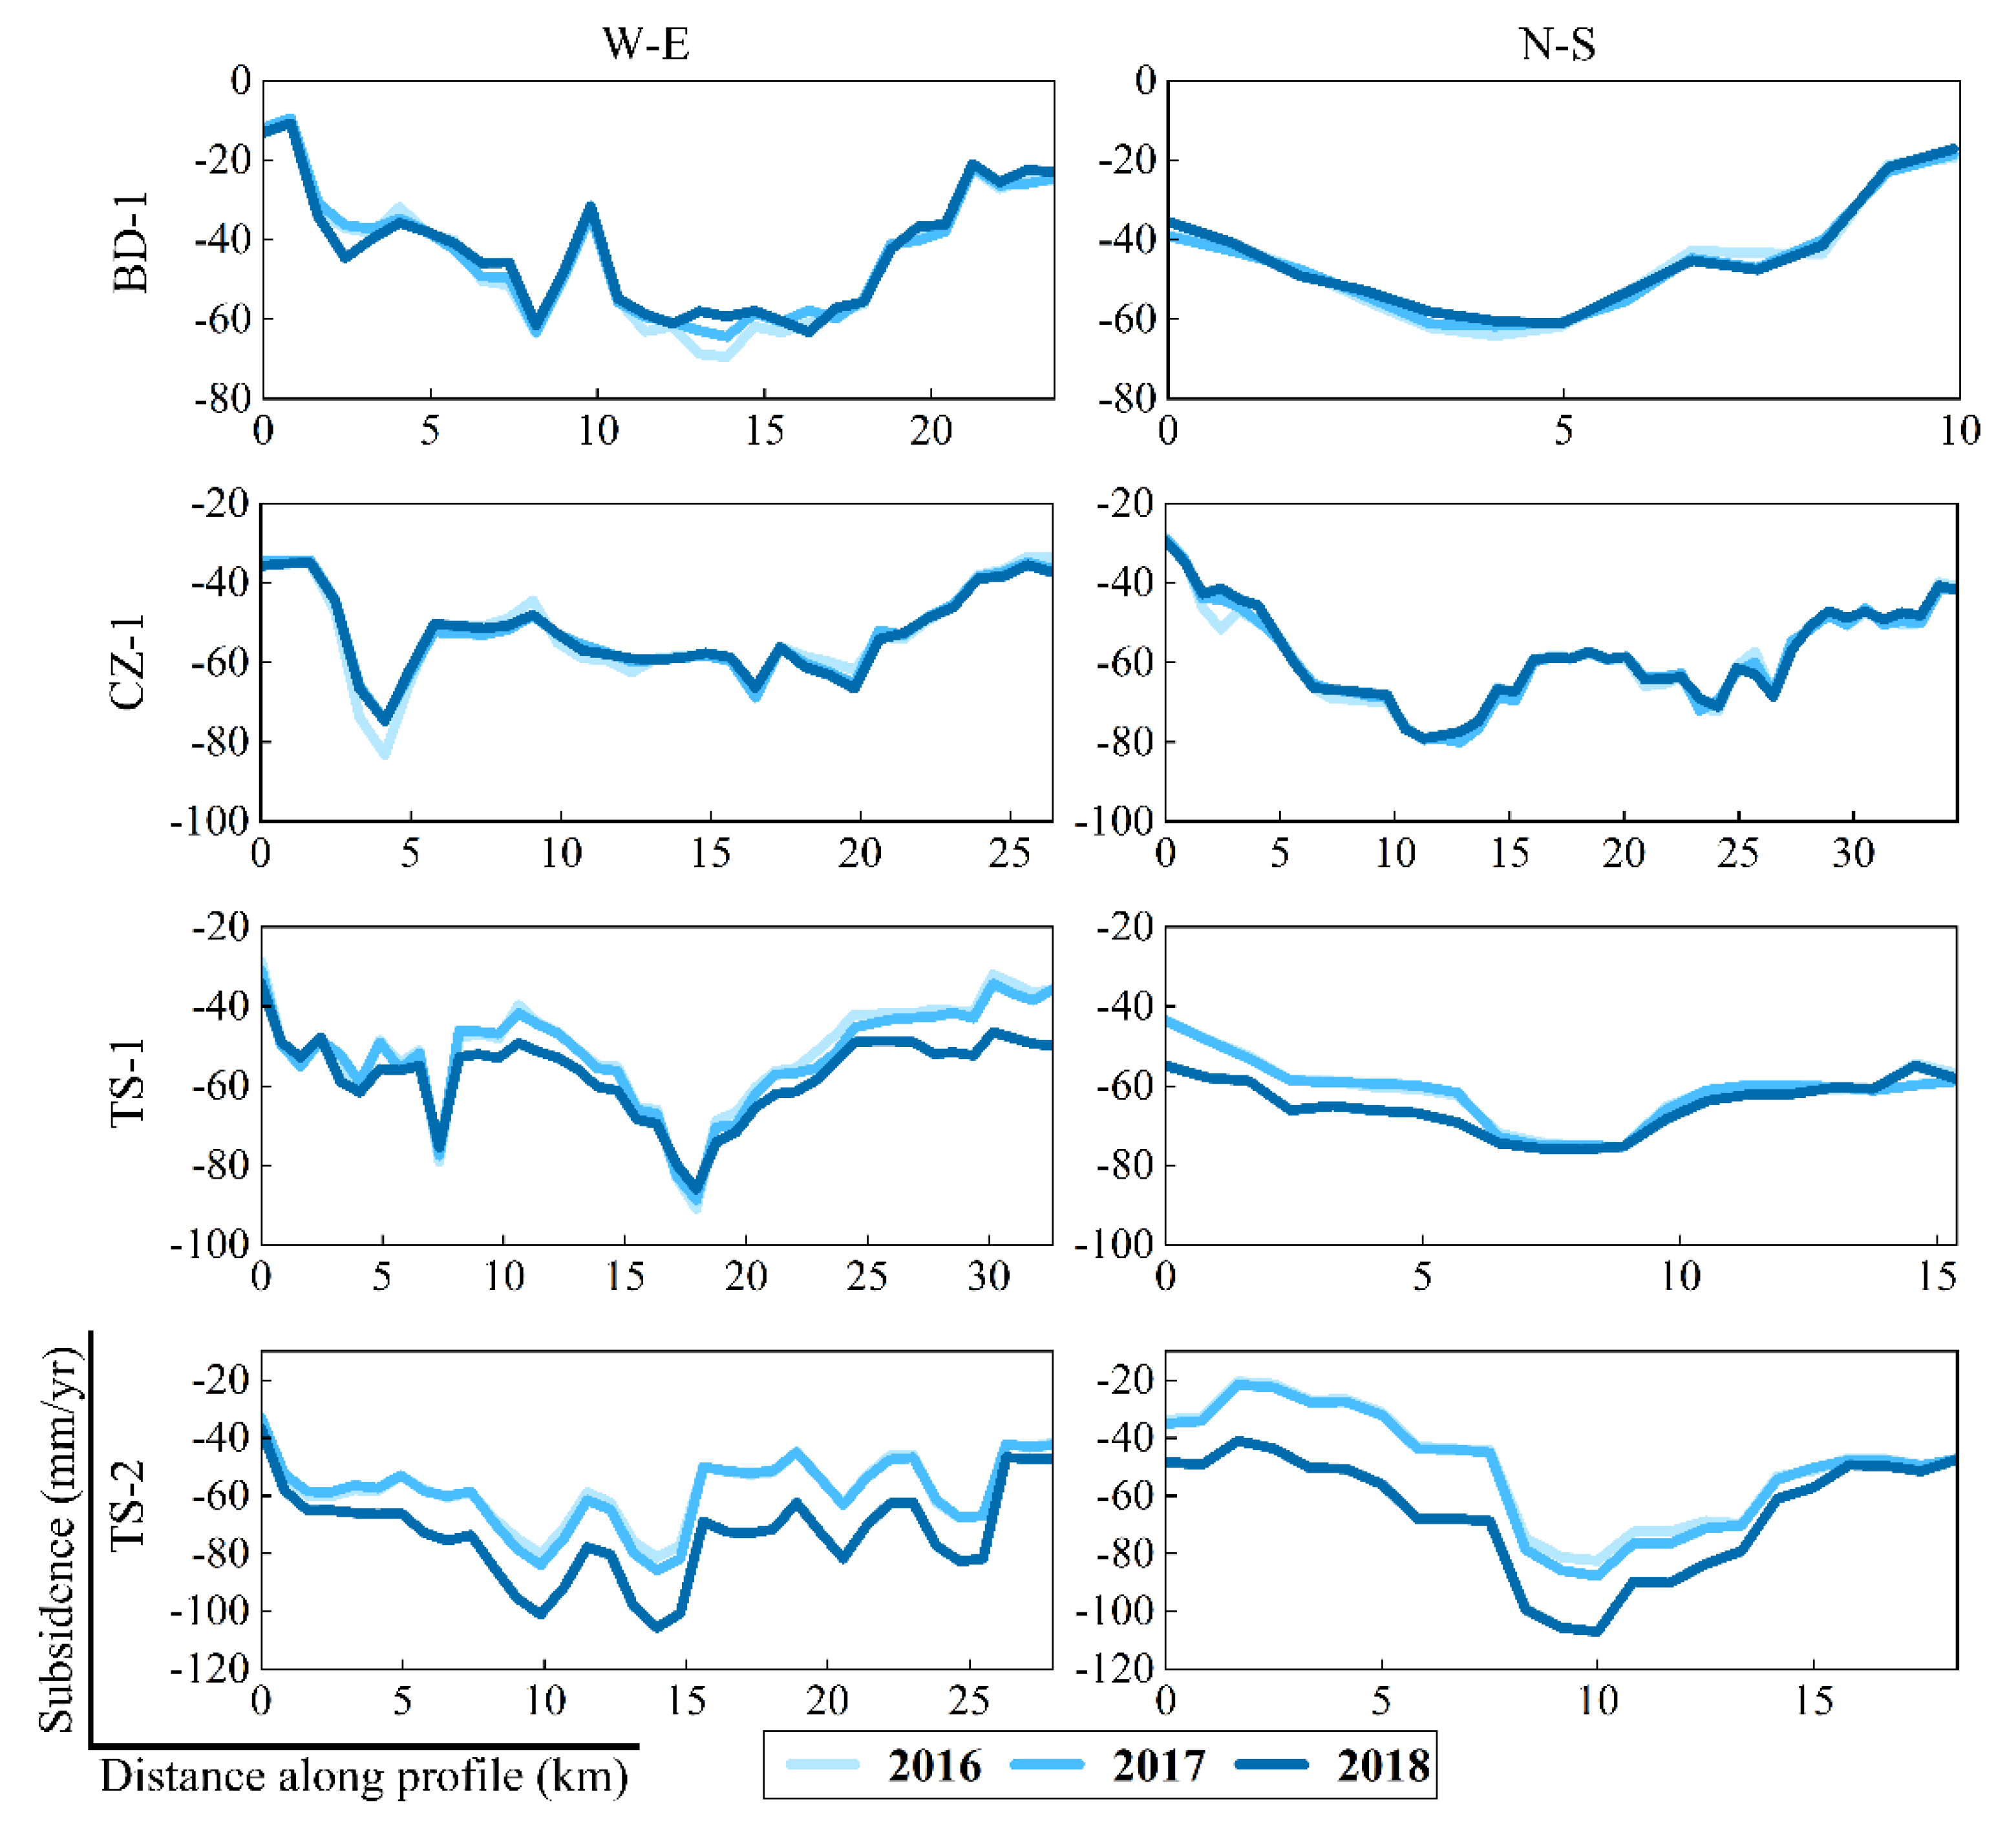
We plot profiles of the displacement rate in the west–east (W–E) and north–south (N–S) directions to illustrate the spatial characteristics of subsidence areas in the NCP. The location of each profile is shown in Figure 5. The behavior of the spatial evolution of subsidence differs significantly at different subsidence funnels between 2016 and 2018. For example, the profiles across the Beijing, Tianjin, Shijiazhuang, Langfang-Tianjin, and Hengshui-Xingtai subsidence centers, labelled BJ-1/2, TJ, SJZ-1/2, LT, and HX (Figure S1 in the Supplementary Material), respectively, are characterized by steady subsidence. The TS-1/2 profiles across the Tangshan subsidence center exhibit increasing subsidence rates (Figure 6). In particular, the TS-2 profile indicates significant increasing subsidence rates from west to east and from north to south, with the maximum subsidence rate increasing from 81.3 mm/yr to 105.6 mm/yr and from 82.4 mm/yr to 106.9 mm/yr, respectively. On the other profile lines, we observe decreasing subsidence rates, for example, on the BD-2 profile across Baoding and the CZ-1 profile across Cangzhou (Figure 6). At distances between 11 and 15 km (from west to east) on profile BD-2, the subsidence velocity slows down from 2016 to 2018. The CZ-1 profile indicates that, at distances from 0 to 5 km, a small zone of subsidence slows down to the north and east. Combined with the statistical chart in Figure 3, these results indicate that the development of subsidence in the PP and CP was relatively stable from 2016 to 2018 and even slowed down in some areas, such as Baoding and Cangzhou. In contrast, the subsidence in the LP increased between 2016 and 2018, especially in the coastal areas of Tangshan.

4.2. Validation

In this section, we assess the precision and consistency of the subsidence rates derived from the individual SAR datasets. To evaluate the precision of the results, the InSAR-derived vertical displacement rates are compared with independent levelling measurements. In this study, 23 ground levelling survey benchmarks were acquired annually from September 2017 to September 2018 (shown in Figure 1 as red dots). Then, the average displacement of the pixels within a certain radius (100 m in our case) centered on each benchmark was obtained as the corresponding InSAR measurement. Figure 7 shows the comparison of the levelling data with the subsidence velocities obtained by two S1A datasets, showing generally good agreement. However, at some locations, differences of a few millimeters are detected. To investigate these differences, the root-mean-square error (RMSE) of the difference between the InSAR and levelling measurements is calculated for each levelling point, and the maximum and minimum errors between the two measurements are calculated. The overall RMSEs are 5.5 mm/yr and 7.2 mm/yr for tracks 142 and 69, respectively. The maximum and minimum errors for track 142 are 11.6 mm/yr and 0.2 mm/yr, respectively, and those for track 69 are 13.5 mm/yr and 1.0 mm/yr. Hence, the difference between the InSAR and levelling measurements is partially attributable to the differences in the location and acquisition time between the levelling and InSAR observations.
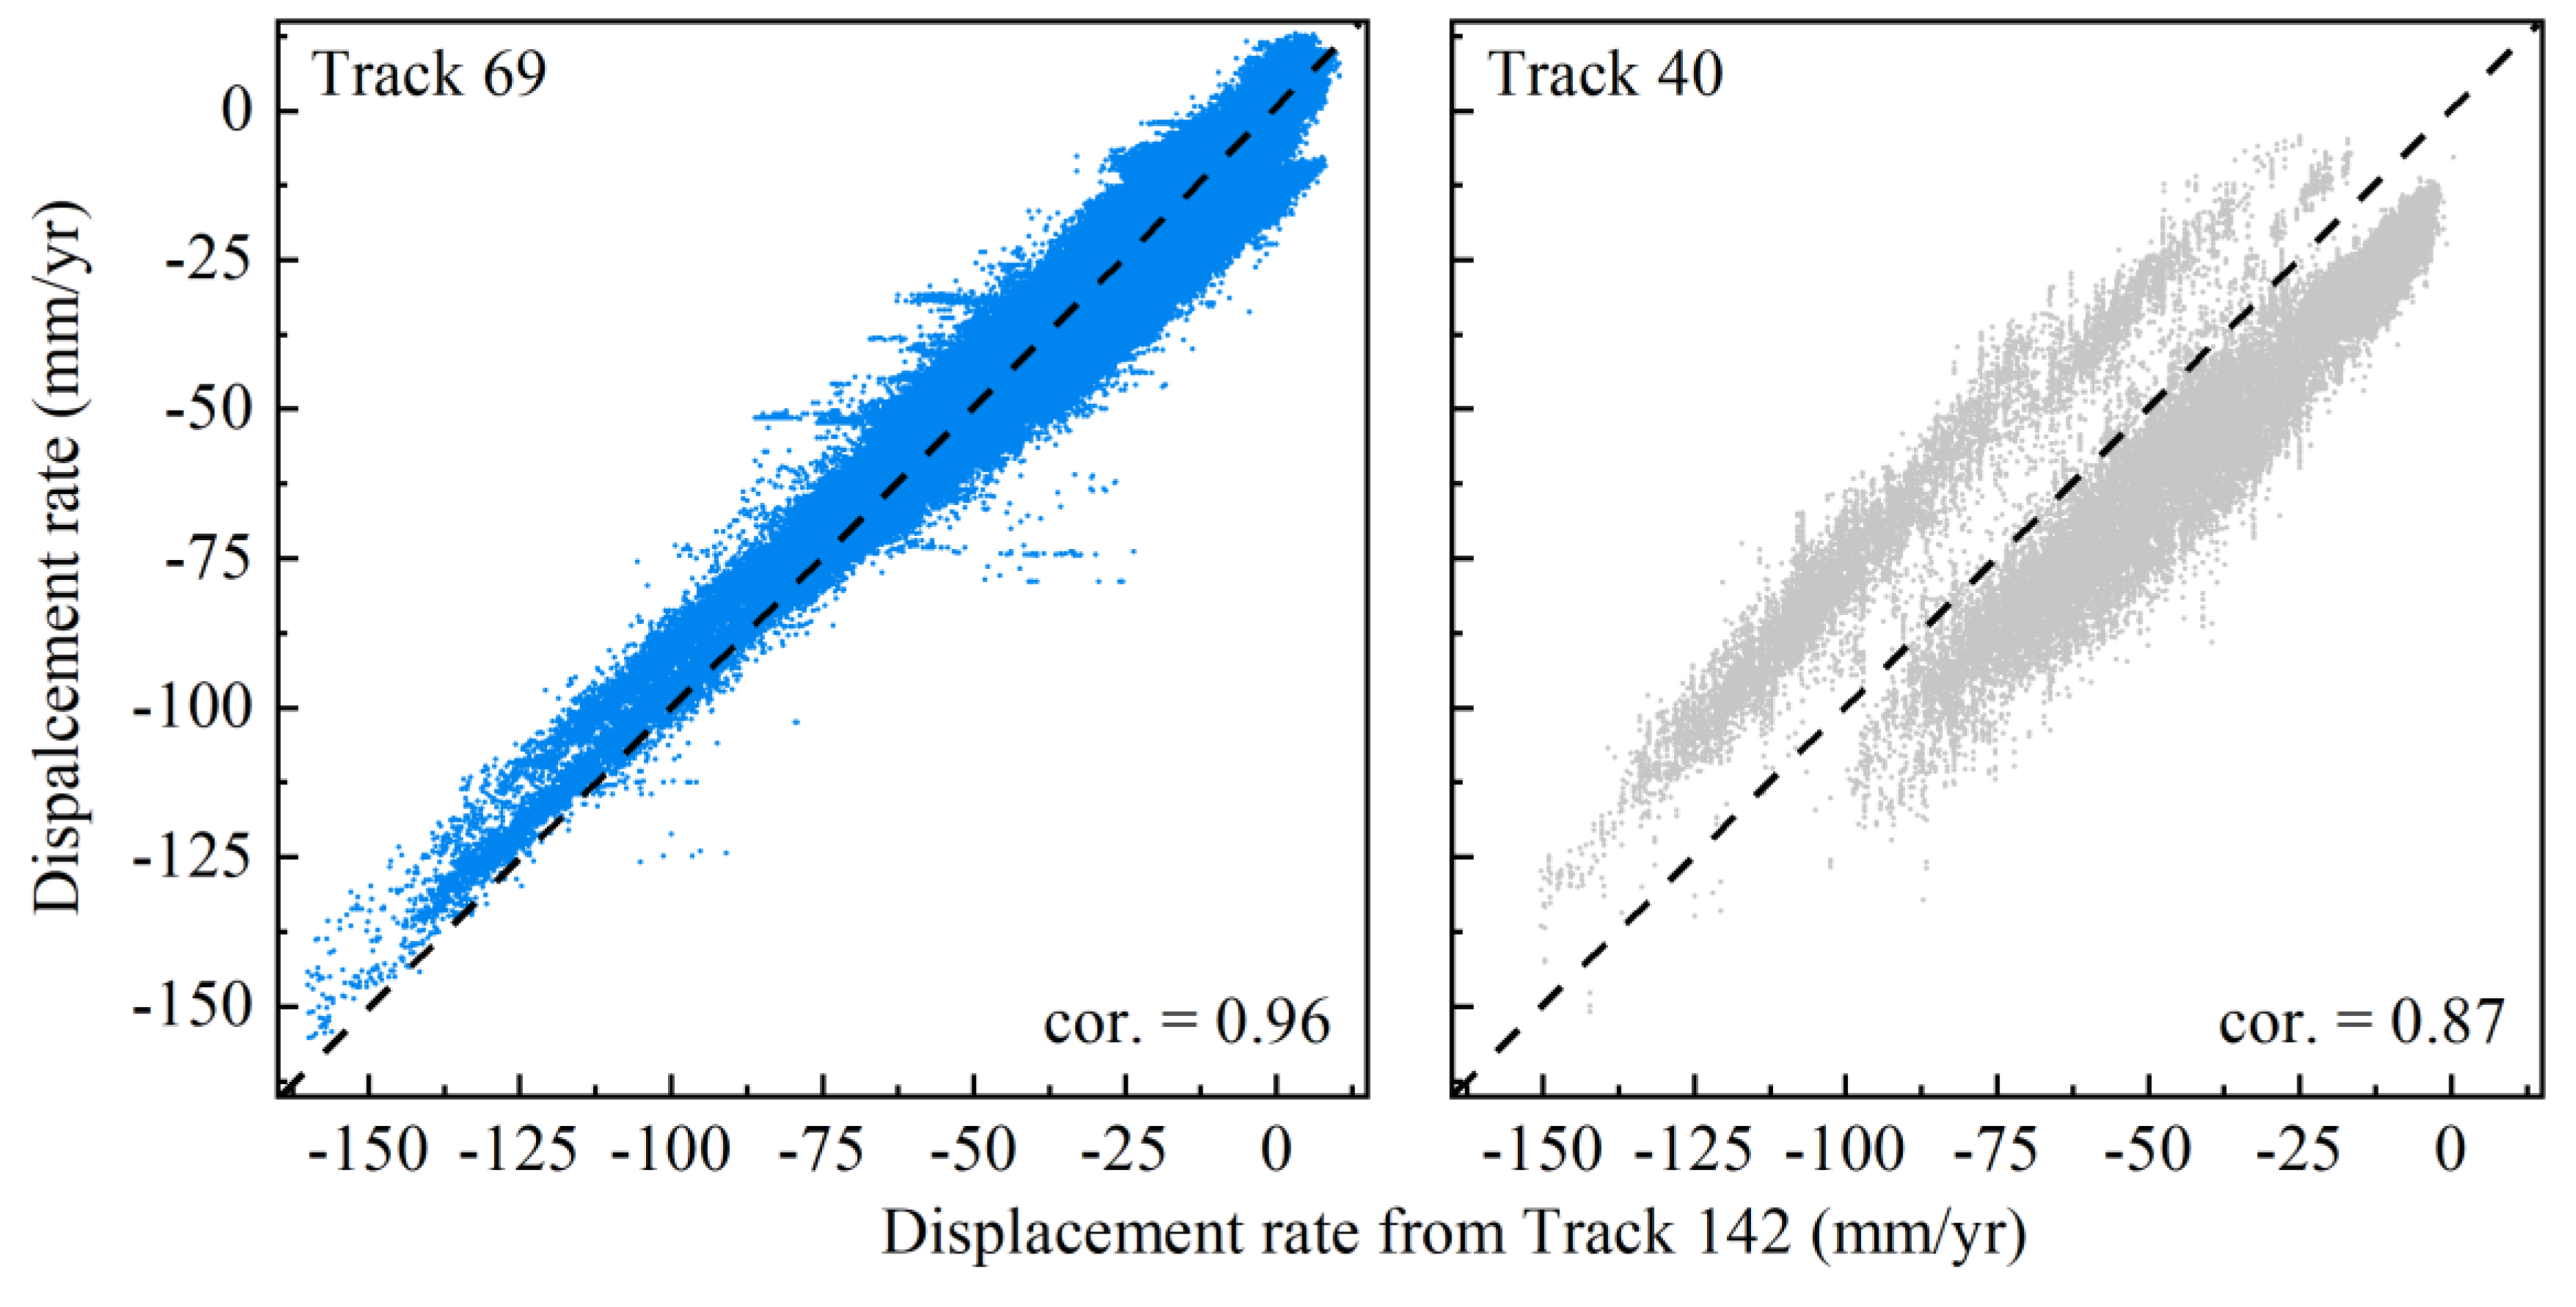
To assess the consistency, the results from different datasets are compared by converting the results into vertical displacements and by resampling them onto a grid, where the size of each grid cell is 5 × 5 km. The vertical displacements from tracks 69 and 40 are then compared with the results from track 142 in the overlapping areas between the two pairs of datasets. The correlations between the displacement rates of track 142 and track 69 and between those of track 142 and track 40 are 0.96 and 0.87, respectively (Figure 8). The overall good agreement among the results from the three different S1A datasets indicates the reliability of the results for further analysis.

5. Discussion

5.1. Comparison with Groundwater Levels

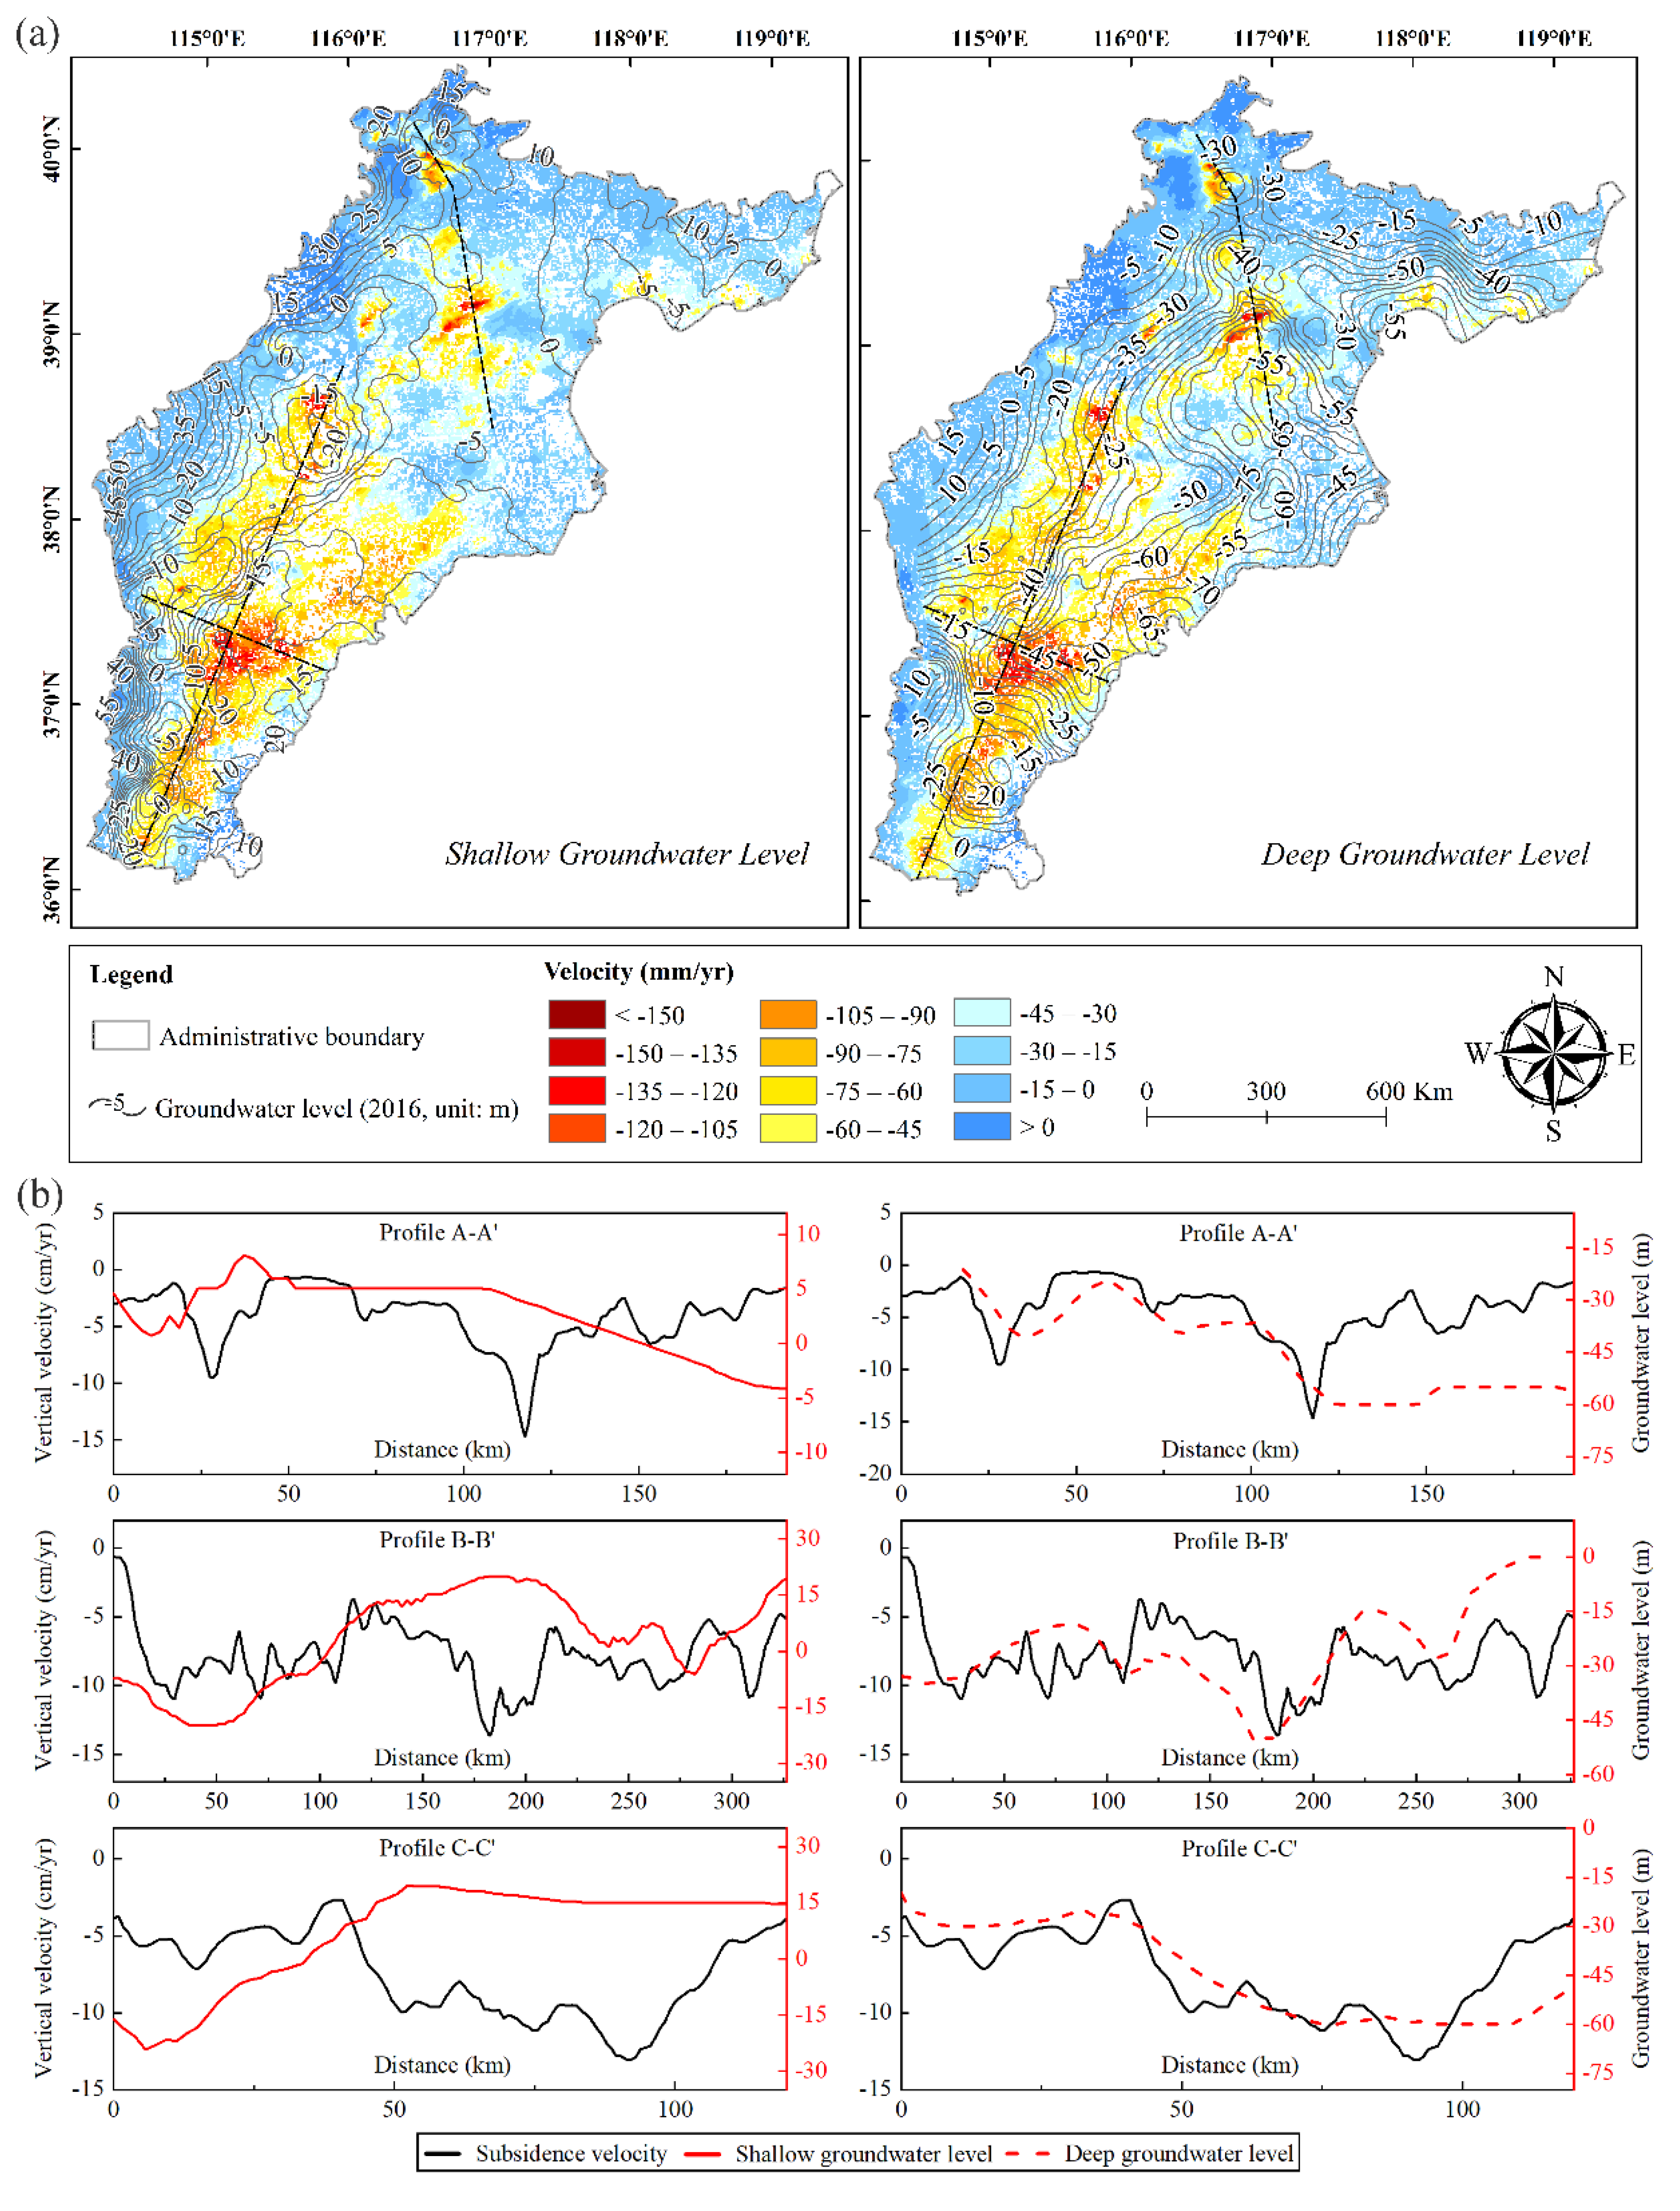
As illustrated in Figure 9a, areas with high subsidence rates always correspond to low groundwater levels. The groundwater level contours drawn in Figure 9a are obtained from the China Geological Environmental Monitoring Institute (http://geocloud.cgs.gov.cn/). The distribution of land subsidence over the study region matches the spatial distribution of the sinking groundwater table, especially that of the deep groundwater level, as shown in the right panel of Figure 9a. As mentioned in Section 2, the shallow groundwater aquifer refers collectively to aquifers 1 and 2, whereas the deep groundwater aquifer refers collectively to aquifers 3 and 4. According to profiles A-A’, B-B’, and C-C’ shown in Figure 9a, the shallow groundwater levels, deep groundwater levels, and subsidence velocities along the profiles are extracted to further analyze the spatial correlation between the hydraulic head level and land subsidence. Figure 9b shows the comparison between the hydraulic head levels from different aquifers and the InSAR-measured subsidence along selected profile lines. As shown in Figure 9b, the spatial distributions of the subsidence centers and the deep groundwater depression cones are fully aligned with each other with regard to profiles A-A’, B-B’, and C-C’. In other words, the subsidence centers are correlated with relatively low deep groundwater levels.
On profile B-B’ at distances between 0 and 120 km and between 240 and 285 km, the distribution of subsidence is similar to that of the shallow groundwater level. Similarly, on profile C-C’, the subsidence distribution matches the shallow groundwater level distribution at distances between 0 and 45 km. In contrast, these two distributions are not consistent on the other sections. Groundwater exploitation in the NCP since the 1970s has lowered the hydraulic heads in the aquifers and formed groundwater depressions. A previous study pointed out that groundwater depressions are widespread in the PP, while deep groundwater depressions are distributed mainly in the middle and eastern NCP [39,45,46] (shown in the left panel of Figure 1a). According to Terzaghi’s theory, groundwater overexploitation has caused a shift in the pore fluid pressure, causing an equivalent change in the effective stress within the aquifer system that compresses the aquifer system skeleton under the new load [47,48]. Thus, subsidence has occurred. Compared with the shallow aquifer, the groundwater within the deep aquifer has a poor ability to recharge within the study region [49]. Therefore, the contradiction attributed to the unbalanced replenishment of the deep aquifer is more prominent than that of the shallow aquifer, and hence, the spatial response of the former to subsidence is more obvious.

5.2. Comparison with Land Use

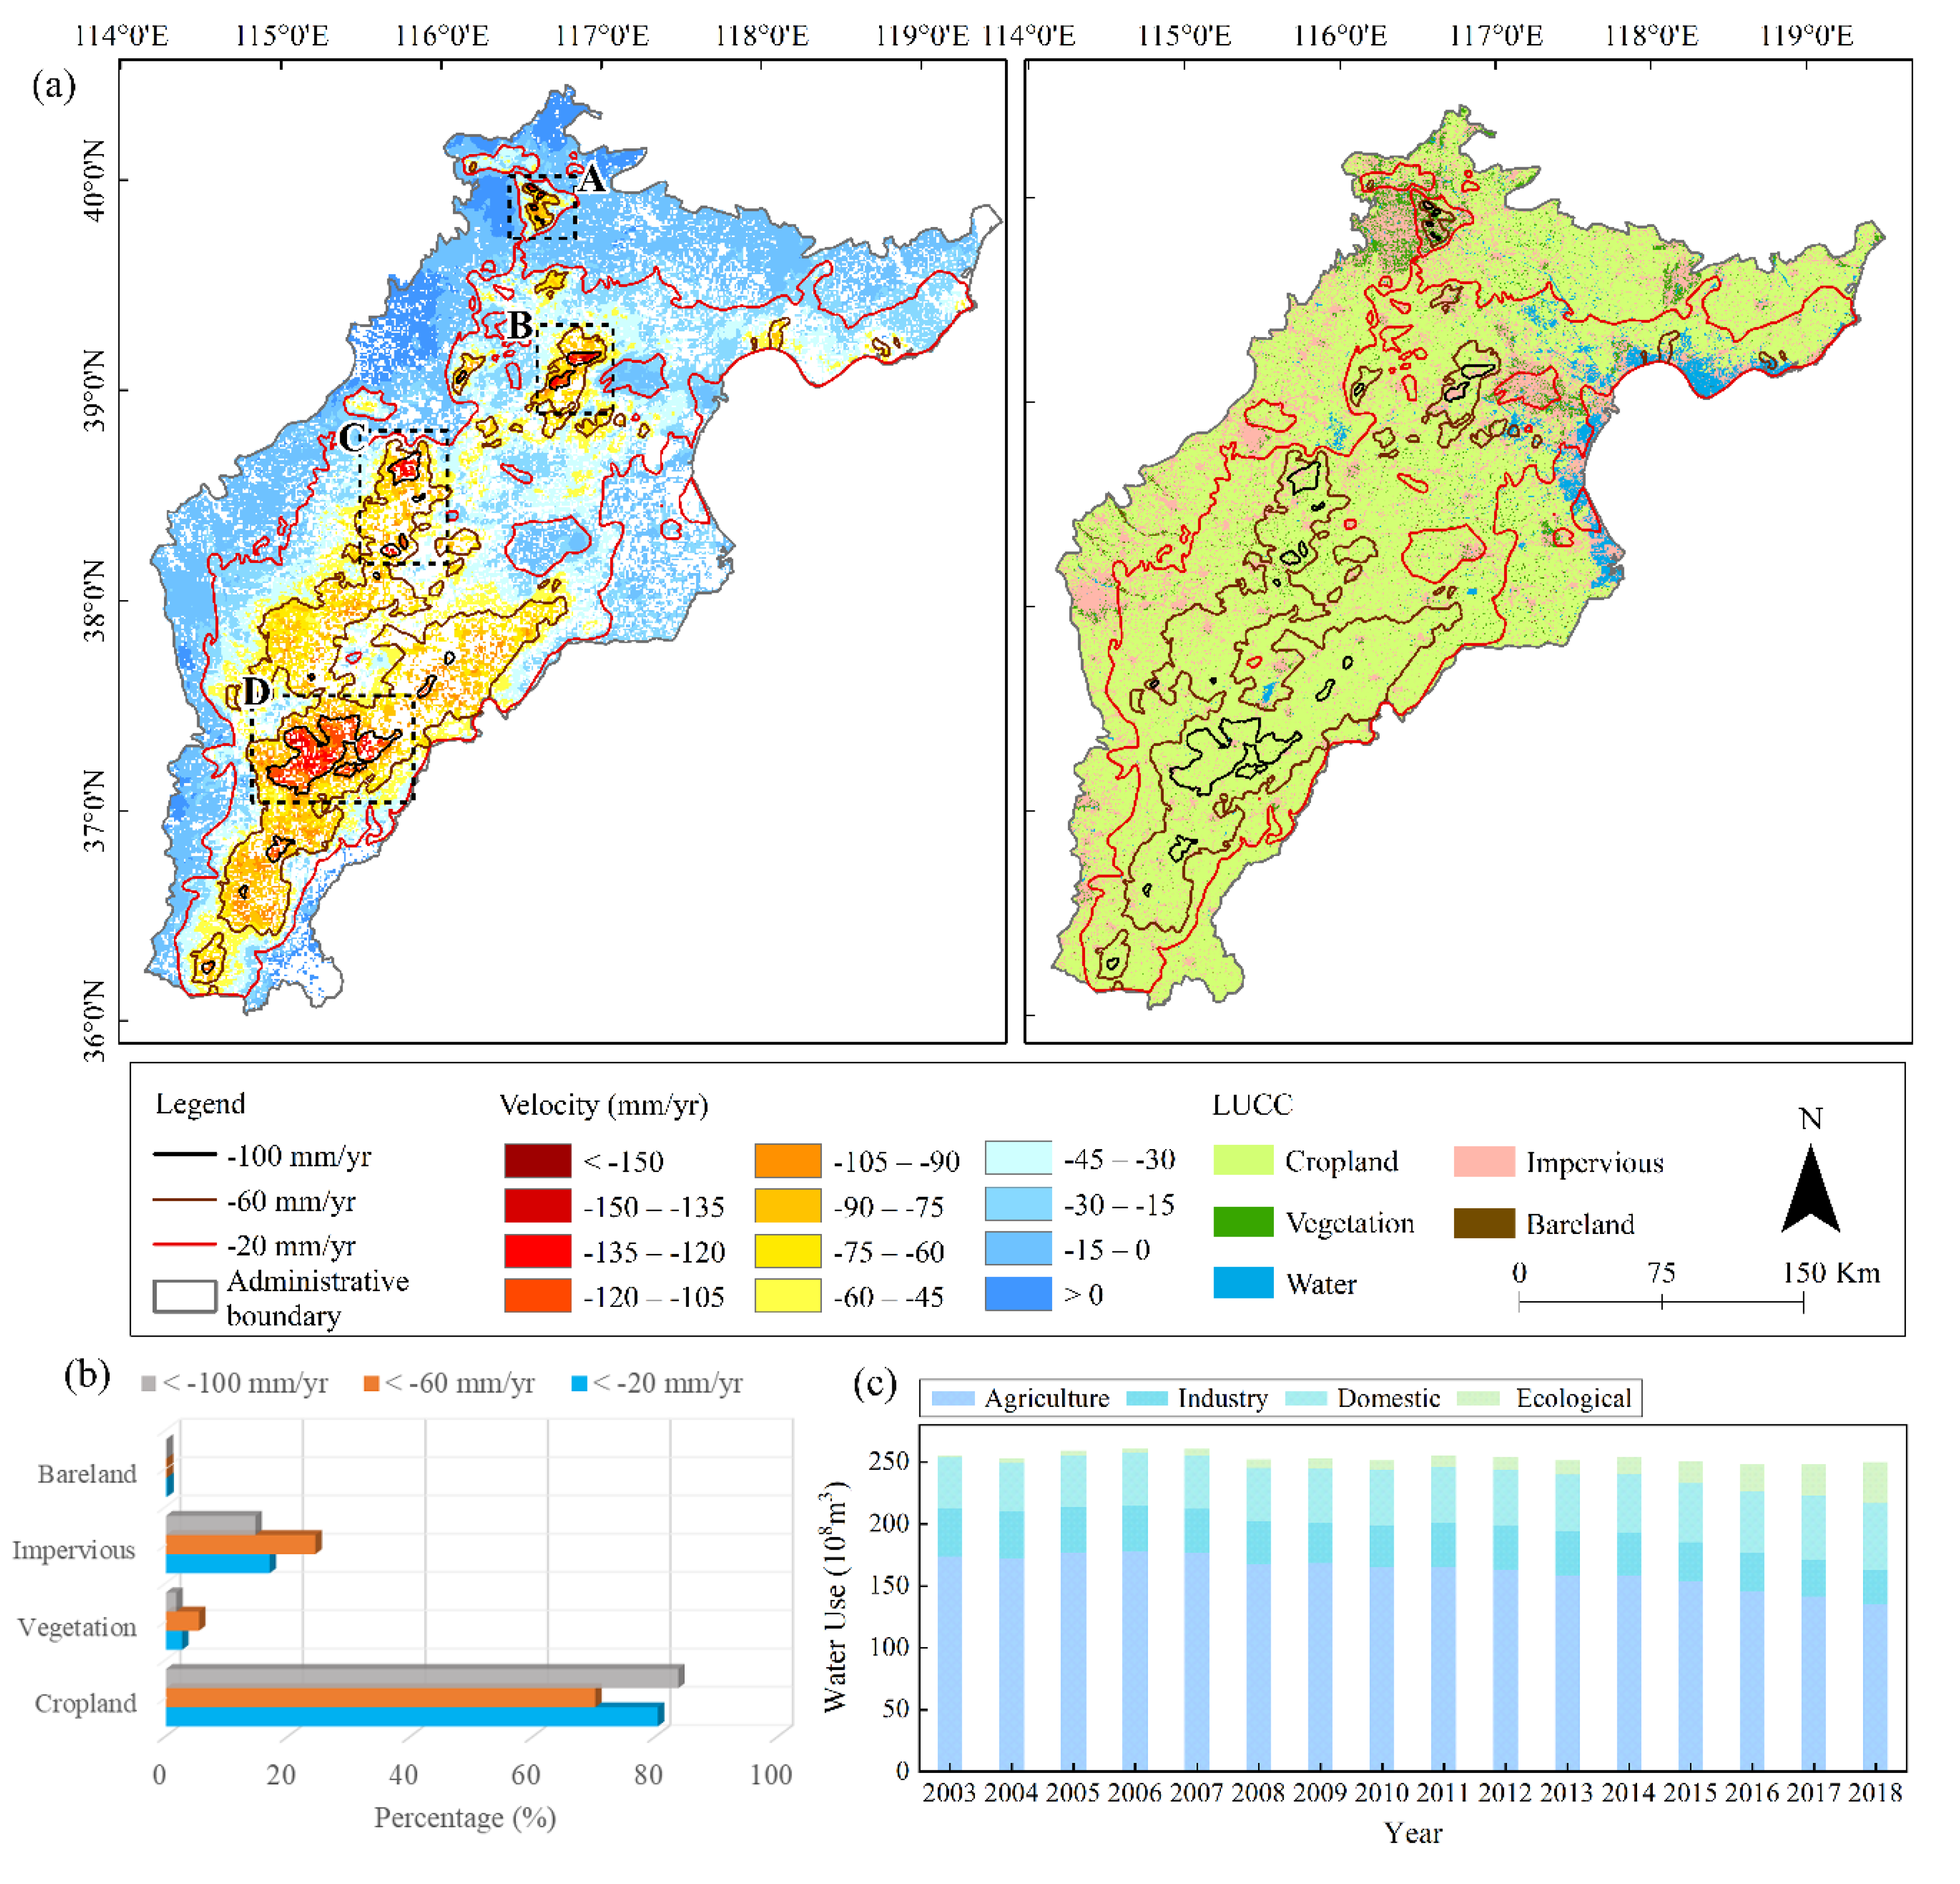
Figure 10a depicts a contour map of the 40-mm interval superimposed onto the InSAR-measured subsidence and highlights four subsidence areas with maximum velocities over 100 mm/yr (marked A to D in the left panel). To examine the land use types corresponding to different magnitudes of subsidence, the land use classification is obtained from the Finer Resolution Observation and Monitoring–Global Land Cover (FROM-GLC10) map provided by Tsinghua University (http://data.ess.tsinghua.edu.cn/) with a resolution of 10 m. In this study, we integrated the classification results, and the final outcome is illustrated in the right panel of Figure 10a. The entire region is categorized into five main classes: cropland, vegetation, water, impervious land, and bare land. Figure 10b shows the statistics of these land use types within the ranges of different subsidence contours. In the areas with subsidence greater than 20, 60, and 100 mm, cropland is the most distributed land use type, followed by impervious land. As illustrated in Figure 10c, from 2003 to 2018, the percentage of agricultural water consumption ranged from 68% to 54% of the total water withdrawn. Agricultural water evidently consumes a large portion of the water in the study area. In the NCP, irrigation water is mostly pumped from groundwater, and high-intensity exploitation for irrigation causes the NCP to experience severe groundwater depletion [50,51]. Therefore, throughout the study area, agricultural planting has a major impact on land subsidence.
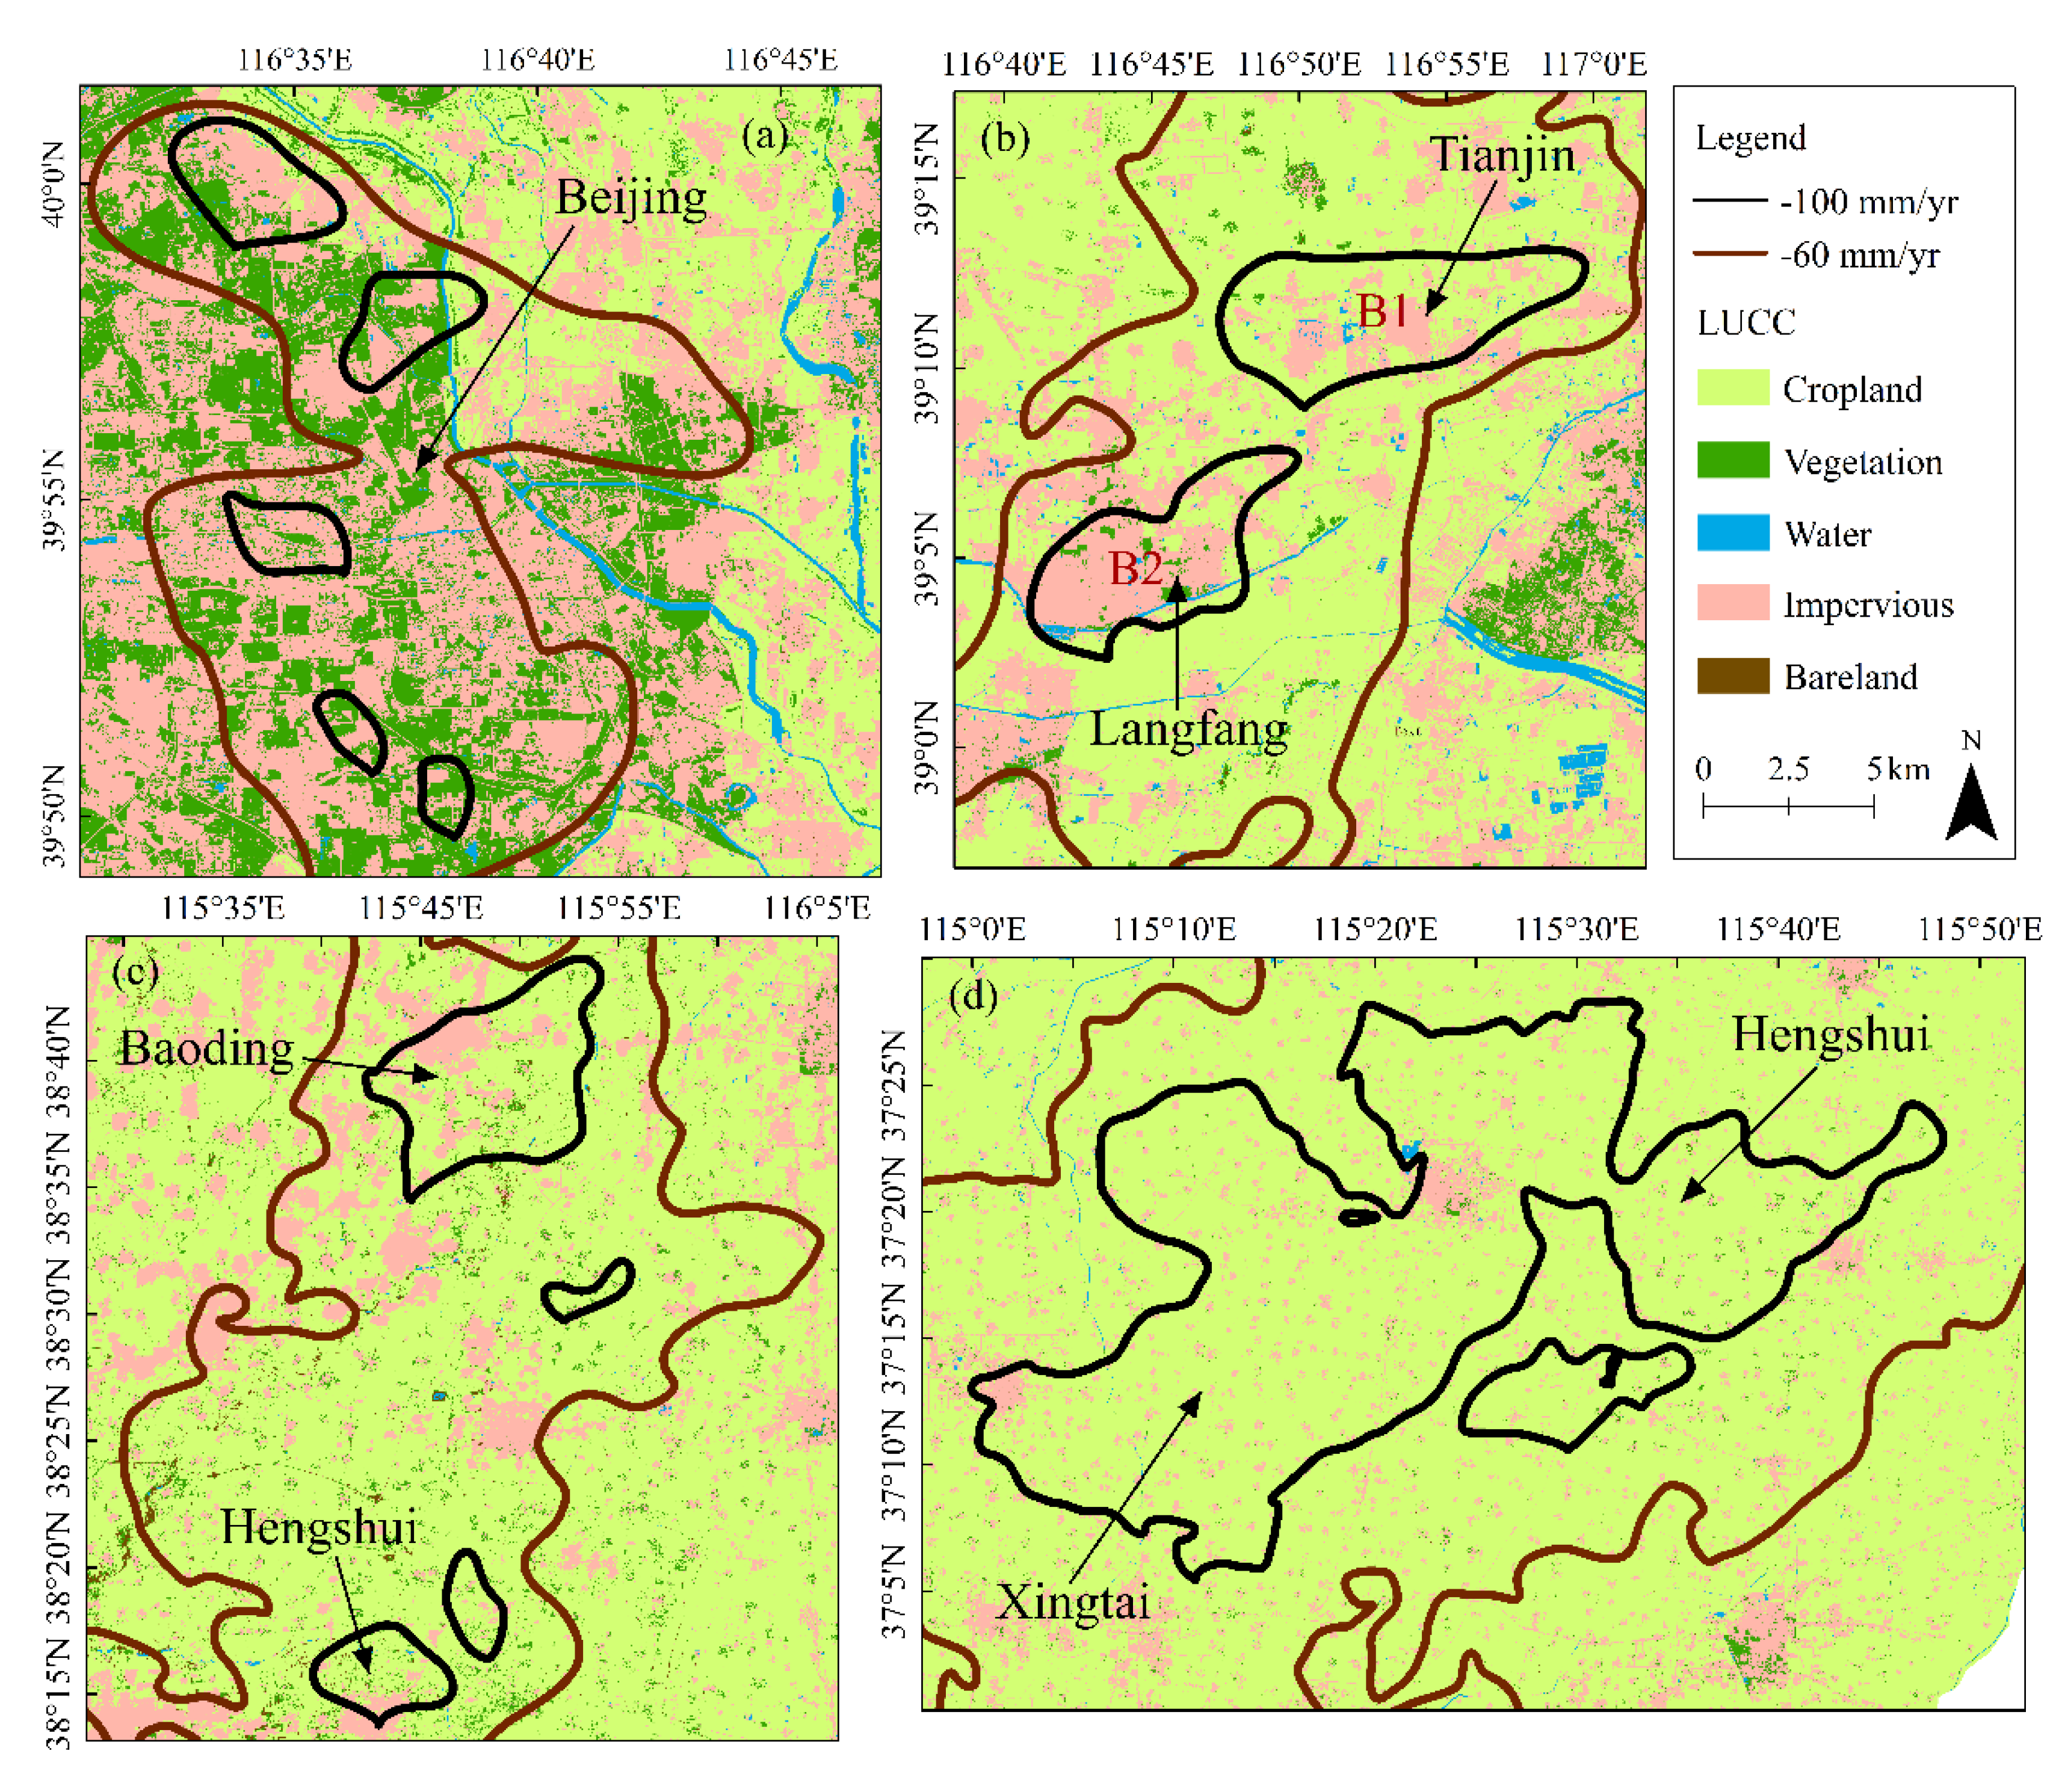
Figure 11 shows magnified views of the land use types in the four selected zones marked with black rectangles in Figure 10a (left panel). The detailed statistical information of these subsidence zones with velocities exceeding 100 mm/yr is provided in Table 3. In zone A, land subsidence occurs mainly in urban areas, and the main land use type in the areas with subsidence rates over 100 mm/yr is impervious land. In zone B, the main land use types in the area with subsidence rates over 100 mm/yr are cropland and impervious land, and their ratio is close to 1:1. As illustrated in Figure 11, there are considerable differences between the land use types in the two areas in zone B (marked B1 and B2) with subsidence rates exceeding 100 mm/yr. In zone B1, the major land use type is impervious land, but that in zone B2 is cropland. In zones C and D, the main land use types are cropland in the areas with subsidence velocities over 100 mm/yr; the ratios between cropland and impervious land are 1:3.7 and 1:9.4 for zones C and D, respectively.

5.3. Other Factors

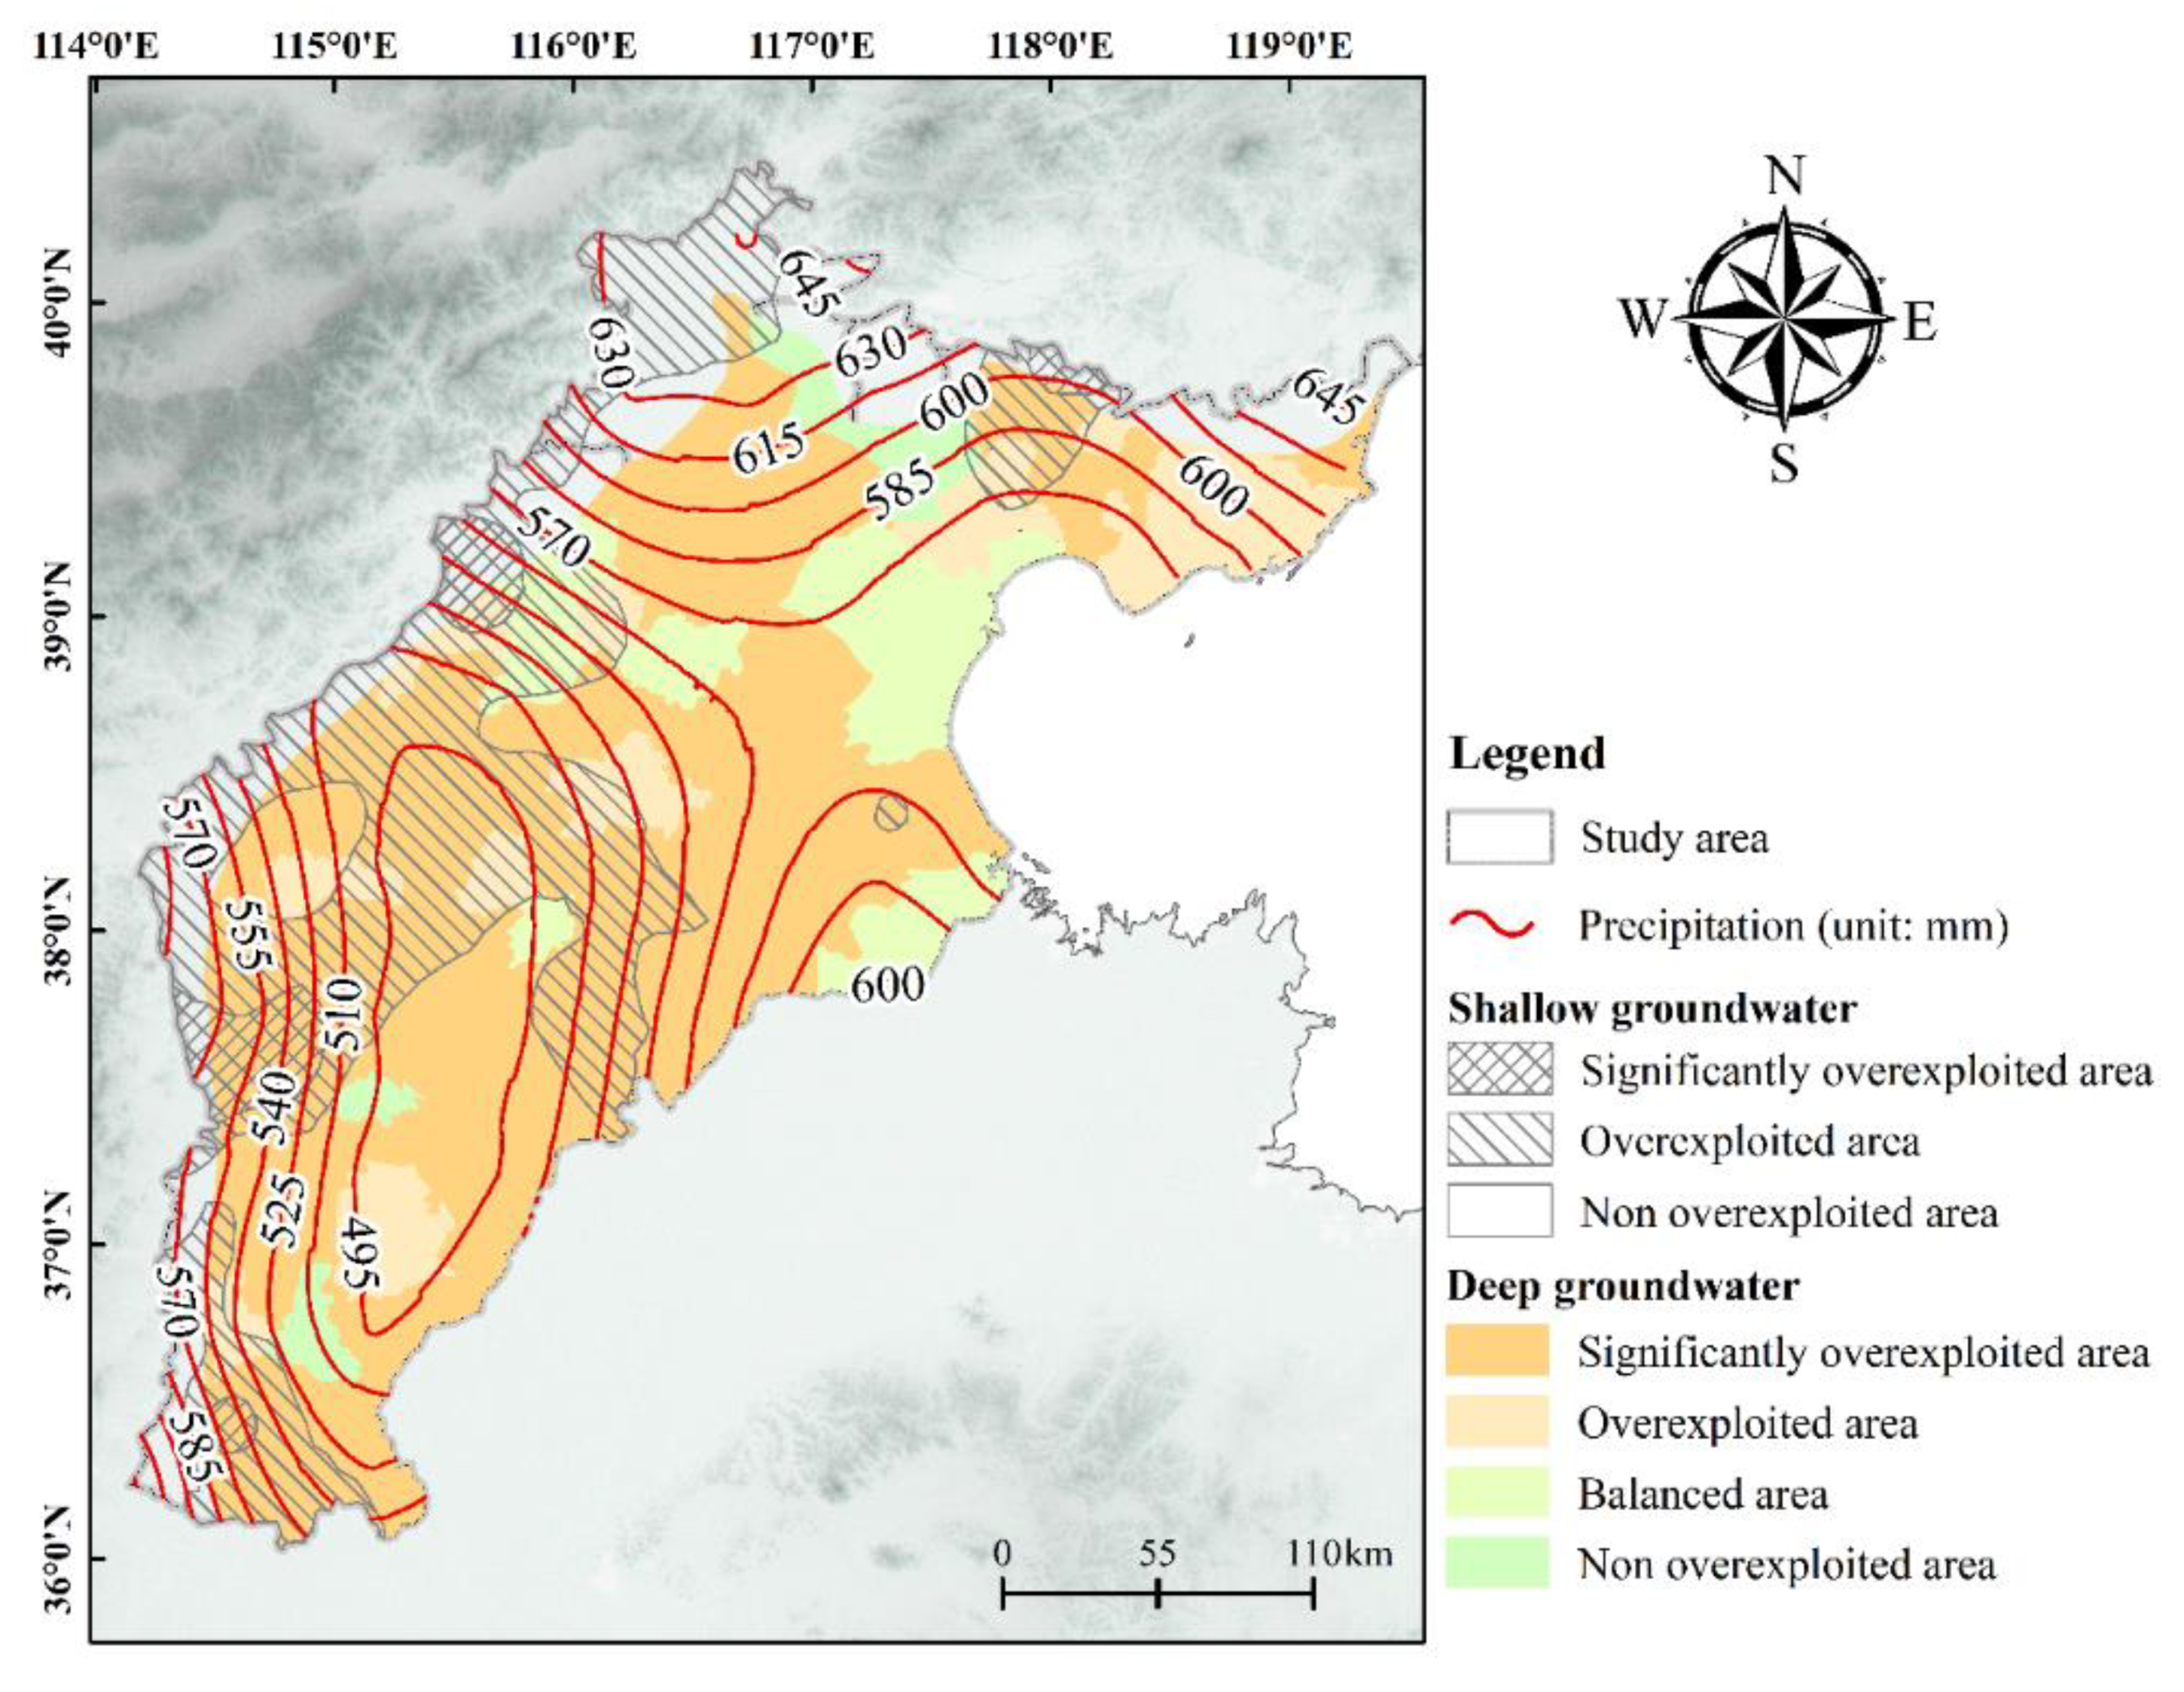
As mentioned in Section 2, the NCP is divided into three main hydrogeological units. From the PP to the CP and the LP, the aquifer systems change from a single aquifer consisting of sandy gravel to a multilayer structure comprising sand separated by silt or clay layers. The NCP began to exploit and apply groundwater on a large scale since the 1970s; consequently, groundwater overexploitation problems exist in many areas at present. The areas in which shallow groundwater is overexploited are distributed mainly in the PP, and those in which deep groundwater is overexploited are distributed mainly in the CP and LP (Figure 12). Deep groundwater is characterized by slower renewal and less recharge than shallow groundwater [52,53]. Furthermore, precipitation is the main source of groundwater replenishment in the NCP: the spatial distribution gradually weakens from the PP to the LP and then increases [54,55]. The alluvial-proluvial fan area easily accepts recharge in the form of lateral inflow in the PP, and the conditions supplying atmospheric precipitation are relatively good. In contrast, groundwater presents weak rechargeability in the CP and LP due to the relatively poor groundwater recharge conditions therein. Therefore, under the same groundwater exploitation intensity, the CP and LP are more prone to land subsidence.
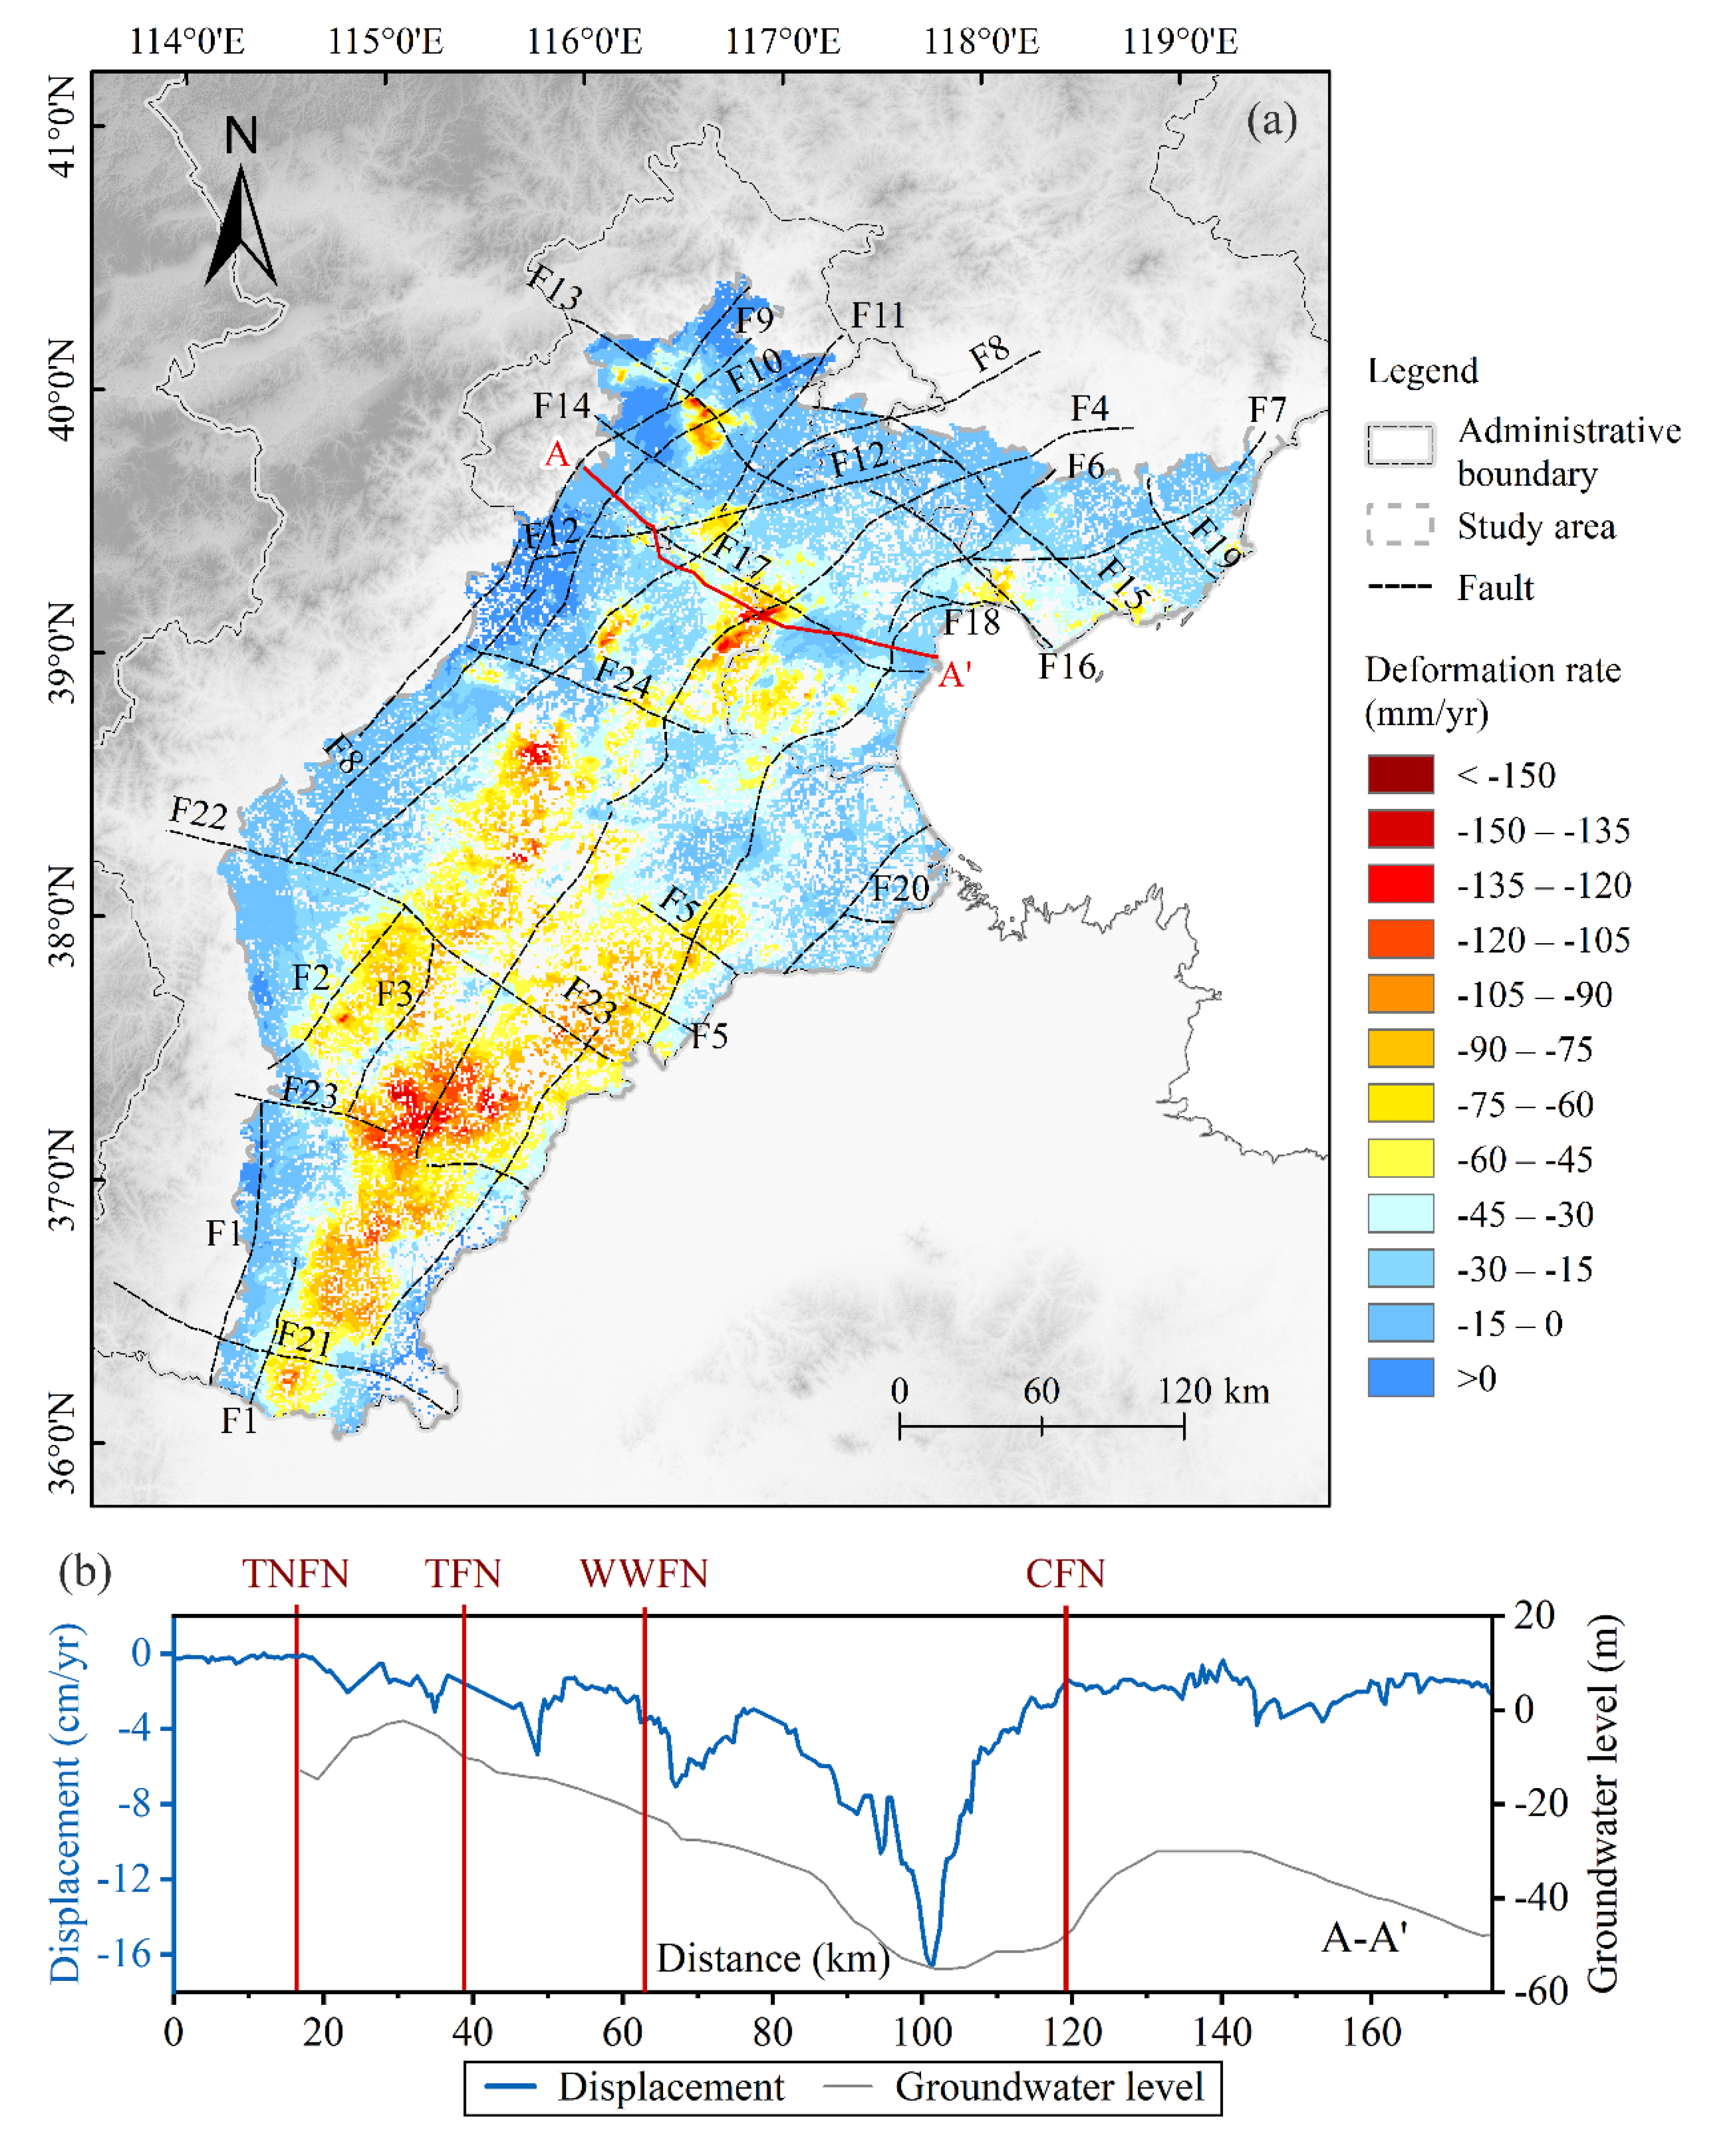
The development of subsidence is controlled by faults, and the main deformation direction is basically parallel to the fracture direction in the NCP [27,57,58,59,60]. Figure 13 demonstrates that faults coincide with the boundaries of subsidence areas, while greater subsidence rates are directly related to the groundwater level. The information of faults in Figure 13 are shown in Table 4. As seen from Figure 13a, there are several active fault zones, and sharp gradients in subsidence are observed across the faults in the study area. Figure 13b shows an example of the average subsidence in four fault zones along profile AA’: the Tongxian–Nanyuan fault zone (TNFN), eastern Taihang fault zone (TFZ), Wuqing–Wenan fault zone (WWFN) and Cangdong fault zone (CFZ). The profile of the average displacement rate along AA’ shows marked differential differences on both sides of these faults, especially WWFN and CFN, with displacement gradients up to 160 mm/yr. These high-velocity gradients correlate with faults, indicating that these faults coincide with the boundaries of the subsidence areas. We observe a significant subsidence center correlated with a relatively low groundwater level, particularly between the WWFN and CFN. In addition, land subsidence is also connected with compressible quaternary layers, urbanization, and geothermal and oil exploitation [61,62,63].

6. Conclusions

In this paper, we first applied SARProZ MT-InSAR technology to multi-track Sentinel-1A images collected from 2016 to 2018 to detect the spatial and temporal distributions of land subsidence across the NCP. The vertical displacements were estimated to have a maximum value of approximately −165.4 mm/yr. The InSAR results are in good agreement with ground levelling measurements and were cross-validated, indicating the reliability of our results. During the observation period, the rates and spatial distributions of subsidence in the PP and CP have remained unchanged for at least three years. In contrast, in the LP, especially in the coastal areas of Tangshan and Qinhuangdao, the subsidence rates have increased and the spatial distribution has expanded significantly. An analysis of the observed displacements coupled with information obtained from geological mapping and groundwater level data illustrates that the distribution and development pattern of land subsidence in the NCP is correlated with deep groundwater exploitation and is controlled by geological structures. Moreover, comparing InSAR-derived subsidence maps with maps of land use types demonstrates that groundwater pumping for agricultural activities is the major mechanism causing land subsidence in the northwestern NCP.

Supplementary Materials

The following are available online at https://www.mdpi.com/2072-4292/12/21/3579/s1, Figure S1: Profiles of the InSAR vertical displacement (2016-2018) marked by the black dashed lines in Figure 5, Table S1: Incidence angle for the Sentinel-1A datasets used in this study.

Author Contributions

Conceptualization, H.G.; methodology, M.S.; software, M.S. and S.Z.; validation, B.C. and C.Z.; formal analysis, M.S. and M.G.; writing—original draft preparation, M.S.; writing—review and editing, M.G. and S.Z.; project administration, H.G. and B.C.; funding acquisition, H.G. and B.C. All authors have read and agreed to the published version of the manuscript.

Funding

This research was funded by National Natural Science Foundation of China (41930109 and 41771455), Beijing Outstanding Young Scientist Program (BJJWZYJH01201910028032), Beijing Youth Top Talent Project, Beijing Municipal Natural Science Foundation (8182013), the program of Beijing Scholars, and the National “Double-Class” Construction of University Projects.

Acknowledgments

We thank the European Space Agency for their great efforts in developing and distributing the remotely sensed SAR data and for their generosity in making Sentinel-1 available at no cost. We also thank the China Geological Survey (CGS) for the groundwater contour data released to the public and Tsinghua University for the Finer Resolution Observation and Monitoring of Global Land Cover (FROM-GLC) data released to the public.

Conflicts of Interest

The authors declare no conflict of interest.

References

  1. Fei, Y.; Zhang, Z.; Zhang, F.; Wang, Z.; Chen, Z.; Chen, J.; Qian, Y.; Li, Y. An analysis of the influence of human activity and climate change on water resources of the North China Plain. ACTA Geosci. SNICA 2007, 28, 567–571. [Google Scholar]
  2. Wu, Y. Mechanism analysis of hazards caused by the interaction between groundwater and geoenvironment. Environ. Geol. 2003, 44, 811–819. [Google Scholar] [CrossRef]
  3. Tomás, R.; Márquez, Y.; Lopez-Sanchez, J.M.; Delgado, J.; Blanco, P.; Mallorquí, J.J.; Martínez, M.; Herrera, G.; Mulas, J. Mapping ground subsidence induced by aquifer overexploitation using advanced Differential SAR Interferometry: Vega Media of the Segura River (SE Spain) case study. Remote Sens. Environ. 2005, 98, 269–283. [Google Scholar] [CrossRef]
  4. Chaussard, E.; Wdowinski, S.; Cabral-Cano, E.; Amelung, F. Land subsidence in central Mexico detected by ALOS InSAR time-series. Remote Sens. Environ. 2014, 140, 94–106. [Google Scholar] [CrossRef]
  5. Caló, F.; Notti, D.; Galve, J.P.; Abdikan, S.; Görüm, T.; Pepe, A.; Şanli, F.B. DInSAR-based detection of land subsidence and correlation with groundwater depletion in konya plain, Turkey. Remote Sens. 2017, 9, 83. [Google Scholar] [CrossRef] [Green Version]
  6. Haghshenas, M.; Motagh, M. Ground surface response to continuous compaction of aquifer system in Tehran, Iran: Results from a long-term multi-sensor InSAR analysis. Remote Sens. Environ. 2019, 221, 534–550. [Google Scholar] [CrossRef]
  7. Gee, D.; Sowter, A.; Grebby, S.; De Lange, G.; Athab, A.; Marsh, S.; Ng, N.; Kingdom, U. National geohazards mapping in Europe: Interferometric analysis of the Netherlands. Eng. Geol. 2019, 256, 1–22. [Google Scholar] [CrossRef]
  8. Del Soldato, M.; Farolfi, G.; Rosi, A.; Raspini, F.; Casagli, N. Subsidence evolution of the Firenze-Prato-Pistoia plain (Central Italy) combining PSI and GNSS data. Remote Sens. 2018, 10, 1146. [Google Scholar] [CrossRef] [Green Version]
  9. Mateos, R.M.; Ezquerro, P.; Luque-Espinar, J.A.; Béjar-Pizarro, M.; Notti, D.; Azañón, J.M.; Montserrat, O.; Herrera, G.; Fernández-Chacón, F.; Peinado, T.; et al. Multiband PSInSAR and long-period monitoring of land subsidence in a strategic detrital aquifer (Vega de Granada, SE Spain): An approach to support management decisions. J. Hydrol. 2017, 553, 71–87. [Google Scholar] [CrossRef]
  10. Ruiz-Constan, A.; Ruiz-Armenteros, A.M.; Martos-Rosillo, S.; Galindo-Zaldivar, J.; Lazecky, M.; Garcia, M.; Sousa, J.J.; Sanz de Galdeano, C.; Delgado-Blasco, J.M.; Jimenez-Gavilan, P.; et al. SAR interferometry monitoring of subsidence in a detritic basin related to water depletion in the underlying confined carbonate aquifer (Torremolinos, southern Spain). Sci. Total. Env. 2018, 636, 670–687. [Google Scholar] [CrossRef]
  11. Asselen, S.V.; Erkens, G.; Stouthamer, E.; Woolderink, H.A.G.; Geeraert, R.E.E.; Hefting, M.M. The relative contribution of peat compaction and oxidation to subsidence in built-up areas in the Rhine-Meuse delta, The Netherlands. Sci. Total. Environ. 2018, 636, 177–191. [Google Scholar] [CrossRef]
  12. Del, M.; Tomás, R.; Pont, J.; Herrera, G. A multi-sensor approach for monitoring a road bridge in the Valencia harbor (SE Spain) by SAR Interferometry (InSAR). Rend. Online Soc. Geol. It. 2016, 41, 235–238. [Google Scholar] [CrossRef] [Green Version]
  13. Dai, K.; Liu, G.; Li, Z.; Ma, D.; Wang, X.; Zhang, B.; Tang, J.; Li, G. Monitoring highway stability in permafrost regions with X-band temporary scatterers stacking InSAR. Sensors 2018, 18, 1876. [Google Scholar] [CrossRef] [PubMed] [Green Version]
  14. Wang, H.; Chang, L.; Markine, V. Structural health monitoring of raliway transition zones using satellite radar data. Sensors 2018, 18, 413. [Google Scholar] [CrossRef] [Green Version]
  15. Ezquerro, P.; Del Soldato, M.; Solari, L.; Tom, R.; Raspini, F.; Ceccatelli, M.; Fern, A.; Casagli, N.; Herrera, G. Vulnerability Assessment of Buildings due to Land Subsidence Using InSAR Data in the Ancient Historical City of Pistoia (Italy). Sensors 2020, 20, 2749. [Google Scholar] [CrossRef] [PubMed]
  16. Chen, W.; Gong, H.; Chen, B.; Liu, K.; Gao, M.; Zhou, C. Spatiotemporal evolution of land subsidence around a subway using InSAR time-series and the entropy method. GIScience Remote Sens. 2017, 54, 78–94. [Google Scholar] [CrossRef]
  17. Yang, Q.; Ke, Y.; Zhang, D.; Chen, B.; Gong, H.; Lv, M.; Zhu, L.; Li, X. Multi-scale analysis of the relationship between land subsidence and buildings: A case study in an eastern Beijing Urban Area using the PS-InSAR technique. Remote Sens. 2018, 10, 1006. [Google Scholar] [CrossRef] [Green Version]
  18. Zhou, C.; Gong, H.; Chen, B.; Li, X.; Li, J.; Wang, X.; Gao, M.; Si, Y.; Guo, L.; Shi, M.; et al. Quantifying the contribution of multiple factors to land subsidence in the Beijing Plain, China with machine learning technology. Geomorphology 2019, 335, 48–61. [Google Scholar] [CrossRef]
  19. Zhang, J.; Chu, L.; Xiao, Z.; Lu, Z.; Shen, R.; Chen, Y. Main progress and achievements of land subsidence survey and monitoring in Hebei Plain. Geol. Surv. CHINA 2014, 1, 45–50. [Google Scholar]
  20. Lyu, M.; Ke, Y.; Li, X.; Zhu, L.; Guo, L. Detection of seasonal deformation of highway overpasses using the PS-InSAR technique: A case study in Beijing urban area. Remote Sens. 2020, 18, 3071. [Google Scholar] [CrossRef]
  21. Liu, M.; Jia, S.; Chu, H. The monitoring system and technologies of land subsidence in Beijing. Geol. Resour. 2012, 21. [Google Scholar] [CrossRef]
  22. Lyu, X.; Song, L.; Shao, X.; Li, J. The suggestion and application of land subsidence monitoring in Tianjin. Shanghai L. Resour. 2017, 38, 26–30. [Google Scholar]
  23. Ferretti, A.; Prati, C.; Rocca, F. Nonlinear subsidence rate estimation using permanent scatterers in differential SAR interferometry. IEEE Trans. Geosci. Remote Sens. 2000, 38, 2202–2212. [Google Scholar] [CrossRef] [Green Version]
  24. Ferretti, A.; Prati, C.; Rocca, F. Permanent scatterers InSAR interferometry. IEEE Trans. Geosci. Remote Sens. 2000, 39, 8–20. [Google Scholar] [CrossRef]
  25. Berardino, P.; Fornaro, G.; Lanari, R.; Member, S.; Sansosti, E.; Member, S. A new algorithm for surface deformation monitoring based on Small Baseline differential SAR interferograms. IEEE Trans. Geosci. Remote Sens. 2002, 40, 2375–2383. [Google Scholar] [CrossRef] [Green Version]
  26. Luo, Q.; Perissin, D.; Zhang, Y.; Jia, Y. L- and X-Band multi-temporal InSAR analysis of Tianjin subsidence. Remote Sens. 2014, 6, 7933–7951. [Google Scholar] [CrossRef] [Green Version]
  27. Liu, P.; Li, Q.; Li, Z.; Hoey, T.; Liu, G.; Wang, C.; Hu, Z.; Zhou, Z.; Singleton, A. Anatomy of subsidence in Tianjin from time series InSAR. Remote Sens. 2016, 8, 266. [Google Scholar] [CrossRef] [Green Version]
  28. Zhou, H.; Wang, Y.; Yan, S.; Wu, Y.; Liu, Q. Land subsidence monitoring and analyzing of Cangzhou area Sentinel-1A/B based time series InSAR. Bull Surv. Map. 2017, 7, 89–93. [Google Scholar]
  29. Bai, Z.; Jin, G.; Zhang, H.; Xu, Q.; Hu, J.; Wang, B. Subsidence monitoring of Tianjin using PSInSAR technique with Sentinel-1A. J. Geomat. Sci. Technol. 2017, 34, 283–288. [Google Scholar]
  30. Lyu, M.; Ke, Y.; Guo, L.; Li, X.; Zhu, L.; Gong, H. Change in regional land subsidence in Beijing after south-to-north water diversion project observed using satellite radar interferometry. GIScience Remote Sens. 2019, 41, 140–156. [Google Scholar] [CrossRef]
  31. Zhang, T.; Shen, W.; Wu, W.; Zhang, B.; Pan, Y. Recent Surface Deformation in the Tianjin Area Revealed by Sentinel-1A Data. Remote Sens. 2019, 11, 130. [Google Scholar] [CrossRef] [Green Version]
  32. Zuo, J.; Gong, H.; Chen, B.; Liu, K.; Zhou, C.; Ke, Y. Time-Series Evolution Patterns of Land Subsidence in the Eastern Beijing Plain, China. Remote Sens. 2019, 11, 539. [Google Scholar] [CrossRef] [Green Version]
  33. Zhou, C.; Lan, H.; Gong, H.; Zhang, Y.; Timothy, A.; Clague, J.; Wu, Y. Reduced rate of land subsidence since 2016 in Beijing, China: Evidence from Tomo-PSInSAR using RadarSAT-2 and Sentinel-1 datasets. Int. J. Remote Sens. 2020, 41, 1259–1285. [Google Scholar] [CrossRef]
  34. Chen, Z.; Qi, J.; Xu, J.; Xu, J.; Ye, H.; Nan, Y. Paleoclimatic interpretation of the past 30 ka from isotopic studies of the deep confined aquifer of the North China plain. Appl Geochem. 2003, 18, 997–1009. [Google Scholar] [CrossRef]
  35. Chen, Z.; Nie, Z.; Zhang, Z.; Qi, J.; Nan, Y. Isotopes and sustainability of groundwater resources, North China Plain. Groundwater 2005, 43, 485–493. [Google Scholar] [CrossRef]
  36. Xue, X.; Li, J.; Xie, X.; Qian, K.; Wang, Y. Impacts of sediment compaction on iodine enrichment in deep aquifers of the North China Plain. Water Res. 2019, 159, 480–489. [Google Scholar] [CrossRef]
  37. Guo, H.; Zhang, Z.; Cheng, G.; Li, W.; Li, T.; Jiao, J. Groundwater-derived land subsidence in the North China Plain. Environ. Earth Sci. 2015, 74, 1415–1427. [Google Scholar] [CrossRef]
  38. Xing, L.; Guo, H.; Zhan, Y. Groundwater hydrochemical characteristics and processes along flow paths in the North China Plain. J. Asian Earth Sci. 2013, 70–71, 250–264. [Google Scholar] [CrossRef]
  39. Zhang, Z.; Shen, Z.; Xue, Y.; Ren, F.; Shi, D.; Yin, Z.; Zhong, Z.; Sun, X. Groundwater Environment Evolution in the North China Plain; Geological Publishing House: Beijing, China, 2000. [Google Scholar]
  40. Yang, Y. Land subsidence disaster prevention and cure in Beijing-Tianjin-Hebei area, China. Urban Geol. 2015, 10, 1–7. [Google Scholar]
  41. China Geological Survey. Atlas of Resources and Environment Geology in Beijing-Tianjin-Hebei Region 2015. Available online: https://www.cgs.gov.cn (accessed on 15 January 2020). (In Chinese)
  42. Guo, L.; Bo, W.; Yang, G. Characteristics of current deformation of fault belts in North China. J. Geod. Geodyn. 2003, 23, 29–36. [Google Scholar]
  43. Yao, Y. Analysis of crustal movement characteristics in the China mainland by high precision repeated measurements of GPS network. Prog. Geophys. 2008, 23, 1030–1037. [Google Scholar]
  44. Zhang, Y.; Wu, H.; Kang, Y.; Zhu, C. Ground Subsidence in the Beijing-Tianjin-Hebei Region from 1992 to 2014 Revealed by Multiple. Remote Sens. 2016, 1–17. [Google Scholar] [CrossRef] [Green Version]
  45. Fei, Y.; Miao, J.; Zhang, Z.; Chen, Z.; Song, H.; Yang, M. Analysis on evolution of groundwater depression cones and its leading factors in North China Plain. Resour. Sci. 2009, 31, 394–399. [Google Scholar] [CrossRef]
  46. Zhao, Q.; Zhang, B.; Yao, Y.; Wu, W.; Meng, G.; Chen, Q. Geodetic and hydrological measurements reveal the recent acceleration of groundwater depletion in North China Plain. J. Hydrol. 2019, 575, 1065–1072. [Google Scholar] [CrossRef]
  47. Gallyoway, D.L.; Hudnut, K.W.; Ingebritsen, S.E.; Phillips, S.P.; Peltzer, G.; Rosen, P.A. Detection of aquifer system compaction and land subsidence using interferometric synthetic aperture radar, Antelope Valley, Mojave Desert, California. Water Resour. Res. 1998, 34, 2573–2585. [Google Scholar] [CrossRef]
  48. Hoffmann, J.; Zebker, H.A.; Galloway, D.L. Seasonal subsidence and rebound in Las Vegas Valley, Nevada, observed by synthetic aperture radar interferometry. Water Resour. Res. 2001, 37, 1551–1566. [Google Scholar] [CrossRef]
  49. Zhu, J.; Guo, H.; Li, W.; Tian, X. Relationship between land subsidence and deep groundwater yield in the North China Plain. South-to-North Water Transf. Water Sci. Technol. 2014, 12, 165–169. [Google Scholar] [CrossRef]
  50. Chen, X.; Thorp, K.; Ouyang, Z.; Hou, Y.; Zhou, B.; Li, Y. Energy consumption due to groundwater pumping for irrigation in the North China Plain. Sci. Total. Environ. 2019, 669, 1033–1042. [Google Scholar] [CrossRef]
  51. Li, P.; Ren, L. Evaluating the effects of limited irrigation on crop water productivity and reducing deep groundwater exploitation in the North China Plain using an agro-hydrological model: II. Scenario simulation and analysis. J. Hydrol. 2019, 574, 715–732. [Google Scholar] [CrossRef]
  52. Russo, T.A.; Lall, U. Depletion and response of deep groundwater to climate-induced pumping variability. Nat. Geosci. 2017, 10, 105–108. [Google Scholar] [CrossRef]
  53. Li, P.; Ren, L. Evaluating the effects of limited irrigation on crop water productivity and reducing deep groundwater exploitation in the North China Plain using an agro-hydrological model: I. Parameter sensitivity analysis, calibration and model validation. J. Hydrol. 2019, 574, 497–516. [Google Scholar] [CrossRef]
  54. Wang, J.; Zhang, Y.; Wen, J.; Sun, J. Temporal and Spatial Changing Features of Climate in North China Plain. Geoscience 2015, 29, 299–306. [Google Scholar] [CrossRef]
  55. Meng, S.; Fei, Y.; Zhang, Z.; Lei, T.; Qian, Y.; Li, Y. Research on spatial and temporal distribution of the precipitation infiltration amount over the past 50 years in North China Plain. Adv. Earth Sci. 2013, 28, 923–929. [Google Scholar] [CrossRef]
  56. China Geological Survey. Results of geological survey in China: Geological survey report on supporting and serving the coordinated development of Beijing-Tianjin-Hebei region 2015. Available online: https://www.cgs.gov.cn (accessed on 26 December 2019). (In Chinese)
  57. Chen, M.; Tomás, R.; Li, Z.; Motagh, M.; Li, T.; Hu, L.; Gong, H.; Li, X.; Yu, J.; Gong, X. Imaging land subsidence induced by groundwater extraction in Beijing (China) using satellite radar interferometry. Remote Sens. 2016, 8, 468. [Google Scholar] [CrossRef] [Green Version]
  58. Hu, L.; Dai, K.; Xing, C.; Li, Z.; Tomás, R.; Clark, B.; Shi, X.; Chen, M.; Zhang, R.; Qiu, Q.; et al. Land subsidence in Beijing and its relationship with geological faults revealed by Sentinel-1 InSAR observations. Int. J. Appl. Earth Obs. Geoinf. 2019, 82. [Google Scholar] [CrossRef]
  59. Li, H.; Zhang, Y.; Meng, J. Characteristics on land subsidence in North China plain within effect of neotectonic movement. Chi. Energy Environ. Prot. 2017, 39, 57–62. [Google Scholar] [CrossRef]
  60. Gao, M.; Gong, H.; Li, X.; Chen, B.; Zhou, C.; Shi, M.; Guo, L.; Chen, Z.; Ni, Z.; Duan, G. Land subsidence and fround fissures in Beijing Capital International Airport (BCIA): Evidence from Quasi-PS InSAR analysis. Remote Sens. 2019, 11, 1466. [Google Scholar] [CrossRef] [Green Version]
  61. Duan, X.; Xu, X.; Wang, R. Land Subsidence and Its Influencing Factors in Tianjin Coastal Area. Acta Sci. Nat. Univ. Pekin. 2014, 50, 1071–1076. [Google Scholar] [CrossRef]
  62. Li, M.; Ge, D.; Zhang, L.; Liu, B.; Guo, X.; Wang, Y. Land subsidence of coastal area in southern Tangshan using PSInSAR technique. J. Eng. Geol. 2016, 24, 704–712. [Google Scholar] [CrossRef]
  63. Liu, Y. The current situation of land subsidence and its formation mechanism in the Hebei coastal province. Shanghai L. Resour. 2016, 37, 69–73. [Google Scholar] [CrossRef]
Figure 1. (a) Location of the study area and the coverage of the SAR datasets: the location of geological structures are derived from [41] and (b) the hydrogeological cross section A-A’ (revised after [34,35,36,38]).
Remotesensing 12 03579 g001
Figure 2. The framework of the multi-track processing procedure.
Remotesensing 12 03579 g002
Figure 3. (a) Mean vertical displacement velocities throughout the NCP derived from the Sentinel-1A (S1A) data by using persistent scatterer interferometric synthetic aperture radar (PS-InSAR), (b) statistics of the subsidence rates at persistent scatterer (PS) points, (c) changes in the area with subsidence over 50 mm from 2016 to 2018, and (d) changes in the maximum subsidence rates from 2016 to 2018: PP, CP, and LP represent the piedmont alluvial-proluvial plain, central alluvial-lacustrine plain, and littoral plain, respectively.
Remotesensing 12 03579 g003
Figure 4. Accumulative time-series deformation revealed by the interferometric synthetic aperture radar (InSAR) technique: the locations of the selected points are marked by black rhombus symbols in Figure 2a.
Remotesensing 12 03579 g004
Figure 5. Mean subsidence velocities derived from the S1A data: The deformation profiles passing through the various subsidence depressions are marked by black dashed lines.
Remotesensing 12 03579 g005
Figure 6. Part of profiles of the InSAR vertical displacement (2016–2018) marked by the black dashed lines in Figure 5.
Remotesensing 12 03579 g006
Figure 7. Comparison between the InSAR measurements and levelling data. The left panel shows the comparison between the Track 142 results and leveling measurements. And the right panel shows the comparison between Track 69 results and leveling measurements.
Remotesensing 12 03579 g007
Figure 8. Consistency between the vertical displacement rates derived from different datasets: the vertical displacement rate from track 142 is chosen as a reference.
Remotesensing 12 03579 g008
Figure 9. Relationships between land subsidence and hydraulic head levels: (a) overlap between hydraulic head levels and InSAR-measured subsidence and (b) the profiles A-A’, B-B’, and C-C’ drawn in the upper panel.
Remotesensing 12 03579 g009
Figure 10. (a) Contour map of the 40-mm interval superimposed onto the vertical displacement across the study area in the left panel and onto the classification of land use types in the right panel and (b) statistics of land use types within different ranges of subsidence contours.
Remotesensing 12 03579 g010
Figure 11. Magnified views of the land use classification in the four highlighted areas: the highlighted areas are marked with black rectangles in the left panel of Figure 10a. (a) ,(b), (c) and (d) show the land use type with vertical displacement rate exceeds 60 mm/yr in Zone A, B,C and D, respectively.
Remotesensing 12 03579 g011
Figure 12. Precipitation and groundwater exploitation information in the study area (the groundwater exploitation information is derived from [41,56]).
Remotesensing 12 03579 g012
Figure 13. (a) Overlap of main active faults (revised after [41]) atop InSAR displacement rates and (b) a profile of the InSAR results: the locations of faults are indicated with red columns. TNFN, TFN, WWFN, and CNF are the abbreviations for Tongxian–Nanyuan fault zone, eastern Taihang fault zone, Wuqing–Wenan fault zone, and Cangdong fault zone, respectively.
Remotesensing 12 03579 g013
Table 1. The classification of the quaternary aquifers underlying the North China Plain (NCP).
ClassificationUnderground Water TypeDepth (m)Quaternary
Aquifer 1unconfined10–50the Holocene formation (Q4)
Aquifer 2shallow confined120–210the upper Pleistocene formation (Q3)
Aquifer 3confined250–310the middle Pleistocene formation (Q2)
Aquifer 4confined350–550the lower Pleistocene formation (Q1)
Table 2. Satellite information for the data used in this study.
SatelliteTrack No.No. of ImagesDate RangOrbit DirectionPolarizationImage Mode
Sentinel-1A401657 January 2016–28 November 2018AscendingVVInterferometric wide swath
14214114 January 2016–18 October 2018
69989 January 2016–1 October 2018
Table 3. Land use conditions in zones A to D with subsidence rates greater than 100 mm/yr.
Zone ListArea (km2) Major Land Use (%)
CroplandImpervious LandVegetationBare Land
A30.766.6159.7533.570.07
B145.7750.5846.412.870.05
C1233.9489.879.520.60.02
D244.3175.2320.533.490.75
B161.8926.8766.926.150.06
B283.8768.0831.270.610.04
Table 4. Information on fault zones.
No.NameNo.Name
F1Taihang fault zoneF13Nankou–Sunhe fault zone
F2Shulu–Ningjin fault zoneF14Yongding river fault zone
F3Baichikou fault zoneF15Sanhe–Fengnan fault zone
F4Wuqing–Wenan fault zoneF16Jiyun river fault zone
F5Cangdong fault zoneF17Haihe fault zone
F6Tangshan–Ninghe fault zoneF18Hangu fault zone
F7Changli–Ninghe fault zoneF19Laoting fault zone
F8Eastern Taihang fault zoneF20Ningjin–Haixing fault zone
F9Huangzhuang–Gaoliying fault zoneF21Linzhang–Daming fault zone
F10Tongxian–Nanyuan fault zoneF22Hengshui–Dezhou fault zone
F11Xiadian–Mafang fault zoneF23Neiqiu–Qinghe fault zone
F12Zhuozhou–Baodi fault zoneF24Xushui–Dacheng fault zone
Publisher’s Note: MDPI stays neutral with regard to jurisdictional claims in published maps and institutional affiliations.