Article

Mining and Restoration Monitoring of Rare Earth Element (REE) Exploitation by New Remote Sensing Indicators in Southern Jiangxi, China

1
Key Laboratory of Digital Lands and Resources and Faculty of Earth Sciences, East China University of Technology, Nanchang 330013, China
2
264 Geological Team of Jiangxi Nuclear Industry, Ganzhou 341000, China
*
Author to whom correspondence should be addressed.
Remote Sens. 2020, 12(21), 3558; https://doi.org/10.3390/rs12213558
Submission received: 9 September 2020 / Revised: 22 October 2020 / Accepted: 24 October 2020 / Published: 30 October 2020

Abstract

:
Rare earth elements (REEs) are widely used in various industries. The open-pit mining and chemical extraction of REEs in the weathered crust in southern Jiangxi, China, since the 1970s have provoked severe damages to the environment. After 2010, different restorations have been implemented by various enterprises, which seem to have a spatial variability in both management techniques and efficiency from one mine to another. A number of vegetation indices, e.g., normalized difference vegetation index (NDVI), soil-adjusted vegetation index (SAVI), enhanced vegetation index (EVI) and atmospherically resistant vegetation index (ARVI), can be used for this kind of monitoring and assessment but lack sensitivity to subtle differences. For this reason, the main objective of this study was to explore the possibility to develop new, mining-tailored remote sensing indicators to monitor the impacts of REE mining on the environment and to assess the effectiveness of its related restoration using multitemporal Landsat data from 1988 to 2019. The new indicators, termed mining and restoration assessment indicators (MRAIs), were developed based on the strong contrast of spectral reflectance, albedo, land surface temperature (LST) and tasseled cap brightness (TCB) of REE mines between mining and postmining restoration management. These indicators were tested against vegetation indices such as NDVI, EVI, SAVI and generalized difference vegetation index (GDVI), and found to be more sensitive. Of similar sensitivity to each other, one of the new indicators was employed to conduct the restoration assessment of the mined areas. Six typically managed mines with different restoration degrees and management approaches were selected as hotspots for a comparative analysis to highlight their temporal trajectories using the selected MRAI. The results show that REE mining had experienced a rapid expansion in 1988–2010 with a total mined area of about 66.29 km2 in the observed counties. With implementation of the post-2010 restoration measures, an improvement of varying degrees in vegetation cover in most mines was distinguished and quantified. Hence, this study with the newly developed indicators provides a relevant approach for assessing the sustainable exploitation and management of REE resources in the study area.

Graphical Abstract

1. Introduction

As a strategic resource, rare earth elements (REEs) are essential for high-tech applications and development across various industries [1,2,3,4,5]. With the increased demand for REE resources in the national and international markets, the scale of REE mining has been expanding since 1970s, and it has become one of the leading industries in southern Jiangxi, the origin of two important rivers, the Ganjiang and the Dongjiang (Figure 1). Due to their particular metallogenic character, the ion-adsorption type REE deposits are mostly hosted in the weathered crust of granitic massifs. Their mining is hence different from that of most other metal ore deposits, and the low-cost open-pit mining has led to severe damages to the ecosystem [6]. Actually, 4 decades of disordered exploitation and mining without relevant environmental protection have caused not only serious land degradation, e.g., vegetation stripping, soil erosion, nutrients losses, damage to the cultivated land and river courses and groundwater pollution, but also waste of REE resources in the mining areas. It is thus of pressing importance to implement effective measures to restore the damaged land cover and protect the environment of the mined areas in southern Jiangxi.
The purpose of restoration is to recover the normal functions of the devastated ecosystems as a consequence of mining [7,8,9,10]. For this reason, the Chinese central and local governments have promulgated orders since 2009 to mitigate the degradation and restore ecosystem functions of the REE mining areas. With this effort, the environment has been improved to a certain degree in some mined areas, while degradation continues in others. However, neither systematic monitoring of the recovery status nor assessment on the effectiveness of different management approaches or techniques has been conducted.
Remote sensing has been widely applied in environmental monitoring, including in land degradation analysis, assessment of the mitigation effectiveness and, particularly, assessment of the policy impacts on the environment [11,12,13,14,15,16]. Since vegetation degradation and recovery are related to change in surface albedo [17], it is possible to use vegetation greenness, surface brightness and their change vector [18] to assess the effectiveness of such management of the mining areas [19,20]. As a topic increasingly recognized as important, research on the human–environment linkages has become a hotspot [21,22,23,24,25,26], and our study on assessment of mining, degradation and restoration is such a case.
Multitemporal remote sensing data are an important geo-information source which allow us to monitor and determine the dynamic trends of vegetation cover [27,28,29,30,31,32,33,34,35,36]. In recent years, a number of studies have been focused on monitoring of land cover change in the mining areas using vegetation indices, e.g., normalized difference vegetation index (NDVI) [37], soil-adjusted vegetation index (SAVI) [38] and enhanced vegetation index (EVI) [32,39,40]. Other studies have used thermal information to monitor coal fires [41] or radar data to examining land subsidence of coal mines [42]. It is worthwhile to mention that several authors have employed remote sensing to assess the rehabilitation or revegetation states of the mined areas [43] and have applied unmanned aerial vehicles (UAVs) for this purpose [44,45,46]. It is good to see that a limited number of studies were devoted to monitoring of REE mines [6,47,48]; however, none of them focused specifically on a comprehensive assessment of spatiotemporal characteristics of land degradation and restoration of the mining areas in southern Jiangxi. For this reason, the main objective of our study was to conduct monitoring and assessment research to fill this gap and to provide relevant advice for local governments for restoration management.
While examining the recovery degree of different REE mines using the above-mentioned vegetation indices, some difficulty was encountered in revealing the subtle difference of restoration, even with the generalized difference vegetation index (GDVI), which is more sensitive and of wider dynamic range than other indices in low-vegetation areas [49,50]. Nevertheless, it might be possible to incorporate GDVI with other biophysical indicators such as surface albedo [17], land surface temperature (LST) [25,51,52,53] and tasseled cap brightness (TCB) [54] to derive a more sensitive indicator to characterize the subtle differences of the REE mines and their restoration. Therefore, one specific objective of this research was to develop an integrated remote sensing indicator for achieving the monitoring and assessment of REE mines while taking multiple biophysical indicators into account.

2. Materials and Methods

2.1. Study Area

The study area, Ganzhou City, which encompasses 18 counties with 39,363 km2 in surface area, is located in southern Jiangxi (Figure 1) and climatically belongs to the subtropical monsoon climatic zone. This area is mainly covered with forests which are partially conifers (Cunninghamia lanceolata, Pinus massoniana) and mainly mixed forests with the following dominant species: Schima superba, Cinnamomum camphora, Acer palmatum, Nothofagaceae Kuprian, Liquidambar formosana, Pinus elliottii, Pinus massoniana and Cunninghamia lanceolata. Other land cover types include woodlands, croplands, orchards, water-bodies and artificial land, where landscape is mainly mountains and hills interbedded with basins. The main river is Ganjiang River running north and its tributaries and subtributaries. The study area is also the origin of the Dongjiang River running south. The average annual precipitation is around 1318 mm and the annual mean temperature is 19.8 °C. The elevation ranges from 89 to 1971 m with an average of 300–500 m. With concentrated rainfall in spring and summer (March–July), soil erosion and water loss are a severe problem, especially in the red soil areas. Through this study, 1281 REE mines were identified with a total mined area of about 79 km2 in the whole southern Jiangxi. However, our research was mainly focused in seven counties (Figure 1) including 1158 mines covering an area of 66.29 km2.
In terms of natural resource endowment, apart from the tungsten ore reserve, southern Jiangxi has abundant ion-absorption type REE deposits and is known as the “Rare Earth Kingdom”. However, due to long-term disordered mining in this area, the native vegetation cover has been severely damaged and the original geomorphologic feature has greatly changed since the 1970s. The early mining techniques included the “pool-leaching” or “heap-leaching” techniques in 1981–1995, which have caused serious vegetation degradation, soil erosion and pollution. The processing adopted in the later stage is the “in situ leaching” technique that has been widely applied since 1996 [55]. With this technique, the surface vegetation was not seriously damaged in a large area, but a great number of liquid injection holes were excavated in the ore-bearing crust, causing damage to topsoil locally and subsoil largely. A part of vegetation cover in the mining area was also immediately destroyed, and the chemical liquid would remain for a long time in soils, causing soil acidification and leading to an increased risk of landslides as such liquid serves as a lubricator. No matter which kind of technique was used, the REE exploitation has caused severe damage to the environment.

2.2. Data and Preprocessing

2.2.1. Satellite Data and Processing

Multitemporal Landsat TM, ETM+ and OLI images from 1988 to 2019 were obtained from the USGS data server (https://glovis.usgs.gov). Only cloud-free images or those with less than 5% of cloud coverage were selected. Due to the abundant rainfall and cloudy weather throughout spring and summer in the study area, October and early November are the period when it is possible to acquire images with low cloud cover, good quality and acceptable sun-elevation angle (≥40°). For this reason, only October and early November images were employed for this study.
Already orthorectified by the provider, NASA, before Landsat images were made publicly accessible, only atmospheric correction was conducted for these images using the COST model developed by Chavez [56] in combination with the dark-object subtraction (DOS) [57] approach to remove the haze effect. The band minimum was applied to estimate the haze value in each band of Landsat images, and spectral radiance was then converted into surface reflectance for each band after atmospheric correction [13,56].
Very high resolution imagery, such as QuickBird, GeoEye and SPOT, available on Google Earth was used as a complementary source for definition of the boundaries and visual verification of mines.
Elevation data (ASTER GDEMV2) with 30 m resolution were obtained from the Geospatial Data Cloud Platform of the Chinese Academy of Sciences (http://www.gscloud.cn/) and used as the background information of the study area.

2.2.2. Field Data

The first-hand data were acquired from field investigations conducted in December 2016 to December 2019 to understand the damages caused by mining to environment and the situation of restoration. Our partner, the 264 Geological Team of Jiangxi Nuclear Industry has conducted rehabilitation management in 11 abandoned REE mines in the study area. Their knowledge and experience were important to our study, especially for assessing the results of our analysis on management effectiveness, and their field pictures were direct proof for validation of our analysis.

2.3. Biophysical Features of the Mining and Restored Areas

The typical biophysical change after open-pit mining, i.e., deforestation through the peeling-off of the topsoil and vegetation cover, is the decrease or loss of vegetation greenness and increase in bareness. The major restoration efforts are to recover the mined areas with vegetation plantation such as grasses, shrubs and trees, but other management options are either to convert the mined areas into factories or solar power stations or simply to cover them with plastic mulch to prevent further soil erosion. Thus, restoration and mitigation measures and procedures are different from mine to mine, and so are the restored greenness and extent in the study areas.
Vegetation indices, surface albedo, brightness and other indicators that are able to capture the bareness information may all be useful for assessment of the mining impacts and restoration effectiveness. For this purpose, remote-sensing-based biophysical indicators such as NDVI, GDVI, EVI, SAVI, atmospherically resistant vegetation index (ARVI) and soil-adjusted and atmospherically resistant vegetation index (SARVI) [58], surface albedo [17], the first principal component (PC1), tasseled cap brightness (TCB) [54,59,60] and LST were taken into account (Table 1). Calculation of vegetation indices is known, but other indicators, e.g., albedo and LST, are less frequently applied. We present their calculation formulas here.
Albedo (α), originally meaning “whiteness”, is a measure of the diffuse reflection of solar radiation out of the total solar radiation on land surface and measured on a scale from 0 to 1. Courel et al. (1984) revealed that increase in albedo in African savanna was a result of land degradation caused by drought [17]. In our case, land degradation by mining may also lead to increase in surface albedo. Liang (2000) developed a series of algorithms for calculating albedo for various satellite sensors [61]. The one for Landsat data, which was further normalized by Smith (2010) [62], is expressed in Equation (1):
α s h o r t = 0.356 ρ 1 + 0.130 ρ 3 + 0.373 ρ 4 + 0.085 ρ 5 + 0.072 ρ 7 0.0018 0.356 + 0.130 + 0.373 + 0.085 + 0.072
where ρ i represents the reflectance of band i; here, i is 1, 3, 4, 5 and 7.
LST was produced in terms of Chander et al. (2009) [63] and USGS (2019) [64] as shown in Equation (2):
LST = k 2 ln k 1 L λ + 1
where L λ is the at-the-sensor spectral radiance (W/(m2sr μm)); k 1 and k 2 are calibration coefficients. LST in kelvin (>273.15 K) is big unit in comparison with other vegetation indices. It was thus further normalized as:
T N = LST LST min / LST max LST min
where T N is the normalized LST; LST min and LST max are the minimum and maximum LST of the observed area, i.e., the mines in our case. T N also takes a value between 0 and 1.
The surface characteristics of REE mines at different stages such as mining disturbance, reclamation and vegetation restoration show great differences. The time trajectories of the biophysical indicators of a typical mine with restoration intervention were projected for the period 1988–2019. We noted that vegetation indices all showed a U-type curve in the mined areas, while other biophysical indicators such as albedo (α), TCB and LST demonstrated an inverse curvilinear character showing, more concretely, a mirror effect of the vegetation indices, i.e., a peak in the mined areas before restoration. An example is shown in Figure 2.

2.4. Pearson Correlation Analysis, Development of the New Mine-Tailored Indicators and Sensitivity Analysis

Apart from the time trajectories, a Pearson correlation analysis at the confidence level of 0.01 was applied to all biophysical indicators (i.e., NDVI, GDVI, SAVI, EVI, SARVI, ARVI, α, TN, TCB and PC1) to uncover their correlation (Table 2).
In terms of the contrasted difference in correlation together with the mirror effect of vegetation indices versus other biophysical indicators (Table 2 and Figure 2), it seems possible to develop a mine-tailored remote sensing indicator or a set of such indicators for assessing the impacts of mining activities on the environment and the postmining mitigation effectiveness. This indicator will allow identifying the subtle difference in land cover change between premining and mining states, and between mined and pos-mining restoration intervention, and to highlight it.
Among the vegetation indices, those with soil adjustment and atmospheric correction were less sensitive to canopy cover than NDVI [13], and all these indices were less sensitive to multibiome features and of less dynamic range than GDVI in dryland systems [49,51]. For mining and mined areas, we randomly selected six typical mines with different mining periods, REE extraction approaches and restorations (see Table 6 for details) to project the time trajectories of GDVI and NDVI, and the former shows again wider dynamic range and higher sensitivity than NDVI (Figure 3). Hence, based on the results shown in both Figure 2 and Figure 3, GDVI seems more suitable for highlighting the vegetation-related information of the mining and mined areas than other indices.
To justify this selection, an importance ranking based on the correlation coefficients in Table 2 using the approach of Orloci (1978) [65] was conducted, and the weighted importance is reported in Table 3.
The nonvegetal part can be revealed by α, TCB and TN, which are negatively correlated with GDVI. In view of this, the new remote sensing indicators were established as follows:
MRAI 1 = GDVI / α + T N
MRAI 2 = GDVI / α + TCB
MRAI 3 = GDVI / α + T N + TCB
MRAI 4 = GDVI / T N + TCB
The indicators in this set were termed mining and restoration assessment indicators (MRAIs). To evaluate their sensitivity, the approach proposed by Gitelson (2004) [66] was followed. Wu (2014) used this approach to assess the sensitivity of GDVI and confirmed the efficiency of this approach [49]. The sensitivity is expressed in Equation (8):
S r MRAI = d MRAI d VI × [ MRAI VI ] 1
where S r MRAI is the relative sensitivity of MRAI versus the referenced vegetation index (VI); d MRAI d VI is the first derivative of MRAI against VI or the infinitesimal change in MRAI in response to that of VI, or rather, the differences between two adjacent pixels of MRAI and VI, showing the tiny change; and MRAI = MRAI M A X MRAI M I N and VI = VI M A X VI M I N are the ranges of MRAI and VI of the observed mines in our case. If Sr > 1, MRAI is more sensitive than the referenced VI; if Sr = 1, they have the same sensitivity; if Sr < 1, MRAI is less sensitive than the referenced VI.

2.5. Application of MRAI for Mining and Restoration Monitoring

After sensitivity analysis, one MRAI, i.e., MRAI1, was selected for mining and restoration monitoring.
To compare the spatiotemporal changes and the management effectiveness at different stages of the REE mines, four observation points in time were selected, i.e., 1988 as premining, 1989–2000 as mining, 2010 as mining and mined state and 2019 as restoration state. Please be aware of the fact that those mines that had been exploited before 1988 were largely considered “no change” in the 1988–2010 period before restoration was conducted. Four concentrated REE mining areas in the study area were chosen for a detailed analysis of mining activities and vegetation greenness changes using MRAI1 as remote sensing indicator. The approach used was a differencing technique followed by a thresholding processing realized by density slicing or classification in order to identify the degradation and restoration and their subtle change degree in space and time [12,14].

3. Results

The intermediate and final results obtained following the above approaches and processing procedure are presented in this section.

3.1. Mirror Effect and Correlation among the Biophysical Indicators

It was revealed that vegetation indices have U-type time trajectories while nonvegetation biophysical indicators show anti-U curvilinear features, constituting a mirror effect of these two groups of indicators in the mining and mined areas (Figure 2).
Pearson correlation analysis illustrated that while the vegetation indices are positively correlated with each other, all of them are negatively correlated with α, TN, TCB and PC1 (Table 2). GDVI has the best negative correlation with these nonvegetation indicators, and TCB seems the best approximation of α, followed by TN.
Table 3 presents the result of ranking analysis based on the correlation coefficients of biophysical indicators (Table 2) and demonstrates that GDVI accounts for the most important weight (63.58%); hence, it is appropriate to select it as vegetation index to constitute the MRAIs.

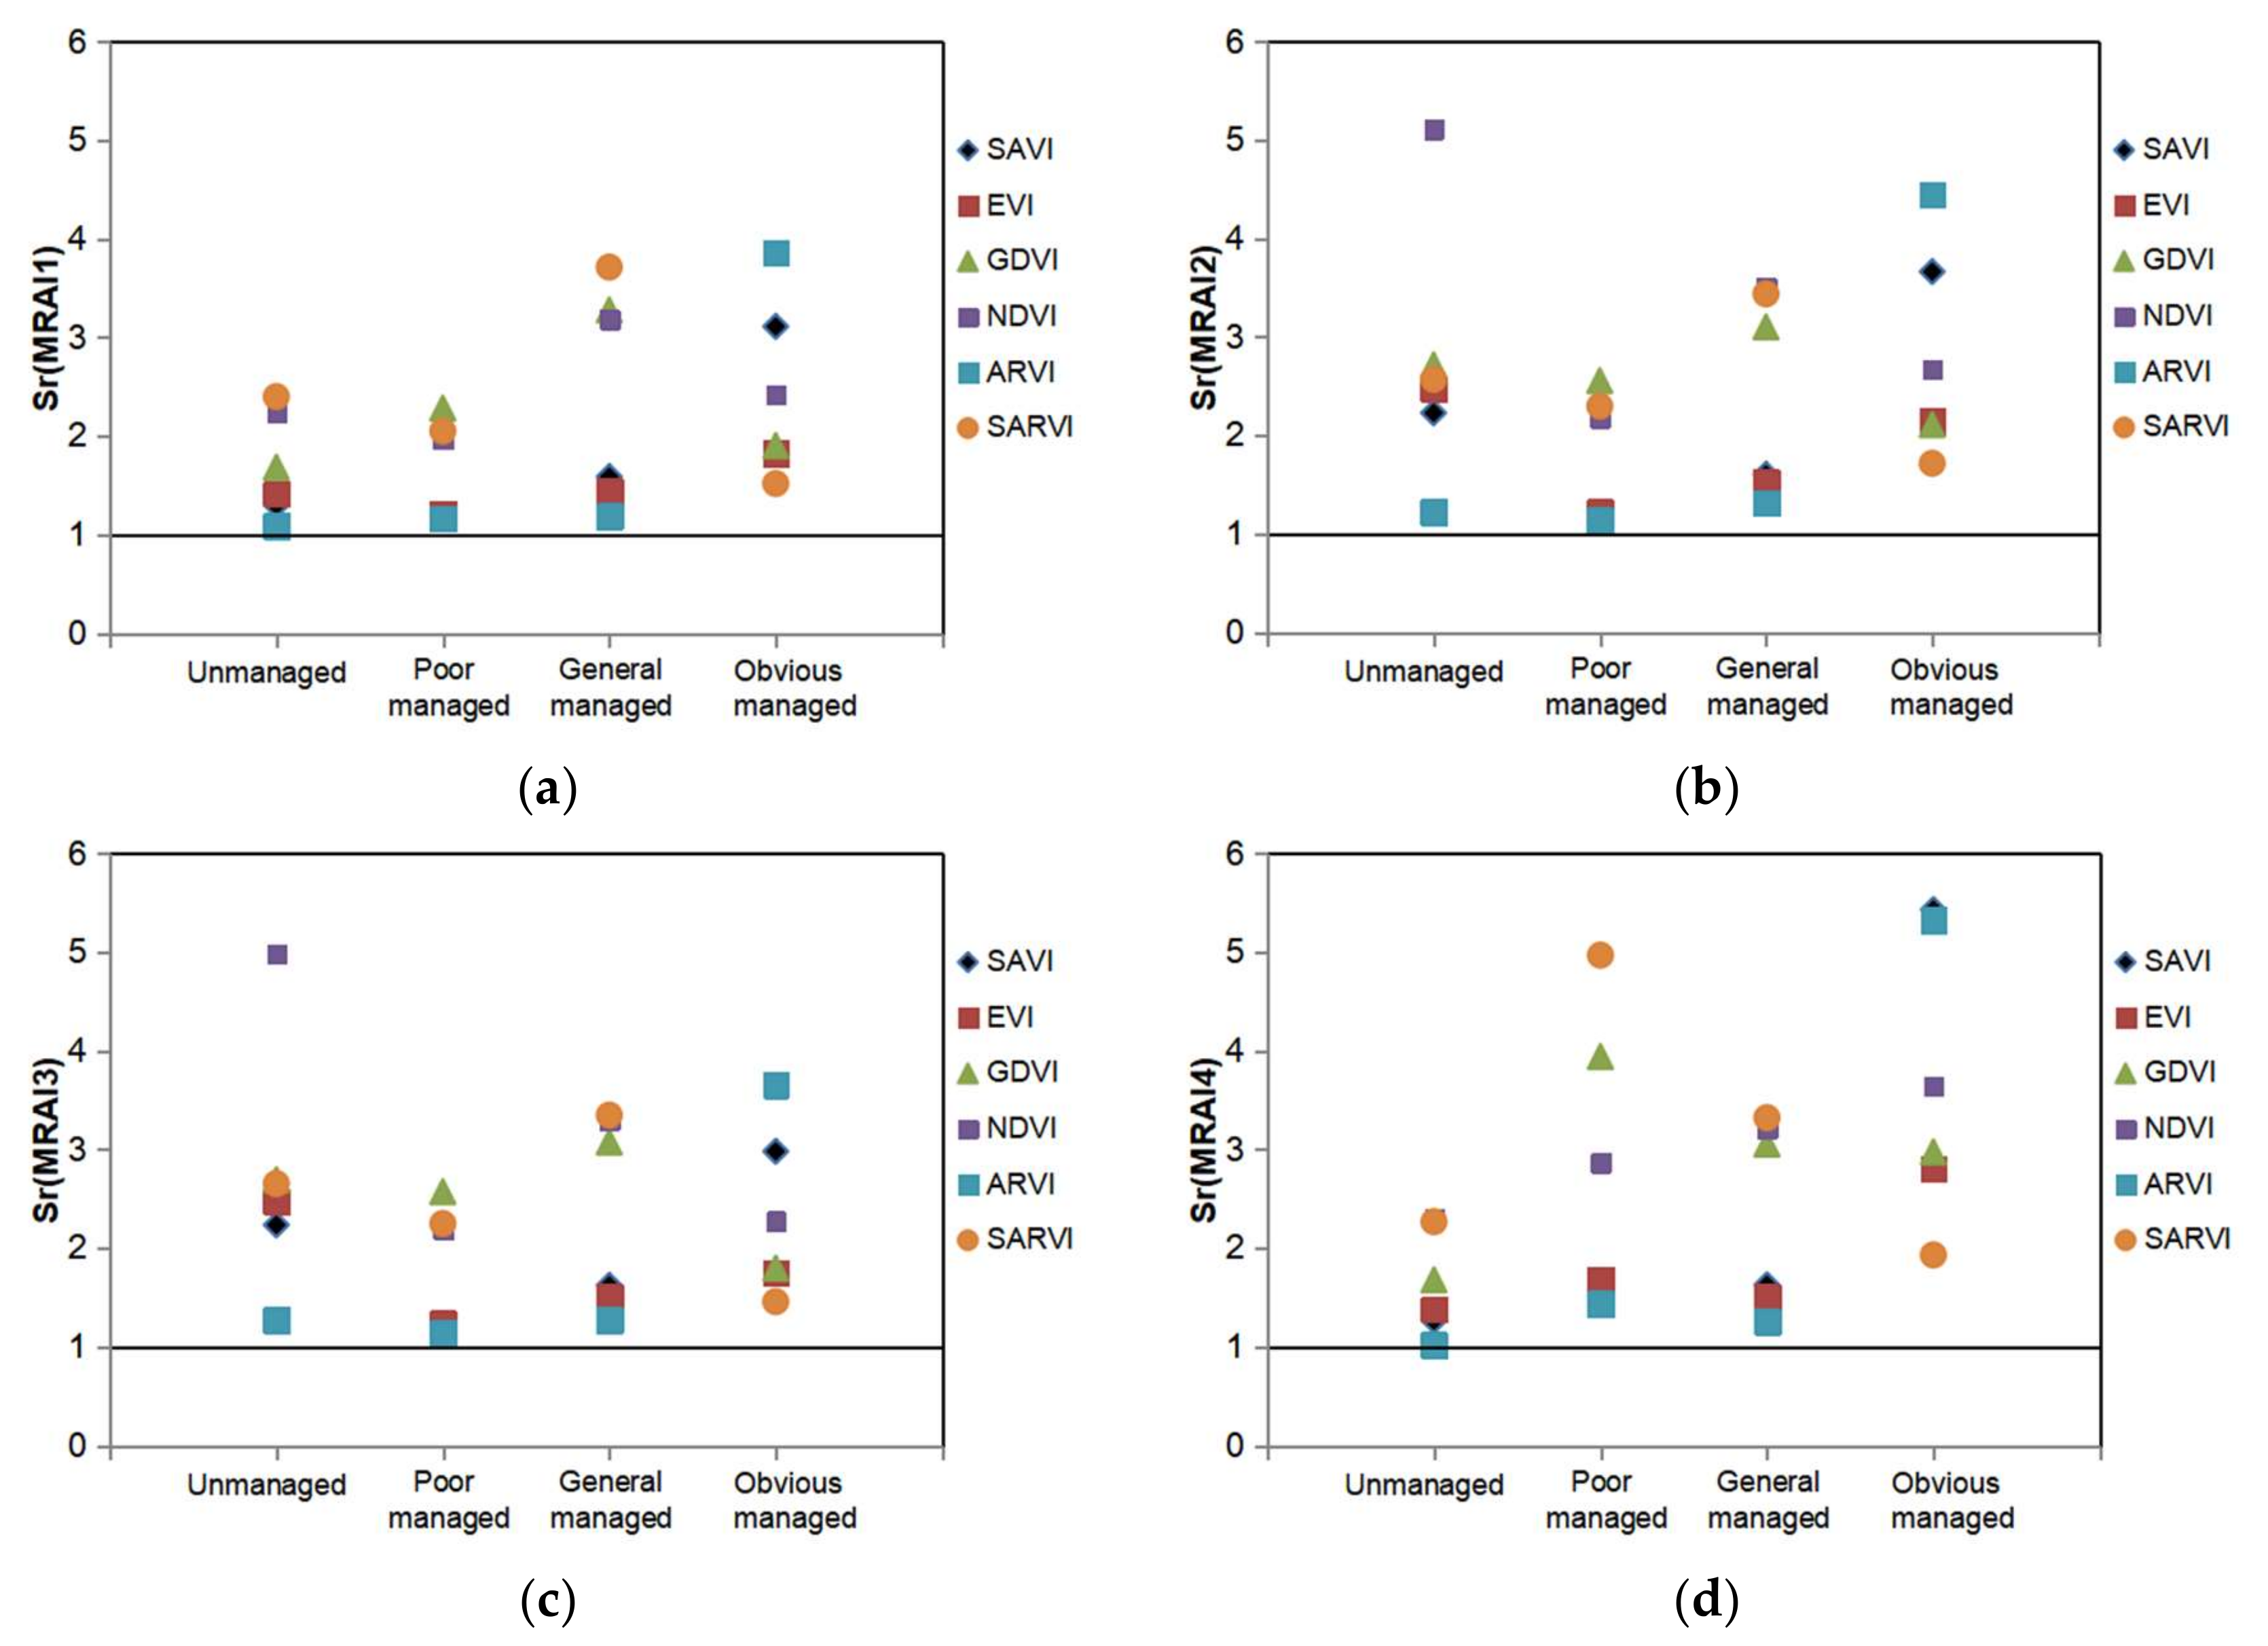
3.2. Sensitivity and Dynamic Ranges of MRAIs

As presented in Figure 4, the sensitivity of all these MRAIs, i.e., Sr(MRAIs), in unmanaged and different vegetation restoration periods of the REE mines is higher than 1, indicating that all of the indicators in the set have higher sensitivity than vegetation indices. Thus, this set of MRAIs can be used for assessing the effects of mining and restoration management.
The dynamic ranges of these indicators of REE mines for Landsat images of 2019 are shown in Table 4; their indications, taking MRAI1 as an example, are listed as follows: when MRAI1 < 1.0, it represents an unmanaged state; when 1.0 < MRAI1 ≤ 1.5, it represents a poor restoration; when 1.5 < MRAI1 ≤ 2.0, it implies a general case of restoration; and when MRAI1 > 2.0, it means a good restoration. Actually, thanks to the wide dynamic range and high sensitivity, the ranges can be much more finely divided.

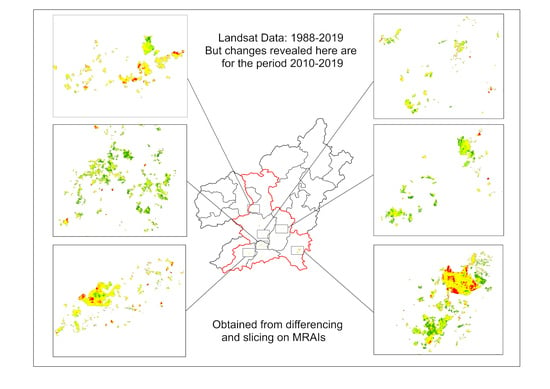
3.3. Spatiotemporal Change of Vegetation Restoration

As previously mentioned, 1158 REE mines with a total surface area of about 66.29 km2 in the seven counties were identified by multitemporal satellite images though the mining period of these mines was different from one to another. The spatiotemporal changes in land degradation (e.g., vegetation loss and soil erosion) and restoration of mines are shown in Table 5 and Figure 5, taking the four most serious counties where REE mines are dominantly distributed (circles a, b, c and d) as an example.
From 1988 to 2010, land degradation, or rather, mining area, had increased by 4281.76 ha (red and brown color in Figure 5), but from 2010 to 2019, newly mined area was reduced to 898.1 ha and rehabilitated green areas had a significant increase by 2135.9 ha, especially in Xunwu, Dingnan, Longnan, and Anyuan (green color in Figure 5). In addition, mining activity and restoration showed a spatial heterogeneity and variability in different counties.

3.4. Verification of the Detected Changes

To ensure the accuracy of the MRAI1 analysis, eight typical REE mines, namely A–F, V1 and V2 (as shown in Figure 5), were selected for verification in reference to field observation and Google Earth (Figure 6, Figure 7 and Figure 8). The geographical information, REE extraction technique and the restoration management are all presented for each mine in Table 6. The comparison shows that the assessment results of the management effectiveness of the mined areas were well consistent with the actual situation observed in the field and on Google Earth (Figure 7 and Figure 8), indicating that the new remote sensing indicator, MRAI1, was able to achieve the monitoring and assessment of the mining and restoration effects on the environment in space and time. On the other hand, from the local detailed analysis, we can see that in the same mining area, the new indicator MRAI1 can well reflect the tiny differences in management effectiveness.

4. Discussion

4.1. Recovery Process

The land surface of REE mines has experienced significant changes from premining and mining to recovery in the past decades, and such changes were mainly associated with implementation of different policies. Driven by the policy of “invigorating the domestic economy and opening to the outside world” of Deng Xiaoping in 1987–1988 [14], innumerous local private companies were set up nationwide. As a result, REE mining experienced a disorderly expansion for economic reasons by a great number of private enterprises in southern Jiangxi. Our change detection using the MRAI1 indicator illustrated that the vegetation cover in the four counties considered decreased dramatically, showing a clear degradation by 4281 ha in which previous vegetation cover had become bare soil with an increased albedo and brightness in 1988–2010. This is indicative of an expanding mining process including the striping off of topsoil and forests to exploit REE deposits in the weathered crust and, at the same time, the setting up of a series of leaching ponds for application of the “pool leaching” or “heap leaching” technology, or digging/drilling of holes and ditches elsewhere to apply the “in situ leaching” technology for REE extraction after 1996 [1,55,67,68]. Vegetation degradation, soil erosion and groundwater pollution as a consequence of mining activities resulted in negative impacts on the ecosystems [68,69]. These are local phenomena in response to the macroscopic policy of the state.
With an increasing awareness of the hazardous damage to the environment caused by mining, the central government promulgated the “Regulations on the Protection of the Geological Environment of Mines” (MoLR 2009) [70], with an order of “who mined who governs”. Hence, restoration management of the abandoned mines became an obligation for mining enterprises in southern Jiangxi in 2010. For this reason, a number of pilot projects have been implemented [67] and different treatments, including chemical and biological approaches, have been tested and proposed [68,71,72,73,74,75]; for the time being, biological rehabilitation is dominant because of the purpose of ecological restoration.
The common vegetation recovery management is plantation of conifers (e.g., Cunninghamia lanceolata, Pinus massoniana), grasses (e.g., Paspalum wettsteinii Hack) and orchards (e.g., navel orange and other local specialty fruits) in the mined areas located in hills and mountains that showed spatial differences in levels of recovery within our detection results (Figure 5). Thanks to these efforts, 2135 ha of abandoned mines have been managed and have, to a certain degree, recovered in the period of 2010–2019 (Table 5). However, in 2019, about 67% of the total area of the observed REE mines was still in a state of degradation or remained unmanaged (Table 5). This is probably the results of the following cases: (1) restoration of some mined areas was still at the stage of land leveling and vegetation was not yet planted; (2) for large mined areas surrounding the cities, the management action was to build factories and solar power plants, which was not regarded as an ecological restoration and led such areas to be classified as unmanaged mines by MRAIs; (3) restoration management had not yet been conducted for the newly mined area after 2010. Clearly, much reclamation work remains to be conducted in this region.

4.2. Advantages and Disadvantages of Our Approaches

It is clear that with their sensitivity and wide dynamic ranges, the integrated MRAIs can help distinguish the subtle differences between premining and mining and between mined and postmining management, of which the latter was actually graded into two levels for facilitating visualization in maps, though it may be divided into many more levels. Actually, Li et al. (2018) and Zhang et al. (2015) used NDVI to identify the REE mines locally [6,48], and Peng et al. (2016) employed ecological quality index to analyze these areas in southern Jiangxi [47]. Largely speaking, their studies were relevant but had less sensitivity and accuracy than our approach, because some of them even failed to distinguish clouds from mines or required more indicators to compose the quality index. From this viewpoint, our approach based on MRAIs seems more robust and practical, requiring less data and having superior applicability. As a matter of fact, our new indicators contain both vegetation and nonvegetation characteristics and are capable of catching more features of land surface change than other single indicators or indices. As such, aside from REE mines, it will be possible to apply them in studies of other kinds of open-pit mining areas such as copper, limestone, iron and coal mines.
However, as with other remote sensing approaches, MRAIs were unable to identify completely mined areas where “in situ leaching” technique had been applied due to the fact that drilling operations kept the surface vegetation cover to certain extent. This problem can be resolved if UAV technology is employed, as it is able to provide higher resolution and hyperspectral data [44]. The limitation of our approach lies in that most of the MRAIs developed, except for MRAI2, may not be applicable if remote sensing data do not possess the thermal band that allows us to derive LST. In this case, MRAI2 is the only choice.

5. Conclusions

This paper presented the development of a set of mine-tailored remote sensing indicators (MRAIs) and their application to detection of the spatial and temporal changes of the REE mining and mined areas and assessment of the effectiveness of restoration management in southern Jiangxi. Our study showed that these new indicators are applicable for achieving such research goals with reliability. We believe that these indicators not only are suitable for research on REE mines, but also have potential for assessment of other kinds of open-pit mines.
This study considered the state of surface vegetation cover, albedo, brightness and surface temperature to assess mining and the effectiveness of the postmining management after different policy implementations. The research still remains at the surface layer, and a more holistic and comprehensive assessment integrating MRAIs with soil and groundwater samples will be required as a next step, as the multidimensional assessment may provide more relevant advice for local authorities for sustainable exploitation and restoration of REE mines.

Supplementary Materials

The following are available online at https://www.mdpi.com/2072-4292/12/21/3558/s1, Table S1: List of the images sensor and acquisition dates selected for this study and Annex 1: Sensitivity analysis.

Author Contributions

Conceptualization, L.X. and W.W.; Data curation, L.X., X.H., P.O., W.H., Y.Z., X.F., J.L., J.J., M.Z., Z.Z. and Y.B.; Formal analysis, L.X.; Funding acquisition, W.W.; Investigation, L.X., Z.L., W.Z., Y.S., T.L. and X.Z.; Methodology, L.X., Z.L., Y.Q., S.P. and C.S.; Project administration, W.W.; Resources, P.O.; Software, X.H.; Writing—review & editing, W.W. All authors have read and agreed to the published version of the manuscript.

Funding

This research was supported by the Start-up Fund for Scientific Research of the East China University of Technology (DHTP2018001) and the fund of the Jiangxi Talent Program (900/2120800004), both granted to Dr Weicheng Wu.

Acknowledgments

The field trips were received by the 264 Geological Team of Jiangxi Nuclear Industry. Landsat images were freely obtained from the USGS data server (https://glovis.usgs.gov).

Conflicts of Interest

The authors declare no conflict of interest.

References

  1. Cheng, J.; Che, L. Current mining situation and potential development of rare earth in China. Chin. Rare Earths 2010, 31, 65–69. (In Chinese) [Google Scholar]
  2. Dushyantha, N.; Batapola, N.; Ilankoon, I.M.S.K.; Rohitha, S.; Premasiri, R.; Abeysinghe, B.; Ratnayake, N.; Dissanayake, K. The story of rare earth elements (REEs): Occurrences, global distribution, genesis, geology, mineralogy and global production. Ore Geol. Rev. 2020, 122. [Google Scholar] [CrossRef]
  3. Wübbeke, J. Rare earth elements in China: Policies and narratives of reinventing an industry. Resour. Policy 2013, 38, 384–394. [Google Scholar] [CrossRef]
  4. Wang, J.; Guo, M.; Liu, M.; Wei, X. Long-term outlook for global rare earth production. Resour. Policy 2020, 65, 101569. [Google Scholar] [CrossRef]
  5. Kamenopoulos, S.N.; Agioutantis, Z. Geopolitical Risk Assessment of Countries with Rare Earth Element Deposits. Min. Metall. Explor. 2020, 37, 51–63. [Google Scholar] [CrossRef]
  6. Li, H.; Lei, J.; Wu, J. Analysis of land damage and recovery process in rare earth mining area based on multi-source sequential NDVI. Trans. Chin. Soc. Agric. Eng. 2018, 34, 232–240. (In Chinese) [Google Scholar] [CrossRef]
  7. Li, T.; Lü, Y.; Fu, B.; Comber, A.J.; Harris, P.; Wu, L. Gauging policy-driven large-scale vegetation restoration programmes under a changing environment: Their effectiveness and socio-economic relationships. Sci. Total Environ. 2017, 607, 911–919. [Google Scholar] [CrossRef] [PubMed] [Green Version]
  8. Ngugi, M.R.; Neldner, V.J.; Doley, D.; Kusy, B.; Moore, D.; Richter, C. Soil moisture dynamics and restoration of self-sustaining native vegetation ecosystem on an open-cut coal mine. Restor. Ecol. 2015, 23, 615–624. [Google Scholar] [CrossRef]
  9. Pei, J.; Wang, L.; Wang, X.; Niu, Z.; Kelly, M.; Song, X.P.; Huang, N.; Geng, J.; Tian, H.; Yu, Y.; et al. Time Series of Landsat Imagery Shows Vegetation Recovery in Two Fragile Karst Watersheds in Southwest China from 1988 to 2016. Remote Sens. 2019, 11, 2044. [Google Scholar] [CrossRef] [Green Version]
  10. Tang, Y.; Shao, Q.; Liu, J.; Zhang, H.; Gong, G. Did Ecological Restoration Hit Its Mark? Monitoring and Assessing Ecological Changes in the Grain for Green Program Region Using Multi-source Satellite Images. Remote Sens. 2019, 11, 358. [Google Scholar] [CrossRef] [Green Version]
  11. Tucker, C.J.; Dregne, H.; Newcomb, W.W. Expansion and Contraction of the Sahara Desert from 1980 to 1990. Science 1991, 253, 299–301. [Google Scholar] [CrossRef] [PubMed]
  12. Wu, W. Monitoring Land Degradation in Drylands by Remote Sensing; Marini, A., Talbi, M., Eds.; Springer: Berlin/Heidelberg, Germany, 2009. [Google Scholar] [CrossRef]
  13. Wu, W.; De Pauw, E.; Helldén, U. Assessing woody biomass in African tropical savannahs by multiscale remote sensing. Int. J. Remote Sens. 2013, 34, 4525–4549. [Google Scholar] [CrossRef]
  14. Wu, W.; De Pauw, E.; Zucca, C. Using remote sensing to assess impacts of land management policies in the Ordos rangelands in China. Int. J. Digit. Earth 2013, 6, 81–102. [Google Scholar] [CrossRef]
  15. Zucca, C.; Wu, W.; Dessena, L.; Mulas, M. Assessing the Effectiveness of Land Restoration Interventions in Dry Lands by Multitemporal Remote Sensing—A Case Study in Ouled DLIM (Marrakech, Morocco). Land Degrad. Dev. 2015, 26, 80–91. [Google Scholar] [CrossRef]
  16. Li, J.; Pei, Y.; Zhao, S.; Xiao, R.; Zhang, C. A Review of Remote Sensing for Environmental Monitoring in China. Remote Sens. 2020, 12, 1130. [Google Scholar] [CrossRef] [Green Version]
  17. Courel, M.F.; Kandel, R.S.; Rasool, S.I. Surface albedo and the Sahel drought. Nature 1984, 307, 528–531. [Google Scholar] [CrossRef]
  18. Lambin, E.F.; Strahler, A.H. Indicators of land-cover change for change-vector analysis in multitemporal space at coarse spatial scales. Int. J. Remote Sens. 1994, 15, 2099–2119. [Google Scholar] [CrossRef]
  19. Zhang, J.; Wang, T.; Ge, J. Assessing Vegetation Cover Dynamics Induced by Policy-Driven Ecological Restoration and Implication to Soil Erosion in Southern China. PLoS ONE 2015, 10, e0131352. [Google Scholar] [CrossRef]
  20. Carabassa, V.; Ortiz, O.; Alcañiz, J.M. RESTOQUARRY: Indicators for self-evaluation of ecological restoration in open-pit mines. Ecol. Indic. 2019, 102, 437–445. [Google Scholar] [CrossRef]
  21. Geist, H.J.; Lambin, E.F. Proximate Causes and Underlying Driving Forces of Tropical Deforestation. BioScience 2002, 52, 143–150. [Google Scholar] [CrossRef]
  22. Coppin, P.; Jonckheere, I.; Nackaerts, K.; Muys, B.; Lambin, E. Digital change detection methods in ecosystem monitoring: A review. Int. J. Remote Sens. 2004, 25, 1565–1596. [Google Scholar] [CrossRef]
  23. Verburg, P.H.; Soepboer, W.; Veldkamp, A.; Limpiada, R.; Espaldon, V.; Mastura, S.S. Modeling the spatial dynamics of regional land use: The CLUE-S model. Environ. Manag. 2002, 30, 391–405. [Google Scholar] [CrossRef]
  24. Veldkamp, A.; Verburg, P.H.; Kok, K.; De Koning, G.H.J.; Priess, J.; Bergsma, A.R. The Need for Scale Sensitive Approaches in Spatially Explicit Land Use Change Modeling. Environ. Modeling Assess. 2001, 6, 111–121. [Google Scholar] [CrossRef]
  25. Wu, W.; Mhaimeed, A.S.; Al-Shafie, W.M.; Ziadat, F.; Dhehibi, B.; Nangia, V.; Pauw, E.D. Mapping soil salinity changes using remote sensing in Central Iraq. Geoderma Reg. 2014, 2, 21–31. [Google Scholar] [CrossRef]
  26. Aspinall, R. Modelling land use change with generalized linear models—A multi-model analysis of change between 1860 and 2000 in Gallatin Valley, Montana. J. Environ. Manag. 2004, 72, 91–103. [Google Scholar] [CrossRef] [PubMed]
  27. Wulder, M.A.; White, J.C.; Goward, S.N.; Masek, J.G.; Irons, J.R.; Herold, M.; Cohen, W.B.; Loveland, T.R.; Woodcock, C.E. Landsat continuity: Issues and opportunities for land cover monitoring. Remote Sens. Environ. 2008, 112, 955–969. [Google Scholar] [CrossRef]
  28. George, M.; Manal, N.; Irna, V.D.M.; Jonathan, L. Evaluating exposure to land degradation in association with repetitive armed conflicts in North Lebanon using multi-temporal satellite data. Environ. Monit. Assess. 2014, 186, 7655–7672. [Google Scholar] [CrossRef]
  29. Maynard, J.J.; Karl, J.W.; Browning, D.M. Effect of spatial image support in detecting long-term vegetation change from satellite time-series. Landsc. Ecol. 2016, 31, 2045–2062. [Google Scholar] [CrossRef]
  30. Jana, A.; Maiti, S.; Biswas, A. Seasonal change monitoring and mapping of coastal vegetation types along Midnapur-Balasore Coast, Bay of Bengal using multi-temporal landsat data. Modeling Earth Syst. Environ. 2015, 2, 7. [Google Scholar] [CrossRef] [Green Version]
  31. Töyrä, J.; Pietroniro, A. Towards operational monitoring of a northern wetland using geomatics-based techniques. Remote Sens. Environ. 2005, 97, 174–191. [Google Scholar] [CrossRef]
  32. Wu, W.; Lambin, E.F.; Courel, M.F. Land use and cover change detection and modelling for North Ningxia, China. In Proceedings of the Mapasia 2002, Bangkok, Thailand, 7–9 August 2002. [Google Scholar]
  33. Lyu, X.; Li, X.; Dang, D.; Dou, H.; Gong, J. A new method for grassland degradation monitoring by vegetation species composition using hyperspectral remote sensing. Ecol. Indic. 2020, 114, 106310. [Google Scholar] [CrossRef]
  34. Alharthi, A.; El-Sheikh, M.A.; Elhag, M.; Alatar, A.A.; Eid, E.M. Remote sensing of 10 years changes in the vegetation cover of the northwestern coastal land of Red Sea, Saudi Arabia. Saudi J. Biol. Sci. 2020. [Google Scholar] [CrossRef]
  35. Huylenbroeck, L.; Laslier, M.; Dufour, S.; Georges, B.; Michez, A. Using remote sensing to characterize riparian vegetation: A review of available tools and perspectives for managers. J. Environ. Manag. 2020, 267, 110652. [Google Scholar] [CrossRef] [PubMed]
  36. Yonatan, T.; María, M.L. Monitoring tropical forest degradation using remote sensing. Challenges and opportunities in the Madre de Dios region, Peru. Remote Sens. Appl. Soc. Environ. 2020, 19. [Google Scholar] [CrossRef]
  37. Tucker, C.J. Red and photographic infrared linear combinations for monitoring vegetation. Remote Sens. Environ. 1979, 8, 127–150. [Google Scholar] [CrossRef] [Green Version]
  38. Huete, A.R. A soil-adjusted vegetation index (SAVI). Remote Sens. Environ. 1988, 25, 295–309. [Google Scholar] [CrossRef]
  39. Huete, A.R.; Liu, H.; Batchily, K.; Leeuwen, W.V.A. A comparison of vegetation indices over a global set of TM images for EOS-MODIS. Remote Sens. Environ. 1997, 59, 440–451. [Google Scholar] [CrossRef]
  40. Demirel, N.; Düzgün, E.; Emil, M.K. Landuse change detection in a surface coal mine area using multi-temporal high-resolution satellite images. Int. J. Min. Reclam. Environ. 2011, 25, 342–349. [Google Scholar] [CrossRef]
  41. Kuenzer, C.; Hecker, C.; Zhang, J.; Wessling, S.; Wagner, W. The potential of multidiurnal MODIS thermal band data for coal fire detection. Int. J. Remote Sens. 2008, 29. [Google Scholar] [CrossRef]
  42. Zheng, M.; Deng, K.; Fan, H.; Du, S. Monitoring and Analysis of Surface Deformation in Mining Area Based on InSAR and GRACE. Remote Sens. 2018, 10, 1392. [Google Scholar] [CrossRef] [Green Version]
  43. Vidal-Macua, J.J.; Nicolau, J.M.; Vicente, E.; Heras, M.M.D.L. Assessing vegetation recovery in reclaimed opencast mines of the Teruel coalfield (Spain) using Landsat time series and boosted regression trees. Sci. Total Environ. 2020, 717, 137250. [Google Scholar] [CrossRef]
  44. Ren, H.; Zhao, Y.; Xiao, W.; Hu, Z. A review of UAV monitoring in mining areas: Current status and future perspectives. Int. J. Coal Sci. Technol. 2019, 6, 320–333. [Google Scholar] [CrossRef] [Green Version]
  45. Johansen, K.; Erskine, P.D.; McCabe, M.F. Using Unmanned Aerial Vehicles to assess the rehabilitation performance of open cut coal mines. J. Clean. Prod. 2019, 209, 819–833. [Google Scholar] [CrossRef]
  46. Padró, J.C.; Carabassa, V.; Balagué, J.; Brotons, L.; Alcaniz, J.M.; Pons, X. Monitoring opencast mine restorations using Unmanned Aerial System (UAS) imagery. Sci. Total Environ. 2019, 657, 1602–1614. [Google Scholar] [CrossRef] [PubMed]
  47. Peng, Y.; He, G.; Zhang, Z.; Jiang, W.; Ouyang, Z.; Wang, G. Eco-environmental dynamic monitoring and assessment of rare earth mining area in Southern Ganzhou using remote sensing. Acta Ecol. Sin. 2016, 36, 1676–1685. [Google Scholar]
  48. Zhang, H.; Zhong, B.; Hong, Y.; Wan, H.; Liu, Q. Dynamic Monitoring of Rare Earths Mining Area in Ganzhou during Recent 20 Years based on Remote Sensing. Remote Sens. Technol. Appl. 2015, 30, 376–382. [Google Scholar] [CrossRef]
  49. Wu, W. The Generalized Difference Vegetation Index (GDVI) for Dryland Characterization. Remote Sens. Environ. 2014, 6, 1211–1233. [Google Scholar] [CrossRef] [Green Version]
  50. Wu, W.; Al-Shafie, W.M.; Mhaimeed, A.S.; Ziadat, F.; Nangia, V.; Payne, W.B. Soil Salinity Mapping by Multiscale Remote Sensing in Mesopotamia, Iraq. IEEE J. Sel. Top. Appl. Earth Obs. 2017, 7, 4442–4452. [Google Scholar] [CrossRef]
  51. Gunasekara, N.K.; Al-Wardy, M.M.; Al-Rawas, G.A.; Charabi, Y. Applicability of VI in arid vegetation delineation using shadow-affected SPOT imagery. Environ. Monit. Assess. 2015, 187, 454. [Google Scholar] [CrossRef]
  52. Wu, W.; Zucca, C.; Muhaimeed, A.S.; Al-Shafie, W.M.; Al-Quraishi, A.F.; Nangia, V.; Zhu, M.; Liu, G. Soil salinity prediction and mapping by machine learning regression in Central Mesopotamia, Iraq. Land Degrad. Dev. 2018, 29, 4005–4014. [Google Scholar] [CrossRef]
  53. Wu, W.; Zucca, C.; Karam, F.; Liu, G. Enhancing the performance of regional land cover mapping. Int. J. Appl. Earth Obs. Geoinf. 2016, 52, 422–432. [Google Scholar] [CrossRef]
  54. Crist, E.P.; Cicone, R.C. Application of the tasseled cap concept to simulated thematic mapper data. Photogramm. Eng. Remote Sens. 1984, 50, 343–352. [Google Scholar] [CrossRef]
  55. Ding, J. Historical review of the ionic rare earth mining: In honor of the 60 anniversary of GNMRI. Nonferrrous Met. Sci. Eng. 2012, 3, 14–19. [Google Scholar] [CrossRef]
  56. Chavez, P.S.J. Image-Based Atmospheric Corrections—Revisited and Improved. Photogramm. Eng. Remote Sens. 1996, 62, 1025–1036. [Google Scholar] [CrossRef]
  57. Chavez, P.S. An improved dark-object subtraction technique for atmospheric scattering correction of multispectral data. Remote Sens. Environ. 1988, 24, 459–479. [Google Scholar] [CrossRef]
  58. Kaufman, Y.J.; Tanre, D. Atmospherically resistant vegetation index (ARVI) for EOS-MODIS. IEEE Trans. Geosci. Remote Sens. 1992, 30, 261–270. [Google Scholar] [CrossRef]
  59. Baig, M.H.A.; Zhang, L.; Shuai, T.; Tong, Q. Derivation of a tasselled cap transformation based on Landsat 8 at-satellite reflectance. Remote Sens. Lett. 2014, 5, 423–431. [Google Scholar] [CrossRef]
  60. Huang, C.; Wylie, B.; Yang, L.; Homer, C.; Zylstra, G. Derivation of a tasselled cap transformation based on Landsat 7 at-satellite reflectance. Int. J. Remote Sens. 2002, 23, 1741–1748. [Google Scholar] [CrossRef]
  61. Liang, S. Narrowband to broadband conversions of land surface albedo I. Remote Sens. Environ. 2001, 76, 213–238. [Google Scholar] [CrossRef]
  62. Smith, R.B. The Heat Budget of the Earth’s Surface Deduced from Space. Available online: https://yceo.yale.edu/faq-page#t3n88 (accessed on 10 June 2020).
  63. Chander, G.; Markham, B.L.; Helder, D.L. Summary of current radiometric calibration coefficients for Landsat MSS, TM, ETM+, and EO-1 ALI sensors. Remote Sens. Environ. 2009, 113, 893–903. [Google Scholar] [CrossRef]
  64. United States Geological Survey (USGS). Landsat 8 (L8) Data Users Handbook, Version 5.0. 2019. Available online: https://digitalcommons.unl.edu/usgspubs/110 (accessed on 10 June 2020).
  65. Orlóci, L. Multivariate Analysis in Vegetation Research; Springer: Dordrecht, The Netherlands, 2013. [Google Scholar]
  66. Gitelson, A.A. Wide Dynamic Range Vegetation Index for Remote Quantification of Biophysical Characteristics of Vegetation. J. Plant Physiol. 2004, 161, 165–173. [Google Scholar] [CrossRef] [PubMed] [Green Version]
  67. Guo, Z.; Zhao, K.; Jin, J.; Wang, G.; Zhu, Y. Reviews on Environmental Assessment and Pollution Prevention of Ion Adsorption Type Rare Earth Ores. Chin. Rare Earths 2019, 40, 115–126. (In Chinese) [Google Scholar] [CrossRef]
  68. Chen, X.; Cai, Q.Y.; Yu, X.S.; Liu, Y.Z.; Wang, X.F. Vertical distributions of soil environmental factors in ion-type rare earth mining of southern Jiangxi—A case study in Longnan rare earth mining area. Chin. Rare Earths 2015, 36, 23–28. (In Chinese) [Google Scholar]
  69. Li, M.S. Ecological restoration of mineland with particular reference to the metalliferous mine wasteland in China: A review of research and practice. Sci. Total Environ. 2006, 357, 38–53. [Google Scholar] [CrossRef] [PubMed]
  70. MoLR (Ministry of Land and Resources of the People’s Republic of China). Regulations on the Protection of the Geological Environment of Mines. 3 March 2009. Available online: http://www.gov.cn/flfg/2009-03/05/content_1251130.htm (accessed on 3 March 2020).
  71. Wei, X.; Zhang, S.; Shimko, J.; Dengler, R.W. Mine drainage: Treatment technologies and rare earth elements. Water Environ. Res. 2019, 91, 1061–1068. [Google Scholar] [CrossRef] [Green Version]
  72. Zeng, G.; Ling, B.; Li, Z.; Luo, S.; Sui, X.; Guan, Q. Fluorine removal and calcium fluoride recovery from rare-earth smelting wastewater using fluidized bed crystallization process. J. Hazard. Mater. 2019, 373, 313–320. [Google Scholar] [CrossRef]
  73. Hedin, B.C.; Capo, R.C.; Stewart, B.W.; Hedin, R.S.; Lopano, C.L.; Stuckman, M.Y. The evaluation of critical rare earth element (REE) enriched treatment solids from coal mine drainage passive treatment systems. Int. J. Coal Geol. 2019, 208, 54–64. [Google Scholar] [CrossRef]
  74. Deng, Z.; Qin, L.; Wang, G.; Luo, S.; Peng, C. Ammonia Nitrogen Pollution and Progress in Its Treatment of Ionic Rare Earth Mines. Chin. Rare Earths 2019, 40, 120–129. (In Chinese) [Google Scholar] [CrossRef]
  75. Wei, Z.; Hao, Z.; Li, X.; Guan, Z.; Cai, Y.; Liao, X. The effects of phytoremediation on soil bacterial communities in an abandoned mine site of rare earth elements. Sci. Total Environ. 2019, 670, 950–960. [Google Scholar] [CrossRef]
Figure 1. Location of the study area in southern Jiangxi (Ganzhou City) and distribution of the rare earth element (REE) mines.
Remotesensing 12 03558 g001
Figure 2. Time trajectories of the biophysical indicators of an REE mine (115°06′E, 24°99′N).
Remotesensing 12 03558 g002
Figure 3. Time trajectories of the generalized difference vegetation index (GDVI) (a) and normalized difference vegetation index (NDVI) (b) of six typical mines. Time trajectory comparison of the mean GDVI and the mean NDVI (c), showing GDVI to have a wider dynamic range and higher sensitivity than NDVI in the mining areas (see Figure 5 for location of these mines and Table 6 for selection details).
Remotesensing 12 03558 g003
Figure 4. Sensitivity of mining and restoration assessment indicators (MRAIs) versus vegetation indices (VIs): (a) Sr(MRAI1); (b) Sr(MRAI2); (c) Sr(MRAI3); (d) Sr(MRAI4). Each sensitivity was the average of ten measurements in their corresponding mines at different stages (see Supplementary Materials).
Remotesensing 12 03558 g004
Figure 5. Spatiotemporal changes of vegetation restoration in four areas (ad) with high mining concentration. A–F are typical mines selected for detailed analysis; V1 and V2 are example sites for verification managed by the 264 Geological Team (see Figures 7 and 8).
Remotesensing 12 03558 g005
Figure 6. Comparison of our results from the six mining sites with Google Earth images from the mining to restoration stages ((AF) is six typical mines, see details in Table 6) (high-resolution images: ©Google).
Remotesensing 12 03558 g006
Figure 7. REE mine management in Ganlin Village in Ganzhou City (V1: 114°55′42.73″E, 25°44′4.28″N). (a) “Slight recovery” detected by Landsat data from 2010 to 2019; (b) eroded landscape after exploitation (10 August 2004, ©Google); (c) landscape observed in the field after management (9 July 2019), i.e., cultivated with grasses and trees; and (d) effect of restoration management seen on 26 April 2020 (©Google), i.e., 14 months after the management was conducted in January 2019.
Remotesensing 12 03558 g007
Figure 8. Restoration of REE mine close to Fengshan Village (V2: 115°0′35.97″E, 25°42′49.90″N). (a) Slight recovery detected by Landsat data because of the restoration engineering conducted in November 2018; (b) damaged landscape before management (29 February 2016, ©Google); (c) observed landscape in the field in July 2019; and (d) restoration seen on Google Earth (26 August 2019, ©Google).
Remotesensing 12 03558 g008
Table 1. Biophysical indicators used in this study.
IndexFull NameFormulaSources
GDVIGeneralized Difference Vegetation Index ρ N I R 2 ρ R 2 / ρ N I R 2 + ρ R 2 [49]
NDVINormalized Difference Vegetation Index ρ N I R ρ R / ρ N I R + ρ R [37]
EVIEnhanced Vegetation Index 2.5 × ρ N I R ρ R ρ N I R + 6.0 ρ R 7.5 ρ B + 1 [39]
SAVISoil Adjusted Vegetation Index 1 + L ρ N I R ρ R / ρ N I R + ρ R + L
Low vegetation, L = 1; intermediate, 0.5; high, 0.25
[38]
ARVIAtmospherically Resistant Vegetation Index ρ N I R ρ R B / ρ N I R + ρ R B
ρ R B = ρ R γ × ρ R ρ B
γ = 1, ρ B = reflectance of blue band
[58]
SARVISoil Adjusted and Atmospherically Resistant Vegetation Index 1 + L ρ N I R ρ R B / ρ N I R + ρ R B + L [58]
αAlbedo [17]
TNNormalized Land Surface Temperature T N = LST LST min / LST max LST min [25]
TCBTasseled Cap Brightness [54,59,60]
PC1The First Principal Component [25]
Table 2. Pearson correlation coefficients among the biophysical indicators.
GDVINDVIEVISAVIARVISARVIαTNTCBPC1
GDVI10.966 **0.964 **0.960 **0.788 **0.620 **−0.713 **−0.529 **−0.809 **0.356 **
NDVI 10.949 **0.948 **0.805 **0.642 **−0.683 **−0.464 **−0.776 **0.348 **
EVI 10.992 **0.787 **0.719 **−0.547 **−0.477 **−0.670 **0.500 **
SAVI 10.843 **0.788 **−0.532 **−0.470 **−0.649 **0.544 **
ARVI 10.844 **−0.475 **−0.383 **−0.542 **0.507 **
SARVI 1−0.072−0.266 **−0.1700.766 **
α 10.434 **0.976 **0.198 *
TN 10.485 **−0.208 *
TCB 10.107
PC1 1
* and ** indicate that the confidence level is 0.01 and 0.05, respectively.
Table 3. Importance ranking of the biophysical indicators based on Table 2.
Biophysical IndicatorsSpecific Sum of SquaresSpecific Sum of Squares as a Proportion (%) Cumulative (%)
GDVI6.35963.58863.588
SARVI1.79817.98481.572
TN0.7277.26788.839
α0.5585.58594.424
PC10.3293.29597.720
ARVI0.1131.13098.849
NDVI0.0640.63999.488
EVI0.0340.34399.831
TCB0.0160.16599.996
SAVI0.0000.004100.000
Ranking was conducted following the approach proposed by Orloci (1978).
Table 4. The ranges of MRAIs in REE mines.
RangeMeanStDev
MRAI1[−2.86, 3.95]1.43 0.55
MRAI2[−6.87, 5.64]1.210.51
MRAI3[−2.18, 2.05]0.780.31
MRAI4[−2.37, 2.50]0.970.39
Table 5. Results of vegetation restoration in the seven counties detected by using MRAI1 indicator.
PeriodSevere DegradationSlight DegradationNo Change Slight RecoverySignificant Recovery
Area%Area%Area%Area%Area%
(ha)(ha)(ha)(ha)(ha)
1988–2000629.629.50658.39 9.935264.4379.4246.720.7229.830.45
2000–20101786.9326.961206.8218.213278.3549.45227.323.43129.581.95
2010–2019435.876.58462.236.973594.9954.231421.6221.45714.2910.78
Here, “No Change” includes the mined area or degradation in the pre-1988 period. Before restoration, such area remained unchanged.
Table 6. The features of the six typical managed REE mines.
SiteLongitudeLatitudeSurface Area (ha)CountyMajor Features
A115.33925.138.03Anyuan“Heap leaching” technique, land leveling and grass plantation in 2014
B115.67924.85442.76Xunwu“Pool leaching” technique, land leveling in 2016, solar power plant in the south, west and northeast in 2017, and large areas of grass plantation in others
C115.72524.9092.55Xunwu“Pool leaching” technique, land leveling and tree plantation in 2009
D115.06724.9987.48Dingnan“In situ mineral leaching” technique, a combination of grass and tree plantation in 2012
E115.04924.9854.94Dingnan“Pool leaching” technique, land leveling in 2010, grass plantation in 2013, factory construction in some areas in 2018
F114.84624.83320.55Longnan“Pool leaching” technique, a combination of tree and grass plantation in 2010
The forest types A–F are coniferous and mixed forests (see Section 2.1).
Publisher’s Note: MDPI stays neutral with regard to jurisdictional claims in published maps and institutional affiliations.

