Article

Integrated Methodology for Urban Flood Risk Mapping at the Microscale in Ungauged Regions: A Case Study of Hurghada, Egypt

1
Department of Urban Management, Graduate School of Engineering, Kyoto University, Kyoto 615-8245, Japan
2
Faculty of Urban and Regional Planning, Cairo University, Giza 12613, Egypt
3
Disaster Prevention Research Institute (DPRI), Kyoto University, Kyoto 611-0011, Japan
4
Irrigation and Hydraulics, Department of Civil Engineering, Faculty of Engineering, Ain Shams University, Cairo 11535, Egypt
5
Architectural Engineering Department, Faculty of Engineering, Tanta University, Tanta 31733, Egypt
*
Author to whom correspondence should be addressed.
Remote Sens. 2020, 12(21), 3548; https://doi.org/10.3390/rs12213548
Submission received: 23 August 2020 / Revised: 26 October 2020 / Accepted: 26 October 2020 / Published: 29 October 2020

Abstract

:
Flood risk mapping forms the basis for disaster risk management and the associated decision-making systems. The effectiveness of this process is highly dependent on the quality of the input data of both hazard and vulnerability maps and the method utilized. On the one hand, for higher-quality hazard maps, the use of 2D models is generally suggested. However, in ungauged regions, such usage becomes a difficult task, especially at the microscale. On the other hand, vulnerability mapping at the microscale suffers limitations as a result of the failure to consider vulnerability components, the low spatial resolution of the input data, and the omission of urban planning aspects that have crucial impacts on the resulting quality. This paper aims to enhance the quality of both hazard and vulnerability maps at the urban microscale in ungauged regions. The proposed methodology integrates remote sensing data and high-quality city strategic plans (CSPs) using geographic information systems (GISs), a 2D rainfall-runoff-inundation (RRI) simulation model, and multicriteria decision-making analysis (MCDA, i.e., the analytic hierarchy process (AHP)). This method was implemented in Hurghada, Egypt, which from 1996 to 2019 was prone to several urban flood events. Current and future physical, social, and economic vulnerability maps were produced based on seven indicators (land use, building height, building conditions, building materials, total population, population density, and land value). The total vulnerability maps were combined with the hazard maps based on the Kron equation for three different return periods (REPs) 50, 10, and 5 years to create the corresponding flood risk maps. In general, this integrated methodology proved to be an economical tool to overcome the scarcity of data, to fill the gap between urban planning and flood risk management (FRM), and to produce comprehensive and high-quality flood risk maps that aid decision-making systems.

Graphical Abstract

1. Introduction

Over recent decades, urban flood risk has significantly increased in Egypt due to extensive urbanization and climate change (Table A1 in the Appendix A). From 1975 to 2014, flash floods from upstream wadi subbasins and pluvial urban floods were responsible for the loss of thousands of lives and economic damage estimated at approximately 1.2 billion USD/year [1]. In most developing countries, various drivers have pushed urban extensions across large lowland areas prone to flood risk associated with the absence of both flood risk management (FRM) and effective spatial planning [2,3,4]. The main challenges of FRM are the deficiency of flood risk assessments and mapping, the lack of preparedness, and outdated information needed for sufficient response and recovery. Especially in Egypt, funding constraints, the ineffectiveness of mitigation measures, and the lack of adequate coordination between the entities responsible for FRM are considered vital challenges. In addition to the increased frequency and intensity of extreme rainfall events, infrastructure aging, the deterioration of building conditions, and the mismanagement of urban land, especially for urban growth in flood-prone areas, are crucial drivers that contribute to increasing urban flood risk [2,3,4,5]. Therefore, integrated flood risk mapping that utilizes spatial data is essential for identifying risk-prone areas in urban environments [6,7,8]. Detailed urban flood risk maps are required to propose efficient mitigation measures for existing urban areas and future expansions that will assist in better decision-making [9]. In this regard, flood risk mapping is expected to boost the efficiency of disaster management, reduce the devastating social and economic impacts of floods, and direct urban growth to safe areas [10].
Flood risk mapping is based on integrating hazard and vulnerability maps. For hazard mapping, many researchers use geographic information system (GIS)-based, lumped, and semi distributed models with very few applications based on distributed models such as the HAZUS M-H, HISS-SSM, FLEMO, and LATIS models, as these models are data-driven [11,12,13,14,15]. However, the selection of these models can be misguided, leading to erroneous outcomes when applied in areas with a composite topography [16]. Therefore, the use of a 2D model, such as the Mike21, Hydrologic Engineering Center’s - River Analysis System (HEC-RAS), and rainfall-runoff-inundation (RRI) models, is generally suggested due to the provision of distributed and accurate results [17,18,19,20,21,22,23,24,25,26,27]. Many studies have simulated the inundation depth in a floodplain without the spatial and temporal distributions of rainfall or suitable infiltration parameters [11,19,20,21,22,28,29]. Moreover, to validate and calibrate the developed model in arid regions, to improve the reliability of the results, and to conduct a sensitivity analysis of the model parameters, various challenges remain. However, the RRI model is capable of simultaneously predicting distributed runoff and flood inundation depths [30,31]. This model has been successfully implemented and modified to simulate single and long-term flooding events with excellent performance both worldwide [31,32,33] and in arid regions [5,34]. Moreover, the RRI model incorporates three different surface-subsurface interactions: (A) only overland flow (no infiltration loss, no subsurface flow), (B) vertical infiltration and infiltration excess overland flow, and (C) saturated subsurface and saturation excess overland flow. The quality of the simulated outputs is highly dependent on the quality of the input data [22,35]. On the other hand, under limited data, the applicability of these models becomes a difficult task, especially in urban and suburban areas [17,18]. In such cases, remote sensing data could play a key role in overcoming this deficiency by providing topographical, metrological, and land cover (LC) data [25,27].
Vulnerability can be defined as susceptibility and fragility with respect to an expected hazard resulting from physical features or operational attributes [30]. The components of vulnerability can be divided into five major categories: the physical, social, economic, environmental, and institutional dimensions [36,37]. Many studies have addressed vulnerability mapping from the last century to the present for different areas with multiple tools and approaches. An approach integrating GISs and multicriteria decision-making analysis (MCDA) is the most common recommended approach [5,38,39,40,41,42,43,44,45,46,47,48,49,50,51,52,53,54,55]. However, flood vulnerability mapping suffers from some limitations in ungauged microscale urban and suburban areas [56,57]. These limitations manifest in the inadequate level of vulnerability analysis based on two main aspects [10]: (1) some vulnerability components are often neglected, and there is a limitation with regard to the number of indicators representing such components at the microscale [57,58,59,60]. As demonstrated in the literature, although 40 possible indicators have been identified, only 11 are commonly used [61]. (2) The indicators used are of low quality and vary from 100 m × 100 m to 300 m × 300 m [62,63], and they are mostly not relevant to urban planning aspects, which are considered the cornerstone of vulnerability mapping in urban areas [11,64]. The data that determine vulnerability represent vital inputs for risk mapping and are usually well provided with high quality with regard to sectoral planning through high-quality city strategic plan (CSP) data sets [65,66]. Although these kinds of data are freely available from urban planning agencies, such data are not utilized in risk mapping because of the separation between FRM and urban planning entities. Therefore, data integration between these entities for effective spatial planning and enhanced flood risk mapping does not occur. Thus, utilizing CSP data will considerably improve vulnerability mapping and make it more reliable, comprehensive, and helpful to decision-makers [65,66].
Many methods for flood risk mapping have been introduced, and the integration of remote sensing data, GISs, and the analytic hierarchy process (AHP) is considered one of the most common methods [23,24,25,26,27]. Furthermore, flood risk mapping in ungauged basins using remote sensing data with hydrological models has been applied in many studies [67,68,69,70,71,72,73]. However, most of these studies conducted their investigations at the regional or basin scale. There is a notable limitation in flood risk mapping studies at the local scale, particularly in studies that combine inundation modeling, the AHP, and urban vulnerability indices in ungauged regions [63,74].
Accordingly, an integrated methodological approach for urban flood risk mapping at the microscale in ungauged regions is proposed and implemented in Hurghada, Egypt, where frequent flood episodes are observed due to intense storms. This study aims to (1) enhance the quality of hazard and vulnerability mapping at the urban microscale in ungauged regions and (2) to produce flood risk maps to support decision-makers in (A) determining the impact of urban development planned for 2027 on the existing urban area in Hurghada, (B) evaluating the 2027 CSP from a flood risk perspective, and (C) prioritizing intervention points. The proposed methodology utilizes a noncommercial 2D RRI simulation model with remote-sensing data to produce high-quality inundation maps and exploit the limited available data. Moreover, high-quality CSP data sets (land use, building height, building condition, building material, total population, population density, and land value) are used to enhance the vulnerability mapping. These parameters have been used by the official authorities responsible for urban planning in Egypt and by several studies as urban vulnerability mapping indicators [37,75,76,77,78,79]. This study targets the generation of the first flood risk maps for Hurghada, covering extreme events with different return periods (REPs; 5, 10, and 50 years) in both current and future situations. Furthermore, the detailed risk maps developed can support decision-making on the design of mitigation measures and policies for the protection of human life, property, and economic activities.

2. Study Area

Hurghada is an important center for tourist and mining activities: it lies directly on the Red Sea coast, and it is bounded by latitudes 270°10’ and 270°30’ N and longitudes 330°30’ and 330°52’ E (Figure 1). The city consists of ten urbanized districts with a dense population distribution. The desert lands flanking the Red Sea are drained by wadis (Figure 1). A wadi can be defined as a dry river that flows infrequently in direct response to heavy rainfall and usually with sudden, potentially destructive urban flash floods. In the last century, enough rainfall to produce wadi flooding occurred in this region an average of only once per decade.
Recently, urban flash floods have occurred more frequently in Hurghada almost every year, causing loss of life and significant damage. Accordingly, the city has become one of the most vulnerable areas to such events near the Red Sea [1]. Satellite rainfall data show that this trend increased in Hurghada from 1983 to 2019. Additionally, the city has the highest mean annual maximum daily precipitation in Egypt [80]. Since 2000, numerous urban flash flood events have occurred along the Egyptian Red Sea coast, which has experienced 30 medium and large events this century [80]. There has been an increase in the exposure of the city to flood risk during winter (rainy season) from October to February due to convective rainfall (Table 1). Additionally, since 1996, several urban flash flood events have been recorded in the city and its vicinity. Inhabited areas, main roads, military campuses, and tourist buildings have been severely affected. Moreover, environmental contamination due to water flooding, especially in the inhabited lowland areas, has occurred [1].
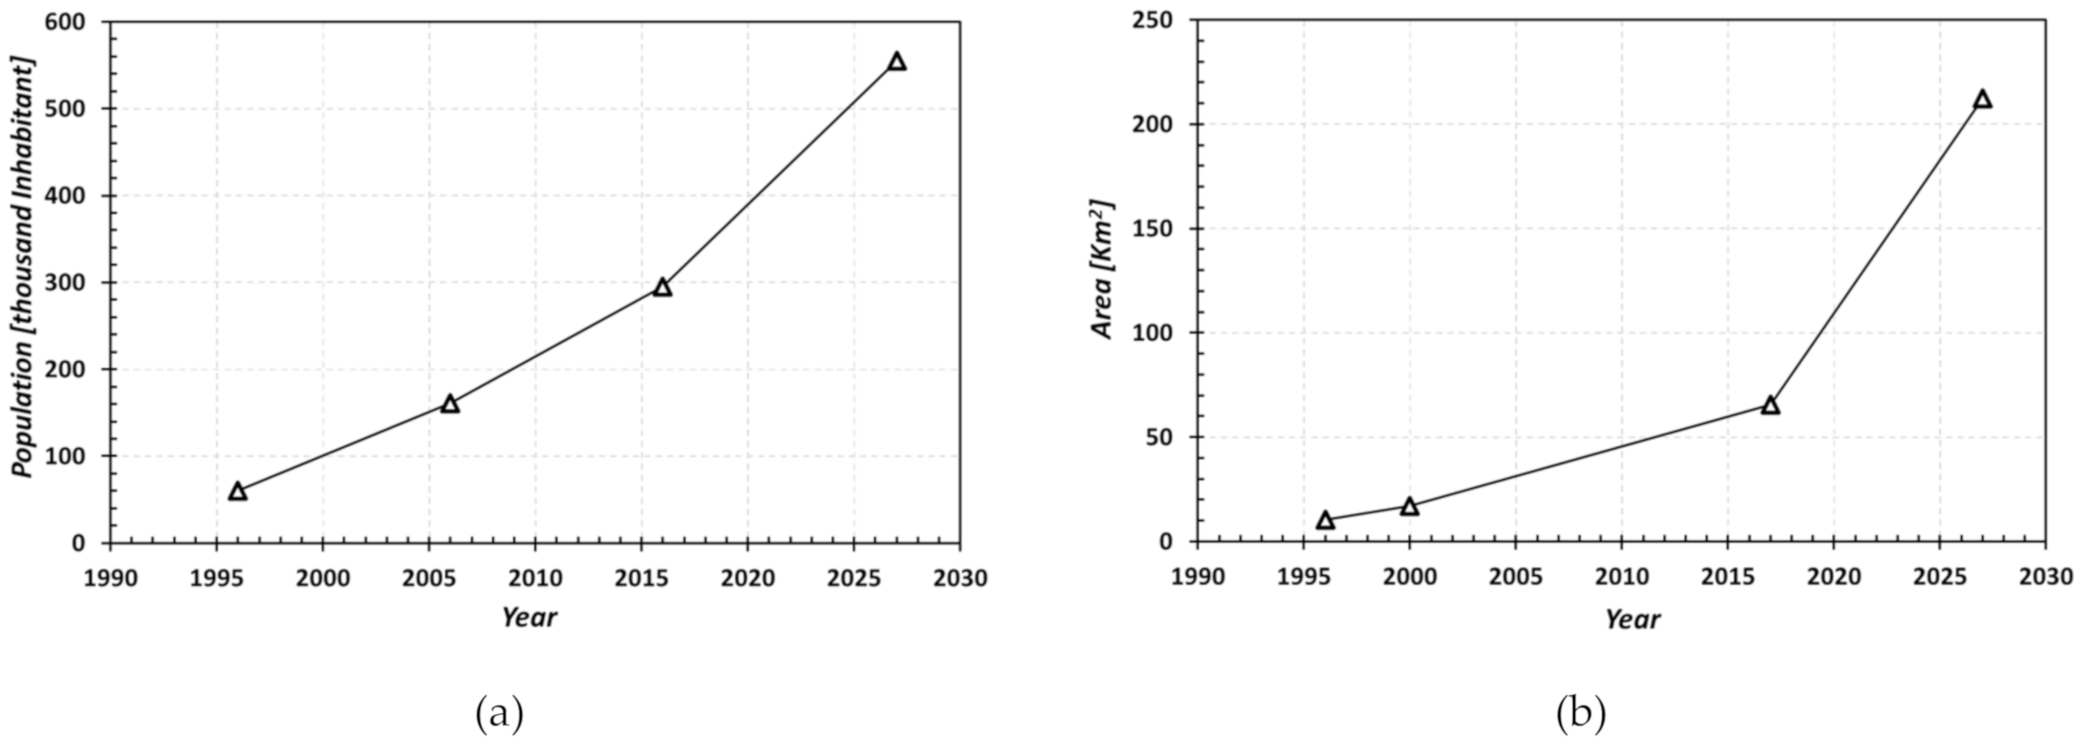
Over the last 25 years, the region has undergone rapid tourism development and massive increases in urban and population growth. During this period, urban LC increased from 10 km2 to 65.5 km2 in 2017, and it is expected to reach 212 km2 in 2027. Additionally, the population increased by almost 3.5 times (Figure 2).

3. Materials and Methods

3.1. Data Availability

Many types of data sets were collected and analyzed in this study (Table 2). Census, demographic, and current urban databases from the city from the 2027 approved plan for Hurghada were collected. The derived data were on the total population, population density, and administrative boundaries as well as all the data needed for the seven indicators used in vulnerability mapping. Additionally, topographic features, spatial-temporal rainfall and runoff analysis, land use, LC types, geospatial data, and risk maps informed by the RRI model at scales appropriate to guide future development were obtained.
The lack of hydrological and meteorological data in the Red Sea region necessitated the use of hydrological modeling to predict flood depth and the spatial extent, in addition to identifying sites with high risk. The RRI model used several remote-sensing data, including a digital elevation model (DEM) with an accuracy of 12.5 m, an LC map, and historical daily rainfall records. The resolution of the rainfall data was as follows: (0.04° × 0.04°)-hourly based data for the 2014 (5-year REP) and 2016 (10-year REP) events. The resolution of the rainfall data was (0.25° × 0.25°)-daily based data on the 1996 (50-year REP) event. LC was mapped from Sentinel (2A) with a 30 m resolution. These data sets were used to produce the inundation maps for the 5, 10, and 50 REPs in Hurghada.
Regarding model calibration and validation, photos during the event from different local newspapers were used. One of the authors (S.A.K.) conducted fact-finding and field investigations, reconnaissance-level inventories for topographic maps, and site visits to obtain the ground truth of the interpretations from imagery. From 2014 to 2015, we visited several specific urban sites, reviewed the proposed layouts of buildings and infrastructure, and provided comments to developers regarding avoiding urban flash flood risk and other environmental impacts. We have direct knowledge of the urban flash flood history of Hurghada over the past three decades from the early 1980s to 2019.

3.2. Proposed Method

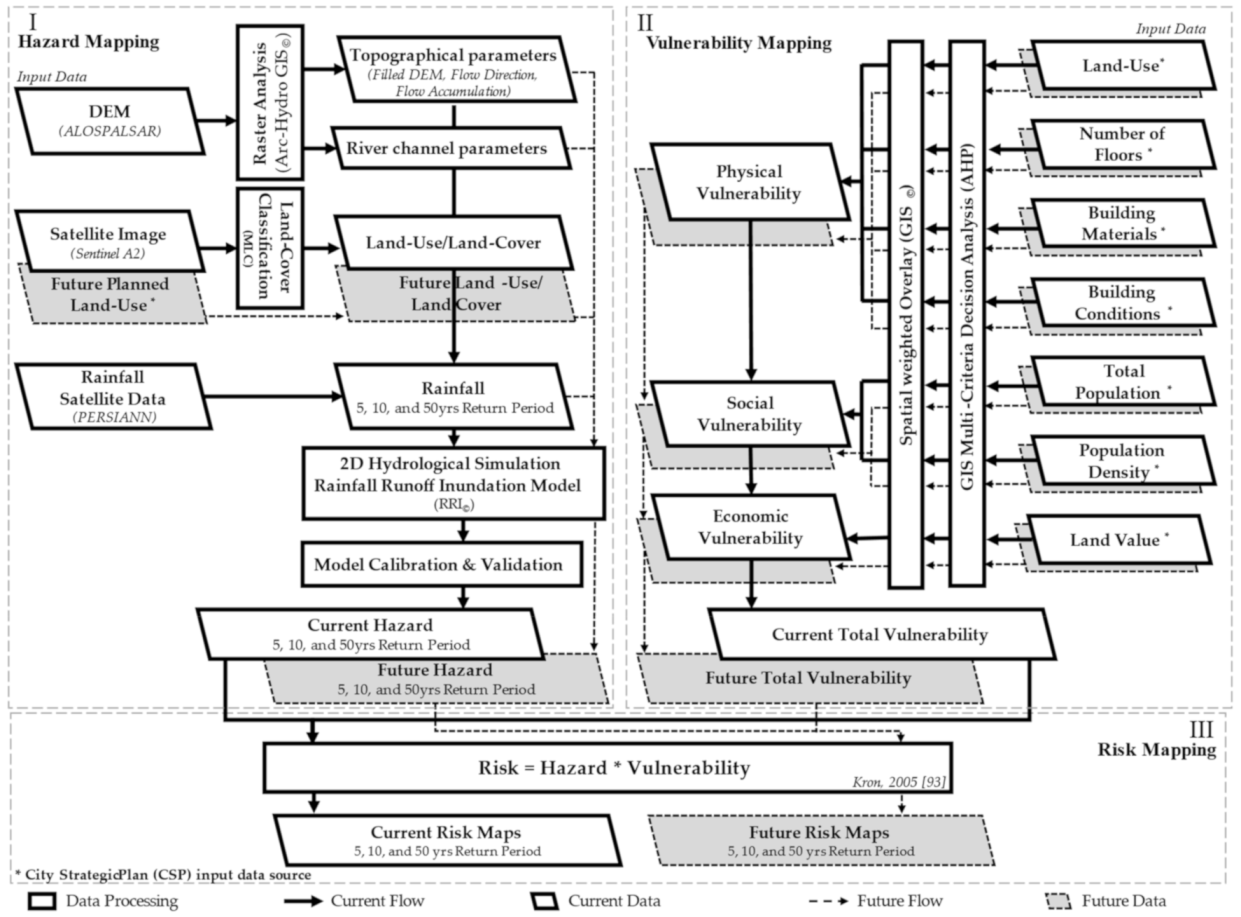
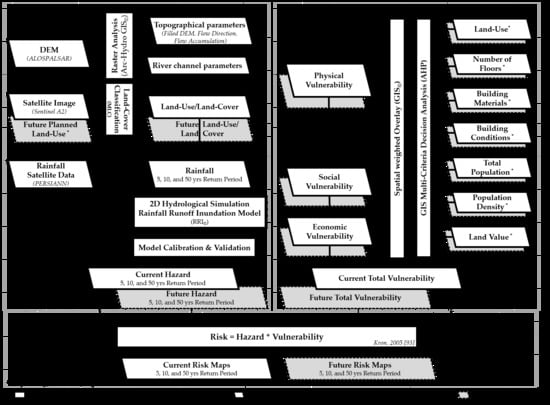
An integrated method is proposed to evaluate urban flood risks in ungauged regions on the city (micro) scale following three steps of assessment (Figure 3). The proposed method consists of three methods:
  • The hazard mapping method was based on rainfall, topographic, and hydrological satellite data for Hurghada during the 1996, 2014, and 2016 events. These events were found to exhibit close to 50, 5, and 10 year REPs, respectively. The RRI model was calibrated based on georeferenced photos taken during the 2014 event. The validation of the model result was conducted using photos of the 2016 event.
  • The vulnerability mapping method was implemented through a combination of multiple physical, economic, and social vulnerability parameters for the current and future situations. The physical vulnerability parameters were land use, building height, building conditions, and building materials. Economic vulnerability had one parameter, land value. The social vulnerability parameters were the total population and population density. Vulnerability maps were generated to present the current and future situations. For the current situation, the CSP data sets obtained from detailed urban surveys were used, while for the future situation, the approved future CSP was used. Then, GIS-based MCDA using the AHP approach was applied to assign the relative weight for each vulnerability parameter and to generate urban flood vulnerability maps. The resulting vulnerability maps were ranked using five equally divided categories: very low, low, moderate, high, and very high. The classification is based on the literature.
  • The risk mapping method is based on integrating the final obtained vulnerability and hazard maps. The final risk map is ranked using five equally divided categories from the minimum to maximum risk score as in the literature: very low, low, moderate, high, and very high.

3.2.1. Hazard Mapping Method

  • RRI model
The RRI model was used for simulating the inundation depth in the Hurghada catchment area. The simulation for the desert was close to saturated subsurface + saturation excess overland flow (case C), while for the urban area, only overland flow was chosen (case A). Additionally, urban flash flood estimation was performed based on daily time series data due to the lack of hourly observations. Rainfall and topographic data are considered the most important input parameters for the RRI model [30].
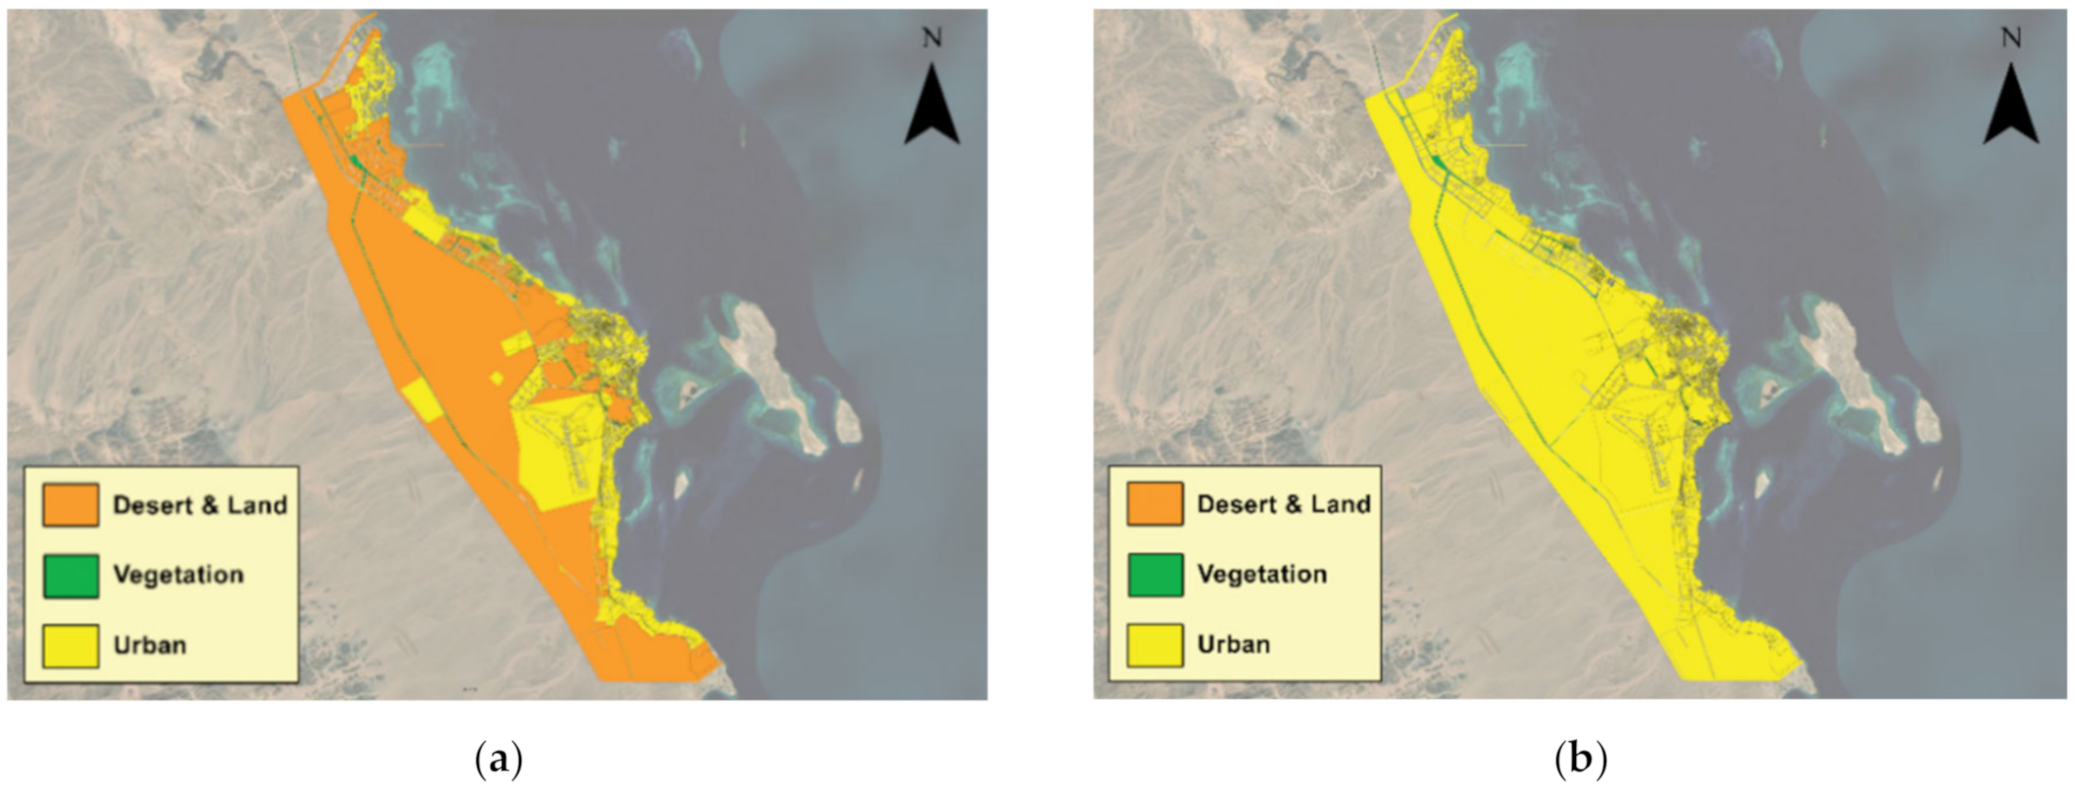
The workflow of the hazard module for floods using the RRI model is summarized in three steps. First, the daily spatial rainfall intensities for different hazard scenarios were obtained based on PERSIANN-Climate Data Record (CDR) for the 1996 event and the PERSIANN-Cloud Classification System (CCS) for the 2014 and 2016 events with their highest resolutions, i.e., 25 km and 4 km, respectively. Second, the DEM was obtained from Advanced Land Observation System-Phased Array Synthetic Aperture Radar (ALOS-PALSAR) data available from the Alaska Satellite Facility (ASF) Distributed Active Archive Center (DAAC) with a 12.5 m resolution [88]. The original DEM was processed using the Arc-hydro tool of ArcMap 10.6.1 to obtain the filled DEM, and the flow direction and flow accumulation were extracted. The Arc-hydro tool was used later to identify and extract the drainage features in the study areas, such as the flow direction, flow accumulation, stream networks, and watershed delineation required as inputs for the RRI model. Third, the LC map was created based on the Sentinel-2A satellite data from 2019, which were corrected based on Google Earth satellite images and CSP data sets (Figure 4a) [79]. For the future situation, the LC map was obtained from the approved 2027 CSP (Figure 4b) [79]. The initial parameters of the RRI model were assigned based on the validated parameters in arid regions [34]. Finally, the RRI input raster maps for rainfall, topography, and LC were converted into ASCII files with their original resolutions, while the hazard maps (inundation depths) had the same resolution as the DEM utilized (12.5 m × 12.5 m).
  • Model calibration and validation
For more comprehensive and accurate results, the RRI model was calibrated and validated. Due to the lack of observed data, the calibration and validation processes were performed based on reported images of the 2014 and 2016 events. Regarding the land use parameters in the RRI model, the model parameters for different cases must be determined in advance. The city was classified into three types of land use: desert, vegetation, and urban (Figure 4).
One point (V1) was obtained from news reports of the event on 9 March 2014 and was used to calibrate the model. The obtained points showed that the inundation levels varied between 10 and 25 cm. Moreover, another two points (V2 and V3) for the 28 October 2016 event varied between 7 and 15 cm and between 10 and 20 cm for the first and second points, respectively (Figure 1). The resulting parameters are shown in Table 3.

3.2.2. Vulnerability Mapping Method

Current and Future Vulnerability Mapping

The vulnerability map data for both the current and future situations were derived from the high-resolution Hurghada CSP (Figure 5), which is a 15-year plan for the period from 2012 to 2027 [79]. These CSP data sets are GIS vector files, which are generally very detailed with higher spatial accuracy because the data are not dependent on grid size. The workflow of the vulnerability module was conducted in the ArcGIS environment, and it can be summarized in three steps. First, rank-based vulnerability score maps of each of these indicators were produced (Table 4). Second, each indicator weight was calculated by the AHP approach and multiplied based on the corresponding score map, producing indicator vulnerability maps. Third, three vulnerability component maps (physical, economic, and social) were produced by combining each component’s set of indicators. Finally, the total vulnerability map was produced by combining the three component maps. The resulting vulnerability maps have the same characteristics as the input data (GIS vector). All resulting vector maps were ranked in five vulnerability classes from very low to very high.
The vulnerability maps were calculated using Equation (1), presented by Frazier et al. [89] and Aroca-Jimenez et al. [90]:
V u l n e r a b i l i t y = f = 1 n   w f s f
where “f” is the vulnerability indicator, “n” is the total number of indicators, “ w f ” is the relative weight assigned to the indicators, and “ s f ” represents the indicator score.

Weighting of the Vulnerability Index Using the AHP

The AHP was developed by Saaty [91] as an essential tool for decision-makers or groups of decision-makers; it enables their preferences to be analyzed and discussed [92]. The AHP is based on constructing a series of pairwise comparison matrices (PCMs) to compare criteria to each other. The AHP is used to estimate the weighting of each criterion, which describes its importance. Saaty suggests a scale of 1–9 for PCM elements, wherein the value of 1 suggests that the criteria are equally important and the value of 9 leads to the inference that the criterion under consideration is essential with regard to the other criterion with which the comparison is made. The relative weights of the parameters were computed using the AHP. The AHP was implemented using the six steps discussed below.
  • The relative importance of each parameter pair was determined based on the pairwise comparison importance scale; this step is called prioritization (Table 5).
  • Pairwise comparison for a matrix of (7 × 7) cells was created for the seven vulnerability parameters (land use, building conditions, building height, building materials, land value, total population, and population density). The elements in row i and column j of the matrix are labeled I and J. The matrix has the property of reciprocity ( a i j = 1 / a i j   ), as shown (Table A2) in the Appendix A.
  • The matrix was standardized using the following mathematical Equation (2):
    a i j i , j = 1 n a i j
  • The normalized value for each parameter from pairwise comparisons was used with the weighted values in the last column of the standardized matrix to obtain the eigenvector, representing the consistency index (CI) matrix.
  • The CI was applied to check the PCM using Equation (3):
    C I   = λ   m a x n n 1
    where CI is the consistency index, n is the number of vulnerability parameters being compared, and λ max is the largest value of the eigenvector matrix.
  • The consistency ratio (CR) is the ratio of the CI and the random index (RI) shown in Table 6 and is expressed mathematically using Equation (4):
    C R = C I R I
Saaty developed the CR to check the consistency of the pairwise comparisons [72]. The CR was calculated, and the value was found to be 0.057, which is less than 10% (0.1), indicating that the PCM is consistent. The final vulnerability map was obtained by using the weighted overlay function in ArcGIS. The resulting weighted overlaid raster was ranked into five vulnerability classes from very low to very high.

3.2.3. Risk Mapping Method

Flood risk maps were generated as a spatial overlay between (1) the total current and future vulnerability maps (vector data) and (2) the flood hazard maps for the 1996, 2014, and 2016 events (raster data). The workflow of the risk module followed in ArcGIS is summarized in three steps.
First, the vulnerability and hazard map data had to be unified to perform the spatial overlaying process. Since the vector data had higher spatial accuracy than the raster data, the hazard raster data were converted into vector data using ArcGIS (Raster Zonal Statistic/Spatial Analyst) by calculating the hazard-level mean values for each pixel by the vulnerability vector layer boundary. Second, the hazard vector layer was categorized into four categories: very high, high, moderate, and low, with inundation depth ranges of 0–0.3 m, 0.3–0.75 m, 0.75–1.5 m, and >1.5 m, respectively. Third, a risk map was calculated based on Kron Equation (5) [94]:
F l o o d   R i s k   =   H a z a r d   ×   V u l n e r a b i l i t y

4. Results

4.1. Hazard Mapping

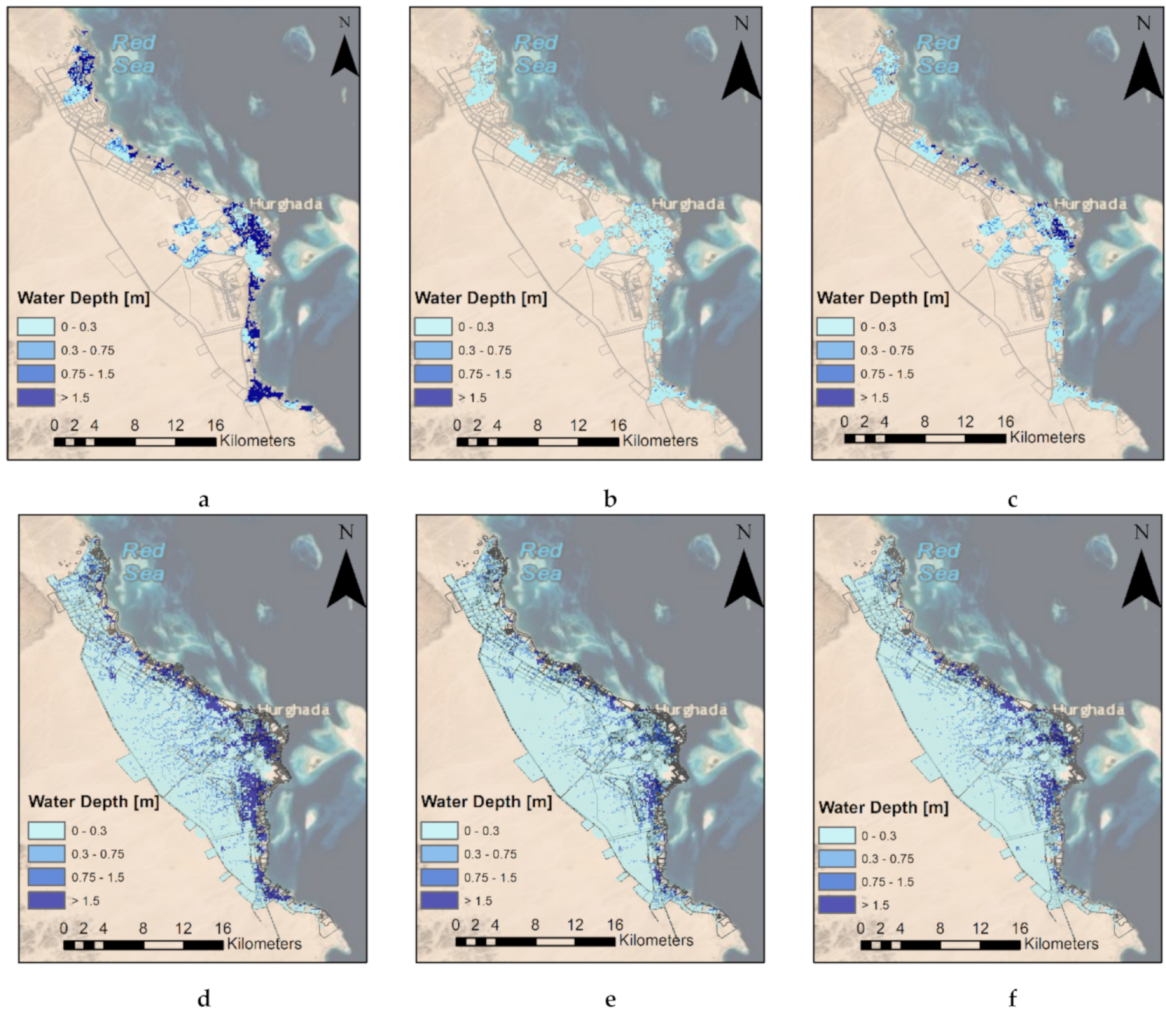
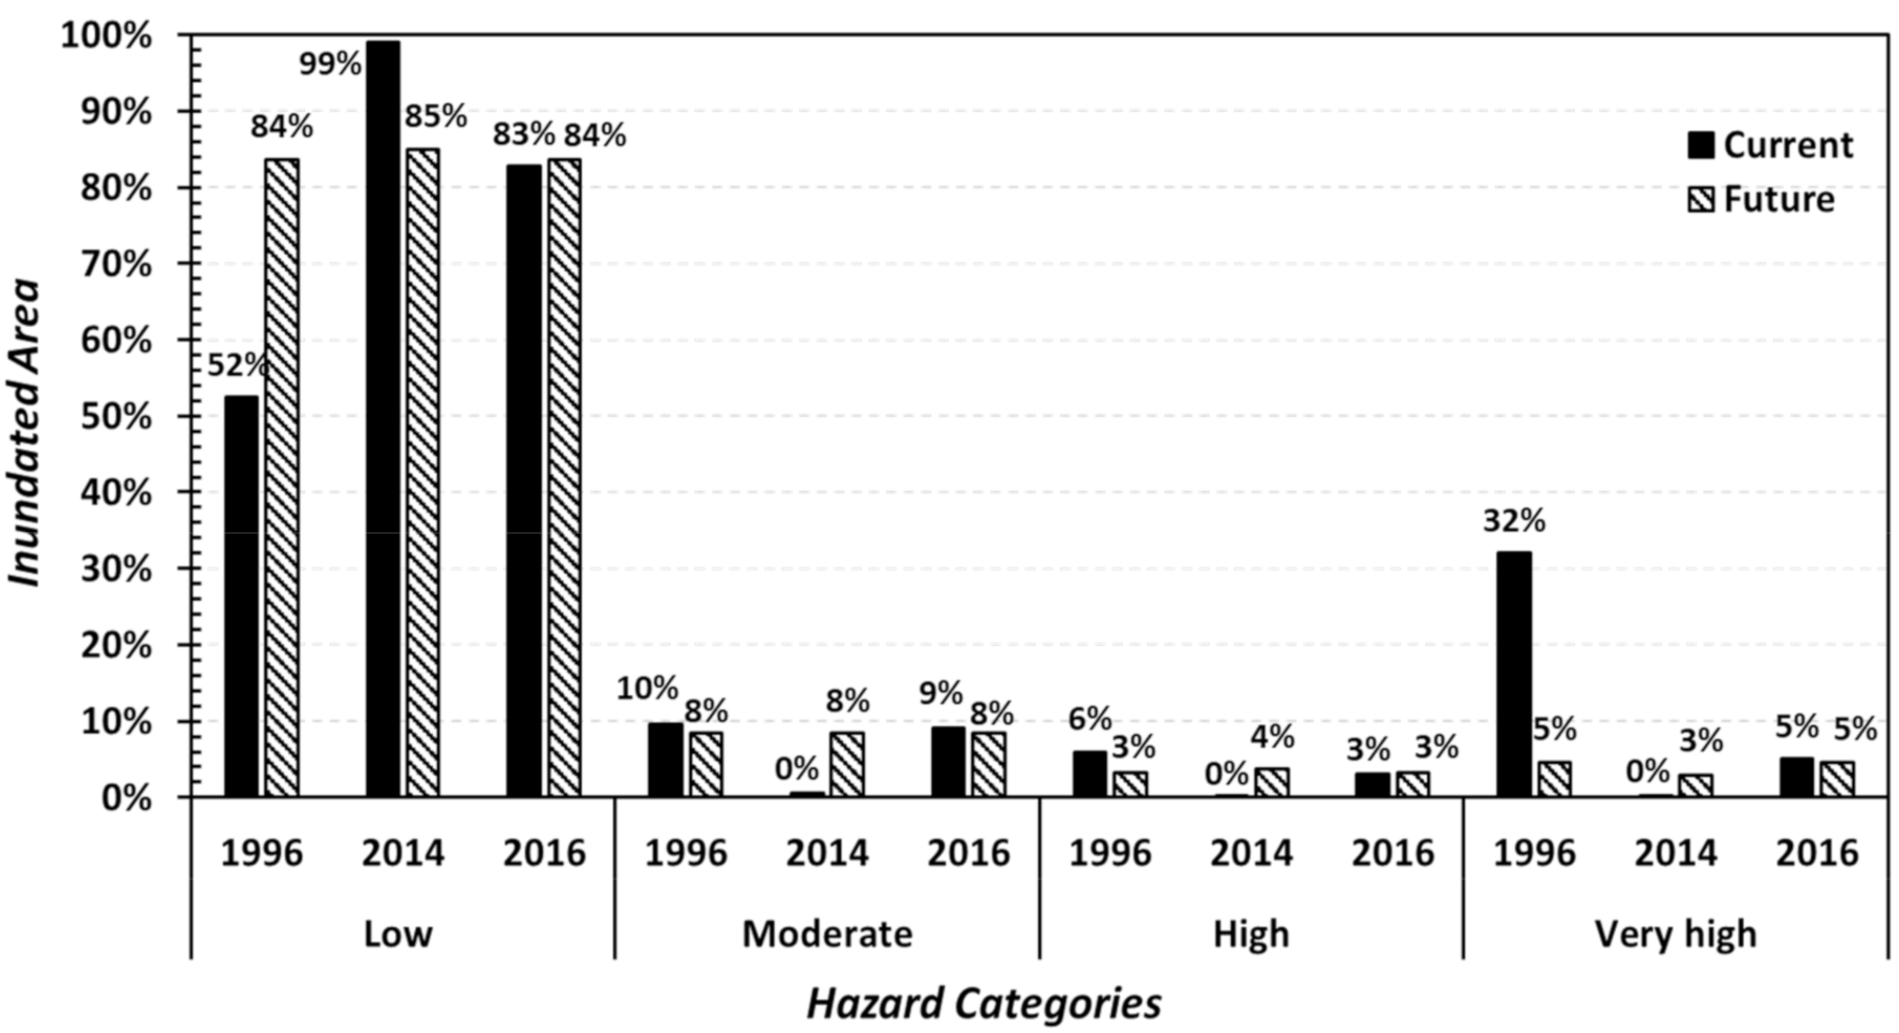
The current and future situation hazard maps for the three events in 1996, 2014, and 2016 are shown in Figure 6. The resulting hazard maps for the 1996 event for the current situation for the inundation depth ranges 0–0.3 m, 0.3–0.75 m, 0.75–1.5 m, and >1.5 m were found to be 31.96%, 5.95%, 9.68%, and 52.39%, respectively; for the future situation, they were found to be 4.6%, 3.32%, 8.4%, and 83.64%, respectively. Regarding the 2014 event, the four inundation depth ranges were 0.21%, 0.23%, 0.49%, and 99.05% for the current situation and 2.87%, 3.72%, 8.38%, and 85.02% for the future situation, respectively. Finally, for the 2016 event, the four inundation depth ranges were 5.07%, 3.1%, 9.06%, and 82.74% for the current situation, respectively, and 4.61%, 3.32%, 8.41%, and 83.64% for the future situation, respectively.
Regarding the RRI model calibration and validation process, for the calibration process, one point (image) during the 2014 event was used. The resulting simulated inundation level was 23 cm and varied in the range of 10–25 cm. In the validation process, two points (images) during the 2016 event were used. The resulting inundation depths from the simulation were 9 cm and 11 cm compared to the observed data, which varied from 7 to 15 cm and 10 to 20 cm for the first and second points, respectively. The RRI model showed high performance in simulating the hazard in the city despite the lack of data and proved to be valid. Furthermore, the model was used to simulate the 1996 event. There is available information regarding the maximum water level that was recorded during the event.

4.2. Current and Future Vulnerability Maps

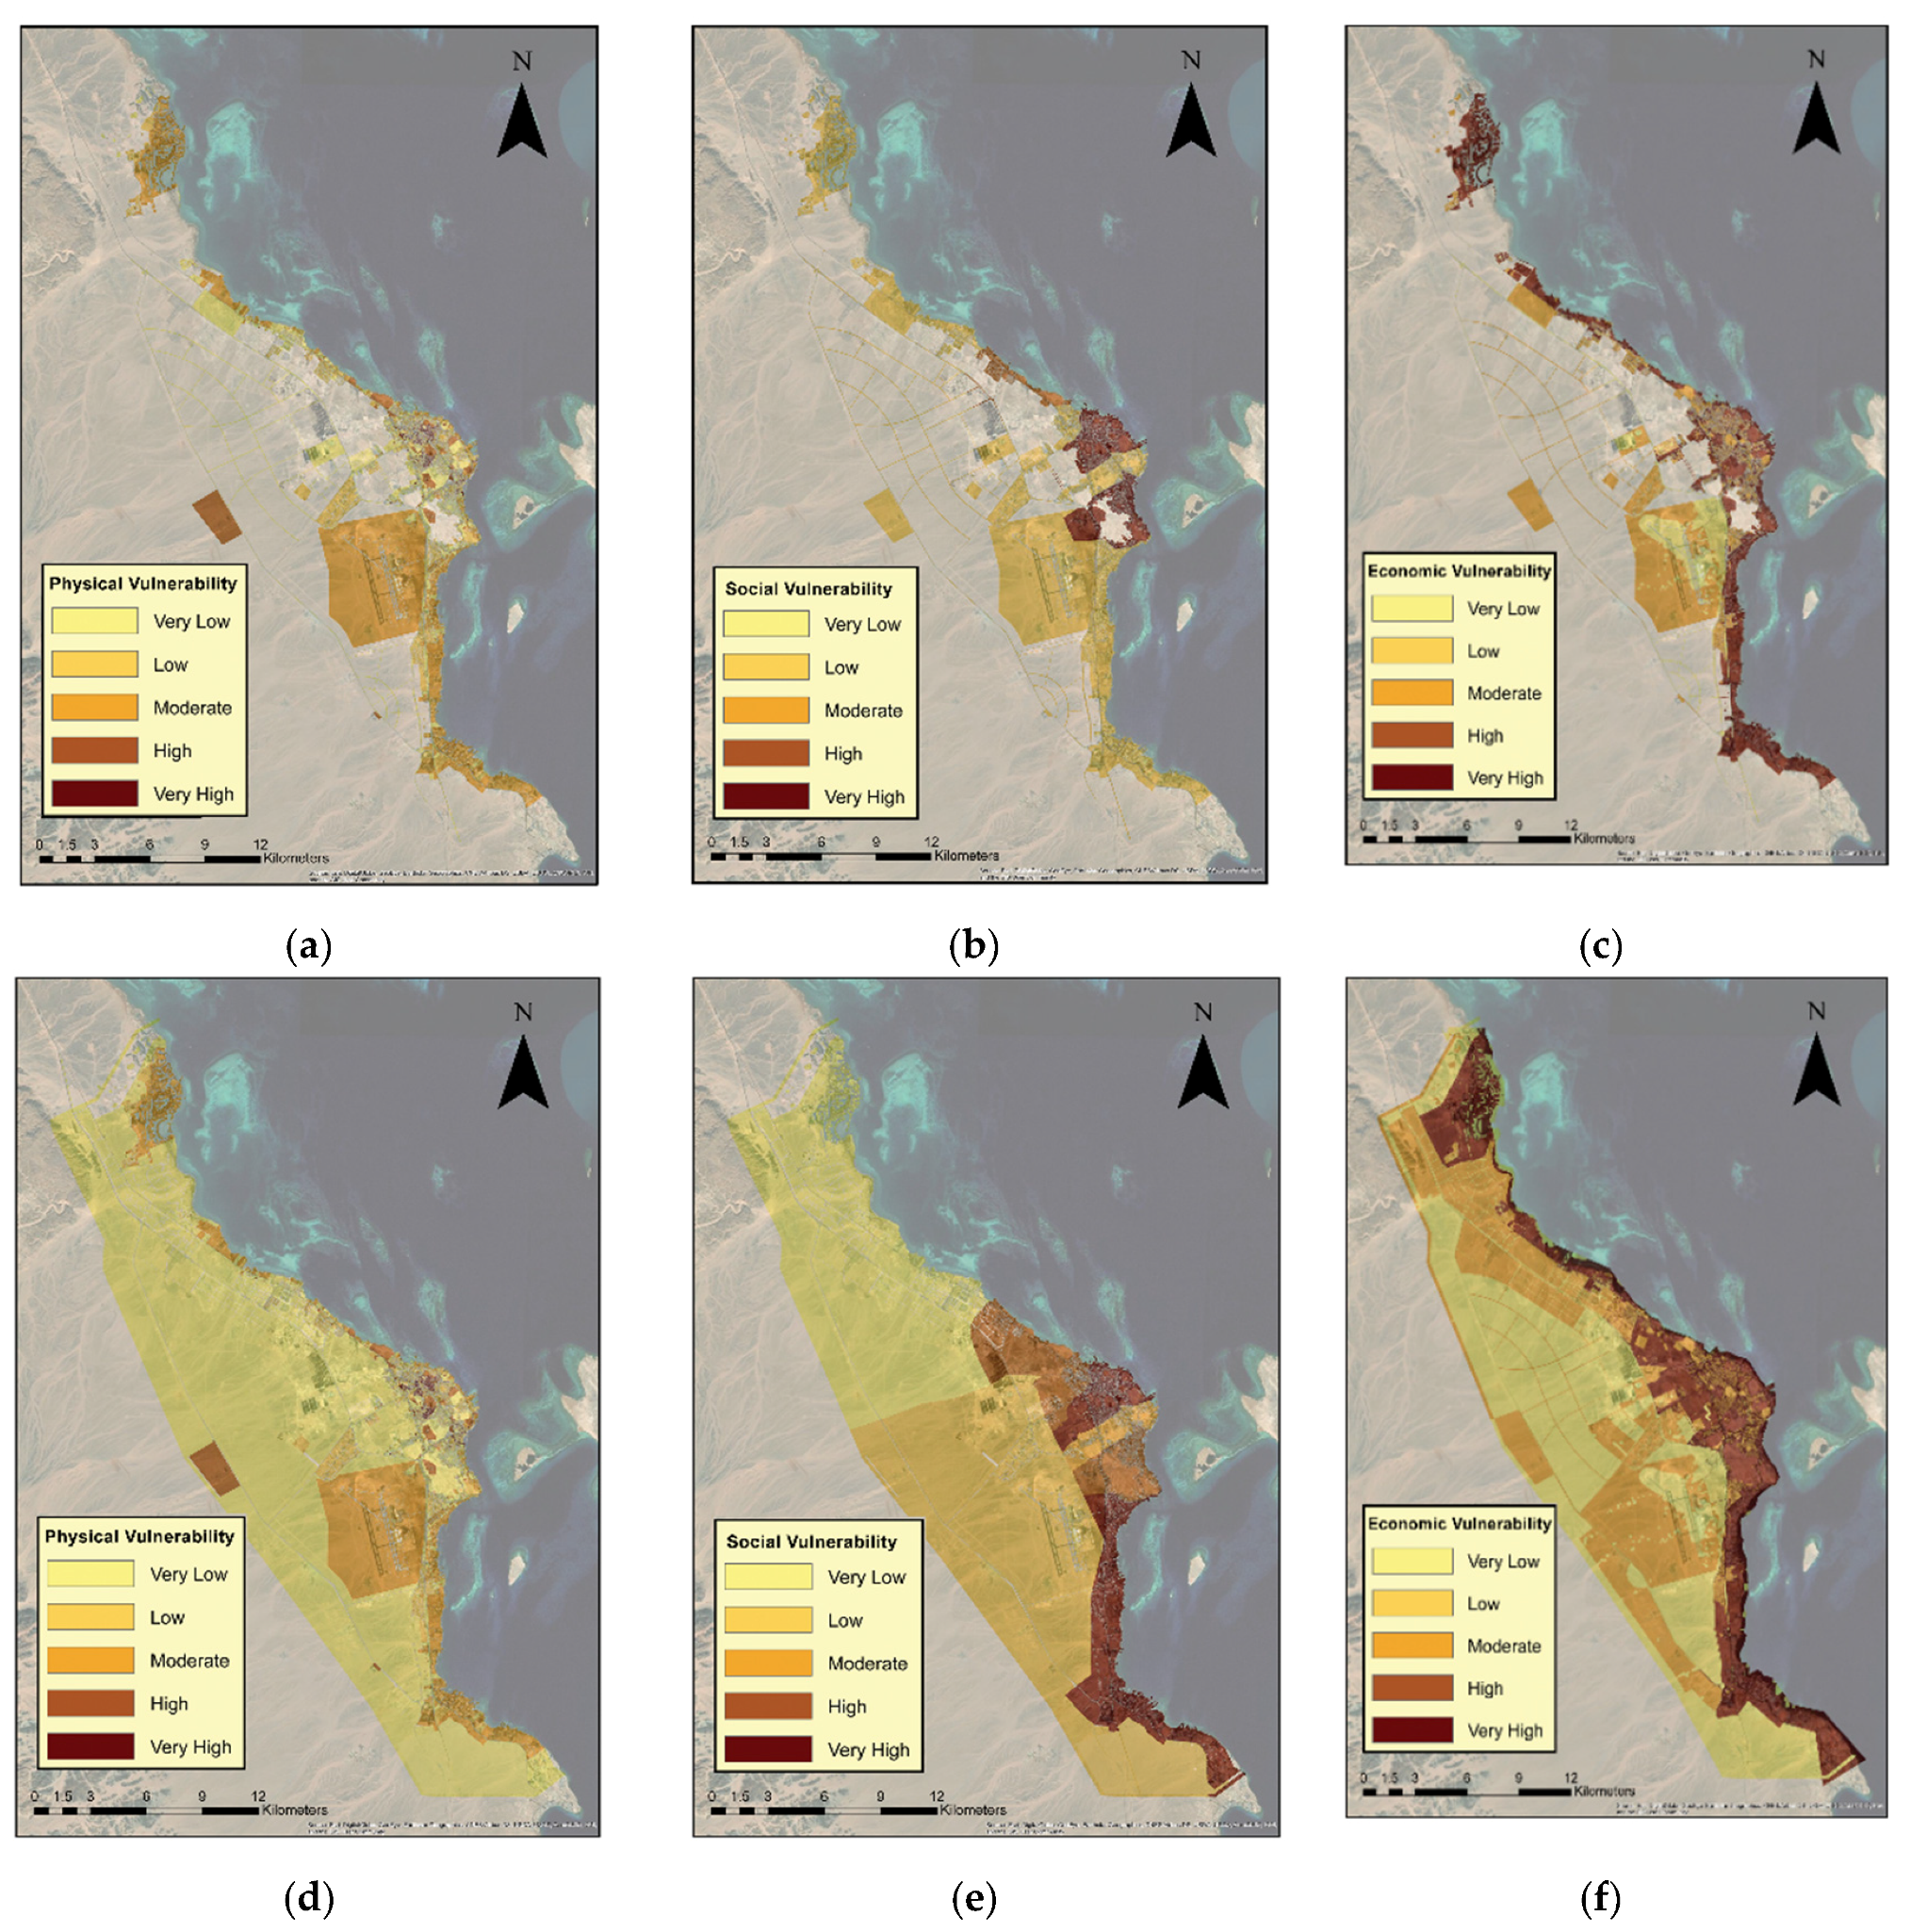
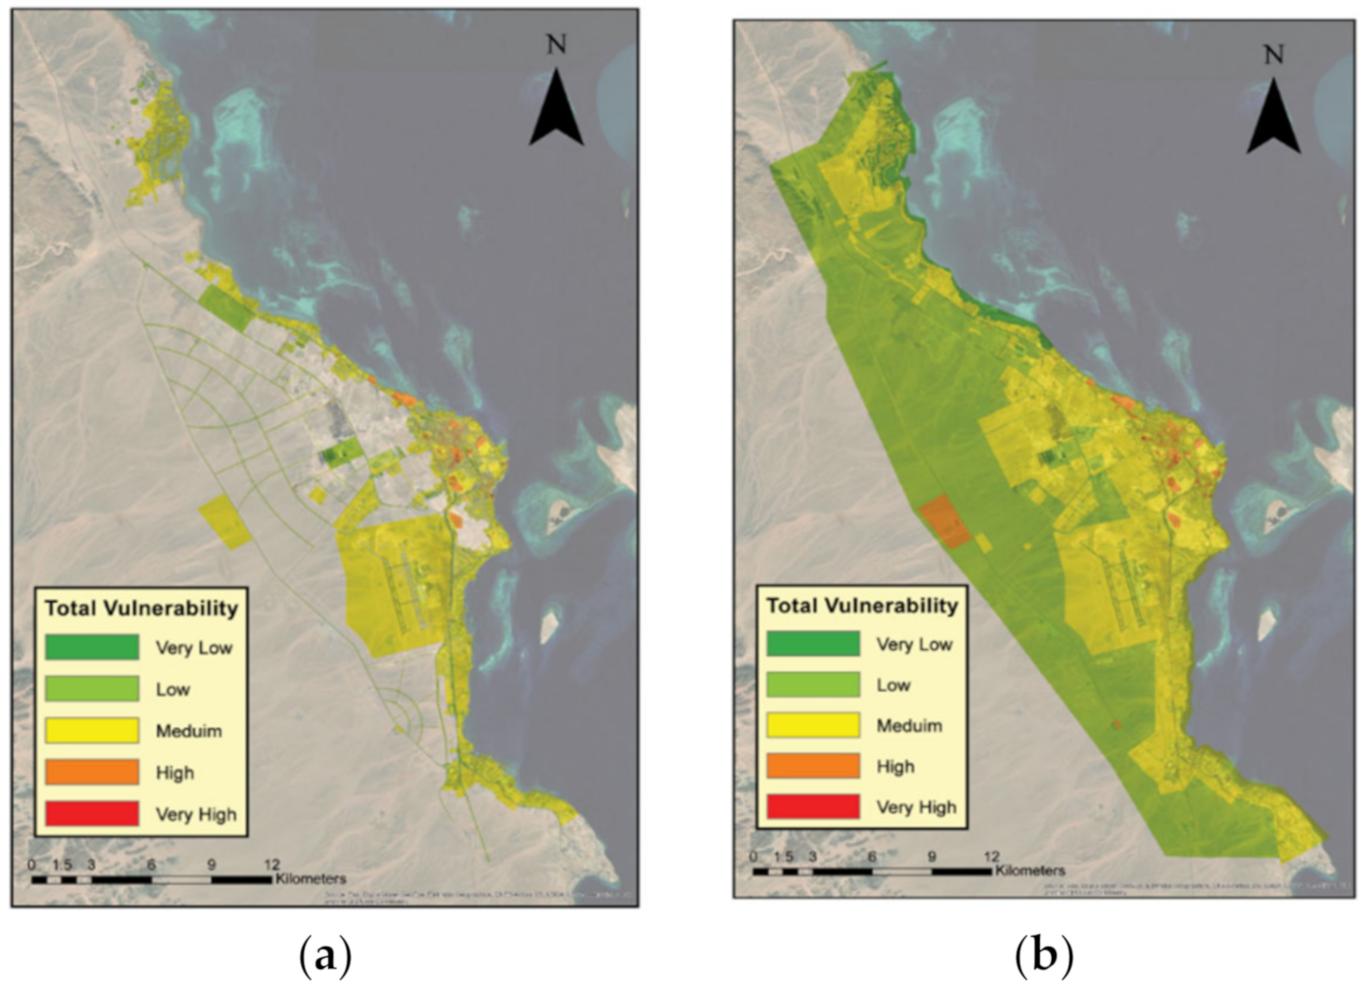
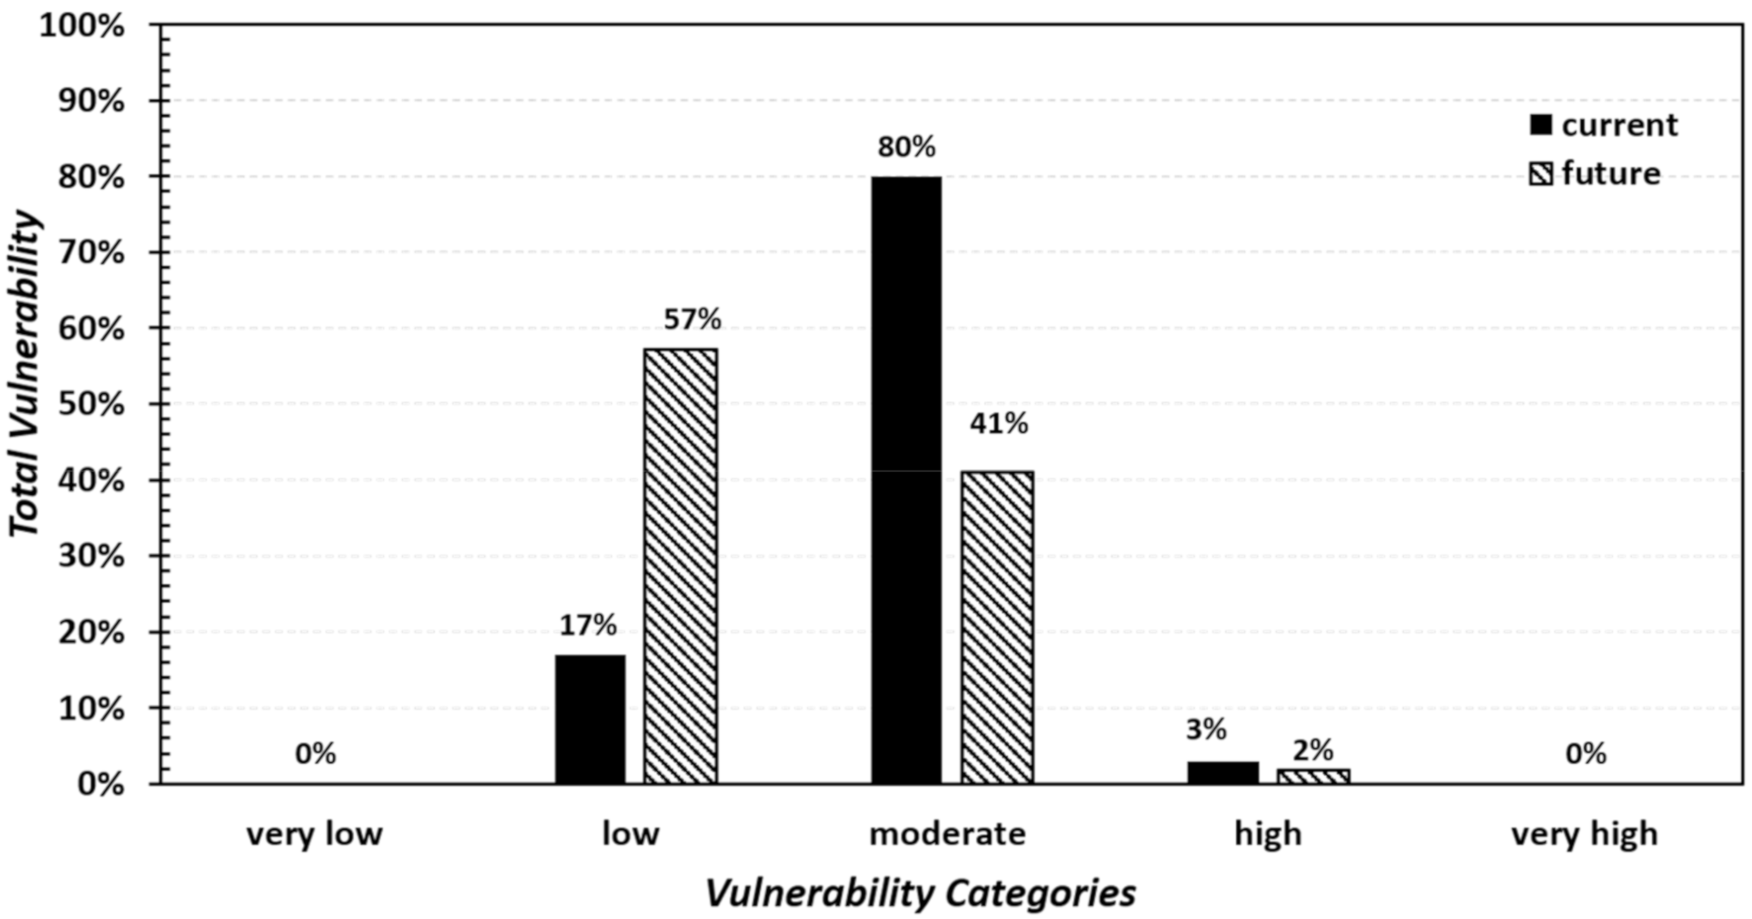
First, vulnerability score maps for the seven indicators were calculated based on the predefined ranks (Table 4). Second, the resulting indicator weights for land use, building height, building conditions, building materials, land value, the total population, and population density using the AHP were found to be 8.1%, 12.2%, 23.8%, 43.4%, 4.2%, 2.4%, and 6%, respectively. Indicator vulnerability maps were generated accordingly. Third, the resulting current and future vulnerability component maps for the physical, economic, and social components were produced (Figure 7a,d), (Figure 7b,e), and (Figure 7c,f), respectively). Finally, the total vulnerability map was produced for the current and future situations (Figure 8a,b, respectively). The results showed that the high total vulnerability category in the current situation reached 3% of the city area, while moderate and low vulnerability covered 80% and 17% of the city area, respectively. Regarding the future approved 2027 CSP, the total vulnerability was found to be 1.8%, 41%, and 57.2% for the high, moderate, and low vulnerability categories, respectively.

4.3. Risk Mapping

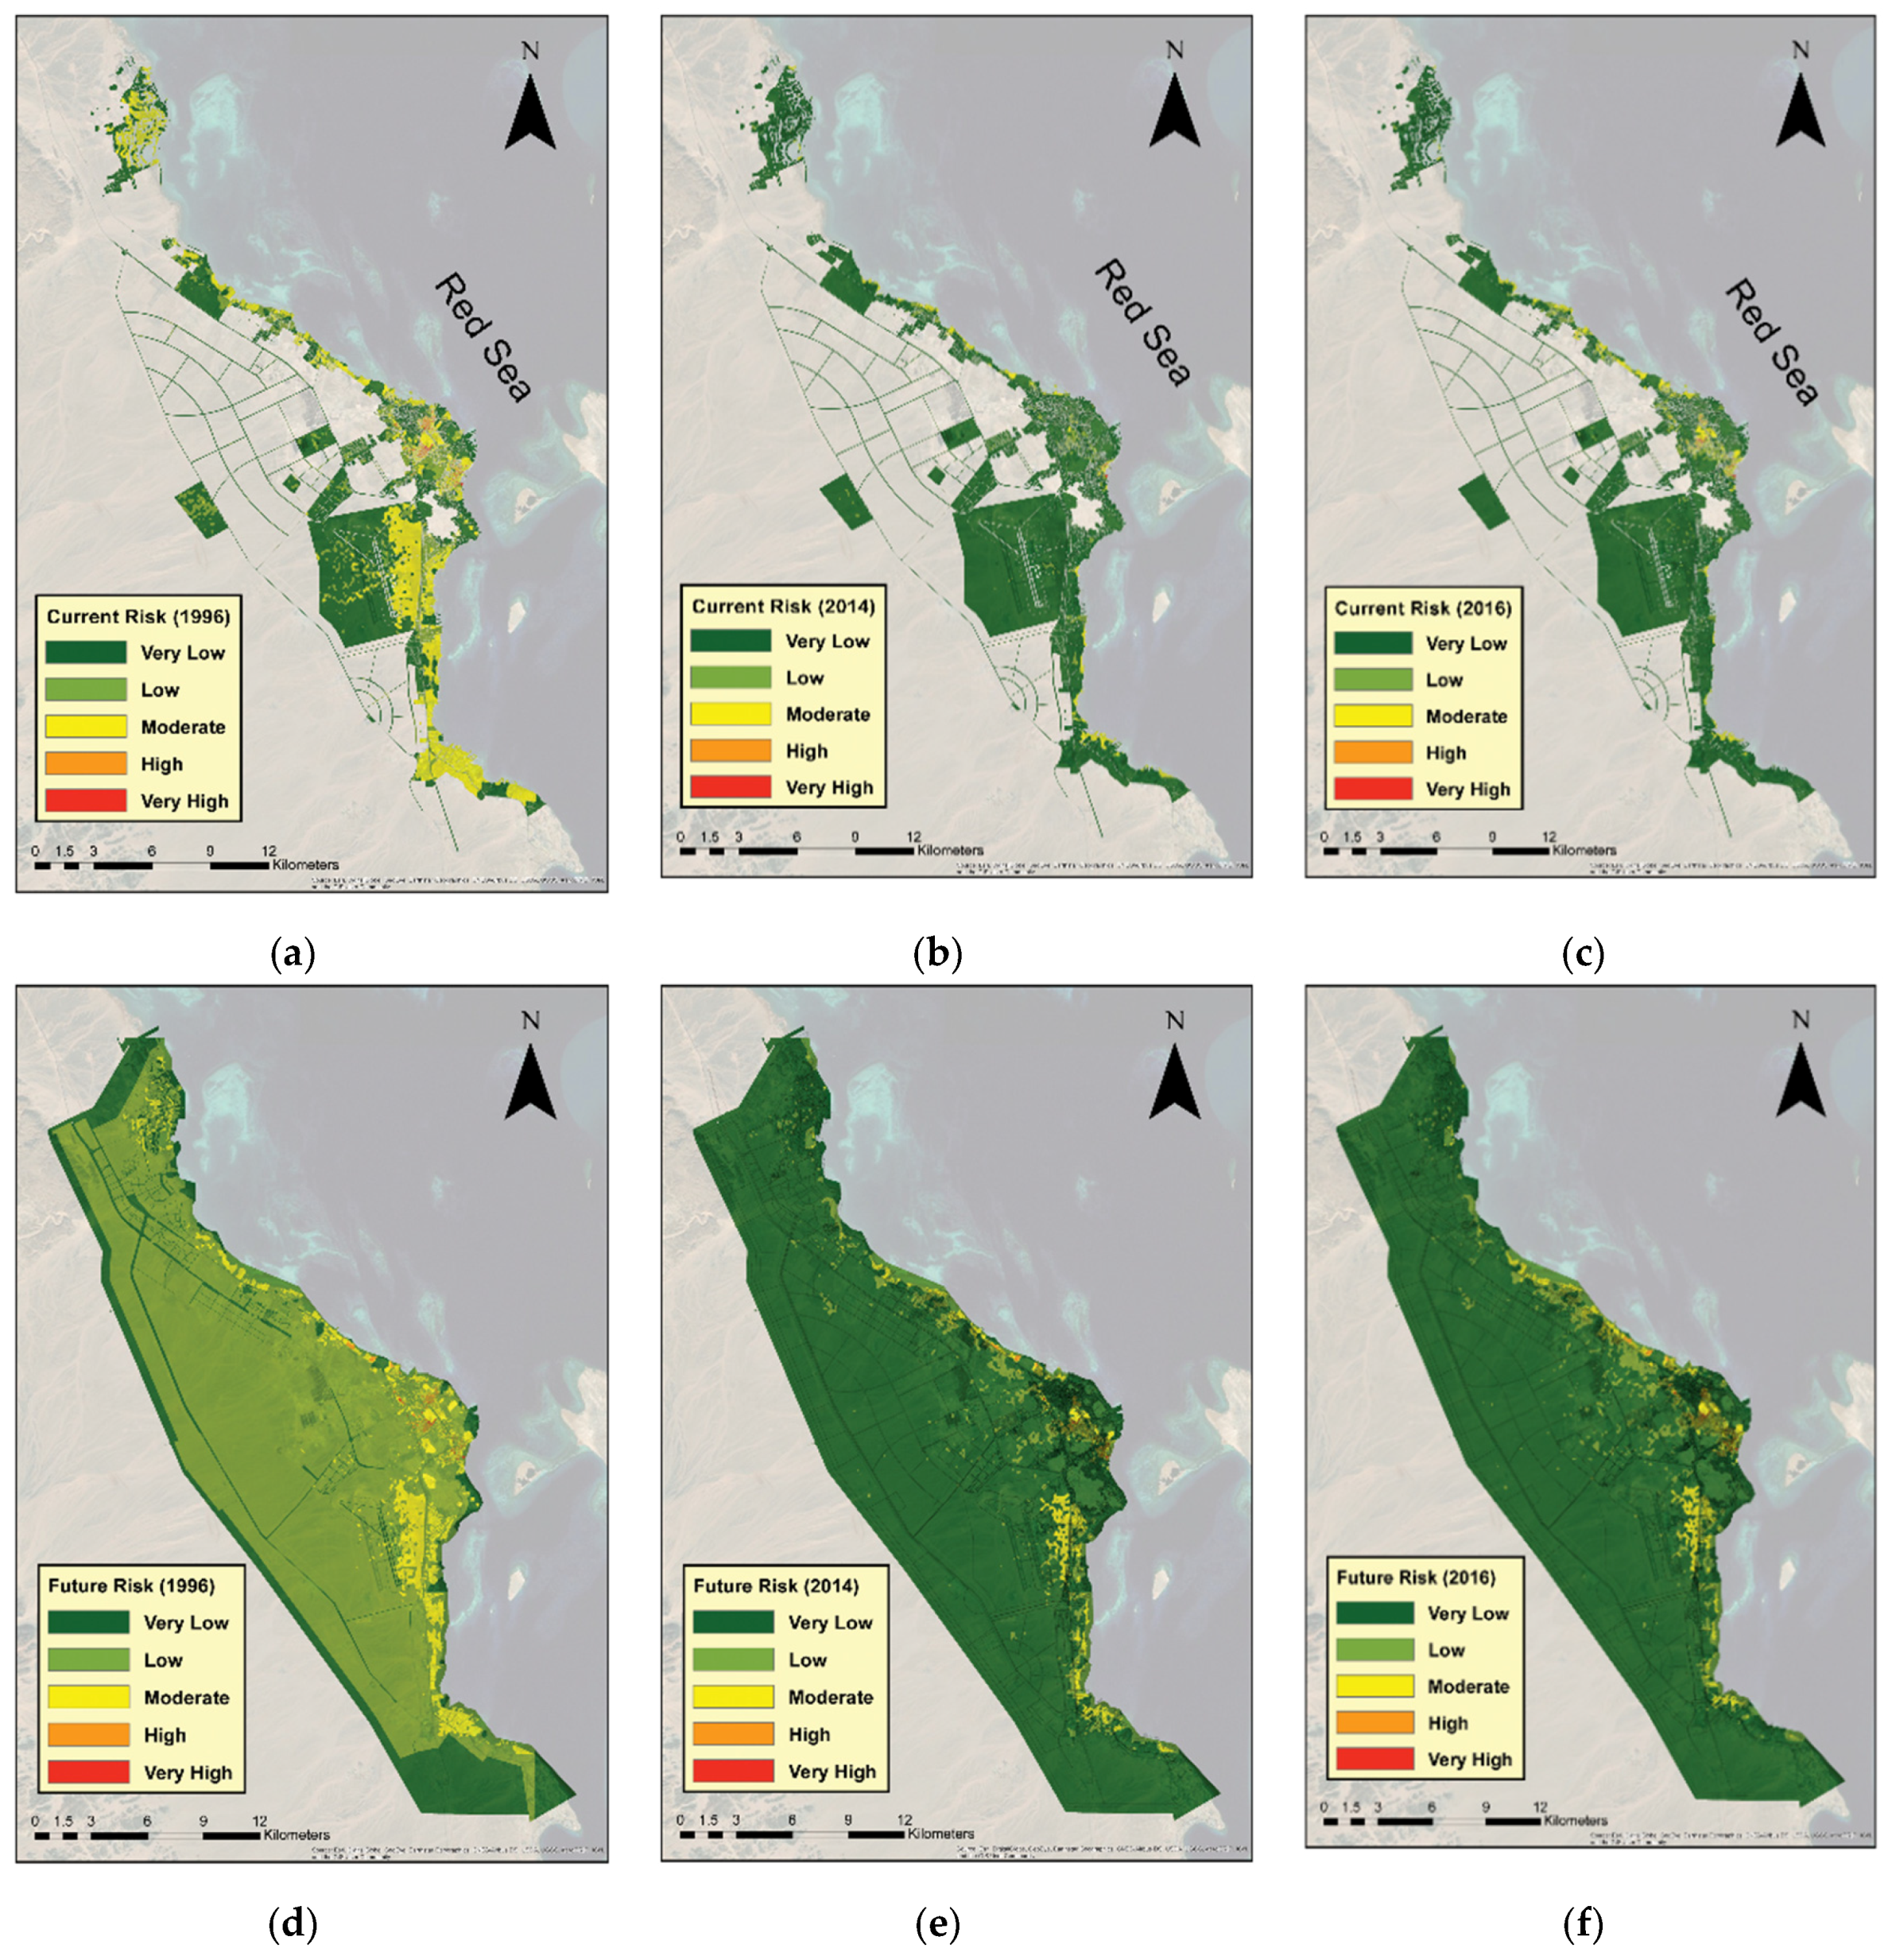
The resulting current flood risk maps for the 1996, 2014, and 2016 flood events are shown in Figure 9a–c, respectively. The percentages of areas at very high, high, moderate, low, and very low risk were found to be 0.1%, 0.8%, 22.3%, 71.5%, and 5.4%, respectively, for the 1996 event. For the 2014 event, they were 0%, 0.3%, 7%, 10.1%, and 82.6%, respectively. Finally, for the 2016 flood event, they were 0.1%, 0.5%, 7.3%, 10.1%, and 82%, respectively.
The resulting future flood risk maps for the 1996, 2014, and 2016 flood events are shown in Figure 9d–f, respectively. Notably, no areas of very high risk existed in any resulting risk maps. The percentages of areas at high, moderate, low, and very low risk were found to be 0.2%, 6.3%, 75.1%, and 18.3% for the 1996 event, respectively. For the 2014 event, they were 0.1%, 2%, 6.9%, and 91%, respectively. Finally, for the 2016 flood event, they were 0.2%, 2.1%, 7.4%, and 90.4%, respectively.

5. Discussion

5.1. Hazard Mapping Using the RRI Model

Flood inundation simulations have revealed the importance of the mainstream in flood events, which is necessary to include in flood prevention plans [62]. The RRI model, which is a 2D model, was capable of simultaneously predicting the distributed runoff and flood inundation depths considering the infiltration parameters, in contrast to previous studies [19,20,21,22,28,29]. The flood inundation maps developed by the RRI model show consistency among the three events (1996, 2014, and 2016) in the areas prone to flood risk (Figure 8). Regions with high susceptibility to floods were located at the lowest parts of the city (along the coast, especially the southern part and the city center) and the areas surrounding streams, which is commonly noticed [63]. It was also noticed that the closer the locations were to a stream, the higher the susceptibility to flood hazards [11]. In all events, in the current situation and in the future, the most affected areas were located within the current urban areas (Figure 10), especially those located along the coast, which means that urban areas in extensions will be partially safe. In other words, most of the planned urban extensions existed in locations with less exposure to floods. However, planned development is increasing flood hazards for existing urban areas due to reduced permeability and increased runoff, as seen previously in coastal cities in Egypt [5]. The degree of severity of each of the three events is directly proportional to the quantity and intensity of rainfall. Urban extensions are expected to face low and moderate risks, while new projects along the coast are expected to be at high risk. To reduce such hazards in both existing and extension areas, sustainable urban stormwater management using best management practices (BMPs) and low impact development (LID) techniques can be implemented [95] along with traditional structural mitigation measures.

5.2. Vulnerability Maps

The vulnerability component that most influenced the resulting maps was found to be the physical component, since all of its indicators were found to have the highest weights in the AHP results. The concentration of physical vulnerability resulted from the existing slum areas in the city center of Hurghada (Figure 6a,d)). This result can be attributed to the characteristics of the buildings in these slums, where the buildings have 1–2 floors, mostly residential uses without any open spaces, and poor construction conditions, there is a high population density, the building materials are clay and wood, and houses are constructed in mountainous areas, making them highly vulnerable to flood hazards. Highly economically vulnerable areas were found along the coast and near the main roads routing the concentration of tourism activities. Finally, social vulnerability increases in the old part of the city to the east along the coast. The reason is the decrease in residential rent rates and the increase in the accessibility of services and activities, which increase the residential demand for such areas. The increase in residential demand and limited lands available led to urban densification.
From the total vulnerability results (Figure 11), we found that more than 83% of the city does not have sufficient resistance against flood hazards in the current situation. This value is predicted to decrease to 42.8% in the future. This decrease stems from the approved characteristics of new urban developments, which do not have the same issues as the current developments in terms of physical, social, and economic vulnerabilities. The resulting vulnerability maps are of high quality with a spatial resolution reaching 1 m × 1 m when converted from vector format, while for many studies, the output resolution has been approximately 100 m × 100 m to 300 m × 300 m at the microscale [62,63].

5.3. Risk Mapping

In all the resulting risk maps, the common areas at risk were spatially concentrated along the coast, especially in the southern part and the city center. It was also evident that the areas at risk increase along with the increase in the REPs of the flood events. Accordingly, the most hazardous event hit Hurghada in 1996 (50-year REP), followed by the 2016 event (10-year REP) and then the 2014 event (5-year REP) (Figure 12). Therefore, the most influential parameters affecting the resulting flood risk maps were mainly physical vulnerability and the hydrological hazard parameters.
Regarding the 5 and 10 year REP events, most of the city lies under moderate to low risk in the current urban area, while the risk ranges from low to very low in the extension zone. Additionally, crucial infrastructure, such as the Hurghada airport, lies under moderate risk. There is a decrease in the areas exposed to very high risk and high risk in the future situation because (1) most of the added areas in the future extension are located relatively far from hazardous urban flash flood locations towards higher elevations; and (2) there is decreasing total vulnerability (especially physical vulnerability) due to the assumption that these new extensions will not suffer from existing issues. However, there is a significant increase in the total area exposed to urban flood risk disasters, resulting in a large increase in urbanized area by approximately 21 times compared with the original built area, from 10 km2 to 212 km2. Therefore, any increase in hazard hydrological parameters in the future will further affect the existing area more than the extension areas. Experience shows that flood risk reduction must avoid single sectoral solutions. A comprehensive integrated strategy should be linked to existing urban planning practices and land management policy, combining both structural and nonstructural flood mitigation measures [96].

6. Conclusions

In this study, an integrated methodology for flood risk mapping of ungauged urban areas at the microscale was proposed. This methodology integrates CSPs and remote sensing data using the AHP approach, a 2D hydrological RRI model, and GIS techniques and was implemented in Hurghada, Egypt. This study was able to achieve the targeted aims, as the following conclusions are drawn:
  • Hazard maps were produced using remote sensing data combined with a suitable and efficient 2D hydrological RRI simulation model for flood inundation depth calculation. A model was used to simulate flash floods for three extreme events with different REPs (5, 10, and 50 years) in both current and future situations. The model was successfully calibrated and validated, although there were limited rainfall and runoff observational data. The model was capable of simultaneously predicting the distributed runoff and flood inundation depths considering infiltration parameters that enhance the quality of the hazard maps produced. The model showed that high water levels occur along the coast and the city center because they are the lowest parts of the city. With the increase in the intensity and frequency of flash flood events, the existing areas along the coast and in the city center will be at more risk than the other areas in the extension. These areas have most tourism activities, which increases the socioeconomic risks incurred by the city.
  • The vulnerability maps produced are of higher quality than those produced by previous studies based on two main aspects: (1) spatial resolution and (2) considering urban planning aspects with seven indicators at the urban microscale in ungauged regions. The vulnerability maps show that physical vulnerability has a higher impact on total vulnerability. Slums are among the areas most affected by floods in Hurghada, since these areas are highly vulnerable to destruction and loss of life. High economic vulnerability is concentrated along the coast and parts of the city center since these areas have the highest land value.
  • The urban extension is in the range of low and moderate risk, except for new projects along the coast, which are expected to be at high risk. Therefore, Hurghada’s 2027 CSP needs to be revised based on the risk maps produced, especially for the new projects along the coast.
  • The main two intervention points in Hurghada can be highlighted as follows: (1) the coastal areas, which have the most tourism activities, increasing the socioeconomic risks incurred by the city, and (2) slums areas.
The proposed methodology proved to be (1) applicable for generating vulnerability, hazard, and risk maps at the microscale, (2) a valuable tool for highlighting the risk-prone areas in regions that suffer from lack of information, (3) a supportive tool that can aid decision-making and policymakers in assessing and managing flood risk, and (4) economical, as it reduces the resource requirements because it is based on CSP data, which are freely available from urban planning agencies. In addition, it uses open remote sensing data, which provide a scientific basis for flood mapping in this data-poor region, as well as a noncommercial 2D hydrological simulation model.
This study recommends improving the AHP approach for weighting the vulnerability indicators by including statistical weighting techniques (e.g., principal component analysis (PCA) and fuzzy logic). This study also recommends that CSPs should be included in developing flood risk maps. Furthermore, these flood risk maps should be included in urban planning projects to avoid unnecessary losses and to prioritize interventions at hot spots. Additionally, flood risk maps should be validated in the future using georeferenced photos during flood events, additional remote sensing data of flooded areas, flood damage data if available, and the support of experts with diverse backgrounds. More case studies should be conducted in microscale urban areas to determine the reliability of the proposed flood risk mapping methodology. To reduce flood risk and its adverse consequences, a comprehensive integrated strategy combining urban planning, urban hydrology, and flood risk management (FRM) is essential.

Author Contributions

Conceptualization, K.I.A.; methodology, K.I.A., D.E., B.E., and S.A.K; software, K.I.A., D.E. and B.E.; validation, K.I.A. and D.E.; formal analysis, K.I.A., D.E., O.M.H., and B.E.; investigation, S.A.K.; resources, K.I.A. and O.M.H.; data curation, K.I.A., M.S., O.M.H., and B.E.; writing—original draft preparation, K.I.A.; writing—review and editing, K.I.A. and D.E.; visualization, K.I.A., D.E., B.E. and O.M.H.; supervision, M.S., S.A.K., and T.S.; project administration, S.A.K. and T.S.; All authors have read and agreed to the published version of the manuscript.

Funding

This study was funded by Kyoto University, and partial support was also provided by Egyptian High Education Ministry to K.I.A. and D.E.

Acknowledgments

The authors appreciate the General Organization of Physical Planning (GOPP), Egypt.

Conflicts of Interest

The authors declare that there are no conflict of interest.

Appendix A

Table A1. Historical records of the hazardous flash floods in Egypt [1].
Affected AreaRecorded Damages
Oct. 2019Cairo, Alexandria, meet Ghamr and new Cairo12 deaths, road damages
Apr. 2018Al ain Alshokhna, Fifth settlement “New Cairo”Road damage, damaged vehicles, 10 million EGP loss
Oct. 2016Ras Sedr, Sharm El Sheikh, Hurghada and QenaRoad damage, water pipe damage
2015Assuit, Sohag, Qena, Luxor and AswanDestroyed houses
2015Alexandria, Al-bhera and Matrouh Governorates35 deaths, 180 destroyed houses, dozens injured, thousands of acres drowned
Feb., Oct. 2015North and south of Sinai, Red Sea regionRoad damages, the loading and unloading area of Hurghada International Airport drowned
Mar., May 2014Taba, Sohag, Aswan, Kom OmboDam failure at Sohag, road damages
2013South Sanai & Sohag and Assuit2 deaths, road damage, 750 million EGP loss
2012W. Dahab, Catherine areaDam failure, destroyed houses
Jan. 2010Aswan, Sinai, and Al Arish8 deaths, 1381 damaged houses, roads, and infrastructure
2009Along the Red Sea coast, Aswan, Sinai12 deaths, damaged houses & roads and 37 injuries
Oct. 2004W. WatierRoad damage
May 1997Safaga, El-Qusier200 deaths, destroyed roads, demolished houses and damaged vehicles
Nov. 1996Hurghada, Marsa Alam
Sep. Nov. 1994Dhab, Sohage, Qena, Safaga, El-Qusier, Hurghada
Mar. Aug. 1991Marsa Alam, W. Aawag3200 destroyed houses
Oct. 1990W. El-Gemal, Marsa Alam
Jan. 1988W. Sudr5 deaths
Oct. 1987South Sanai1 death, road damage, 27 injuries
1985Qena Governorate32 deaths, dam failure
Feb. 1982South GizaDemolished 180 houses
Apr. 1981Aswan GovernorateRoad damage and demolished houses
Feb., Nov., and Dec. 1980Aswan Governorate, W. Elarish, Qena And SohagRoad damage, demolished houses and farms
May, Oct. 1979Aswan, Kom Ombo, Idfu, Assiut, Marsa Alam, El-Qusier5619 deaths, demolished houses
1975Minia, Assuit and SohagDrowning of 10 villages, 180 houses destroyed, and 1500 citizens displaced
Feb. 1975W. El-Arish17 deaths, road problems and 200 houses destroyed
1972GizaDestroyed houses, roads, and farms
1954Qena GovernorateDestroyed 500 houses
1947W. Al ArishDemolished houses, destroyed roads and dam failure
Table A2. Pairwise comparisons [91].
Description1234567
Land UseBuilding HeightBuilding ConditionBuilding MaterialsLand ValueTotal Pop.Pop. Density
land use1.000.500.200.143.004.002.00
building height2.001.000.330.204.007.002.00
building condition5.003.001.000.257.009.004.00
building materials7.005.004.001.007.009.007.00
land value0.330.250.140.141.003.000.50
total pop.0.250.140.110.110.331.000.33
pop. density0.500.500.250.142.003.001.00
Sum16.0810.396.041.9924.3336.0016.83

References

  1. Abdel-Fattah, M.; Kantoush, S.; Sumi, T. Integrated Management of Flash Flood in Wadi System of Egypt: Disaster Prevention and Water Harvesting; Disaster Prevention Research Institute Kyoto University: Kyoto, Japan, 2015. [Google Scholar]
  2. Proag, V. The concept of vulnerability and resilience. Procedia Econ. Financ. 2014, 18, 369–376. [Google Scholar] [CrossRef] [Green Version]
  3. Mohamed, S.A.; El-Raey, M.E. Vulnerability assessment for flash floods using GIS spatial modeling and remotely sensed data in El-Arish City, North Sinai, Egypt. Nat. Hazards 2019, 1–22. [Google Scholar] [CrossRef]
  4. Almalah, F. Report on the Arab Region Consultations on the Post-2015 Framework for Disaster Risk Reduction. In Proceedings of the 2nd Arab Conference on Disaster Risk Reduction, Sharm El Sheikh, Egypt, 14–16 September 2014. [Google Scholar]
  5. Saber, M.; Abdrabo, K.I.; Habiba, O.M.; Kantosh, S.A.; Sumi, T. Impacts of triple factors on flash flood vulnerability in Egypt: Urban growth, extreme climate, and mismanagement. Geosciences 2020, 10, 24. [Google Scholar] [CrossRef] [Green Version]
  6. Amundrud, Ø.; Aven, T. On how to understand and acknowledge risk. Reliab. Eng. Syst. Saf. 2015, 142, 42–47. [Google Scholar] [CrossRef] [Green Version]
  7. Psomiadis, E.; Dercas, N.; Dalezios, N.R.; Spyropoulos, N.V. The role of spatial and spectral resolution on the effectiveness of satellite-based vegetation indices. In Proceedings of the Remote Sensing for Agriculture, Ecosystems, and Hydrology XVIII, Edinburgh, UK, 26–29 September 2016. [Google Scholar]
  8. Fleischhauer, M. The role of spatial planning in strengthening urban resilience. In Resilience of Cities to Terrorist and other Threats; Springer: Berlin, Germany, 2008; pp. 273–298. [Google Scholar]
  9. Wamsler, C. Cities, Disaster Risk and Adaptation; Routledge: Abingdon, UK, 2014. [Google Scholar]
  10. Cools, J.; Vanderkimpen, P.; El Afandi, G.; Abdelkhalek, A.; Fockedey, S.; El Sammany, M.; Abdallah, G.; El Bihery, M.; Bauwens, W.; Huygens, M. An early warning system for flash floods in hyper-arid Egypt. Nat. Hazards Earth Syst. Sci. 2012, 12, 443–457. [Google Scholar] [CrossRef]
  11. Dewan, A. Floods in a Megacity: Geospatial Techniques in Assessing Hazards, Risk and Vulnerability; Springer: Berlin, Germany, 2013. [Google Scholar]
  12. Papaioannou, G.; Loukas, A.; Vasiliades, L.; Aronica, G. Flood inundation mapping sensitivity to riverine spatial resolution and modelling approach. Nat. Hazards 2016, 83, 117–132. [Google Scholar] [CrossRef]
  13. Aronica, G.; Bates, P.; Horritt, M. Assessing the uncertainty in distributed model predictions using observed binary pattern information within GLUE. Hydrol. Process. 2002, 16, 2001–2016. [Google Scholar] [CrossRef]
  14. Horritt, M.; Di Baldassarre, G.; Bates, P.; Brath, A. Comparing the performance of a 2-D finite element and a 2-D finite volume model of floodplain inundation using airborne SAR imagery. Hydrol. Process. Int. J. 2007, 21, 2745–2759. [Google Scholar] [CrossRef]
  15. Costabile, P.; Macchione, F. Enhancing river model set-up for 2-D dynamic flood modelling. Environ. Model. Softw. 2015, 67, 89–107. [Google Scholar] [CrossRef]
  16. Papaioannou, G.; Efstratiadis, A.; Vasiliades, L.; Loukas, A.; Papalexiou, S.M.; Koukouvinos, A.; Tsoukalas, I.; Kossieris, P. An operational method for flood directive implementation in ungauged urban areas. Hydrology 2018, 5, 24. [Google Scholar] [CrossRef] [Green Version]
  17. Bates, P.D.; Wilson, M.D.; Horritt, M.S.; Mason, D.C.; Holden, N.; Currie, A. Reach scale floodplain inundation dynamics observed using airborne synthetic aperture radar imagery: Data analysis and modelling. J. Hydrol. 2006, 328, 306–318. [Google Scholar] [CrossRef]
  18. Aggett, G.; Wilson, J. Creating and coupling a high-resolution DTM with a 1-D hydraulic model in a GIS for scenario-based assessment of avulsion hazard in a gravel-bed river. Geomorphology 2009, 113, 21–34. [Google Scholar] [CrossRef]
  19. Deckers, P.; Kellens, W.; Reyns, J.; Vanneuville, W.; De Maeyer, P. A GIS for flood risk management in Flanders. In Geospatial Techniques in Urban Hazard and Disaster Analysis; Showalter, P., Lu, Y., Eds.; Springer: Dordrecht, The Netherlands, 2009; pp. 51–69. [Google Scholar]
  20. Tate, E.; Muñoz, C.; Suchan, J. Uncertainty and sensitivity analysis of the HAZUS-MH flood model. Nat. Hazards Rev. 2015, 16, 04014030. [Google Scholar] [CrossRef]
  21. Koks, E.; De Moel, H.; Koomen, E. Comparing extreme rainfall and large-scale flooding induced inundation risk–evidence from a Dutch case-study. Stud. Water Manag. Issues 2012, 26, 3–26. [Google Scholar] [CrossRef] [Green Version]
  22. Apel, H.; Aronica, G.; Kreibich, H.; Thieken, A. Flood risk analyses—how detailed do we need to be? Nat. Hazards 2009, 49, 79–98. [Google Scholar] [CrossRef]
  23. Radwan, F.; Alazba, A.; Mossad, A. Flood risk assessment and mapping using AHP in arid and semiarid regions. Acta Geophys. 2019, 67, 215–229. [Google Scholar] [CrossRef]
  24. Bajabaa, S.; Masoud, M.; Al-Amri, N. Flash flood hazard mapping based on quantitative hydrology, geomorphology and GIS techniques (case study of Wadi Al Lith, Saudi Arabia). Arab. J. Geosci. 2014, 7, 2469–2481. [Google Scholar] [CrossRef]
  25. Kussul, N.; Shelestov, A.; Skakun, S. Flood monitoring from SAR data. In Use of Satellite and In-Situ Data to Improve Sustainability; Springer: Dordrecht, The Netherlands, 2011; pp. 19–29. [Google Scholar]
  26. Klemas, V. Remote sensing of floods and flood-prone areas: An overview. J. Coast. Res. 2015, 31, 1005–1013. [Google Scholar] [CrossRef]
  27. Psomiadis, E. Flash flood area mapping utilising SENTINEL-1 radar data. In Proceedings of the Earth Resources and Environmental Remote Sensing/GIS Applications VII, Edinburgh, UK, 27–29 September 2016; International Society for Optics and Photonics: Bellingham, WA, USA, 2016; p. 100051G. [Google Scholar]
  28. Sarhadi, A.; Soltani, S.; Modarres, R. Probabilistic flood inundation mapping of ungauged rivers: Linking GIS techniques and frequency analysis. J. Hydrol. 2012, 458, 68–86. [Google Scholar] [CrossRef]
  29. Domeneghetti, A.; Vorogushyn, S.; Castellarin, A.; Merz, B.; Brath, A. Probabilistic flood hazard mapping: Effects of uncertain boundary conditions. Hydrol. Earth Syst. Sci. 2013, 17, 3127–3140. [Google Scholar] [CrossRef] [Green Version]
  30. Sayama, T.; Ozawa, G.; Kawakami, T.; Nabesaka, S.; Fukami, K. Rainfall–runoff–inundation analysis of the 2010 Pakistan flood in the Kabul River basin. Hydrol. Sci. J. 2012, 57, 298–312. [Google Scholar] [CrossRef]
  31. Taylor, J.R.; Lovell, S.T. Mapping public and private spaces of urban agriculture in Chicago through the analysis of high-resolution aerial images in Google Earth. Landsc. Urban Plan. 2012, 108, 57–70. [Google Scholar] [CrossRef]
  32. Nastiti, K.D.; Kim, Y.; Jung, K.; An, H. The application of rainfall-runoff-inundation (RRI) model for inundation case in upper Citarum watershed, West Java-Indonesia. Procedia Eng. 2015, 125, 166–172. [Google Scholar] [CrossRef] [Green Version]
  33. Bhagabati, S.S.; Kawasaki, A. Consideration of the rainfall-runoff-inundation (RRI) model for flood mapping in a deltaic area of Myanmar. Hydrol. Res. Lett. 2017, 11, 155–160. [Google Scholar] [CrossRef] [Green Version]
  34. Abdel-Fattah, M.; Kantoush, S.; Saber, M.; Sumi, T. Hydrological Modelling of Flash Flood at Wadi Samail, Oman; Disaster Prevention Research Institute, Kyoto University: Kyoto, Japan, 2016. [Google Scholar]
  35. Glas, H.; Deruyter, G.; De Maeyer, P.; Mandal, A.; James-Williamson, S. Analyzing the sensitivity of a flood risk assessment model towards its input data. Nat. Hazards Earth Syst. Sci. 2016, 16, 2529–2542. [Google Scholar] [CrossRef] [Green Version]
  36. Nasiri, H.; Shahmohammadi-Kalalagh, S. Flood vulnerability index as a knowledge base for flood risk assessment in urban area. J. Nov. Appl. Sci. 2013, 2, 269–272. [Google Scholar]
  37. Fernandez, P.; Mourato, S.; Moreira, M.; Pereira, L. A new approach for computing a flood vulnerability index using cluster analysis. Phys. Chem. Earth Parts A/B/C 2016, 94, 47–55. [Google Scholar] [CrossRef]
  38. Mahmoud, S.H.; Gan, T.Y. Multi-criteria approach to develop flood susceptibility maps in arid regions of Middle East. J. Clean. Prod. 2018, 196, 216–229. [Google Scholar] [CrossRef]
  39. Meyer, V.; Scheuer, S.; Haase, D. A multicriteria approach for flood risk mapping exemplified at the Mulde river, Germany. Nat. Hazards 2009, 48, 17–39. [Google Scholar] [CrossRef]
  40. Sinha, R.; Bapalu, G.; Singh, L.; Rath, B. Flood risk analysis in the Kosi river basin, north Bihar using multi-parametric approach of analytical hierarchy process (AHP). J. Indian Soc. Remote Sens. 2008, 36, 335–349. [Google Scholar] [CrossRef]
  41. Meyer, V.; Haase, D.; Scheuer, S. A multicriteria flood risk assessment and mapping approach. Flood Risk Manag. Res. Pract. 2009, 4, 1687–1694. [Google Scholar] [CrossRef]
  42. Ouma, Y.O.; Tateishi, R. Urban flood vulnerability and risk mapping using integrated multi-parametric AHP and GIS: Methodological overview and case study assessment. Water 2014, 6, 1515–1545. [Google Scholar] [CrossRef]
  43. Wang, Y.; Li, Z.; Tang, Z.; Zeng, G. A GIS-based spatial multi-criteria approach for flood risk assessment in the Dongting Lake Region, Hunan, Central China. Water Resour. Manag. 2011, 25, 3465–3484. [Google Scholar] [CrossRef]
  44. El-Rakaiby, M. Drainage basins and flash flood hazard in selected parts of Egypt. Egypt J. Geol. 1989, 33, 309–323. [Google Scholar]
  45. El Shamy, I.Z. Recent recharge and flash flooding opportunities in the Eastern Desert, Egypt; Possibilités de recharge de nappes et de crues subites dans le Désert Oriental, Egypte. Ann. Geol. Surv. Egypt 1992, 18, 323–334. [Google Scholar]
  46. Elzawahry, A.; Elgamal, M.; Imam, Y.; Alrahbi, H.; Elshikaly, S. Flash floods-roads interaction: Experience from the Arab region. In Proceedings of the 3rd Gulf Conference on Roads (TGCR06), Muscat, Sultanate of Oman, 6–8 March 2006; pp. 6–8. [Google Scholar]
  47. Youssef, A.; Pradhan, B.; Gaber, A.; Buchroithner, M. Geomorphological hazard analysis along the Egyptian Red Sea coast between Safaga and Quseir. Nat. Hazards Earth Syst. Sci. 2009, 9, 751–766. [Google Scholar] [CrossRef]
  48. El-Magd, I.A.; Hermas, E.; El Bastawesy, M. GIS-modelling of the spatial variability of flash flood hazard in Abu Dabbab catchment, Red Sea Region, Egypt. Egypt. J. Remote Sens. Space Sci. 2010, 13, 81–88. [Google Scholar] [CrossRef] [Green Version]
  49. Moawad, M.B.; Abdel Aziz, A.O.; Mamtimin, B. Flash floods in the Sahara: A case study for the 28 January 2013 flood in Qena, Egypt. Geomat. Nat. Hazards Risk 2016, 7, 215–236. [Google Scholar] [CrossRef] [Green Version]
  50. Elnazer, A.A.; Salman, S.A.; Asmoay, A.S. Flash flood hazard affected Ras Gharib city, Red Sea, Egypt: A proposed flash flood channel. Nat. Hazards 2017, 89, 1389–1400. [Google Scholar] [CrossRef]
  51. Ezz, H. The Utilization of GIS in Revealing the Reasons behind Flooding Ras Gharib City, Egypt. Int. J. Eng. Res. Afr. 2017, 31, 135–142. [Google Scholar] [CrossRef]
  52. Monsef, H.A.E. A mitigation strategy for reducing flood risk to highways in arid regions: A case study of the El-Quseir–Qena highway in Egypt. J. Flood Risk Manag. 2018, 11, S158–S172. [Google Scholar] [CrossRef]
  53. Elboshy, B.; Kanae, S.; Gamaleldin, M.; Ayad, H.; Osaragi, T.; Elbarki, W. A framework for pluvial flood risk assessment in Alexandria considering the coping capacity. Environ. Syst. Decis. 2019, 39, 77–94. [Google Scholar] [CrossRef]
  54. Mohamed, S.A. Application of satellite image processing and GIS-Spatial modeling for mapping urban areas prone to flash floods in Qena governorate, Egypt. J. Afr. Earth Sci. 2019, 158, 103507. [Google Scholar] [CrossRef]
  55. Abuzied, S.; Yuan, M.; Ibrahim, S.; Kaiser, M.; Saleem, T. Geospatial risk assessment of flash floods in Nuweiba area, Egypt. J. Arid Environ. 2016, 133, 54–72. [Google Scholar] [CrossRef]
  56. De Brito, M.M.; Evers, M.; Höllermann, B. Prioritization of flood vulnerability, coping capacity and exposure indicators through the Delphi technique: A case study in Taquari-Antas basin, Brazil. Int. J. Disaster Risk Reduct. 2017, 24, 119–128. [Google Scholar] [CrossRef]
  57. Percival, S.; Teeuw, R. A methodology for urban micro-scale coastal flood vulnerability and risk assessment and mapping. Nat. Hazards 2019, 97, 355–377. [Google Scholar] [CrossRef] [Green Version]
  58. Eckert, S.; Jelinek, R.; Zeug, G.; Krausmann, E. Remote sensing-based assessment of tsunami vulnerability and risk in Alexandria, Egypt. Appl. Geogr. 2012, 32, 714–723. [Google Scholar] [CrossRef]
  59. Youssef, A.; Abdel Moneim, A.; Abu El-Maged, S. Flood hazard assessment and its associated problems using geographic information systems. In Proceedings of the Fourth International Conference on the Geology of Africa, Assiut, Egypt, 15–16 November 2005; pp. 1–17. [Google Scholar]
  60. Saidi, S.; Ghattassi, A.; Anselme, B.; Bouri, S. GIS based multi-criteria analysis for flood risk assessment: Case of manouba essijoumi basin, NE Tunisia. In Advances in Remote Sensing and Geo Informatics Applications; CAJG 2018; El-Askary, H., Lee, S., Heggy, E., Pradhan, B., Eds.; Advances in Science, Technology & Innovation (IEREK Interdisciplinary Series for Sustainable Development); Springer: Cham, Switzerland, 2019; pp. 273–279. [Google Scholar]
  61. Balica, S. Approaches of understanding developments of vulnerability indices for natural disasters. Environ. Eng. Manag. J. 2012, 11, 963–974. [Google Scholar] [CrossRef]
  62. Park, K.; Lee, M.-H. The Development and Application of the Urban Flood Risk Assessment Model for Reflecting upon Urban Planning Elements. Water 2019, 11, 920. [Google Scholar] [CrossRef] [Green Version]
  63. Glas, H.; Rocabado, I.; Huysentruyt, S.; Maroy, E.; Salazar Cortez, D.; Coorevits, K.; De Maeyer, P.; Deruyter, G. Flood risk mapping worldwide: A flexible methodology and toolbox. Water 2019, 11, 2371. [Google Scholar] [CrossRef] [Green Version]
  64. Mustafa, A.; Bruwier, M.; Archambeau, P.; Erpicum, S.; Pirotton, M.; Dewals, B.; Teller, J. Effects of spatial planning on future flood risks in urban environments. J. Environ. Manag. 2018, 225, 193–204. [Google Scholar] [CrossRef] [PubMed]
  65. Greiving, S. Integrated risk assessment of multi-hazards: A new methodology. Spec. Pap. -Geol. Surv. Finl. 2006, 42, 75. [Google Scholar]
  66. Greiving, S.; Fleischhauer, M.; Wanczura, S. Management of natural hazards in Europe: The role of spatial planning in selected EU member states. J. Environ. Plan. Manag. 2006, 49, 739–757. [Google Scholar] [CrossRef]
  67. Grimaldi, S.; Petroselli, A.; Arcangeletti, E.; Nardi, F. Flood mapping in ungauged basins using fully continuous hydrologic–hydraulic modeling. J. Hydrol. 2013, 487, 39–47. [Google Scholar] [CrossRef]
  68. Khan, S.I.; Hong, Y.; Wang, J.; Yilmaz, K.K.; Gourley, J.J.; Adler, R.F.; Brakenridge, G.R.; Policelli, F.; Habib, S.; Irwin, D. Satellite remote sensing and hydrologic modeling for flood inundation mapping in Lake Victoria basin: Implications for hydrologic prediction in ungauged basins. IEEE Trans. Geosci. Remote Sens. 2010, 49, 85–95. [Google Scholar] [CrossRef] [Green Version]
  69. Li, W.; Lin, K.; Zhao, T.; Lan, T.; Chen, X.; Du, H.; Chen, H. Risk assessment and sensitivity analysis of flash floods in ungauged basins using coupled hydrologic and hydrodynamic models. J. Hydrol. 2019, 572, 108–120. [Google Scholar] [CrossRef]
  70. Jafarzadegan, K.; Merwade, V. A DEM-based approach for large-scale floodplain mapping in ungauged watersheds. J. Hydrol. 2017, 550, 650–662. [Google Scholar] [CrossRef]
  71. Tsanis, I.; Seiradakis, K.; Daliakopoulos, I.; Grillakis, M.; Koutroulis, A. Assessment of GeoEye-1 stereo-pair-generated DEM in flood mapping of an ungauged basin. J. Hydroinform. 2014, 16, 1–18. [Google Scholar] [CrossRef]
  72. Samela, C.; Manfreda, S.; Paola, F.D.; Giugni, M.; Sole, A.; Fiorentino, M. DEM-based approaches for the delineation of flood-prone areas in an ungauged basin in Africa. J. Hydrol. Eng. 2016, 21, 06015010. [Google Scholar] [CrossRef]
  73. Mashaly, J.; Ghoneim, E. Flash flood hazard using optical, radar, and stereo-pair derived dem: Eastern desert, Egypt. Remote Sens. 2018, 10, 1204. [Google Scholar] [CrossRef] [Green Version]
  74. Büchele, B.; Kreibich, H.; Kron, A.; Thieken, A.; Ihringer, J.; Oberle, P.; Merz, B.; Nestmann, F. Flood-risk mapping: Contributions towards an enhanced assessment of extreme events and associated risks. Nat. Hazards Earth Syst. Sci. 2006, 6, 485–503. [Google Scholar] [CrossRef]
  75. Kappes, M.S.; Papathoma-Koehle, M.; Keiler, M. Assessing physical vulnerability for multi-hazards using an indicator-based methodology. Appl. Geogr. 2012, 32, 577–590. [Google Scholar] [CrossRef]
  76. Stephenson, V.; D’ayala, D. A new approach to flood vulnerability assessment for historic buildings in England. Nat. Hazards Earth Syst. Sci. 2014, 14, 1035. [Google Scholar] [CrossRef] [Green Version]
  77. Papathoma-Köhle, M.; Gems, B.; Sturm, M.; Fuchs, S. Matrices, curves and indicators: A review of approaches to assess physical vulnerability to debris flows. Earth-Sci. Rev. 2017, 171, 272–288. [Google Scholar] [CrossRef]
  78. Ruiter, M.C.d.; Ward, P.J.; Daniell, J.E.; Aerts, J.C. A comparison of flood and earthquake vulnerability assessment indicators. Nat. Hazards Earth Syst. Sci. 2017, 17, 1231–1251. [Google Scholar] [CrossRef] [Green Version]
  79. General Organization for Physical Planning (GOPP), General Strategic Plan of 2027 for Proposed Future Urbanization Area for the City of Hurghada, Red Sea; General Organization for Physical Planning (GOPP): Cairo, Egypt, 2013.
  80. Gado, T.A. Statistical characteristics of extreme rainfall events in Egypt. In Proceedings of the Twentieth International Water Technology Conference, IWTC20, Hurghada, Egypt, 18–20 May 2017; pp. 18–20. [Google Scholar]
  81. Moustafa, M. The People of Hurghada Complain about Electricity, Water cutout and Inundated Streets due to Floods. Available online: https://www.youm7.com/story/2016/10/28/ (accessed on 20 April 2020).
  82. The People of Hurghada Distress the Officials after the Floods. Available online: https://www.alnaharegypt.com/191578 (accessed on 6 July 2020).
  83. Adeel, M. Methodology for identifying urban growth potential using land use and population data: A case study of Islamabad Zone IV. Procedia Environ. Sci. 2010, 2, 32–41. [Google Scholar] [CrossRef] [Green Version]
  84. Adelekan, I.O. Vulnerability of poor urban coastal communities to flooding in Lagos, Nigeria. Environ. Urban. 2010, 22, 433–450. [Google Scholar] [CrossRef] [Green Version]
  85. Devi, N.N.; Sridharan, B.; Kuiry, S.N. Impact of urban sprawl on future flooding in Chennai city, India. J. Hydrol. 2019, 574, 486–496. [Google Scholar] [CrossRef]
  86. Available online: https://chrsdata.eng.uci.edu/ (accessed on 12 March 2020).
  87. Eldeberky, Y.; Hünicke, B. Vulnerability of the Nile delta to recent and future climate change. In Proceedings of the E-proceedings of the 36th IAHR World Congress, The Hague, The Netherlands, 28 June–3 July 2015. [Google Scholar]
  88. Facility, A.S. The Digital Elevation Model (DEM), ALOS-PALSAR DEM. Available online: https://search.asf.alaska.edu/#/?dataset=ALOS (accessed on 8 May 2020).
  89. Frazier, T.G.; Thompson, C.M.; Dezzani, R.J. A framework for the development of the SERV model: A Spatially Explicit Resilience-Vulnerability model. Appl. Geogr. 2014, 51, 158–172. [Google Scholar] [CrossRef]
  90. Aroca-Jimenez, E.; Bodoque, J.M.; Garcia, J.A.; Diez-Herrero, A. Construction of an integrated social vulnerability index in urban areas prone to flash flooding. Nat. Hazards Earth Syst. Sci. 2017, 17, 1541–1557. [Google Scholar] [CrossRef] [Green Version]
  91. Saaty, T.L. What is the analytic hierarchy process. In Mathematical Models for Decision Support; Springer: Heidelberg/Berlin, Germany, 1988; pp. 109–121. [Google Scholar]
  92. Proctor, W. Towards sustainable forest management an application of multi-criteria analysis to Australian forest policy. In Proceedings of the Third International Conference of the European Society for Ecological Economics, Vienna, Austria, 3–6 May 2000. [Google Scholar]
  93. Saaty, T.L. Fundamentals of Decision Making and Priority Theory with the Analytic Hierarchy Process; RWS Publications: Pittsburgh, PA, USA, 2000. [Google Scholar]
  94. Kron, W. Flood risk= hazard• values• vulnerability. Water Int. 2005, 30, 58–68. [Google Scholar] [CrossRef]
  95. Pour, S.H.; Abd Wahab, A.K.; Asaduzzaman Shahid, S.; Dewan, A. Low impact development techniques to mitigate the impacts of climate-change-induced urban floods: Current trends, issues and challenges. Sustain. Cities Soc. 2020, 62, 102373. [Google Scholar] [CrossRef]
  96. Jha, A.K.; Bloch, R.; Lamond, J. Cities and Flooding: A Guide to Integrated Urban Flood Risk Management for the 21st Century; The World Bank: Washington, DC, USA, 2012. [Google Scholar]
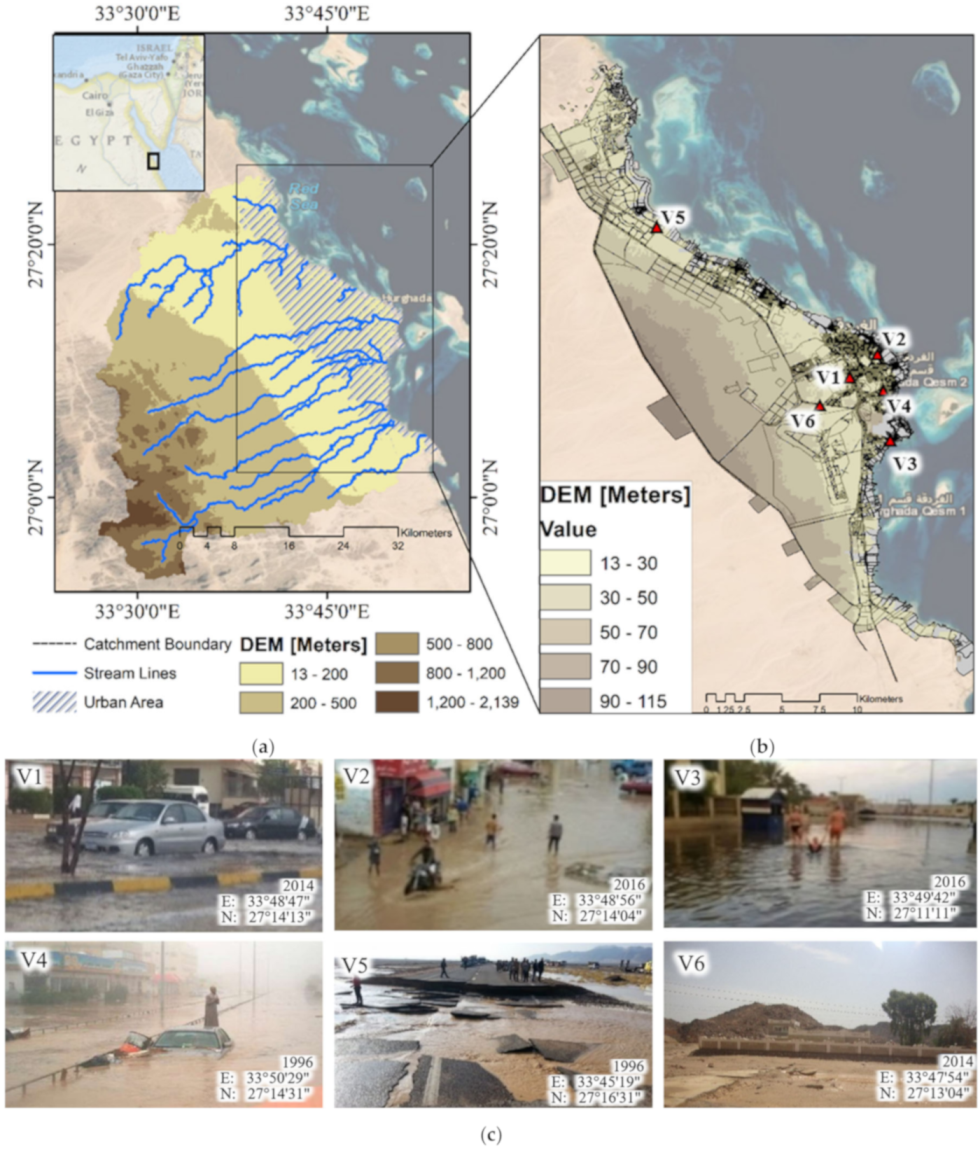
Figure 1. The study area of (a) the Hurghada catchment area, (b) Hurghada with georeferenced photo locations, and (c) the georeferenced photos showing the destructive effects of flood events [81,82].
Remotesensing 12 03548 g001
Figure 2. (a) Population growth and (b) urban expansion in Hurghada between 1996 and 2027.
Remotesensing 12 03548 g002
Figure 3. Flowchart for data processing and methods.
Remotesensing 12 03548 g003
Figure 4. Current land cover (a) and future land cover (b) (2027) of Hurghada.
Remotesensing 12 03548 g004
Figure 5. Selected vulnerability indicators from the city strategic plan (CSP) data sets (current). (A) Land Use. (B) Building Height. (C) Building Conditions. (D) Building Materials. (E) Land Value. (F) Population Density. (G) Total Population.
Remotesensing 12 03548 g005
Figure 6. Flood inundation maps (RRI model) for Hurghada for the current situation (ac) and the future situation for the 2027 CSP (df) for the events in 1996, 2014 and 2016, respectively.
Remotesensing 12 03548 g006
Figure 7. Physical, social, and economic vulnerability in the current situation (ac) and in the future (2027) (df), respectively.
Remotesensing 12 03548 g007
Figure 8. (a) Current total vulnerability and (b) future total vulnerability in 2027.
Remotesensing 12 03548 g008
Figure 9. Flood risk maps for Hurghada for the events in 1996 (50-year REP) (a), 2014 (5-year REP) (b), and 2016 (10-year REP) (c) for the current situation and (df) for the future situation in the 2027 CSP, respectively.
Remotesensing 12 03548 g009
Figure 10. Flood inundation percentages for the current and future (2027) situations for the events in 1996, 2014, and 2016.
Remotesensing 12 03548 g010
Figure 11. Current and future total vulnerability in Hurghada.
Remotesensing 12 03548 g011
Figure 12. Current and future total risk in Hurghada.
Remotesensing 12 03548 g012
Table 1. Historical records of devasting urban flash floods in Hurghada, Egypt [1].
DATEAFFECTED AREARECORDED DAMAGESRAINFALL (MM/EVENT)RETURN PERIOD
15–16 October 2019Hurghada, Ras GharibRoad damage6.81 year
27–28 October 2016Ras Sedr, Sharm El Sheikh, Hurghada and QenaRoad damage, water pipe damage, demolished houses, damaged vehicles47.910 years
9–10 March 2014HurghadaRoad and water pipe damage37.85 years
16–18 November 1996Hurghada, Marsa Alam200 deaths, damaged roads, houses, and vehicles11050 years
Table 2. Material descriptions.
Data TypeDateFormatData SourceDerived Data
Census and demographic data2017ASCII, JPEG[83]Total Population, Population Density, Administrative Boundaries
ASTER-ALSO-PALSAR
(12.5 m spatial resolution)
2020Geotiff[84]Topographic and Hydrological Parameters
Rainfall (scale 0.04° × 0.04°) (hourly based)2020PERSIANN-CCS[85]Rainfall Distribution during the 2014 and 2016 Events
Rainfall (scale 0.25° × 0.25°) (daily based) PERSIANN-CDR[86]Rainfall Distribution during the 1994 Event
Sentinel (2A) (30 m resolution)2019Geotiff[87]Land Cover Types
Photos during the event2016 2014JPEG[81]Images Needed for Model Calibration and Validation
Current urban database of the city and the approved 2027 plan for Hurghada2013Geospatial database, JPEG, PDF[79]Land Use, Building Height, Building Conditions, Building Materials, Land Value, Total Population and Population Density
Table 3. Resulting parameters from the calibration process.
ParameterRangeDesertUrban
River Roughness Coefficient0.015–0.040.022
Hillslope Roughness Coefficient0.15–10.30.2
Soil Depth0.1–211
Soil Porosity0.05–0.60.30.1
Vertical Sat. Hydraulic Conductivity6.54 × 10−5–1.67 × 10−74 × 10−60
Suction at the Vertical Wetting Front0.0495–0.31630.31630
Lateral Sat. Hydraulic Conductivity0.01–0.300
Unsaturation Eff. Porosity0.02–0.40.10
Table 4. Scoring criteria for the vulnerability indicators.
IndicatorsVulnerability Score Criteria
Low (Score = 1)Moderate (Score = 2)High (Score = 3)
Number of floors<3 floors2–3 floorsone floor
Land useOpen areas and agricultureResidential, commercial
and services
Industry, tourism, and storage
Building materialsConcrete, metalClayWood
Population densityLess than 2000 persons/km22000–2300
persons/km2
More than 2500 persons/km2
Total populationLess than 25,000 inhabitantsFrom 25,000–50,000 inhabitantsMore than 50,000 inhabitants
Building conditionsExcellentGoodPoor
Land valueLowMediumHigh
Table 5. Pairwise comparison importance scale [91].
ScaleDescriptionReciprocals *
1Elements i and j have equal importance1
3Element i is slightly more important than element j1/3
5Element i is more important than element j1/5
7Element i is much more important than element j1/7
9Element i is very much more important than element j1/9
* Reciprocals are used if element i has a lower value than element j.
Table 6. RI (random index) based on the order of the PCM (pairwise comparison matrices) [93].
No. of Indicators12345678910
RI000.580.91.121.241.321.411.451.49
Publisher’s Note: MDPI stays neutral with regard to jurisdictional claims in published maps and institutional affiliations.