Abstract
A multilayer module is incorporated into the Signals of Opportunity (SoOp) Coherent Bistatic Scattering model (SCoBi) for determining the reflections and propagation of electric fields within a series of multilayer dielectric slabs. This module can be used in conjunction with other SCoBi components to simulate complex, bistatic simulation schemes that include features such as surface roughness, vegetation, antenna effects, and multilayer soil moisture interactions on reflected signals. This paper introduces the physics underlying the multilayer module and utilizes it to perform a simulation study of the response of SoOp-R measurements with respect to subsurface soil moisture parameters. For a frequency range of 100–2400 MHz, it is seen that the SoOp-R response to a single dielectric slab is mostly frequency insensitive; however, the SoOp-R response to multilayer dielectric slabs will vary between frequencies. The relationship between SoOp-R reflectivity and the contributing depth is visualized, and the results show that SoOp-R measurements can display sensitivity to soil moisture below the penetration depth. By simulation of simple soil moisture profiles with different wetting and drying gradients, the dielectric contrast between layers is shown to be the greatest contributing factor to subsurface soil moisture sensitivity. Overall, it is observed that different frequencies can sense different areas of a soil moisture profile, and this behavior can enable subsurface soil moisture data products from SoOp-R observations.
Keywords:
signals of opportunity (SoOp); reflectometry; coherent; bistatic; vegetation; multilayer; radar 1. Introduction
Recent investments into Global Navigation Satellite System (GNSS) reflectometry (GNSS-R) GNSS-R for ocean applications have vitalized research into signals of opportunity (SoOp) reflectometry (SoOp-R) for land-based remote sensing areas. The authors of [1,2,3] showed that GNSS signals can be used to monitor ocean surface roughness and wind vectors from spaceborne SoOp-R measurements. This success has inspired research in the use of the Cyclone GNSS (CYGNSS) GNSS-R constellation for geophysical remote sensing [4,5,6] and the future SoOp P-Band Investigation (SNOOPI) satellite, which is a technology validation mission of P-band reflectometry using SoOp-R to enable spaceborne remote sensing of root-zone soil moisture (RZSM) and snow water equivalent (SWE) [7]. These SoOp-R experiments inspire a need for modeling tools that provide insight into the interaction between SoOp-R and geophysical parameters.
In recent years, there has been significant development in the use of SoOp sources within the 100–2400 MHz range. Specifically, popular frequencies and sources include Orbcomm’s private communication satellite system at I-band (137 MHz), the United States Navy’s Mobile User Objective System at P-band (240–270 MHz and 360–380 MHz), GNSS systems (≈1575.42 MHz), and the XM satellite radio system at S-band (≈2338 MHz). Recent technology demonstrations and remote sensing experiments have successfully leveraged these signals to detect geophysicals parameters such as soil moisture (SM) and SWE [7,8,9,10,11,12,13].
It is common throughout the literature to cite the penetration depth of signals below L-band as a motivating factor for the use of very high frequency (VHF) and ultra high frequency (UHF) sources as tools for RZSM remote sensing [14]. For both radar and SoOp-R, the compounding effects of propagation, reflection, and SM profile structure will produce a single microwave remote sensing observable which describes all of these non-negligible components. Relating this profile-encompassing measurement to SM values within the root-zone is, therefore, a truly difficult task without proper intuition of the mechanisms which govern the SoOp interaction within the profile. For this reason, robust modeling of these interactions is required.
The SoOp Coherent Bistatic model (SCoBi) [15] is a robust framework which allows for the modeling of many SoOp system variables and scattering surface parameters. It is a publicly available model which has been designed to be highly configurable to allow for additional modeling features [16]. Of particular interest to the area of RZSM remote sensing using SoOp-R is the multilayer module which allows for the modeling of arbitrary SM profiles. This module has been used in previous research for investigating the SoOp-R response to RZSM [12], but its underlying physics and methodology has not been introduced in the literature.
This paper serves as a simulation study which investigates the SoOp-R response to RZSM as well as introduces SCoBi’s multilayer module. The primary focus of the simulation is to understand the interactions into the subsurface reflection processes which enable RZSM retrieval. To this end, we observe the response of the SCoBi model to a single dielectric slab, variable configurations of two dielectric slabs, and simple polynomial-based SM profile configurations. The governing principles of the SCoBi model’s multilayer module are defined. Additionally, we discuss the integration of this module within the publicly available SCoBi model and simulator (M&S) package and briefly describe the package’s methods that are available for interested users to carry out their own simulation studies.
This paper is divided as follows. Section 2 provides a generalized description of the multilayer module and its capability to model RZSM profiles. Section 3 discusses the common methodology of this paper across our simulations. Section 4 details our analysis of single-, dual-, and multi-slab profiles to highlight relevant parameters. Section 5 includes a discussion of the results and potential advancements of this research. Section 6 summarizes our results and provides our conclusions.
2. Model
The SCoBi model is a fully polarimetric, bistatic scattering model which allows for a wide number of configurable simulation environments for both the bistatic radar system and the scattering surface [15]. SCoBi simulates a three-dimensional space containing a bistatic radar configuration among a source transmitter, a reflecting surface, and a receiver. The SCoBi model determines the received direct, specular, and diffuse components of the signal emitted from the transmitter. The model is capable of simulating custom receiver antenna patterns, arbitrary radar positions, configurable vegetation canopies, and transmitter frequencies between I- and S-band.
In late 2018, Mississippi State University’s Information Processing and Sensing Lab (IMPRESS) publicly released the SCoBi Modeling and Simulation (M&S) package under a GNU general public license as a means for researchers to conduct simulation studies using SoOp-R in addition to providing a simple, all-in-one interface for newcomers to the field. The SCoBi M&S package along with its documentation is available for download at https://github.com/impresslab/SCoBi. The current version (v1.0.3) features many capabilities such as comprehensive modeling of vegetation effects, bare terrain, surface roughness effects, arbitrary antenna patterns, arbitrary bistatic geometry, and multilayer soil moisture (SM) profiles. The current version is designed for ground-based and airborne geometry and, therefore, assumes a planar Earth surface. Additionally, the publicly available M&S package does not currently feature incoherent reflection coefficient determination but is intended for releasing in the future. More information on the M&S package can be found in [16].
In this section, we introduce the multilayer SM module that is used by SCoBi to determine the reflection processes within a SM profile. We briefly review the relevant components of the core SCoBi model which use the multilayer module. We then discuss this paper’s method for determining penetration depth based on this multilayer module. Finally, the tools available in the M&S package are discussed.
2.1. Reflection Processes from a Multilayered Dielectric Slab
The SCoBi multilayer module makes direct use of well-established principles which have seen use in many layered structure applications such as radome design, the analysis and synthesis of speech, geophysical signal processing for oil exploration, the probing of tissue by ultrasound, and the design of acoustic reflectors for noise control for many decades [17,18]. To determine the reflection/transmission processes of an incident wave from or into a multilayered dielectric structure, a matrix formulation of the matching at dielectric discontinuities and the propagation within each layer are derived and the reflectivity is recursively solved in the upward direction.
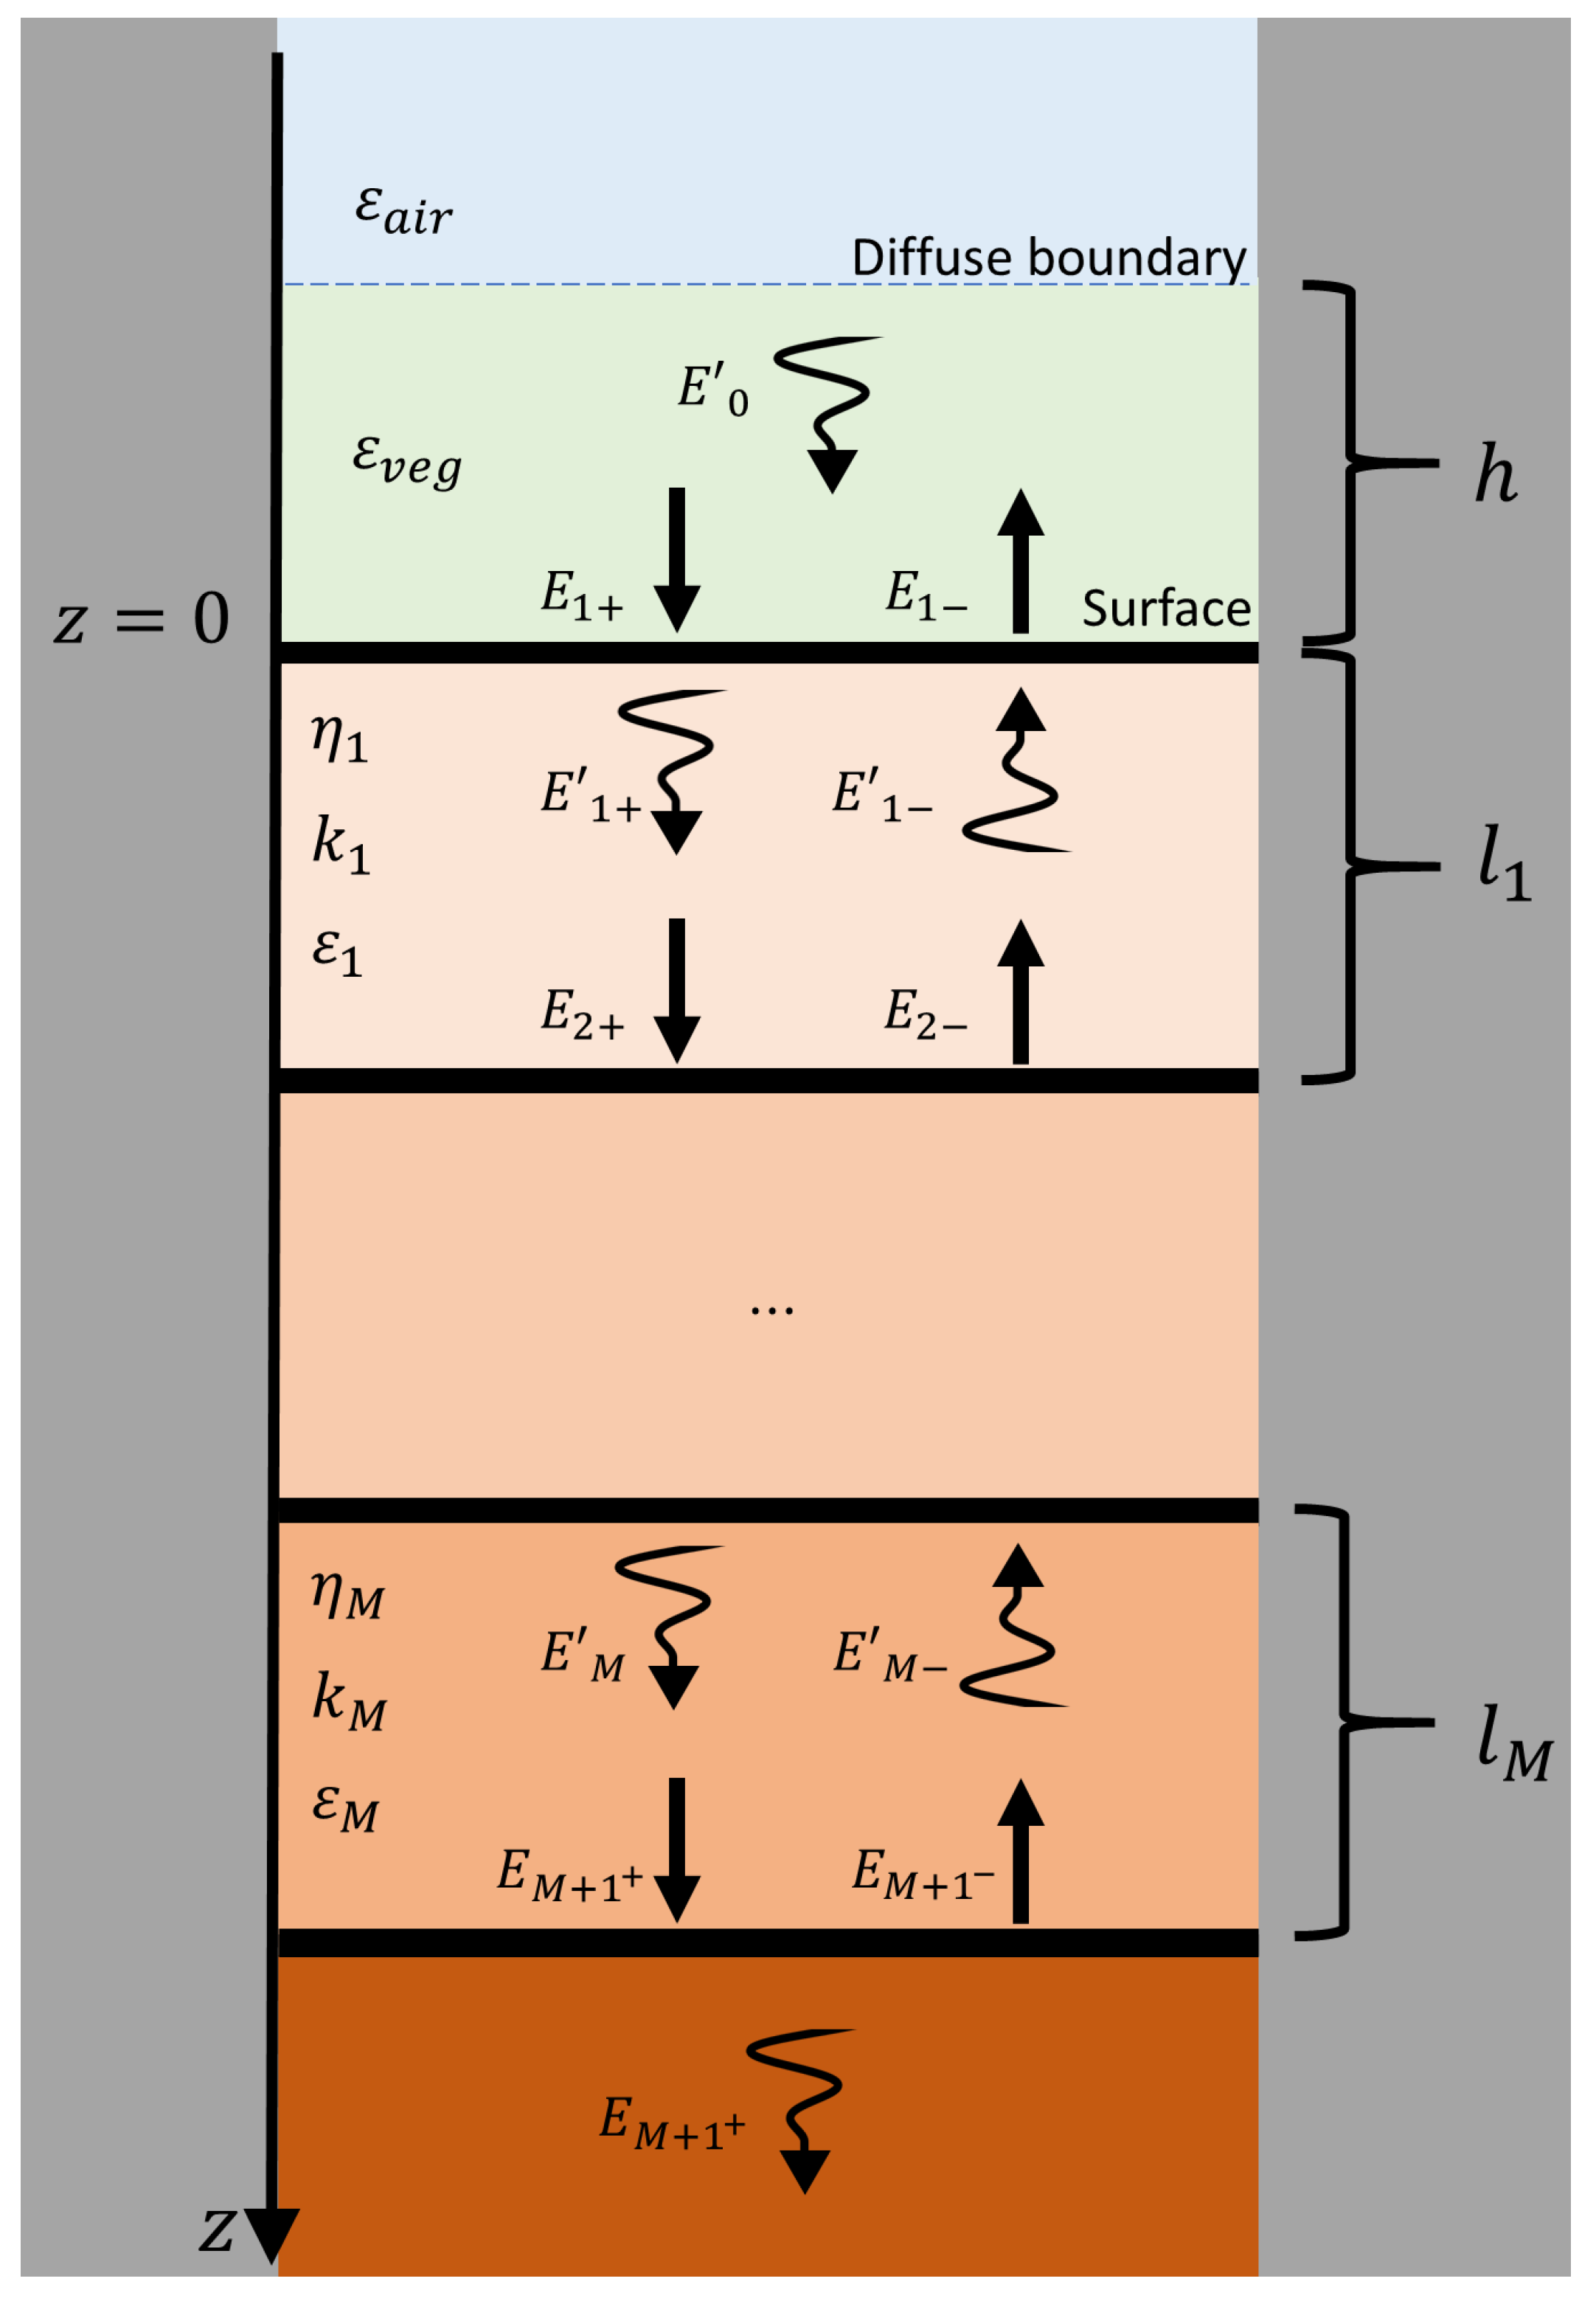
Consider uniform plane waves which are normally incident on a multilayered dielectric structure beneath a slab of mean vegetation medium, as shown in Figure 1. The vegetation is replaced by an equivalent dielectric constant of with a depth h via discrete scatterer approach [19] while the dielectric constant of air is unity. The boundary between air and vegetation layer is diffuse since the fraction of vegetation to the total vegetation layer volume is small. The upper portion of the profile (vegetation and air) represents all area above the SM profile wherein freespace path loss, vegetation effects, and systematic influences shape the electromagnetic wave propagating from the transmitter to the surface. The SM profile’s surface, designated as a point m, represents the vegetation–surface boundary position, which is effectively equivalent to air–surface boundary since the vegetation is a sparse medium. The SM profile is represented by a series of M dielectric slabs of thickness , interfaces, and a semi-infinite half-plane wherein the dielectric constant of the Mth dielectric slab extends infinitely and downward in to the soil. Each slab features characteristics such as its complex dielectric constant , wave-number , wavelength , and complex characteristic impedance . Waves which are propagating through a medium are represented by electric fields (e.g., ). The subscripts + and − are used to denote the wave modes propagating in the positive (downward) and negative (upward) z-directions. The prime (or non-primed) fields indicate that quantities are defined right below (or above) each layer interface.
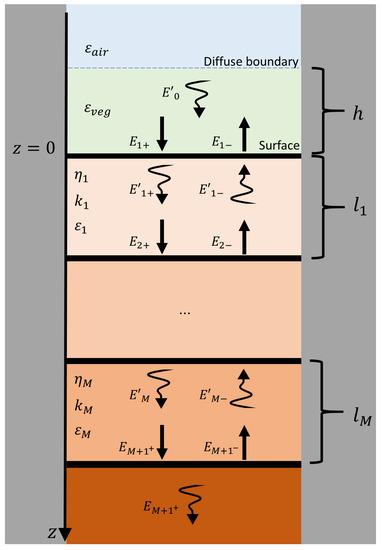
Figure 1.
Representation of propagation and reflection processes within a discretized soil moisture profile.
Critical values for this structure are the complex valued elementary reflection coefficient and elementary transmission coefficient across each dielectric interface, where the dielectric contrast between layers is a dominant contributor. The reflection coefficient observed at the surface () is determined through propagation of reflection responses iteratively by initializing the elementary reflection coefficient at the bottom-most interface of the profile with the assumption of no upward waves emanating from the semi-infinite slab. This is called backward-layer recursion as it iterates from bottom to top with decreasing index order. For each dielectric slab, both wave propagation and reflection processes are determined by matching upward and downward fields at each layer and propagating the upward and downward fields from one layer to the next as follows:
where is phase thickness and is the thickness of the ith slab. The first matrix factor scaled by reciprocal of in the right side denotes matching matrix while the second matrix factor represents propagation matrix . Multiplying the matrix factors out in Equation (1), we obtain recursions for the intermediate reflection coefficient at each layer boundary with the quotient of the forward propagating wave and backward reflected wave as:
where is governed by the elementary reflection coefficient , the phase thickness , and the intermediate reflection coefficient of the previous slab.
To account for polarization and angle for oblique incidence case, the fields are separated into transverse and longitudinal components with respect to the surface normal (the z-direction). The transverse components satisfy the identical propagation and matching matrix relationships as in the case of normal incidence with exception of the modification of the media and wave characteristics (e.g., the phase thickness and the characteristics impedance ) [18]. For oblique incidence (i.e., from the surface normal), the longitudinal phase constant is given by while the characteristics impedance for horizontal (H) and vertical (V) polarizations are given by and , respectively. The final value (linearly polarized reflection coefficient at the surface) is then used in the SCoBi model as a component of the total reflectometry process by including vegetation and system parameters.
2.2. Use of Multilayer Module within SCoBi
Having calculated the Fresnel reflection coefficient from the ground (), we now describe how the core SCoBi model uses this term to calculate the total received SoOp-R measurement from the compounding effects of the SoOp-R system and the ground environment. The core SCoBi model makes use of several modules such as bistatic geometry, ground reflection, vegetation effects, and multilayer dielectric structure modules. Note that in some cases such as vegetation and multilayer, not all modules will be used during a simulation depending on the user’s simulation requirements. The relationship between the ground reflections and core SCoBi model is explained for the specular component and is used similarly for the incoherent component of the received signal. From an arbitrary geometry, we observe that the signal reflected from the ground takes the form of a ground reflection matrix:
where is the q-polarized Fresnel reflection coefficient of the multilayer dielectric structure as determined by Equation (2) at the surface including the smooth surface roughness represented by the surface root mean square (rms) height s. Here, it is assumed that the rough surface under the vegetation is smooth, does not include topography, and follows Kirchhoff’s approximation with a Gaussian height distribution. The angle denotes the angle of specular reflection from the surface, and the subscripts {H, V} and {H, V}, and as a result, co- and cross-polarized cases are treated simultaneously. From the perspective of the coherent scattering, the reflections from a multilayer profile are embedded within the specular reflection matrix as a matrix product of the incoming and outgoing vegetation transmission matrices and the ground reflection matrix , given below:
where and are unit vectors describing the wave propagation in incoming and outgoing directions. The superscripts + and − are used to denote the wave modes propagating away and towards the specular point (SP). The ground reflection matrix is a function of the reflecting angle at the SP . Under a smooth surface assumption, this value will be equal to the wave’s angle of incidence. This specular reflection coefficient can then directly be used by the core SCoBi model to determine the coherent and incoherent components of the received SoOp-R signal. In the absence of vegetation, the vegetation transmission matrix is an identity matrix. The coherent reflection coefficient observed at the receiver terminals is given by
where the transmit and receive antenna patterns are represented by and , respectively, while the polarization basis transformations between SP-to-receiver and transmitter-to-SP are given by and . The nominal polarization state is given by . Finally, the specular reflection processes are captured by the term. This term contains all of the information for the subsurface reflection processes which are the focus of this paper. A more detailed explanation of the core model functionality is available in [15].
The incoherent reflection coefficient is determined similarly to the coherent case. The incoherent reflection coefficient is calculated using several Monte Carlo simulations, and the multilayer SM gradient is used in the calculation of observed scattering mechanisms (e.g., single, double, and triple bounces), which affects the scattering matrix. More information on the incoherent signal processes can be found in [15]. Details on creating scattering particles in addition to all other simulation environment processes are outlined in [16,20].
2.3. Penetration Depth Calculation
Penetration depth refers to the point within a dielectric media where the signal’s energy decays to from the amount available at the air–surface boundary layer. Penetration depth, similar to the reflection coefficient of a multilayer dielectric slab, is a single value which exists in a large dynamic range depending on a SM profile’s soil texture and moisture content. While penetration depth does not indicate a precise limit to a SoOp-R system’s SM sensitivity, it is, nevertheless, a useful metric for describing a SoOp-R system’s interaction with a SM profile.
The traditional method of determining penetration depth is given by the inverse of the medium’s power absorption coefficient [14]. If a low-loss dielectric (small loss tangent) medium is assumed, the resulting form is established [21].
This method, while useful, is limited to a single uniform slab and determines the depth at which the power of a signal reaches as it propagates through a single slab at nadir incidence angle. However, the case of layered media having transmission losses is more complicated. Alternatively, the penetration depth can be modified by multiple dielectric discontinuities composing a SM gradient as illustrated in [22,23]. SCoBi uses a similar approach for the forward-scattering case seen in SoOp-R by explicitly calculating the transmissivity into the soil layers. To analyze the relationship between an arbitrary SM profile and the penetration depth, let us summarize the main steps of the theoretical calculations.
Starting from the incident amplitude , the transmitted amplitude from the soil surface to the ith soil layer can be written as
where is the intermediate transmission coefficient from the top of the soil to the ith layer (in the downward direction). Note that Equation (7) differs from the elementary transmission coefficient since it combines all the processes from top to the ith interface. To determine the overall transmission response into the ith layer, we start at the top interface with the relation , where is first obtained via Equation (2). We then successively apply inverse of the matching and propagation matrices given in Equation (1) to obtain Equation (7). This is called forward layer recursion as it iterates from surface to the ith layer into the soil with increasing index order. The downward-going transmissivity is defined as the fraction of energy transferred to the ith layer relative to the surface and is equal to . It is calculated using Poynting’s Theorem and taking the ratio of (time-averaged) transmitted power density at the ith interface () to (time-averaged) incident power density on the surface (). Assuming fine discretization between boundary layers, the penetration depth can be determined by denoting the layer boundary at which the transmissivity reaches . The major difference of this approach from the traditional calculation (Equation (6)) is its applicability to layered profiles in which one can analyze the penetration depth as a function of SM profile, incidence angle, and polarization.
2.4. Simulation Tools and Soil Moisture Profile Representations
Several simulation tools are given in the SCoBi M&S package that allow the user to explore potential SM profile structures. After providing SM samples and soil texture information to the simulator, the SM values are converted to complex dielectric constant values using one of three provided SM dielectric functions: the Wang model [24], the Dobson–Peplinski model [25,26], and the Mironov model [27]. The Wang model is an empirical model developed using data measured at 1.4 and 5.0 GHz, making it ideal for simulations at L- and C-band under similar soil texture conditions. The Dobson–Peplinski model is an empirical model that has been designed using measurements made between 0.3 and 18 GHz. Finally, the Mironov model is a semi-empirical model that has been validated over a range of 0.3–26.5 GHz [28]. Previous studies have shown that the performance accuracy of each model will vary depending on the frequency and soil condition of any given measurement, and, thus, a user may require the use of multiple dielectric models depending on the measurement conditions [29,30]. The simulator is designed to handle both an “experiment-based” environment where only a small number of SM values are known via in-situ measurements and cases where each SM value is explicitly defined. To this end, the SCoBi simulator features multiple SM fitting functions which are used in conjunction with the SM dielectric functions.
Currently, four functions exist for mapping SM as a function of depth within the profile: a discrete slab model, a second-order polynomial, a third-order polynomial, and a logistic function fit. Given a set of SM values, the model computes the dielectric constant for each SM point, and the dielectric constant between each SM point is fit depending on the selected function. For the dielectric slab fit, each slab extends from the given soil depth to the midpoint between its nearest neighbor. This is performed for all values excluding the values between the surface and the first SM value which will assume the value of SM nearest to the surface. The slabs themselves are composed of multiple smaller interfaces as defined by the soil discretization of the user’s choice. If the user defines SM for each depth corresponding to the discretization level, each SM value will be explicitly defined, and a midpoint will not be created. The polynomial fits are the least-squares-best-fit for the dielectric constant of the profile as specified by the user. The logistic fit is that of an iterative, traditional logistic regression model [31].
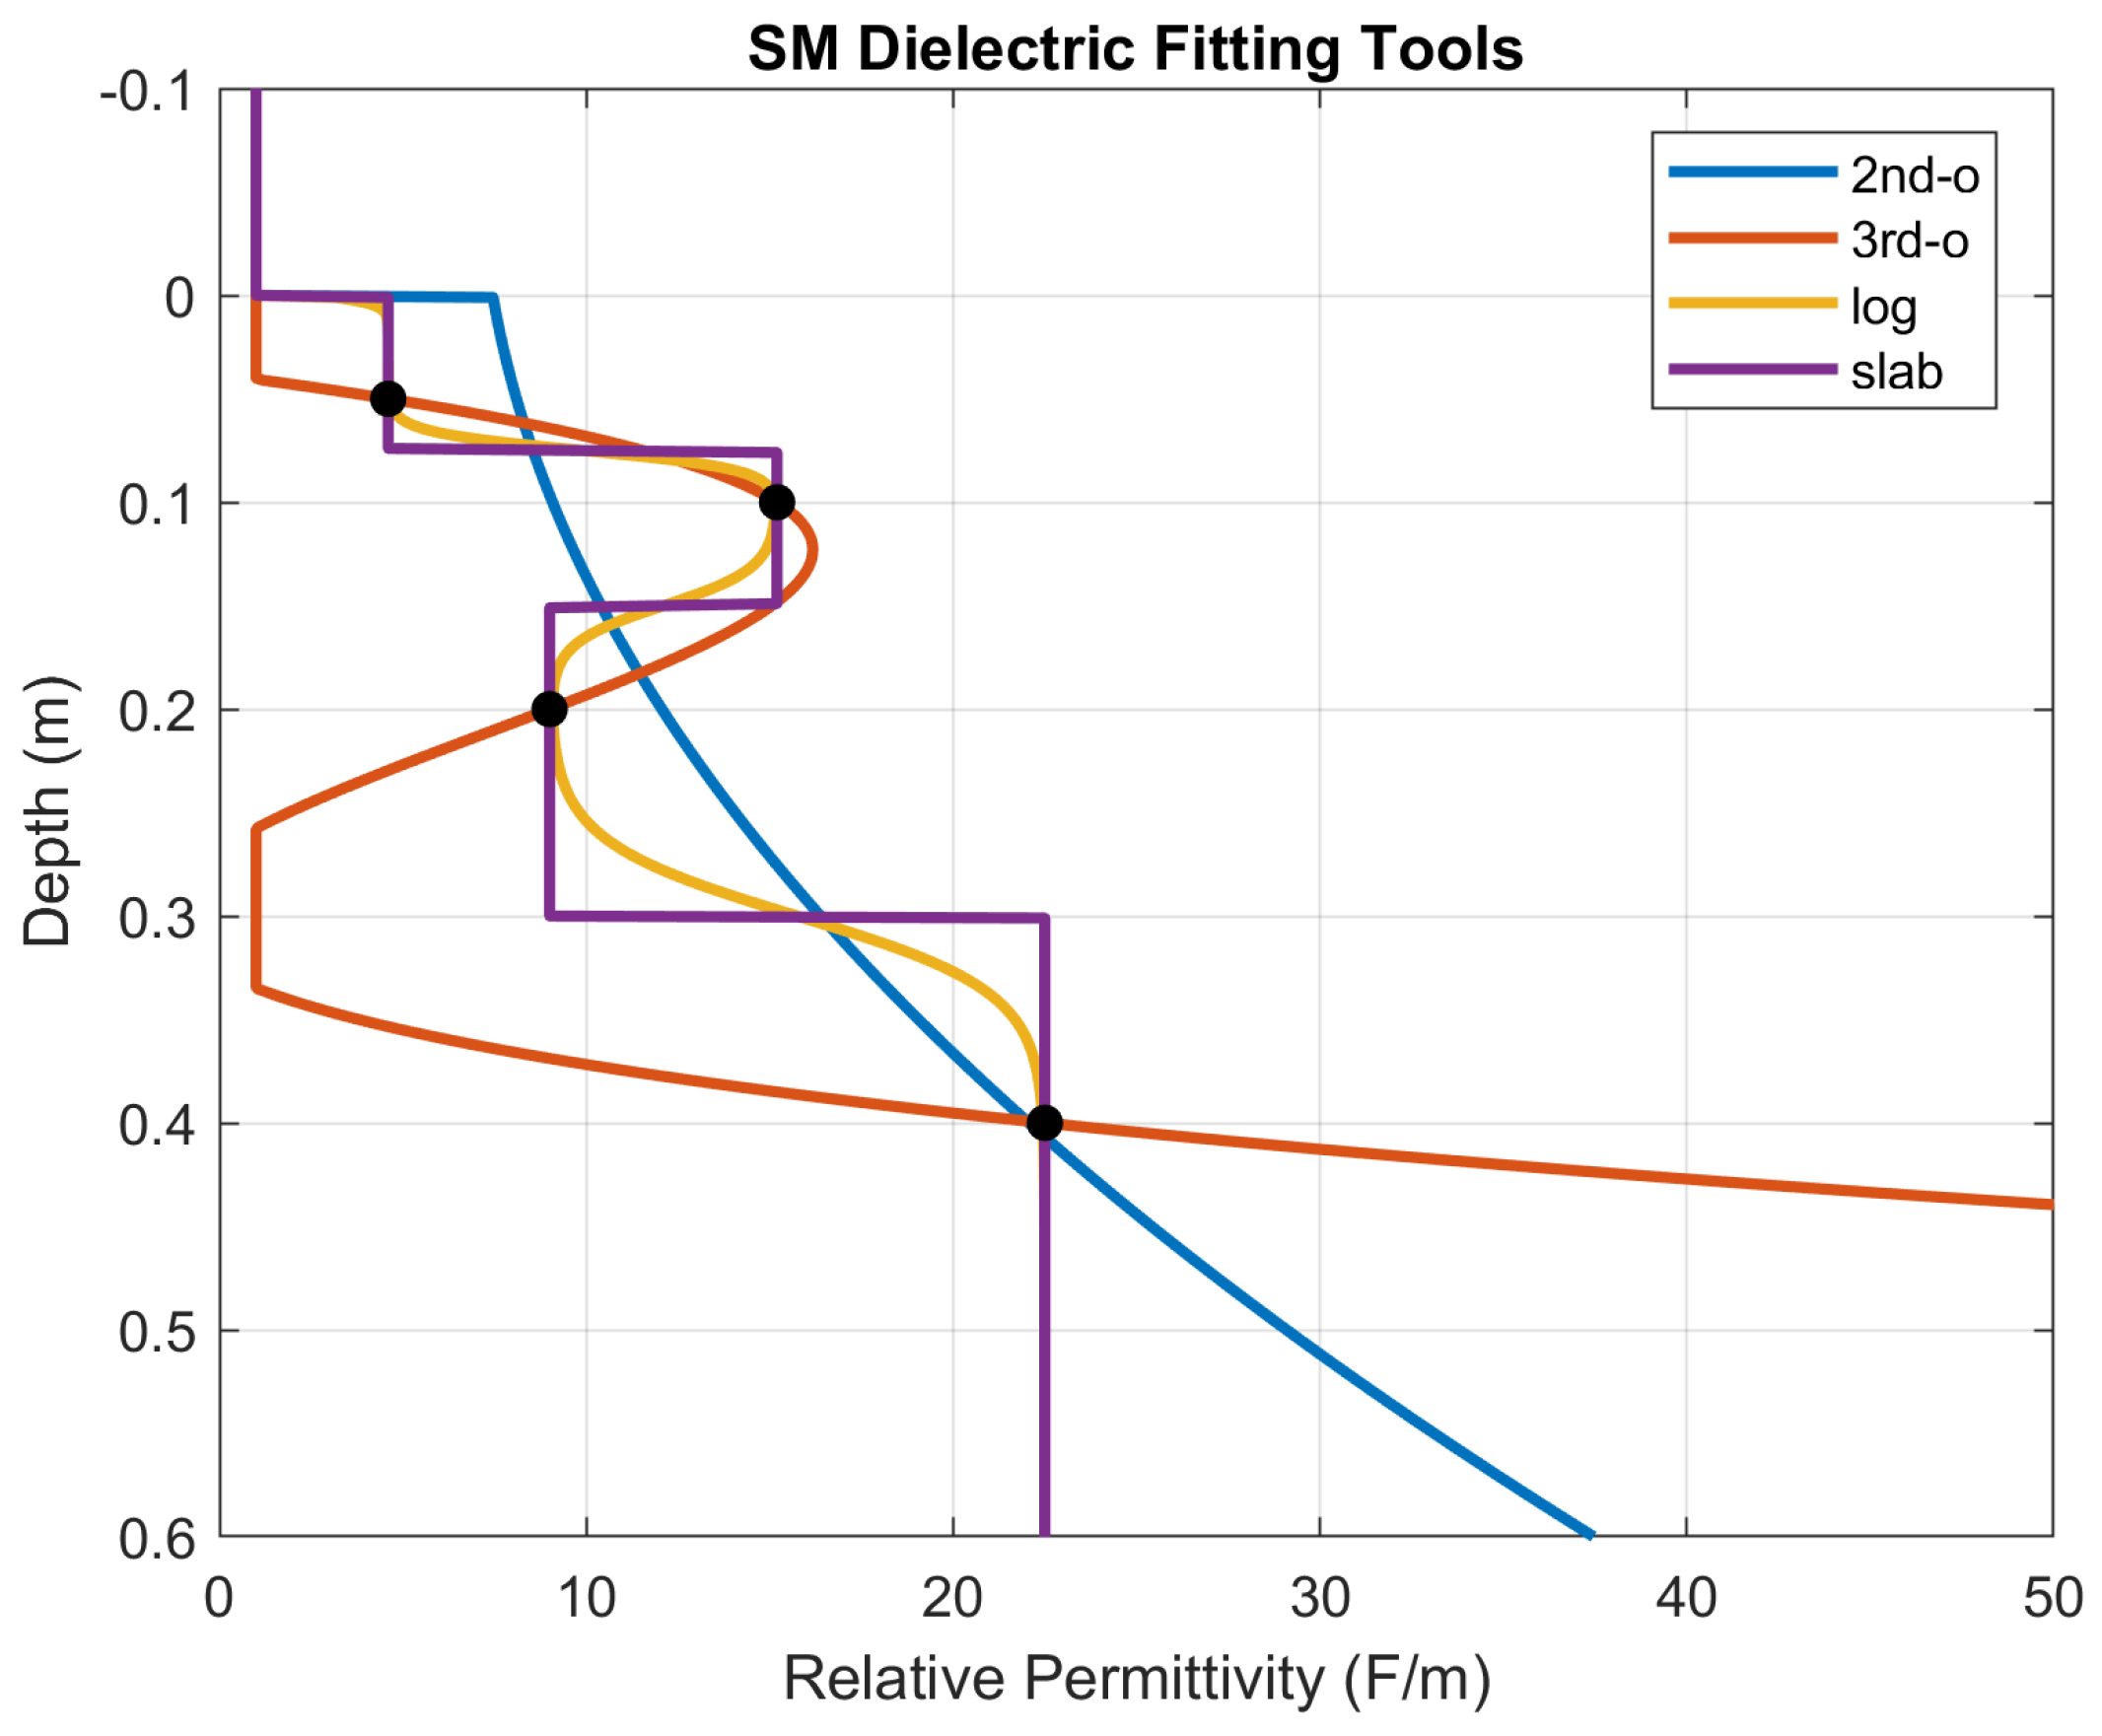
To illustrate the SM profile fitting function, the four dielectric fitting functions are visualized in Figure 2 using the input parameters of Table 1 to define the profile according to the Mironov model with a soil discretization of 1 mm. It should be noted that these values only depict the relative permittivity of the fitting functions. The second-order and third-order polynomial fitting functions place a regression line corresponding to the respective polynomial order given a set of SM samples. Because the number of SM samples match the number of polynomial coefficients, the third-order polynomial is able to perfectly fit each SM sample provided. The third-order polynomial also depicts the simulator’s “lower boundary” as the polynomial fit required to create this curve results in values below the dielectric constant of air. The dielectric slab fit depicts the simulator’s slab fitting technique which extends the dielectric constant up to the mid-point between each provided SM sample. The logistic fitting function places a logistic curve between each SM sample before remaining constant for the depth remaining after the final provided SM input.
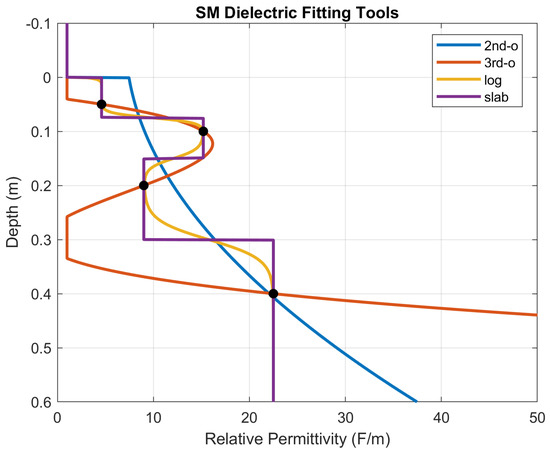
Figure 2.
Discretized soil moisture profile representation in SCoBi model and simulator package. Each profile is fit using defined dielectric constant values (shown as black points) over a discretized profile. For clarity, only the relative permittivity is shown.

Table 1.
Example soil moisture profile information.
3. Methodology
Having detailed the SCoBi model and simulator’s functionality for modeling multilayer SM profiles, this subsection details the methodology and simulation description for our study of the subsurface reflection processes that will enable RZSM profile inversion. Additionally, we would like to explore the relationship between penetration depth and the response of a SoOp-R system to a profile’s depth. For this reason, we establish the following methodology for obtaining accurate, repeatable SoOp-R simulations using SCoBi. To maintain focus on the response to RZSM and subsurface SM variation, neither surface roughness nor vegetation effects are considered. For all simulations, the Mironov model is used [15]. This SM dielectric model is a function of only three variables: frequency, volumetric SM, and the soil’s volumetric clay percentage. For most simulations, the clay content is restricted to 31% to simulate a loamy soil as typically seen in soils intended for crop yield. Each profile is discretized into 1-mm interfaces. This is done in order to simulate a continuous SM profile with respect to the incident signal wavelength as opposed to using large dielectric slabs. This discretization is used in this study to create larger dielectric slabs from smaller components (e.g., a 5-cm thick dielectric slab would be composed of 50 1-mm slabs of identical dielectric constant values.) This means that the propagation and reflection processes are determined every one mm (i.e., account for propagation losses every millimeter and, when applicable, observe signal reflections at dielectrically discontinuous boundary layers.) Unless stated otherwise, all simulations occur at normal incidence. The receiver is assumed to be at low altitude where the earth surface curvature is negligible. As soil substrate composition is widely regarded as having negligible scattering effects in this frequency region, only coherent contributions are considered for these simulations. Because of these simplifications, the observed reflection coefficient ( from Equation (5)) is equal to the surface reflection coefficient ( from Equation (2).) No incoherent contributions are simulated.
The simulation study in Section 4 examines multiple SM profile configurations as explicitly defined by the M&S package’s discrete slab fit function. We examine multiple SM profiles and the SoOp-R response for frequencies between 100 and 2400 MHz. While only a discrete number of communication/navigation sources exist within this region, characterizing the general frequency response in this region is within the general scope of this section. Nearly all simulations are performed at normal incidence.
While some simulations make use of a frequency sweep across the 100–2400 MHz spectrum, some simulations take place at discrete frequencies. Due to the popular usage of these bands within SoOp-R experiments throughout the literature, the frequencies at 137.5, 255, 370, 1575.42, and 2338.75 MHz are used for these visualizations.
During simulations involving penetration depth, it is worth noting that the penetration depth is dependent on the polarization of the incidence signal. SCoBi defines these values in terms of linear polarization. For all simulations in this study, the penetration depth is derived from the horizontal component of the emitted signal, although we note that, for these configurations at normal incidence, neither penetration depth nor reflectivity changes with respect to polarization.
3.1. Single Slab Study
Before understanding the multilayer case, it is important to understand how SoOp-R behaves given a single slab of SM. While many simulation studies have been conducted for understanding traditional back-scattering, single-frequency radar systems in relation to SM [32,33,34,35,36,37], this study seeks to characterize the forward-scattering, multi-frequency SoOp-R response to various SM profile configurations and controllable receiver variables.
For the initial simulation, we examine the SoOp-R response to a single SM slab with values between 5% and 50% VSM. The constant SM value extends infinitely from the surface of the soil downwards. All incident signals assume a right-hand circular polarized transmitter. The incident angle along the surface is taken at normal incidence in nearly all simulations. The dielectric constant of SM with respect to frequency is also examined.
3.2. Dual Slab Study
We now analyze the response to two dielectric slabs. Two studies are performed: a study showing the SoOp-R response of dual-slab profiles to: (1) depth of the second slab; (2) frequency and incidence angle; and (3) soil texture.
In these dual slab simulations, two parallel slabs of soil moisture are placed on top of one another where the first slab acts as a constant SM layer from the air–surface boundary to a defined depth, and the second slab extends semi-infinitely downward. While we acknowledge that such a simple representation may not represent the “true” response of SM profiles to SoOp sources, the analysis of dual-slab profiles allows us to more easily comprehend the new contributions induced by multilayer SM slabs.
For the first study, the first slab takes values of 20%, 30%, and 40% SM, while the underlying slab is fixed at a value of 50% SM. While such levels of difference in SM may be uncommon, this is done in order to maximize potential reflections beneath the upper slab and visualize signatures which can be extended into more realistic SM profiles. The primary observables seen in this study are those of the resultant reflection coefficient, the penetration depth, and the transmissivity of the signal as it passes through the 1-mm interfaces across the two dielectric slabs. Only two constant dielectric slabs are present for each SM profile configuration. This is done to quantify the effect that varying the position of a second dielectric slab has on the measured reflectivity.
While penetration depth provides an indication of the location within the profile that a signal’s energy falls to 36.8% of its incident energy, direct analysis of a SoOp system’s reflectivity response to different SM profile configurations can provide an understanding of the limitations of a SoOp receiver system. To provide a metric for monitoring SoOp-R’s change in reflectivity as a function of the position of a second dielectric slab beneath a constant SM slab, we seek to determine a depth within the two-layered SM profile where the reflectivity falls below a defined threshold. This depth, referred to as a “saturation depth” for this study, is obtained by lowering the second slab into the profile to such an extent that changes in reflectivity can no longer be observed as a function of the second slab’s location to a user-defined threshold level. In our example, it is assumed that reflectivity does not vary significantly beyond 1 m. Over the range of 1–2 m, a mean value of the reflection coefficient is obtained by averaging the reflection coefficients for multiple two-layer SM profile configurations to obtain a “saturated reflectivity.” We then iterate backwards from the bottom-most layer towards the surface and establish a depth at which the reflectivity deviates by a user-specified amount from the saturated reflectivity. For the purposes of our problem, we assume that our system can confidently determine reflectivity up to 1% accuracy. Thus, we seek to use this metric to determine the depth at which the two-slab profile sees fluctuations in coherency that are greater than 1%.
For the second part of this study, fixed dual-slab profiles are analyzed with respect to frequency and incidence angle. The profiles consist of a first slab with a dielectric constant value derived from the Mironov SM dielectric model, and the lower layer is an arbitrary, high-dielectric constant value beneath the SM layer. The lower layer dielectric constant is defined by the Mironov dielectric model for 50% SM. Two slabs are shown as examples at 10% and 30% SM. The four profiles consist of the first slab extending from the surface (0 m) to the second slab at 0.2, 0.3, 0.4, and 0.5 m. The horizontal component of the incident wave is analyzed with an angle of normal incidence to determine the transmissivity and penetration depth values.
In the third portion of this dual-slab study, the effect of soil texture on SoOp-R measurements is discussed. Soil texture, typically defined as the amount of sand, silt, and clay shared within a soil layer, is a dependency for many soil dielectric mixing models. SM content is generally the dominating variable for these mixing models due to water’s high permittivity, and the distribution of water content within the soil volume can vary the dielectric constant. The use of soil texture and SM as soil dielectric modeling inputs is a common technique dating backing to the 1980s.
The Mironov model used by this paper is a function of frequency, SM, and clay content. In this section, the impact of clay uncertainty on SoOp-R measurements is reported using a study of two slabs. The slabs are are separated by a dielectric interface located at 15 cm. Two profile configurations are used. The first and second dielectric slabs contain 15% and 30% SM in one configuration. 30% and 15% SM are used in another configuration for Slabs 1 and 2. Because the Mironov model is only a function of clay, the change in reflectivity is visualized across a range of 5–45% clay content within the first and second slab. Because soil dielectric constant behaves nonlinearly in the Mironov dielectric model as a function of SM and clay, the results are plotted by taking the absolute difference between clay content configurations and the “true” clay content value (25% for both slabs.) The results visualize how different combinations of clay values can produce similar reflectivity values when the clay content of the first and second slab’s clay content is varied.
3.3. Arbitrary Profile Study
After performing simulations on both single and dual-slab profiles, we now view the response of SoOp-R to profiles which feature dielectric constant changes at nearly every interface. In other words, this study seeks to visualize the subsurface contributions from a variable, arbitrary SM profiles on the reflection coefficient. Specifically, we show how the reflection coefficient changes between layers as the iterative method computes the reflection coefficient from the bottom-most interface as it ascends towards the surface. To this end, we visualize three components: several SM profiles, the elementary reflection coefficient derived from the dielectric contrast between each interface, and the intermediate reflection coefficient taken from Equation (2) viewed at the ith interface of each SM profile. The intermediate reflection coefficient values () are terms used to solve for the surface reflection coefficient () that are influenced by the subsurface SM structure. We note that SoOp-R measurements cannot directly measure the intermediate reflection coefficients at these subsurface interfaces. However, such a simulation can help visualize the effects that highly discretized dielectric constant gradients have on multifrequency SoOp-R signals as they propagate through a complex, smoothly-varying SM profile under the SCoBi modeling assumptions.
In the previous studies, we examine SM profiles consisting of either one or two distinct dielectric constant values within the profile. We now examine SM as a function of either first- or second-order polynomial fitting. We choose the following format to mathematically describe SM profiles as provided in [36]:
where , , and represent polynomial coefficients and z represents the SM profile depth in meters. In addition to these parameters, the SM profile is bounded between 3% and volumetric SM for any given polynomial coefficient. The discretization of z assumes an interface every 1 mm. Under such a discretization, the subsequent results should allow us to visualize the contributions of heterogeneous areas in the upper portion of the profile [38], which are known to be significant in altering the reflected energy, as well as from deeper portions of the profile.
While it is clear that SM profiles are shaped by many factors including thermal and capillary processes, we use a polynomial function in order to approximate an arbitrary, high-resolution profile under easily configurable conditions. It is not the intent of this simulation to model highly realistic SM profiles; however, it is our goal to depict variable, simple SM conditions with easily depicted changes in the SM gradient to illustrate how SoOp-R measurements behave as arbitrary profiles change.
4. Results
This section contains the results of three simulation studies: simulations performed using a single SM value for a semi-infinite dielectric slab; a two-slab study of penetration depth, frequency, and incidence angle; and a study of subsurface reflection coefficient changes using arbitrary profiles represented by simple lines and polynomials. Each of these simulations allows us to look at different aspects of SoOp-R’s response to changes in the specular, forward-scattering reflection coefficient as well as the interactions with RZSM.
4.1. Single Slab
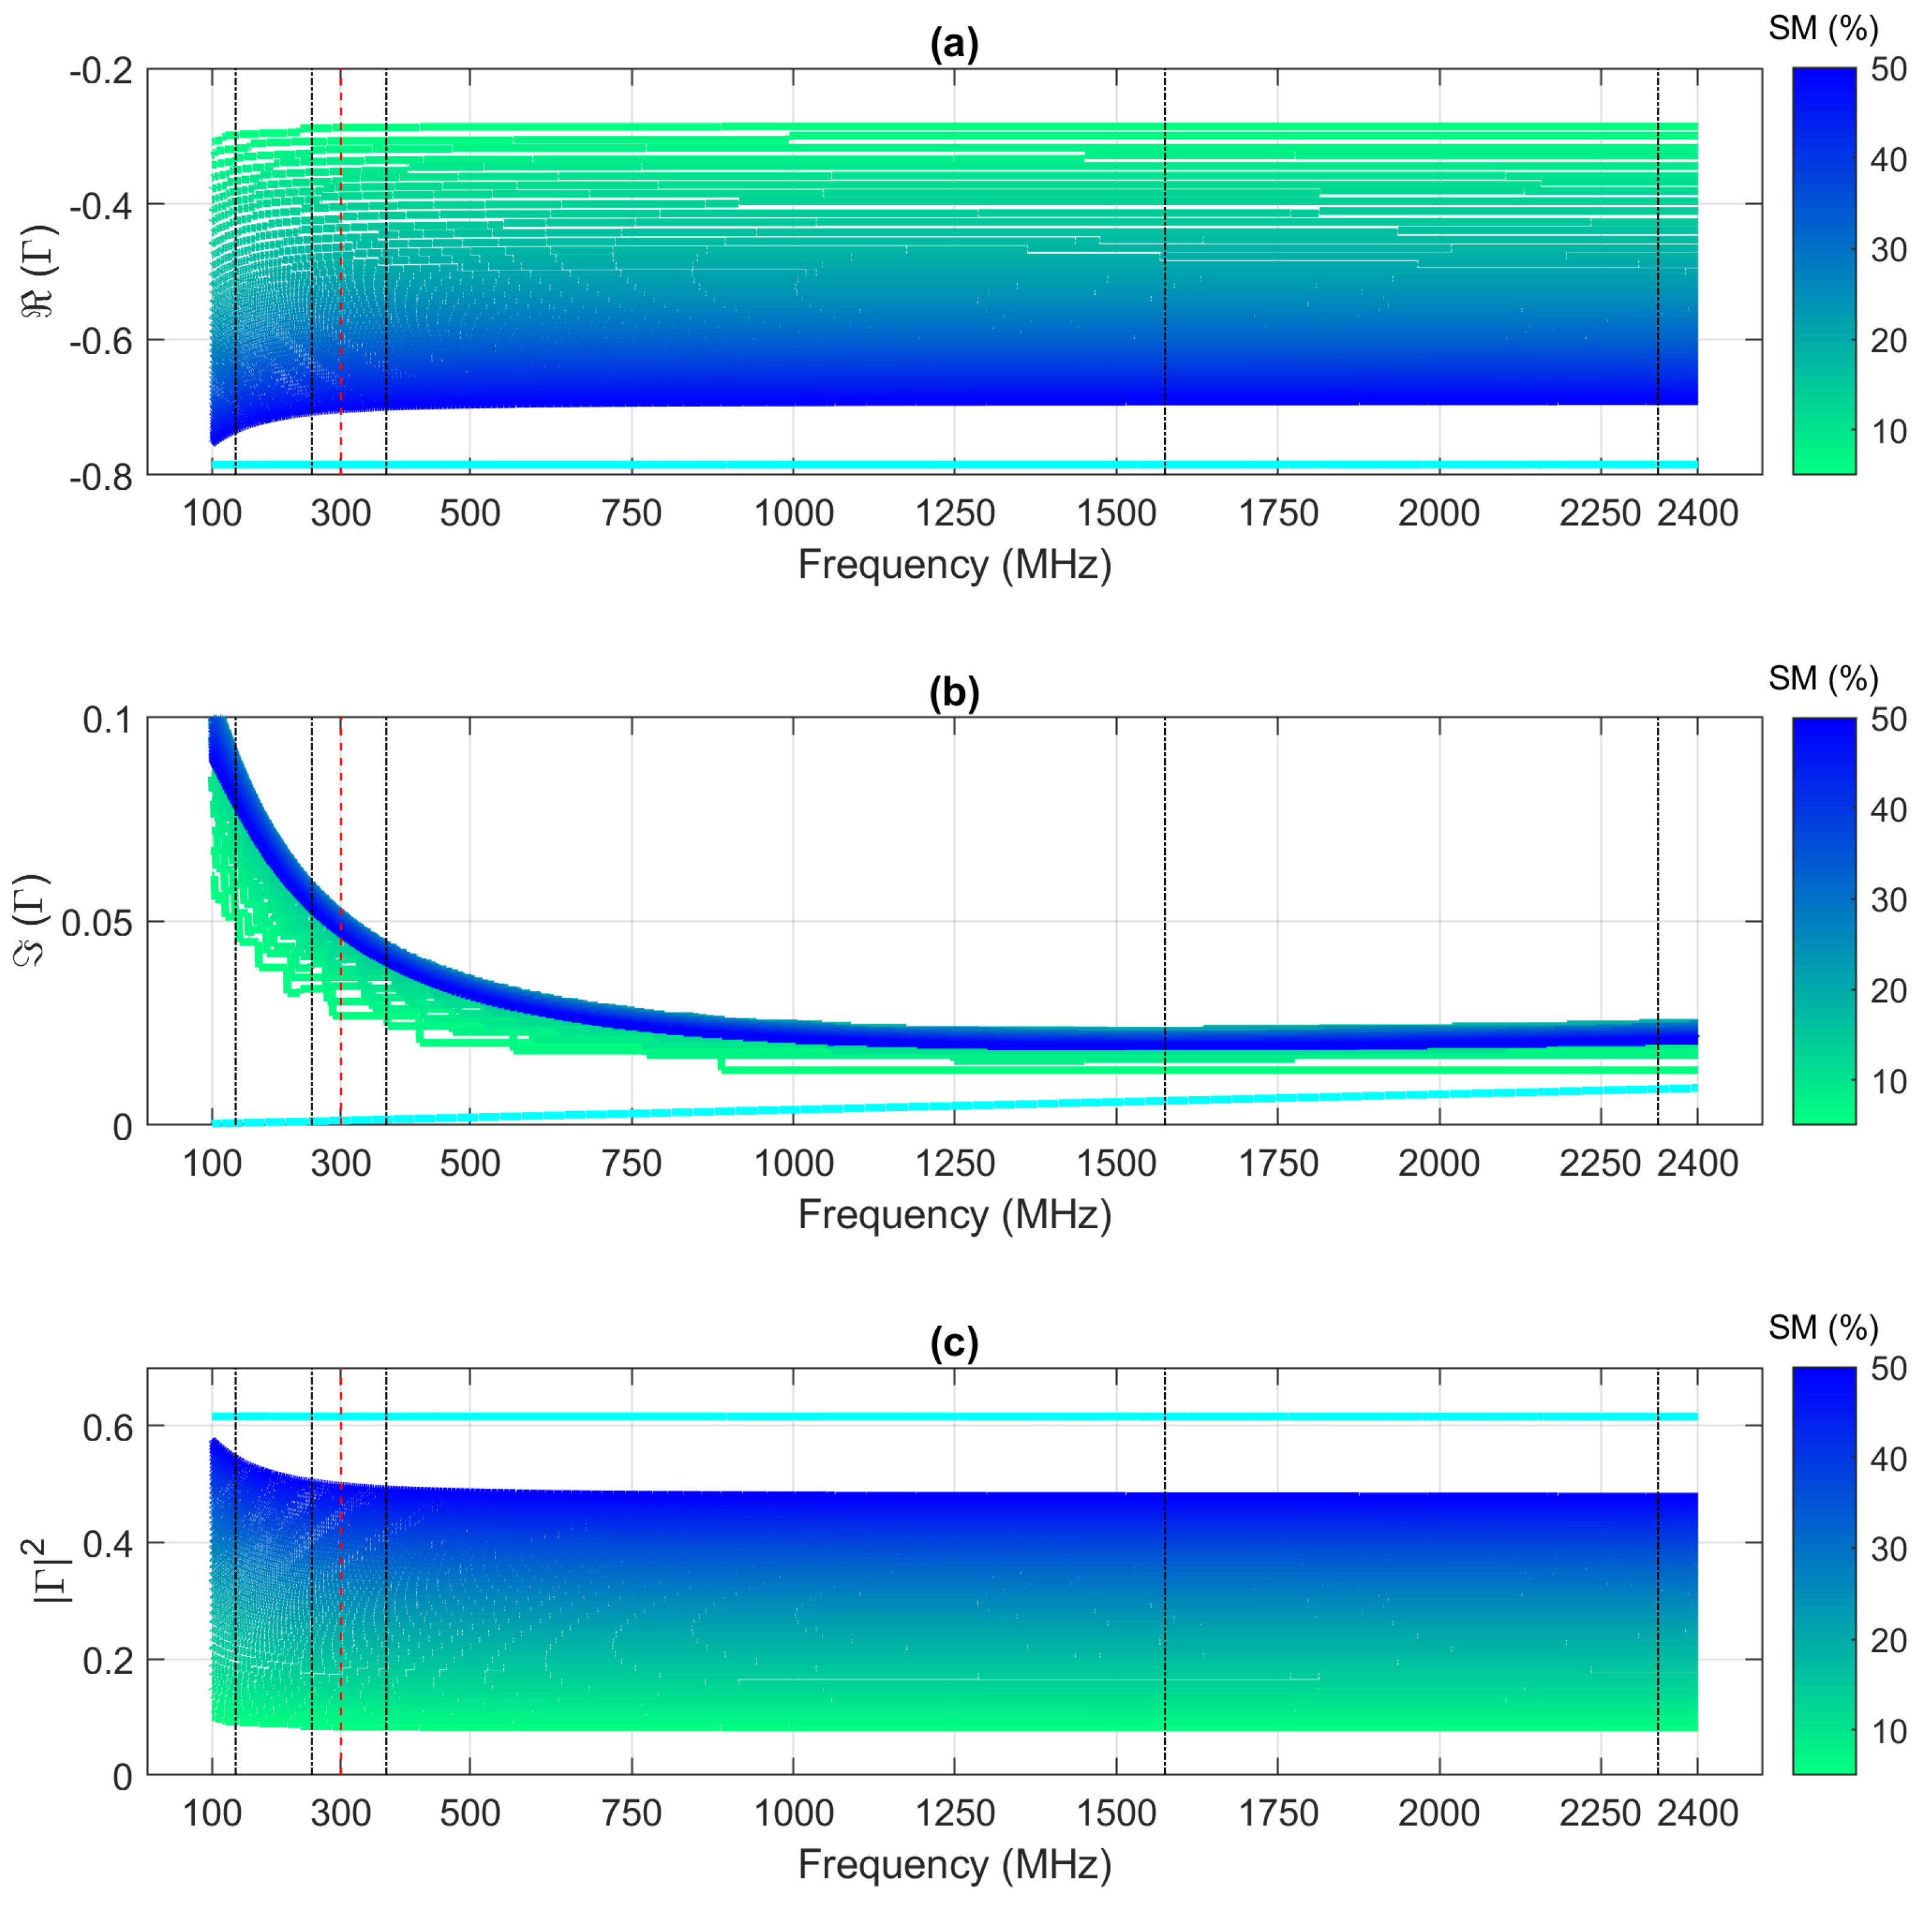
Figure 3 depicts the behavior of the real and imaginary reflection coefficient as well as reflectivity for a frequency sweep between 100 and 2400 MHz with 1-Hz resolution. The commonly referenced SoOp-R sources are depicted as black dashed lines at the corresponding frequency location along the x-axis. In addition to the response of SM, the response of the same frequencies to pure water is shown in Figure 3a using the model shown in [14]. Between 300 and 2400 MHz, the real component of the reflection coefficient is largely frequency insensitive. If the real component of the reflection coefficient is considered as a function of SM, it can be seen that the real component of the reflection coefficient increases in magnitude as a function of SM content. For the imaginary portion of the measurement, the SoOp-R values take on a curvature with respect to frequency, and, for most values above 1000 MHz, the values are largely the same. When examining the reflectivity, similar frequency regimes above and below 300 MHz can be seen.
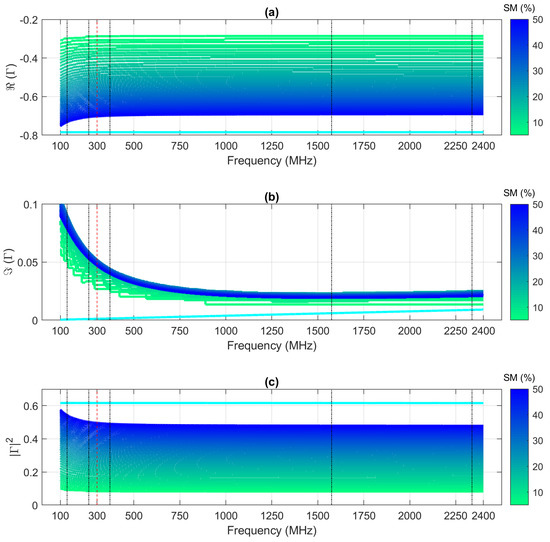
Figure 3.
(a) Real, (b) imaginary, and (c) magnitude square of the measured reflection coefficient. The color gradient shows the reflection coefficient values for soil moisture between 5% and 50%, and the cyan line shows the reflection coefficient values of water for the given frequency range. The black, dashed lines show the position of the commonly referenced SoOp-R sources, while the red dashed line shows the lower validation region of the Mironov dielectric model. All measurements are performed at normal incidence.
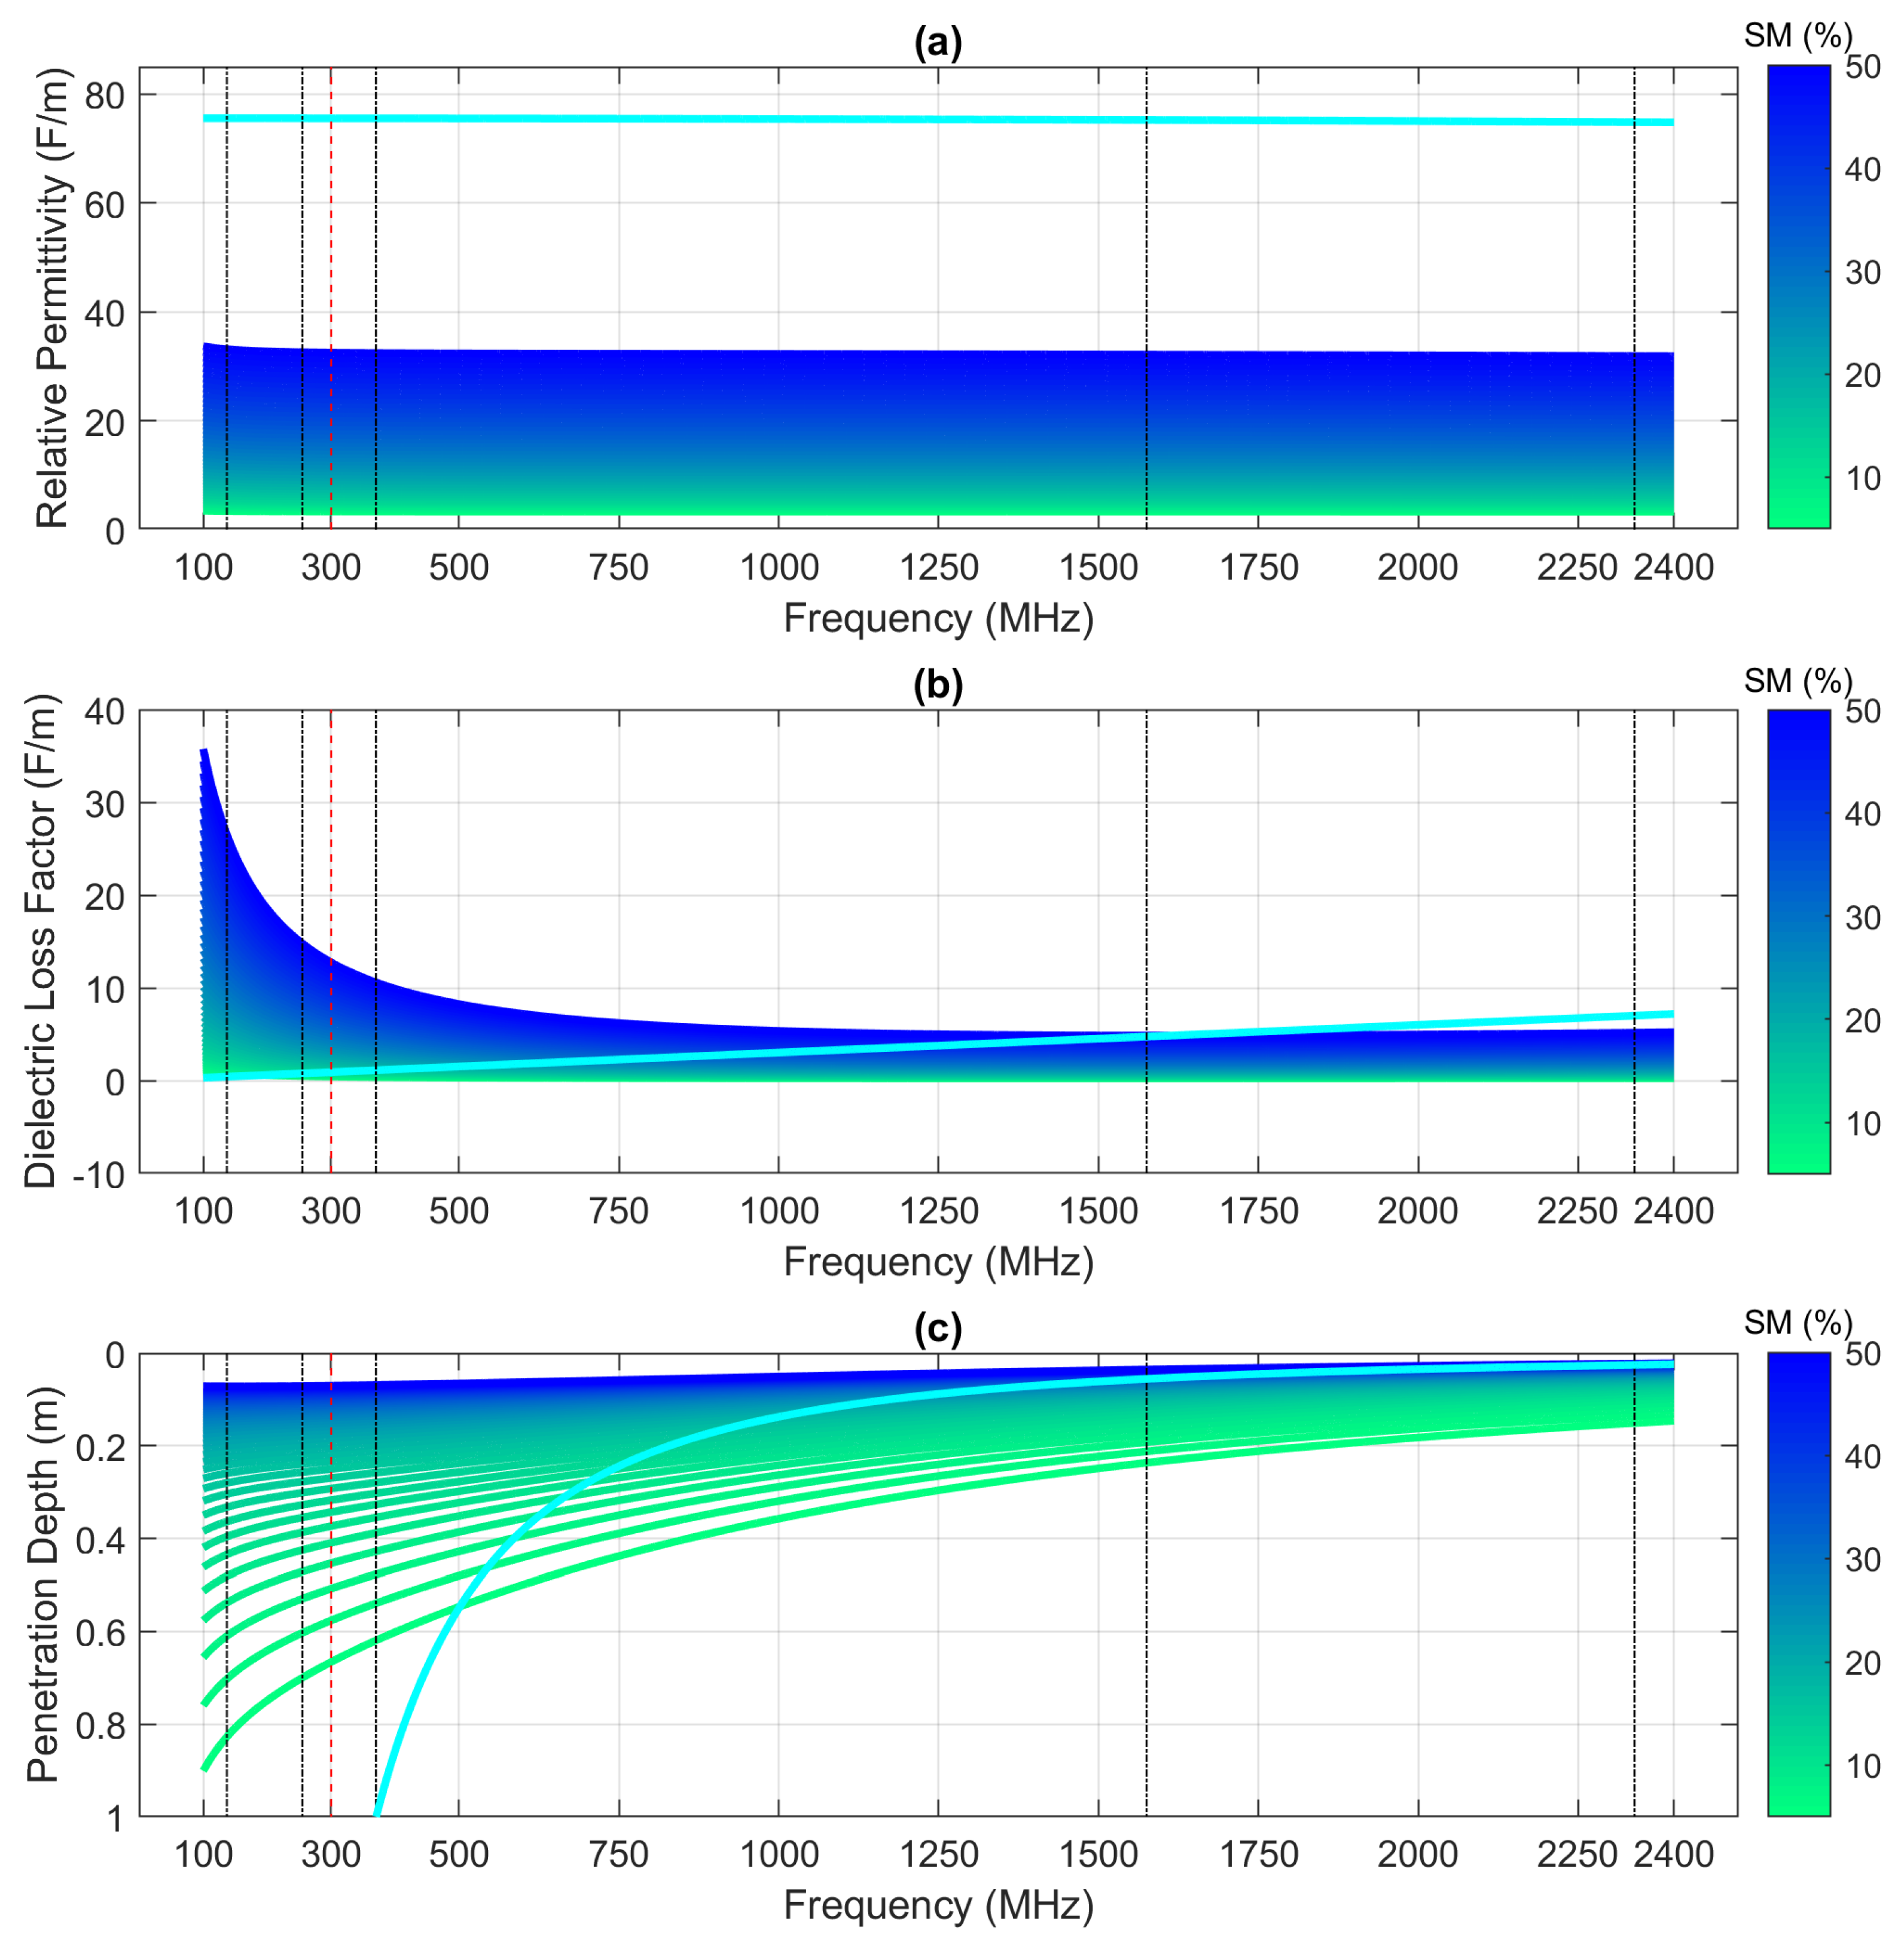
While the reflectivity does appear to vary below 300 MHz, all values above 300 MHz appear to primarily be a function of SM with little response to changes in frequency. To investigate this, the dielectric constant values produced by the Mironov model are simulated using the same SM and frequency values in Figure 3. The results are depicted in Figure 4 alongside the dielectric constant of pure water. For the reader’s convenience, the single-layer penetration depth values for the corresponding dielectric constant values are plotted in Figure 4 using Equation (6).
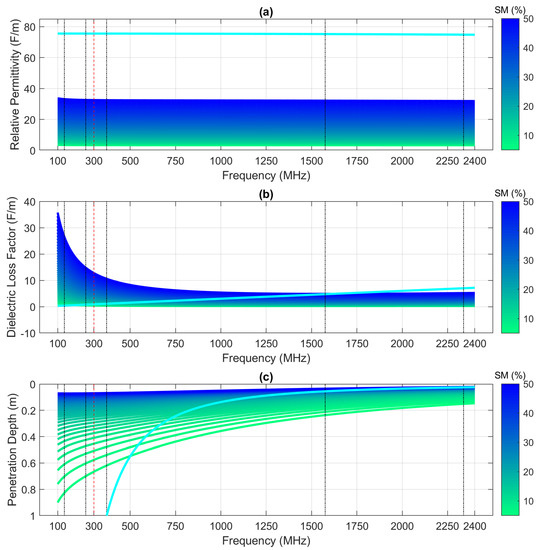
Figure 4.
Behavior of (a) real and (b) imaginary dielectric constant for multiple soil moisture values as a function of frequency in addition to (c) penetration depth information from Equation (6). The color gradient shows the dielectric constant for soil moisture between 5% and 50%, and the cyan line shows the dielectric constant of water for the given frequency range. The black dashed lines show the position of the commonly referenced SoOp-R sources, while the red dashed line shows the lower validation region of the Mironov dielectric model.
It is clear that the reflectivity values observed in Figure 3c behave nearly identically to the general pattern of the real component of the dielectric constant seen in Figure 4. It can generally be observed that the real component of the dielectric constant is a more dominating component, especially beyond 500 MHz. Thus, the frequency insensitivity observed in the SM dielectric constant creates a generally flat SoOp-R response across frequencies.
As stated previously, the Mironov model [27] is a physics-based approach to determining the dielectric constant of SM that has been validated for frequencies between 300 MHz and 26.5 GHz. While the values have been largely verified over this range, values below 300 MHz, as denoted by the dashed red line in Figure 3 and Figure 4, are not guaranteed because the dielectric model for these frequencies was created by fitting dielectric constant measurements to calculations derived from the generalized refractive mixing dielectric model. As such, values below 300 MHz should be used cautiously as these dielectric constant values have not been validated by measurements.
Ultimately, it can be observed that the response of SoOp-R to SM is proportional to the dielectric model used for SM. This experiment was performed with the Dobson–Peplinski model, and the same frequency insensitivity was observed. The Wang model was derived from L- and C-band data only and is not applicable for this frequency sweep simulation.
Understanding that the magnitude of the reflection coefficient from a uniform SM slab does not change drastically across our observed frequency spectrum, we note that the imaginary component of the soil dielectric constant will govern the rate at which these frequencies suffer propagation loss. Different frequencies, by merit of the SM dielectric constant’s imaginary component, can potentially observe differences in SoOp-R response to SM profiles based on their moisture content as a function of depth. To investigate this, we now examine the response of SoOp-R to two dielectric slabs in multiple configurations.
4.2. Dual Slab Study
4.2.1. Saturation Depth of Descending Slab
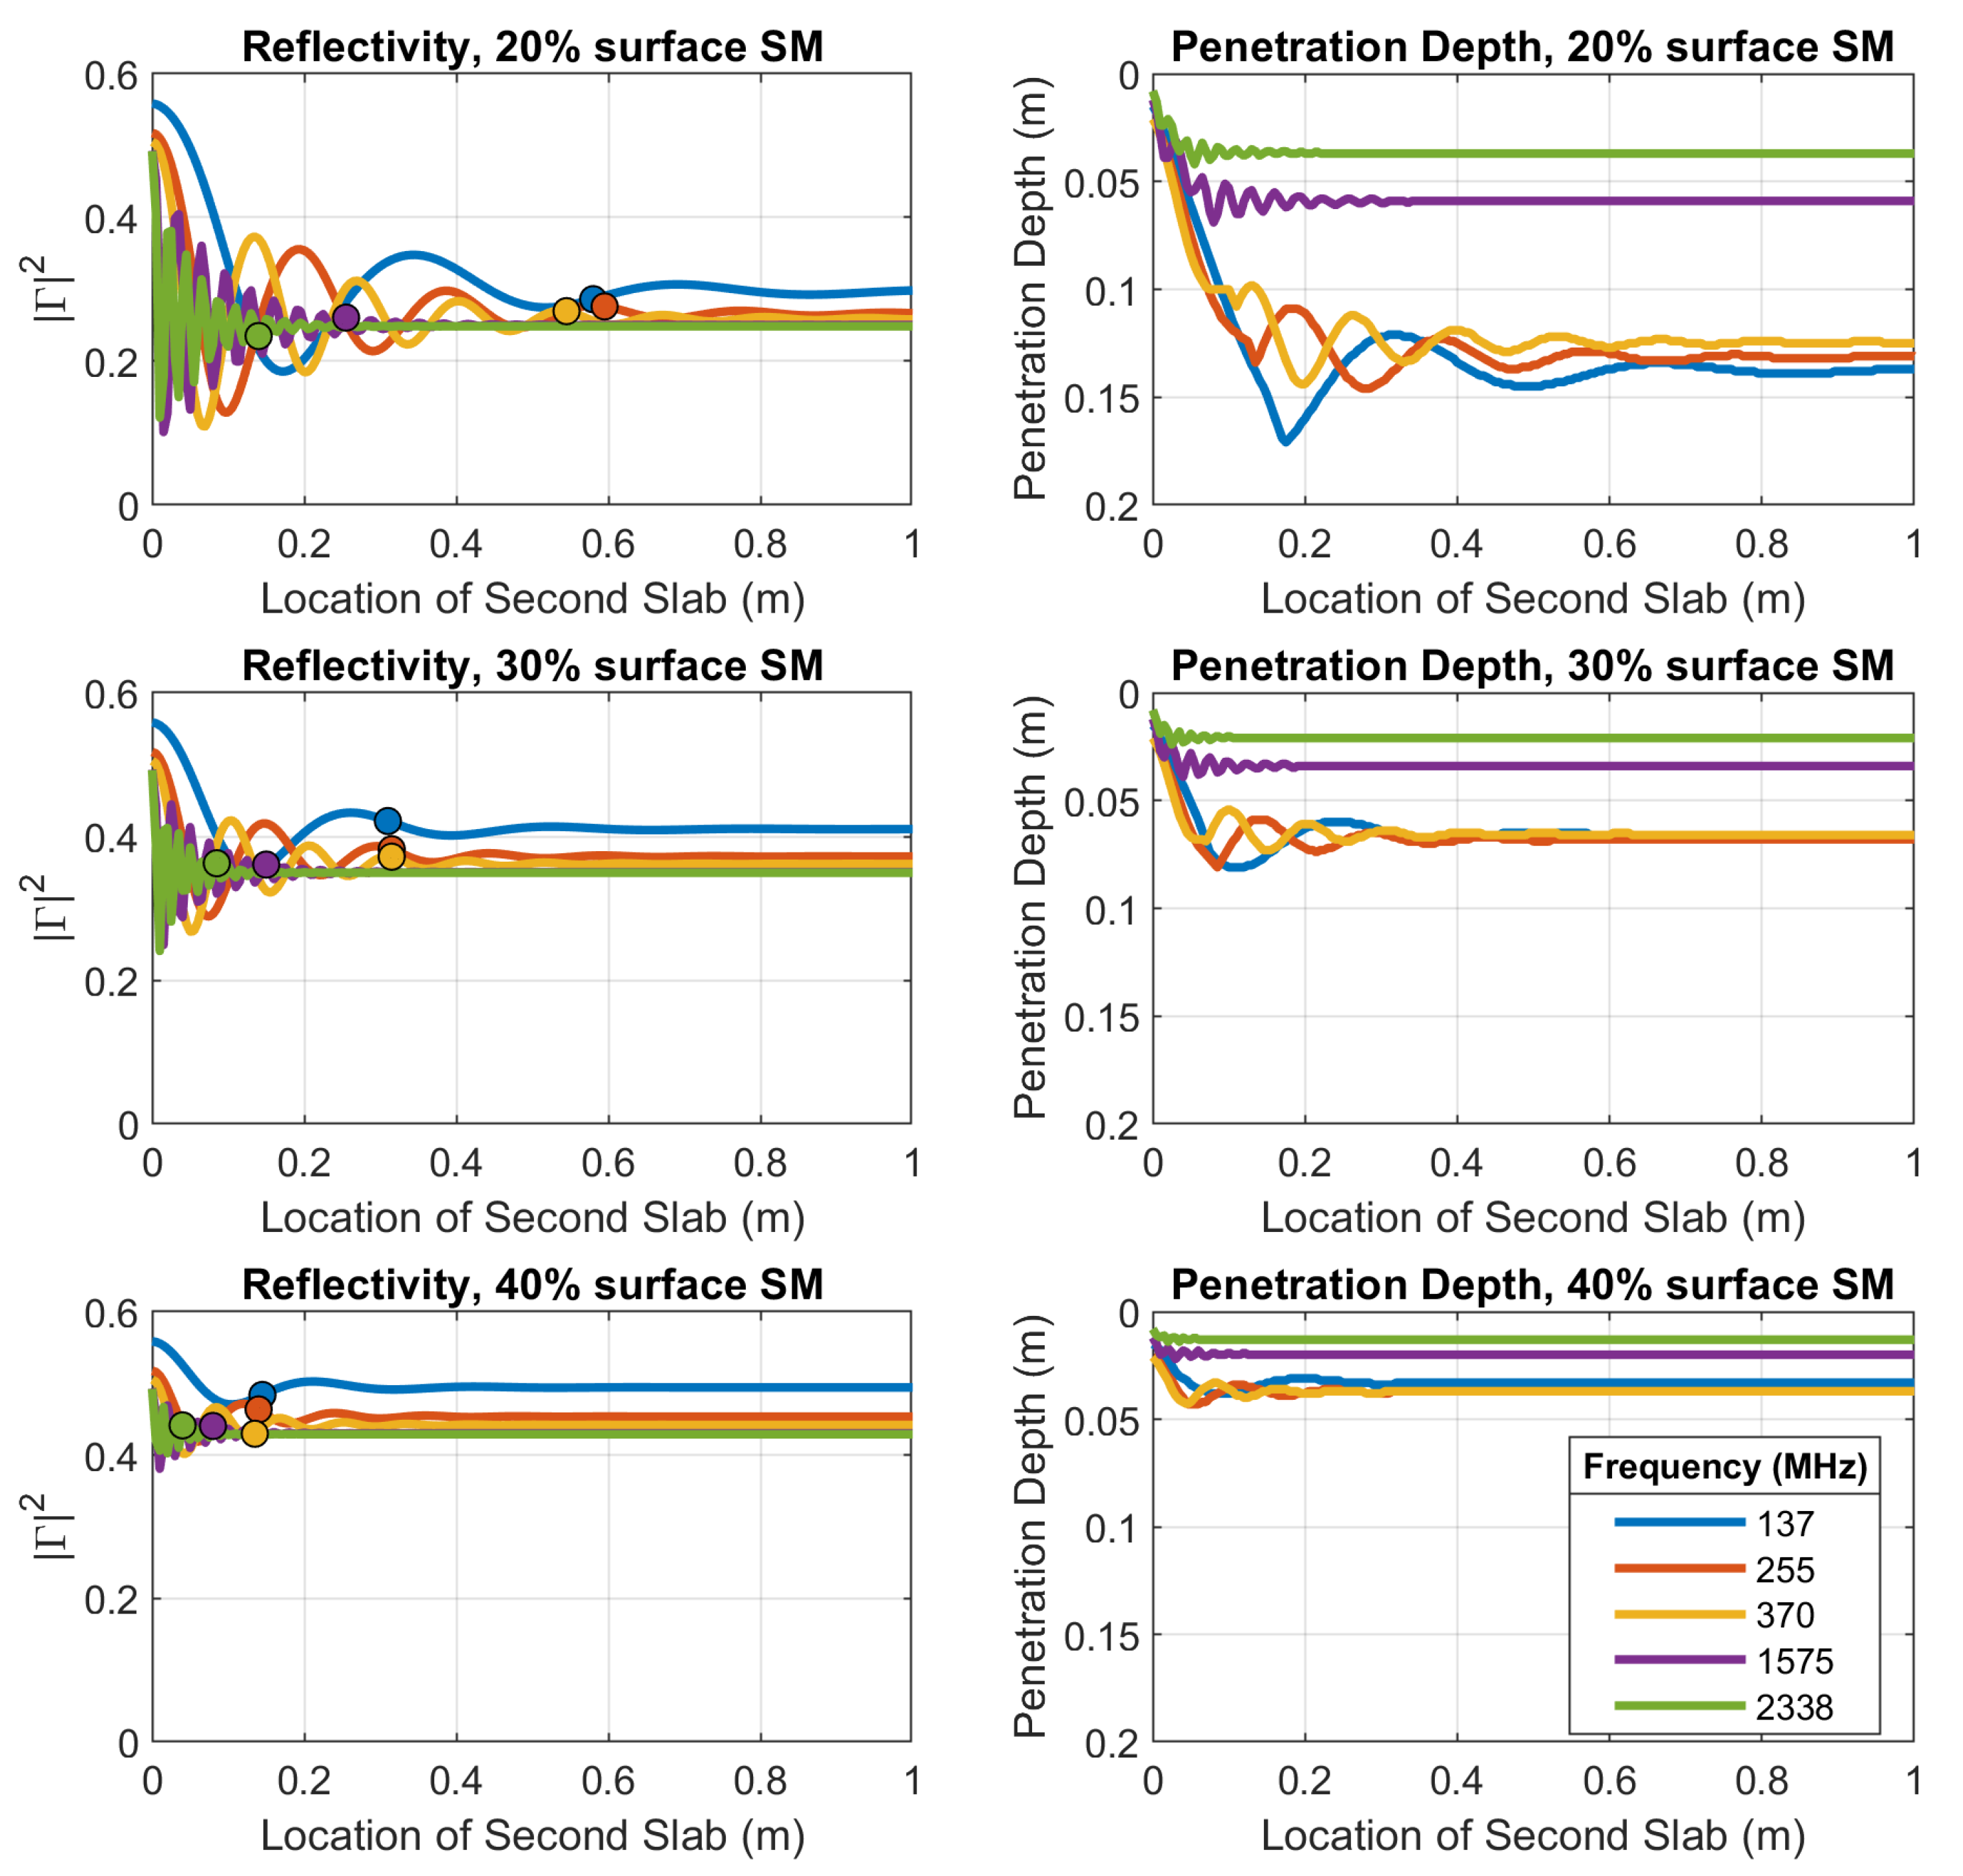
Using the saturation depth methodology described in Section 3, the response of SoOp-R systems at frequencies of 137.5, 255, 370, 1575.42, and 2338.75 MHz is simulated over a series of two slab configurations. Simulations are performed where the first slab uses SM values of 20%, 30%, and 40%. The results of this simulation are depicted in Figure 5.
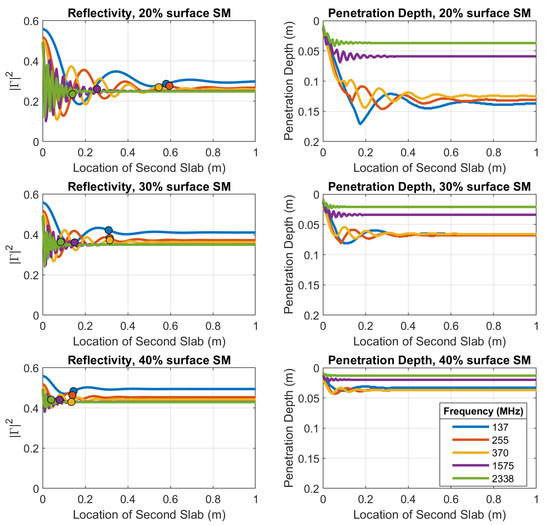
Figure 5.
(Left column) Changes in reflectivity due to moving a secondary slab beneath a single dielectric slab and (right column) the corresponding penetration depth for each dual-slab configuration. Each row assumes that the first slab’s SM value is 20%, 30%, and 40% SM, respectively, and all simulations assume a second slab SM of 50% SM.
In the left column of Figure 5, we observe the change in reflectivity as the second slab of 50% SM descends into the SM profile. The right column shows the penetration depth for each SM profile configuration as a function of the location of the dielectric boundary between the first and second slabs. The resulting reflectivity alternates about the “saturated reflectivity” as a function of depth similar to an attenuating sinusoid. This is expected since propagation effects are the primary mechanism that changes reflectivity in this simulation. However, we note that such strong coherent behavior largely exists due to the simple multilayer waveguide structure used in this simulation and that physical SM profiles may not exhibit this exact behavior.
The dramatic increases in penetration depth seen when the second slab lies within the upper 20 cm of the profile is dominantly driven by the real component of the reflection coefficient approaching zero. This is a property of the coherent nature of the SoOp-R signals. Thus, for specific SM profile configurations, large values of transmission occur whenever the phase of the reflected signal causes either the real or imaginary component of the reflection coefficient to trend towards zero. For all simulated frequencies, we can observe that variations in both penetration depth and reflectivity are largely saturated before the configuration reaches 1 m in depth.
Using the aforementioned methodology, the colored points along each separate frequency plot in the left column of Figure 5 represent the determined saturation depth. By assuming that our SoOp-R system can detect changes up to in reflectivity, we observe that reflectivity is affected by changes in dielectric constant occurring at depths deeper than the penetration depth shown in the right column of Figure 5 as well as the penetration depth provided by Equation (6). For example, values at 370 MHz under a 20% SM slab are expected to have a penetration depth of 17.9 cm using the traditional penetration depth equation for a single slab (Equation (6)). However, by moving a secondary slab beneath this surface slab, we observe SoOp-R responses up to 54.5 cm.
Overall, these results suggest that despite the dominantly frequency-independent nature of SoOp-R measurements in relation to SM content, different frequencies are capable of observing changes in reflectivity values based on frequency-dependent propagation and matching properties of a wave traveling through a multilayered medium. Thus, RZSM is potentially measurable by a SoOp-R system by using different wavelengths. Although the method of determining a “saturation depth” would be more difficult to apply to SM profile configurations that are more complex than a two-slab structure, the general insights obtained show that the contributing area of reflections can extend beyond the penetration depth of a profile. If multiple frequencies can be leveraged, values within the SM profile can potentially be obtained through inversion techniques based on differences in the coherence of the observed reflectivity.
4.2.2. Frequency and Angle Response of Dual Slab Configurations
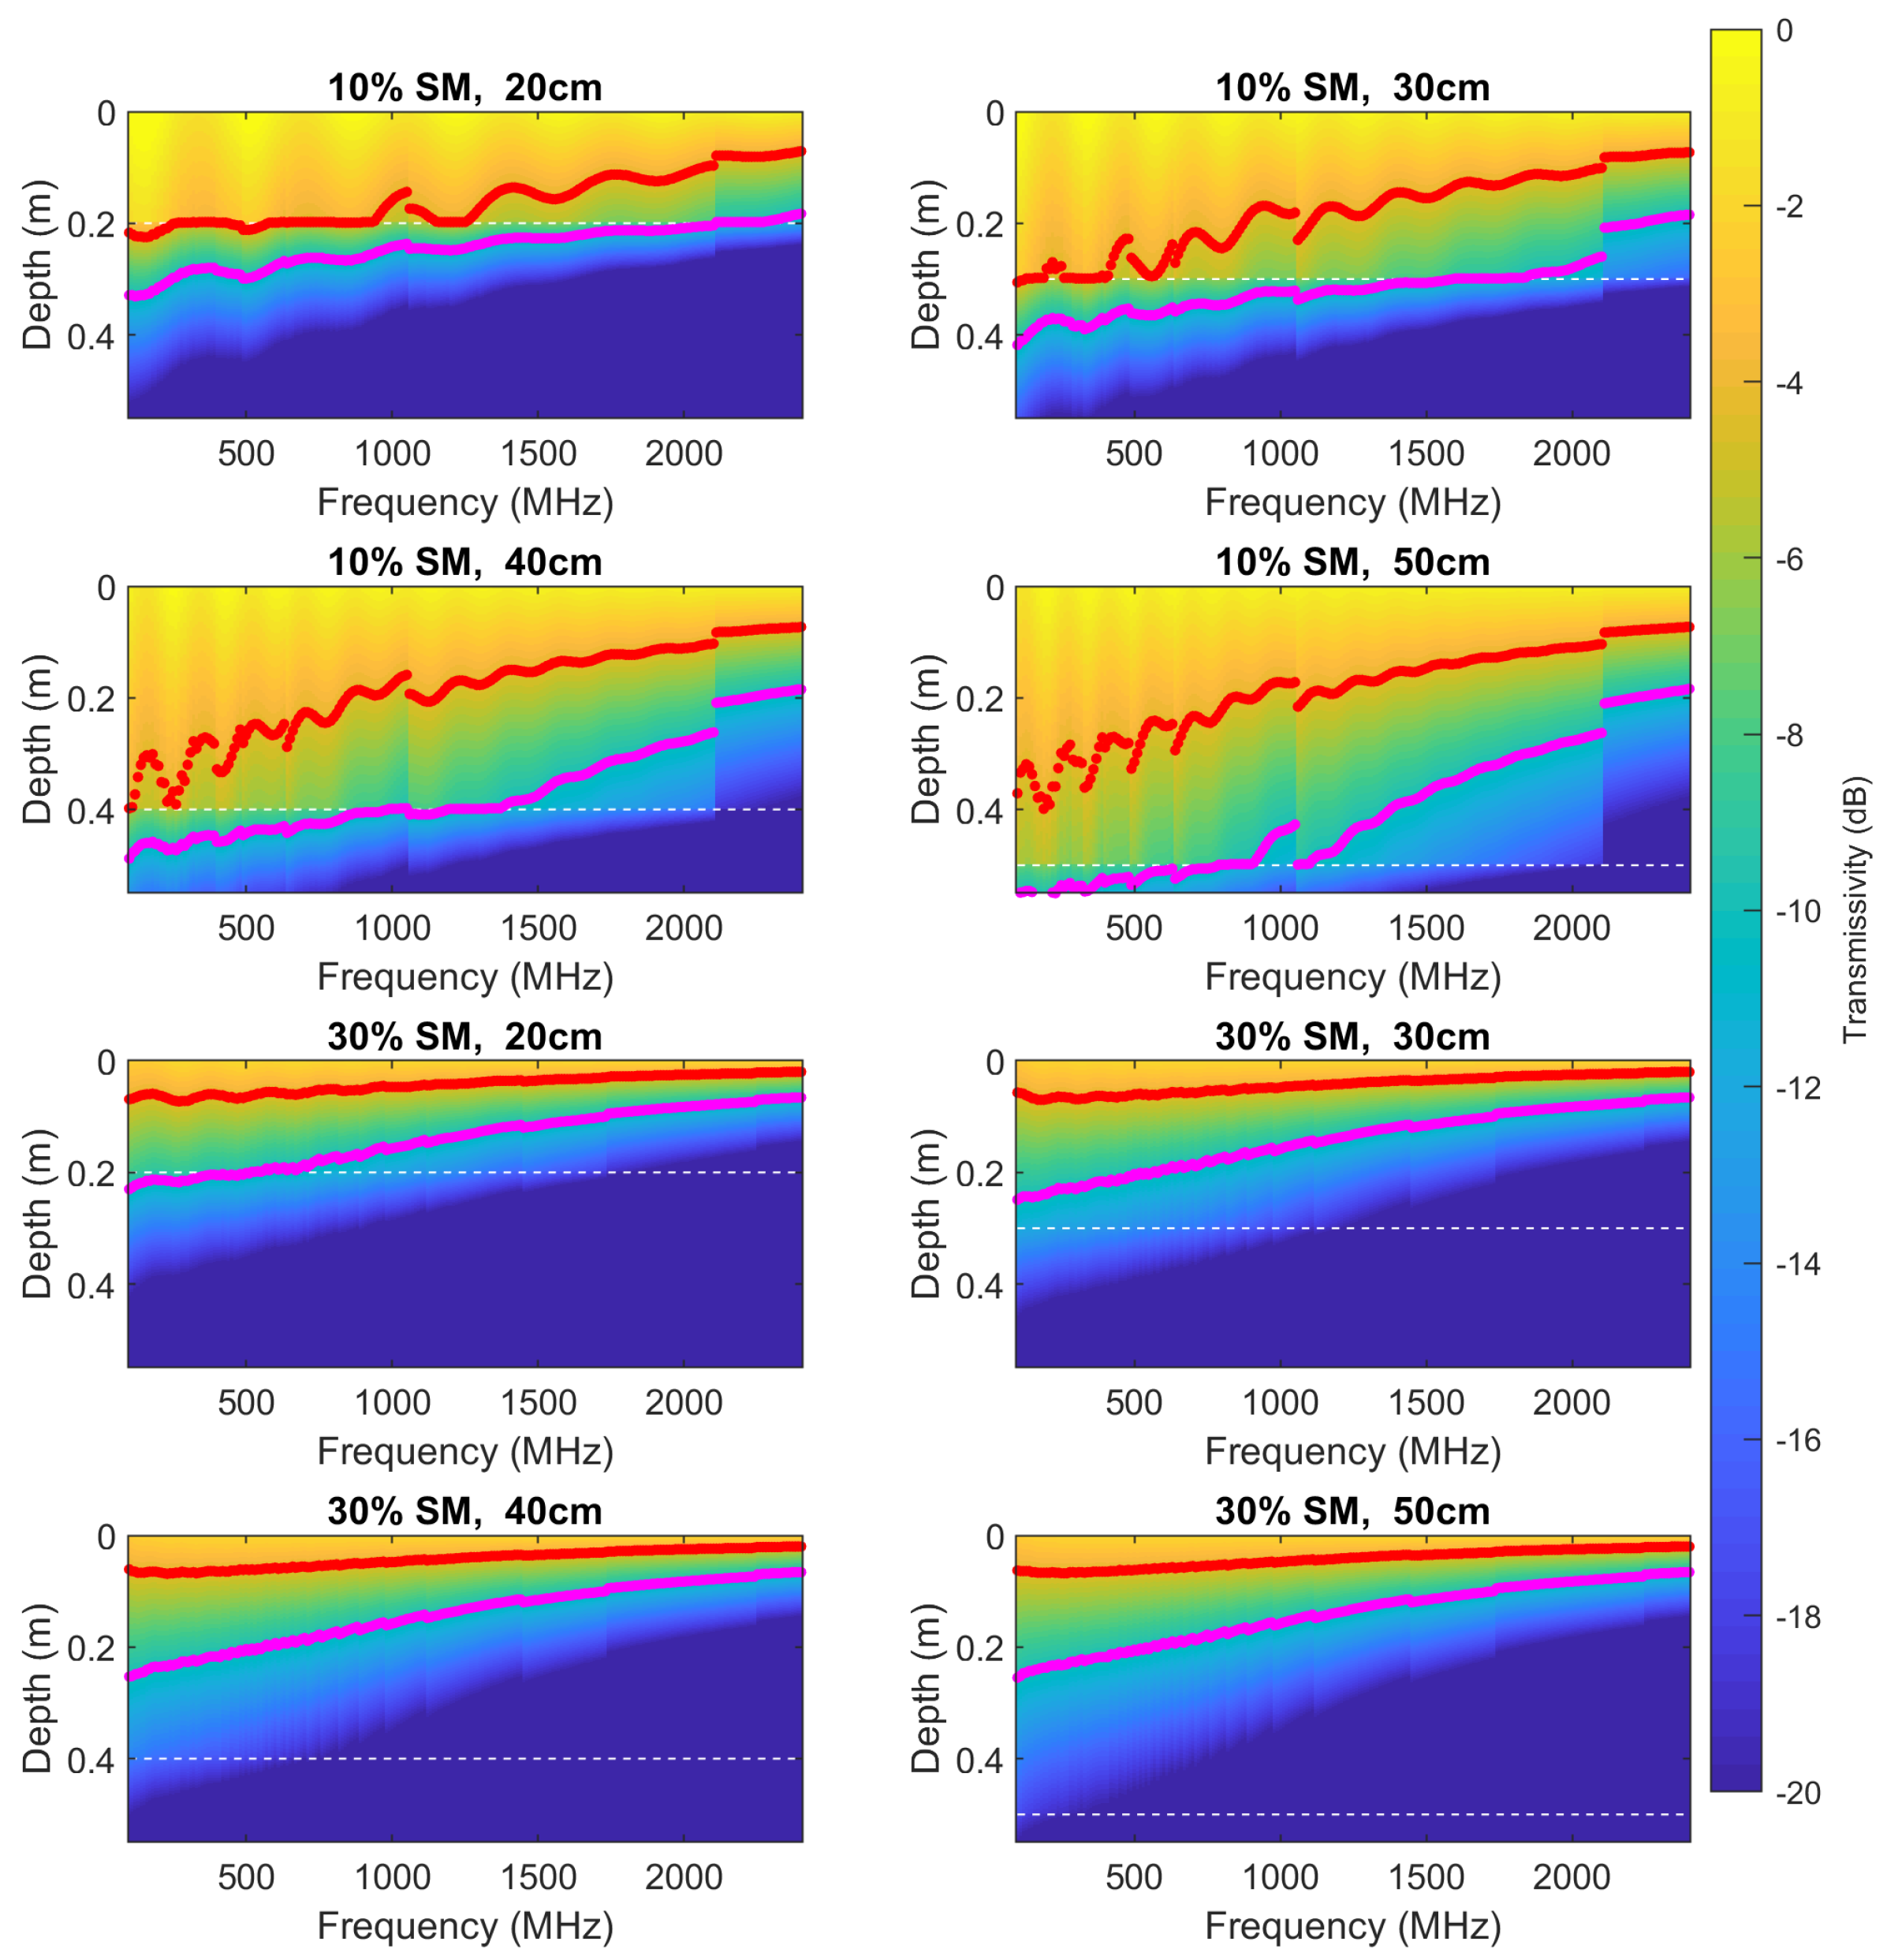
Figure 6 depicts the a heatmap of the transmissivity for a frequency sweep of four distinct SM profiles. The white line denotes the location of the second layer across each simulation, and the red curve denotes where the energy has fallen to the level considered to be the penetration depth (4.3 dB). Additionally, the magenta line shows the location where the energy has fallen to 10% (−10 dB). For the color axis, the transmissivity of the incident signal is depicted and is bounded between 0 and −20 dB in order to visualize certain coherence properties of this study.
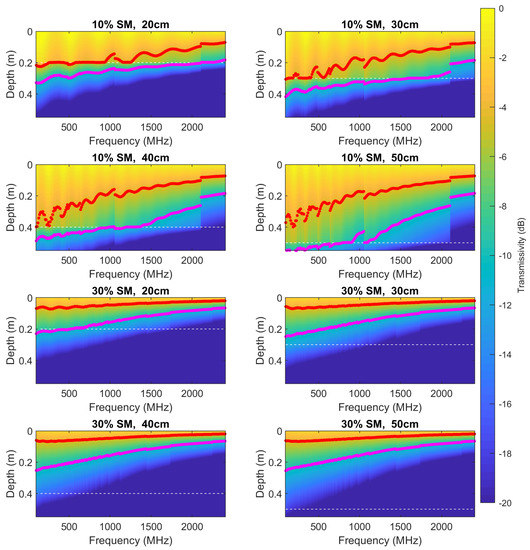
Figure 6.
Frequency sweep of four two-layer profiles. The white lines represent the location of the second layer, the red line represent the penetration depth of the configuration, and the magenta line depicts where the transmittance reaches 10% of its original energy. The first slab SM is 10% for the upper four subplots and 30% for the lower four subplots. The second slab SM is 50% for all subplots.
For lower frequencies, the penetration depth occurs near the location of the second dielectric slab. Across the frequency sweep, we can visualize the effects of phase thickness in the calculation of the reflection coefficient. As the high dielectric constant value descends into the profile, the transmittance of the signal oscillates more rapidly across the frequency spectrum. When the SM of the upper layer is increased, we observe higher signal attenuation in addition to faster oscillation across the frequency spectrum.
Across each subplot, the color bar visualizes the energy of the signal up to the point where 1% (−20 dB) of the energy from the surface remains. It can be observed across the frequency sweep that the transmitted energy and penetration depth varies as a function of frequency despite the previous simulations showing frequency-independence. The coherency effects which cause the penetration depth to fluctuate are largely suppressed at frequencies above L-band for all simulations, and this fluctuation can be further suppressed by increased SM content or larger distance between areas of dielectric contrast. This indicates that, regardless of coherence effects, the use of different frequencies can be leveraged to sense subsurface changes in dielectric constant given a sufficiently sensitive SoOp-R system.
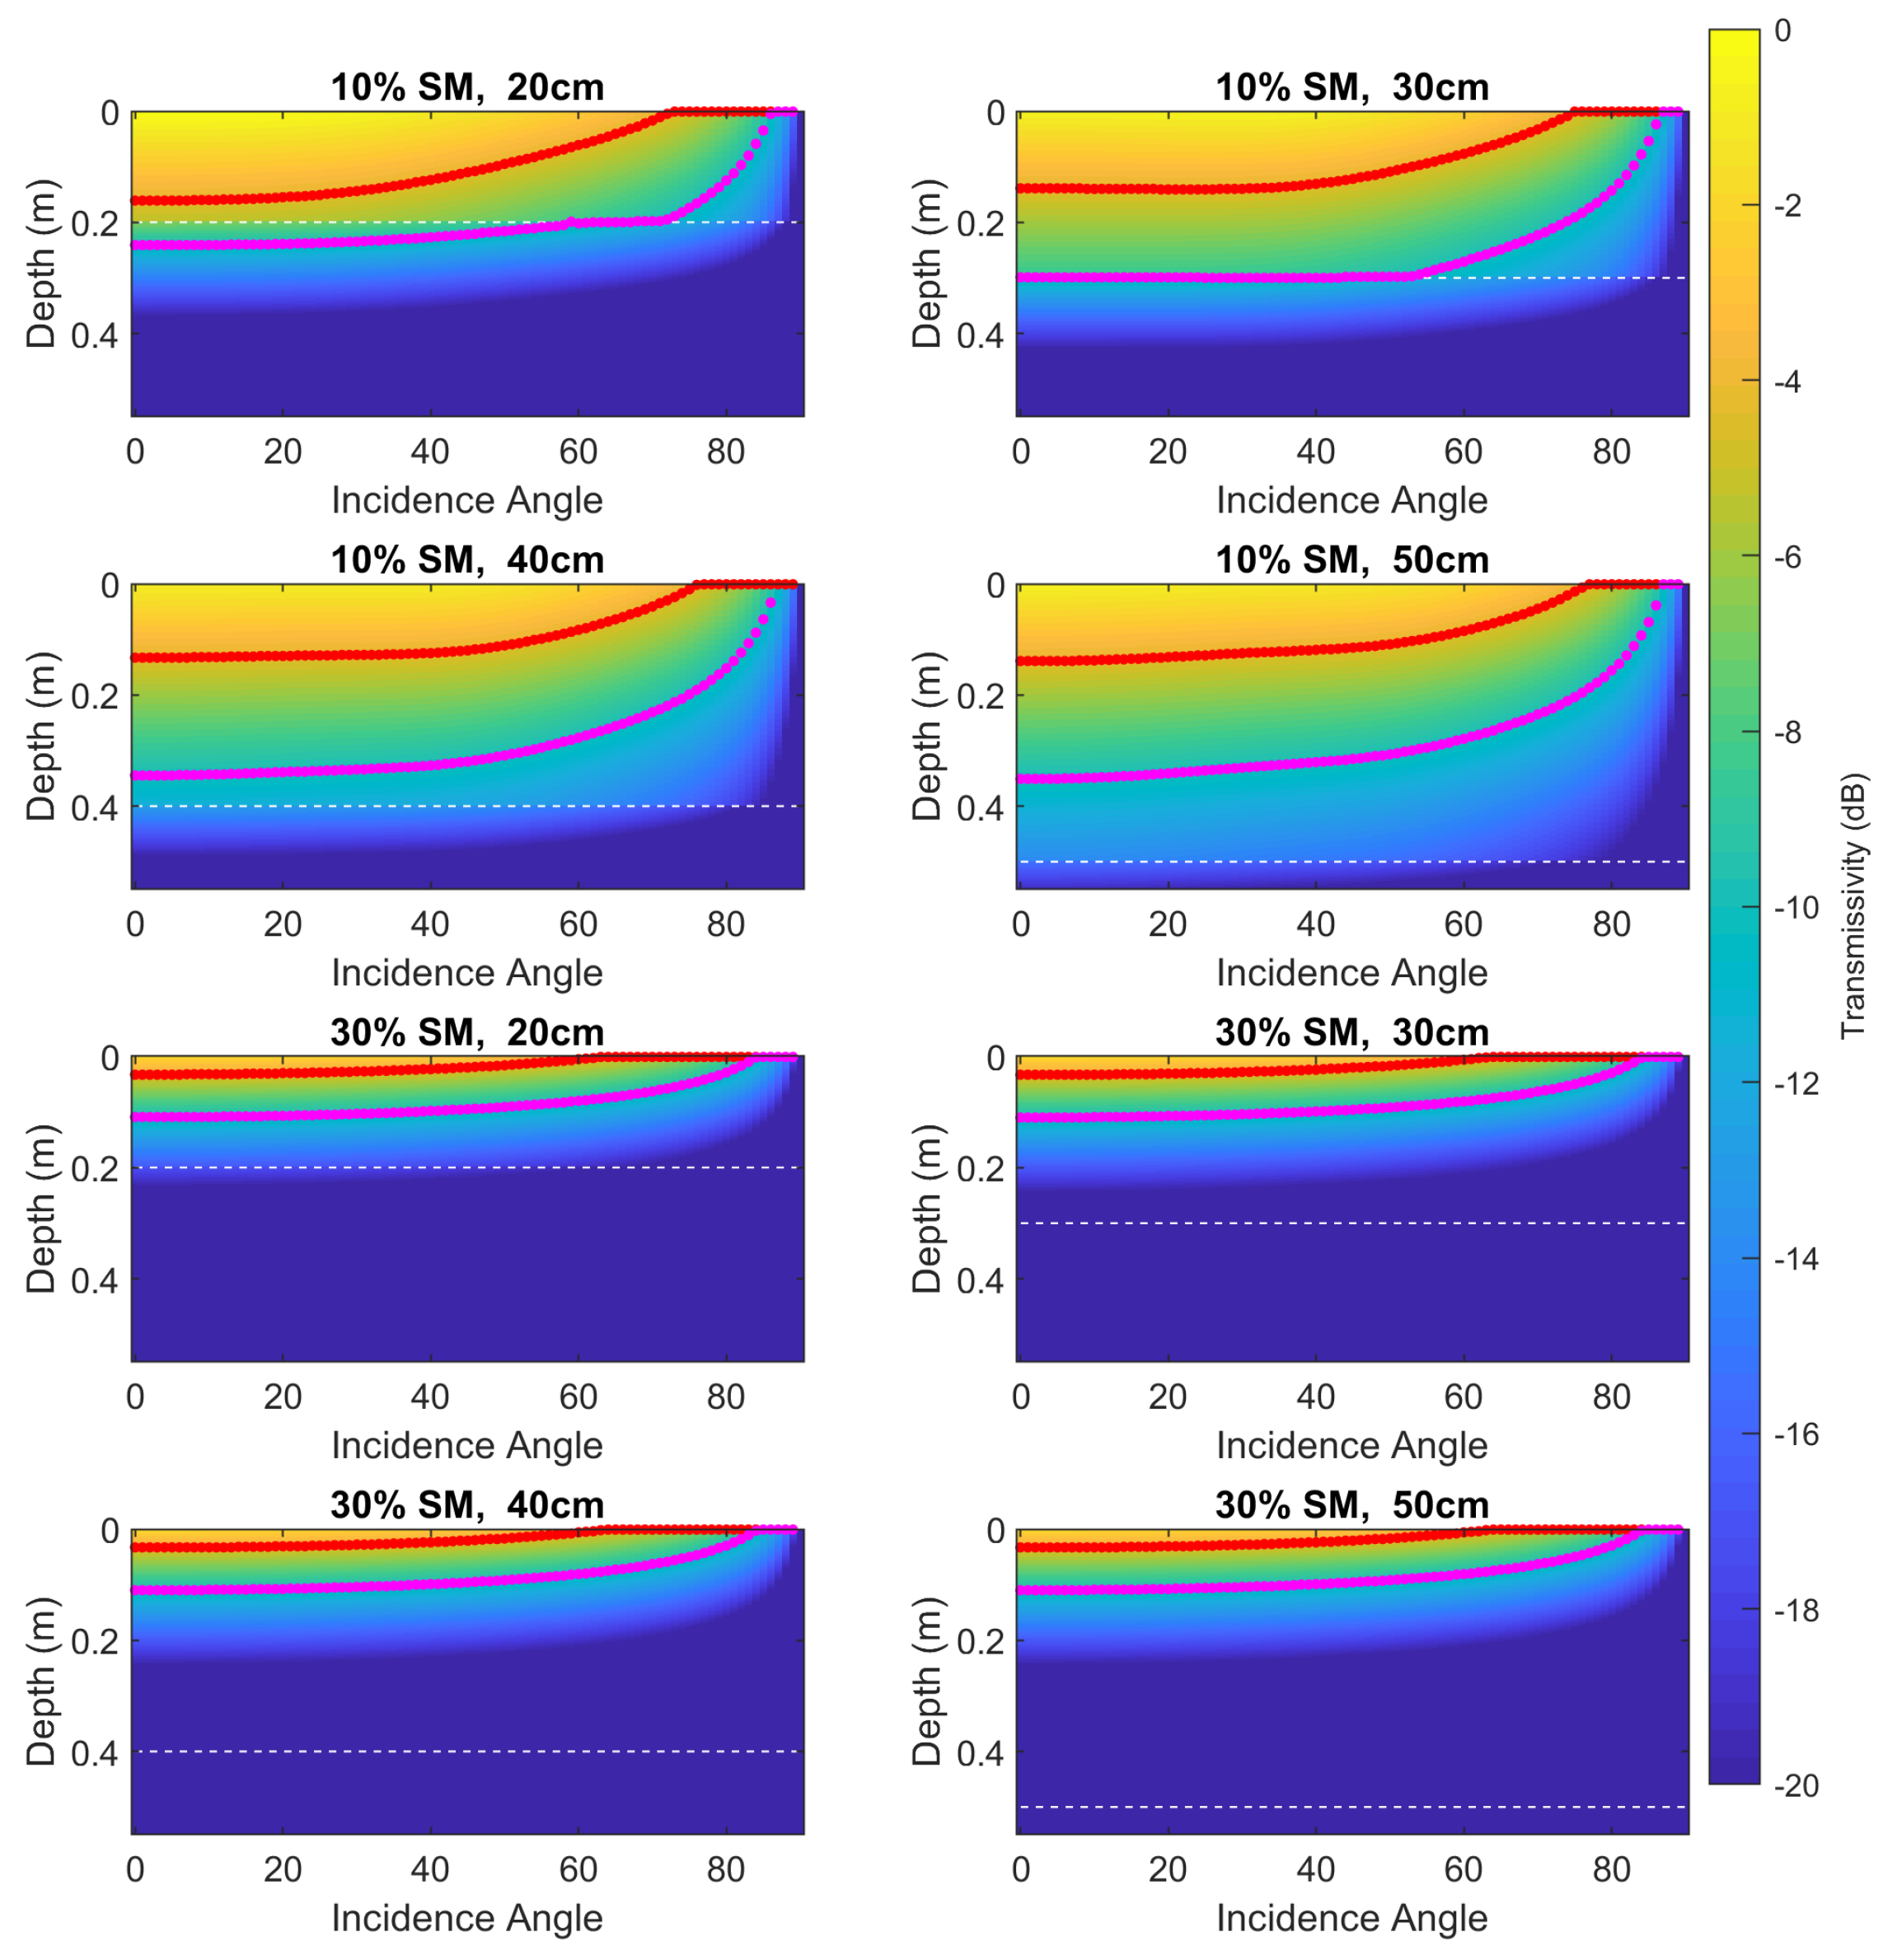
In addition to this frequency sweep, we visualize the transmissivity and penetration depth of a 370 MHz signal as a function of incidence angle as depicted in Figure 7. Across all slab configurations, we observe that the penetration depth rapidly approaches zero around 70° incidence. This aligns with many experiments which ignore observations near 70° incidence. Though not depicted, simulations show that the general trend of the effect of changing incidence angle does not vary with frequency. Thus, the significance of different incidence angles for a given profile is that it reduces the total transmissivity of the signal into the SM gradient and, therefore, reduces the contributing area of the SM profile towards the receiver.
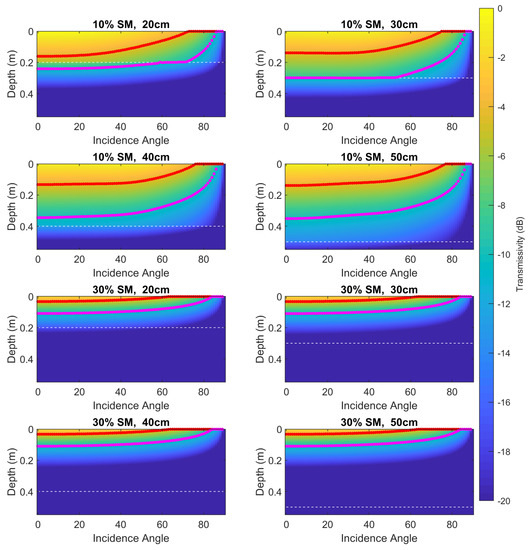
Figure 7.
Incidence angle sweep of four two-layer profiles at 370 MHz. The white lines represent the location of the second layer, the red line represent the penetration depth of the configuration, and the magenta line depicts where the transmittance reaches 10% of its original energy. The upper slab SM is 10% for the upper four subplots and 30% for the lower four subplots. The second slab SM is 50% for all subplots.
4.2.3. Clay Content Response to Dual Slab Configurations
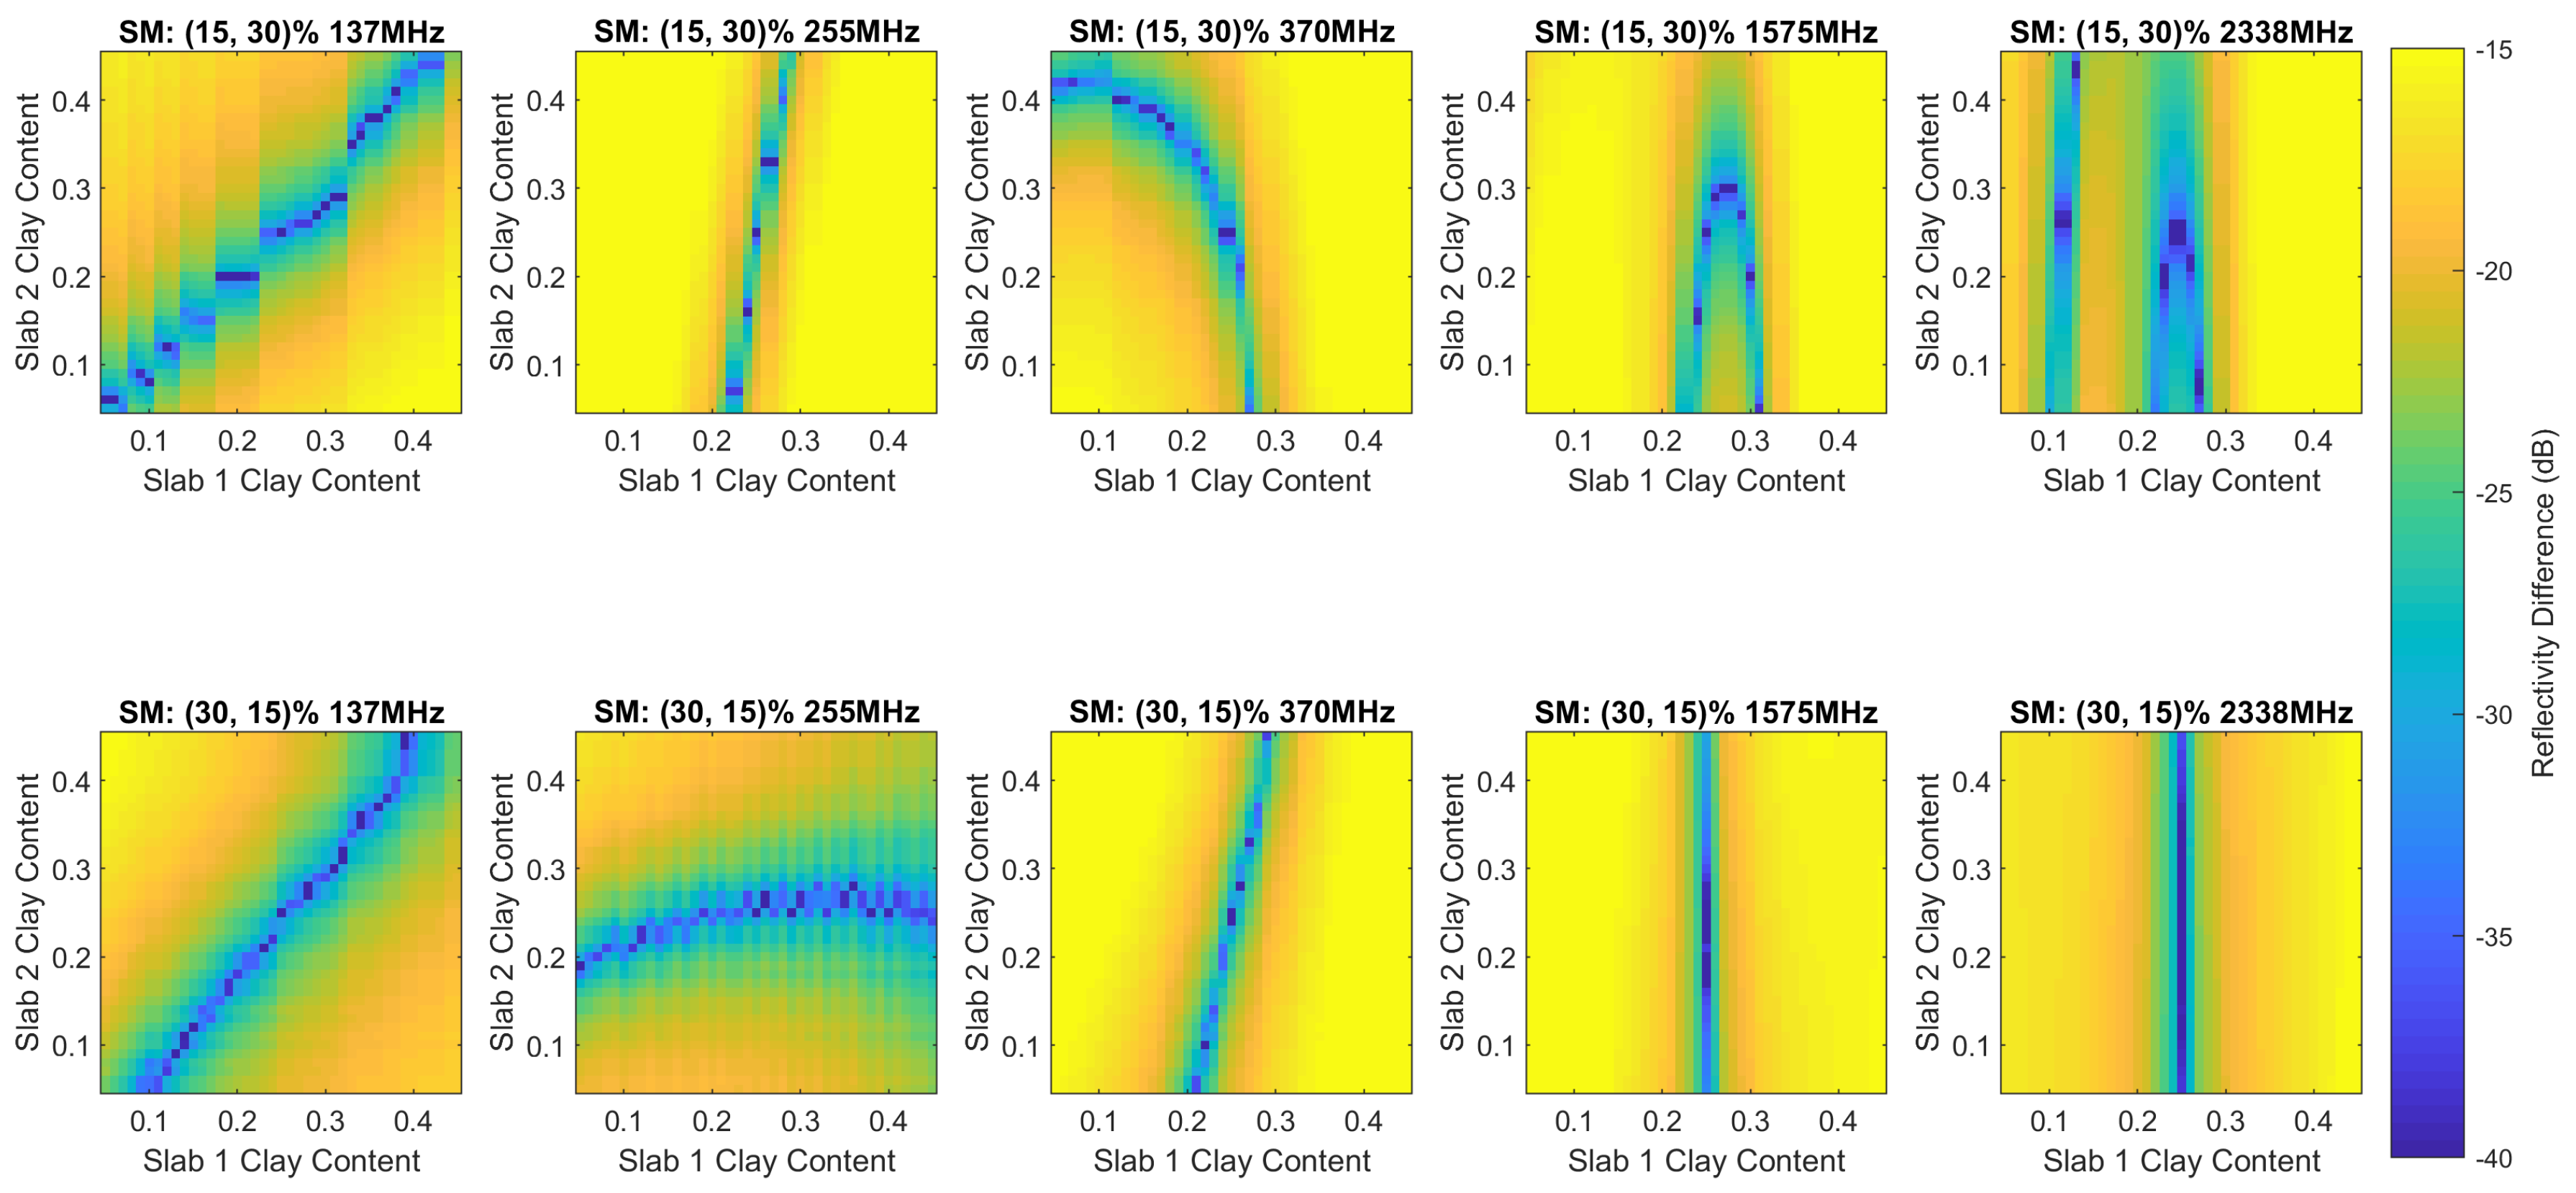
Figure 8 depicts the difference between multiple clay content combinations and the reflectivity of a dual slab configuration at 25 % for the first and second soil slabs. The center pixel of each image in Figure 8 shows a value of zero in natural units ( in dB), and all surrounding pixels show how reflectivity differs from the configuration at the center pixel. However, the color bar has been fixed to a range of −40 to −15 dB to show meaningful data. These values are plotted for each of the five frequencies at 137.5, 255, 370, 1575.42, and 2338.75 MHz for two distinct SM slab combinations. The top row of subplots shows a configuration of 15% SM for Slab 1 and 30% for Slab 2. The second row of subplots shows a configuration of 30% SM for Slab 1 and 15% for Slab 2.
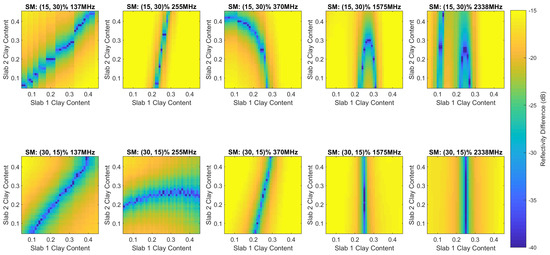
Figure 8.
Relative difference between reflectivity measurements as a function of clay content within two soil slabs for different frequencies. The upper slab is 15 cm in height, and the second slab is semi-infinite. The top row of subplots show a configuration for SM values of 15% and 30% for Slabs 1 and 2, and the bottom row uses SM configurations of 30% and 15% for Slabs 1 and 2.
Lines of pixels in Figure 8 are displayed which represent largely minor differences in reflectivity values (35 dB.) In most cases, these largely similar reflectivity values can be created by simultaneously varying the clay content of both Slab 1 and Slab 2. However, for higher frequencies and higher SM content, the reflectivity measurements will be insensitive to the second slab. This behavior is exhibited in the two lower-right subplots for surface SM of 30% and frequency values of 1575 and 2338 MHz. It can be seen that these lines are all highly dependent on frequency, SM, and clay content.
In general, one can expect higher reflectivity differences for lower SM values due to the dominance of the SM parameters contributions on the dielectric constant. Beyond this observation, simple relationships between reflectivity and clay content are difficult to quantify for the Mironov model. This is because increasing clay content will generally lower the soil dielectric contrast and increase its loss factor. The joint effects of SM and clay are nonlinear, and this behavior produces the nonlinear lines of pixels below dB.
4.3. Arbitrary Profile
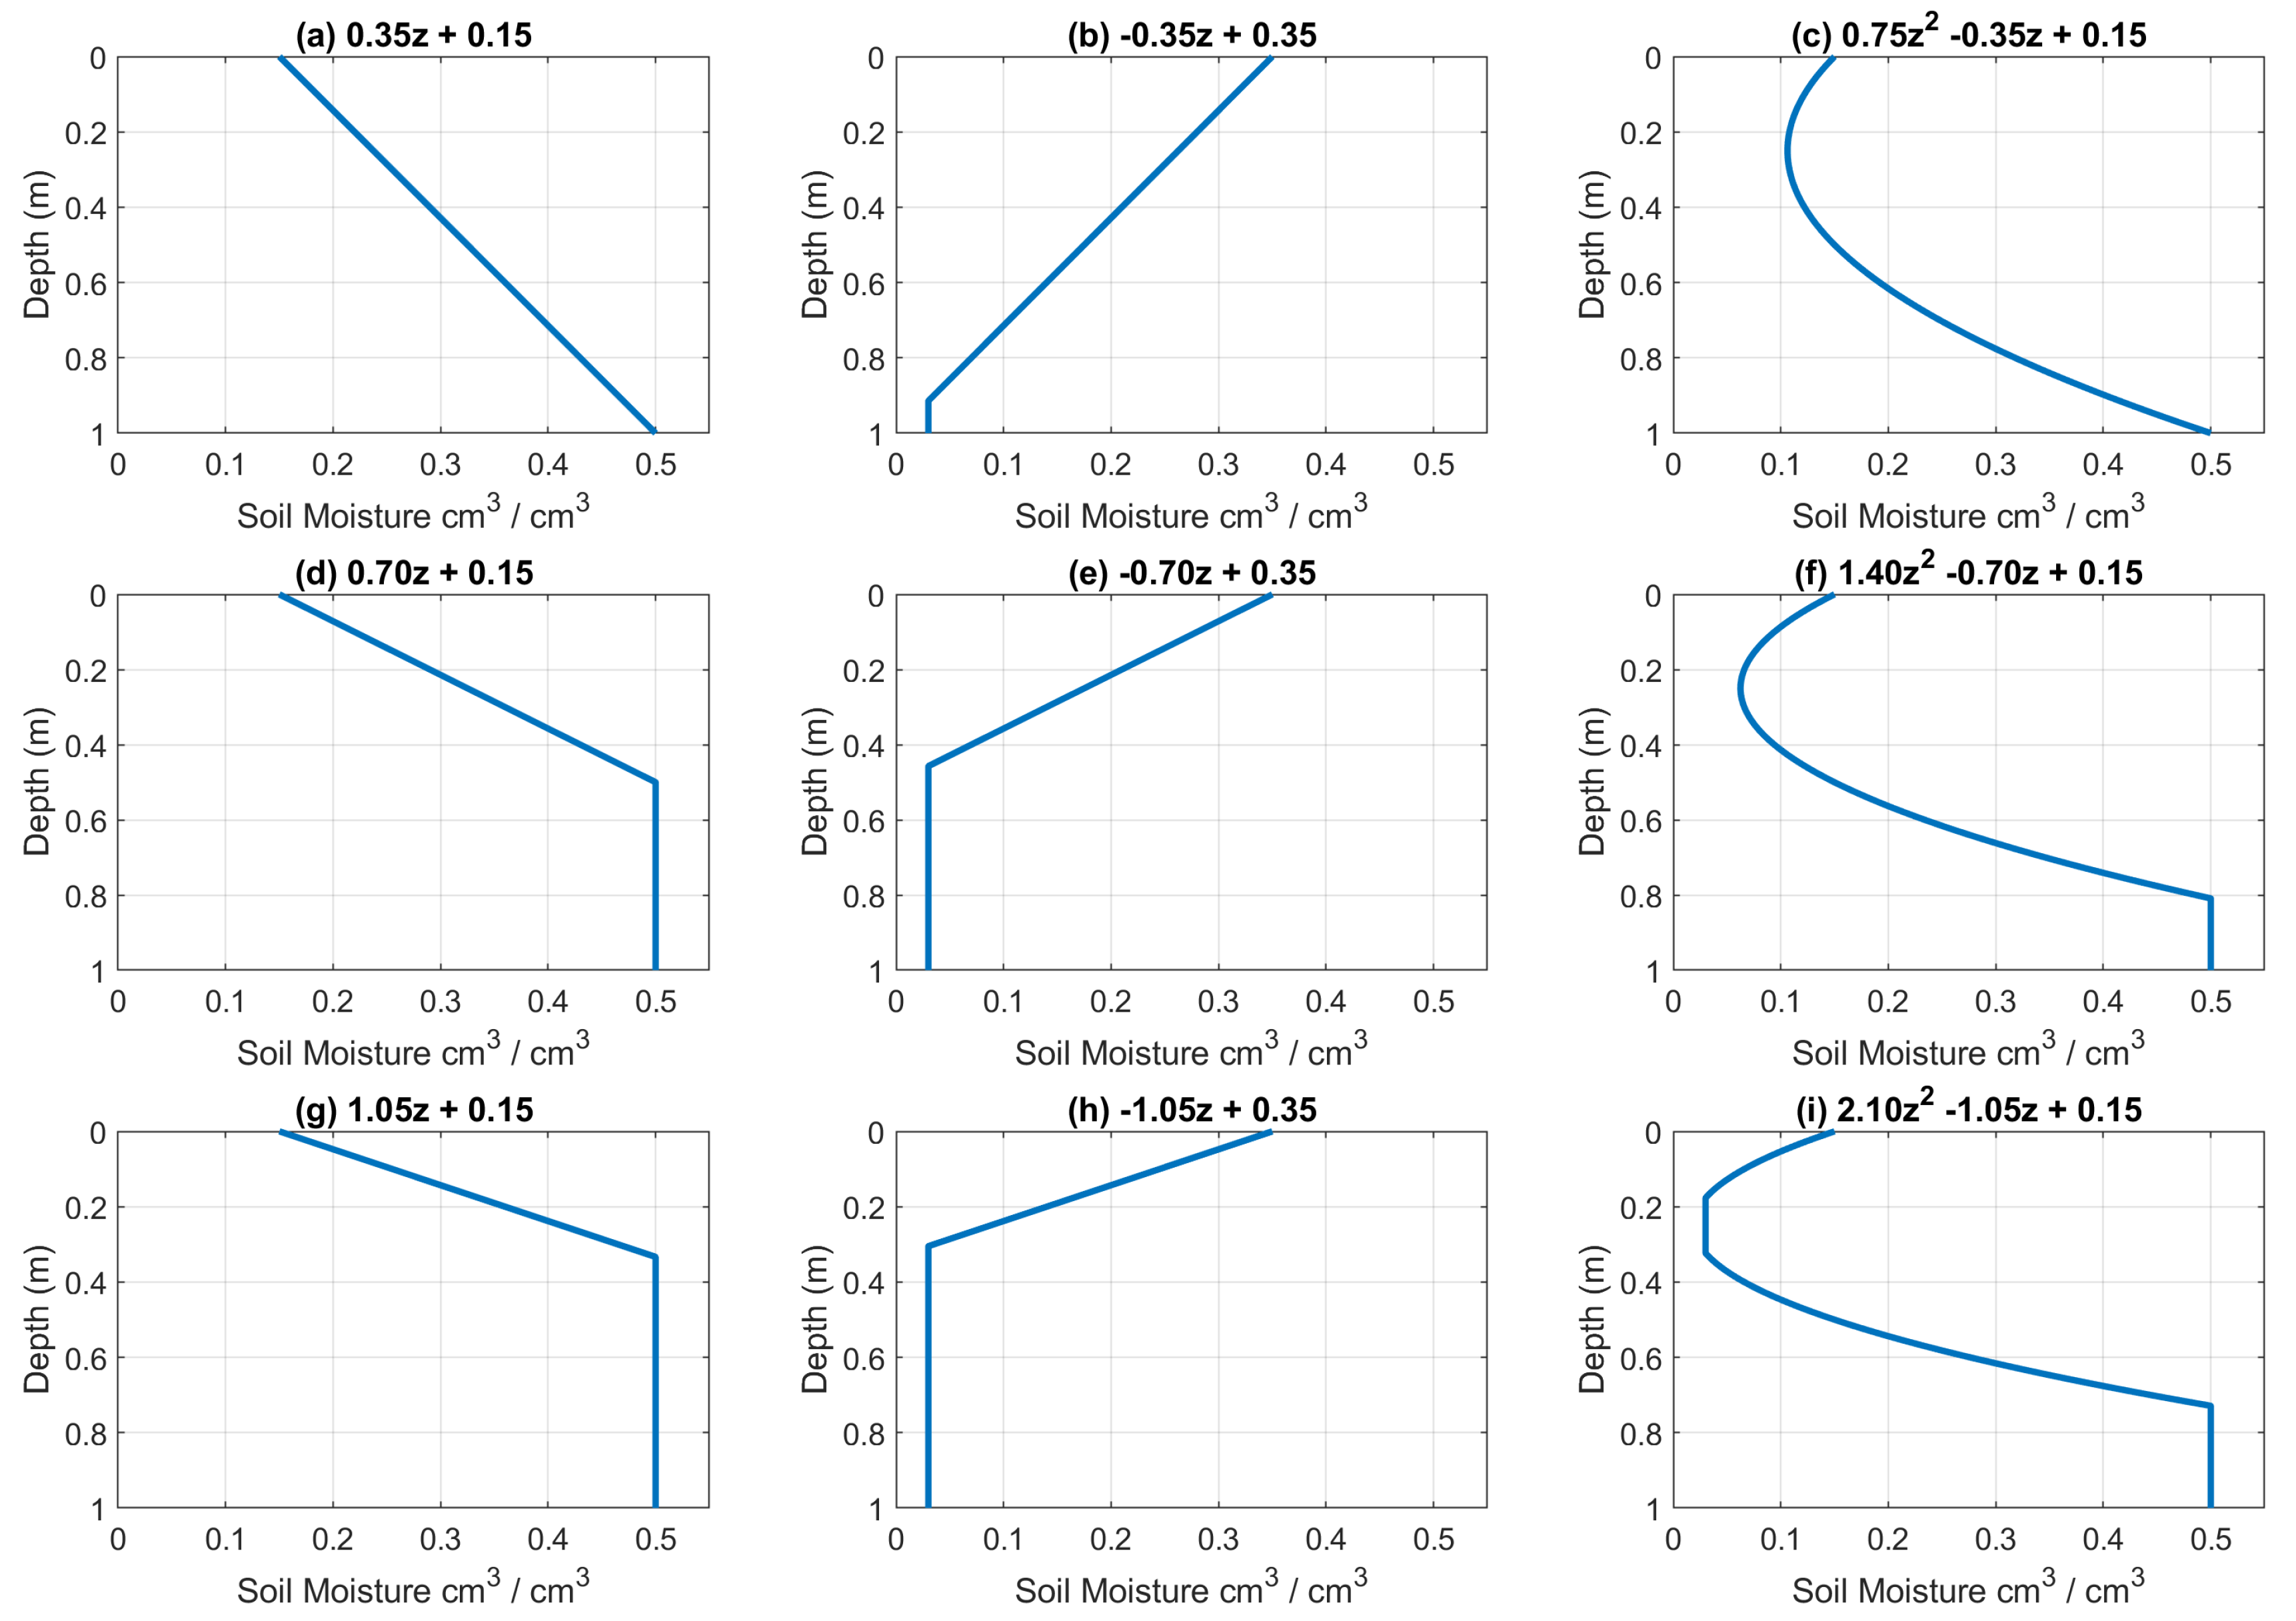
Figure 9 depicts nine different SM profiles which vary as a function of depth. Figure 9a,d,g depicts a linear, wetting SM profile. Figure 9b,e,h depicts a linear, drying SM profile. Figure 9c,f,i depicts a second-order polynomial curve for a SM profile fit. Figure 9i displays the upper and lower SM boundaries as discussed in Section 3.3. Each subplot indicates the polynomial coefficients used to create the depth-dependent SM profile using Equation (8).
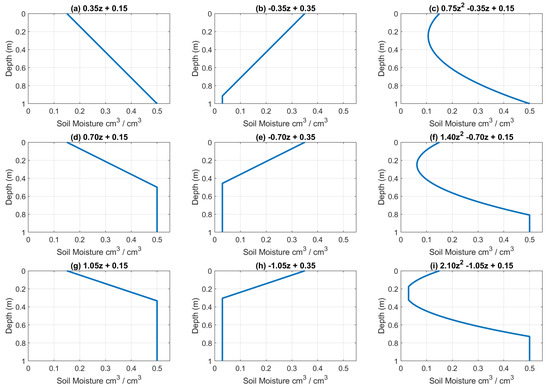
Figure 9.
Example soil moisture profiles represented by polynomial-based equations indicated by the title of each subplot: (a,d,g) positive, linear soil moisture profiles; (b,e,h) negative, linear soil moisture profiles; and (c,f,i) second-order polynomial fits.
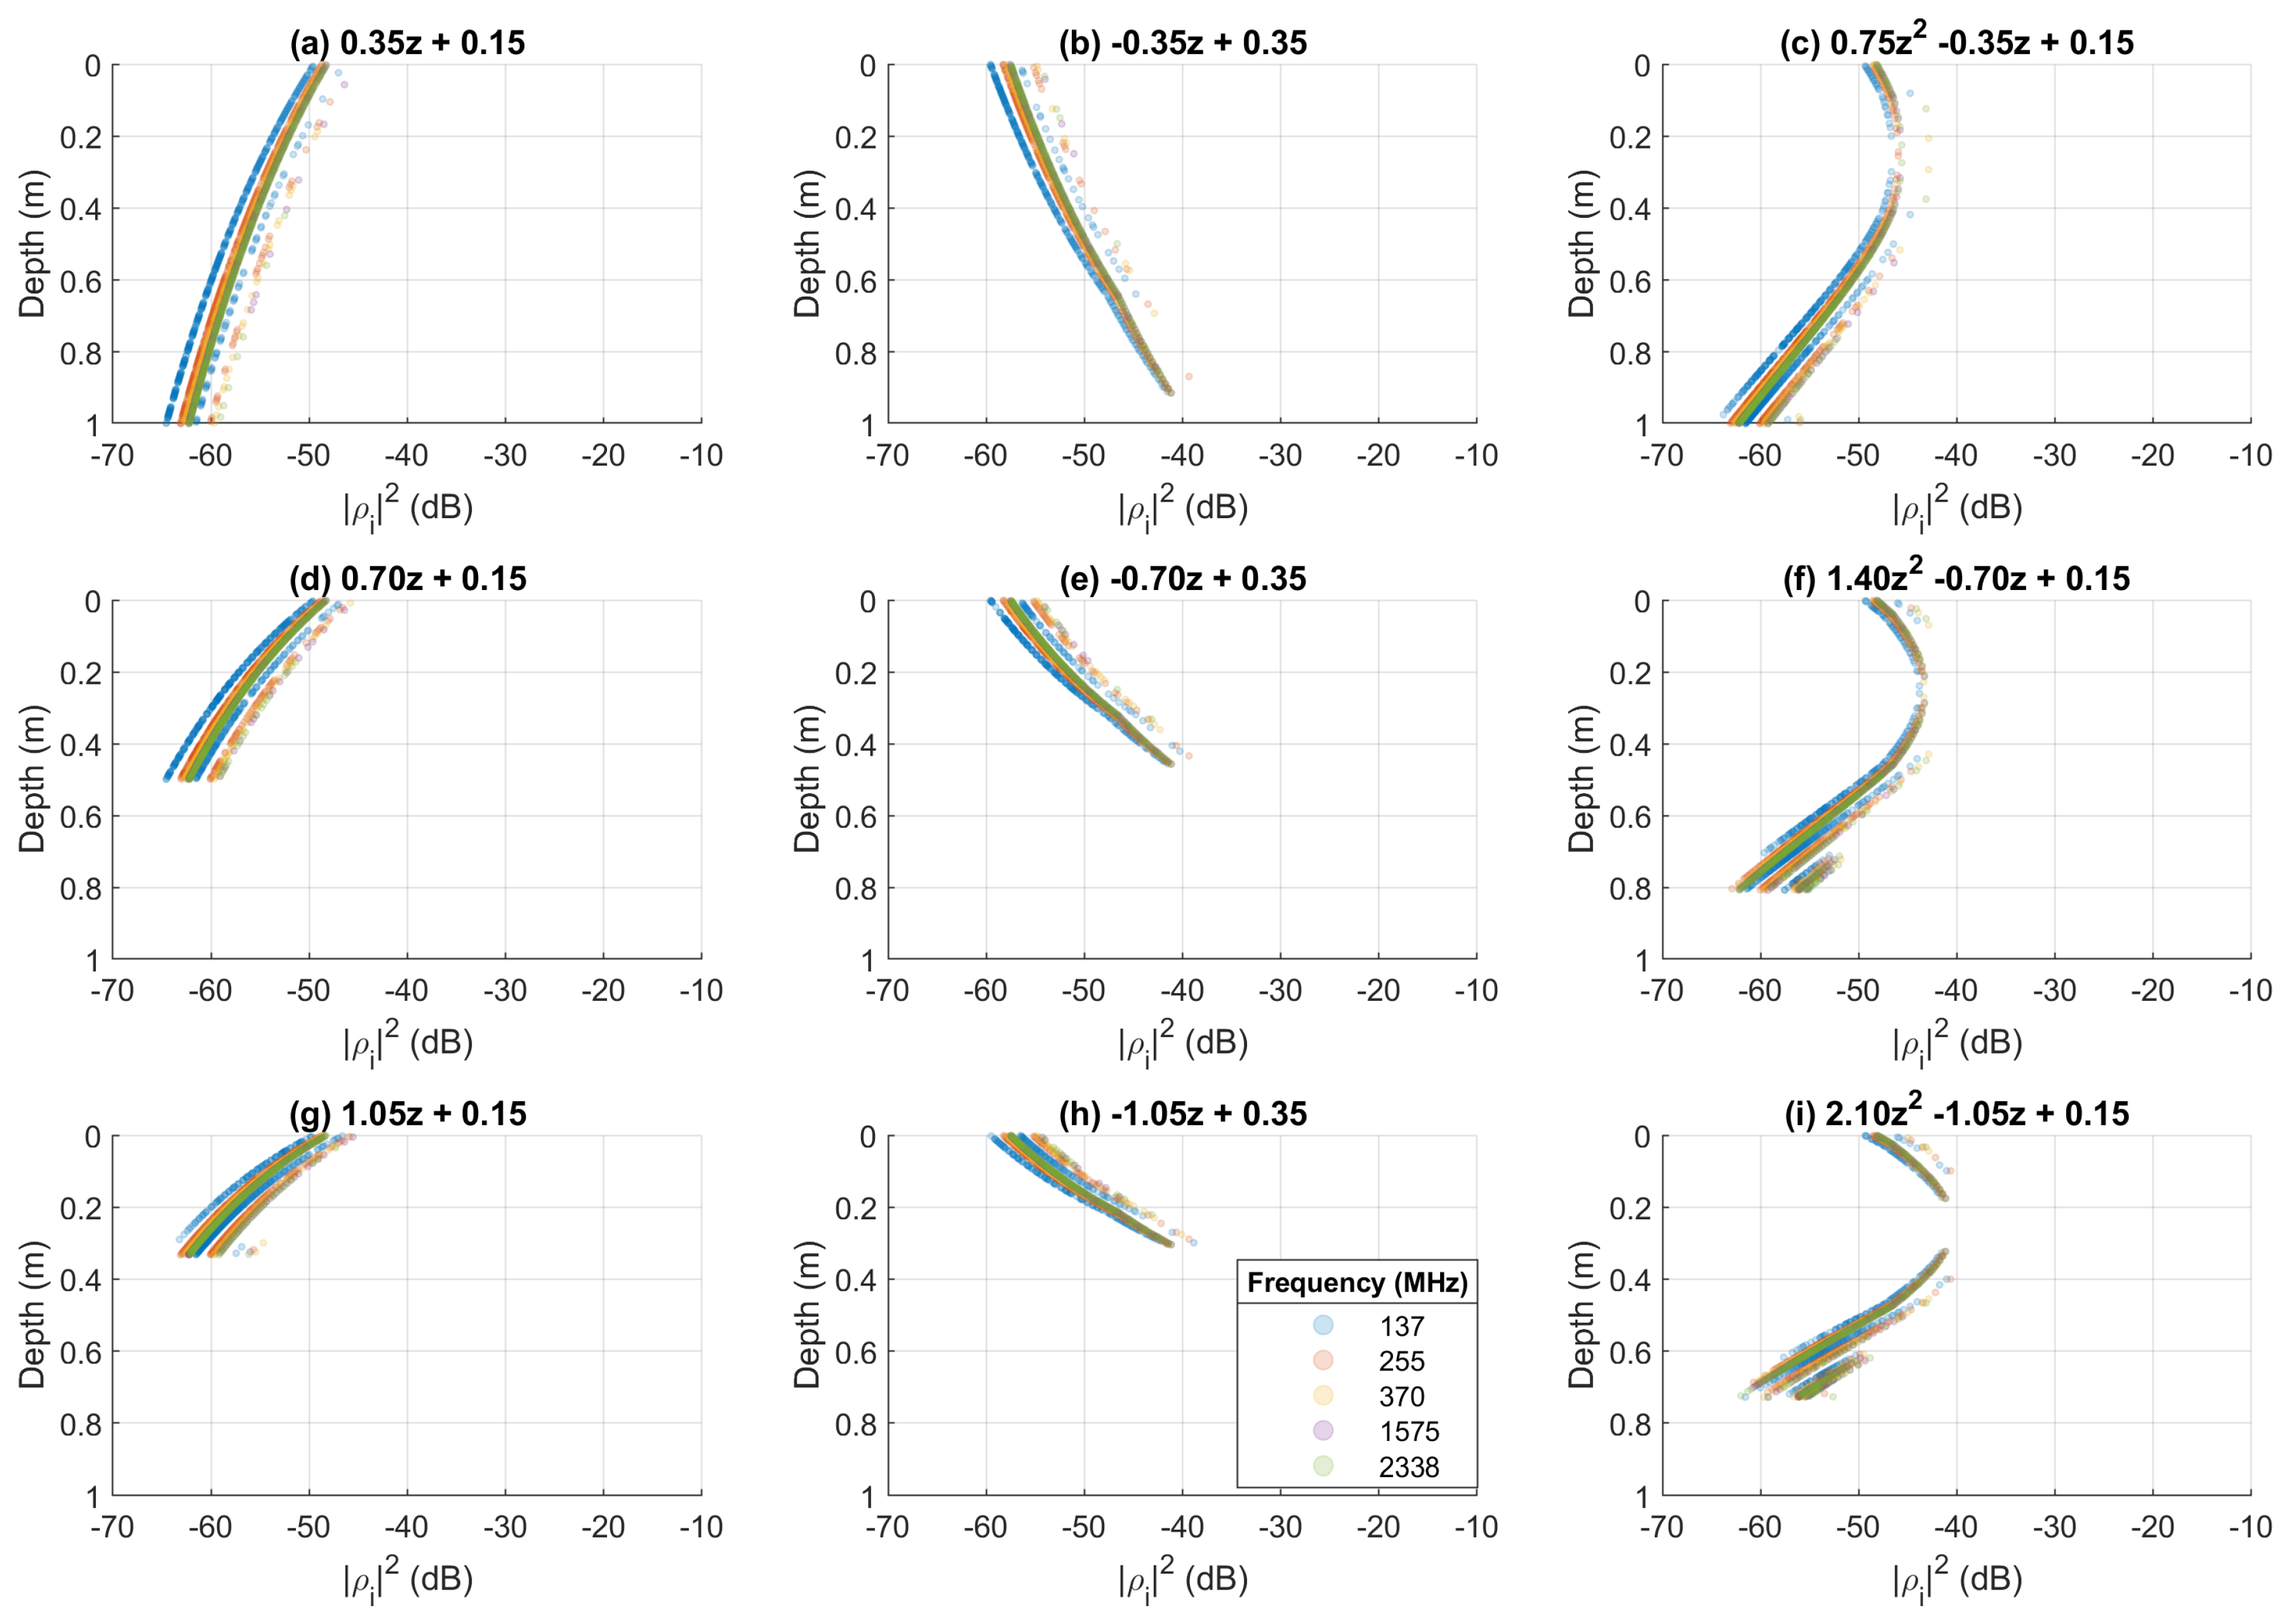
From these SM profiles, we calculate the elementary reflection coefficients between dielectric boundary layers in the subsurface of the SM profile in Figure 10. The primary driver of elementary reflection coefficients is the difference, or contrast, between two adjacent dielectric slabs. Because of the high level of discretization used in this study (a new slab every millimeter), the magnitude square of the elementary reflection coefficient values is shown in decibels for easier visualization at low dielectric contrast. Whenever minimal dielectric contrast is present (i.e., adjacent dielectric slabs possess nearly the same dielectric constant value), the elementary reflection coefficient approaches zero. We see that, in all cases, the elementary reflection coefficient value is greater for areas of lower SM content and is lower for areas of higher SM content. With the shape of these elementary reflection coefficients depicted, we now observe how the intermediate solution for the total reflection coefficient of the entire SM profile is determined.
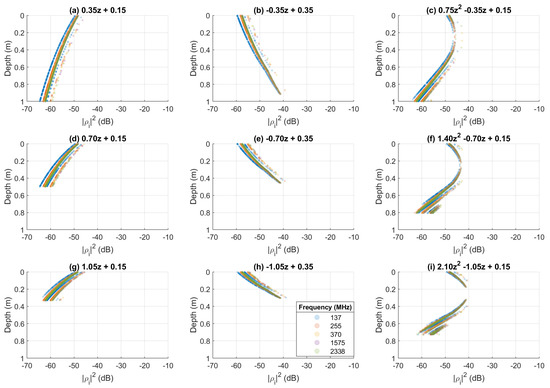
Figure 10.
Elementary reflection coefficient in the subsurface of the soil moisture profiles of Figure 9. Each subplot shares a common legend indicating the frequency of each reflection coefficient. Contributions from the air–surface interface are not depicted.
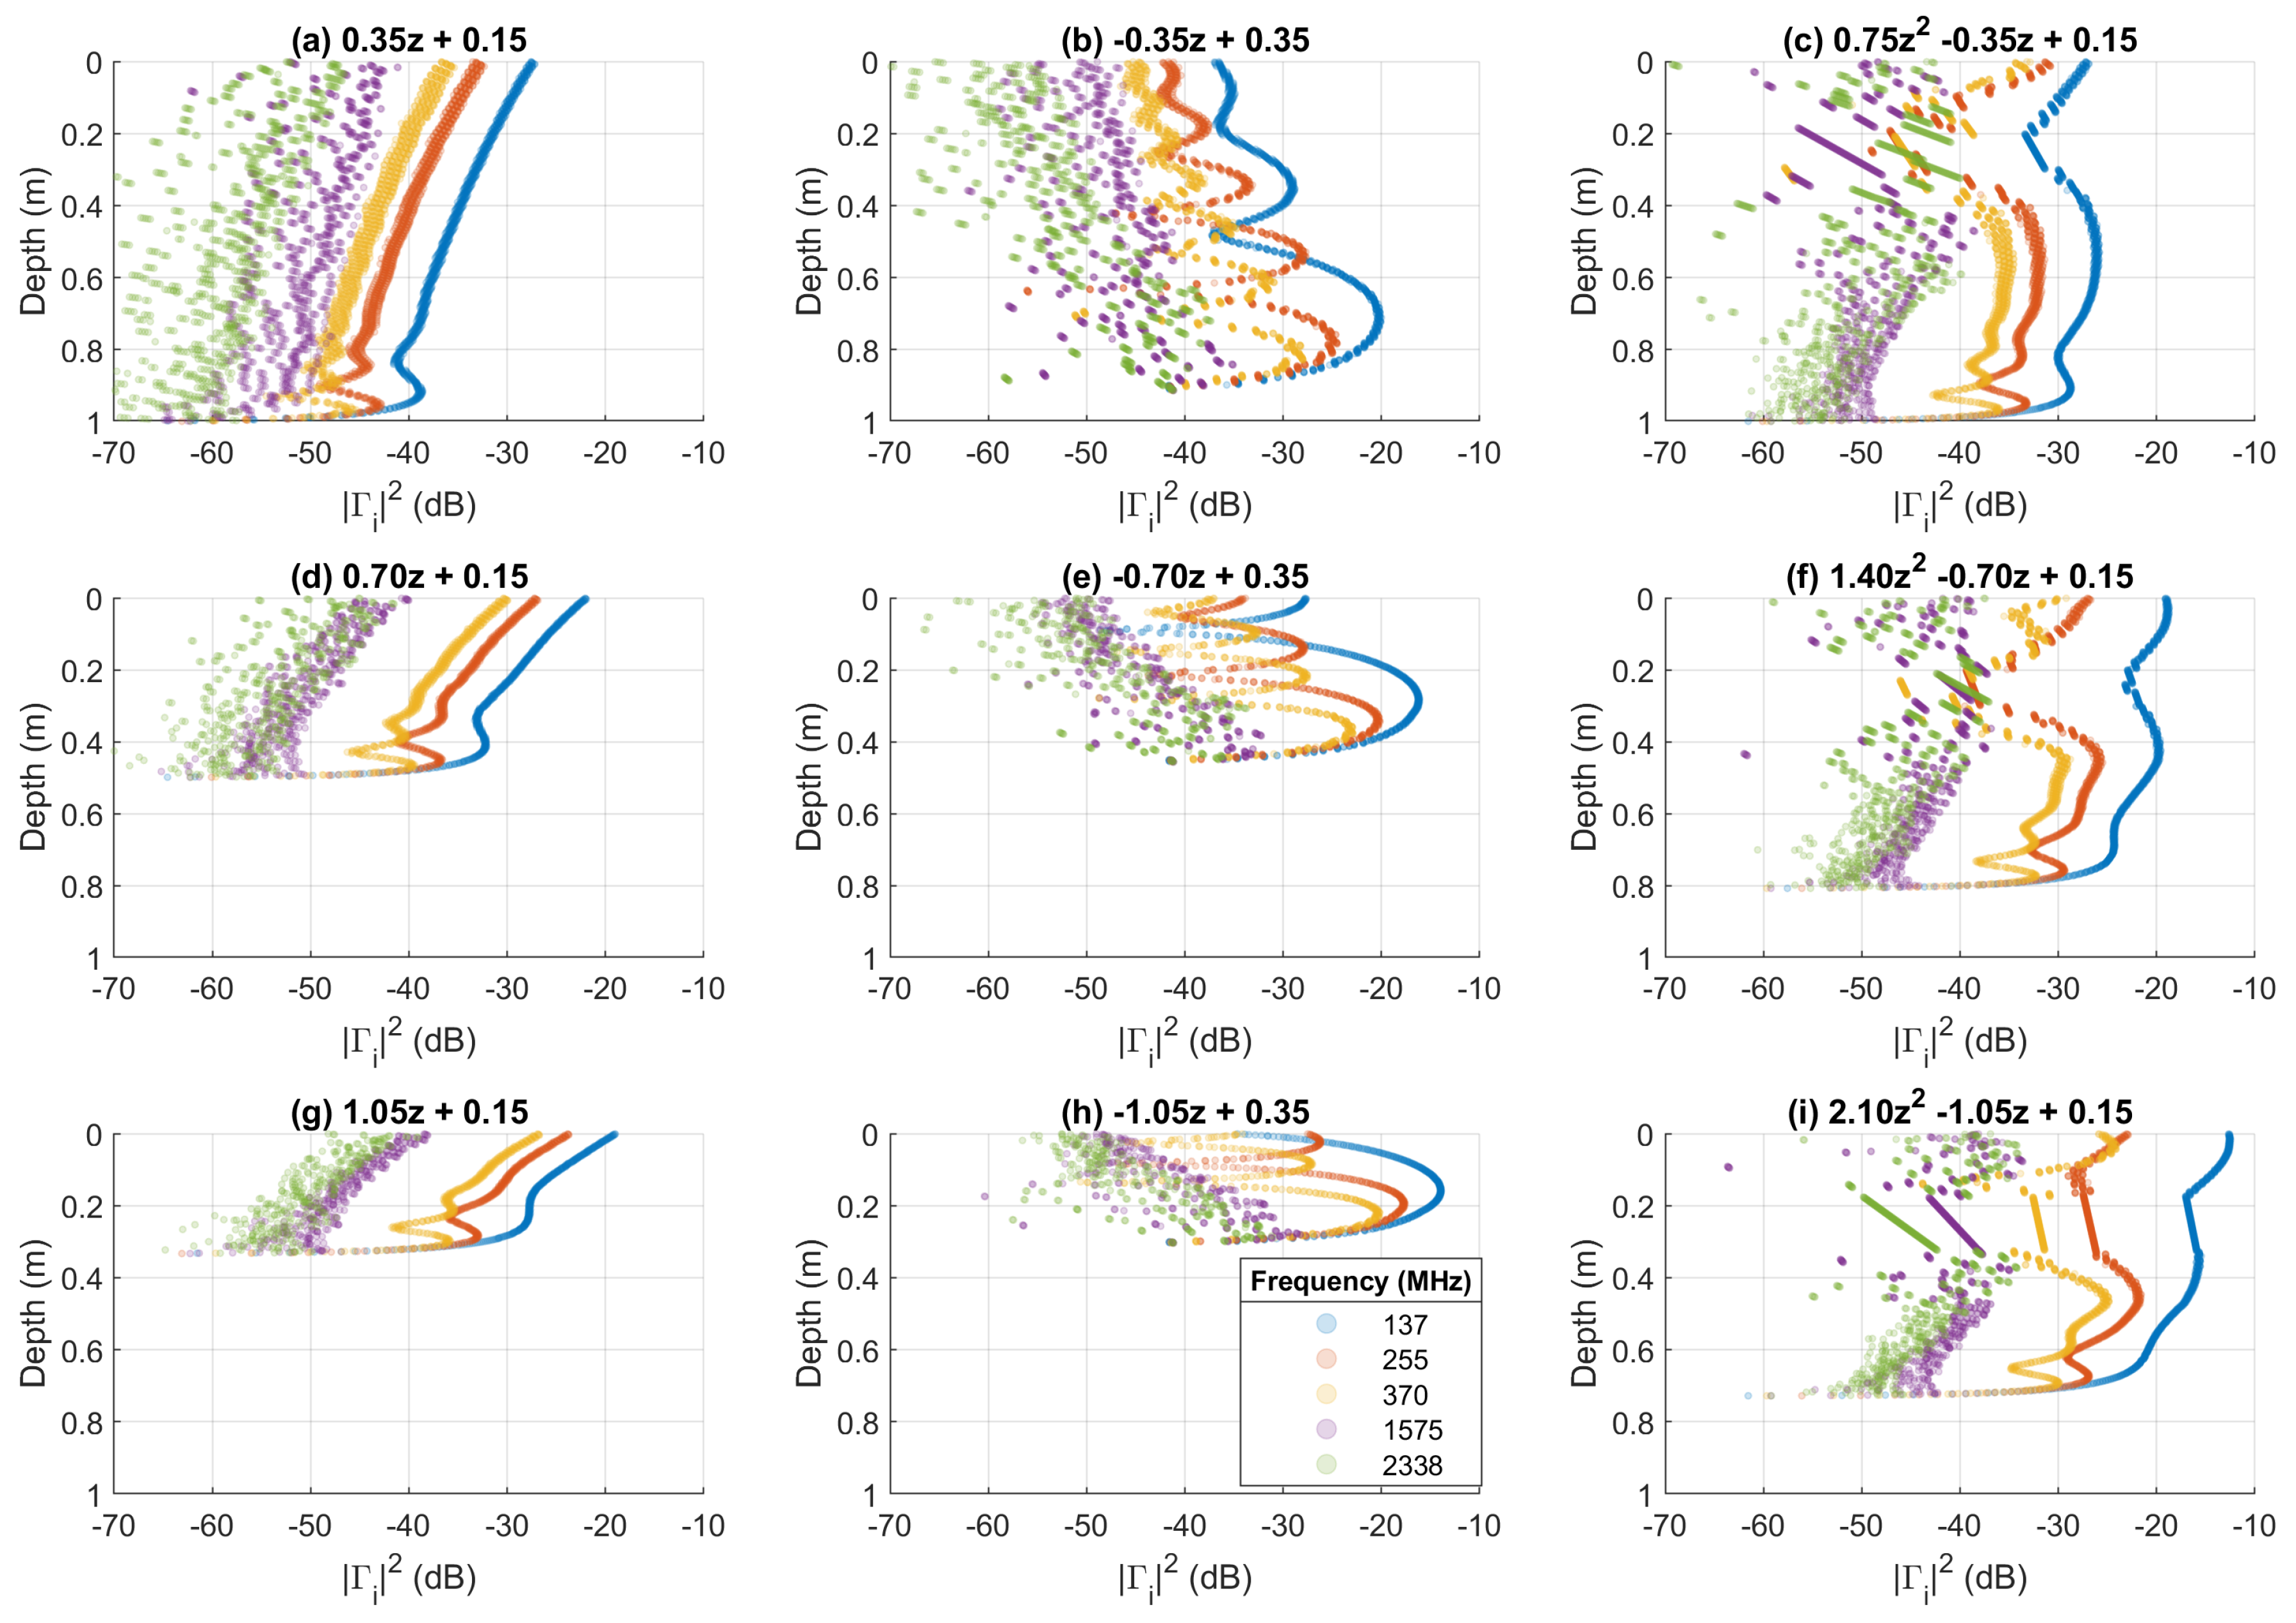
In Figure 11, we show the subsurface, intermediate reflection coefficients at each interface for each profile in Figure 9. As discussed in Section 2 in the description of Equation (2), the reflection coefficient is initialized from the bottom of the profile with the value of the elementary reflection coefficient, and the joint reflection and propagation effects are determined in order to calculate the intermediate reflection coefficient at the ith interface as it ascends towards the surface of the profile. Our most general observations can be made with Figure 11a. For the lowest frequencies at 137, 255, and 370 MHz, the coherency of the signal is clearly depicted. The coherent nature is generally suppressed in the wetting SM profiles, while the coherency can be clearly visualized in the drying profiles. This is likely due to the overall lower SM content of the drying profiles. For all cases of higher frequency signals at 1575 and 2338 MHz, the reflection coefficient varies greatly, but generally follows the same path towards the surface as the lower frequency values. From these results, it is expected that, at higher discretization levels, these higher frequency values will show smoother variations. As expected, the reflection coefficient for lower frequencies tends to have a higher value than its high frequency counterparts.
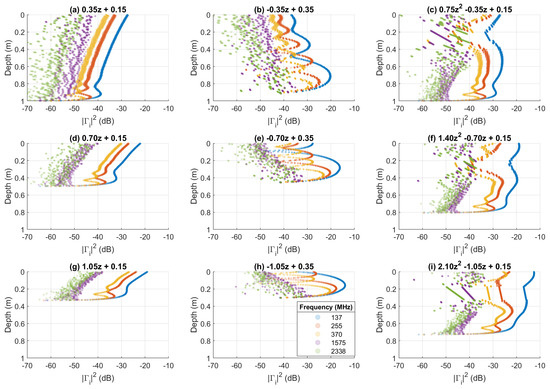
Figure 11.
Intermediate reflection coefficient solution in the subsurface of the soil moisture profiles of Figure 9. The reflection coefficient is initialized by the bottom-most elementary reflection coefficient and determined as the signal travels upward through the profile. Each subplot shares a common legend indicating the frequency of each reflection coefficient. Contributions from the air–surface interface are not depicted.
Viewing each column of subplots in Figure 9, we observe that the SM profile increases as a function of depth more rapidly from subplot to subplot. This in turn produces higher dielectric contrast and higher values of subsurface reflection coefficient values in Figure 11. Thus, the total observed reflection coefficient seen by a SoOp-R system which seeks to resolve RZSM will be most largely affected by the rate at which SM changes with respect to depth in a profile.
As noted above, we observe an area of no change in SM in Figure 9i. This same depth location produces an interesting phenomenon in the intermediate reflection coefficient of Figure 11i. Once the reflection coefficient reaches this portion, the value begins to degrade as it rises towards the surface. This is explained by the two processes which govern the reflection coefficient estimation: propagation and reflections. When there is no change in dielectric constant, no reflections will occur. Thus, each frequency observes an attenuated loss in reflection coefficient value due to propagation loss, with the greatest loss occurring with higher frequencies. Once the reflection coefficient calculation observes non-zero elementary reflection coefficients, the dielectric discontinuities will contribute to reflections observed by the SoOp-R system.
Figure 10 also visualizes the nonlinear losses accrued by the reflected energy within the profile. Comparing Figure 10a,b, we see that, as the lower frequency reflectivity values approach the surface in Figure 10a, the reflectivity increases and contributes to the overall observed reflectivity at the surface. For Figure 10b, the reflectivity value decreases as it approaches the surface due to the drying SM profile. For this subplot, even the lower frequencies are more easily altered by propagation processes which contribute to the oscillatory behavior across the calculated reflectivity values. However, comparing Figure 10b–e, we observe that these reflection coefficient values are less susceptible to the oscillatory behavior. This is due to the larger dielectric contrast which allows for contributions arising from reflection processes to become more dominant across each layer.
This simulation, overall, shows the importance of dielectric contrast. As the previous simulations have shown, different frequencies are capable of observing differences in SoOp-R measurements due to differences in both the coherence of the reflection coefficient as well as a given frequency’s tolerance to propagation losses as determined by a frequency’s dielectric loss properties. If greater dielectric contrast between layers is observed, there will be more opportunity for the reflected signal’s energy to be reflected towards the receiver. Conversely, if the SM profile changes slowly, fewer reflections will be produced, and the effects of propagation loss will be more strongly pronounced.
5. Discussion
The SCoBi model used in these simulations is highly modular and designed to examine a wide variety of SoOp-R scenarios. By allowing the user to model their own SM profile, vegetation canopies, antenna radiation patterns, and bistatic configuration, it is our intent to provide a simple, configurable M&S package to model and design SoOp-R experiments using fundamental microwave theory based on Maxwell’s equations. Interested parties are encouraged to use the codes available in this package to adapt to their M&S needs. The SCoBi multilayer module is currently being used in modeling and simulations in support of the SNOOPI experiment [7], RZSM inversion research being conducted at Purdue University [39], and farmland SM remote sensing at Mississippi State University.
The version of SCoBi used in this study is designed for low-altitude applications. A SCoBi update is in development in support of future SNOOPI measurements which includes more comprehensive tools that are appropriate for spaceborne applications. Specifically, a future release of SCoBi is in development which will utilize a grid of several flat-earth approximations superimposed over a digital elevation model (DEM) to calculate the total received electric field emerging from each facet. Since the absolute phase of the signal is preserved, the total topographic effects will be considered a superposition of each grid along the DEM. This expected update will enable analysis with respect to topographical relief, spherical Earth surface scattering, and incoherent contributions from surface roughness effects. While coherency can be reasonably assumed under smooth surface assumptions at low altitudes, topographic relief has been shown to be a significant factor in GNSS-R applications for spaceborne applications [40,41]. Thus, the results of these simulations must be carefully considered for spaceborne applications where incoherent contributions from factors such as topography may be dominant. Future studies which discuss the signatures and dynamic range of signal contributions from topography, surface roughness, and vegetation would be highly beneficial to the literature for understanding the utility of the different available frequencies.
In addition to surface roughness effects, rough layering between dielectric slabs within the profile have not been included in this study. This methodology has been incorporated into the study of radar backscatter previously. Given a two-layer model, it has been shown that the subsurface layer roughness can have a measurable impact on the overall reflected energy [42,43]. It is suggested that subsurface layer roughness should be used when a significant shift in soil texture composition occurs [44]. However, the SM profiles in this paper assume a homogenous soil texture composition in nearly all simulations. If prior information is known about uneven dielectric variations within the profile, we note that such subsurface layer roughness values should be considered.
As discussed in Section 4, the measured reflectivity is a function of both wave propagation effects and reflections along dielectric discontinuities. As shown in Figure 4, the relative permittivity for the examined frequency region is largely identical, and the loss factor is largely frequency insensitive above 1000 MHz. Because of this frequency insensitivity, the dielectric discontinuities across the vertical SM gradient will be the same, and this will produce nearly identical values of reflections at each boundary layer. However, because of the frequency dependence of the propagation effects, different frequencies will observe different responses to a SM gradient based on reflections towards the receiver as shown in Figure 11. For this reason, we conclude that multiple frequencies can leverage the differences observed in the measured reflection coefficients to determine subsurface SM values.
Our simulations exhibit the behavior of SoOp measurements given a SM profile represented by a single slab, two slabs, and an arbitrary number of slabs. By following this process of increased layering, we can clearly visualize that the dielectric boundaries produce identical reflections given a single air–surface interface, as shown in Figure 3. When looking at two dielectric slabs, we can observe that the position of the dielectric slabs within the profile will cause the SoOp-R observation to become frequency dependent. From these two simulations, we can obtain all of the components to rationalize the behavior of the SoOp-R response to complicated profiles represented by n-degree polynomials and, therefore, any SM model based on the profile’s dielectric properties and layering structure. While this paper presents several simple representations of the SM vertical profile, this research can be further explored by examining the feasibility of SoOp-R-enabled SM inversion using hydrologically-based SM models. Inclusion of parameters such as hydraulic potential, evapotranspiration modeling, hydraulic conductivity, and soil pressure head can assuredly be beneficial for the creation of SM data products; however, such profile-specific and hydrology-focused simulations are beyond the scope of this paper. Additionally, this simulation did not account for surface roughness or vegetation effects, which was done to provide a focused insight into the simplified case of SoOp-R reflections from a bare soil profile. Future studies could further this research by characterizing the impact of various vegetation structures and surface roughness parameters on the measured SoOp-R signal.
6. Summary and Conclusions
This work presents the multilayer module of the SCoBi model and simulator. The SCoBi multilayer module enables the modeling and simulation of user-defined SM profiles using well-established, fundamental electromagnetic theory. The inclusion of the multilayer module in the SCoBi framework is designed to allow users to conduct comprehensive SoOp-R simulations of RZSM regardless of their scientific background. When paired with SCoBi’s other modules, SCoBi can enable multifaceted analysis of SoOp-R simulations with respect to surface SM, RZSM, surface roughness effects, vegetation, bistatic geometry, and many other modeling considerations for land remote sensing. The details of the model as well as the simulator functionality are described.
This paper presents an analysis of the multifrequency SoOp-R response to RZSM represented by multilayer dielectric slabs with variable depth, SM content, and discretization. The analysis uses the recently-developed Mironov model to represent the complex SM dielectric constant within each layer. We provide the following general observations:
From our simulations, we observe that the dielectric constant value of SM is largely frequency independent for the examined frequency range of this study. While this study uses the Mironov model primarily to determine the dielectric constant value of SM, this phenomenon is observed in the Dobson–Peplinksi SM dielectric model as well. We observe that the coherence of these signals can be leveraged in order to observe changes in subsurface SM.
Penetration depth is briefly examined for a simple, two-dielectric slab simulation series. While penetration depth is often cited in the literature to indicate a general area at which SM may be retrieved, this paper discusses an example method of determining a profile-specific sensing depth by moving a dielectric slab down a profile and observing the position where the reflectivity is less than the SoOp-R system’s confidence threshold for reflectivity measurements. If a SoOp-R system can confidently measure reflectivity to a desired precision level, the depth at which SM may be sensed can be much greater than the suggested penetration depth.
The effect of variable clay content within the Mironov soil dielectric model is examined. As the Mironov model is a function of only frequency, clay content, and SM, the clay content of the Mironov model is the only parameter available to describe soil composition. When this clay content is varied for two soil slabs, we find that many combinations of clay content can result in similar resulting reflectivity values. This suggests the importance of soil texture classification in order to minimize errors induced by uncertainty in soil texture.
We also examine the effects of profiles which vary in SM as a function of depth. It can be observed that the dielectric contrast between layers is the driving force for responses to subsurface SM. If a portion of the profile features no variation in dielectric constant, only propagation loss occurs, and no energy will be reflected towards the receiver in order to be sensed. The lower frequencies can take advantage of higher penetration and sense dielectric contrast deeper into the soil, whereas higher frequencies have a limited response over shallow regions of the soil. This further emphasizes the importance of leveraging more than one frequency source to retrieve subsurface SM.
Author Contributions
Conceptualization, M.K. and D.B.; Methodology, D.B. and M.K.; Software, M.K., O.E., and D.B.; Validation, J.L.G., B.R.N., J.R.P., M.A.V., and R.B.; Formal analysis, D.B., M.K., and A.C.G.; Investigation, D.B., M.K., A.C.G., J.L.G., B.R.N., J.R.P., and R.B.; Resources, M.K.; Writing—original draft preparation, D.B., M.K., A.C.G.; Writing—review and editing, D.B., M.K., O.E., A.C.G., J.L.G., B.R.N., J.R.P., M.A.V., and R.B.; Visualization, D.B.; Supervision, M.K. and A.C.G.; Project administration, M.K.; and Funding acquisition, M.K., J.L.G., and R.B. All authors have read and agreed to the published version of the manuscript.
Funding
This work was sponsored by NASA Grant NNH17ZDA001N-THP under Terrestrial Hydrology Program.
Conflicts of Interest
The authors declare no conflict of interest.
References
- Gleason, S. Remote Sensing of Ocean, Ice and Land Surfaces Using Bistatically Scattered GNSS Signals from Low Earth Orbit. Ph.D. Thesis, University of Surrey, Guildford, UK, 2006. [Google Scholar] [CrossRef]
- Jales, P. Spaceborne Receiver Design for Scatterometric GNSS Reflectometry. Ph.D. Thesis, University of Surrey, Guildford, UK, 2012. [Google Scholar]
- Ruf, C.S.; Gleason, S.; Jelenak, Z.; Katzberg, S.; Ridley, A.; Rose, R.; Scherrer, J.; Zavorotny, V. The CYGNSS nanosatellite constellation hurricane mission. In Proceedings of the 2012 IEEE International Geoscience and Remote Sensing Symposium, Munich, Germany, 22–27 July 2012; pp. 214–216. [Google Scholar] [CrossRef]
- Chew, C.C.; Small, E.E. Soil Moisture Sensing Using Spaceborne GNSS Reflections: Comparison of CYGNSS Reflectivity to SMAP Soil Moisture. Geophys. Res. Lett. 2018, 45, 4049–4057. [Google Scholar] [CrossRef]
- Clarizia, M.P.; Pierdicca, N.; Costantini, F.; Floury, N. Analysis of CYGNSS data for soil moisture retrieval. IEEE J. Sel. Top. Appl. Earth Obs. Remote Sens. 2019, 12, 2227–2235. [Google Scholar] [CrossRef]
- Eroglu, O.; Kurum, M.; Boyd, D.; Gurbuz, A.C. High Spatio-Temporal Resolution CYGNSS Soil Moisture Estimates Using Artificial Neural Networks. Remote Sens. 2019, 11, 2272. [Google Scholar] [CrossRef]
- Garrison, J.; Piepmeier, J.; Shah, R.; Vega, M.; Spencer, D.; Banting, R.; Firman, C.; Nold, B.; Larsen, K.; Bindlish, R. SNOOPI: A Technology Validation Mission for P-band Reflectometry using Signals of Opportunity. In Proceedings of the IGARSS 2019—2019 IEEE International Geoscience and Remote Sensing Symposium, Yokohama, Japan, 28 July–2 August 2019; IEEE: Piscataway, NJ, USA, 2019; pp. 5082–5085. [Google Scholar]
- Chew, C.C.; Small, E.E.; Larson, K.M.; Zavorotny, V.U. Effects of near-surface soil moisture on GPS SNR data: Development of a retrieval algorithm for soil moisture. IEEE Trans. Geosci. Remote Sens. 2014, 52, 537–543. [Google Scholar] [CrossRef]
- Pierdicca, N.; Guerriero, L.; Egido, A.; Paloscia, S.; Floury, N. Exploiting GNSS signals for soil moisture and vegetation biomass retrieval. In Proceedings of the 2015 IEEE International Geoscience and Remote Sensing Symposium (IGARSS), Milan, Italy, 26–31 July 2015; pp. 5119–5122. [Google Scholar] [CrossRef]
- Knuble, J.; Piepmeier, J.; Deshpande, M.; Toit, C.D.; Garrison, J.; Lin, Y.C.; Stienne, G.; Katzberg, S.; Alikakos, G. Airborne P-band Signal of Opportunity (SoOP) demonstrator instrument; Status update. In Proceedings of the 2016 IEEE International Geoscience and Remote Sensing Symposium (IGARSS), Beijing, China, 10–15 July 2016; pp. 5638–5641. [Google Scholar] [CrossRef]
- Garrison, J.; Lin, Y.C.; Nold, B.; Piepmeier, J.R.; Vega, M.A.; Fritts, M.; Toit, C.F.; Knuble, J. Remote sensing of soil moisture using P-band signals of opportunity (SoOp): Initial results. In Proceedings of the 2017 IEEE International Geoscience and Remote Sensing Symposium (IGARSS), Fort Worth, TX, USA, 23–28 July 2017; pp. 4158–4161. [Google Scholar] [CrossRef]
- Garrison, J.L.; Kurum, M.; Nold, B.; Piepmeier, J.; Vega, M.A.; Bindlish, R.; Pignotti, G.; Lafayette, W. Remote Sensing of Root-Zone Soil Moisture Using I- and P-band Signals of Opportunity: Instrument Validation Studies. In Proceedings of the IGARSS 2018—2018 IEEE International Geoscience and Remote Sensing Symposium, Valencia, Spain, 22–27 July 2018; pp. 8305–8308. [Google Scholar]
- Yueh, S.; Shah, R.; Xu, X.; Elder, K.; Starr, B. Experimental Demonstration of Soil Moisture Remote Sensing Using P-Band Satellite Signals of Opportunity. IEEE Geosci. Remote Sens. Lett. 2019, 17, 207–211. [Google Scholar] [CrossRef]
- Ulaby, F.T.; Long, D.G. Microwave Radar and Radiometric Remote Sensing, 1st ed.; University of Michigan Press: Ann Arbor, MI, USA, 2014. [Google Scholar] [CrossRef]
- Kurum, M.; Deshpande, M.; Joseph, A.T.; O’Neill, P.E.; Lang, R.H.; Eroglu, O. SCoBi-Veg: A generalized bistatic scattering model of reflectometry from vegetation for signals of opportunity applications. IEEE Trans. Geosci. Remote Sens. 2018, 57, 1049–1068. [Google Scholar] [CrossRef]
- Eroglu, O.; Boyd, D.R.; Kurum, M. The Signals of Opportunity Coherent Bistatic Scattering Simulator: A Free, Open Source Simulator Framework. IEEE Geosci. Remote Sens. Mag. 2020. [Google Scholar] [CrossRef]
- Ulaby, F.; Moore, R.; Fung, A. Microwave Remote Sensing: Microwave Remote Sensing Fundamentals and Radiometry; Artech House: London, UK, 1981. [Google Scholar]
- Orfanidis, S. Waves and Antennas Electromagnetic, 2nd ed.; 2016; p. 1413. Available online: http://eceweb1.rutgers.edu/~orfanidi/ewa/ (accessed on 21 October 2020).
- Lang, R.H.; Sighu, J.S. Electromagnetic backscattering from a layer of vegetation: A discrete approach. IEEE Trans. Geosci. Remote. Sens. 1983, GE-21, 62–71. [Google Scholar] [CrossRef]
- Eroglu, O.; Boyd, D.R.; Kurum, M. SCoBi User’s Manual; 2018; Available online: https://github.com/impresslab/SCoBi/tree/master/docs/manuals (accessed on 21 October 2020).
- Ulaby, F.; Moore, R.; Fung, A. Microwave Remote Sensing: Active and Passive. Volume 2—Radar Remote Sensing and Surface Scattering and Emission Theory; Addison-Wesley Publishing: Boston, MA, USA, 1982. [Google Scholar]
- Bruckler, L.; Witono, H.; Stengel, P. Near surface soil moisture estimation from microwave measurements. Remote Sens. Environ. 1988, 26, 101–121. [Google Scholar] [CrossRef]
- Boisvert, J.; Gwyn, Q.; Brisco, B.; Major, D.; Brown, R. Evaluation of soil moisture estimation techniques and microwave penetration depth for radar applications. Can. J. Remote Sens. 1995, 21, 110–123. [Google Scholar] [CrossRef]
- Wang, J.R.; Schmugge, T.J. An empirical model for the complex dielectric permittivity of soils as a function of water content. IEEE Trans. Geosci. Remote Sens. 1980, GE-18, 288–295. [Google Scholar] [CrossRef]
- Dobson, M.C.; Ulaby, F.F.; Hallikainen, M.T.; El-Rayes, M.A. Microwave dielectric behavior of wet soil—Part II: Dielectric mixing models. IEEE Trans. Geosci. Remote Sens. 1985, 23, 35–46. [Google Scholar] [CrossRef]
- Peplinski, N.R.; Ulaby, F.T.; Dobson, M.C. Dielectric properties of soils in the 0.3–1.3-GHz range. IEEE Trans. Geosci. Remote Sens. 1995, 33, 1340. [Google Scholar] [CrossRef]
- Mironov, V.L.; Fomin, S.V. Temperature and Mineralogy Dependable Model for Microwave Dielectric Spectra of Moist Soils. PIERS Online 2009, 5, 411–415. [Google Scholar] [CrossRef]
- Mironov, V.L.; De Roo, R.D.; Savin, I.V. Temperature-dependable microwave dielectric model for an arctic soil. IEEE Trans. Geosci. Remote Sens. 2010, 48, 2544–2556. [Google Scholar] [CrossRef]
- Yayong, S.; Jianwei, M.; Jie, P.; Shifeng, H.; Kun, Y.; Peng, Z.; He, Z. Preliminary Applicability Analysis of Soil Dielectric Constant Model of the Different Soil Texture Condition. In Proceedings of the IGARSS 2019—2019 IEEE International Geoscience and Remote Sensing Symposium, Yokohama, Japan, 28 July–2 August 2019; pp. 7148–7151. [Google Scholar]
- Mialon, A.; Richaume, P.; Leroux, D.; Bircher, S.; Bitar, A.A.; Pellarin, T.; Wigneron, J.P.; Kerr, Y.H. Comparison of Dobson and Mironov dielectric models in the SMOS soil moisture retrieval algorithm. IEEE Trans. Geosci. Remote Sens. 2015, 53, 3084–3094. [Google Scholar] [CrossRef]
- Hosmer, D.W., Jr.; Lemeshow, S.; Sturdivant, R.X. Applied Logistic Regression; John Wiley & Sons: Hoboken, NJ, USA, 2013; Volume 398. [Google Scholar]
- Ulaby, F.T. Radar Measurement of Soil Moisture Content. IEEE Trans. Antennas Propag. 1974, 11, 257–265. [Google Scholar] [CrossRef]
- Champion, I.; Faivre, R. Sensitivity of the radar signal to soil moisture: Variation with incidence angle, frequency, and polarization. IEEE Trans. Geosci. Remote Sens. 1997, 35, 781–783. [Google Scholar] [CrossRef]
- Oh, Y. Radar measurement of soil moisture: From professor Fawwaz Ulaby’s pioneering works in the early 1970s to its current status. In Proceedings of the 2012 IEEE International Geoscience and Remote Sensing Symposium, Munich, Germany, 22–27 July 2012; pp. 1258–1261. [Google Scholar] [CrossRef]
- Kurum, M.; Lang, R.H.; O’Neill, P.E.; Joseph, A.T.; Cosh, M.; Jackson, T. Forest canopy effects on the estimation of soil moisture at L-band. In Proceedings of the IGARSS 2008—2008 IEEE International Geoscience and Remote Sensing Symposium, Boston, MA, USA, 7–11 July 2008; Volume 1, pp. I-33–I-36. [Google Scholar] [CrossRef]
- Tabatabaeenejad, A.; Burgin, M.; Duan, X.; Moghaddam, M. P-band radar retrieval of subsurface soil moisture profile as a second-order polynomial: First AirMOSS results. IEEE Trans. Geosci. Remote Sens. 2015, 53, 645–658. [Google Scholar] [CrossRef]
- Sadeghi, M.; Tabatabaeenejad, A.; Tuller, M.; Moghaddam, M.; Jones, S.B. Advancing NASA’s AirMOSS P-band Radar Root-zone Soil Moisture Retrieval Algorithm via Incorporation of Richards’ Equation. Remote Sens. 2017, 9, 17. [Google Scholar] [CrossRef]
- Zribi, M.; Gorrab, A.; Baghdadi, N.; Lili-Chabaane, Z.; Mougenot, B. Influence of radar frequency on the relationship between bare surface soil moisture vertical profile and radar backscatter. IEEE Geosci. Remote Sens. Lett. 2014, 11, 848–852. [Google Scholar] [CrossRef]
- Boyd, D.R.; Kurum, M.; Eroglu, O.; Gurbuz, A.C.; Garrison, J.; Nold, B.; Piepmeier, J.; Vega, M.; Bindlish, R. Investigation of Root-Zone Soil Moisture Profile Sensitivity to Multiple Signals of Opportunity Sources. In Proceedings of the 2019 USNC-URSI National Radio Science Meeting, Boulder, CO, USA, 9–12 January 2019; p. 170. [Google Scholar]
- Park, H.; Camps, A.; Castellvi, J.; Muro, J. Generic Performance Simulator of Spaceborne GNSS-Reflectometer for Land Applications. IEEE J. Sel. Top. Appl. Earth Obs. Remote Sens. 2020, 13, 3179–3191. [Google Scholar] [CrossRef]
- Dente, L.; Guerriero, L.; Comite, D.; Pierdicca, N. Space-Borne GNSS-R Signal over a Complex Topography: Modeling and Validation. IEEE J. Sel. Top. Appl. Earth Obs. Remote Sens. 2020, 13, 1218–1233. [Google Scholar] [CrossRef]
- Tabatabaeenejad, A.; Duan, X.; Moghaddam, M. Coherent scattering of electromagnetic waves from two-layer rough surfaces within the kirchhoff regime. IEEE Trans. Geosci. Remote Sens. 2013, 51, 3943–3953. [Google Scholar] [CrossRef]
- Duan, X.; Moghaddam, M. Bistatic vector 3-D scattering from layered rough surfaces using stabilized extended boundary condition method. IEEE Trans. Geosci. Remote Sens. 2013, 51, 2722–2733. [Google Scholar] [CrossRef]
- Kuo, C.H.; Moghaddam, M. Electromagnetic scattering from multilayer rough surfaces with arbitrary dielectric profiles for remote sensing of subsurface soil moisture. IEEE Antennas Propag. Soc. APS Int. Symp. 2007, 45, 4797–4800. [Google Scholar] [CrossRef]
Publisher’s Note: MDPI stays neutral with regard to jurisdictional claims in published maps and institutional affiliations. |
© 2020 by the authors. Licensee MDPI, Basel, Switzerland. This article is an open access article distributed under the terms and conditions of the Creative Commons Attribution (CC BY) license (http://creativecommons.org/licenses/by/4.0/).

