Article

Mapping the Natural Distribution of Bamboo and Related Carbon Stocks in the Tropics Using Google Earth Engine, Phenological Behavior, Landsat 8, and Sentinel-2


by
Manjunatha Venkatappa
1,2,3,*,
Sutee Anantsuksomsri
1,2,
Jose Alan Castillo
4,
Benjamin Smith
5,6 and
Nophea Sasaki
7
1
Regional Urban and Built Environmental Analytics, Faculty of Architecture, Chulalongkorn University, 254 Phayathai Road, Pathumwan, Bangkok 10330, Thailand
2
Department of Urban and Regional Planning, Faculty of Architecture, Chulalongkorn University, 254 Phayathai Road, Pathumwan, Bangkok 10330, Thailand
3
LEET Intelligence Co., Ltd., Perfect Park, Suan Prikthai, Muang Pathum Thani, Pathum Thani 12000, Thailand
4
Ecosystems Research and Development Bureau, Department of Environment and Natural Resources, Forestry Campus, Los Baños, Laguna 4031, Philippines
5
Hawkesbury Institute for the Environment, Western Sydney University, Penrith, NSW 2751, Australia
6
Department of Physical Geography and Ecosystem Science, Lund University, Sölvegatan 12. S-223 62, Sweden
7
Natural Resources Management, SERD, Asian Institute of Technology. P.O. Box 4, Khlong Luang, Pathumthani 12120, Thailand
*
Author to whom correspondence should be addressed.
Remote Sens. 2020, 12(18), 3109; https://doi.org/10.3390/rs12183109
Submission received: 30 July 2020 / Revised: 14 September 2020 / Accepted: 15 September 2020 / Published: 22 September 2020

Abstract

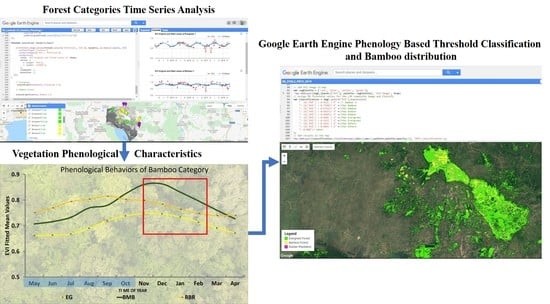
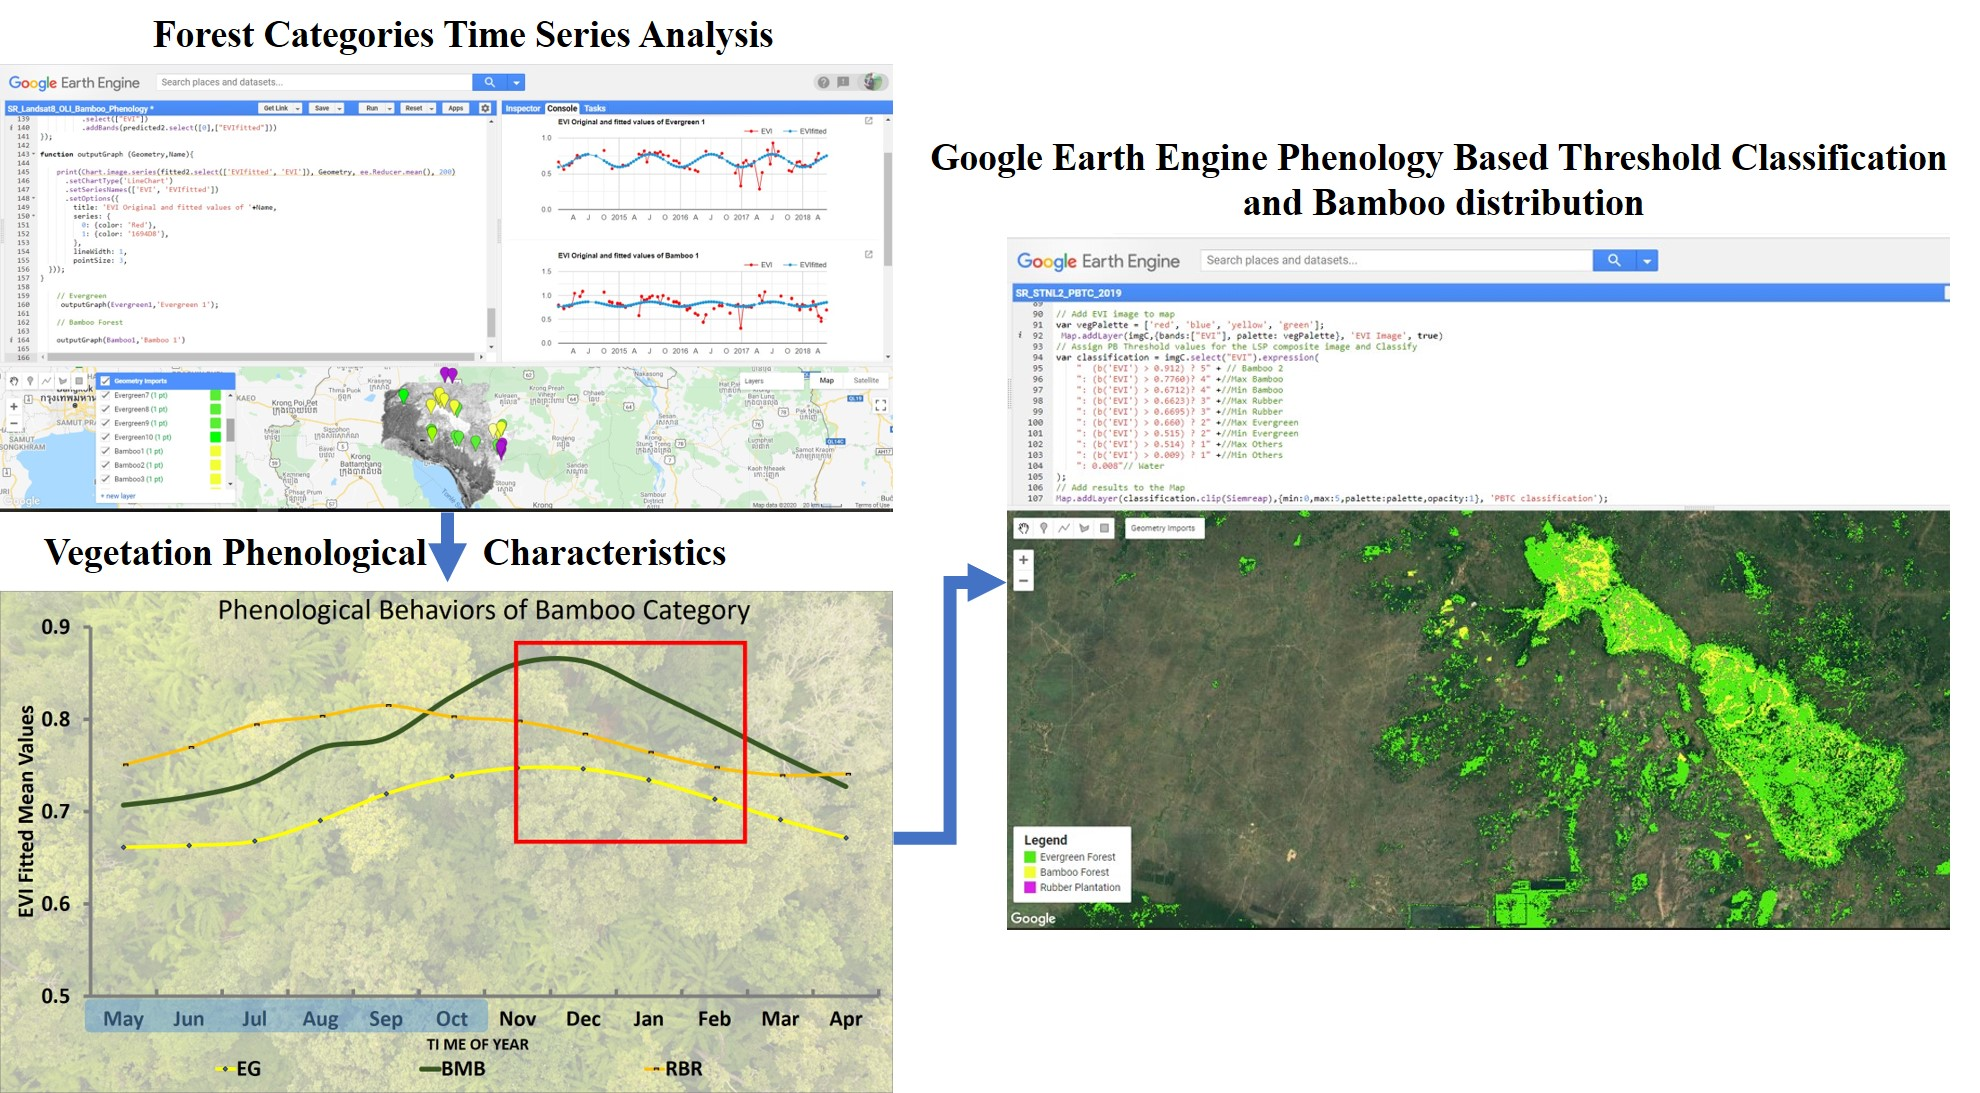
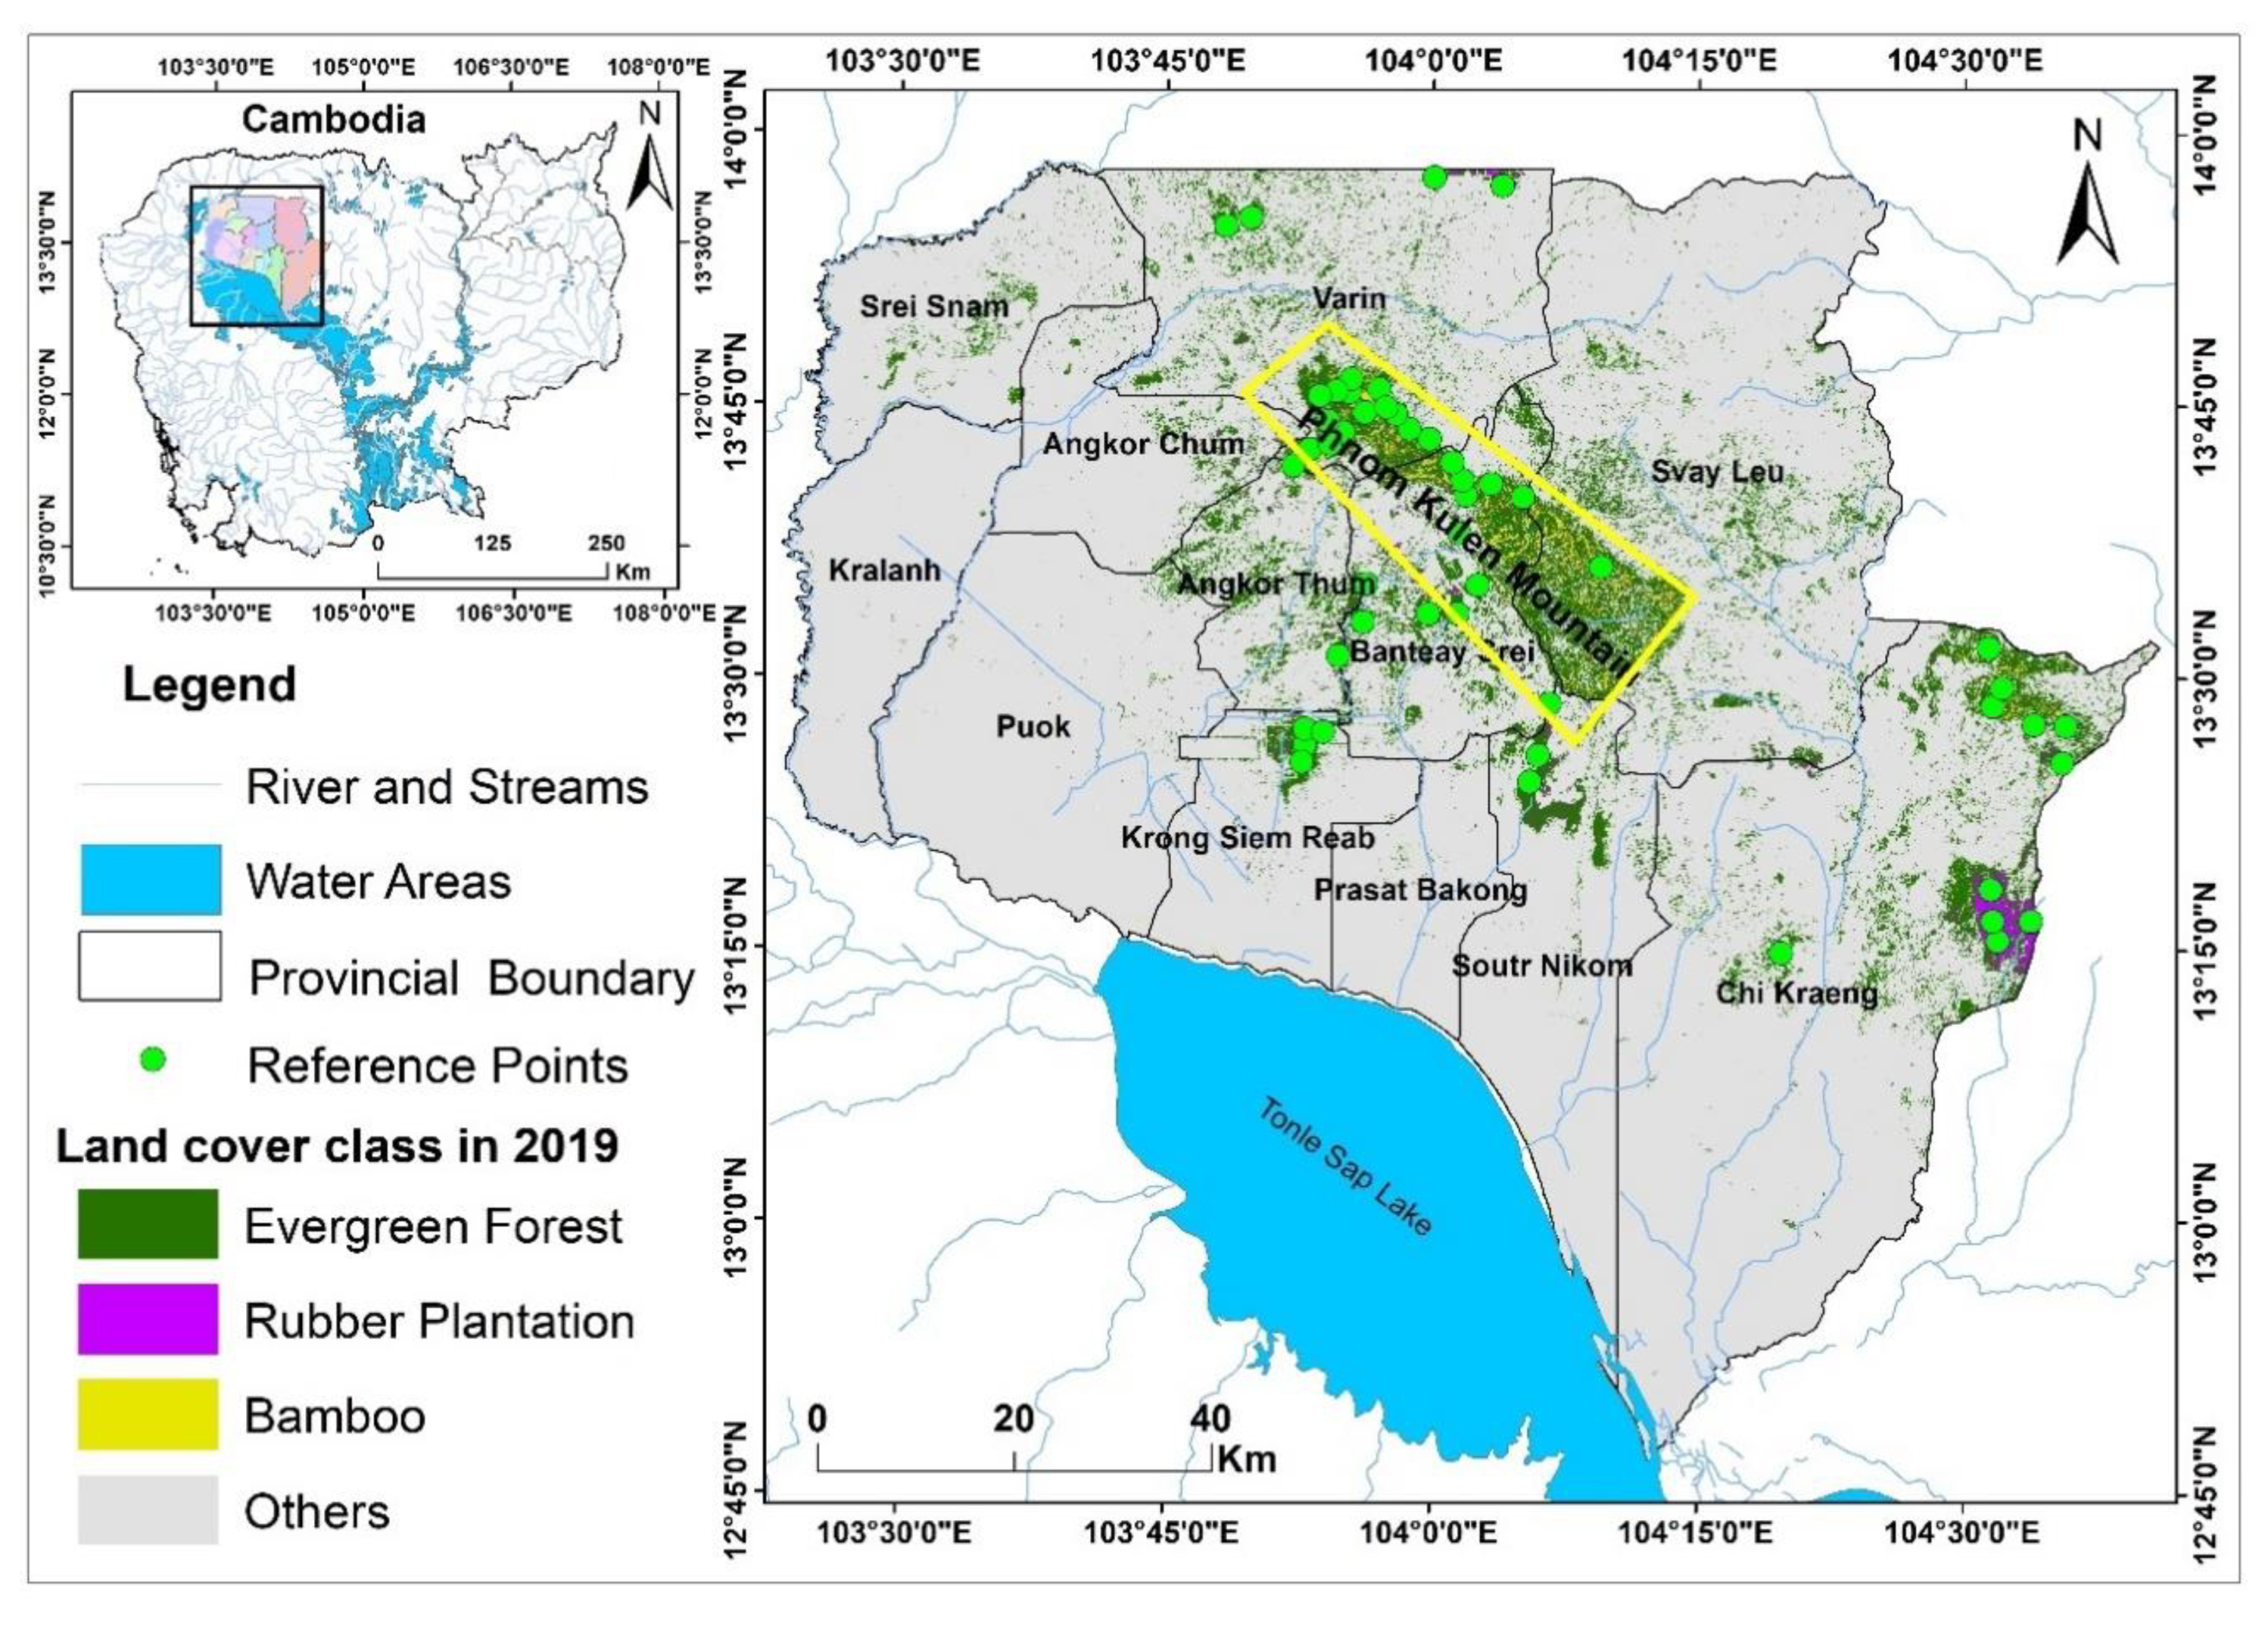
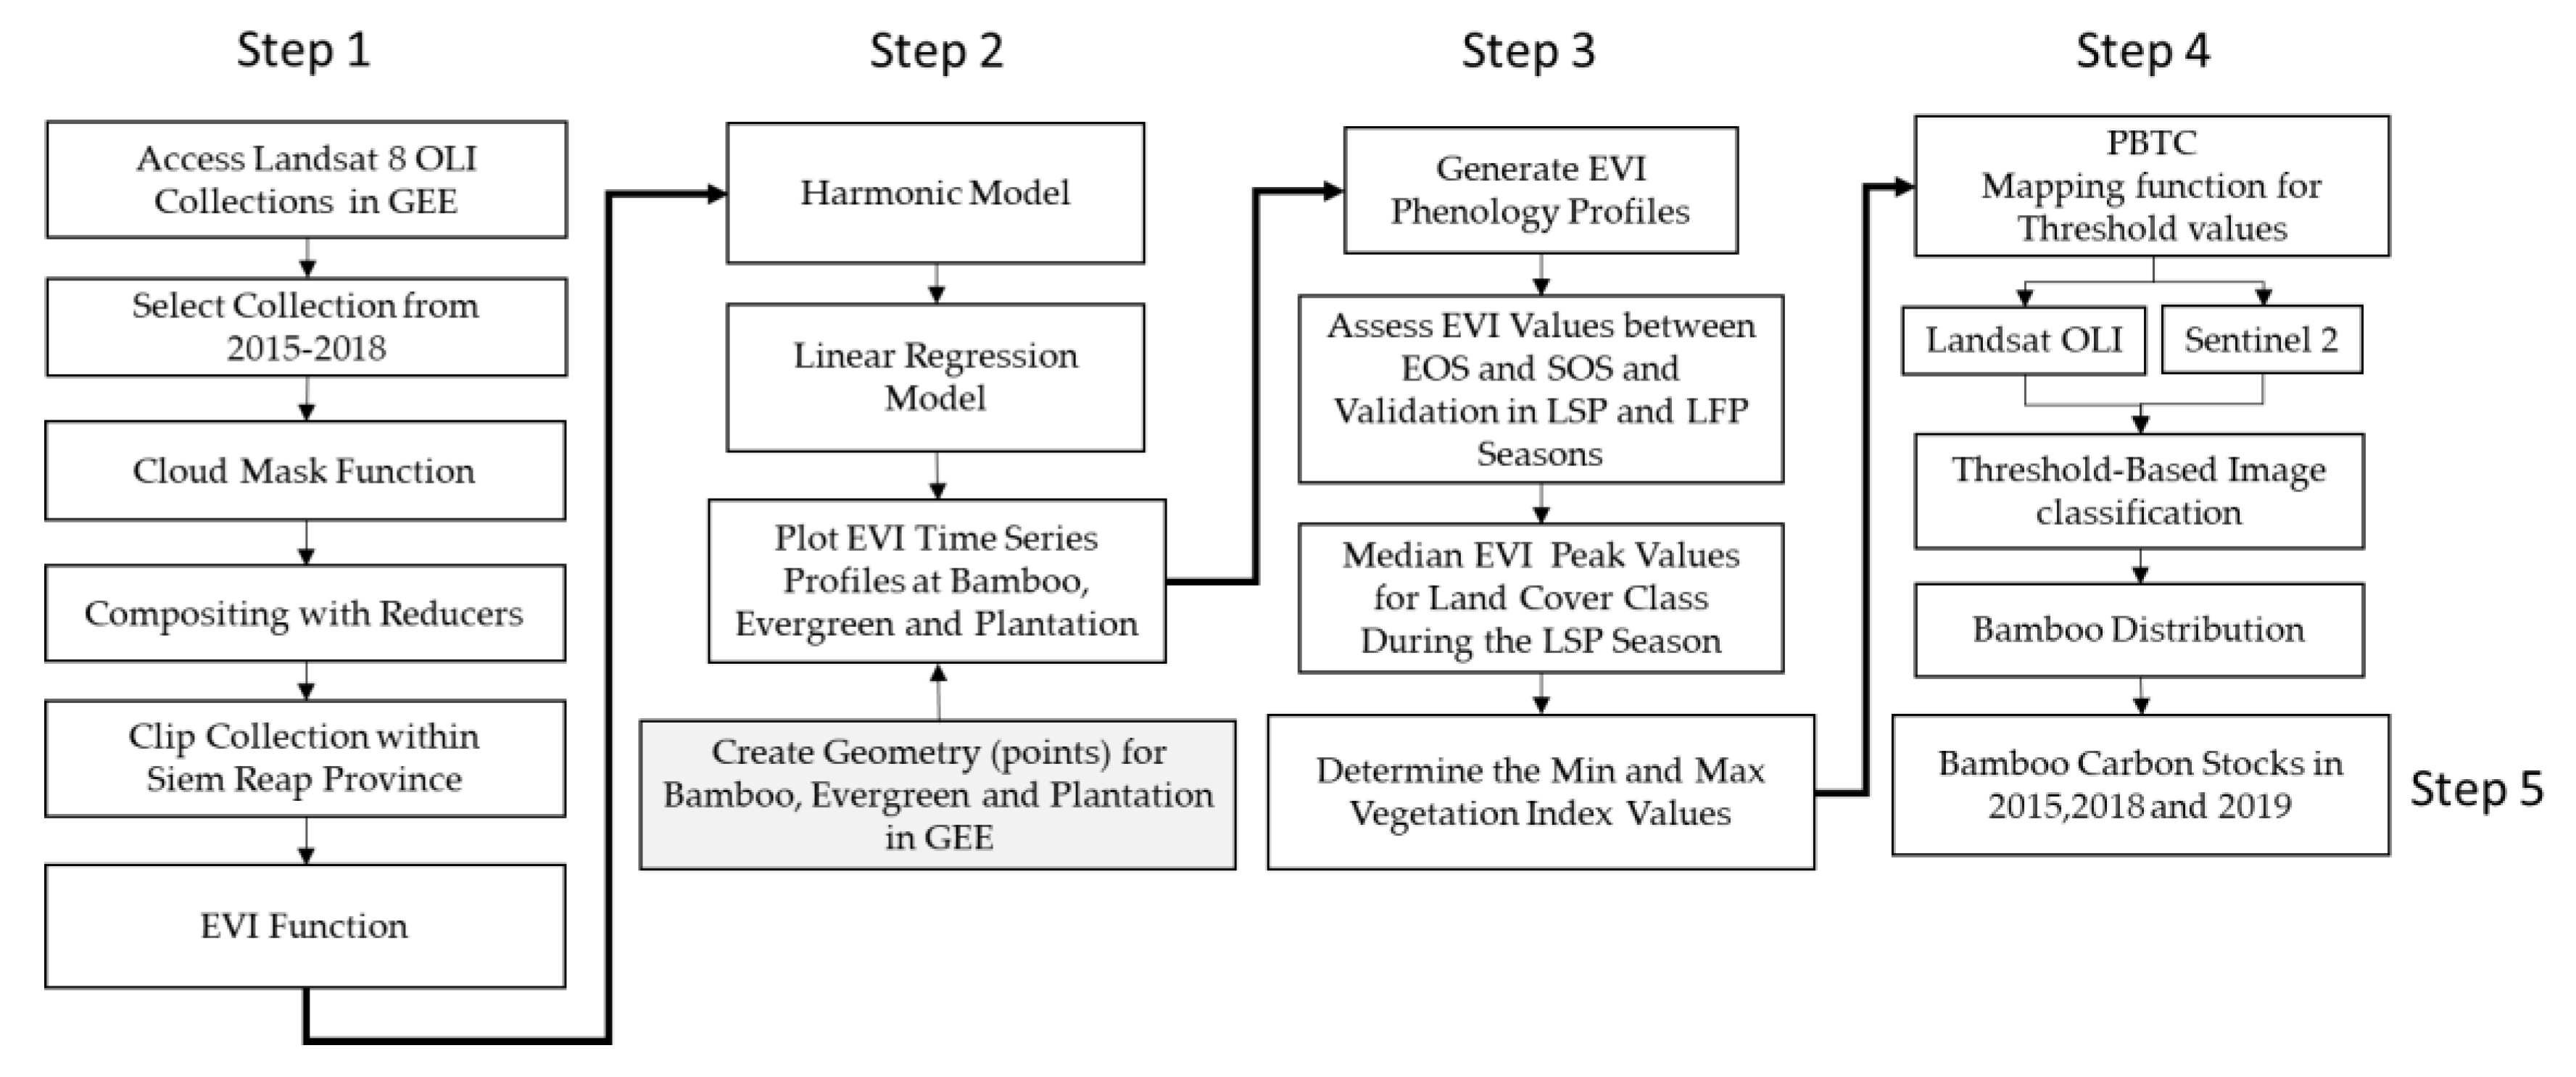
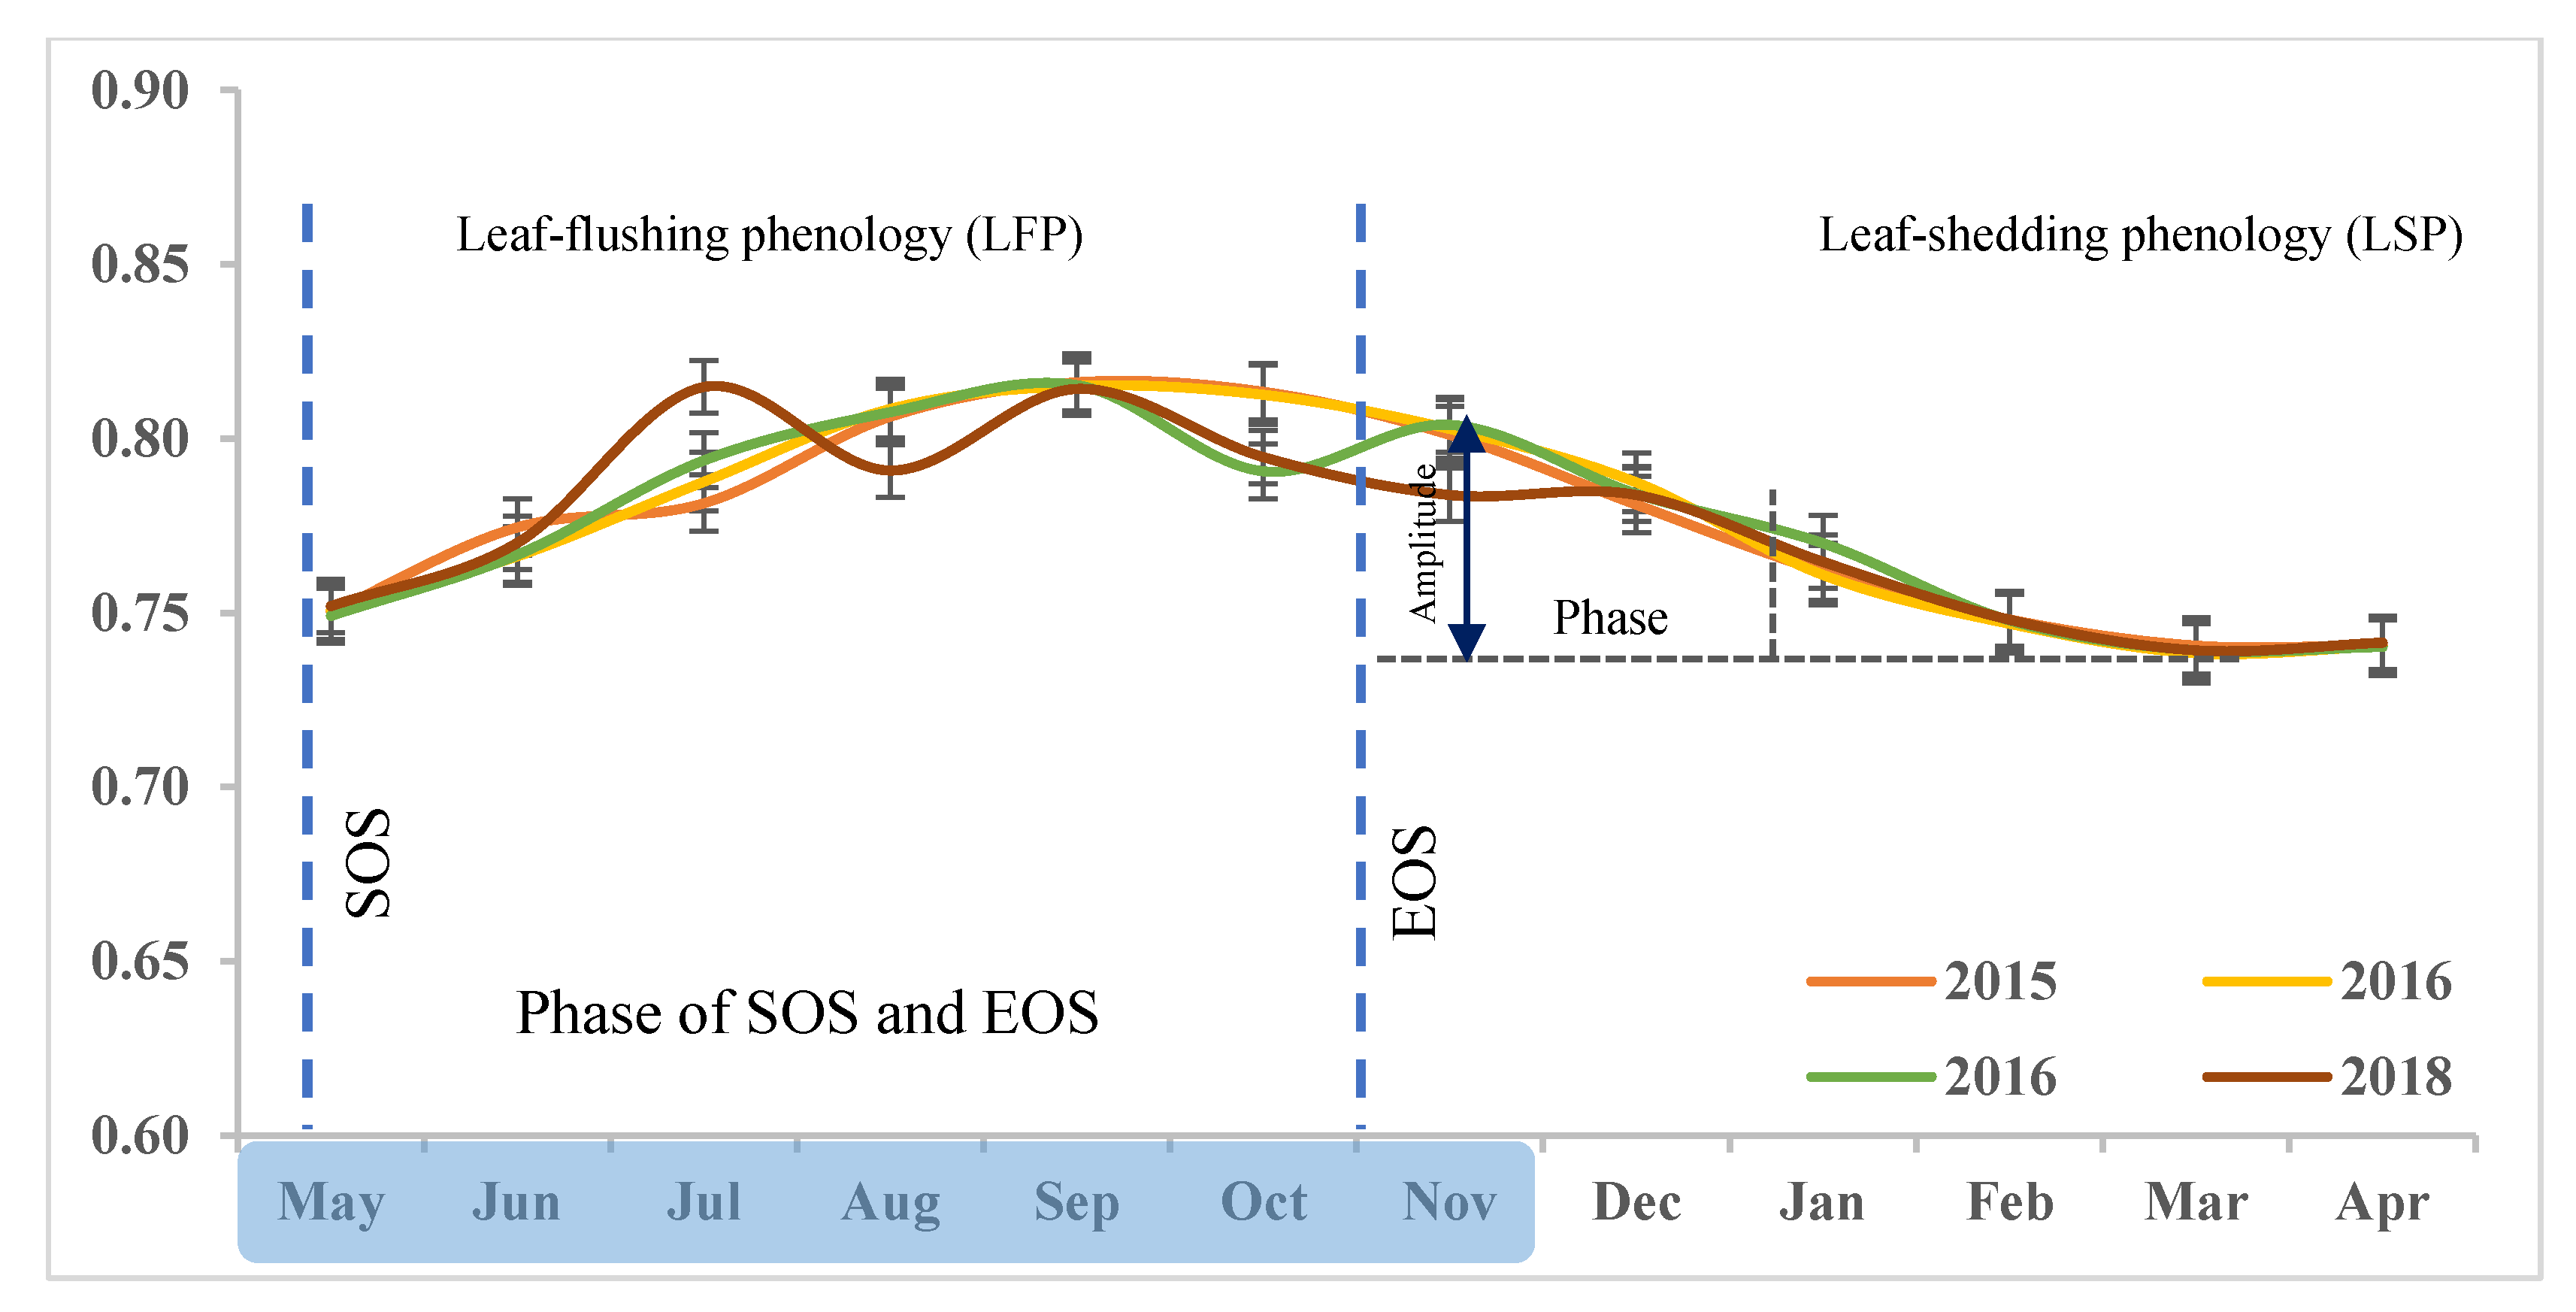
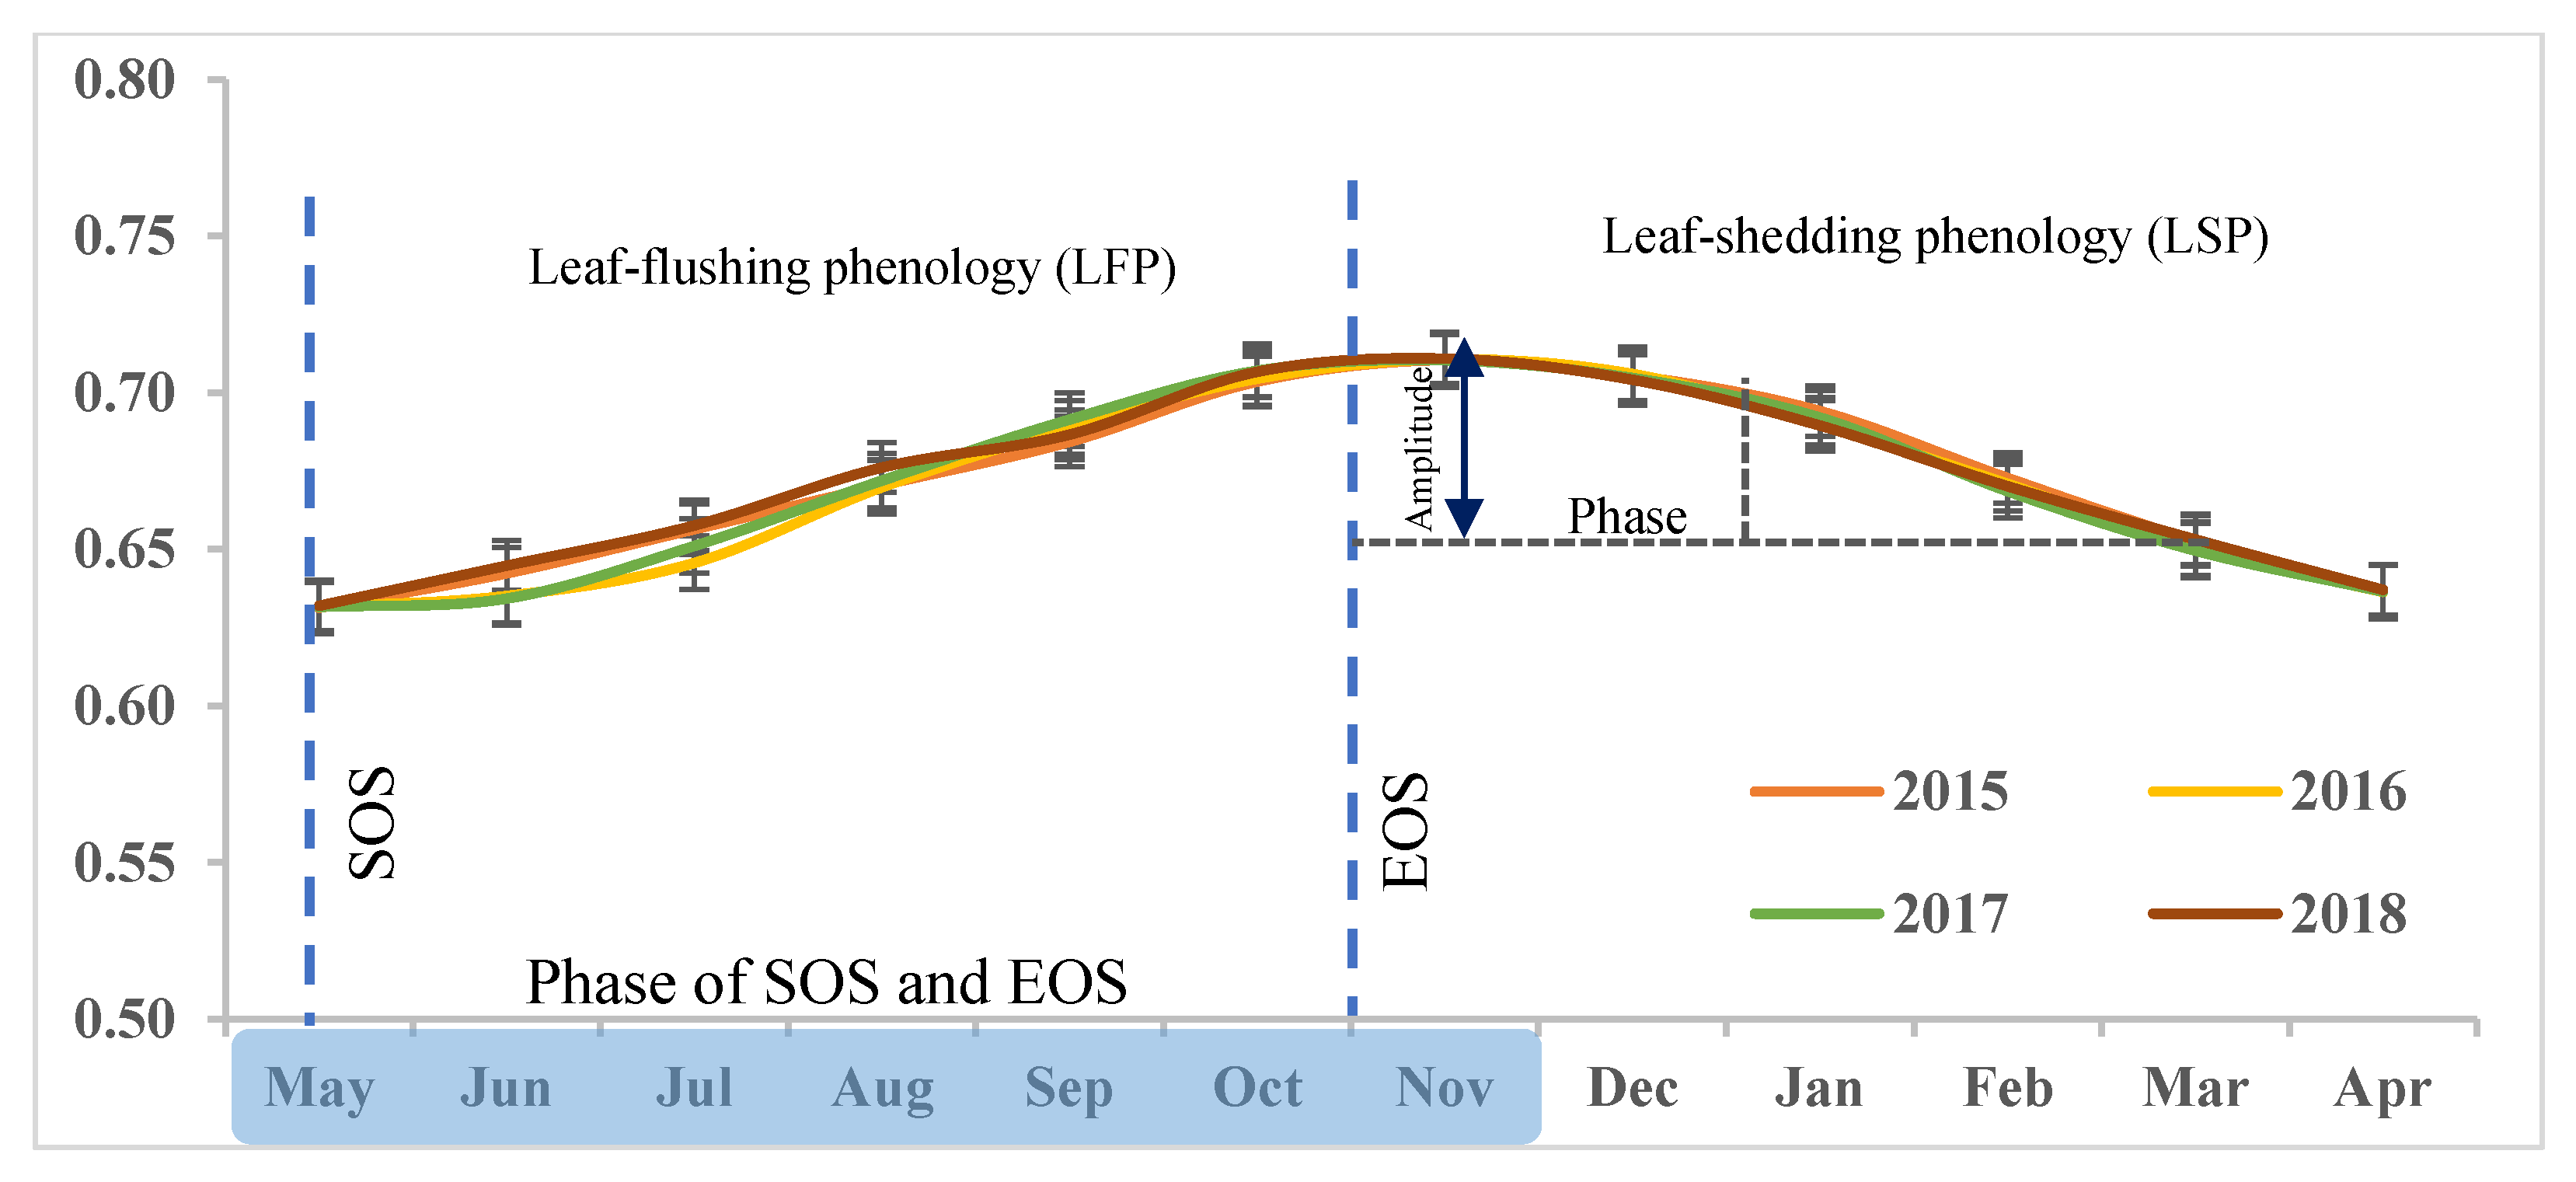
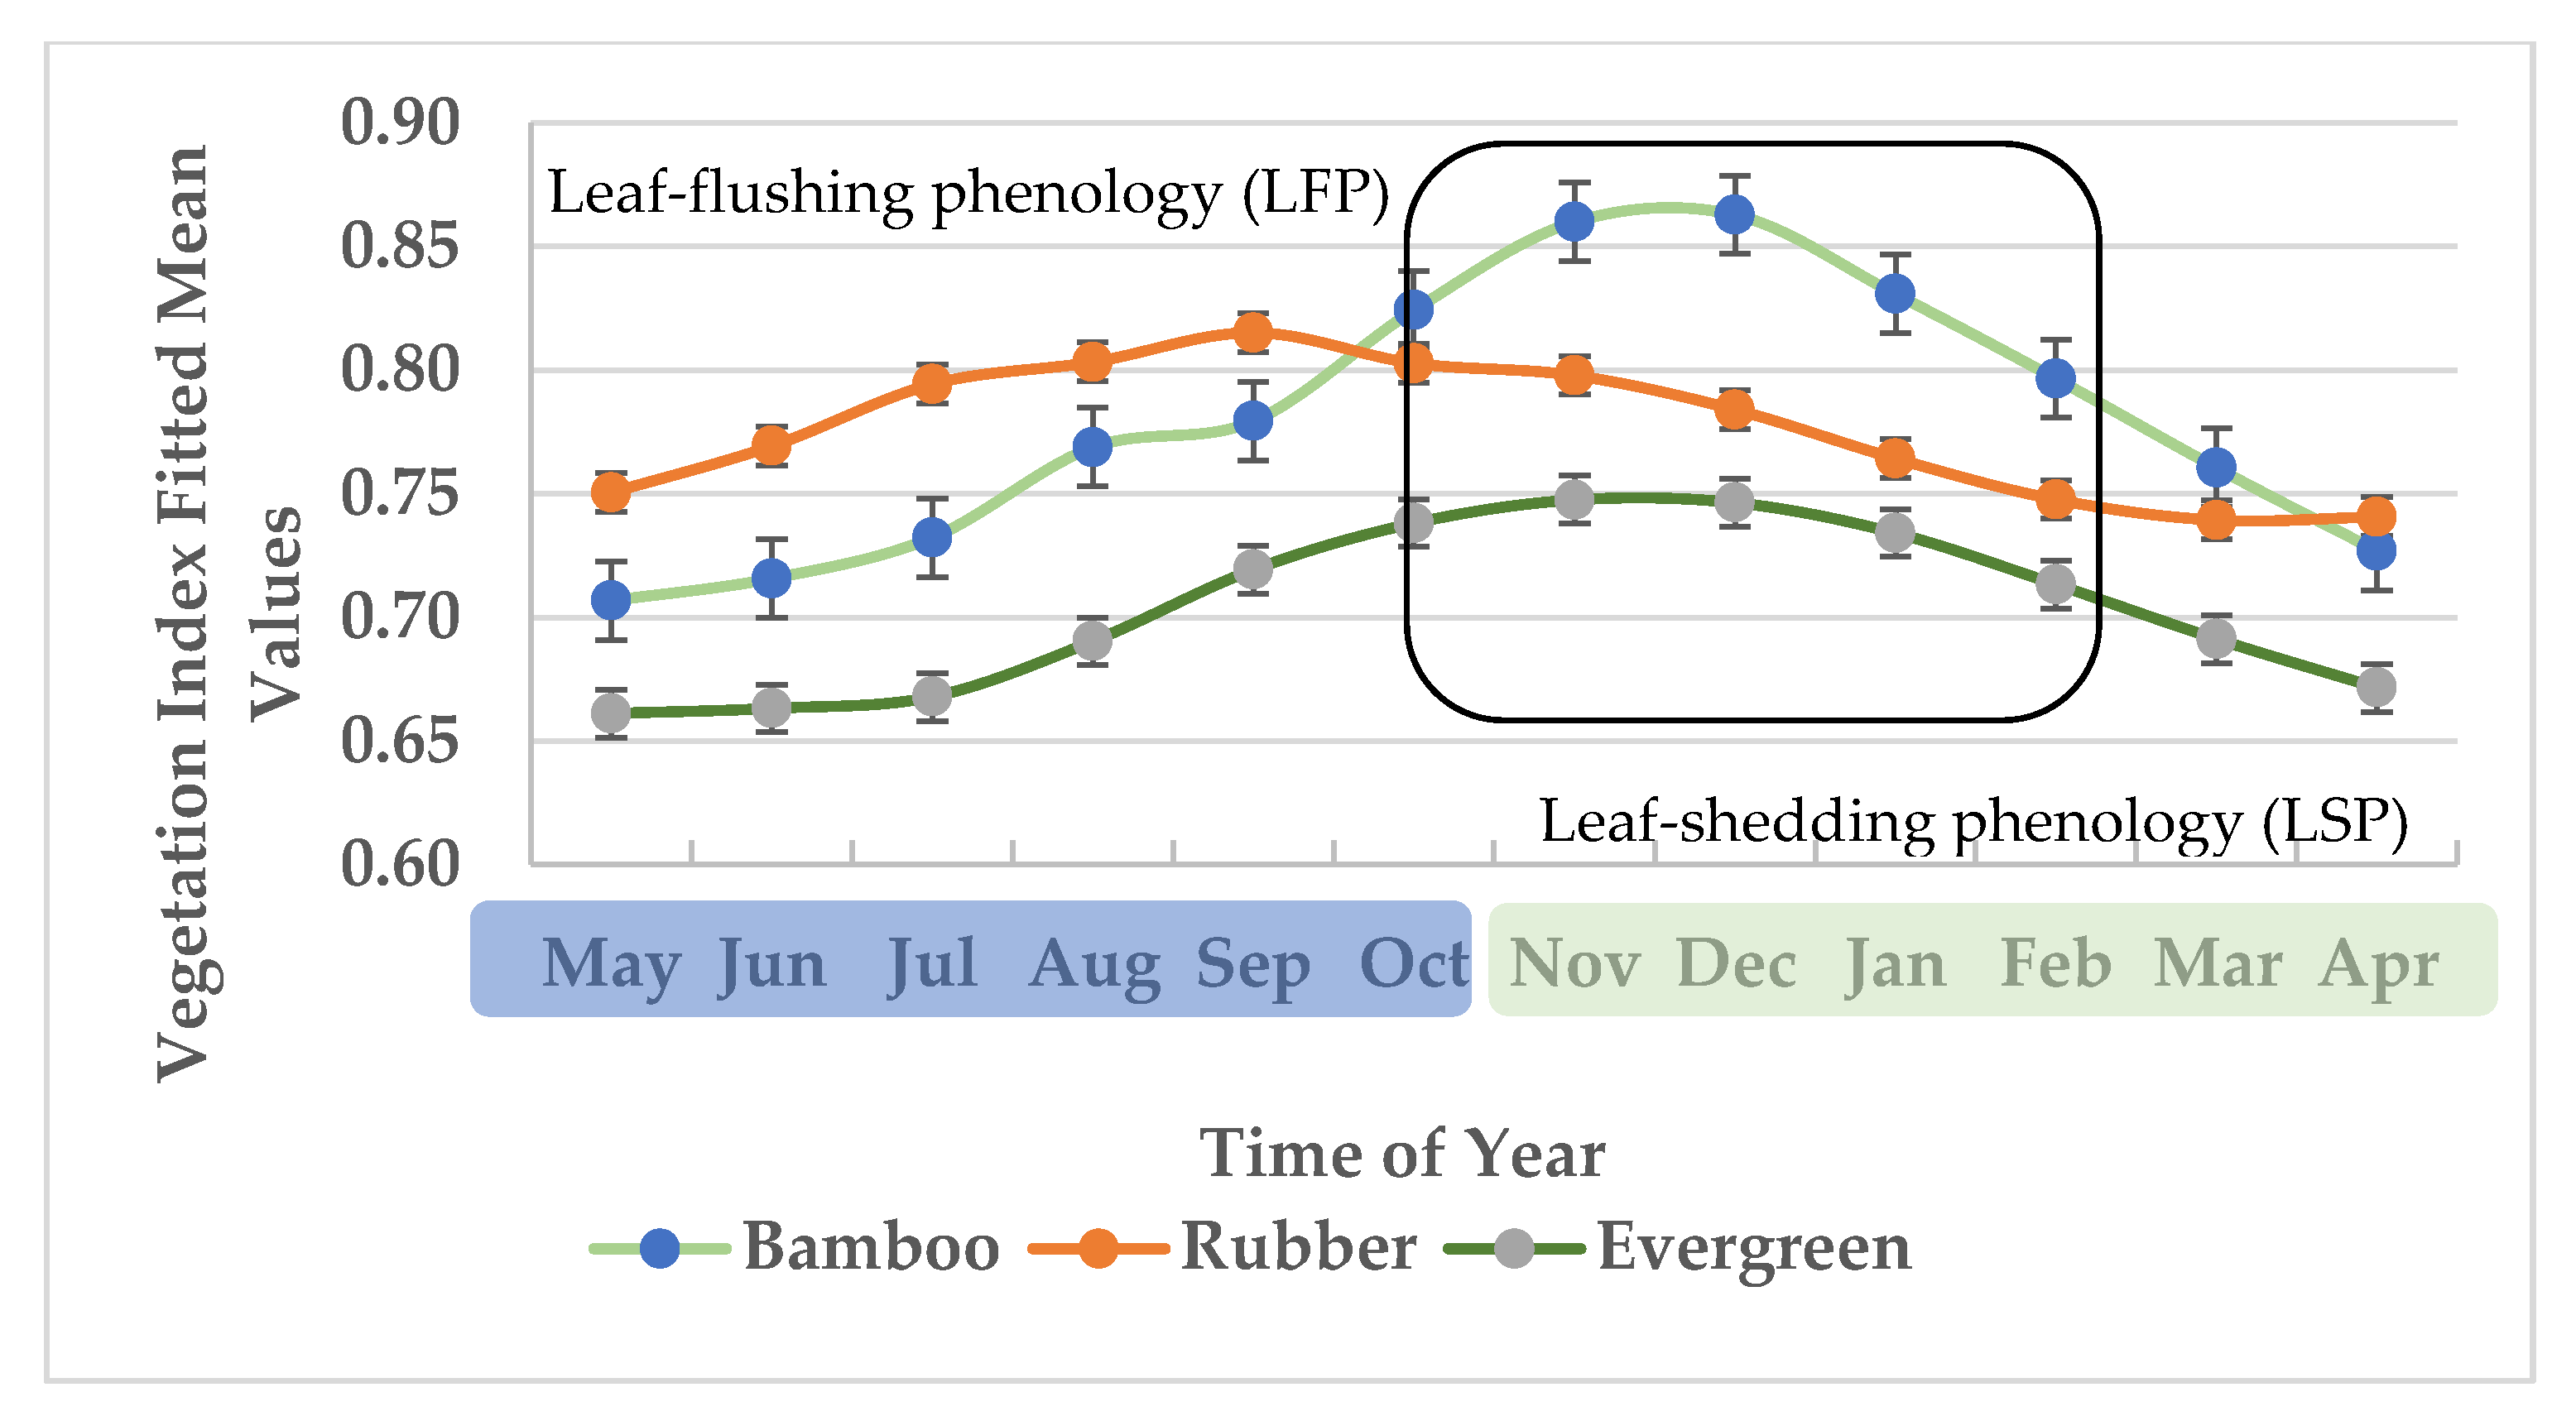
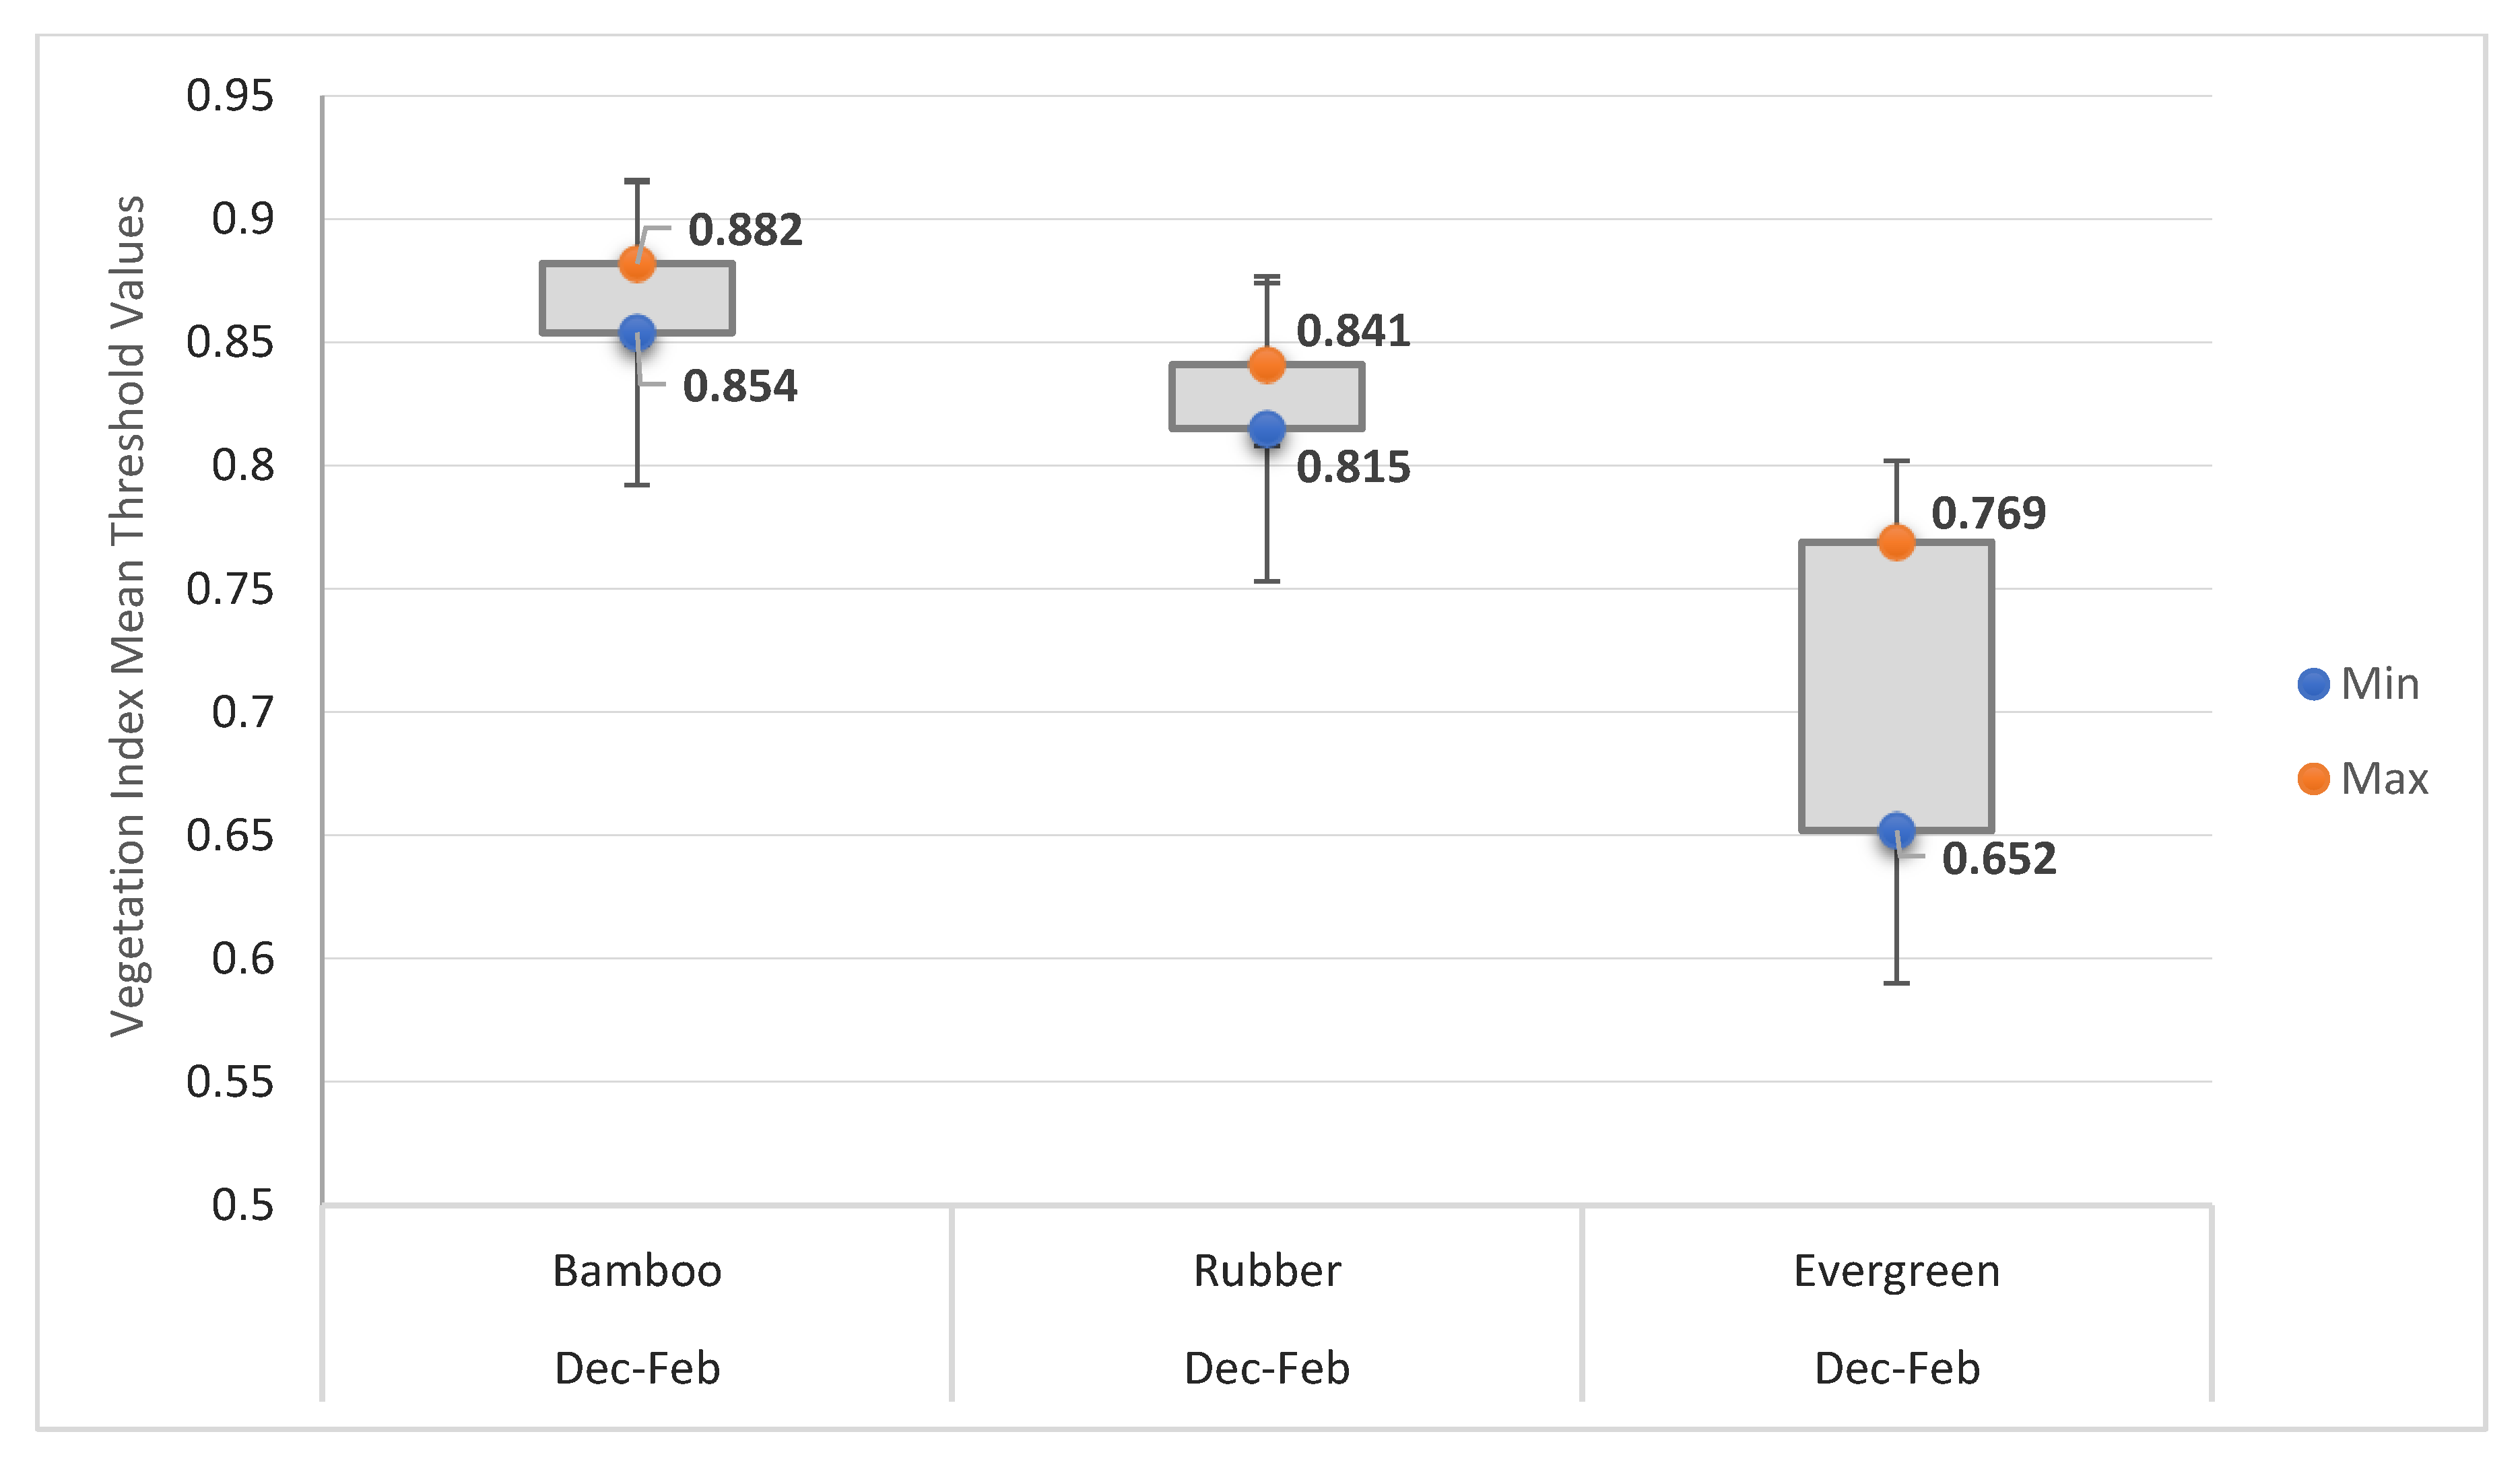
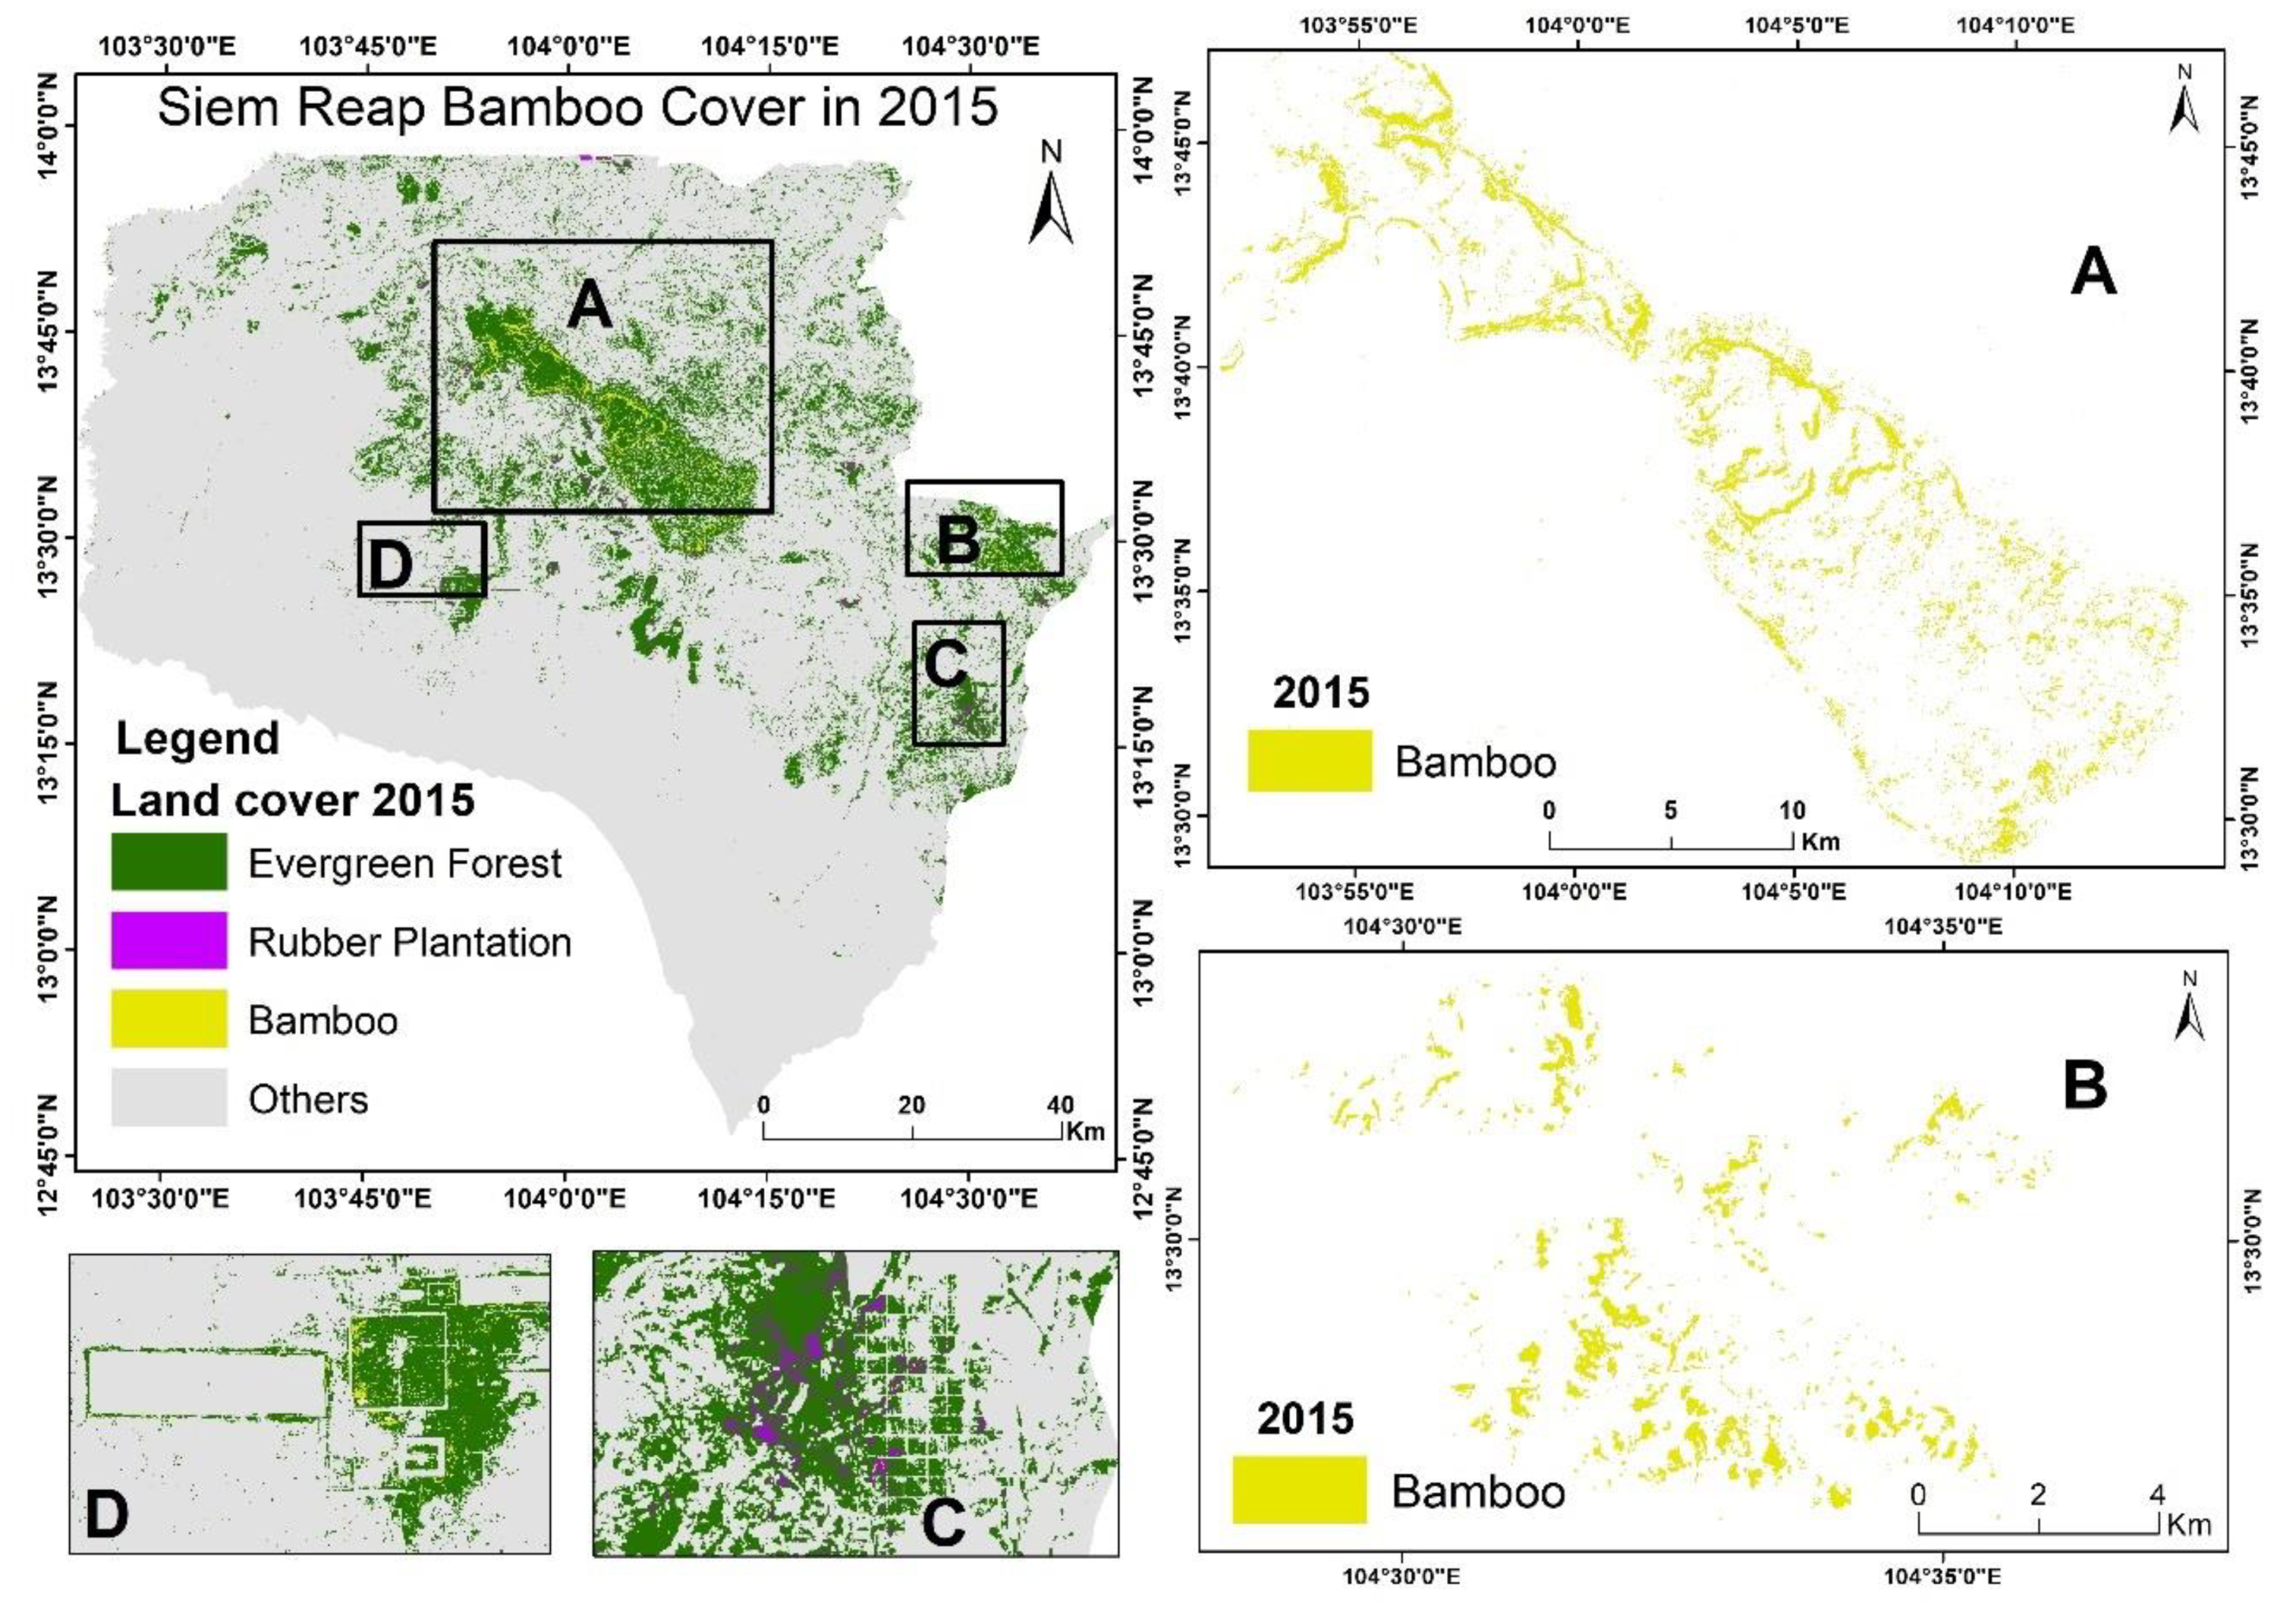
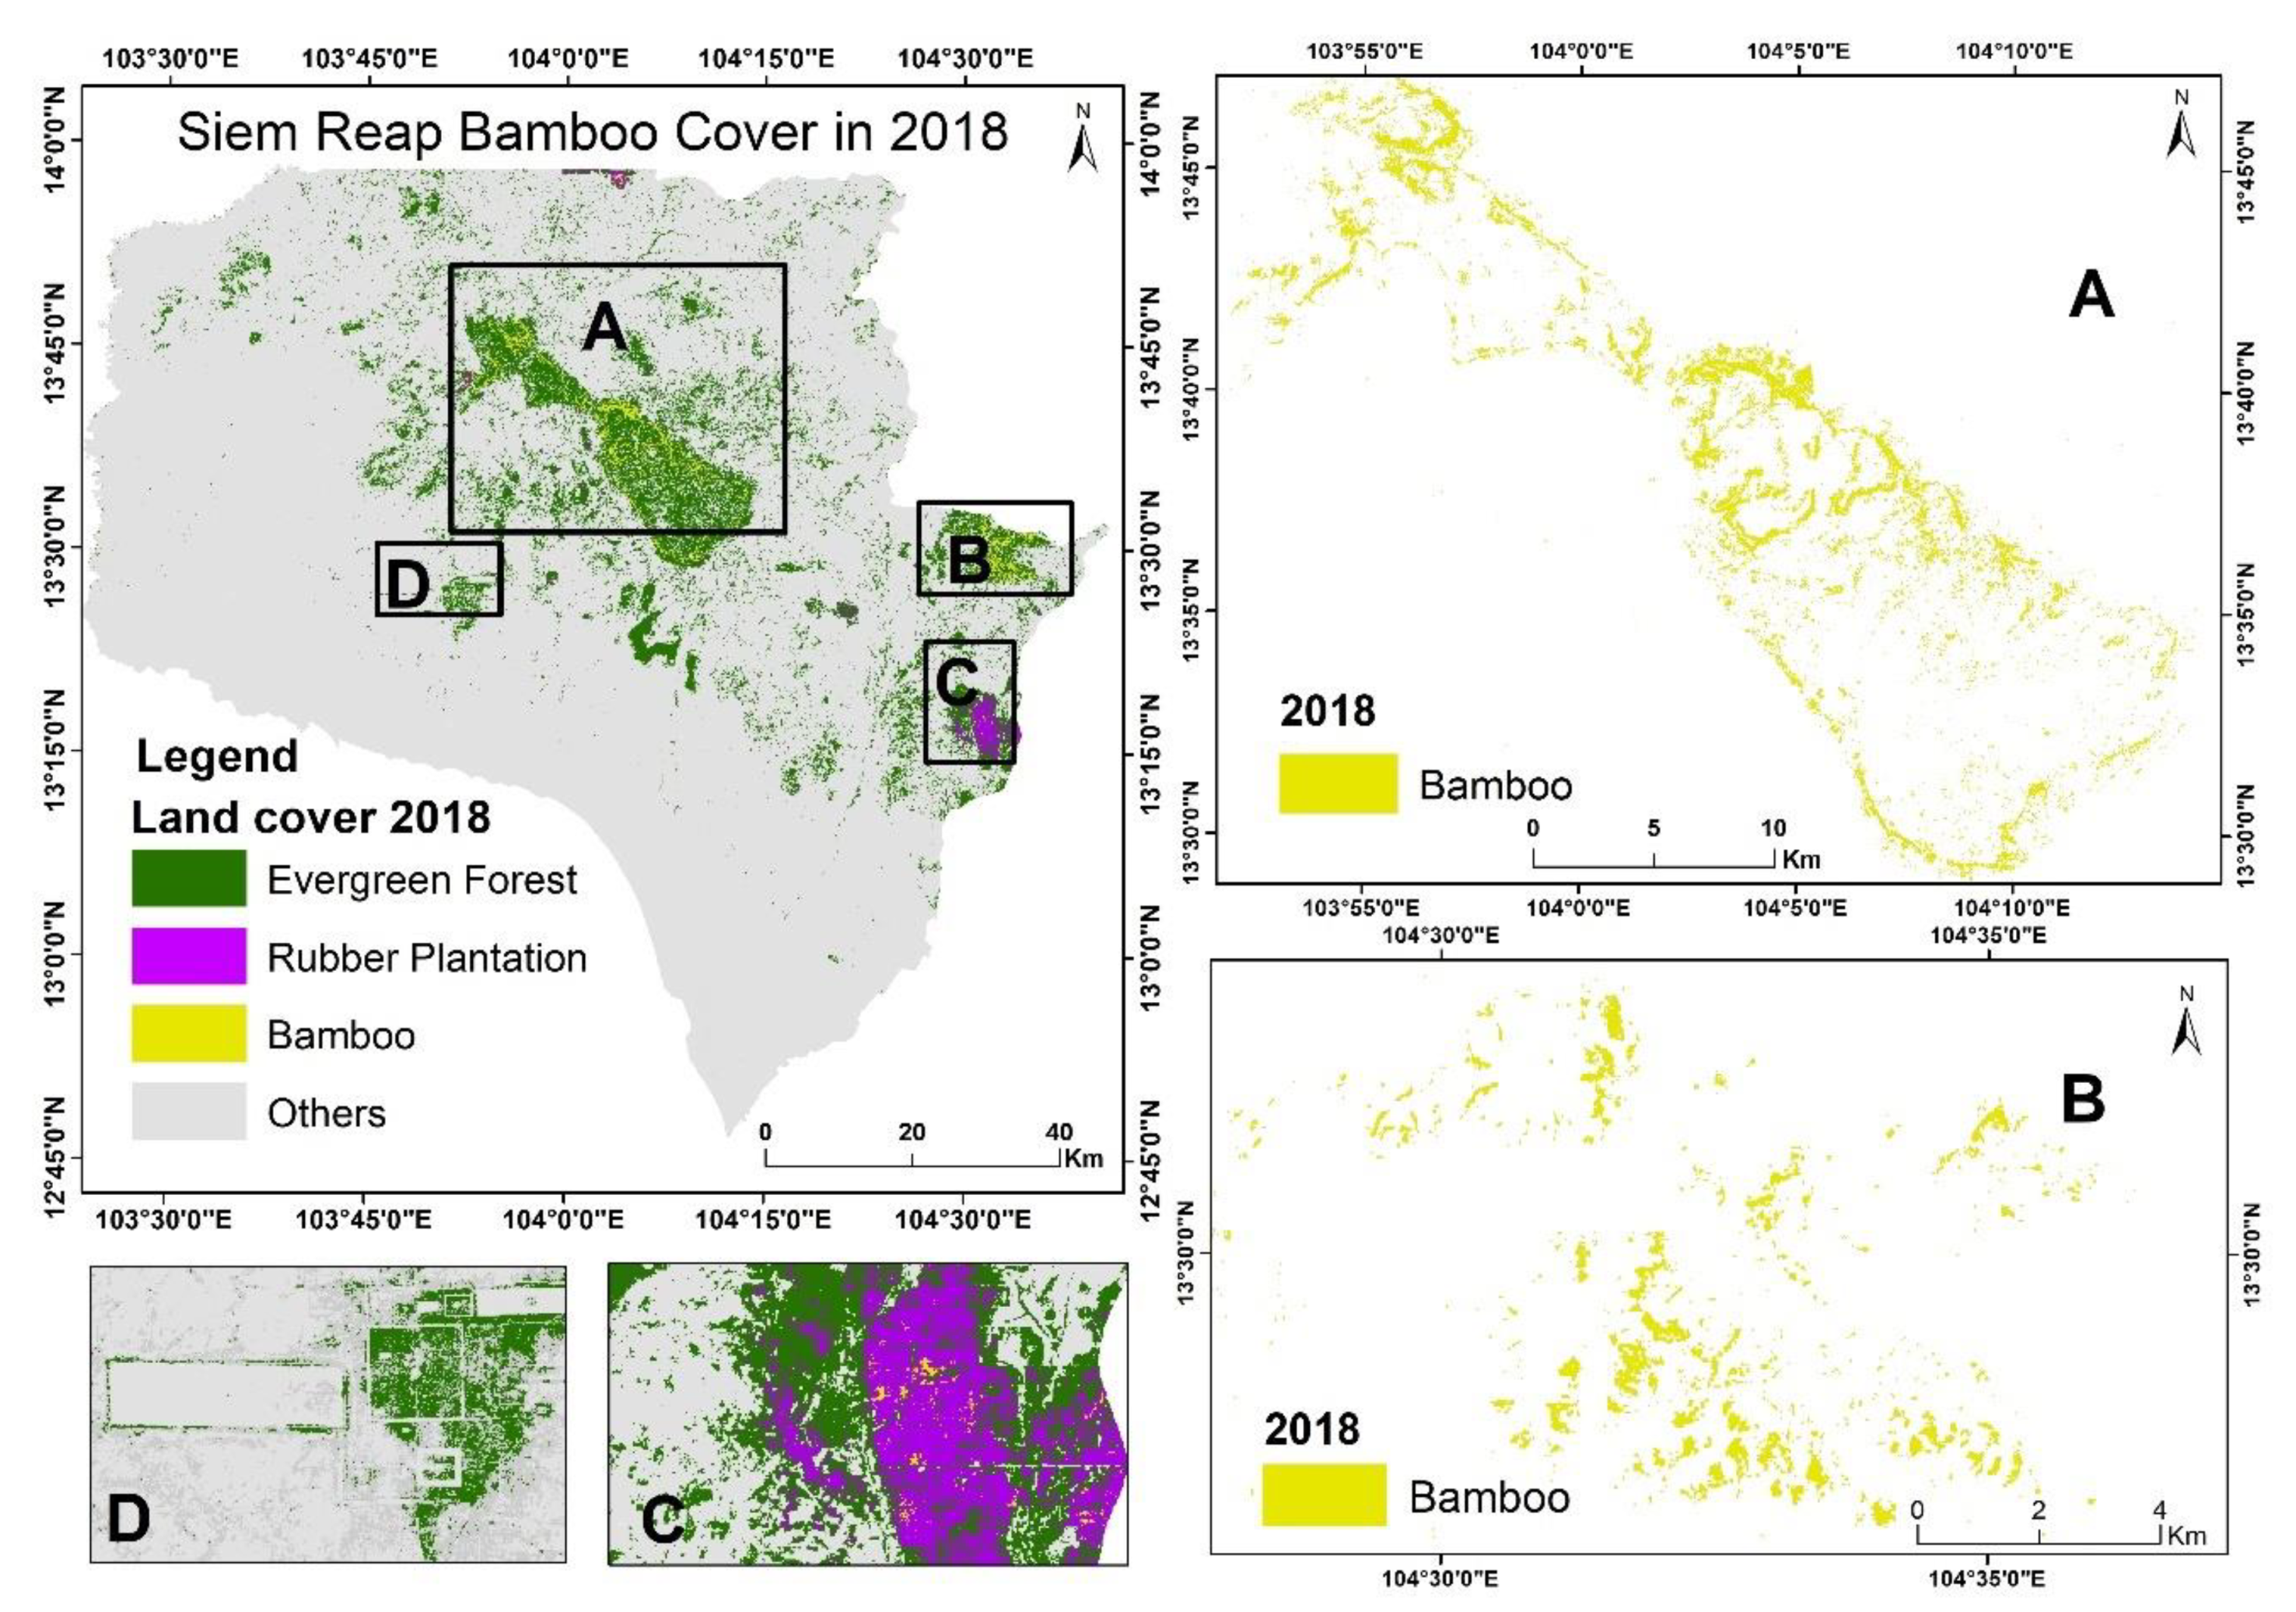
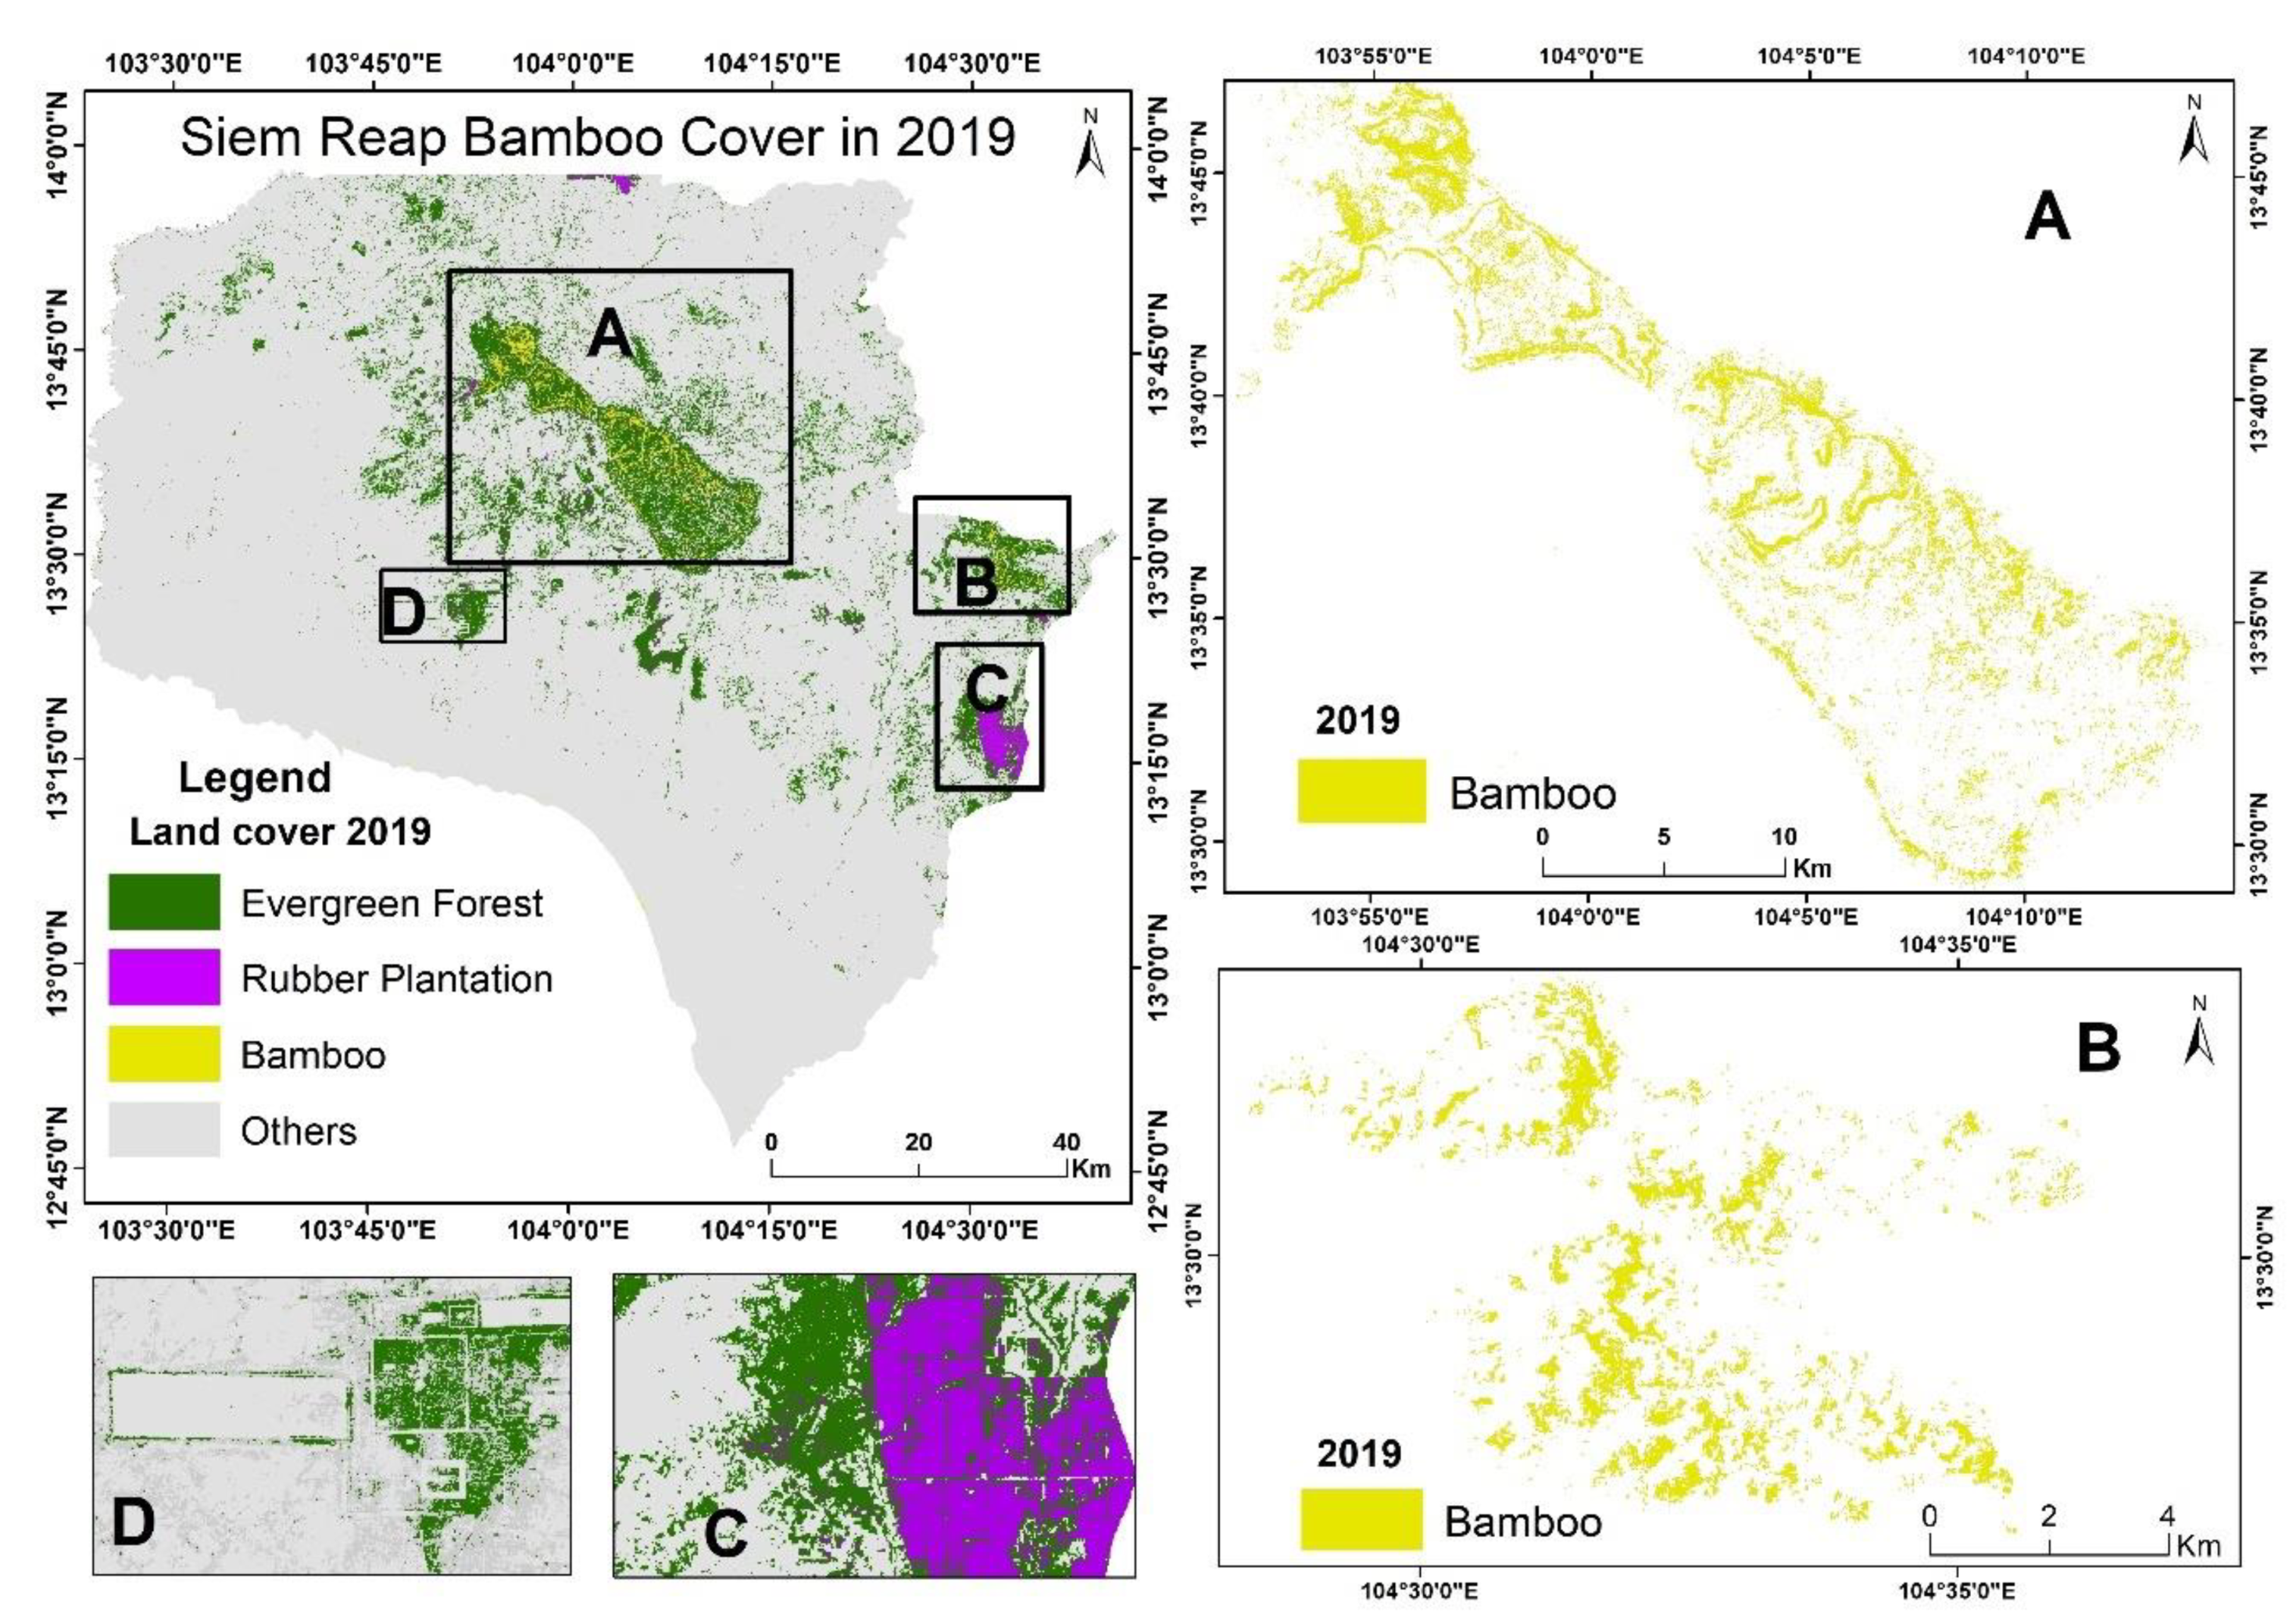
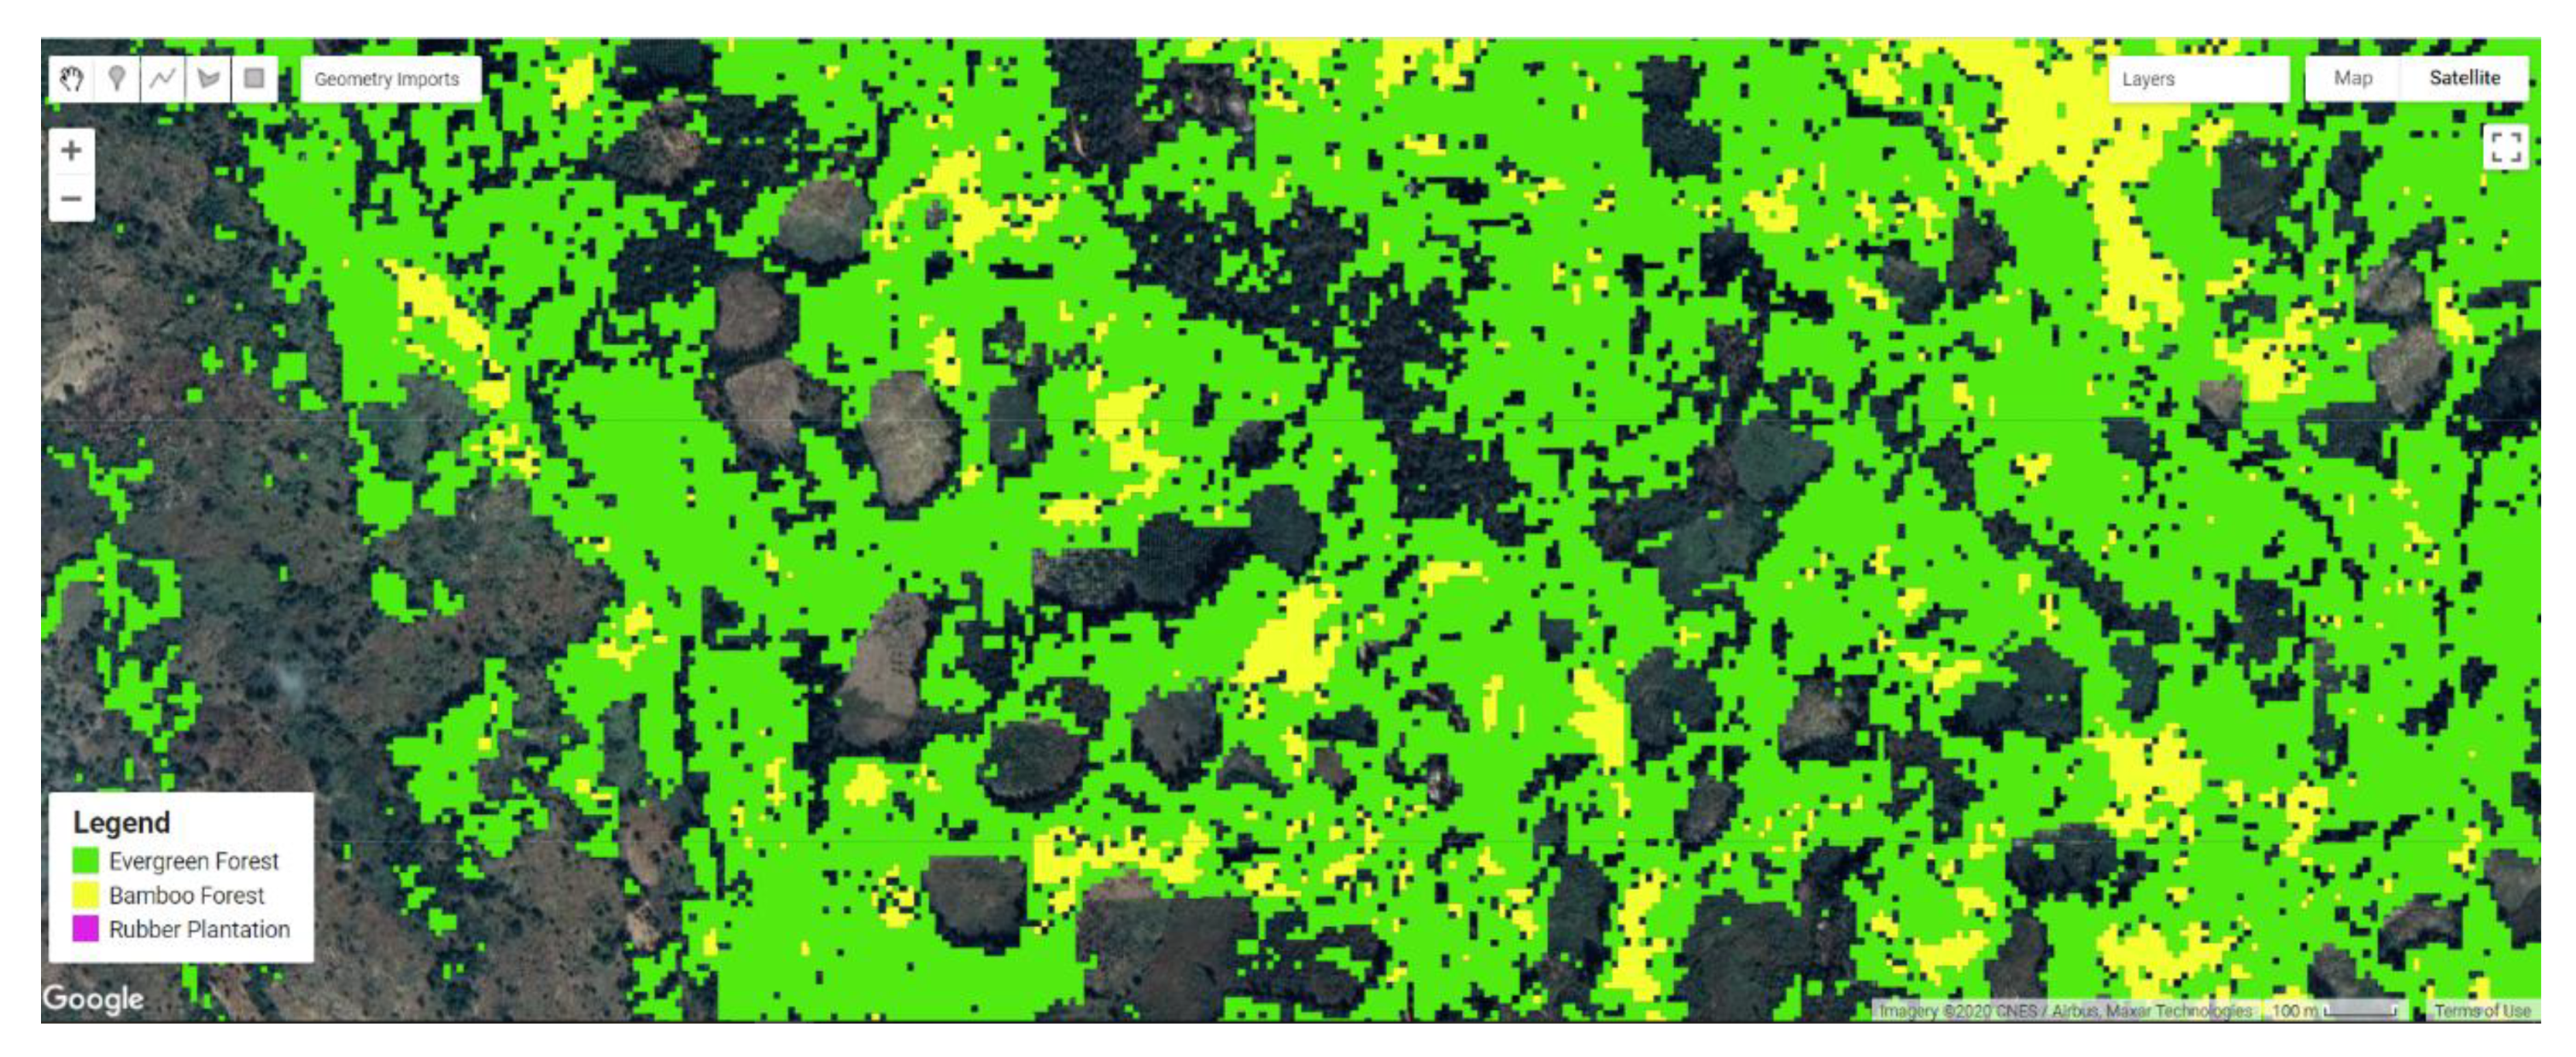
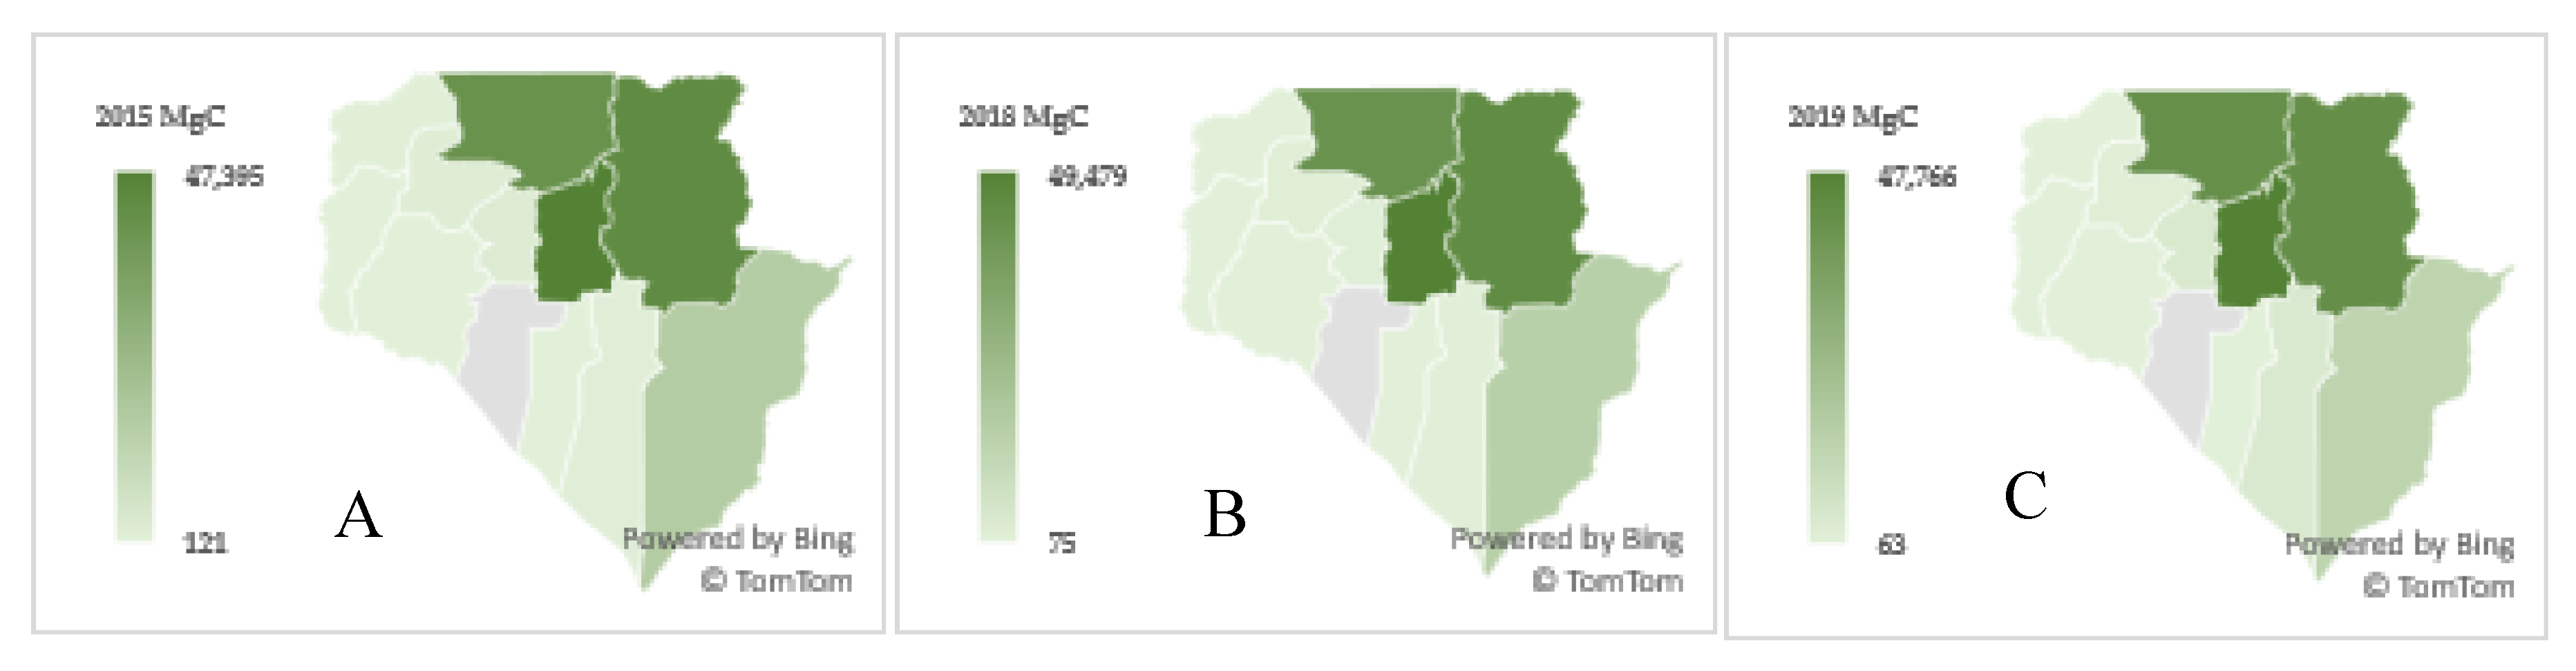
Although vegetation phenology thresholds have been developed for a wide range of mapping applications, their use for assessing the distribution of natural bamboo and the related carbon stocks is still limited, especially in Southeast Asia. Here, we used Google Earth Engine (GEE) to collect time-series of Landsat 8 Operational Land Imager (OLI) and Sentinel-2 images and employed a phenology-based threshold classification method (PBTC) to map the natural bamboo distribution and estimate carbon stocks in Siem Reap Province, Cambodia. We processed 337 collections of Landsat 8 OLI for phenological assessment and generated 121 phenological profiles of the average vegetation index for three vegetation land cover categories from 2015 to 2018. After determining the minimum and maximum threshold values for bamboo during the leaf-shedding phenology stage, the PBTC method was applied to produce a seasonal composite enhanced vegetation index (EVI) for Landsat collections and assess the bamboo distributions in 2015 and 2018. Bamboo distributions in 2019 were then mapped by applying the EVI phenological threshold values for 10 m resolution Sentinel-2 satellite imagery by accessing 442 tiles. The overall Landsat 8 OLI bamboo maps for 2015 and 2018 had user’s accuracies (UAs) of 86.6% and 87.9% and producer’s accuracies (PAs) of 95.7% and 97.8%, respectively, and a UA of 86.5% and PA of 91.7% were obtained from Sentinel-2 imagery for 2019. Accordingly, carbon stocks of natural bamboo by district in Siem Reap at the province level were estimated. Emission reductions from the protection of natural bamboo can be used to offset 6% of the carbon emissions from tourists who visit this tourism-destination province. It is concluded that a combination of GEE and PBTC and the increasing availability of remote sensing data make it possible to map the natural distribution of bamboo and carbon stocks.
Keywords: bamboo mapping; Google Earth Engine; Landsat 8 OLI; Sentinel-2; vegetation phenology; threshold values; threshold classification; carbon stocks; CDM; PBTC; REDD+ bamboo mapping; Google Earth Engine; Landsat 8 OLI; Sentinel-2; vegetation phenology; threshold values; threshold classification; carbon stocks; CDM; PBTC; REDD+
Graphical Abstract