Article

Mapping the Natural Distribution of Bamboo and Related Carbon Stocks in the Tropics Using Google Earth Engine, Phenological Behavior, Landsat 8, and Sentinel-2

by
Manjunatha Venkatappa
1,2,3,*,
Sutee Anantsuksomsri
1,2,
Jose Alan Castillo
4,
Benjamin Smith
5,6 and
Nophea Sasaki
7
1
Regional Urban and Built Environmental Analytics, Faculty of Architecture, Chulalongkorn University, 254 Phayathai Road, Pathumwan, Bangkok 10330, Thailand
2
Department of Urban and Regional Planning, Faculty of Architecture, Chulalongkorn University, 254 Phayathai Road, Pathumwan, Bangkok 10330, Thailand
3
LEET Intelligence Co., Ltd., Perfect Park, Suan Prikthai, Muang Pathum Thani, Pathum Thani 12000, Thailand
4
Ecosystems Research and Development Bureau, Department of Environment and Natural Resources, Forestry Campus, Los Baños, Laguna 4031, Philippines
5
Hawkesbury Institute for the Environment, Western Sydney University, Penrith, NSW 2751, Australia
6
Department of Physical Geography and Ecosystem Science, Lund University, Sölvegatan 12. S-223 62, Sweden
7
Natural Resources Management, SERD, Asian Institute of Technology. P.O. Box 4, Khlong Luang, Pathumthani 12120, Thailand
*
Author to whom correspondence should be addressed.
Remote Sens. 2020, 12(18), 3109; https://doi.org/10.3390/rs12183109
Submission received: 30 July 2020 / Revised: 14 September 2020 / Accepted: 15 September 2020 / Published: 22 September 2020

Abstract

:
Although vegetation phenology thresholds have been developed for a wide range of mapping applications, their use for assessing the distribution of natural bamboo and the related carbon stocks is still limited, especially in Southeast Asia. Here, we used Google Earth Engine (GEE) to collect time-series of Landsat 8 Operational Land Imager (OLI) and Sentinel-2 images and employed a phenology-based threshold classification method (PBTC) to map the natural bamboo distribution and estimate carbon stocks in Siem Reap Province, Cambodia. We processed 337 collections of Landsat 8 OLI for phenological assessment and generated 121 phenological profiles of the average vegetation index for three vegetation land cover categories from 2015 to 2018. After determining the minimum and maximum threshold values for bamboo during the leaf-shedding phenology stage, the PBTC method was applied to produce a seasonal composite enhanced vegetation index (EVI) for Landsat collections and assess the bamboo distributions in 2015 and 2018. Bamboo distributions in 2019 were then mapped by applying the EVI phenological threshold values for 10 m resolution Sentinel-2 satellite imagery by accessing 442 tiles. The overall Landsat 8 OLI bamboo maps for 2015 and 2018 had user’s accuracies (UAs) of 86.6% and 87.9% and producer’s accuracies (PAs) of 95.7% and 97.8%, respectively, and a UA of 86.5% and PA of 91.7% were obtained from Sentinel-2 imagery for 2019. Accordingly, carbon stocks of natural bamboo by district in Siem Reap at the province level were estimated. Emission reductions from the protection of natural bamboo can be used to offset 6% of the carbon emissions from tourists who visit this tourism-destination province. It is concluded that a combination of GEE and PBTC and the increasing availability of remote sensing data make it possible to map the natural distribution of bamboo and carbon stocks.

Graphical Abstract

1. Introduction

Bamboos are evergreen perennial flowering plants that can be found in the tropical and subtropical regions of the world [1]. Bamboos provide important ecosystem goods and services to people: for example, they serve as sources of food and raw materials for construction [2] and play important roles in soil erosion control, water conservation, and land rehabilitation [3]. Bamboo forests also have a potential role in climate change mitigation, acting as sinks or sources of atmospheric carbon [2,4], depending on how they are managed. Despite such importance, studies on the natural distribution of bamboos remain limited, making it difficult to assess their abundance or measure and monitor their carbon stocks. Therefore, it is critically important to map bamboo distributions using fast and timely technologies for transparent, speedy, and monitoring at scale. Understanding the natural distribution of bamboos also allows us to assess the roles of bamboos in climate change mitigation and rural community development.
Bamboos are plants in the subfamily Bambusoideae of Gramineae. More than 1500 species are found in the tropical and subtropical regions of Asia [1]. Bamboos are considered non-timber forest products (NTFPs) with the ability to provide food, raw materials [2], and other ecosystem services to industries and local people [2,5]. Natural bamboo and plantations can be managed to mitigate climate change [3,6]: as fast-growing, high-yield plants they are capable of sequestering between 5 and 12 tCO2 ha−1 year−1 [3,5,6]. Therefore, the management of bamboo forests can be eligible under the REDD+ scheme (reducing emissions from deforestation and forest degradation, forest conversation, sustainable management of forests, and enhancement of forest carbon stocks) of the United Nations Framework Convention on Climate Change (UNFCCC) [6]. It can also contribute to the achievement of Sustainable Development Goals (SDGs) 7, 13, and 15 [3]. Nevertheless, effective management of bamboo forests requires an understanding of their distribution through accurate mapping [7].
Remote sensing imagery has been used for various phenological applications in land use and land cover classification [8], mapping of rubber plantations [9], cropland [10,11], and bamboo mapping [12]. Researchers have used medium-resolution Landsat satellite data for the assessment of land cover changes over the past 40 years. Such data have become freely available in global archives that offer detail on land use and land cover dynamics [13,14,15]. These Landsat data have 30 m spatial resolution and a 16-day temporal interval. Launched in February 2013, Landsat 8 is the latest data acquired using the Operational Land Imager (OLI) and Thermal Infrared Sensor sensors in addition to the existing Landsat series of NASA. The recent launch of the Sentinel-2 satellite mission of the European Space Agency in 2015 and 2017 provides a new opportunity for land-based mapping and monitoring in the tropics using Sentinel-2′s high-resolution multispectral data and 10-day temporal interval. While Landsat 8 OLI data have been used for phenology-based studies, very few studies have evaluated the potential use of Sentinel-2 imagery data for phenology-based land cover mapping. Previous studies attempted to examine surface phenology for land use and land cover classification [13] and rubber plantation [9,16] and cropland mapping [17] in tropical regions [11]. For example, Schwieder et al. [18] used remote sensing technologies to assess forest carbon stocks [18]. However, challenges remain in determining the phenology-based threshold values for bamboo distribution mapping because of the rapid changes in phenological behavior between seasons [19,20]. Such rapid changes in phenology make it difficult to avoid the misclassification of bamboo. A recent study indicates that the mapping of bamboo distribution needs to employ robust classification methods to avoid misclassification [13]. Freely available moderate-resolution remote sensing data in a cloud-computing platform offers significant potential [12] as a robust methodology, for example in developing countries in Southeast Asia such as Cambodia, where remotely sensed reconstructions of past land cover change have been limited.
Previous studies that employed current mapping techniques for bamboo stands either used very high resolution images without regard to temporal spectral behavior [7,19,21] or time-series Landsat data [12,21] and the enhanced vegetation index (EVI) [22,23,24,25,26,27] with an additional focus on temporal information. The majority of these studies also implemented traditional imagery acquisition and processing methods, downloading large-sized images and processing them using image processing software. This traditional approach is not only time-consuming, especially when dealing with time-series imagery, but also requires a workstation with a high capacity for image processing and storage [13]. Available studies on bamboo mapping were mostly carried out in subtropical China, India, and East Africa. Several studies have used remote sensing applications to estimate carbon stocks [12,28,29]. Sasaki et al. [30] estimated carbons stocks in Cambodian forest types, including bamboo, using four carbon pools—above-ground biomass, below-ground biomass, deadwood, and litter—by applying the Intergovernmental Panel on Climate Change (IPCC) method [31]. Attempts have also been made to study the natural distribution of bamboo in Cambodia using commercial remotely sensed data such as Phased Array type L-band Synthetic Aperture Radar [32] and Light Detection and Ranging [33]. Although these studies yielded some information about bamboo distribution, their methods are labor-intensive and costly in terms of computation power.
The recent launch of Google Earth Engine (GEE) offers an enormous opportunity for time-series image acquisition and processing in a fast cloud-computing environment [34,35], which can be used to study the natural distribution of bamboo free of cost. GEE’s fast cloud-computing technology and its available remote sensing data, specifically Landsat and Sentinel satellite products, have been used for a wide range of applications at the local and global scales [13,36,37,38]. Recently, GEE has been extensively used for surface phenology mapping [15,39]. However, the literature is limited in studies that used the GEE cloud-computing platform for bamboo mapping using the vegetation phenology threshold approach. Furthermore, finding low-cost technologies for assessing carbon sequestration is important to support mitigation efforts in relation to the ongoing climate crisis [18,40].
The present study was designed to determine threshold values for naturally distributed bamboo using a GEE harmonic and regression model for Landsat 8 OLI and to map the bamboo distribution and related carbon stocks in Siem Reap Province in Cambodia for the years 2015, 2018, and 2019 using a phenology-based threshold classification method (PBTC) [13] and freely available Landsat 8 OLI and Sentinel-2 collections in GEE.

2. Study Materials and Methods
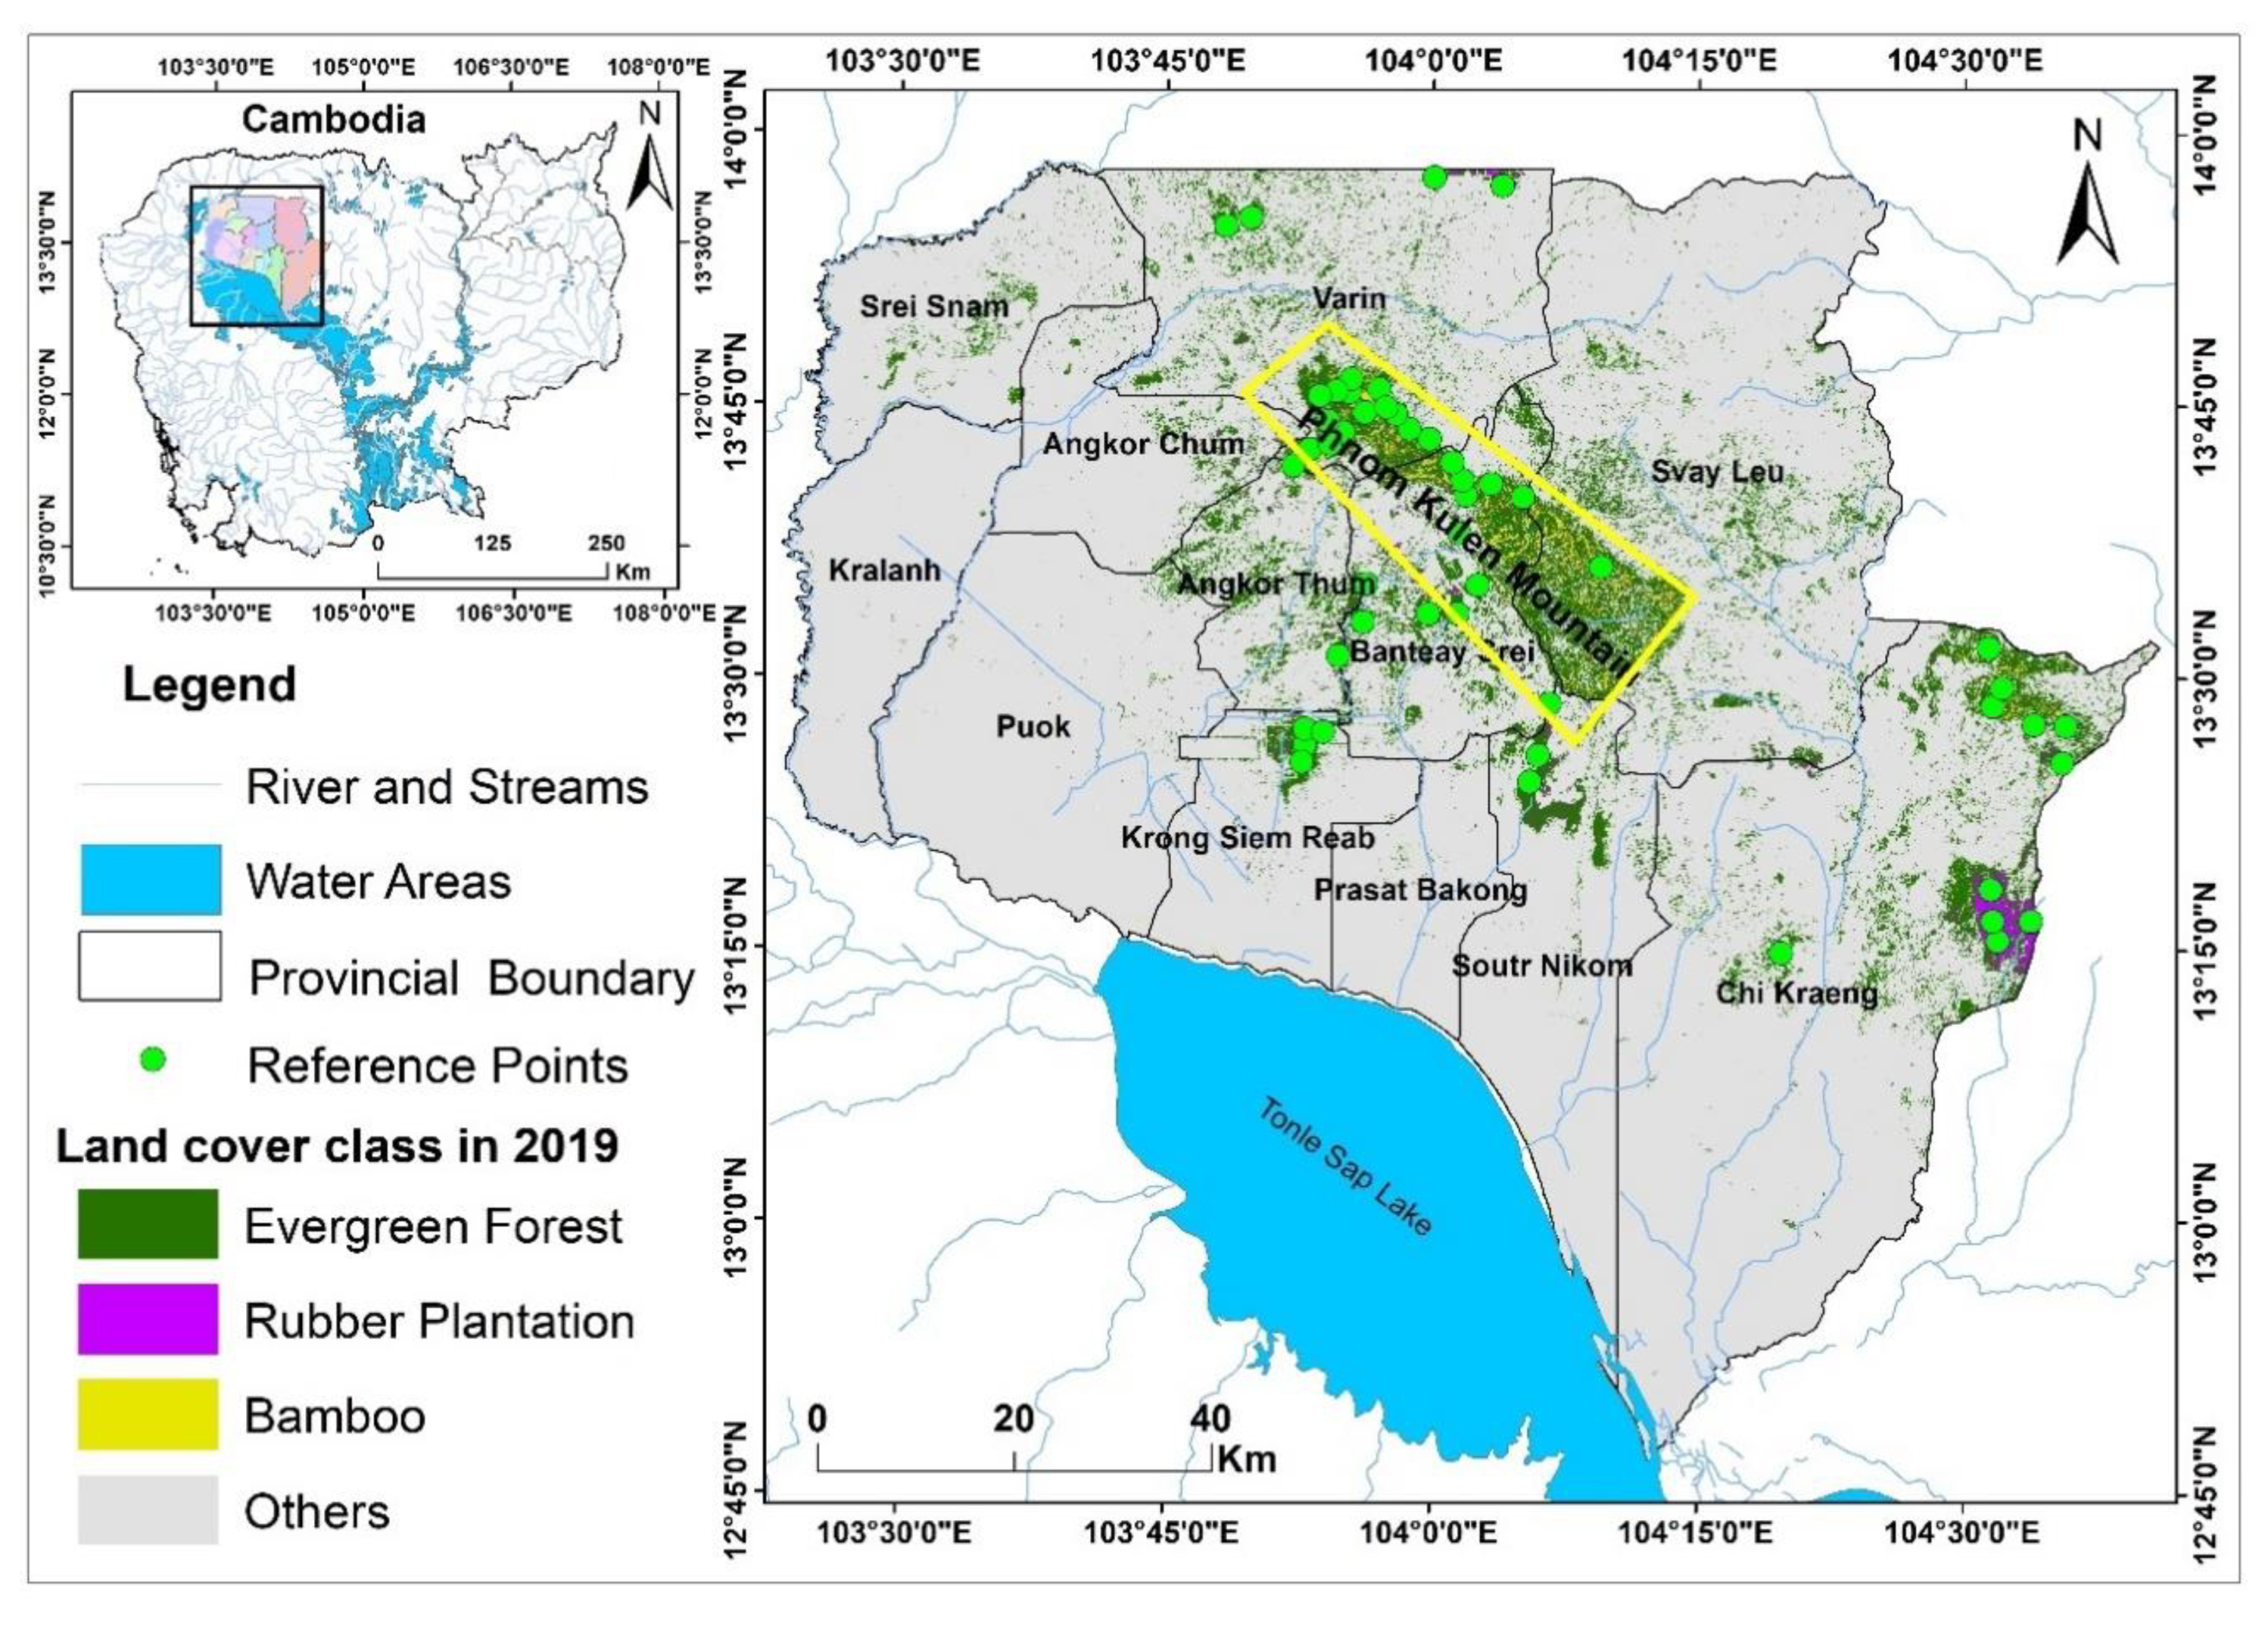
2.1. Study Area

Siem Reap Province, Cambodia, was chosen for this study because it has all forest types found in Cambodia, except Mangrove forest. Siem Reap (Figure 1) is one of the fastest-developing regions in Cambodia because of its proximity to the tourist attractions of the Angkor Wat complex and Tonle Sap Lake. Although tourism is an important income source for some local people, the majority still depend on forest products and agriculture for their livelihoods [41].
Bamboo grows naturally in Cambodia’s tropical climate. Cambodia has about 10 species in four genera of bamboo, namely, Bambusa, Arundinaria, Dendrocalamus, and Oxytenanthera. Bambusa has a more extensive distribution in the country as compared with Oxytenanthera and Arundinaria. Bamboo species such as Arundinaria ciliata, Arundinaria pusilla, and Bambusa blumeana grow beneath evergreen, semi-evergreen, and deciduous trees [42]. Several bamboo species in the region have commercial value as a material for construction and for making agricultural tools, handicrafts, and paper. The above three species, as well as Dendrocalamus spp., are used as food and for making kitchen utensils, matting, slat traps, and floats [42].
The major forest types are deciduous, evergreen, flooded forest, and bamboo. Dense bamboo stands are found in the northern part of Cambodia in evergreen and deciduous forests, around Tonle Sap Lake, and along stream banks [42]. Some ethnic groups rely heavily on bamboo products for their livelihoods, especially in the north and northeast regions, which include some parts of Siem Reap Province [42]. Bamboo remains widely distributed in the remaining forested area and continues to support rural areas. A recent study by Sasaki et al. [30] showed that Cambodia’s forest carbon stocks, including bamboo, are helping the government’s efforts to reach their national emission reduction targets [30,43]. In 2018, the government included bamboo species as a major forest type [43].

2.2. Remote Sensing Data
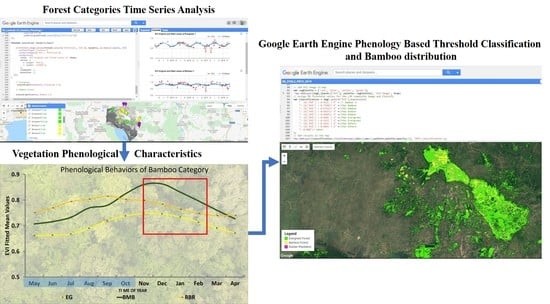
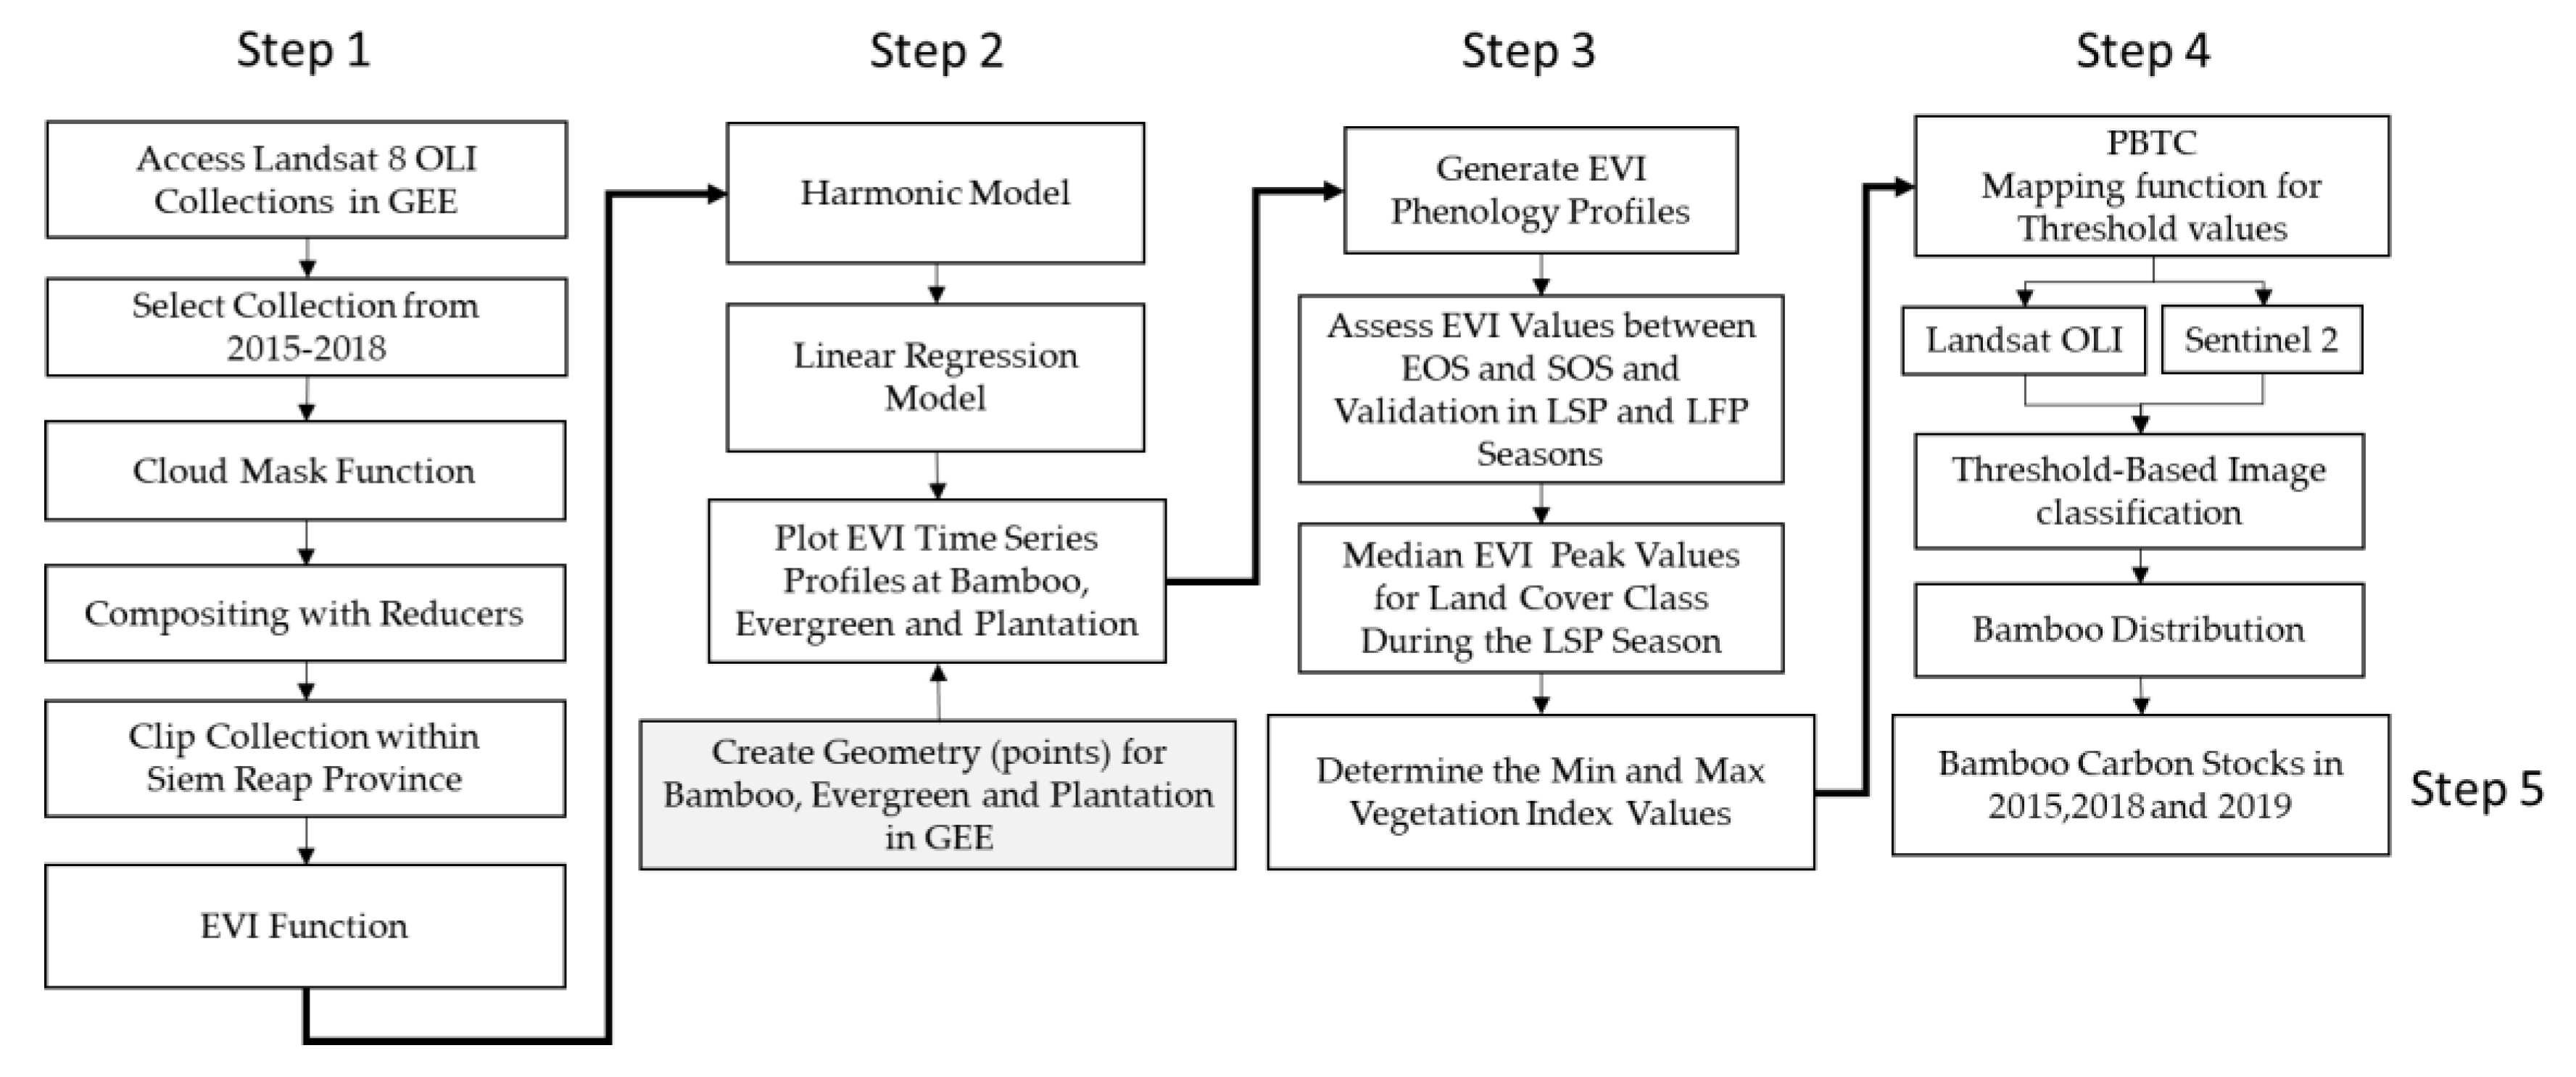
Google Earth Engine provides ready-to-use remote sensing data in an up-to-date library with moderate to high-resolution imagery. To characterize vegetation phenology, we used 297 moderate-resolution 30 m Landsat 8 OLI top-of-atmosphere (TOA) collections from 2015 to 2018 (Table 1). Forty Landsat 8 OLI collections that cover the study area of Siem Reap Province were sourced between December and February of 2015 and 2018 for bamboo threshold-based classification [13] (Table 2). To further explore vegetation threshold values for Sentinel-2 products, we accessed 422 Sentinel-2 images from January to December 2019 (Table 2).

2.3. Methodology

Figure 2 illustrates the methodological framework of selected vegetation phenological assessment and phenology-based threshold classification methods for bamboo mapping and bamboo carbon stock assessment.
Here, we used JavaScript programming in GEE to collect time-series of Landsat 8 OLI image collections from 2015 to 2018 and applied cloud mask functions (less than 45%) to exclude cloud pixels prior to the assessment of land use classification (Figure 2, Step 1) [10,34,37,45,46]. We then applied an image compositing and reducer function to select the most recent pixel in the collections.
We applied a composite median reducer function to calculate the median value of each image collection. The median reducer function removes clouds in the image, which have high values, and shadows, which have low values [35,47]. The output composite value is the median in each band over time [34,46]. We applied a clip function to subset the image collections within the study region and then calculated the EVI using Equation (1) (Figure 2, Step 1) (Appendix A):
E V I = G × ( N I R R E D ) ( N I R + C 1 × R E D C 2 × B L U E + L )
where G = 2.5 (gain factor) [48,49,50]; C1 = 6 and C2 = 7.5 (aerosol correction factors); L = 1 (canopy background adjustment factor) [48,49,50]; and NIR (near infrared) is Landsat band 5 and Sentinel-2 band 8, RED is band 4 in both Landsat and Sentinel-2, and BLUE is band 2 in both Landsat and Sentinel-2 [49].
In assessing the vegetation phenological profiles of selected land cover classes, we applied a time-series analysis for EVI by adapting harmonic and regression model JavaScript algorithms from our recent study [13] (Figure 2, Step 2). We selected 65 geometry locations (Figure 1 and Figure 3D), including 30 for bamboo forest, 30 for evergreen forest, and 5 for rubber plantations, where no large land cover changes had occurred during the phenological analysis period (2015 to 2018). As we observed during the field survey in 2019, the larger portion of bamboo distribution was found in and around the Kulen Mountain area, including Varin, Banteay Seri, and Svay Leu Districts, and in the northern part of Chi Kreng District (Figure 1). Thus, we selected 10 sites with a large homogeneous extent of bamboo around the Kulen Mountain for creating the geometry for analyzing the phenological behavior of bamboo.
For the rubber plantation samples, we created four geometry locations in Chi Kraeng District, two in the northern part of Varin, two in Angkor Thom, and two locations in Banteay Srei Districts. For evergreen forest geometries, we created three in the Angkor Wat region, where there are permanent sampling plots for evergreen forest [51], and seven geometries were created within the study area (Figure 3). Eventually, we generated the time-series and fitted and original EVI profiles for each selected vegetation category to assess phenological behaviors [52] and determine the threshold values [13] from Landsat 8 OLI collections during the leaf-shedding phenology stage (December to March) from 2015 to 2018 (Figure 2, Step 2).
In Figure 3A, is the code window for the GEE time-series indices and harmonic regression JavaScript code developed in GEE to assess the phenological behaviors of selected vegetation categories; Figure 3B is the graphical window showing the harmonic and time-series phenological behaviors of evergreen, bamboo, and rubber vegetation’s fitted (blue line) and original (red dots) vegetation index values from 2015 to 2018; Figure 3C shows geometry inputs of selected vegetation categories; Figure 3D is the map window showing the geometry of evergreen (green), bamboo (yellow), and rubber plantation (purple) in Siem Reap Province. The background image is Landsat 8 OLI composite EVI data in GEE.
Google Earth Engine generates EVI time-series profile datasets in a comma-separated values file format (CSV). Using the GEE export option, we exported 25 (10 evergreen, 10 bamboo, and five rubber plantations) CSV profiles and used the Pivot Table function of Microsoft Excel to obtain the average EVI values per year and month over four years, from 2015 to 2018 (Figure 2, Step 3).
The time-series analysis of fitted vegetation indices allowed us to quantify the phenological behaviors of bamboo, rubber, and evergreen forest categories. To do this, we first assessed the fitted vegetation index profiles derived from the time-series harmonic regression model using compressed (15-day intervals) Landsat 8 OLI collections. We then calculated the average of the mean fitted vegetation index values by creating 120 phenological profiles for selected land use categories (2015, 2016, 2017, and 2018) during the leaf-flushing phenology stage (LFP) at the start of the season (SOS) and the leaf-shedding phenology stage (LSP) at the end of the season (EOS) over four years. Previous phenological studies showed that fitted index values have higher accuracy in determining the vegetation threshold values for mapping during the LSP stage, locally called EOS [13].
We selected the fitted EVI profiles and assessed the phenology-based vegetation index values from November to April (EOS) or during the LSP season to determine the separation of bamboo index profiles from evergreen forests and rubber plantations from 2015 to 2018. We then created 12 average-fitted EVI phenological profiles for the three land use categories by year to estimate the average EVI profiles and determine the threshold values for bamboo forest, evergreen forest, and rubber plantation and to classify bamboo distribution in the region during the mid-dry season (Figure 2, Step 3). Because the purpose of this study was to determine the natural distribution of bamboo forest, we did not consider the vegetation index values for other land cover categories in this study, which fell below the evergreen forest threshold values.
Since the resulting Landsat 8 OLI phenology threshold values did not match the Sentinel-2 composite EVI for the selected land use categories, to classify the Sentinel-2 composite EVI data by using the PBTC method, we assigned Min = 0.6712 and Max = 0.7760 for bamboo, 0.6695–0.6623 for rubber, and 0.555–0.660 for the evergreen forest category by modifying Landsat Thematic Mapper (TM) threshold values from our previous phenological study [13]. We used JavaScript to build the PBTC algorithm [13] for classifying the median EVI data from composite Landsat OLI and Sentinel-2 images. As depicted in Figure 2 (Step 4), the steps used for the composite image and pixel-based threshold mapping of individual land cover categories were as follows:
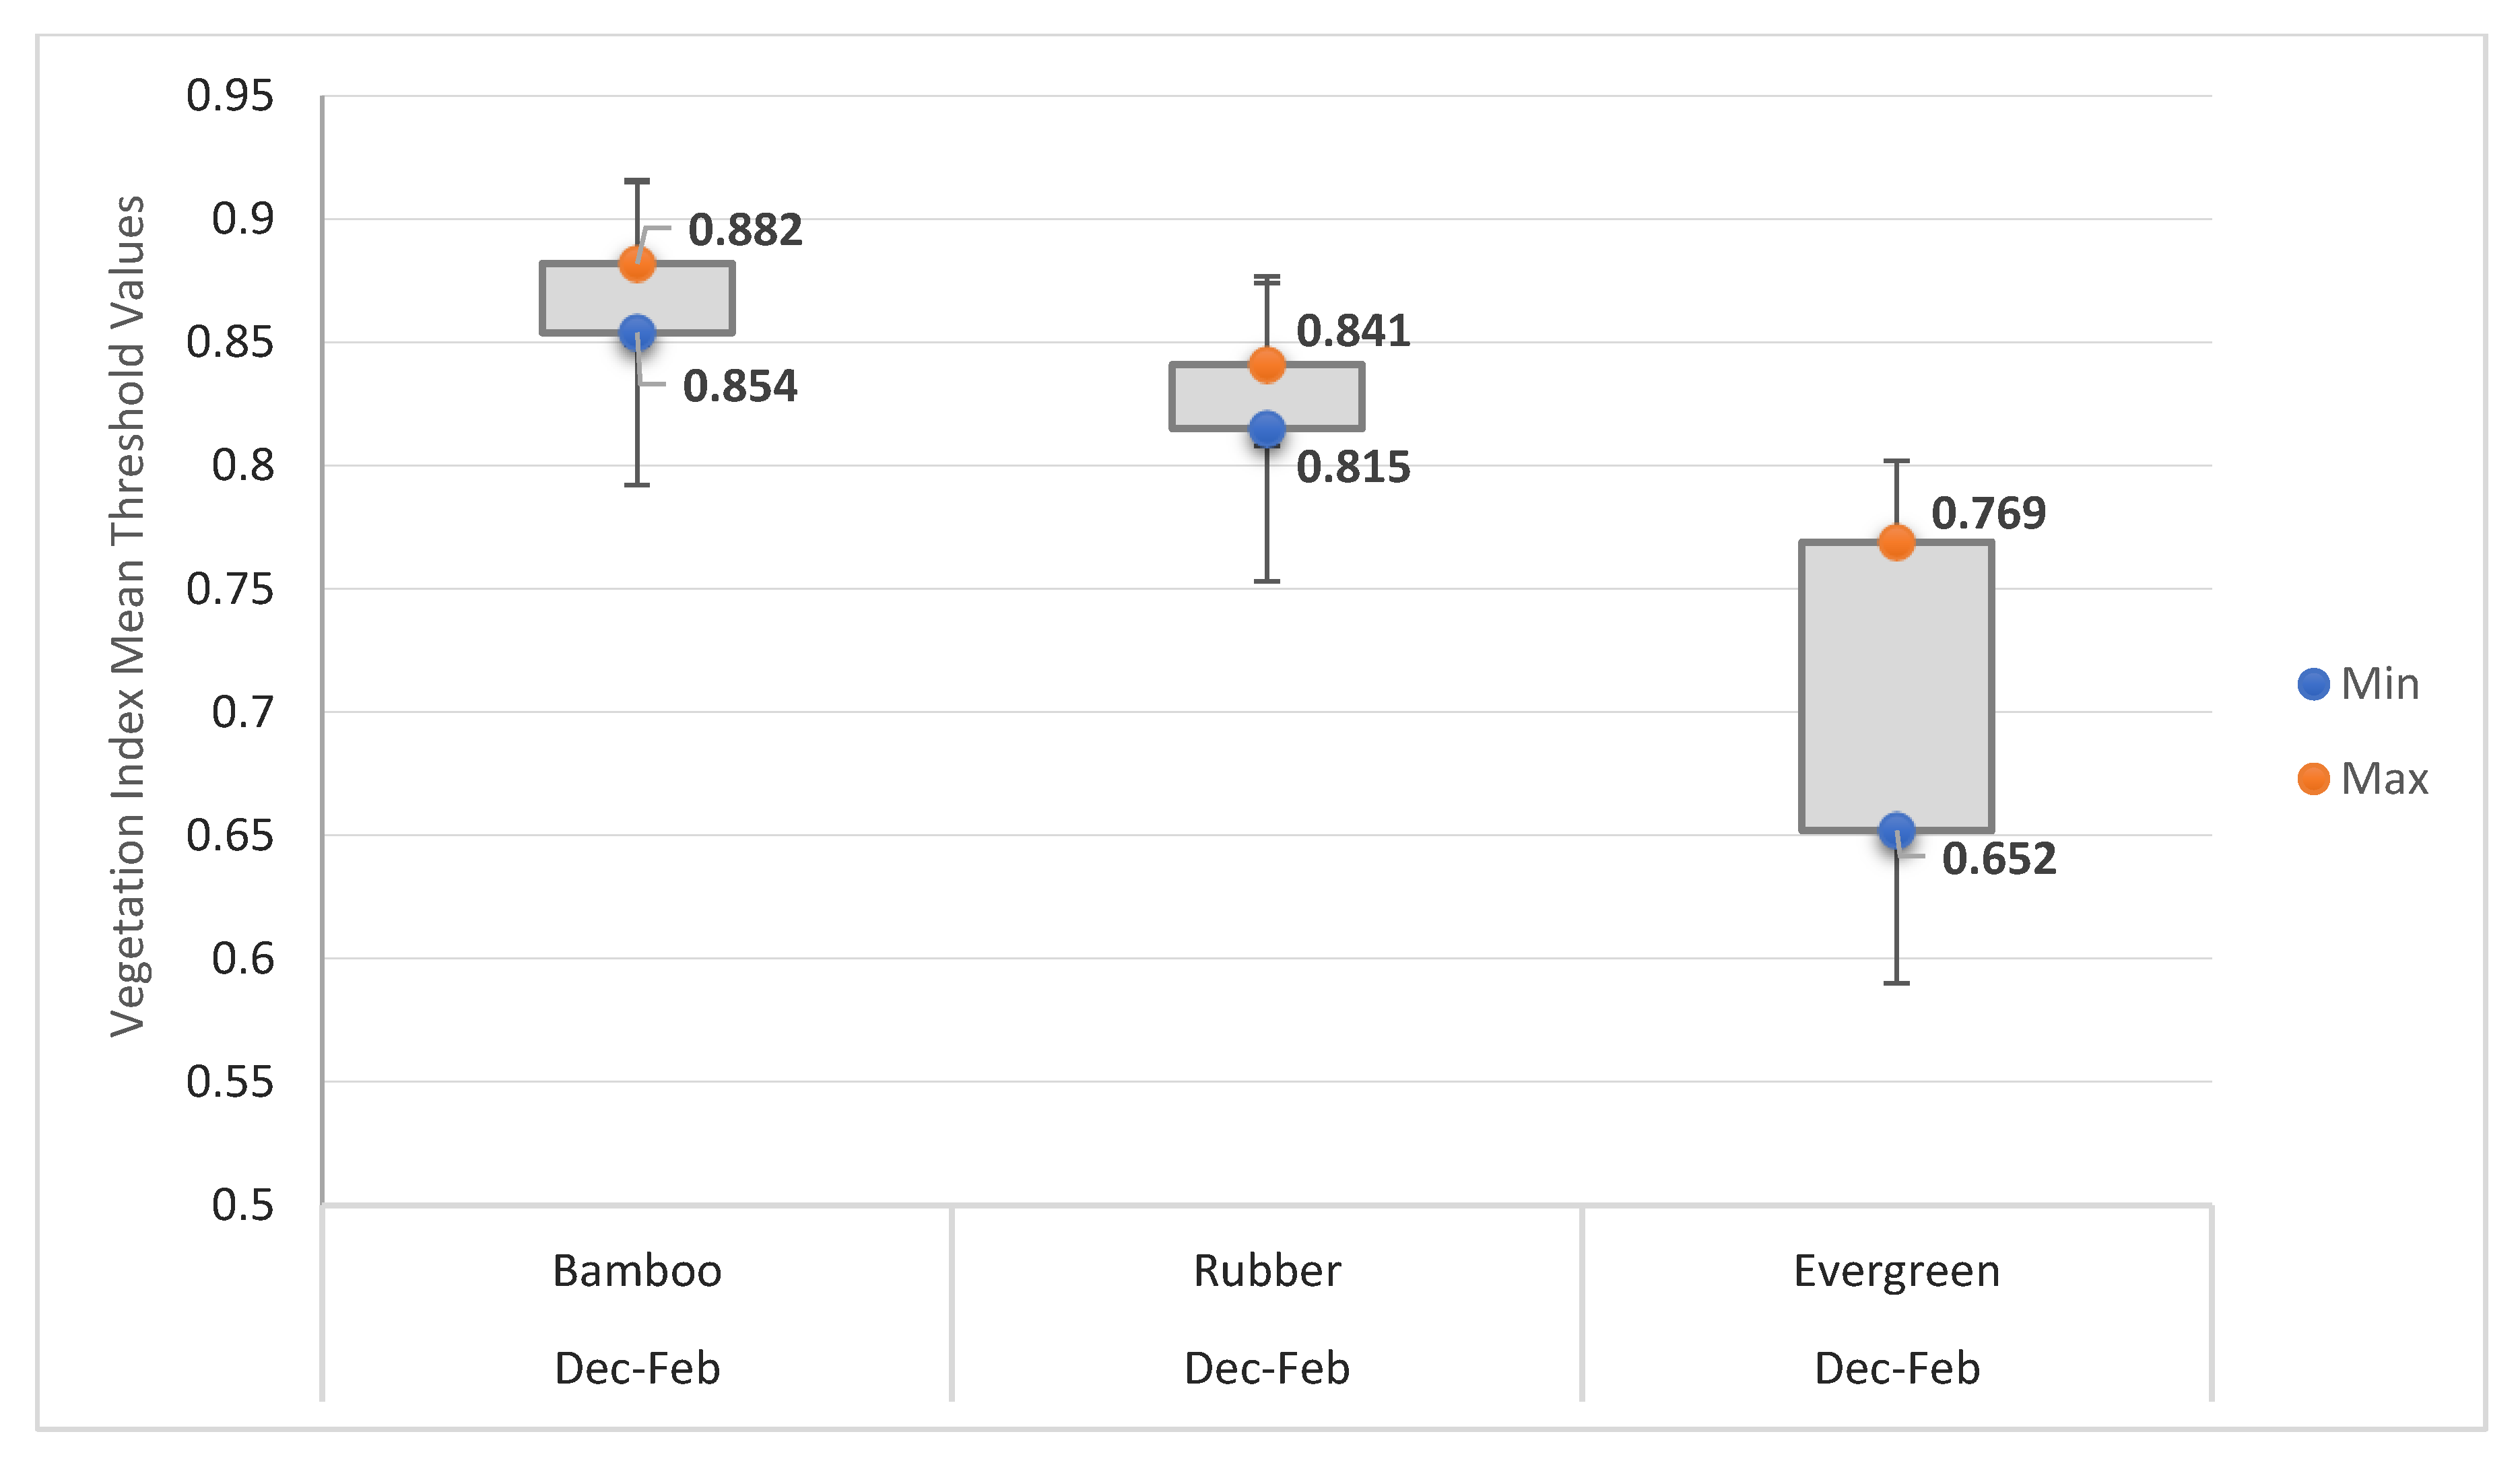
  • Imagery preprocessing and time-series collections were filtered for the dry mid-phenology season (from December to February).
  • Image filter functions were applied to select image collections in the particular phenological period within the study region [13].
  • To develop the mapping function for EVI data, the GEE image reducer and median function was used to form composite time-series images to obtain a median EVI [35,53].
  • The PBTC function was applied to the bamboo forest, evergreen forest, and rubber plantation categories.
The final PBTC maps were used to map the bamboo distribution and calculate the bamboo carbon stocks in Siem Reap Province (Figure 4).

2.4. Accuracy Assessment

Google Earth higher-resolution imagery (VHR) is free of cost and can be used directly as a base source for validating land use, land cover maps [54] because it provides the most accurate data for selecting the most appropriate reference points that are very important for validation. The images are updated whenever new images become available. Depending on the sensor, the image resolution ranges from 30 m to 15 cm. Utilizing the time-lapse feature in Google Earth Pro allows the user to view zoomable images as far back as 30 years, which is ideal for validating land use, land cover maps [55] and performing investigation and preliminary studies with suitable accuracy [56,57] by applying recognized protocols, as recommended by [58]. Here, a stratified random sampling technique was employed for the validation of phenology-based threshold classified maps. From the number of random points generated in ArcGIS, a total of 1500 accuracy points were selected within the evergreen forest, bamboo, and rubber plantation land cover categories. We excluded the random points that fell within the water and other land cover categories. Because the spatial distribution of bamboo and rubber plantation areas is smaller than that of the evergreen forest and other land cover classes, we selected random reference points within the three forest categories to acquire a considerable number of reference points for the bamboo and rubber plantation category areas to better assess mapping accuracy [59].
PBTC maps were exported to Google Drive using the export function in GEE, and we used these maps in ArcGIS to transform land cover labels into 1500 accuracy points by applying ArcGIS spatial-join and related tools. We then used these accuracy points in Google Earth Pro to verify and validate the 1500 points for Landsat OLI (2015 and 2018) and Sentinel-2 (2019) maps (Figure 5).
These accuracy points were compared to the matching land cover labels using the VHR imagery in Google Earth Pro. The percentage of agreement was recorded in an accuracy table, and classification accuracy was assessed using a confusion matrix in Microsoft Excel. We then calculated overall accuracy, producer’s accuracy, user’s accuracy, and kappa coefficients from the confusion matrix [13,58] for PBTC maps.

2.5. Bamboo Carbon Stock Assessment

To implement the REDD+ scheme, Cambodia employs a national definition of forest that is consistent with the Global Forest Resources Assessment [60] and considers bamboo to be one of the main forest categories for net carbon sequestration from land use, land use change, and forestry [60]. Conventionally, forest inventories are used for measuring, reporting, and verification (MRV) of deforestation and forest degradation in the tropics to provide the needed information for establishing baseline emissions against which mitigation measures and performance can be assessed [61,62,63].
Equation (2) was applied for calculating carbon stocks in the existing bamboo areas and is presented below [30,60]:
T C S = i = 1 12 B F i × C S
where TCS is the total carbon stocks of bamboo forest in 2015, 2018, and 2019; BFi, is the area of bamboo forest in district i in Siem Reap Province at any given time; and CS is the carbon stocks in bamboo forest in the respective years (i.e., 2015, 2018, or 2019). Sasaki et al. [30] estimated the bamboo carbon stocks in Cambodia to be 57.4 Mg C ha−1 [64] for all pools except organic soil carbon. Here, we used the same value to calculate the bamboo carbon stocks in 12 districts in Siem Reap Province in 2015, 2018, and 2019 (Figure 2, Step 5) [30,60].
If natural bamboo forests are completely cleared, total emissions from such clearing were estimated using
C E = T C S × 44 12
where CE is carbon emission (Mg CO2), TCS is the total bamboo carbon stock at any given time of clearing (in 2015, 2018, and 2019) in Equation (2), and 44/12 is the molecular weight ratio of carbon dioxide to carbon [30,65].
On the other hand, if all these natural bamboo forests are fully protected and the avoided carbon emissions (ACE) are used to offset the carbon emissions from tourists visiting the province, the contribution of bamboo forest to climate change mitigation was estimated using
C O R =   A C E T ×   E P   ×   100
where COR is carbon offsetting rate (%), T is the total number of tourists visiting Siem Reap in 2015 (2,100,000) and 2018 (2,200,000) [66]. Due to the lack of data in 2019, tourist-based emissions for 2019 were not included in our carbon offsetting calculation, EP is the tourist’s per capita emissions for traveling to and staying in Siem Reap (4.14 Mg CO2/person) [67]; ACE is the avoided carbon emissions. If 100% is avoided, ACE = CE.

3. Results

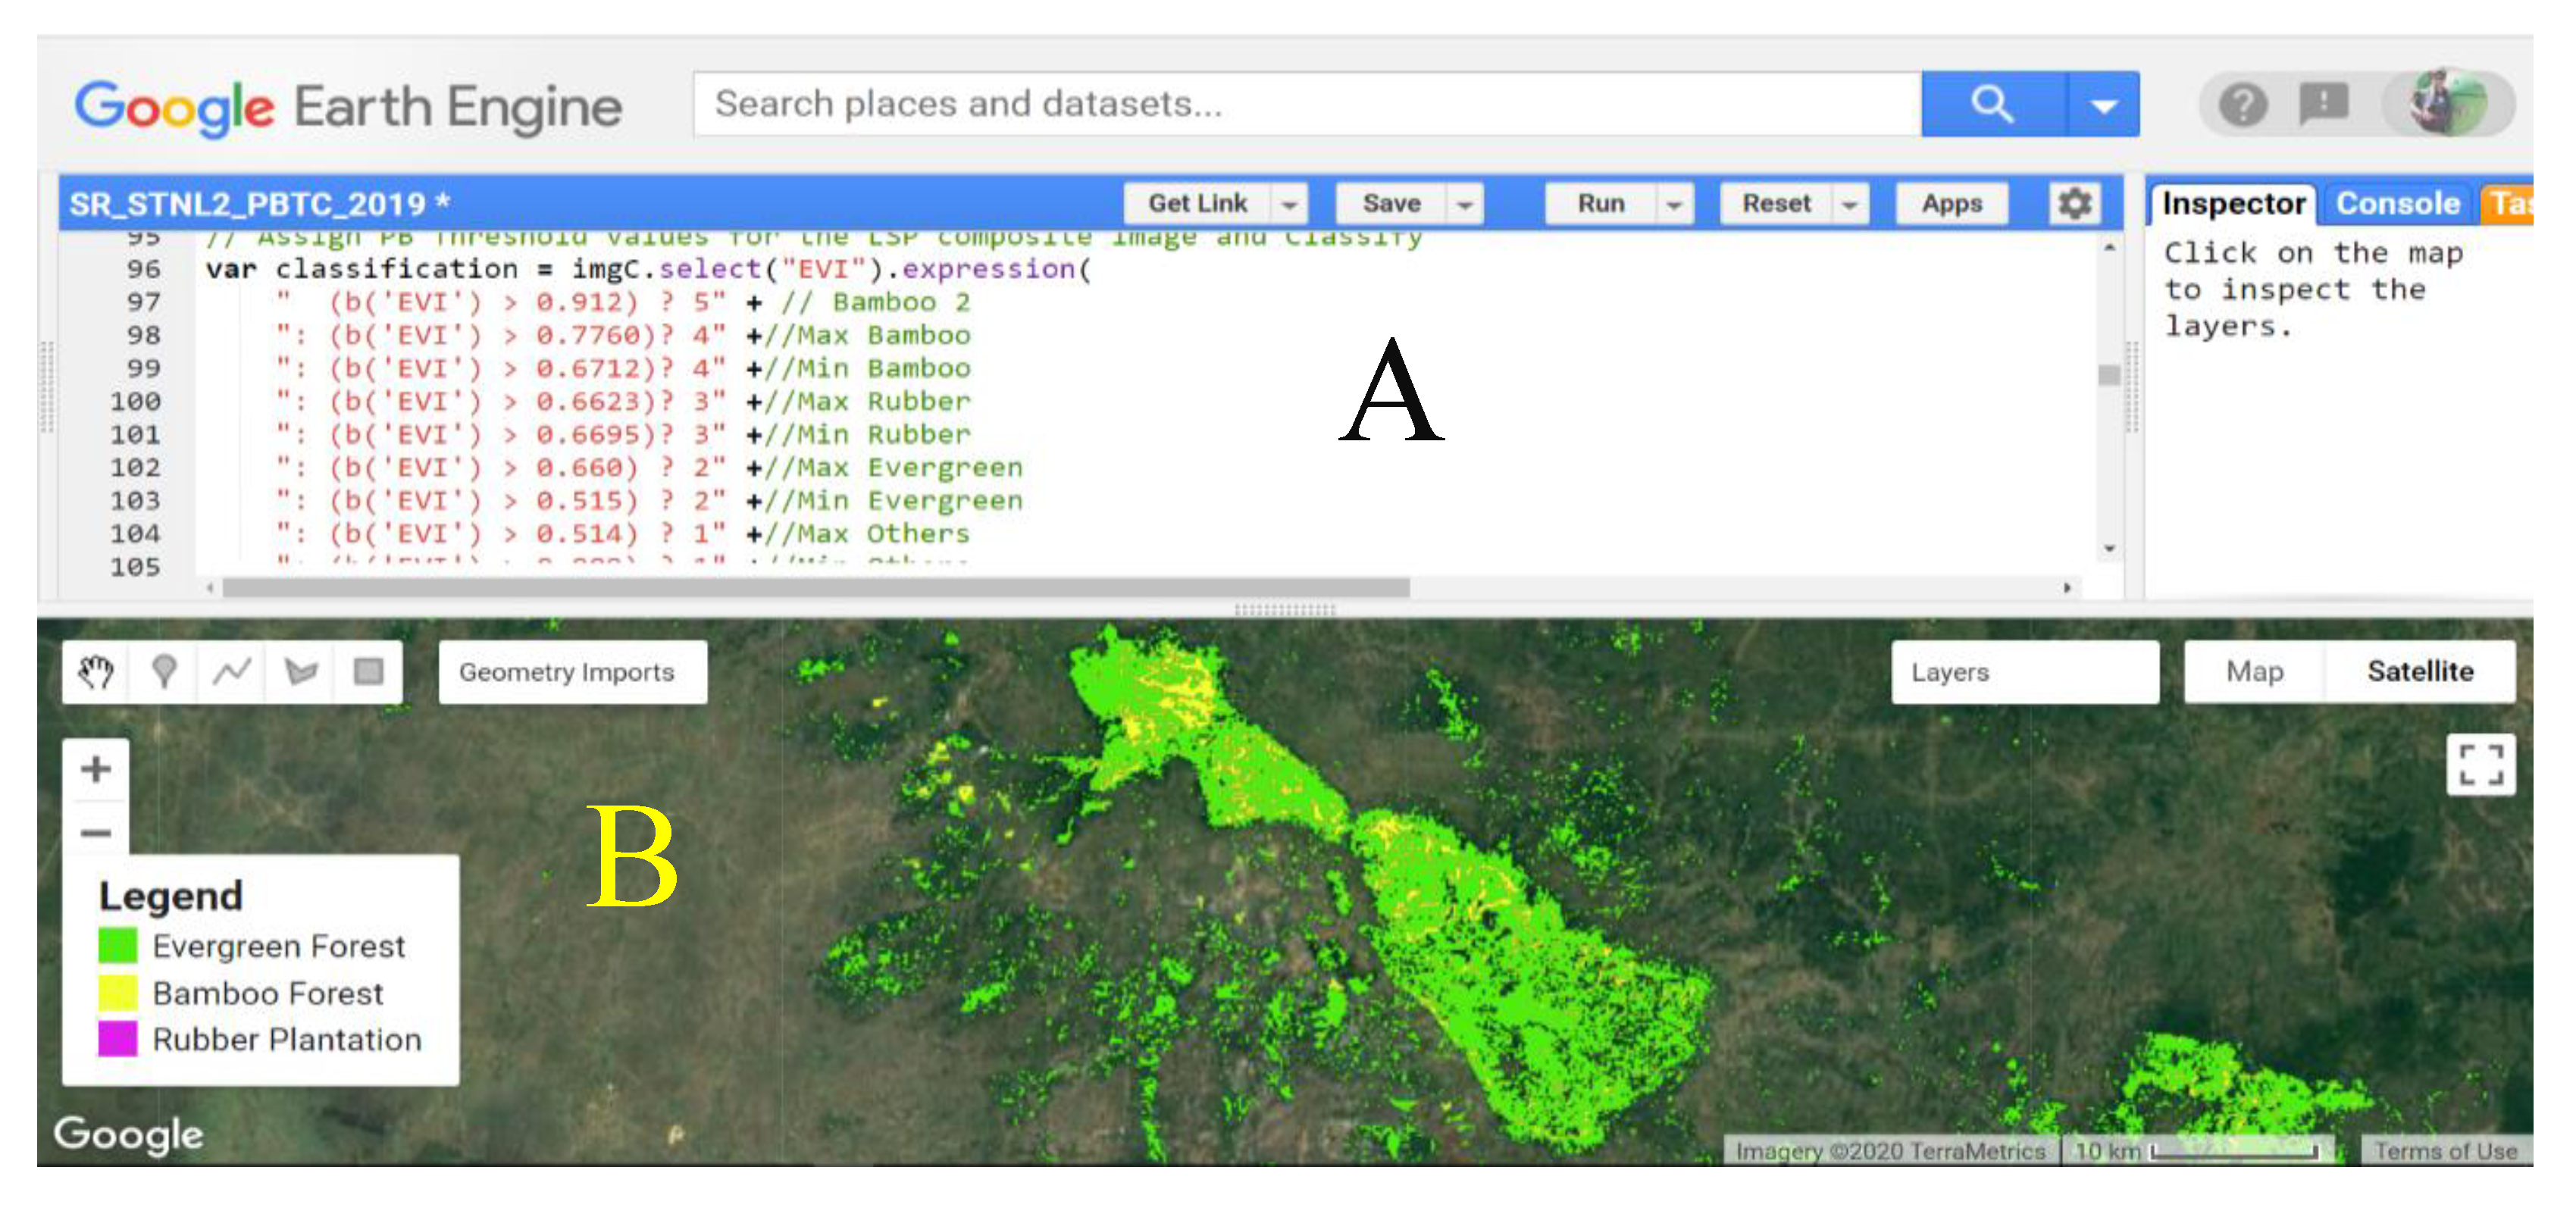
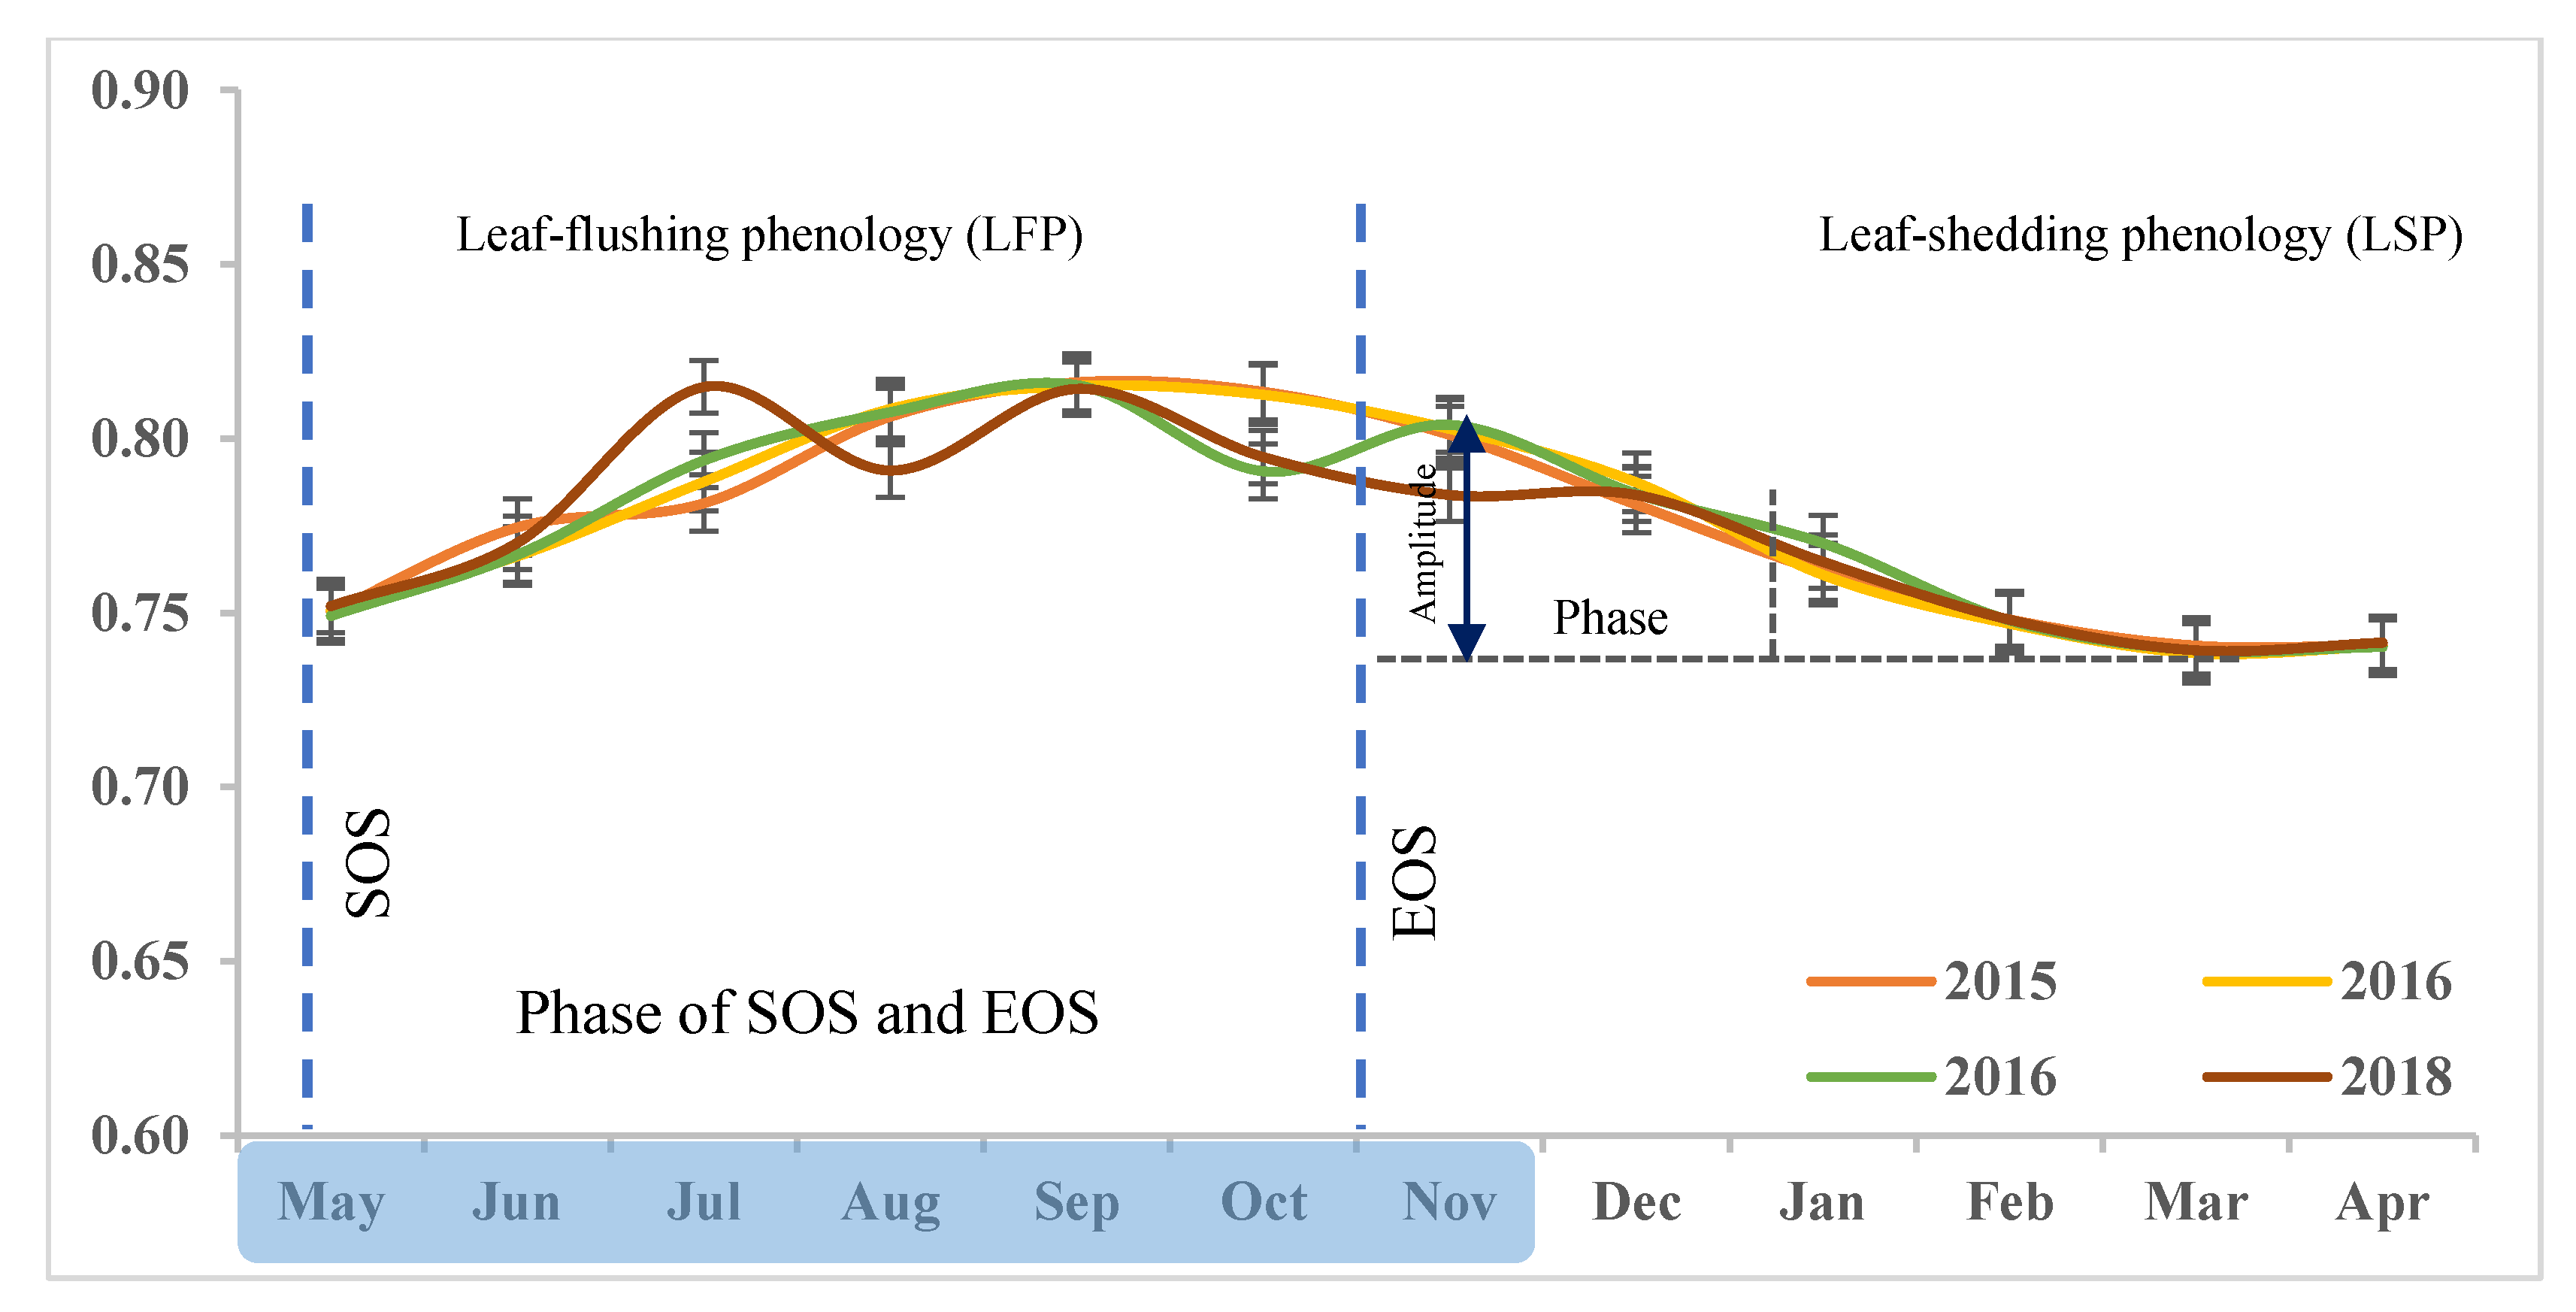
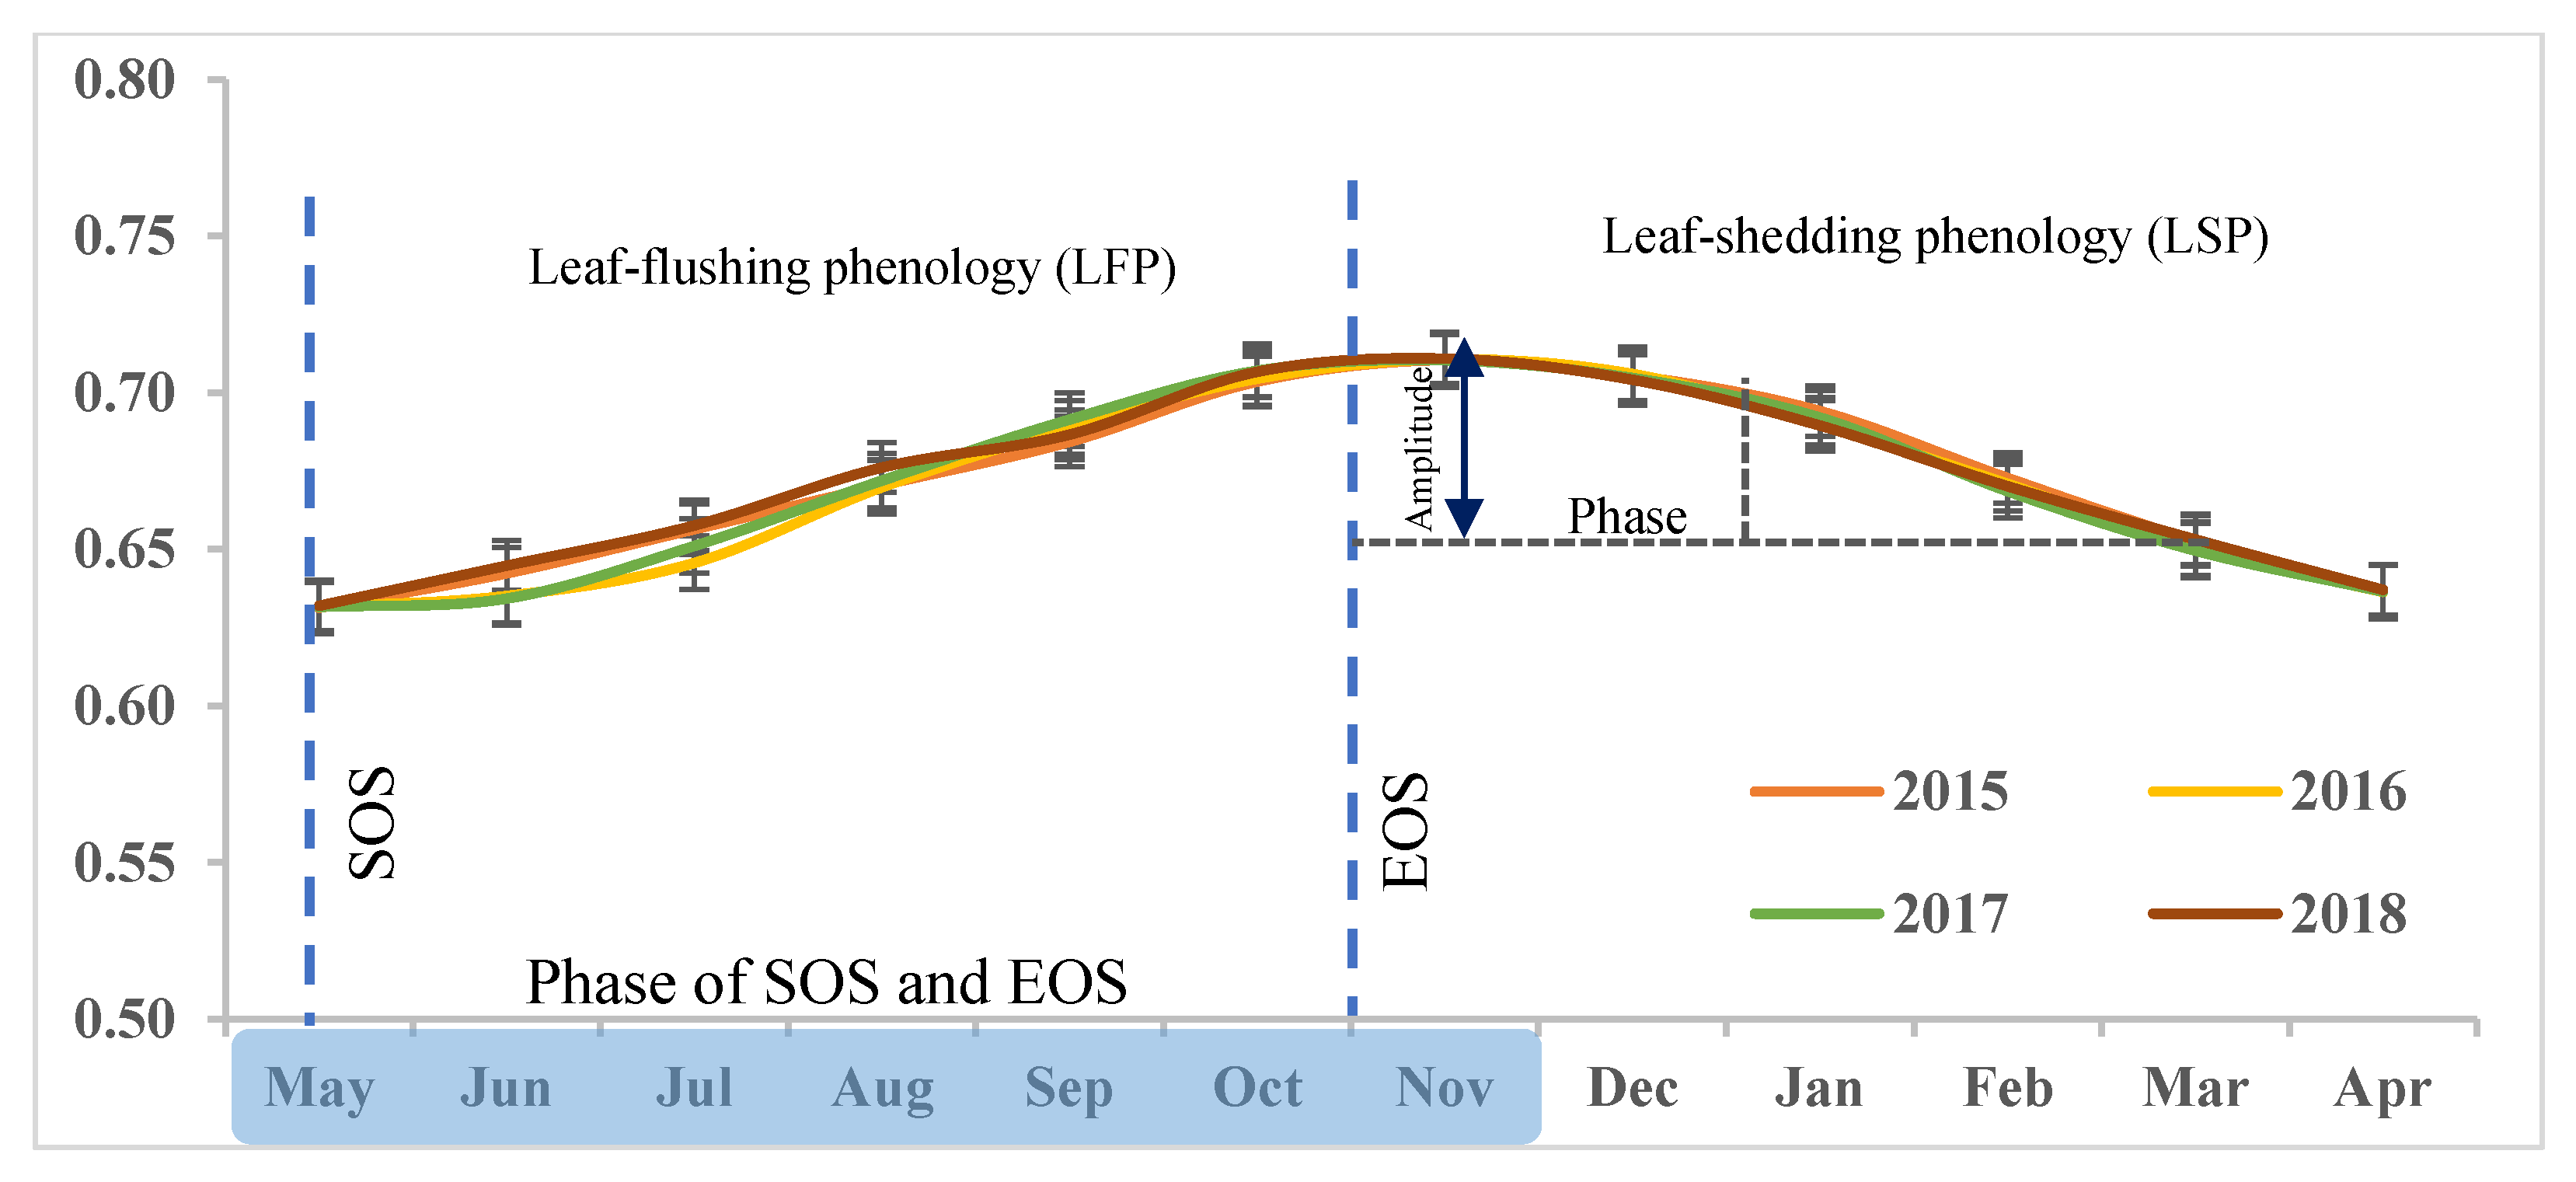
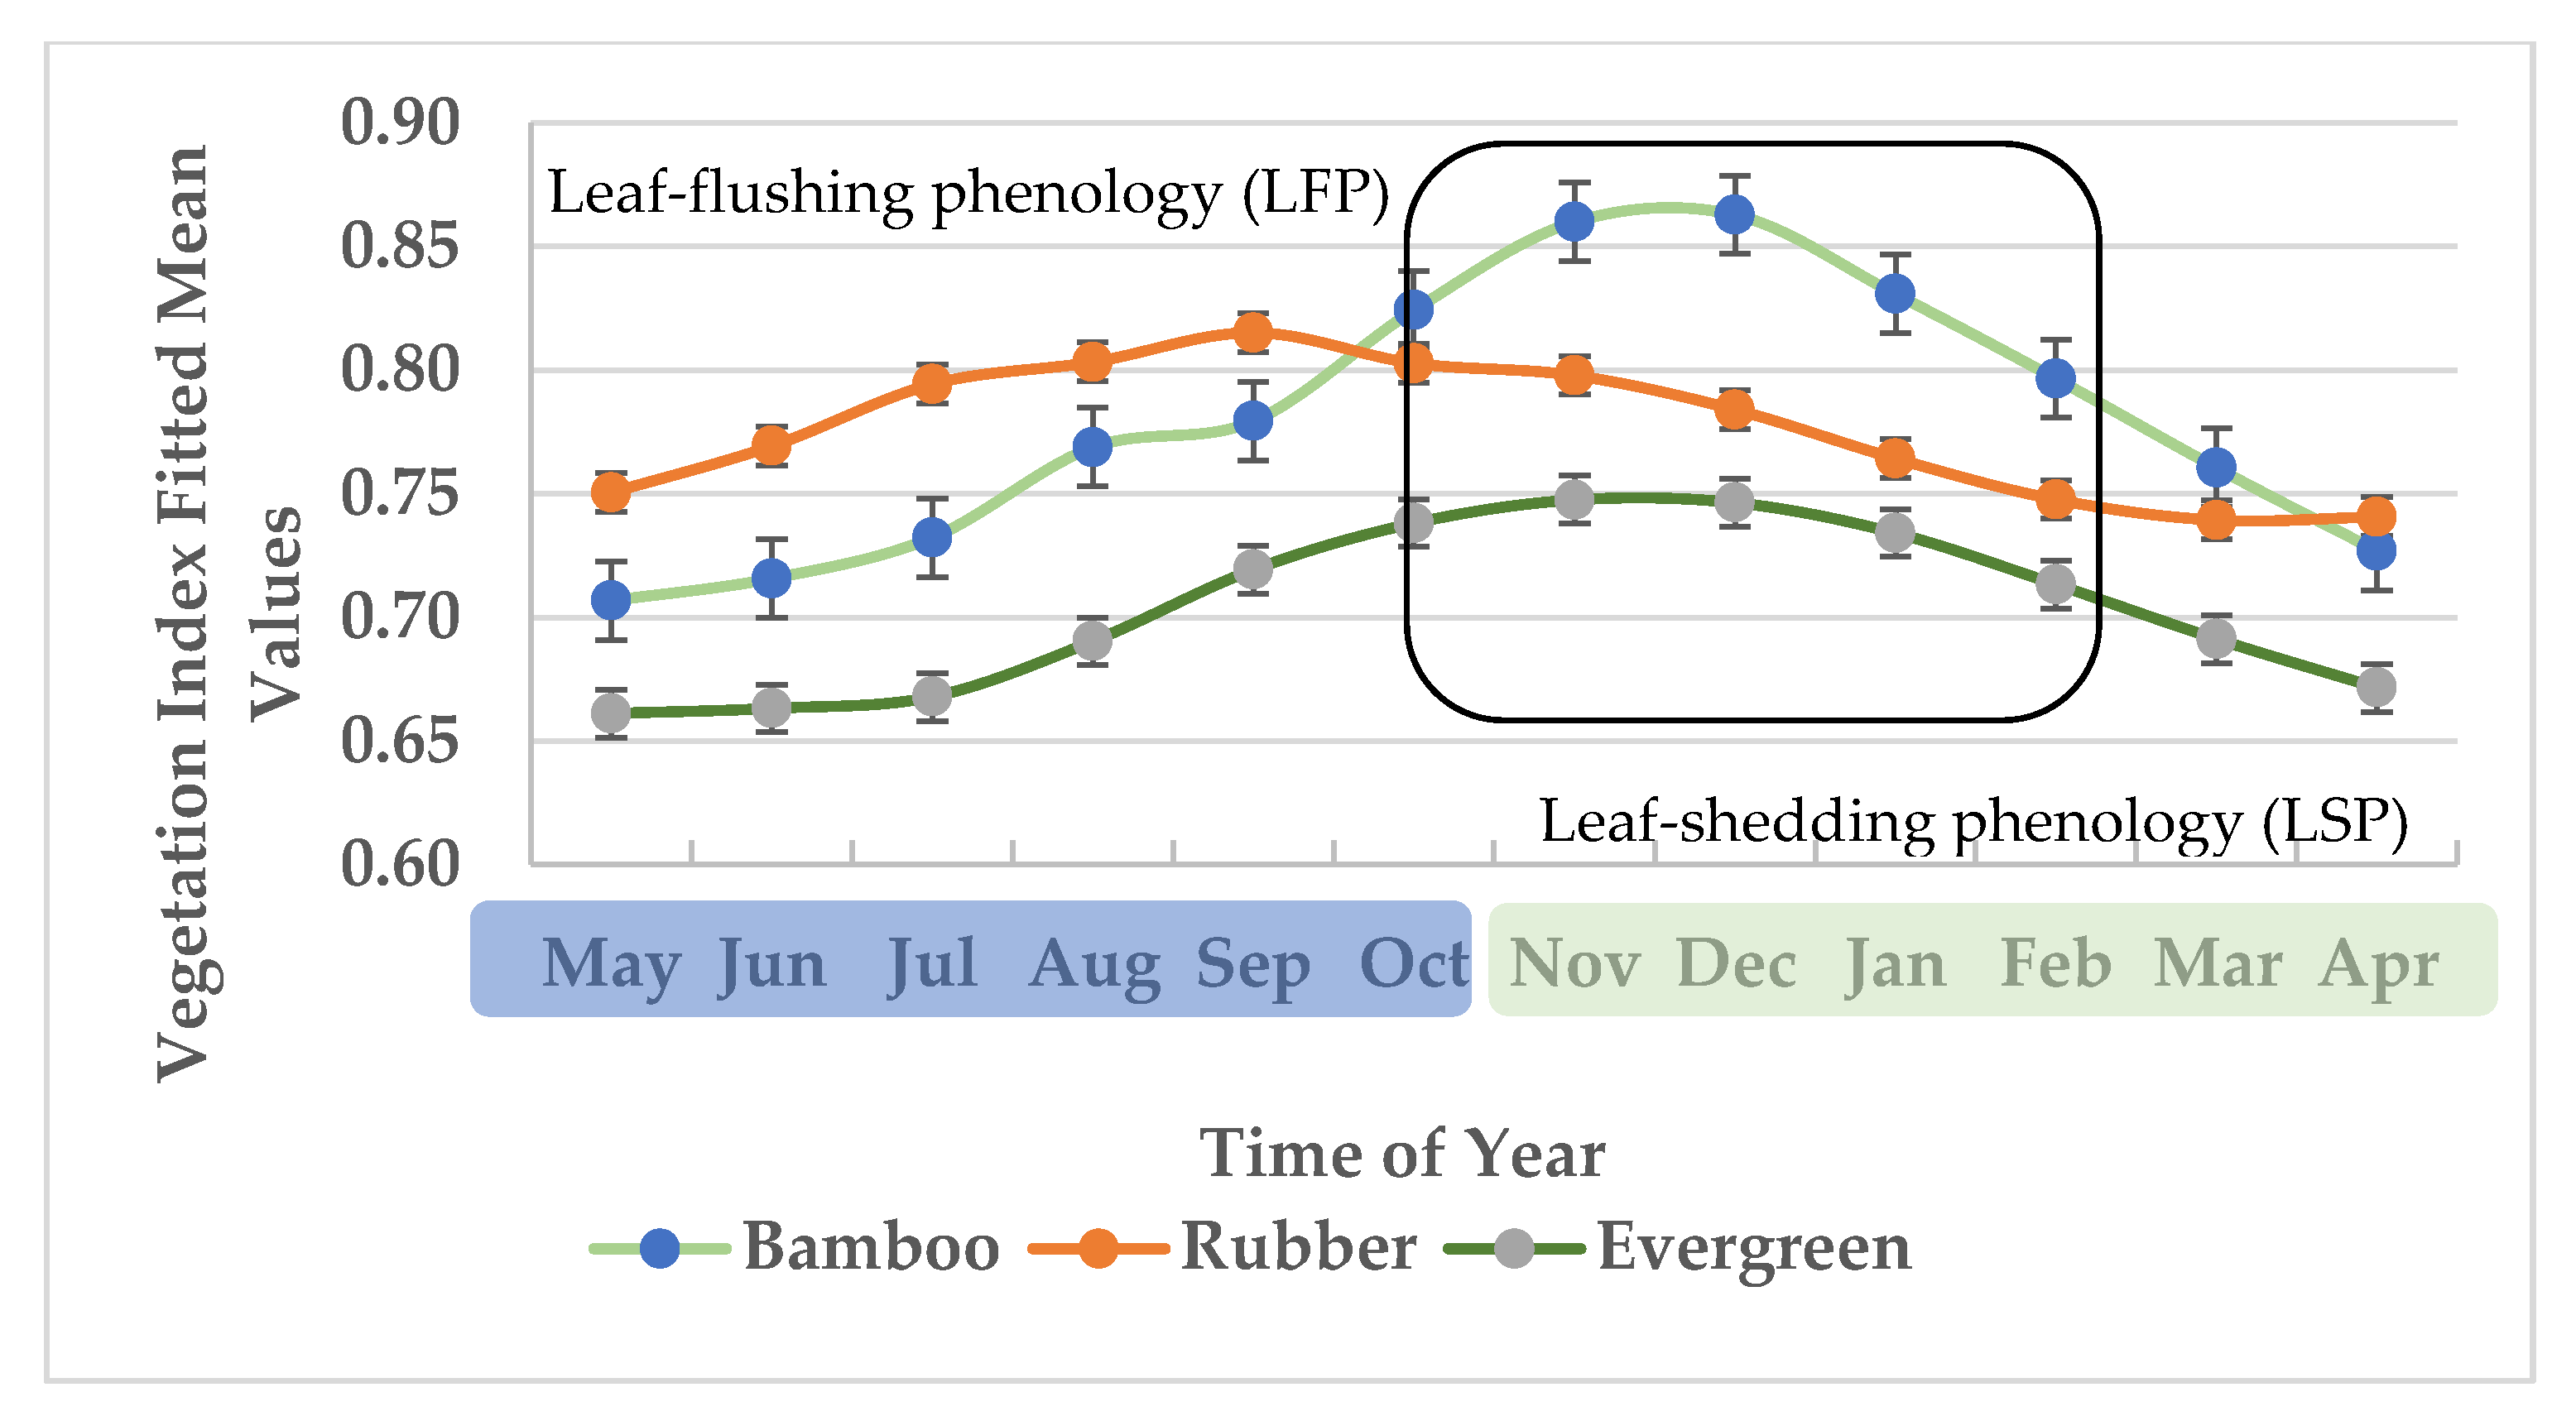
3.1. Phenological Profiles and Threshold Values

The time-series analysis of fitted vegetation indices allowed us to quantify the differences in phenological behavior between bamboo, rubber, and evergreen forest land cover categories, as shown in Figure 6, Figure 7 and Figure 8.
In Figure 6, the yearly average index profiles were generated by analyzing 40 profiles from 10 geometry locations between 2015 and 2018. The highlighted blue color shows the LFP stage and indicates the local start-of-season (SOS) and end-of-season (EOS) periods from May to November. The dashed blue lines indicate the SOS and EOS phases. The blue arrow and black dashed line show the leaf-shedding phenological stage and the amplitude of the minimum and maximum bamboo index profiles from December to April.
Figure 6 (bamboo), Figure 7 (rubber), and Figure 8 (evergreen) show the overlapping of average-fitted vegetation index profiles during SOS and EOS and the regular fluctuation of average EVI profiles of bamboo, rubber, and evergreen forest during the LSP stage (from December to April) in all 30 of the selected geometry locations from 2015 to 2018. The most distinguishable differences in the three vegetation cover indices were apparent in the LSP stage. The bamboo average-fitted vegetation index values were Min = 0.71 and Max = 0.83 from 2015 to 2017 and Min = 0.71 and Max = 0.84 in the LFP stage in 2018 (Figure 6). The fitted values for evergreen in the LSP stage reveal lower vegetation index values than those for bamboo in all selected phenology years (Figure 8). We found that evergreen had fitted average index values of Min = 0.63 and Max = 0.70 in the LFP stage from 2015 to 2018. The rubber plantation values (Min = 0.75 and Max = 0.80) were higher than the bamboo and evergreen forest values in the SOS to EOS season, and its vegetation index values were lower than bamboo and evergreen values during the LSP season (Figure 7).
However, during the start of the LSP stage, bamboo vegetation index values (Max = 0.86 and Min = 0.83 from November to January) were greater than those of evergreen (Max = 0.71 and Min = 0.69) and rubber (Max = 0.80 and Min = 0.76) in the overall SOS and EOS or LFP period. The separation of fitted indices of bamboo, rubber, and evergreen phenological profiles in the mid-LSP stage is shown in Figure 9.
The cumulative average phenology profile of land use categories (Figure 9), namely, bamboo, rubber, and evergreen, were assessed by validating 120 index profiles during the LSP and LFP stages. Comparing the phenology-based index profiles revealed that bamboo had greater index values over the entire LSP period from 2015 to 2018. The amplitude of bamboo minimum and maximum peak values (0.860–0.863) occurred at the end of the LSP stage (December–February), and the lowest index values (0.707–0.716) were found at the start of the rainy season (SOS) in May–July.
The rubber plantation vegetation index values (0.784–0.798) were greater than the bamboo values (0.707–0.716) in the SOS (monsoon/rainy season) from May to September, and they were slightly lower (0.741–0.748) right after the start of the mid-LSP stage (January–April). However, the bamboo and rubber vegetation index profiles overlapped in the EOS season between September and October, as shown in Figure 9. The evergreen phenological values and the phase of amplitudes are smaller than those for bamboo and rubber in all phenological stages. Therefore, classification confusion of evergreen forest and that of bamboo or rubber is not likely to occur.
Bamboo was found to have the highest vegetation index in the mid-dry phenological phase. Amplitudes of the minimum and maximum threshold values were determined (0.854–0.882) and are shown in Figure 10. Similarly, rubber plantations showed the highest vegetation index, but the range of the threshold amplitude (0.815–0.841) between bamboo and evergreen forest was smaller (0.581–0.648) (Figure 10).

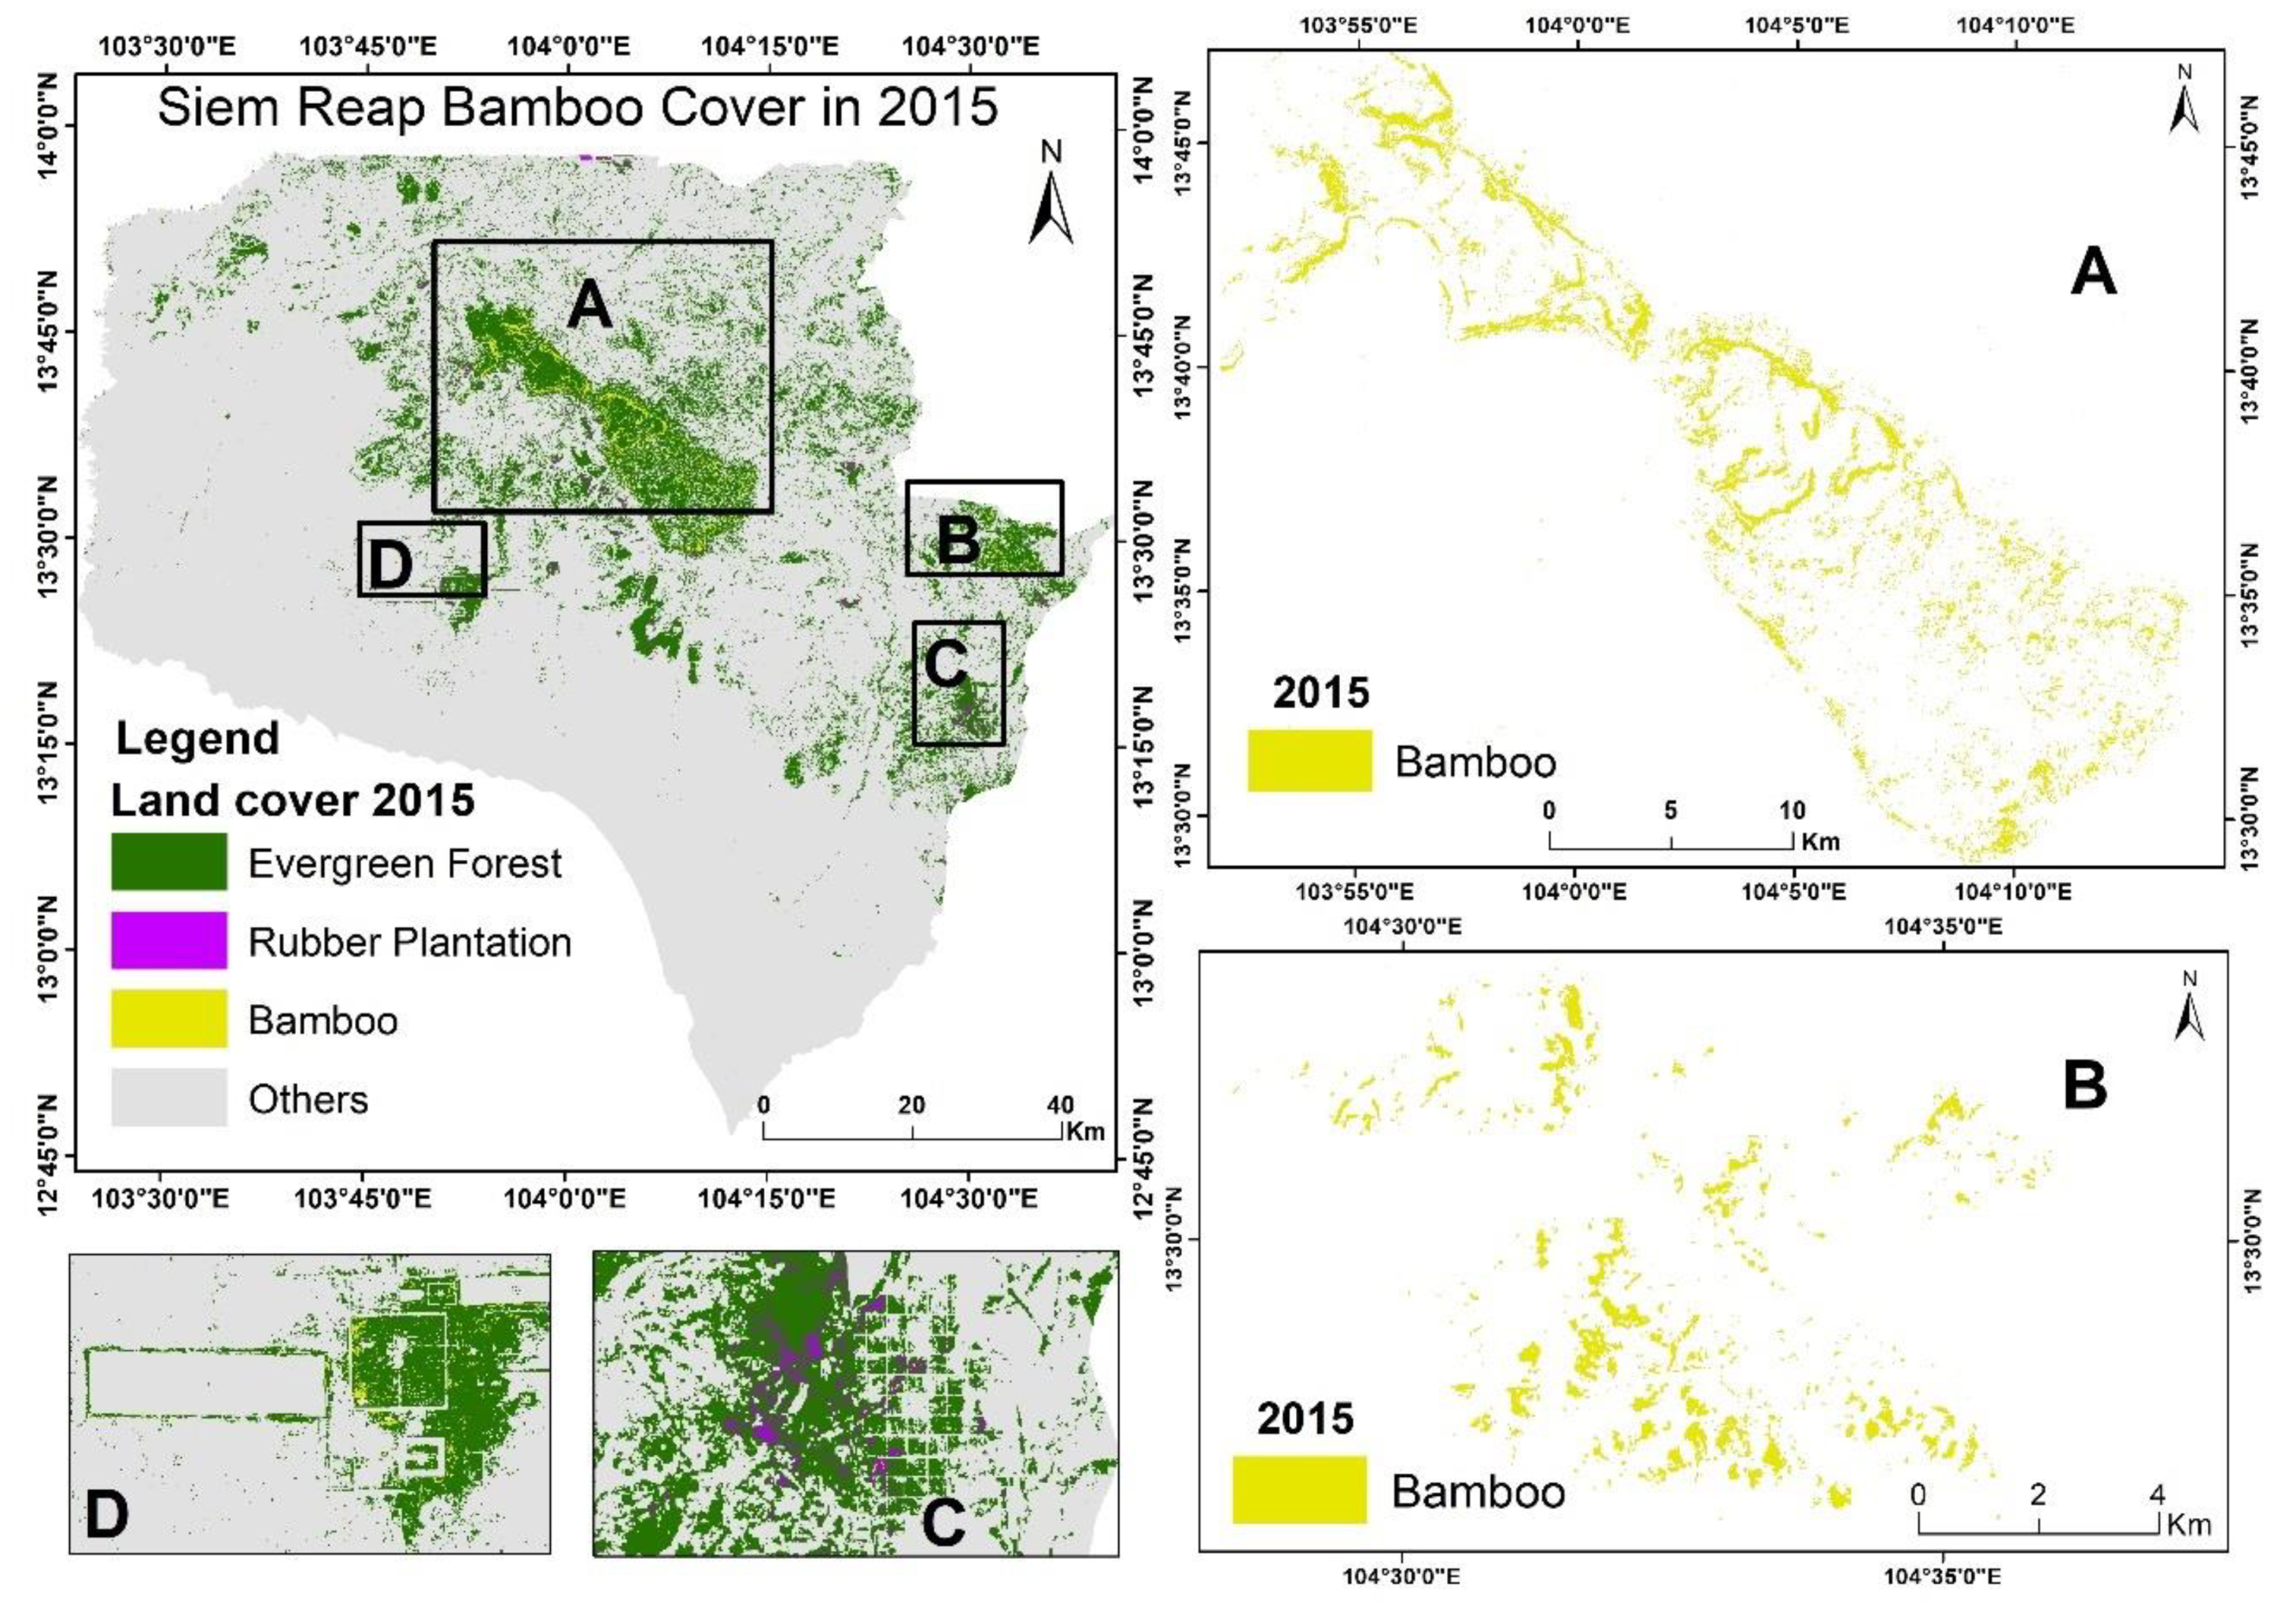
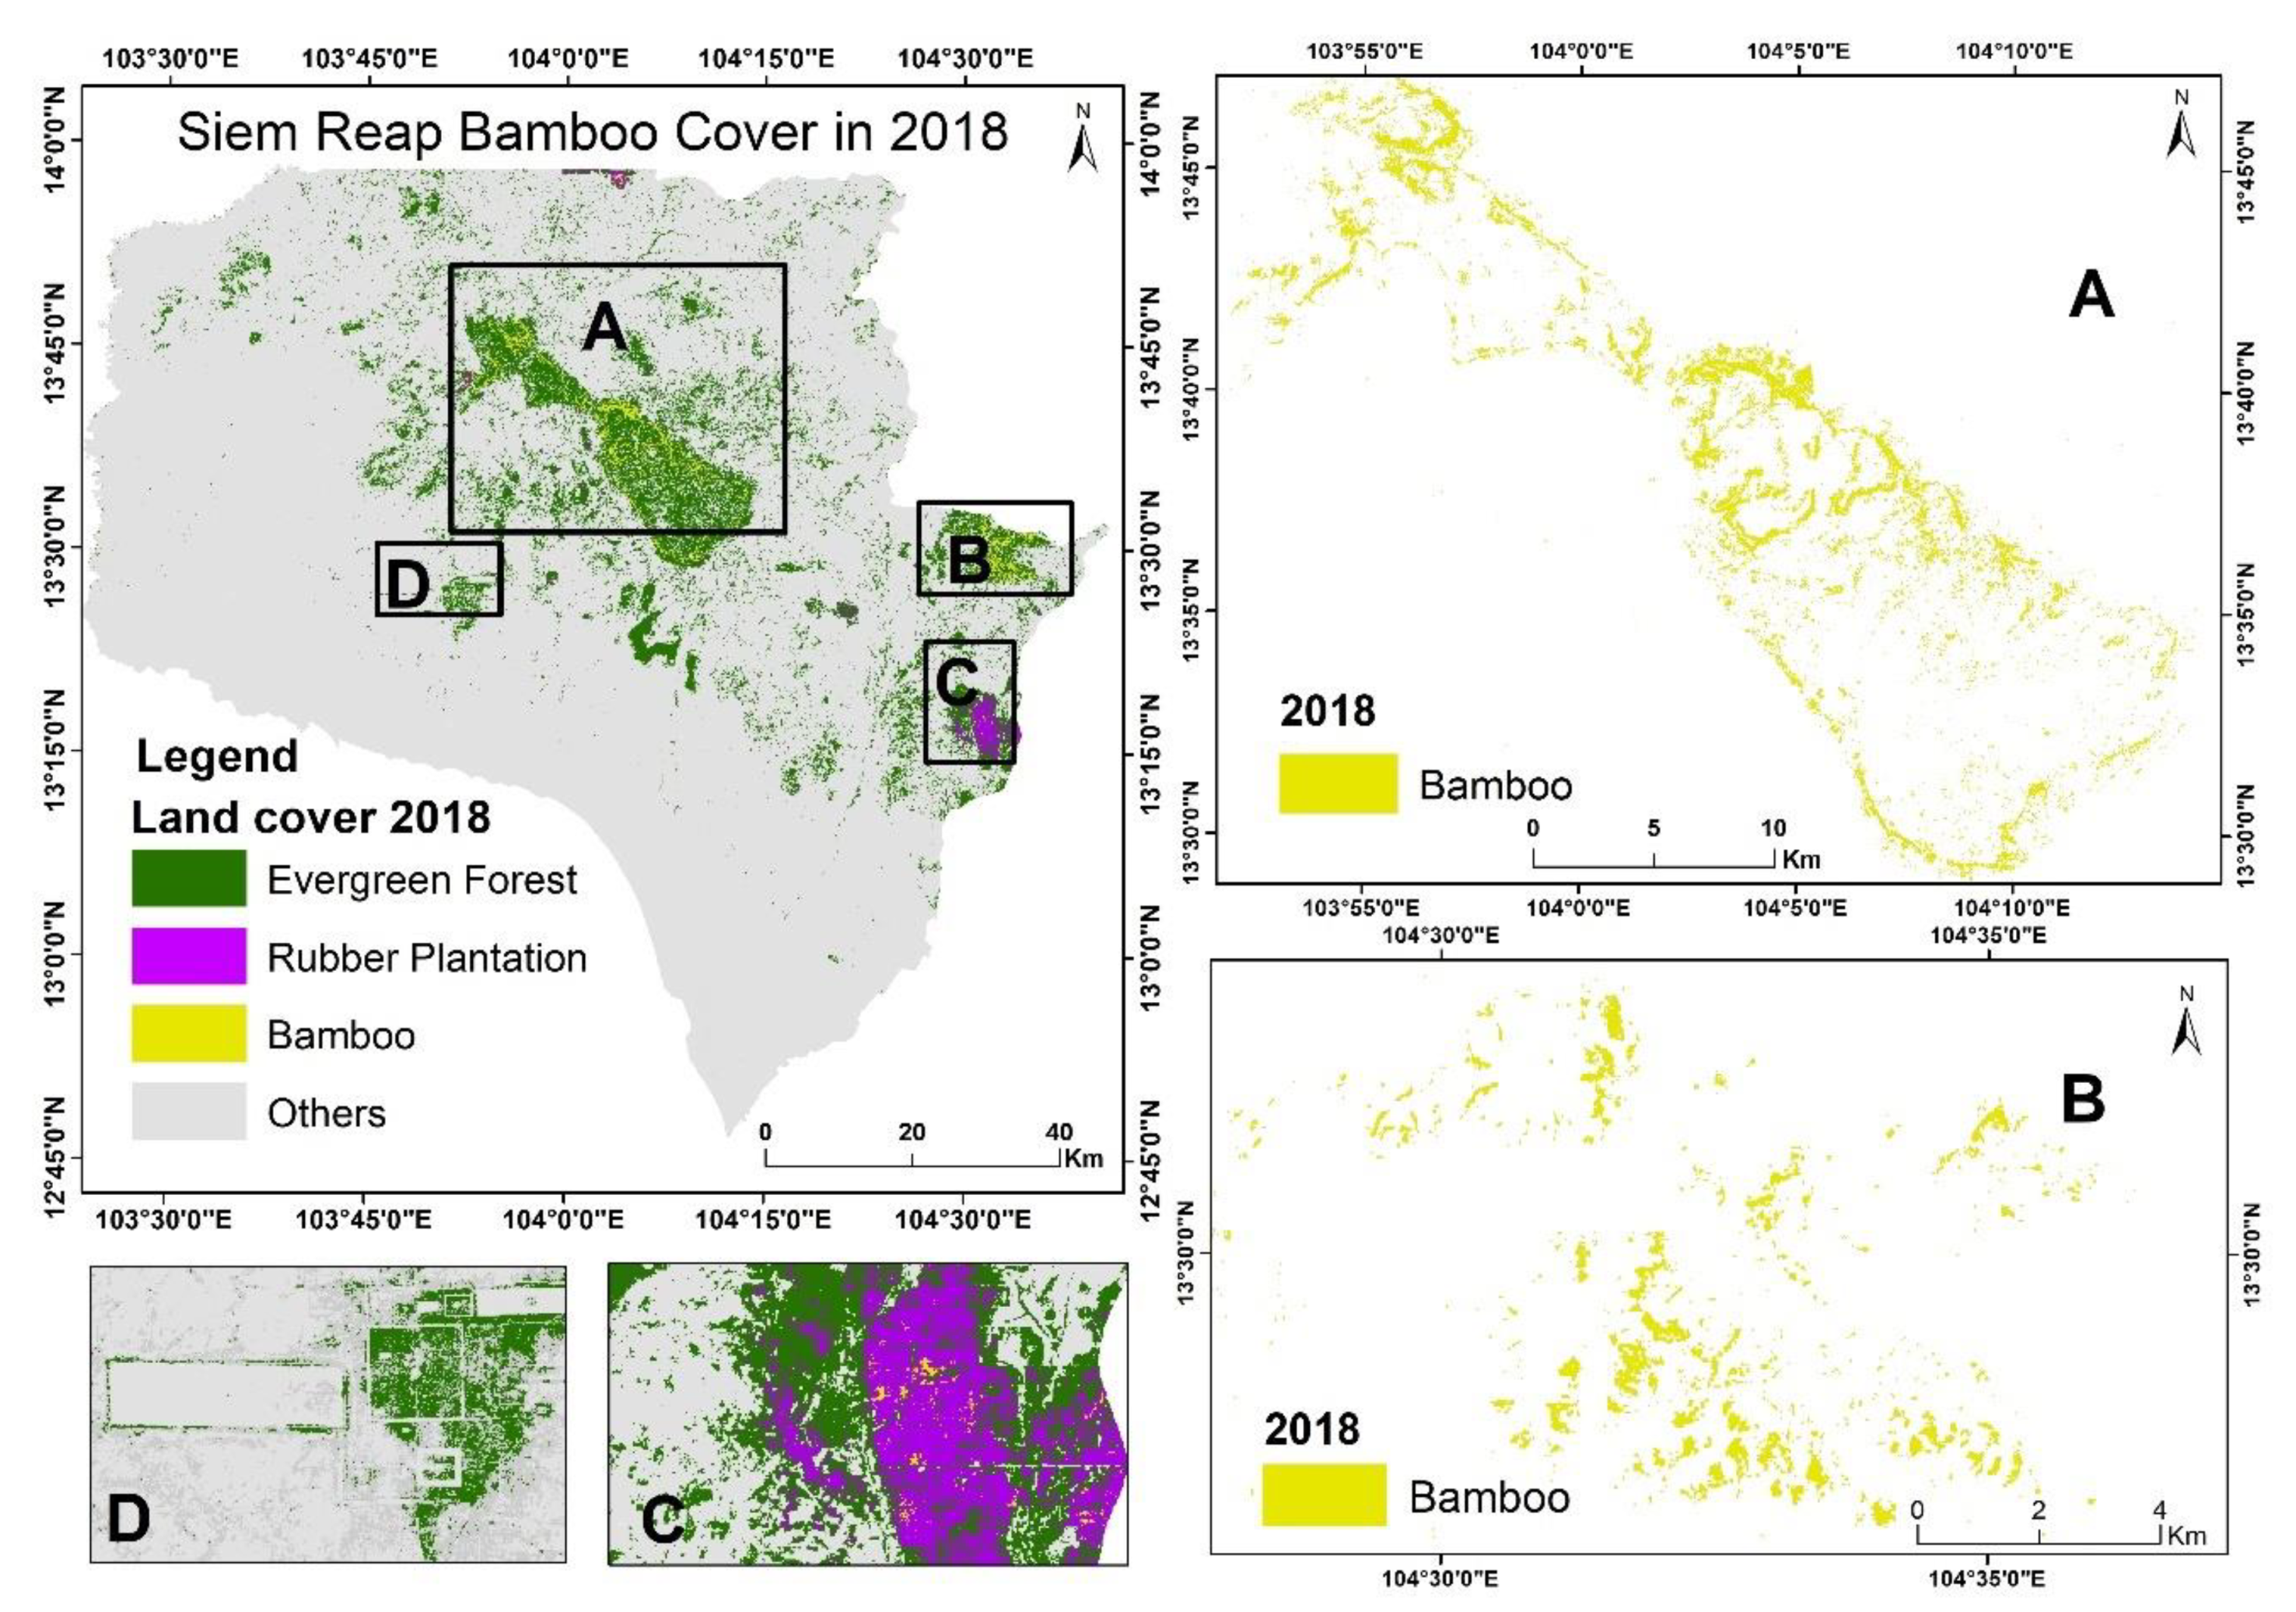
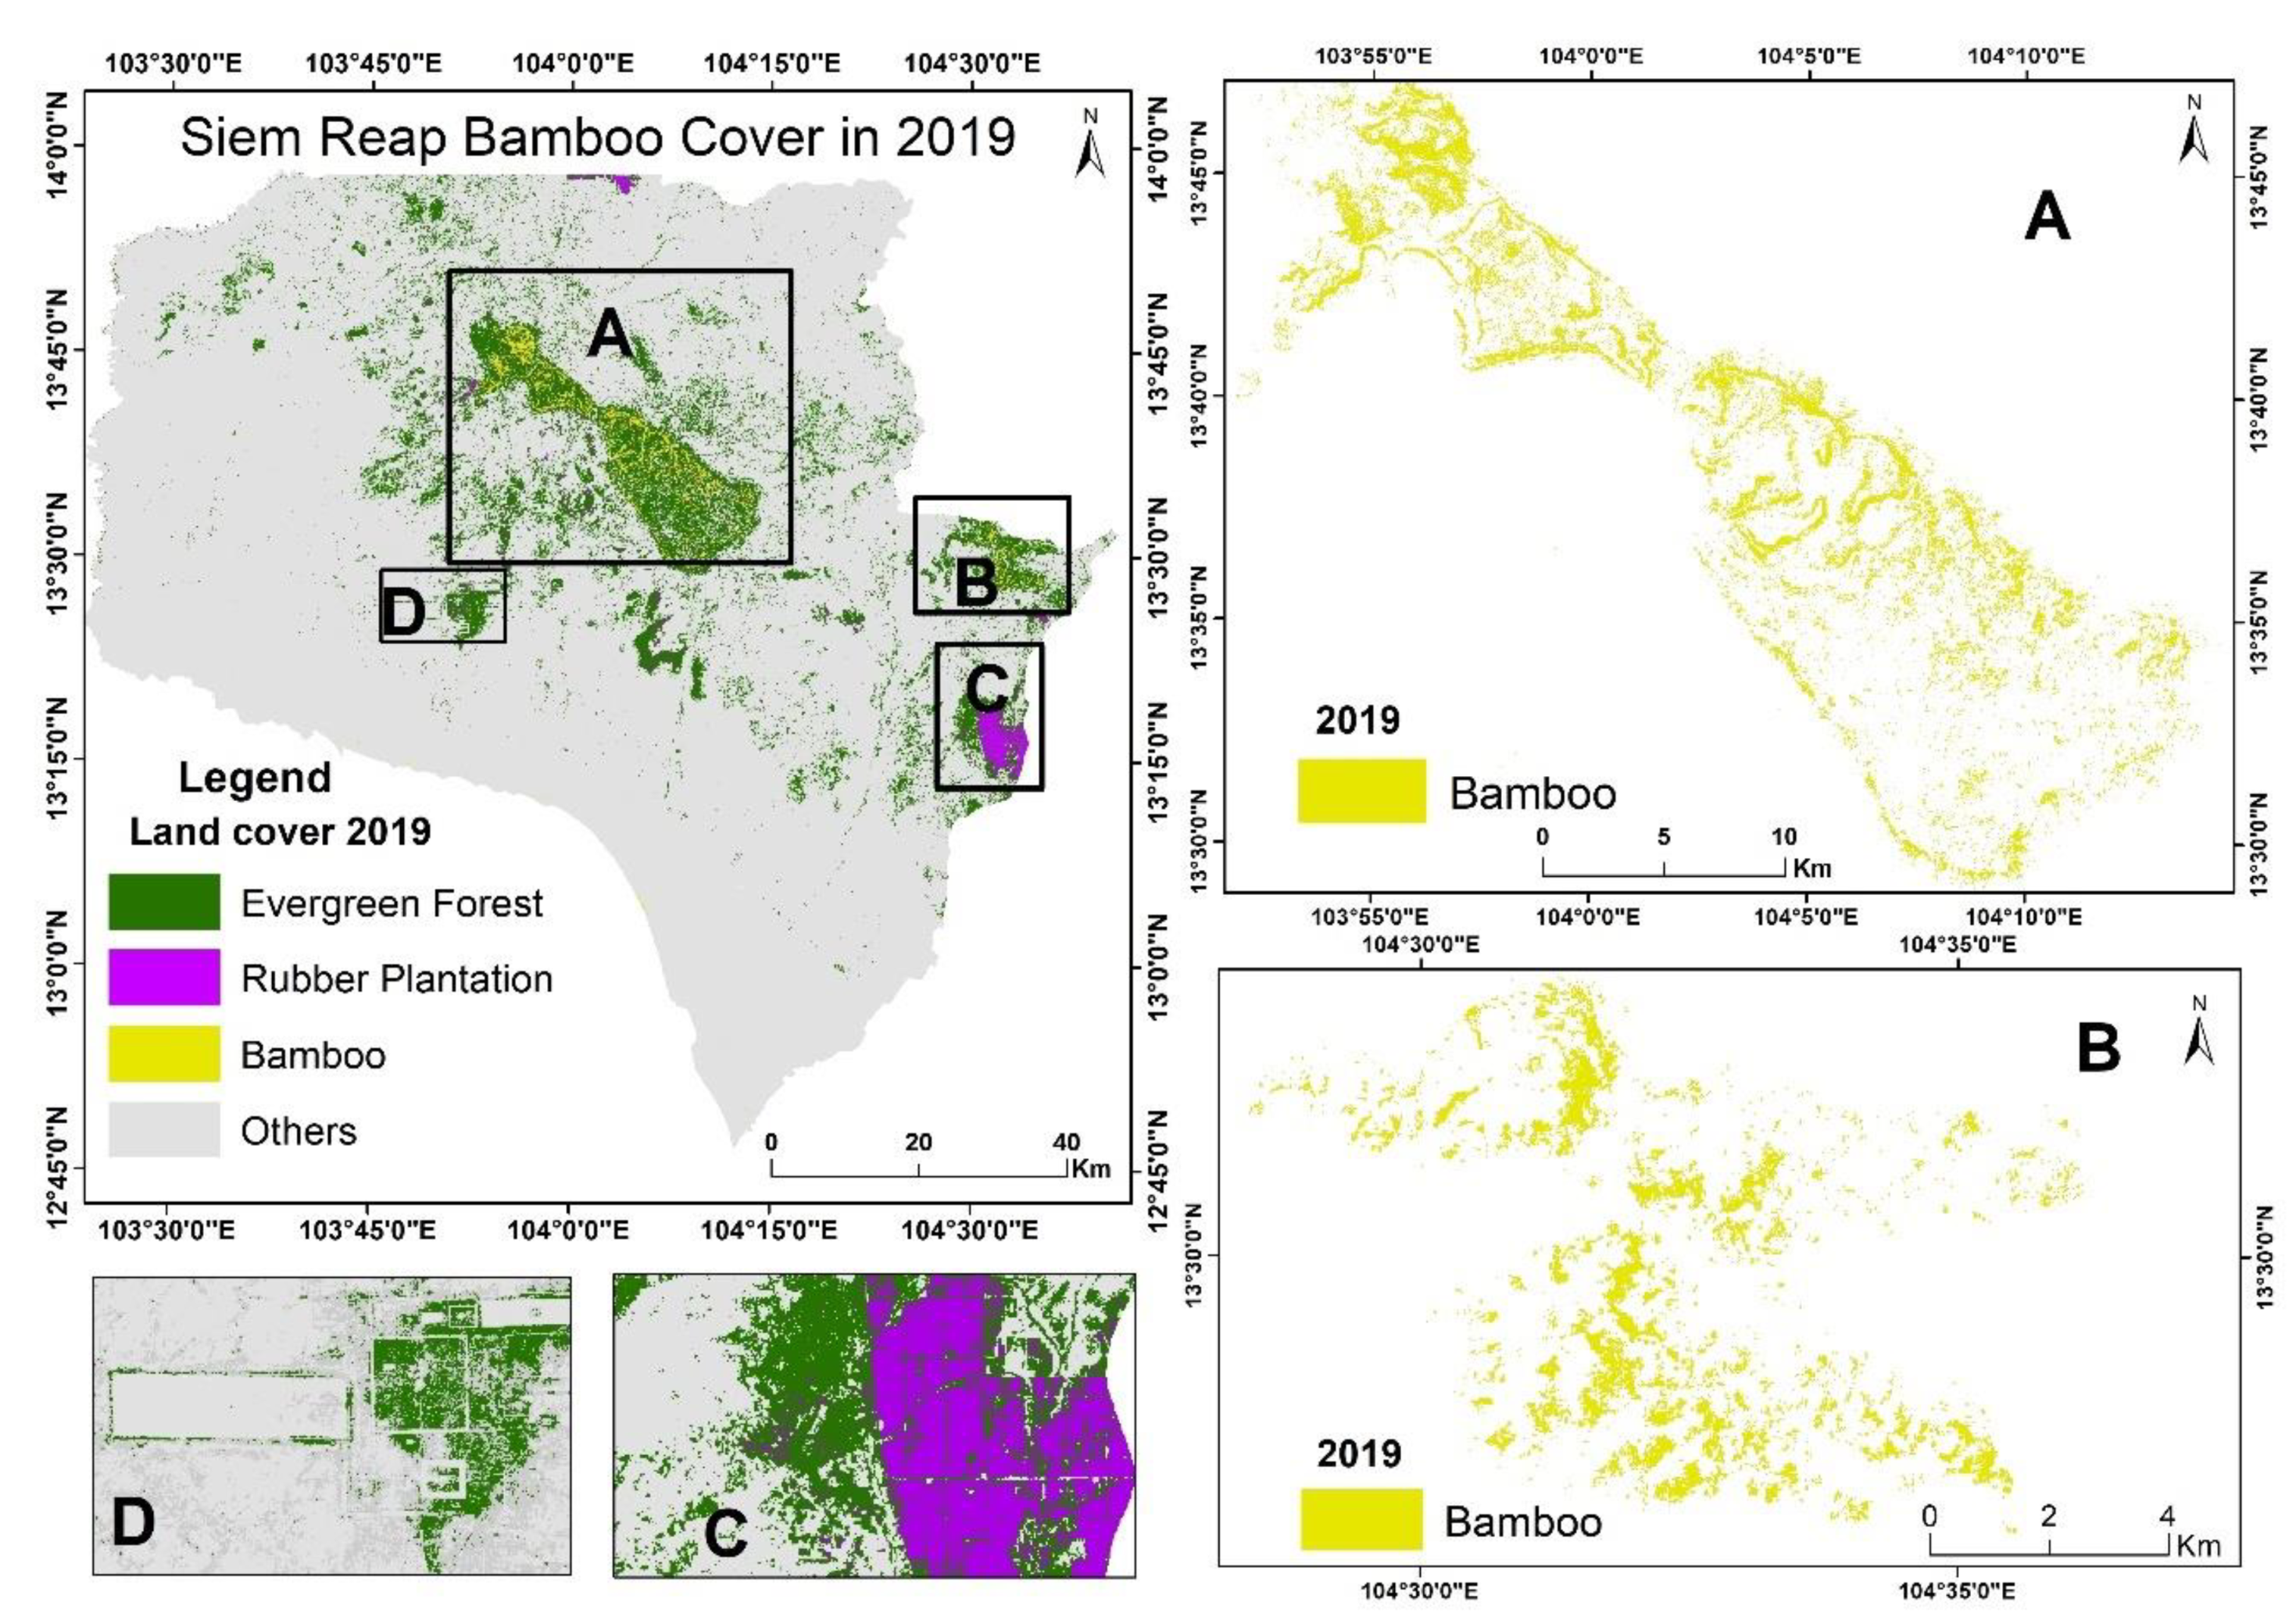
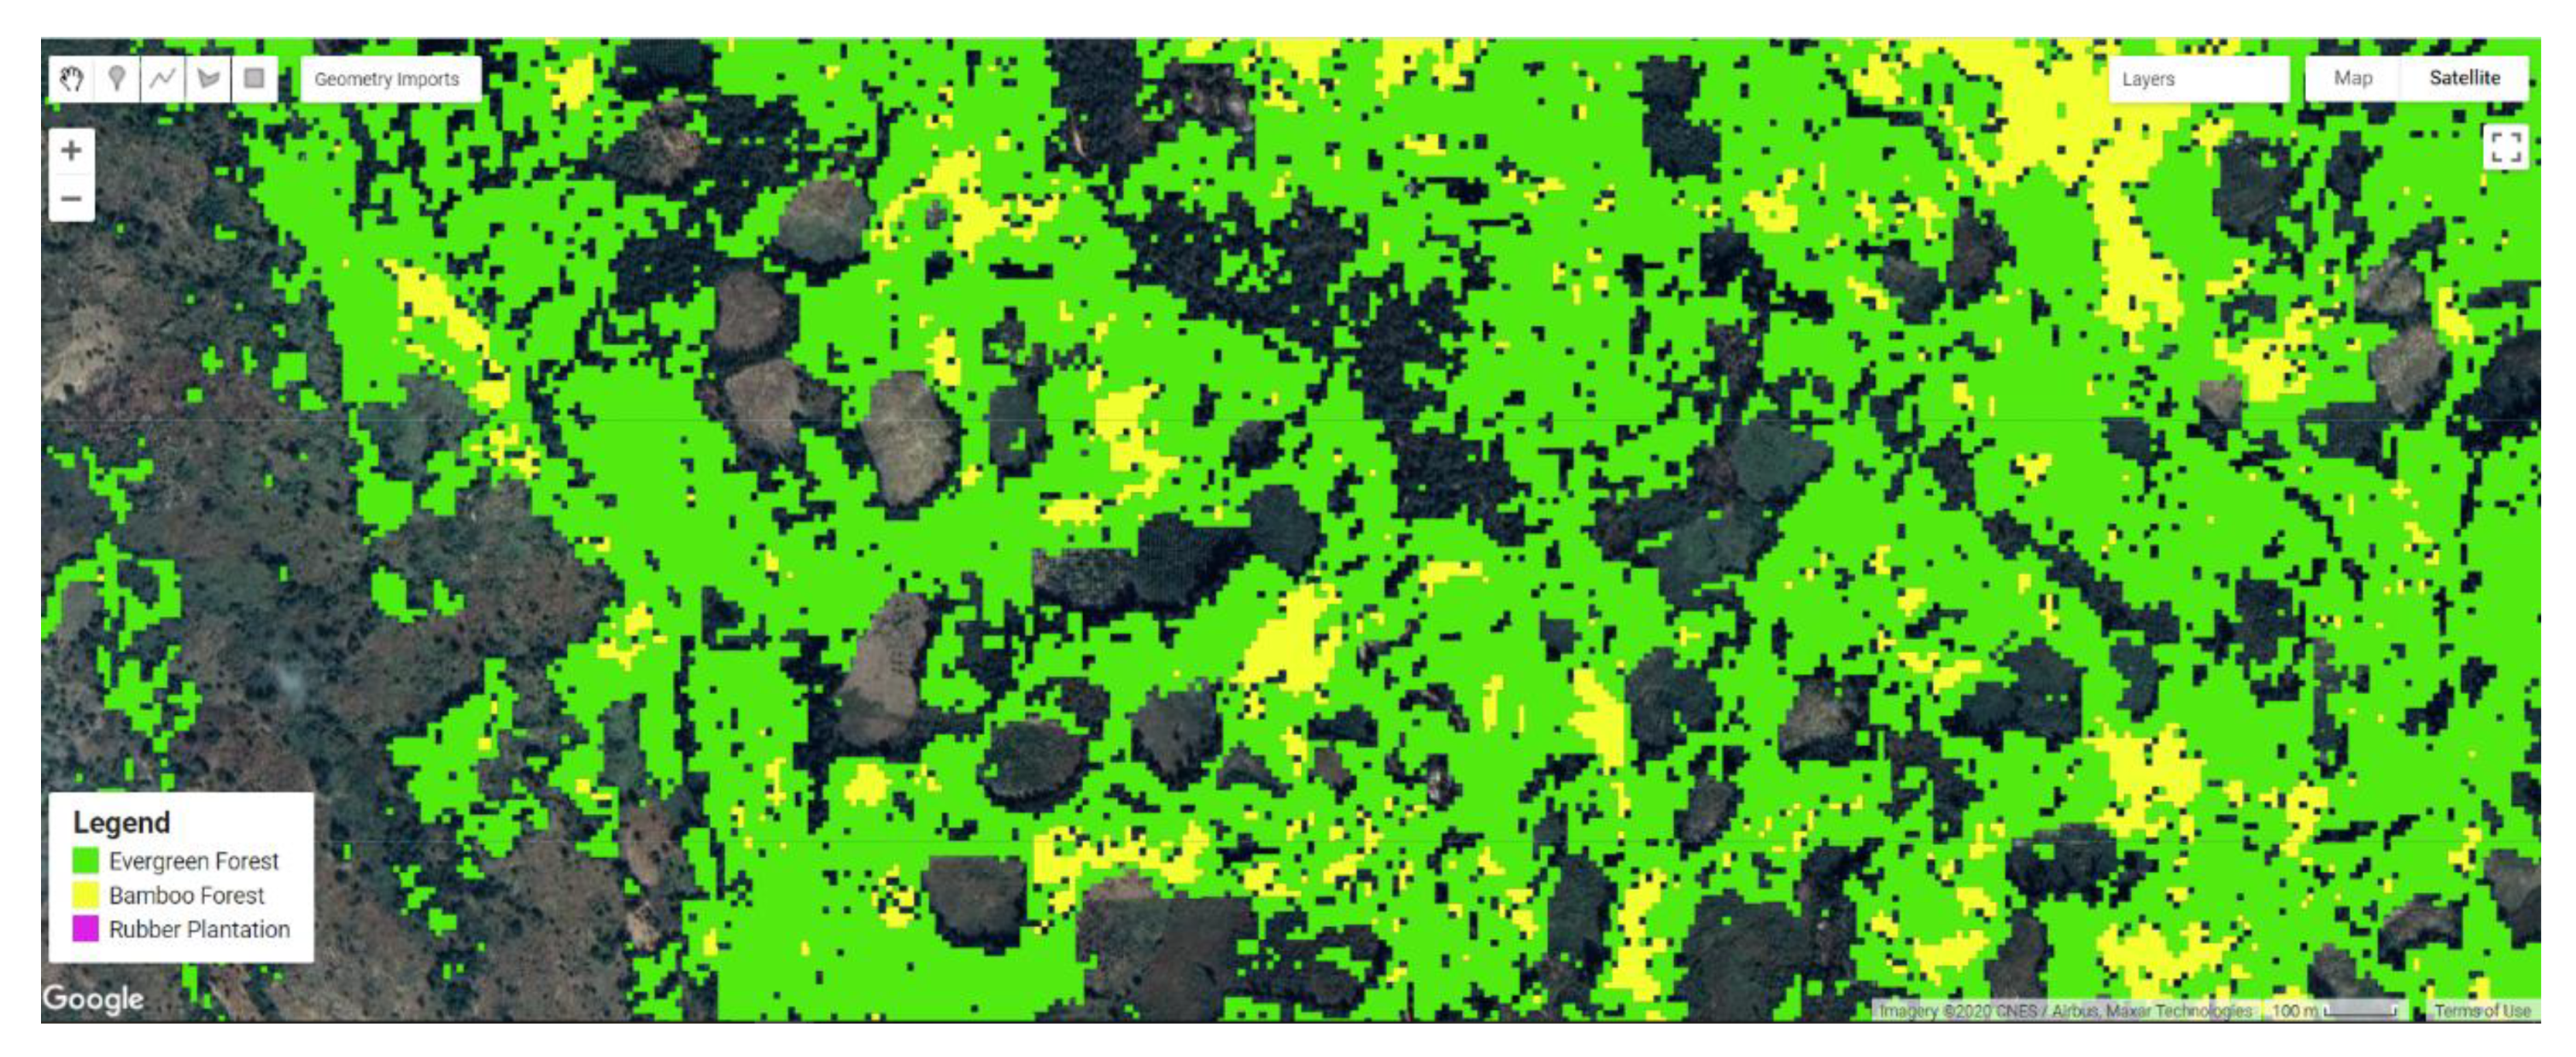
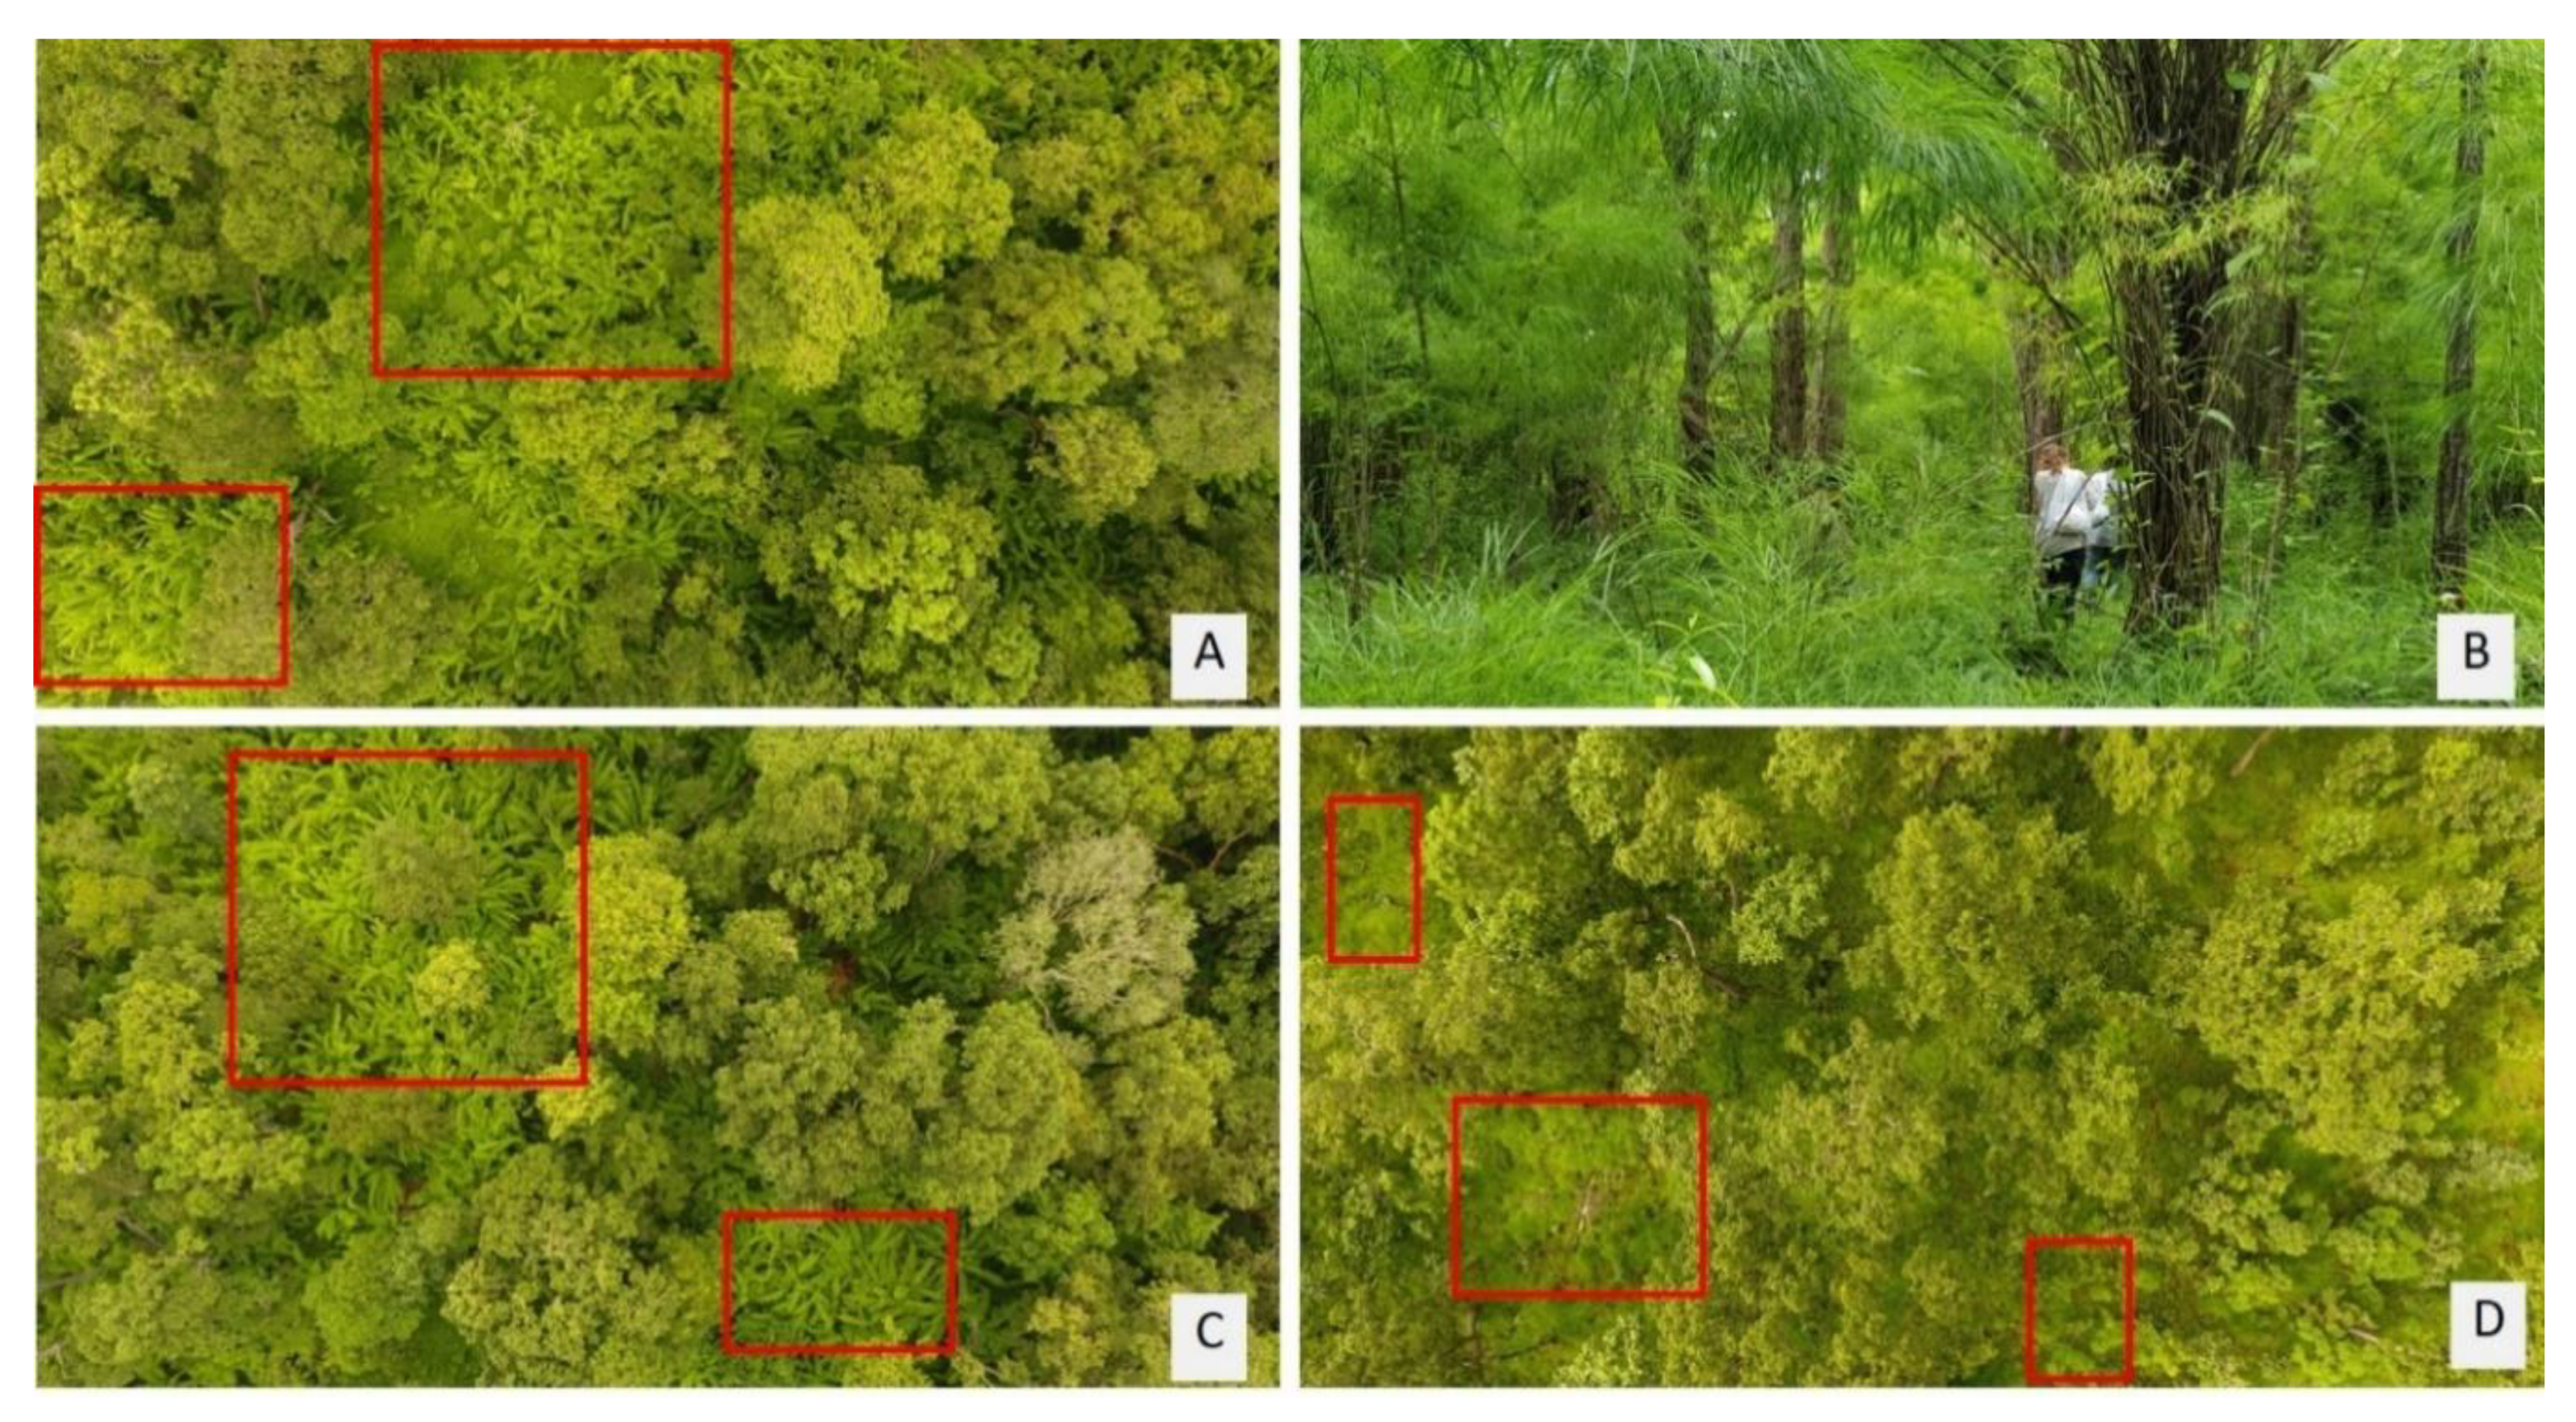
3.2. Natural Distribution of Bamboo Forest

Using the obtained threshold values of selected land cover categories, we were able to derive the natural bamboo distribution for the entire Siam Reap Province in 2015 (Figure 11), 2018 (Figure 12), and 2019 (Figure 13).
The PBTC map of land use in Siem Reap in 2015 and 2018 (Figure 11 and Figure 12) represents the bamboo, rubber, evergreen, and other land cover distributions. Evergreen forest is widely distributed around Kulen Mountain and the Angkor Wat temple. Bamboo distribution was found largely in the mountain region, and some patches can be observed around the Angkor Wat temple. Rubber distribution can be seen in only a small area (Figure 11C) in 2015, whereas the increase in rubber is clearly seen in 2018 (Figure 12C).
In Figure 11A, the map represents the distribution of bamboo around Kulen Mountain and Kulen National Park. Figure 11B (Boeng Peae Wildlife Sanctuary) shows the distribution of bamboo in natural evergreen forests in the northwestern part of the study region, including Chi Kraeng District. Figure 11C shows a mix of vegetation of evergreen forest (green) and rubber (purple) in Chi Kraeng District. Figure 11D shows the rich evergreen forest cover and small bamboo distribution around the Angkor Wat temple.
As shown in Figure 13, bamboo distribution was higher in 2019 compared with that in 2015, and the distribution of rubber plantations can be seen clearly in Varin and Chi Kraeng Districts (Figure 12C and Figure 13C). Figure 13 shows a higher bamboo distribution area compared with that in the Landsat OLI maps (2015 and 2018) in most of the study region. On the other hand, rubber plantation distribution can be seen clearly in Varin and Chi Kraeng Districts (Figure 13C). Our analysis found that the bamboo cover was 2674 ha in 2015, 2711 ha in 2018, and 2672 ha in 2019. A larger area of bamboo was in upland areas and along riverbanks [42], especially in Phnom Kulen National Park and the northern part of Chi Kraeng District.

3.3. Accuracy Assessment

Validation of the 2015 and 2018 maps using VHR imagery in Google Earth revealed that for bamboo classification, producer’s accuracy (PA) is 95.7% and user’s accuracy (UA) is 86.6% for 2015, with values of 97.8% (PA) and 87.9% (UA) for 2018. The Sentinel-2 map shows that the PA is 91.7% with a UA of 86.5% for 2019. The evergreen forest has a UA of 95.7%–89.7% and PA of 84.3%–89.9% (2015–2018). Rubber plantation PA is 93.6%–68.1% and UA is 81.5%–95.5% (2015–2018) for the Landsat 8 OLI maps. We found that the overall accuracy in VHR is 89.72%–89.56% (2015–2018) with a kappa coefficient of 0.83–0.82 for the Landsat OLI phenology-based threshold maps of 2015 and 2018 (Table 3, Figure 14).

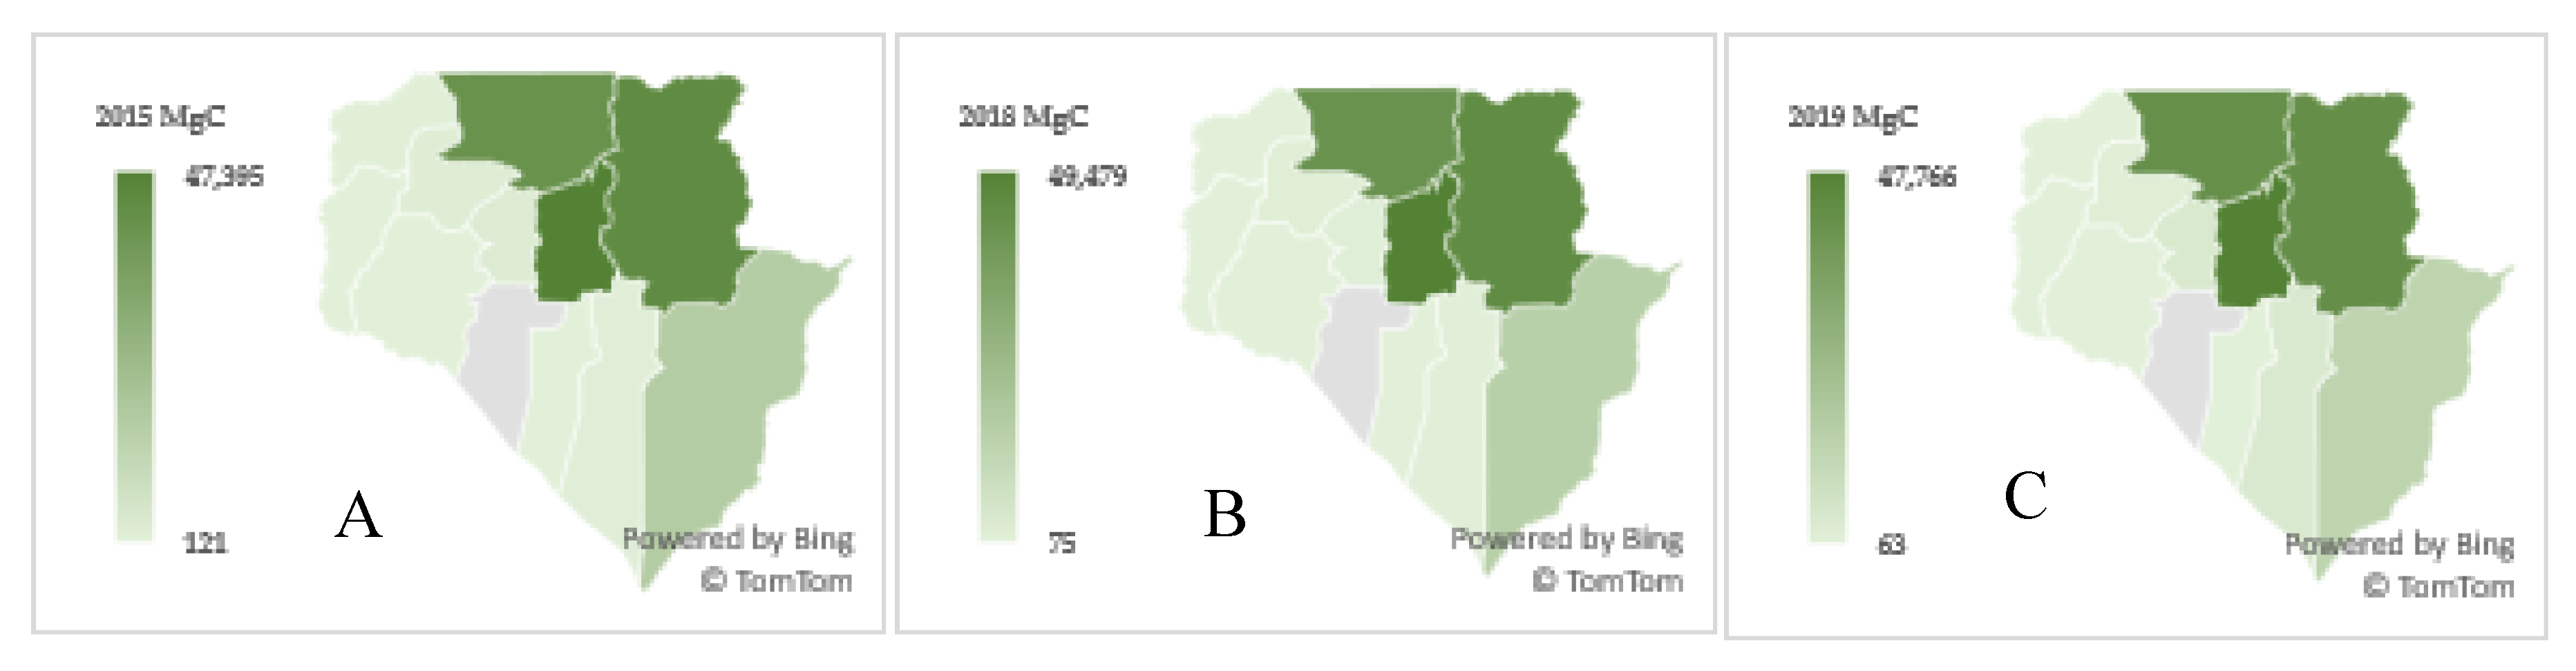
3.4. Area of Bamboo Forest and Its Carbon Stocks by Districts

We estimated a total bamboo area of 2674 ha in 2015, 2711 ha in 2018, and 2672 ha in 2019. Carbon stocks in bamboo forest were estimated at 153,511; 155,583; and 153,367 Mg C in 2015, 2018, and 2019, respectively. Specifically, among the 12 districts, the Banteay Srei District had a higher amount of bamboo carbon stocks (47,500 Mg C) between 2015 and 2019, and Svay Leu and Varin Districts had more than 41,600 Mg C in the same period. Other districts covered smaller portions of bamboo, and their carbon stocks were less than 3000 Mg C (Table 4).
Siem Reap is a popular tourist destination in Cambodia because of its rich historical temple attraction, Angkor Wat heritage, and natural attractions. Siem Reap welcomed 2.2 million tourists in 2018, increasing from 2.1 million in 2015. These visiting tourists accounted for carbon emissions of 8,693,652 Mg CO2 in 2015 and 9,107,635 Mg CO2 in 2018. Carbon emission reductions from the full protection of natural bamboo forests can offset 6% of carbon emissions from tourists visiting Siem Reap Province.
The spatial distribution of bamboo forest by districts in 2015, 2018, and 2019 is shown in Figure 15.

4. Discussion

Our method has limitations in identifying bamboo in dense and tall vegetation areas such as evergreen forest, as well as in smaller bamboo patches in other forests. There are possible errors in our study due to data limitation and the occurrence of natural stands of bamboo. Limited ground-based data also constrains potential accuracy. Different stages of bamboo growth in the study areas were obtained through remotely sensed temporal data. Different species at various growing stages show different phenological behaviors [20], and their spectral values vary during phenological stages [19,20]. Nath et al. [20] found that ground-based data are needed to reduce the possible errors while increasing the map accuracy. For example, in Sichuan Province, China, where small patch of bamboo could be identified through the use of ground-based data and k-nearest neighbor classifier for the Worldview-2 imagery [21]. Even in such a difficult situation, they achieved a bamboo map producer’s accuracy of 82.65% and a user’s accuracy of 93.10%.
The second source of error could be the distribution of bamboo mixed with other vegetation types. During the field survey, we found that other lowland areas in Siem Reap have small bamboo patches, usually along riverbanks and intermingled with tall, dense areas of evergreen and deciduous forests. This makes it difficult to identify bamboo from moderate-resolution satellite imagery, which might account for the omission errors in Table 3 and Figure 16.
When observing Figure 9 and Figure 10, the rubber category is the main source of confusion for the bamboo category because the ranges of the minimum and maximum threshold values are close to each other. To avoid this problem, big data [35] and deep learning-based technology [68,69] may be employed. In addition, because bamboo is usually mixed with evergreen forest in most of the study region, selection of ground-reference points for accuracy assessment without ground data can create confusion between bamboo and evergreen forests. If such incidence occurs, evergreen or bamboo can be mistakenly classified into just one category. One possible solution would be to use very high resolution imagery such as Planet’s daily imagery for bamboo phenological assessment and IKONOS, QuickBird, WorldView [21], GeoEye, and Pleiades, with 0.5 meter or finer spatial resolutions, or to acquire ground-based inventory data [30] or imagery from advanced unmanned aerial vehicles (UAV) [70,71]. Apart from the problems stated earlier, other possible errors when classifying the bamboo forests could occur if we want to classify the bamboo distribution by ages. Chen et al. [28] and Langner et al. [72] noted the difficulty in obtaining an integrated phenological cycle for young and mature bamboo using moderate-resolution remote sensing data.
Errors in estimating carbon stocks in bamboo forest could arise from the use of generalized data of carbon stocks per unit area from Sasaki et al. [30] which was based on average data for the whole country. To improve the accuracy of carbon stocks assessment, field measurement of the targeted bamboo forest in the study region could be a solution, but this is costly and time consuming.

5. Conclusions

Using PBTC method and GEE with remote sensing imagery from Landsat 8 OLI in 2015, 2016, 2017, and 2018, we were able to determine the minimum and maximum vegetation thresholds for bamboo forest, evergreen forest, and rubber plantation in Siem Reap province, Cambodia. With these thresholds, we could classify and map the distribution of natural bamboo forest in 2015 and 2018. We achieved the overall Landsat 8 OLI bamboo maps for 2015 and 2018 UAs of 86.6% and 87.9% and PAs of 95.7% and 97.8%, respectively. Similarly, we achieved UAs of 86.5% and PAs of 91.7% for Sentinel-2 imagery for 2019. Accordingly, spatial distribution of carbon stocks by districts in the Siem Reap was estimated and mapped across the province. We found that area of bamboo was 2674 ha in 2015, 2711 ha in 2018, and 2672 ha in 2019. Total carbon stocks in the respective years were 153,511, 155,583, and 153,367 Mg C.
It can be concluded that GEE can be used to classify and map the natural distribution of the natural bamboo forest and related carbon stocks with the aid of PBTC method, multi-spectral Sentinal-2 and Landsat 8 OLI imagery. However, using very high-resolution imagery, UAV, big data technology, and deep learning could improve the misclassification during the closer ranger of threshold values of various land cover categories. To avoid confusion between natural bamboo and evergreen forests, it is important to select the ground reference points through field visit, forest measurement, and/or using UAV.
If bamboo forest is fully protected, the avoided emissions could offset about 6% of carbon emissions by tourists visiting the province, indicating that bamboo can also play an important role in climate change mitigation in addition to providing non-timber forest products to the local people. As bamboo forest has multiple roles in local livelihood improvement as well as climate change mitigation, management of this forest through proper mapping and zoning could increase awareness of the benefits of the bamboo forests, which could help promote effective management for long-term sustainable use.

Author Contributions

Conceptualization, M.V.; methodology, M.V. and N.S.; GEE coding, M.V.; validation, M.V.; formal analysis, M.V.; investigation, M.V.; data curation, M.V.; writing—original draft preparation, M.V.; review and editing, N.S., S.A., J.A.C., and B.S.; visualization, M.V.; supervision, M.V., S.A., and N.S., project administration, M.V., N.S., S.A., and B.S.; funding acquisition, N.S., M.V., and B.S. All authors have read and agreed to the published version of the manuscript.

Funding

This research project is supported by the Second Century Fund (C2F), Chulalongkorn University and the Swedish Research Council grant Forest Restoration and Water Availability for Smart Agriculture: A Case Study of Cambodia (FRAWASA), Dnr. 2016-06329.

Acknowledgments

We would like to acknowledge the C2F of Chulalongkorn University, Thailand, for their post-doctoral fellowship. We would also like to thank the LEET Intelligence Co., Ltd. and Ecosystems Research and Development Bureau in the Philippines for research support and the FRAWASA’s Cambodian team for their assistance in field data collection.

Conflicts of Interest

The authors declare no conflict of interest.

Appendix A

Table A1. GEE JavaScript function for calculating the Landsat 8 OLI EVI.
Landsat 8 OLI EVI function
// Add an EVI function for the Landsat 8 TAO collections.
function addEVI(Landsat8){
return Landsat8.addBands(Landsat8.expression)
‘2.5 * ((NIR - RED) / (NIR + 6 * RED - 7.5 * BLUE + 1))’,
{
‘NIR’: Landsat8.select(‘B5’),
‘RED’: Landsat8.select(‘B4’),
‘BLUE’: Landsat8.select(‘B2’)
}).rename(‘L8EVI’)).float();
};
Sentinel-2 EVI function
// Add an EVI function for the Sentinel-2 (SNL) collections.
function addEVI(SNL){
return SNL.addBands(SNL.expression(
‘2.5 * ((NIR - RED) / (NIR + 6 * RED - 7.5 * BLUE + 1))’,
{
‘NIR’: SNL.select(‘B8’),
‘RED’: SNL.select(‘B4’),
‘BLUE’: SNL.select(‘B2’)
}).rename(‘SNLEVI’)).float();
};
where L = 1 (canopy background adjustment factor) [49,50]; C1 = 6 and C2 = 7.5 (aerosol correction factors) and G = 2.5 (gain factor) [49,50,51]; and NIR (Landsat band 5 and Sentinel-2 band 8 (B8), RED (band 4 (B4) in both Landsat and Sentinel-2), and BLUE (band 2 (B2) in both Landsat and Sentinel-2) are atmospherically corrected for surface reflectance in near-infrared, red, and blue bands of Sentinel-2 imagery in GEE [50].

References

  1. Zhou, G.; Meng, C.; Jiang, P.; Xu, Q. Review of Carbon Fixation in Bamboo Forests in China. Bot. Rev. 2011, 77, 262–270. [Google Scholar] [CrossRef]
  2. Houdanon, R.D.; Mensah, S.; Gnanglè, C.; Yorou, N.S.; Houinato, M. Ecosystem services and biomass stock from bamboo stands in central and southern Benin, West Africa. Energy Ecol. Environ. 2018, 3, 185–194. [Google Scholar] [CrossRef]
  3. INBAR Bamboo: A strategic resource for countries to reduce the effects of climate change. Policy Synth. Rep. 2014, 1–28.
  4. Ben-zhi, Z.; Mao-yi, F.; Jin-zhong, X.; Xiao-sheng, Y.; Zheng-cai, L. Ecological functions of bamboo forest: Research and Application. J. For. Res. 2005, 16, 143–147. [Google Scholar] [CrossRef]
  5. Yuen, J.Q.; Fung, T.; Ziegler, A.D. Carbon stocks in bamboo ecosystems worldwide: Estimates and uncertainties. For. Ecol. Manage. 2017, 393, 113–138. [Google Scholar] [CrossRef]
  6. Yiping, L.; Yanxia, L.; Buckingham, K.; Henley, G.; Guomo, Z. Bamboo and Climate Change Mitigation: A Comparative Analysis of Carbon Sequestration; International Network for Bamboo and Rattan (INBAR): Beijing, China, 2010; Volume 32, ISBN 978-92-95098-89-3. [Google Scholar]
  7. Goswami, J.; Tajo, L.; Sarma, K.K. Bamboo resources mapping using satellite technology. Curr. Sci. 2010, 99, 650–653. [Google Scholar]
  8. Simonetti, D.; Simonetti, E.; Szantoi, Z.; Lupi, A.; Eva, H.D. First Results from the Phenology-Based Synthesis Classifier Using Landsat 8 Imagery. IEEE Geosci. Remote Sens. Lett. 2015, 12, 1496–1500. [Google Scholar] [CrossRef]
  9. Kou, W.; Xiao, X.; Dong, J.; Gan, S.; Zhai, D.; Zhang, G.; Qin, Y.; Li, L. Mapping deciduous rubber plantation areas and stand ages with PALSAR and landsat images. Remote Sens. 2015, 7, 1048–1073. [Google Scholar] [CrossRef] [Green Version]
  10. Dong, J.; Xiao, X.; Menarguez, M.A.; Zhang, G.; Qin, Y.; Thau, D.; Biradar, C.; Moore, B. Mapping paddy rice planting area in northeastern Asia with Landsat 8 images, phenology-based algorithm and Google Earth Engine. Remote Sens. Environ. 2016, 185, 142–154. [Google Scholar] [CrossRef] [Green Version]
  11. Fan, H.; Fu, X.; Zhang, Z.; Wu, Q.; Fan, H.; Fu, X.; Zhang, Z.; Wu, Q. Phenology-Based Vegetation Index Differencing for Mapping of Rubber Plantations Using Landsat OLI Data. Remote Sens. 2015, 7, 6041–6058. [Google Scholar] [CrossRef] [Green Version]
  12. Zhang, M.; Gong, P.; Qi, S.; Liu, C.; Xiong, T. Mapping bamboo with regional phenological characteristics derived from dense Landsat time series using Google Earth Engine. Int. J. Remote Sens. 2019, 40, 9541–9555. [Google Scholar] [CrossRef]
  13. Venkatappa, M.; Sasaki, N.; Shrestha, R.P.; Tripathi, N.K.; Ma, H.O. Determination of vegetation thresholds for assessing land use and land use changes in Cambodia using the Google Earth Engine cloud-computing platform. Remote Sens. 2019, 11, 1514. [Google Scholar] [CrossRef] [Green Version]
  14. Alwashe, M.A.; Bokhari, A.Y. Monitoring vegetation changes in Al Madinah, Saudi Arabia, using Thematic Mapper data. Int. J. Remote Sens. 1993, 14, 191–197. [Google Scholar] [CrossRef]
  15. Tsai, Y.H.; Stow, D.; Chen, H.L.; Lewison, R.; An, L.; Shi, L. Mapping vegetation and land use types in Fanjingshan National Nature Reserve using google earth engine. Remote Sens. 2018, 10, 927. [Google Scholar] [CrossRef] [Green Version]
  16. Xiao, C.; Li, P.; Feng, Z.; Liu, X. An updated delineation of stand ages of deciduous rubber plantations during 1987-2018 using Landsat-derived bi-temporal thresholds method in an anti-chronological strategy. Int. J. Appl. Earth Obs. Geoinf. 2019, 76, 40–50. [Google Scholar] [CrossRef]
  17. Wang, J.; Xiao, X.; Qin, Y.; Dong, J.; Zhang, G.; Kou, W.; Jin, C.; Zhou, Y.; Zhang, Y. Mapping paddy rice planting area in wheat-rice double-cropped areas through integration of Landsat-8 OLI, MODIS, and PALSAR images. Sci. Rep. 2015, 5. [Google Scholar] [CrossRef] [PubMed] [Green Version]
  18. Schwieder, M.; Leitão, P.J.; Pinto, J.R.R.; Teixeira, A.M.C.; Pedroni, F.; Sanchez, M.; Bustamante, M.M.; Hostert, P. Landsat phenological metrics and their relation to aboveground carbon in the Brazilian Savanna. Carbon Balance Manag. 2018, 13, 7. [Google Scholar] [CrossRef] [Green Version]
  19. Fava, F.; Colombo, R. Remote sensing-based assessment of the 2005-2011 bamboo reproductive event in the arakan mountain range and its relation with wildfires. Remote Sens. 2017, 9, 85. [Google Scholar] [CrossRef] [Green Version]
  20. Nath, A.J.; Das, G.; Das, A.K. Vegetative phenology of three bamboo species in subtropical humid climate of Assam. Trop. Ecol. 2008, 49, 85–89. [Google Scholar]
  21. Tang, Y.; Jing, L.; Li, H.; Liu, Q.; Yan, Q.; Li, X. Bamboo classification using worldview-2 imagery of giant panda habitat in a large shaded area in wolong, Sichuan province, China. Sensors 2016, 16, 1957. [Google Scholar] [CrossRef]
  22. Adole, T.; Dash, J.; Atkinson, P.M. Characterising the land surface phenology of Africa using 500 m MODIS EVI. Appl. Geogr. 2018, 90, 187–199. [Google Scholar] [CrossRef] [Green Version]
  23. Verhegghen, A.; Bontemps, S.; Defourny, P. A global NDVI and EVI reference data set for land-surface phenology using 13 years of daily SPOT-VEGETATION observations. Int. J. Remote Sens. 2014, 35, 2440–2471. [Google Scholar] [CrossRef] [Green Version]
  24. Matsushita, B.; Yang, W.; Chen, J.; Onda, Y.; Qiu, G. Sensitivity of the Enhanced Vegetation Index (EVI) and Normalized Difference Vegetation Index (NDVI) to Topographic Effects: A Case Study in High-density Cypress Forest. Sensors 2007, 7, 2636–2651. [Google Scholar] [CrossRef] [PubMed] [Green Version]
  25. Gurung, R.B.; Breidt, F.J.; Dutin, A.; Ogle, S.M. Predicting Enhanced Vegetation Index (EVI) curves for ecosystem modeling applications. Remote Sens. Environ. 2009, 113, 2186–2193. [Google Scholar] [CrossRef]
  26. Kou, W.; Liang, C.; Wei, L.; Hernandez, A.; Yang, X. Phenology-Based Method for Mapping Tropical Evergreen Forests by Integrating of MODIS and Landsat Imagery. Forests 2017, 8, 34. [Google Scholar] [CrossRef]
  27. Mishra, N.B.; Crews, K.A.; Neuenschwander, A.L. Sensitivity of EVI-based harmonic regression to temporal resolution in the lower Okavango Delta. Int. J. Remote Sens. 2012, 33, 7703–7726. [Google Scholar] [CrossRef]
  28. Chen, Y.; Li, L.; Lu, D.; Li, D. Exploring bamboo forest aboveground biomass estimation using Sentinel-2 data. Remote Sens. 2019, 11, 7. [Google Scholar] [CrossRef] [Green Version]
  29. SijiMol, K.; Dev, S.A.; Sreekumar, V.B. A Review of the Ecological Functions of Reed Bamboo, Genus Ochlandra in the Western Ghats of India: Implications for Sustainable Conservation. Trop. Conserv. Sci. 2016, 9, 389–407. [Google Scholar] [CrossRef]
  30. Sasaki, N.; Chheng, K.; Mizoue, N.; Abe, I.; Lowe, A.J. Forest reference emission level and carbon sequestration in Cambodia. Glob. Ecol. Conserv. 2016, 7, 82–96. [Google Scholar] [CrossRef] [Green Version]
  31. Chheng, K.; Sasaki, N.; Mizoue, N.; Khorn, S.; Kao, D.; Lowe, A. Assessment of carbon stocks of semi-evergreen forests in Cambodia. Glob. Ecol. Conserv. 2016, 5, 34–47. [Google Scholar] [CrossRef] [Green Version]
  32. Avtar, R.; Suzuki, R.; Takeuchi, W.; Sawada, H. PALSAR 50 m Mosaic Data Based National Level Biomass Estimation in Cambodia for Implementation of REDD+ Mechanism. PLoS ONE 2013, 8, e74807. [Google Scholar] [CrossRef] [PubMed]
  33. Singh, M.; Evans, D.; Chevance, J.B.; Tan, B.S.; Wiggins, N.; Kong, L.; Sakhoeun, S. Evaluating remote sensing datasets and machine learning algorithms for mapping plantations and successional forests in Phnom Kulen National Park of Cambodia. PeerJ 2019, 2019, e7841. [Google Scholar] [CrossRef]
  34. Kumar, L.; Mutanga, O. Google Earth Engine Applications Since Inception: Usage, Trends, and Potential. Remote Sens. 2018, 10, 1509. [Google Scholar] [CrossRef] [Green Version]
  35. Gorelick, N.; Hancher, M.; Dixon, M.; Ilyushchenko, S.; Thau, D.; Moore, R. Google Earth Engine: Planetary-scale geospatial analysis for everyone. Remote Sens. Environ. 2017, 202, 18–27. [Google Scholar] [CrossRef]
  36. Lopezaraiza-mikel, M.; Quesada, M.; Daniel, L.; Cabadilla, A. Phenological patterns of tropical dry forest along latitudinal and successional gradients in the Neotropics. In Tropical Dry Forests in the Americas: Ecology, Conservation, and Management; Sánchez-Azofeifa, A., Powers, J.S., Fernandes, G.W., Quesada, M., Eds.; CRC Press: Boca Raton, FL, USA, 2014; pp. 101–128. [Google Scholar]
  37. Huang, H.; Chen, Y.; Clinton, N.; Wang, J.; Wang, X.; Liu, C.; Gong, P.; Yang, J.; Bai, Y.; Zheng, Y.; et al. Mapping major land cover dynamics in Beijing using all Landsat images in Google Earth Engine. Remote Sens. Environ. 2017, 202, 166–176. [Google Scholar] [CrossRef]
  38. Sidhu, N.; Pebesma, E.; Câmara, G. Using Google Earth Engine to detect land cover change: Singapore as a use case. Eur. J. Remote Sens. 2018, 51, 486–500. [Google Scholar] [CrossRef]
  39. Markert, K.N.; Schmidt, C.M.; Griffin, R.E.; Flores, A.I.; Poortinga, A.; Saah, D.S.; Muench, R.E.; Clinton, N.E.; Chishtie, F.; Kityuttachai, K.; et al. Historical and operational monitoring of surface sediments in the Lower Mekong Basin using Landsat and Google Earth Engine cloud computing. Remote Sens. 2018, 10, 909. [Google Scholar] [CrossRef] [Green Version]
  40. Aryal, J.P.; Sapkota, T.B.; Khurana, R.; Khatri-Chhetri, A.; Rahut, D.B.; Jat, M.L. Climate change and agriculture in South Asia: Adaptation options in smallholder production systems. Environ. Dev. Sustain. 2019, 1–31. [Google Scholar] [CrossRef] [Green Version]
  41. NIS National Institute of Statistics. Available online: http://www.nis.gov.kh/index.php/en/ (accessed on 19 August 2020).
  42. Rao, A.N.; Ramanatha Rao, V.; Institute, I.P.G.R. Bamboo—Conservation, diversity, ecogeography, germplasm, resources utilization and taxonomy. In Proceedings of the Training Course Cum Workshop, Kunming and Xishuangbanna, Yunnan, China, 10–17 May 1998. [Google Scholar]
  43. MoE Cambodia Forest Cover 2016. Available online: https://redd.unfccc.int/uploads/54_3_cambodia_forest_cover_resource__2016_english.pdf (accessed on 10 June 2020).
  44. ODC Open Development Cambodia. Available online: https://opendevelopmentcambodia.net/map-explorer (accessed on 17 August 2020).
  45. Fawcett, A.D.; Leiterer, R.; Heisig, H.; Wulf, H.; Kellenberger, T.; Joerg, P.C. Google Earth Engine Product Prototypes. 2017. Available online: https://developers.google.com/earth-engine (accessed on 10 June 2020).
  46. Google Earth Engine Earth Engine Data Catalog. Available online: https://developers.google.com/earth-engine/datasets/ (accessed on 15 August 2020).
  47. Chander, G.; Markham, B.L.; Helder, D.L. Summary of current radiometric calibration coefficients for Landsat MSS, TM, ETM+, and EO-1 ALI sensors. Remote Sens. Environ. 2009, 113, 893–903. [Google Scholar] [CrossRef]
  48. Arekhi, M.; Goksel, C.; Sanli, F.B.; Senel, G. Comparative evaluation of the spectral and spatial consistency of Sentinel-2 and Landsat-8 OLI data for Igneada longos forest. ISPRS Int. J. Geo-Inf. 2019, 8, 56. [Google Scholar] [CrossRef] [Green Version]
  49. Jiang, Z.; Huete, A.R.; Didan, K.; Miura, T. Development of a two-band enhanced vegetation index without a blue band. Remote Sens. Environ. 2008, 112, 3833–3845. [Google Scholar] [CrossRef]
  50. Banskota, A.; Wynne, R.H.; Johnson, P.; Emessiene, B. Synergistic use of very high-frequency radar and discrete-return lidar for estimating biomass in temperate hardwood and mixed forests. Ann. For. Sci. 2011, 68, 347–356. [Google Scholar] [CrossRef] [Green Version]
  51. Samreth, V.; Chheng, K.; Monda, Y.; Kiyono, Y.; Toriyama, J.; Saito, S.; Saito, H.; Ito, E. Tree Biomass Carbon Stock Estimation using Permanent Sampling Plot Data in Different Types of Seasonal Forests in Cambodia. Japan Agric. Res. Q. 2012, 46, 187–192. [Google Scholar] [CrossRef]
  52. Wilson, B.T.; Knight, J.F.; McRoberts, R.E. Harmonic regression of Landsat time series for modeling attributes from national forest inventory data. ISPRS J. Photogramm. Remote Sens. 2018, 137, 29–46. [Google Scholar] [CrossRef]
  53. Xiong, J.; Thenkabail, P.S.; Tilton, J.C.; Gumma, M.K.; Teluguntla, P.; Oliphant, A.; Congalton, R.G.; Yadav, K.; Gorelick, N. Nominal 30-m cropland extent map of continental Africa by integrating pixel-based and object-based algorithms using Sentinel-2 and Landsat-8 data on google earth engine. Remote Sens. 2017, 9, 65. [Google Scholar] [CrossRef] [Green Version]
  54. Potere, D. Horizontal positional accuracy of google earth’s high-resolution imagery archive. Sensors 2008, 8, 7973–7981. [Google Scholar] [CrossRef]
  55. Tilahun, A. Accuracy Assessment of Land Use Land Cover Classification using Google Earth. Am. J. Environ. Prot. 2015, 4, 193. [Google Scholar] [CrossRef]
  56. Ragheb, A.E.; Ragab, A.F. Enhancement of Google Earth Positional Accuracy. Int. J. Eng. Res. Technol. 2015, 4, 627–630. [Google Scholar]
  57. Mohammed, N.Z.; Ghazi, A.; Mustafa, H.E. Positional accuracy testing of Google Earth. Int. J. Multidiscip. Sci. Eng. 2013, 4, 6–9. [Google Scholar]
  58. Olofsson, P.; Foody, G.M.; Herold, M.; Stehman, S.V.; Woodcock, C.E.; Wulder, M.A. Good practices for estimating area and assessing accuracy of land change. Remote Sens. Environ. 2014, 148, 42–57. [Google Scholar] [CrossRef]
  59. Foody, G.M. Harshness in image classification accuracy assessment. Int. J. Remote Sens. 2008, 29, 3137–3158. [Google Scholar] [CrossRef] [Green Version]
  60. FREL Initial Forest Reference Level for Cambodia under the UNFCCC Framework. Available online: https://redd.unfccc.int/files/cambodia_frl_rcvd17112016.pdf (accessed on 17 November 2018).
  61. Lu, H.; Liu, G.; Zhao, J.; Jiang, L. Current remote sensing options for monitoring carbon emissions. Int. Conf. Geoinformatics 2013, 2–5. [Google Scholar]
  62. Angelsen, A. REDD+ as Result-based Aid: General Lessons and Bilateral Agreements of Norway. Rev. Dev. Econ. 2017, 21, 237–264. [Google Scholar] [CrossRef] [Green Version]
  63. Venkatesh, G.; Gerdesmeier, D.; Primer, A.; Walther, L.M.; Summary, E.; Pierce, K.E.N.; Fernando, E.S.; Gruezo, W.S.; Bantayan, N.C.; Calderon, M.M.; et al. Sustainable Financing for Forest and Landscape Restoration: Opportunities, Challenges, and the Way Forward; FAO and UNCCD: Rome, Italy, 2016; Volume 11, ISBN 9789251072929. [Google Scholar]
  64. Sasaki, N.; Asner, G.P.; Pan, Y.; Knorr, W.; Durst, P.B.; Ma, H.O.; Abe, I.; Lowe, A.J.; Koh, L.P.; Putz, F.E. Sustainable Management of Tropical Forests Can Reduce Carbon Emissions and Stabilize Timber Production. Front. Environ. Sci. 2016, 4, 50. [Google Scholar] [CrossRef] [Green Version]
  65. IPCC Task Force on National Greenhouse Gas Inventories. Available online: https://www.ipcc-nggip.iges.or.jp/public/2006gl/vol4.html (accessed on 10 June 2020).
  66. TC Cambodia Tourism Statistics - Tourist Information Center | Tourism Cambodia. Available online: https://www.tourismcambodia.com/tourist-information/tourist-statistic.htm (accessed on 29 July 2020).
  67. Lenzen, M.; Sun, Y.Y.; Faturay, F.; Ting, Y.P.; Geschke, A.; Malik, A. The carbon footprint of global tourism. Nat. Clim. Chang. 2018, 8, 522–528. [Google Scholar] [CrossRef]
  68. Zhang, C.; Sargent, I.; Pan, X.; Li, H.; Gardiner, A.; Hare, J.; Atkinson, P.M. Joint Deep Learning for land cover and land use classification. Remote Sens. Environ. 2019, 221, 173–187. [Google Scholar] [CrossRef] [Green Version]
  69. Zhang, X.; Han, L.; Han, L.; Zhu, L. How Well Do Deep Learning-Based Methods for Land Cover Classification and Object Detection Perform on High Resolution Remote Sensing Imagery? Remote Sens. 2020, 12, 417. [Google Scholar] [CrossRef] [Green Version]
  70. Iizuka, K.; Yonehara, T.; Itoh, M. Estimating Tree Height and Diameter at Breast Height (DBH) from Digital Surface Models and Orthophotos Obtained with an Unmanned Aerial System for a Japanese Cypress (Chamaecyparis obtusa) Forest. Remote Sens. 2018, 10, 13. [Google Scholar] [CrossRef] [Green Version]
  71. McCabe, M.F.; Rodell, M.; Alsdorf, D.E.; Miralles, D.G.; Uijlenhoet, R.; Wagner, W.; Lucieer, A.; Houborg, R.; Verhoest, N.E.C.; Franz, T.E.; et al. The future of Earth observation in hydrology. Hydrol. Earth Syst. Sci. 2017, 21, 3879–3914. [Google Scholar] [CrossRef] [PubMed] [Green Version]
  72. Langner, A.; Miettinen, J.; Kukkonen, M.; Vancutsem, C.; Simonetti, D.; Vieilledent, G.; Verhegghen, A.; Gallego, J.; Stibig, H.J. Towards operational monitoring of forest canopy disturbance in evergreen rain forests: A test case in continental Southeast Asia. Remote Sens. 2018, 10, 544. [Google Scholar] [CrossRef] [Green Version]
Figure 1. Map of the study area. Note: Light green points indicate phenology sampling points for bamboo, evergreen, and rubber plantations. The yellow box indicates the National Park of Phnom Kulen mountain. Source: The background map is the bamboo distribution derived from Sentinel-2 imagery in 2019 in this study. The provincial and district boundaries were obtained from Open Development Cambodia [44].
Remotesensing 12 03109 g001
Figure 2. Methodological framework of phenology-based threshold classification to identify the natural distribution of bamboo forest. GEE, Google Earth Engine; EVI, enhanced vegetation index; EOS, end of season; SOS, start of season; LSP, leaf-shedding phenology stage; LFP, leaf-flushing phenology stage.
Remotesensing 12 03109 g002
Figure 3. Example of original and fitted OLI index time-series profile of evergreen forest and bamboo between 2015 and 2018 generated by using harmonic regression and a time-series model. (A) is the GEE JavaScript code window, (B) is the EVI time-series graph, (C) is the geometry inputs for selected forest land cover categories and (D) shows the map window in GEE.
Remotesensing 12 03109 g003
Figure 4. Example result of Sentinel-2 imagery phenology-based threshold classified map. Legend: (A) Code window showing the PBTC functions developed in GEE. (B) Map window that represents the 10 m resolution Sentinel-2 land use map in 2019. Bamboo forest appears in yellow (inset legend). The background image is GEE Google Earth imagery.
Remotesensing 12 03109 g004
Figure 5. Imported reference points in Google Earth Pro for PBTC map accuracy assessment.
Remotesensing 12 03109 g005
Figure 6. Fitted phenological profile of Landsat 8 OLI EVI composite data for bamboo forest.
Remotesensing 12 03109 g006
Figure 7. Fitted mean vegetation index profiles of Landsat 8 OLI EVI composite data for rubber plantation. Average index profiles were generated by assessing 40 profiles from 10 geometry locations of the bamboo category between 2015 and 2018.
Remotesensing 12 03109 g007
Figure 8. Fitted EVI profile of Landsat 8 OLI EVI composite data for evergreen forest. The average vegetation index profiles were generated from 10 geometry locations by assessing 40 profiles from 2015 to 2018.
Remotesensing 12 03109 g008
Figure 9. Time-series average index values of bamboo, rubber, and evergreen forest categories during the middle LSP season from 2015 to 2018. The average phenology index values were generated by validating 120 index profiles. The box surrounding the profiles indicates the phase of separation of the EVI profile of the three vegetation categories during the middle-leaf-shedding phenology season. Locally, May–October is the rainy season (LFP stage), and November–April is the dry season (LSP stage).
Remotesensing 12 03109 g009
Figure 10. Minimum and maximum threshold values for bamboo forest, rubber plantation, and evergreen forest determined using Landsat 8 OLI EVI time-series data during the mid-LSP stage from 2015 to 2018.
Remotesensing 12 03109 g010
Figure 11. Maps showing the bamboo distribution in Siem Reap in 2015. Inset maps show the locations of the natural bamboo distributions around the Kulen Mountain (A) and Boeng Peae Wildlife Sanctuary (B) and of dense evergreen forests in southeastern region of the Boeng Peae Wildlife Sanctuary (C) and Angkor Wat temple (D).
Remotesensing 12 03109 g011
Figure 12. Maps showing the bamboo distribution in Siem Reap in 2018. Inset maps show natural distribution of bamboo in Kulen Mountain (A) and Boeng Peae Wildlife Sanctuary regions (B), rubber plantation in southeastern region (C) and evergreen forest around the Angkor Wat temple (D).
Remotesensing 12 03109 g012
Figure 13. Maps showing the bamboo distribution using the Sentinel-2 in Siem Reap, 2019. Inset maps show natural distribution of bamboo around the Kulen Mountain (A) and Boeng Peae Wildlife Sanctuary areas (B), rubber plantation (C) and dense evergreen forest around the Angkor Wat temple (D).
Remotesensing 12 03109 g013
Figure 14. Example of Landsat 8 PBTC 2018 map with 89% overall accuracy. Green indicates evergreen forest, and yellow represents the distribution of bamboo. The background image is very high resolution (VHR) imagery in GEE.
Remotesensing 12 03109 g014
Figure 15. Maps showing carbon stock distribution at the district level using Landsat OLI data (A) in 2015 and (B) in 2018, while (C) used Sentinel-2 data in 2019.
Remotesensing 12 03109 g015
Figure 16. Images showing the locations of our field survey and unmanned aerial vehicle (UAV) Phantom 4’s captured locations for detecting bamboo. (A). evergreen forest and bamboo patches (red boxes outline bamboo distribution). (B). field survey of bamboo distribution along the river. (C). dense evergreen forest and bamboo distribution. (D). young bamboo patches in a deciduous forest.
Remotesensing 12 03109 g016
Table 1. Landsat 8 Operational Land Imager (OLI) collections used for assessing the phenological behavior of selected land cover categories.
Landsat 8 OLI
PATHROW2015201620172018
1265017161615
5121201816
1275020201918
5117222220
Total Collections75787569
Table 2. Landsat OLI and Sentinel-2 image collections used in this study for phenology-based threshold classification (PBTC).
Cloud-Free Month and YearPATH/ROW Sentinel-2 TILELandsat 8 Sentinel-2 Number of Images/Tiles
December–February126/50L-8-OLI-TOA20
2014–2015127/51
December–February126/50L-8-OLI-TOA20
2017–2018127/51
January–December 201948PUA, 48PUV, 48PVA, 48PVVSentinel-2442
Total 482
Note: OLI is Landsat Operational Land Imager 8, and TOA is top-of-atmosphere; 48PUA, 48PUV, 48PVA, and 48PVV are Sentinel-2 Military Grid Reference System (MGRS) tiles in the study region.
Table 3. User’s accuracy and producer’s accuracy assessment for classifying the bamboo, rubber, and evergreen forest in Siem Reap.
Forest CategoryEvergreenRubberBambooUser’s Accuracy
Landsat OLI imagery in 2015
Evergreen2685795.70%>
Rubber1788381.50%
Bamboo33122086.60%
Producer’s accuracy84.30%93.60%95.70%Overall Accuracy 89.72%
Kappa 0.83
Landsat OLI imagery in 2018
Evergreen28629489.70%
Rubber264195.50%
Bamboo30122587.90%
Producer’s accuracy89.90%68.10%97.80%Overall Accuracy 89.56%
Kappa 0.82
Sentinel-2 imagery for 2019
Evergreen273111491.60%
Rubber788588.00%
Bamboo28521186.50%
Producer’s Accuracy88.60%84.60%91.70%Overall Accuracy 89.10%
Kappa 0.82
Note 1: Bold cells indicate the agreement of the accuracy metrics. Note 2: Total reference points 642.
Table 4. Total carbon stocks and emission reductions in bamboo forests by districts in Siem Reap Province in 2015, 2018, and 2019.
District Name201520182019
Area (ha)(Mg C)Area (ha)(Mg C)Area (ha)(Mg C)
Angkor Chum261504201137201142
Angkor Thum362061181039553134
Banteay Srei82647,39586249,47983147,682
Chi Kraeng27015,52125314,52221512,335
Kralanh212121263189
Puok3149175169
Prasat Bakong317831895258
Krong Siem Reab201165221246301693
Soutr Nikom147988448533054
Srei Snam11603286163
Svay Leu75743,46978745,14573442,132
Varin70640,54773342,09172541,615
Total2674153,5112711155,5832672153,367
Bamboo Emissions (Mg CO2)562,872 570,470 562,346
Carbon Emissions by tourists visiting Siem Reap (Mg CO2)8,693,652 9,107,635
Carbon Offsetting Rate (from Tourists-Based Emissions)6.5% 6.3%

