Monitoring Pasture Aboveground Biomass and Canopy Height in an Integrated Crop–Livestock System Using Textural Information from PlanetScope Imagery
Abstract
1. Introduction
2. Materials and Methods
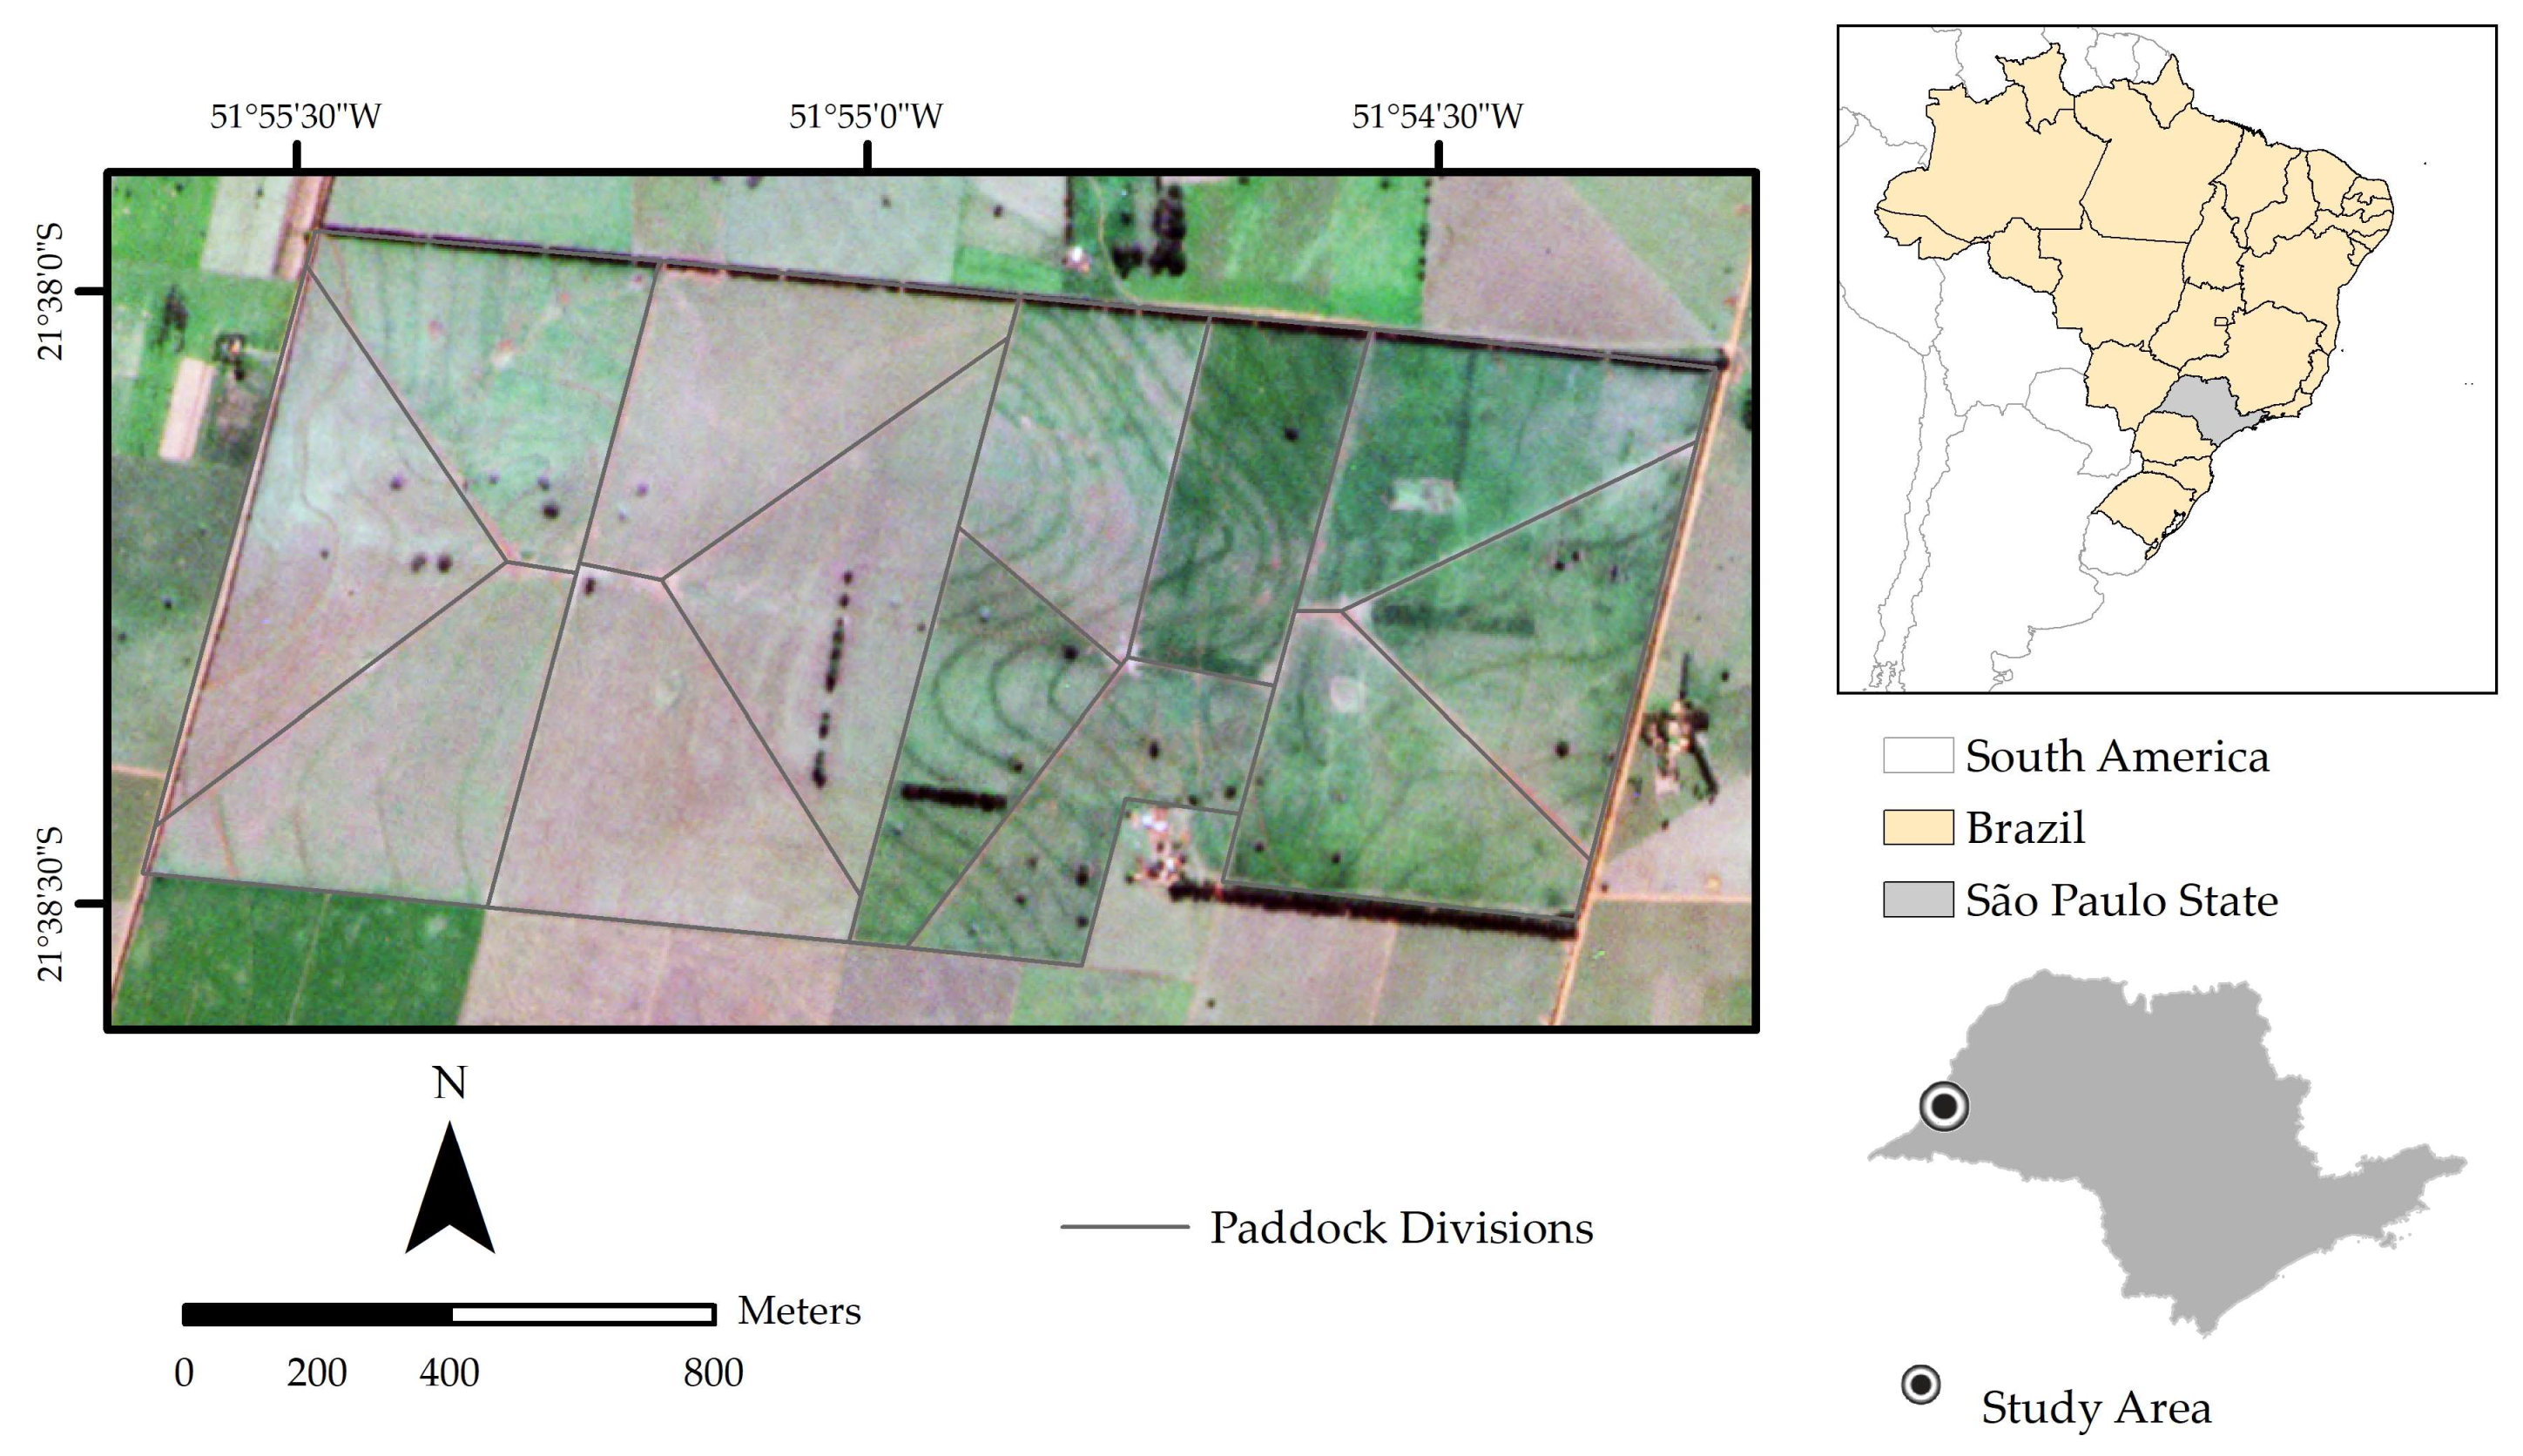
2.1. Study Area
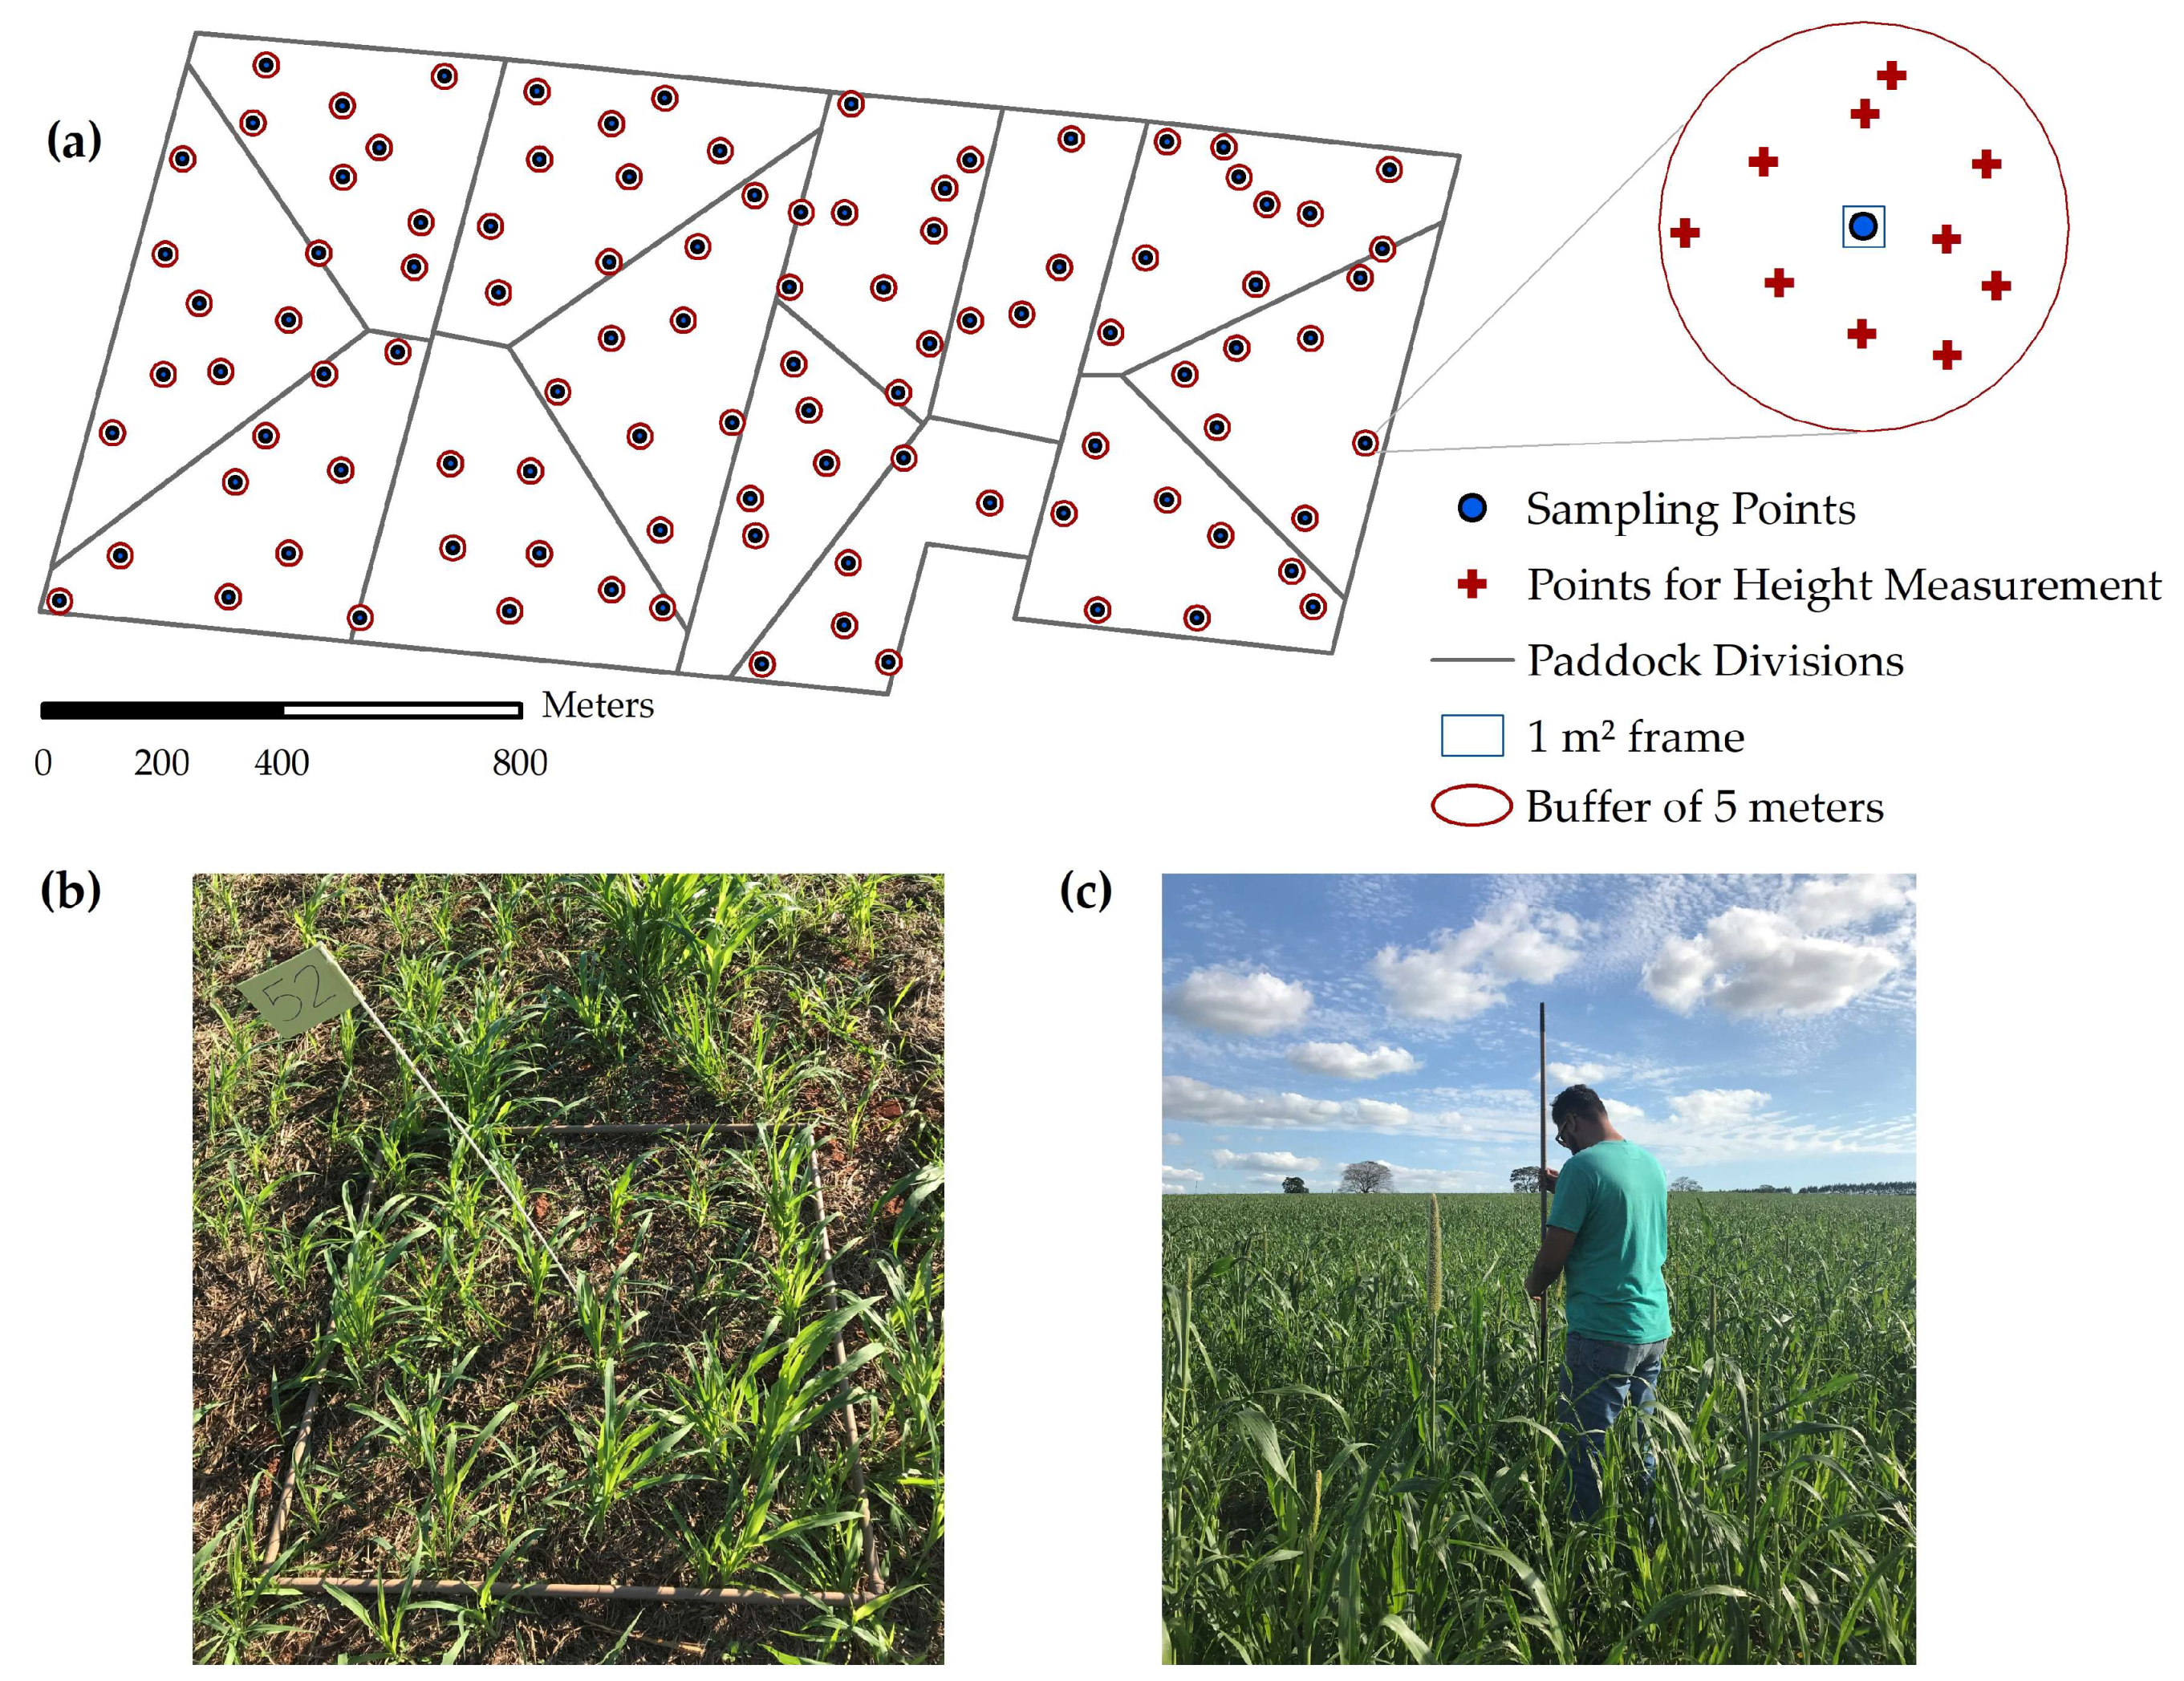
2.2. Field Data Collection
2.3. Remote Sensing Data Collection and Preprocessing
2.4. Vegetation Indices
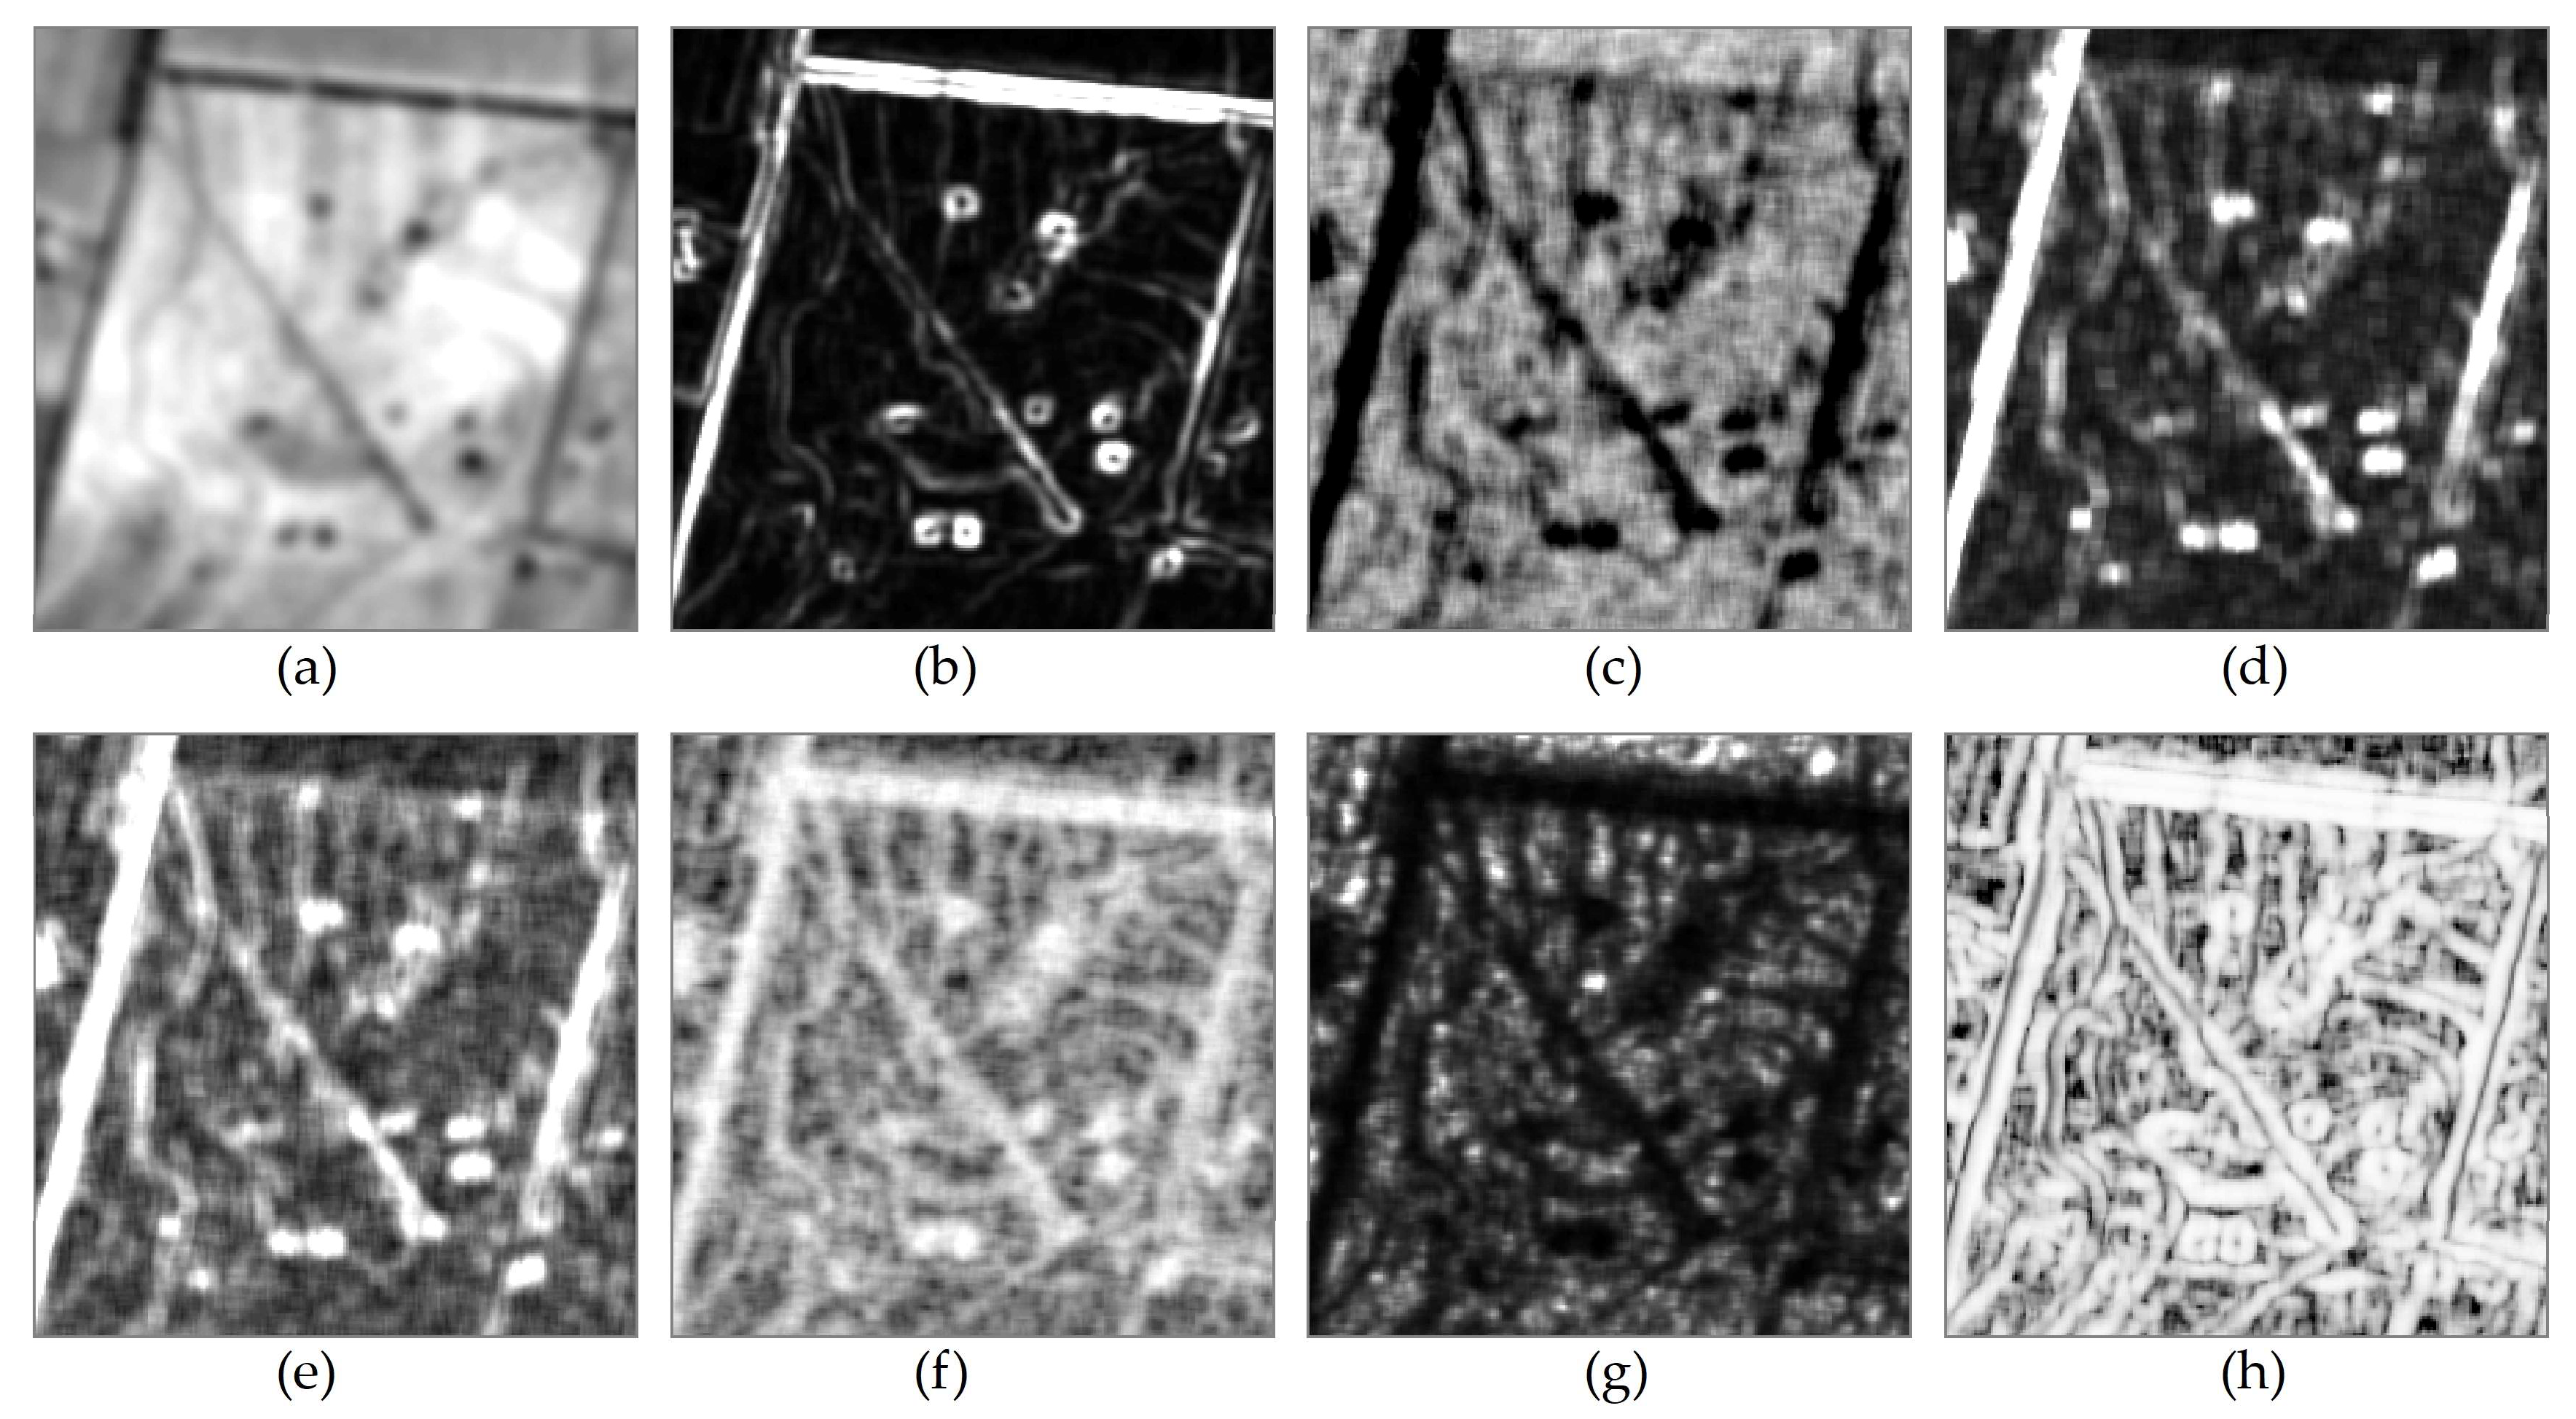
2.5. Texture Measures
2.6. Spectral and Textural Data Extraction
2.7. Pasture AGB and CH Modelling
Machine Learning Regression Algorithms
2.8. Model Evaluation
2.8.1. Hyperparameters Tuning in XGBoost and RF models
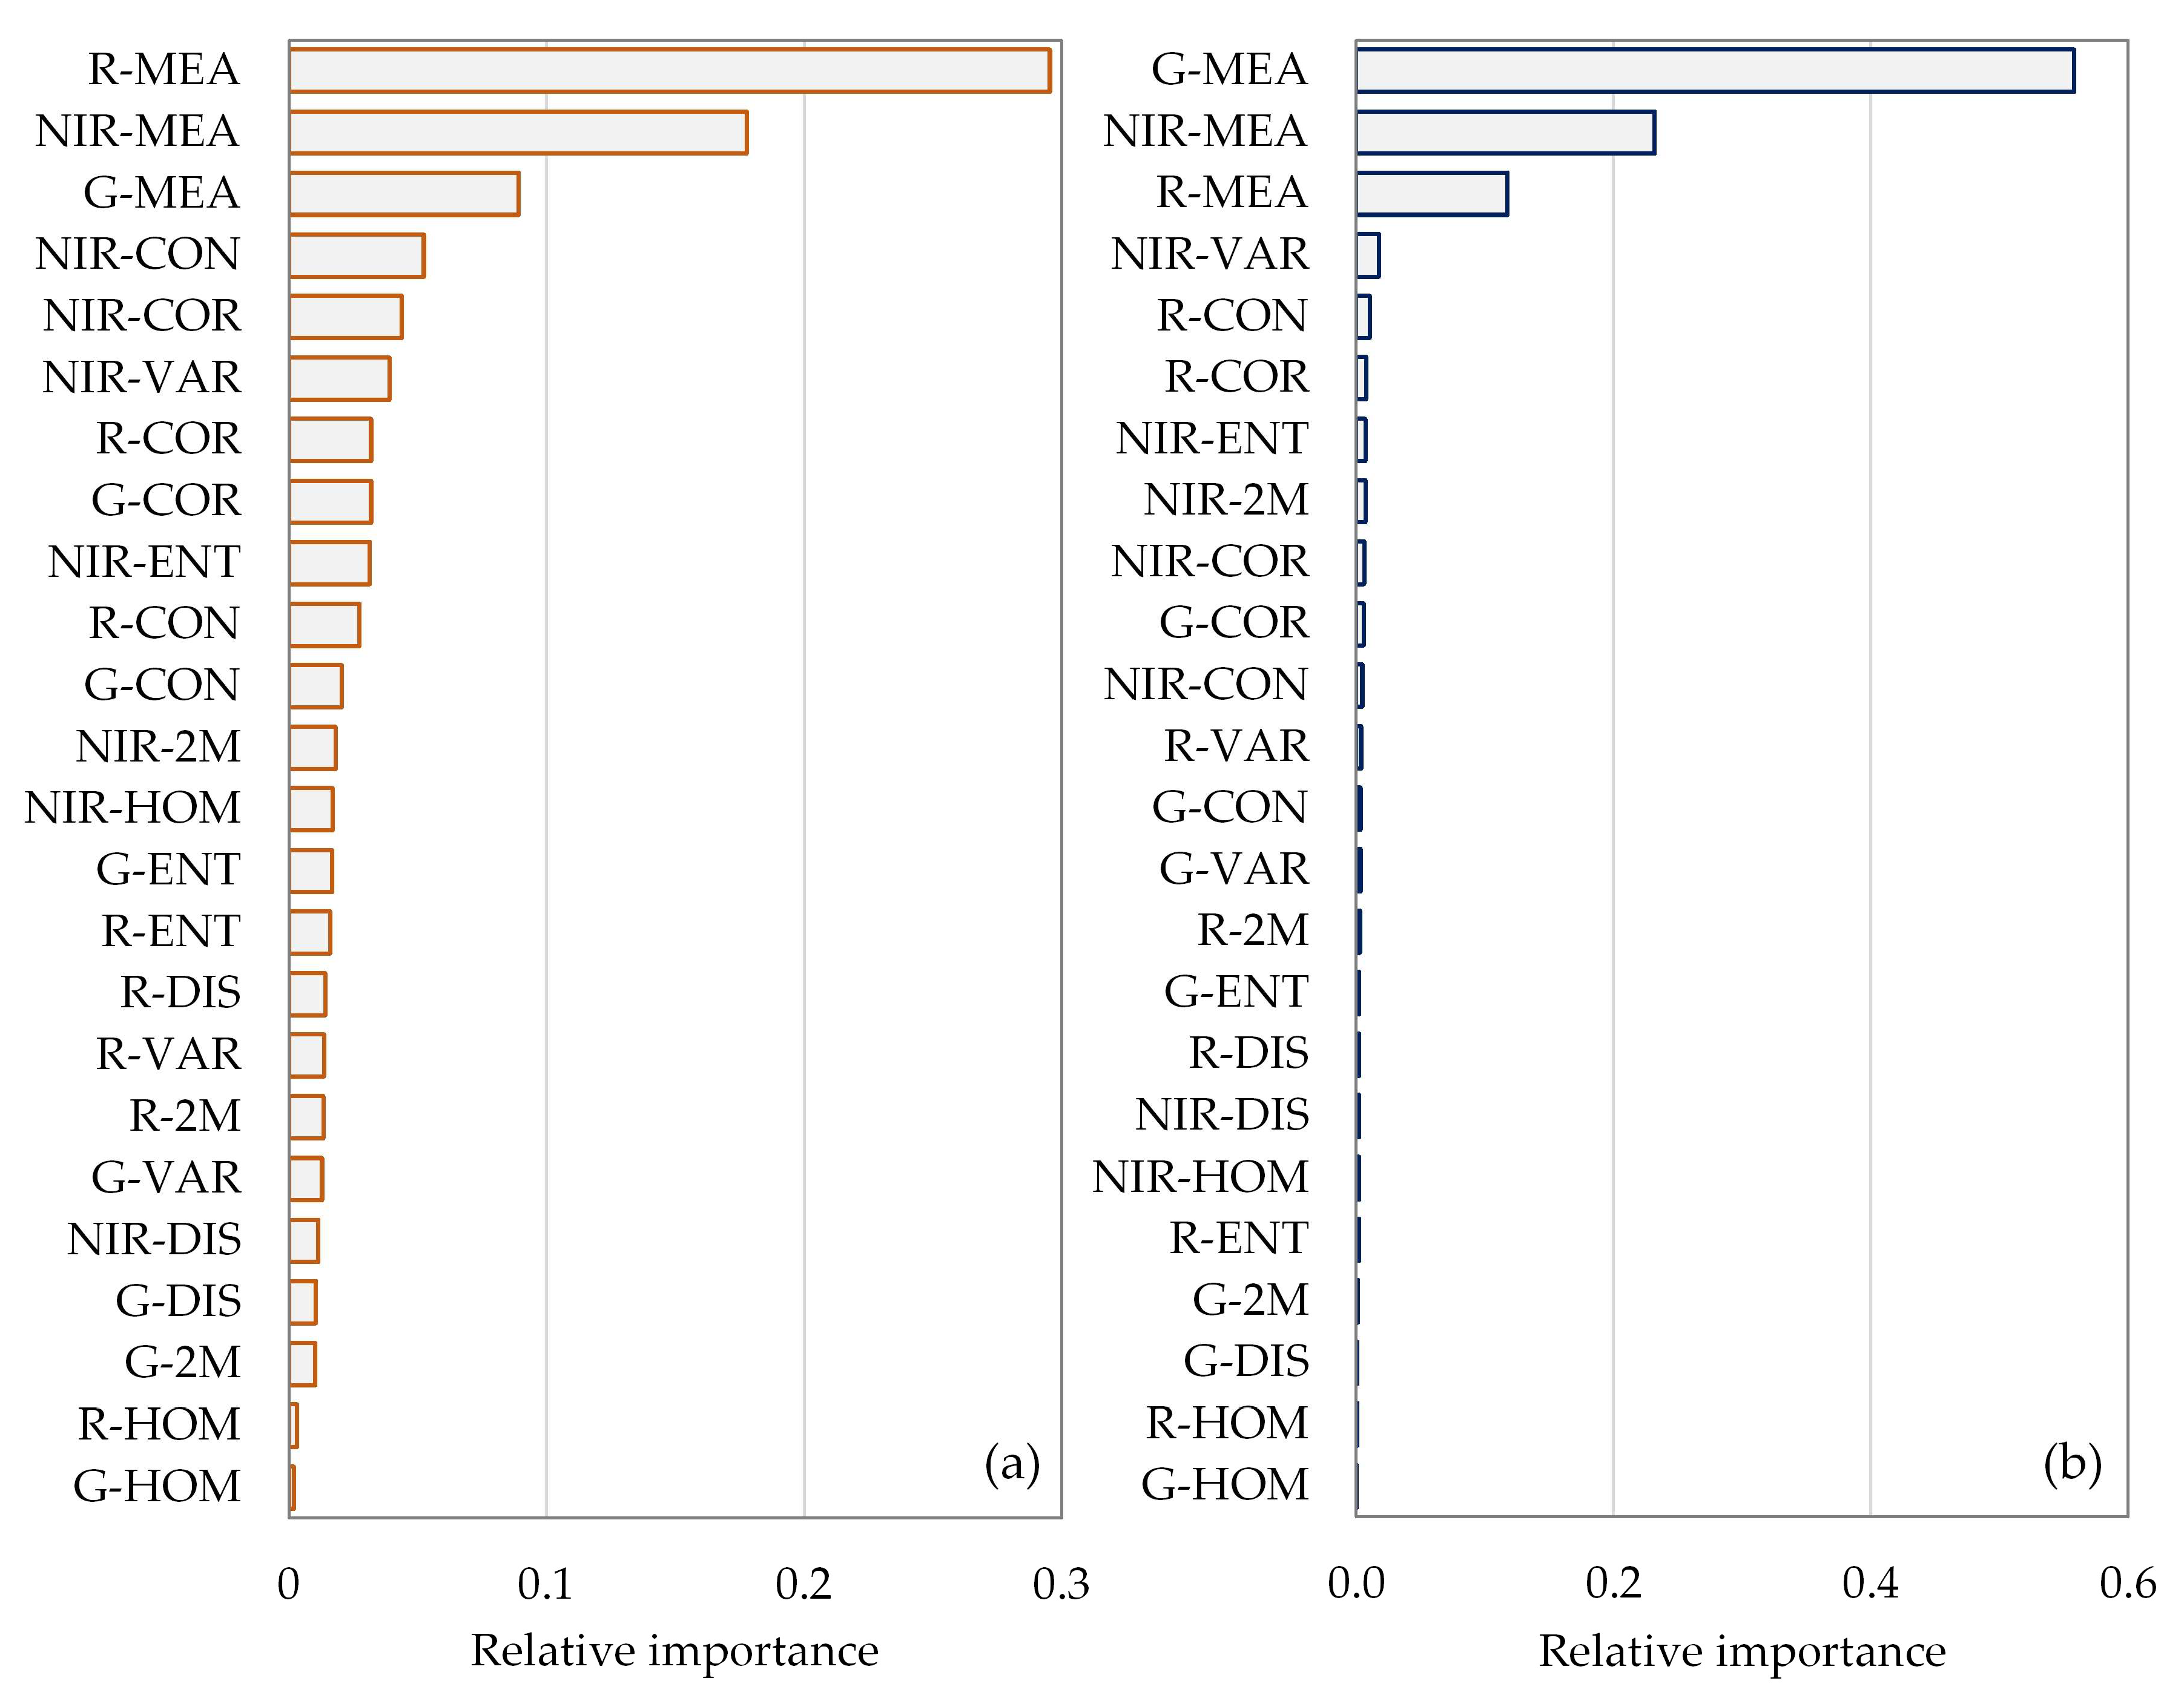
2.8.2. Feature Importance
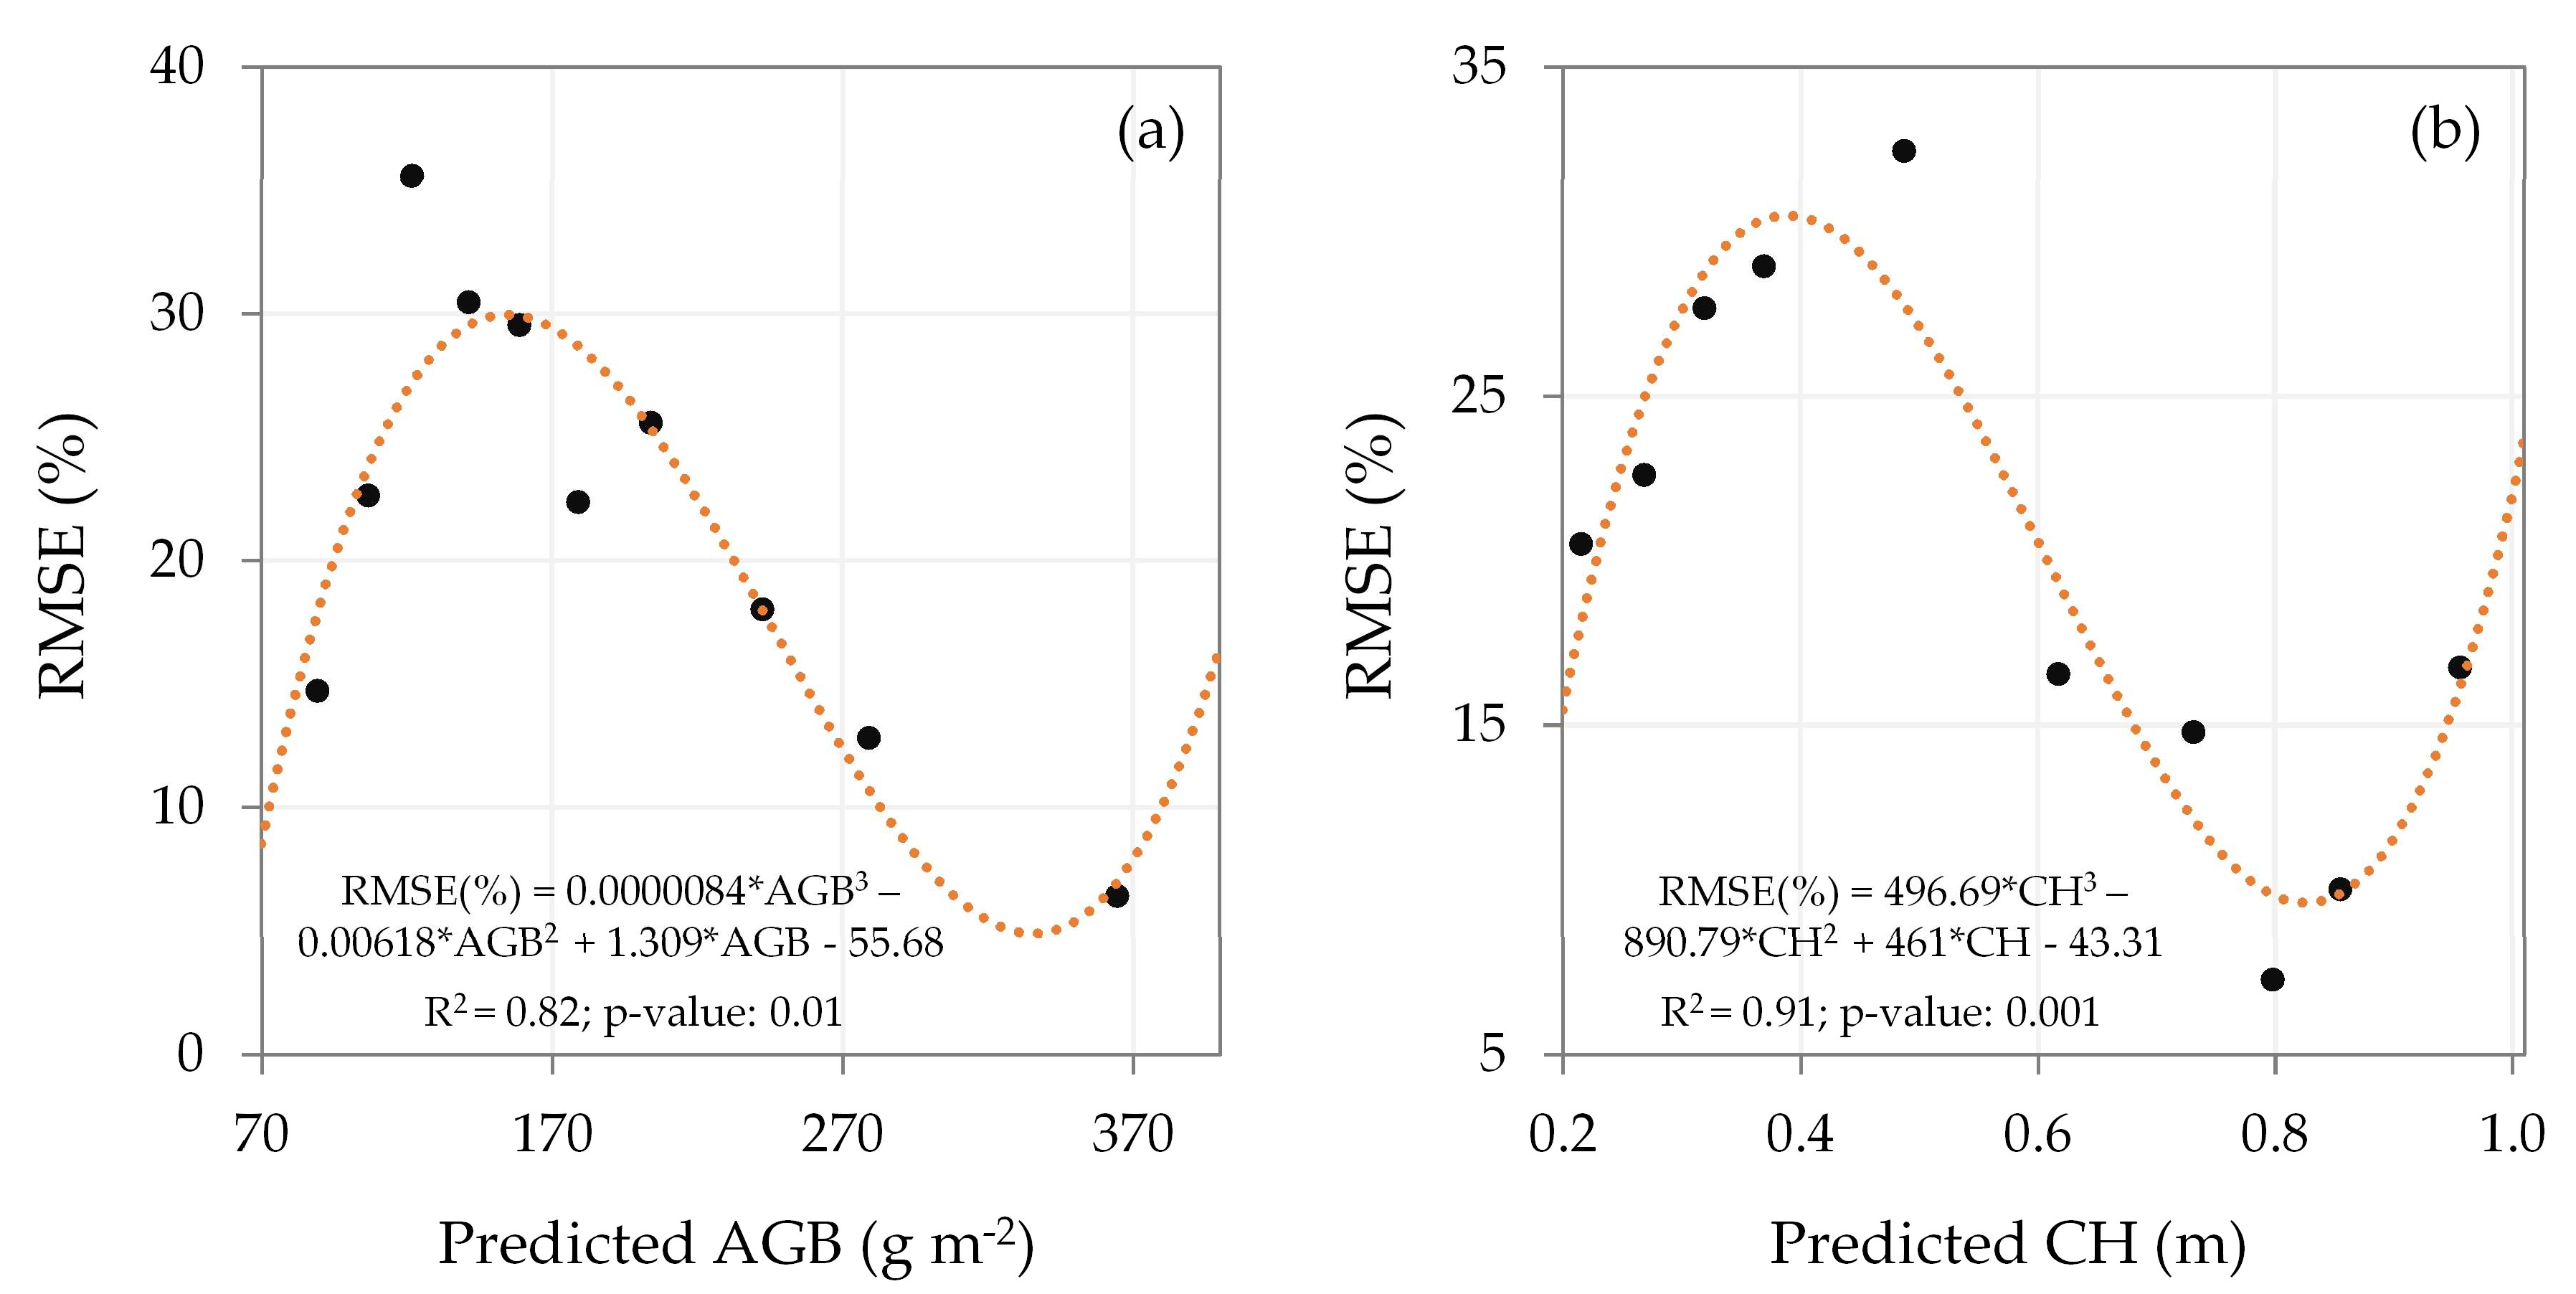
2.8.3. Accuracy Assessment and Uncertainty Analysis
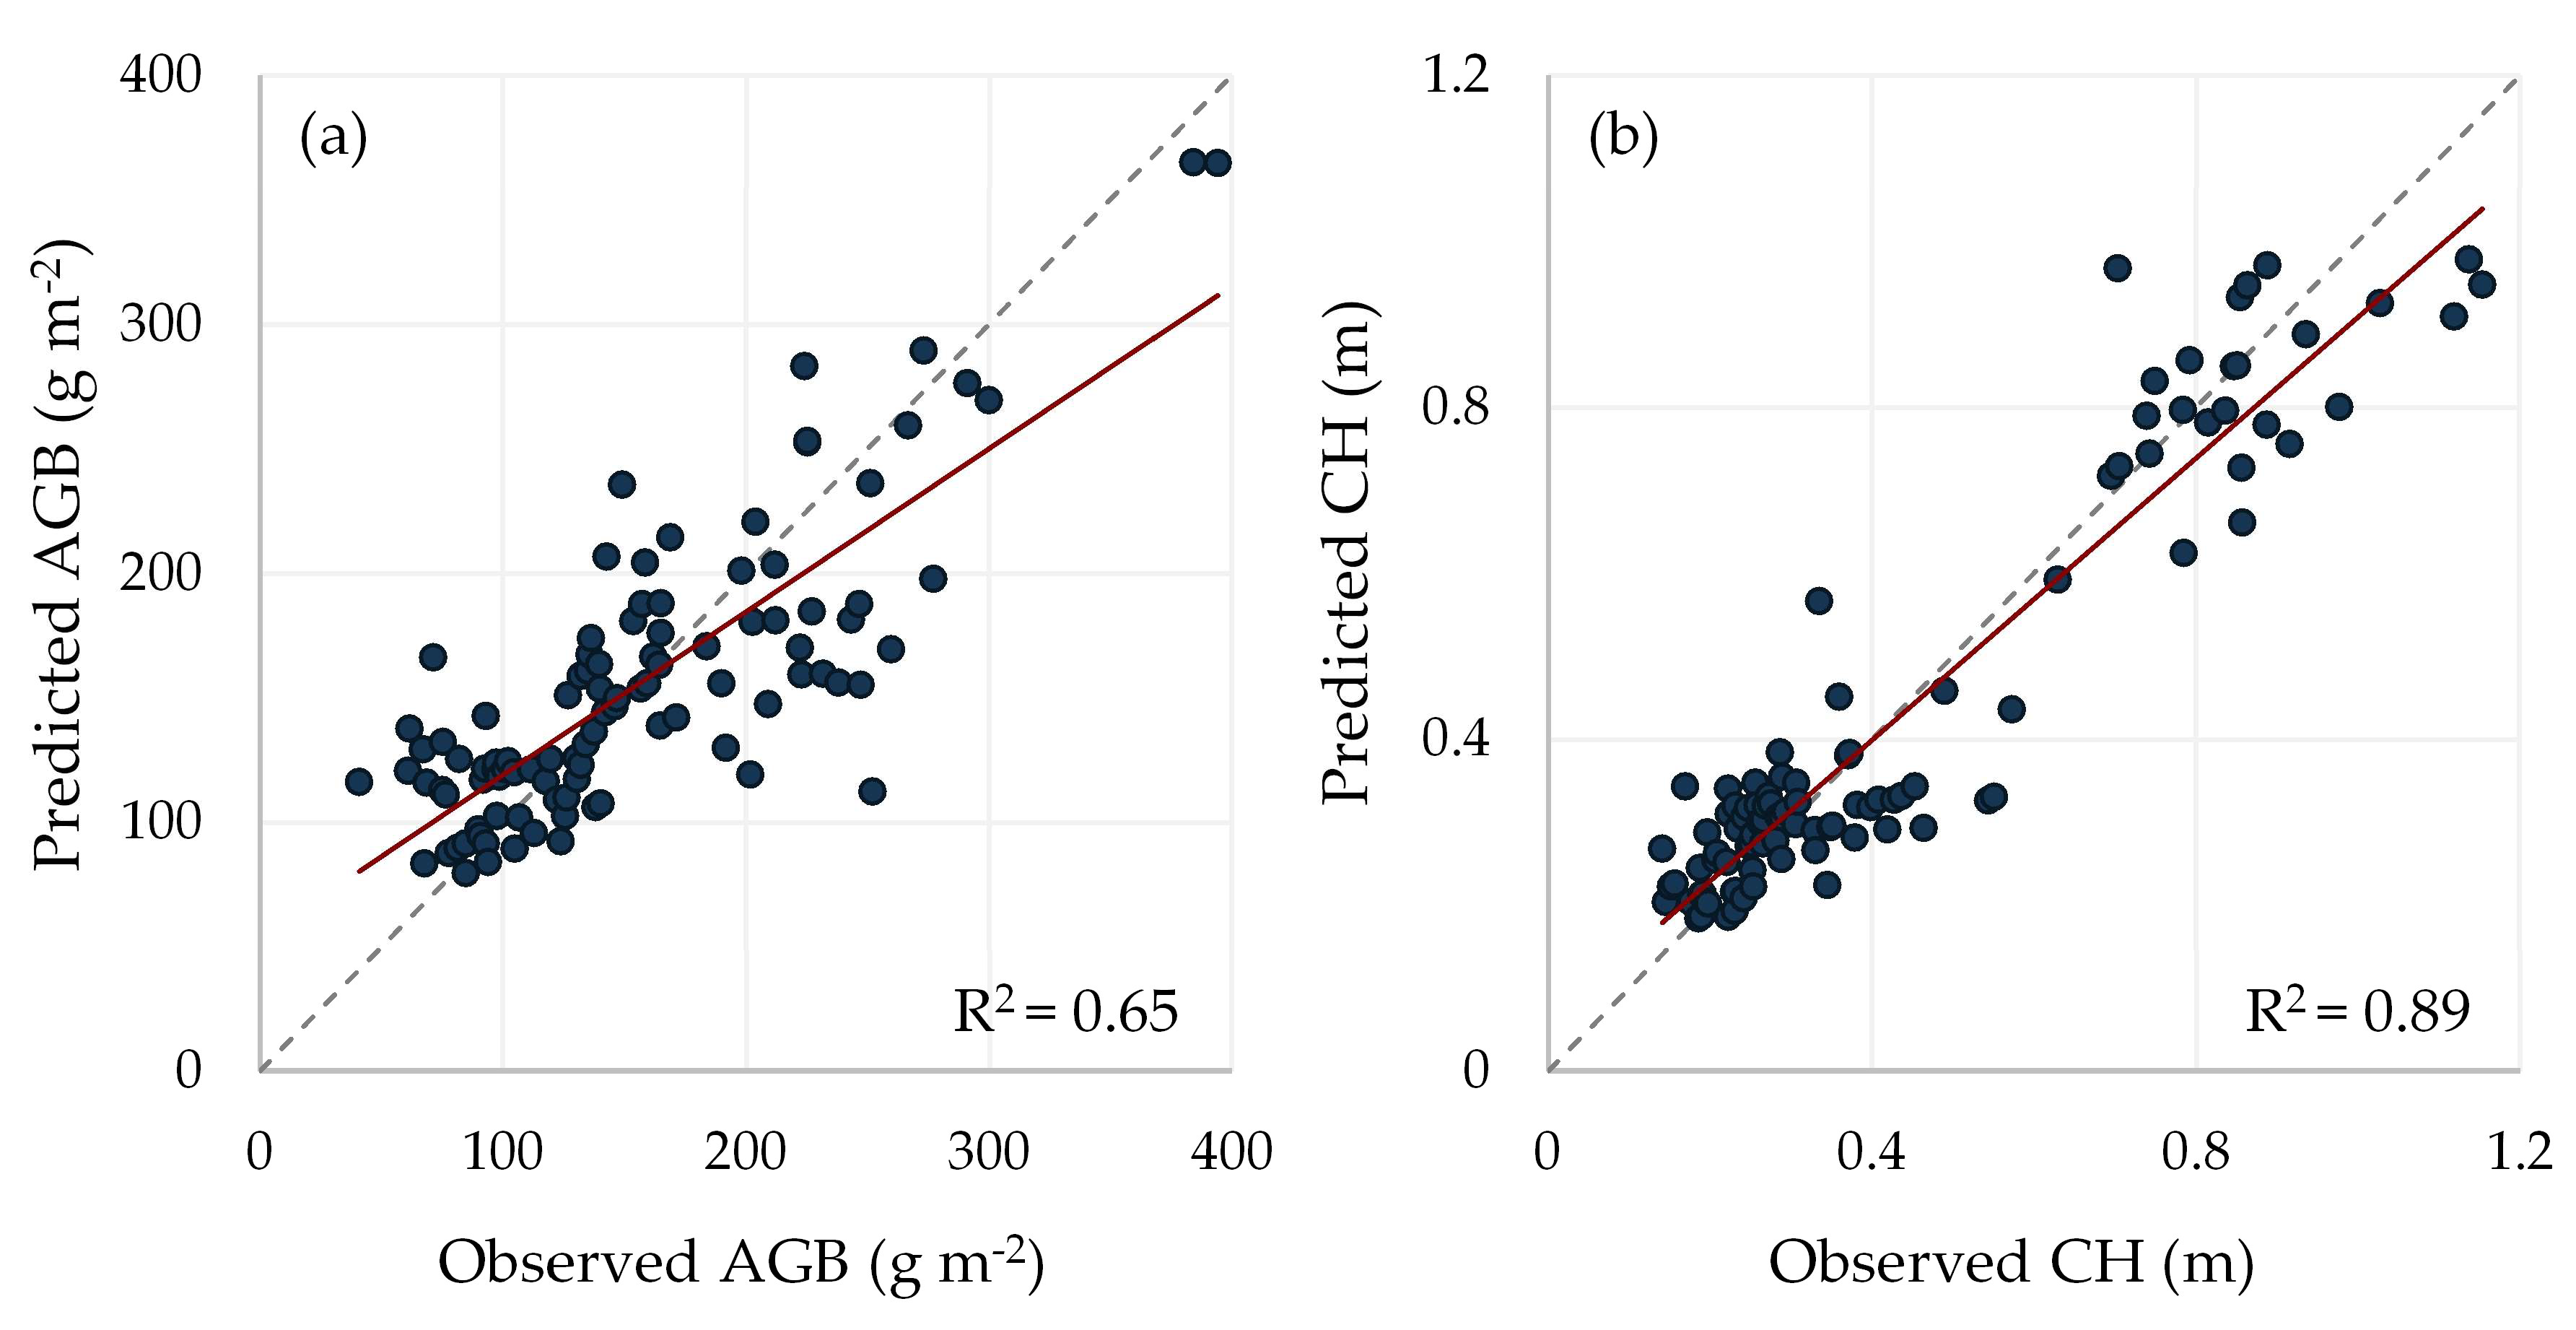
3. Results
4. Discussion
5. Conclusions
Author Contributions
Funding
Acknowledgments
Conflicts of Interest
References
- Nie, Z.; McLean, T.; Clough, A.; Tocker, J.; Christy, B.; Harris, R.; Riffkin, P.; Clark, S.; McCaskill, M. Benefits, challenges and opportunities of integrated crop-livestock systems and their potential application in the high rainfall zone of southern Australia: A review. Agric. Ecosyst. Environ. 2016, 235, 17–31. [Google Scholar] [CrossRef]
- Bell, L.W.; Moore, A.D. Integrated crop-livestock systems in Australian agriculture: Trends, drivers and implications. Agric. Syst. 2012, 111, 1–12. [Google Scholar] [CrossRef]
- Moraine, M.; Duru, M.; Therond, O. A social-ecological framework for analyzing and designing integrated crop–livestock systems from farm to territory levels. Renew. Agric. Food Syst. 2017, 32, 43–56. [Google Scholar] [CrossRef]
- Garrett, R.D.; Niles, M.T.; Gil, J.D.B.; Gaudin, A.; Chaplin-Kramer, R.; Assmann, A.; Assmann, T.S.; Brewer, K.; de Faccio Carvalho, P.C.; Cortner, O.; et al. Social and ecological analysis of commercial integrated crop livestock systems: Current knowledge and remaining uncertainty. Agric. Syst. 2017, 155, 136–146. [Google Scholar] [CrossRef]
- Poffenbarger, H.; Artz, G.; Dahlke, G.; Edwards, W.; Hanna, M.; Russell, J.; Sellers, H.; Liebman, M. An economic analysis of integrated crop-livestock systems in Iowa, U.S.A. Agric. Syst. 2017, 157, 51–69. [Google Scholar] [CrossRef]
- Cortner, O.; Garrett, R.D.; Valentim, J.F.; Ferreira, J.; Niles, M.T.; Reis, J.; Gil, J. Perceptions of integrated crop-livestock systems for sustainable intensification in the Brazilian Amazon. Land Use Policy 2019, 82, 841–853. [Google Scholar] [CrossRef]
- De Souza Filho, W.; de Albuquerque Nunes, P.A.; Barro, R.S.; Kunrath, T.R.; de Almeida, G.M.; Genro, T.C.M.; Bayer, C.; de Faccio Carvalho, P.C. Mitigation of enteric methane emissions through pasture management in integrated crop-livestock systems: Trade-offs between animal performance and environmental impacts. J. Clean. Prod. 2019, 213, 968–975. [Google Scholar] [CrossRef]
- Bieluczyk, W.; de Cássia Piccolo, M.; Pereira, M.G.; de Moraes, M.T.; Soltangheisi, A.; de Campos Bernardi, A.C.; Pezzopane, J.R.M.; Oliveira, P.P.A.; Moreira, M.Z.; de Camargo, P.B.; et al. Integrated farming systems influence soil organic matter dynamics in southeastern Brazil. Geoderma 2020, 371, 114368. [Google Scholar] [CrossRef]
- Alves, B.J.R.; Madari, B.E.; Boddey, R.M. Integrated crop–Livestock–Forestry systems: Prospects for a sustainable agricultural intensification. Nutr. Cycl. Agroecosystems 2017, 108, 1–4. [Google Scholar] [CrossRef]
- Andersson, K.; Trotter, M.; Robson, A.; Schneider, D.; Frizell, L.; Saint, A.; Lamb, D.; Blore, C. Estimating pasture biomass with active optical sensors. Adv. Anim. Biosci. 2017, 8, 754–757. [Google Scholar] [CrossRef]
- Legg, M.; Bradley, S. Ultrasonic Arrays for Remote Sensing of Pasture Biomass. Remote Sens. 2019, 11, 2459. [Google Scholar] [CrossRef]
- Punalekar, S.M.; Verhoef, A.; Quaife, T.L.; Humphries, D.; Bermingham, L.; Reynolds, C.K. Application of Sentinel-2A data for pasture biomass monitoring using a physically based radiative transfer model. Remote Sens. Environ. 2018, 218, 207–220. [Google Scholar] [CrossRef]
- Edirisinghe, A.; Hill, M.J.; Donald, G.E.; Hyder, M. Quantitative mapping of pasture biomass using satellite imagery. Int. J. Remote Sens. 2011, 32, 2699–2724. [Google Scholar] [CrossRef]
- Pullanagari, R.; Kereszturi, G.; Yule, I. Integrating airborne hyperspectral, topographic, and soil data for estimating pasture quality using recursive feature elimination with random forest regression. Remote Sens. 2018, 10, 1117. [Google Scholar] [CrossRef]
- Wang, J.; Xiao, X.; Bajgain, R.; Starks, P.; Steiner, J.; Doughty, R.B.; Chang, Q. Estimating leaf area index and aboveground biomass of grazing pastures using Sentinel-1, Sentinel-2 and Landsat images. ISPRS J. Photogramm. Remote Sens. 2019, 154, 189–201. [Google Scholar] [CrossRef]
- Smith, R.C.G.; Adams, M.; Gittins, S.; Gherardi, S.; Wood, D.; Maier, S.; Stovold, R.; Donald, G.; Khohkar, S.; Allen, A. Near real-time Feed On Offer (FOO) from MODIS for early season grazing management of Mediterranean annual pastures. Int. J. Remote Sens. 2011, 32, 4445–4460. [Google Scholar] [CrossRef]
- Veloso, G.A.; Ferreira, M.E.; Ferreira Júnior, L.G.; Barbosa da Silva, B. Modelling gross primary productivity in tropical savanna pasturelands for livestock intensification in Brazil. Remote Sens. Appl. Soc. Environ. 2020, 17, 100288. [Google Scholar] [CrossRef]
- Otgonbayar, M.; Atzberger, C.; Chambers, J.; Damdinsuren, A. Mapping pasture biomass in mongolia using partial least squares, random forest regression and landsat 8 imagery. Int. J. Remote Sens. 2018, 1161, 3204–3226. [Google Scholar] [CrossRef]
- Parente, L.; Ferreira, L.; Faria, A.; Nogueira, S.; Araújo, F.; Teixeira, L.; Hagen, S. Monitoring the brazilian pasturelands: A new mapping approach based on the landsat 8 spectral and temporal domains. Int. J. Appl. Earth Obs. Geoinf. 2017, 62, 135–143. [Google Scholar] [CrossRef]
- Jakimow, B.; Griffiths, P.; van der Linden, S.; Hostert, P. Mapping pasture management in the Brazilian Amazon from dense Landsat time series. Remote Sens. Environ. 2018, 205, 453–468. [Google Scholar] [CrossRef]
- Planet Imagery Product Specifications. Available online: https://assets.planet.com/docs/Planet_Combined_Imagery_Product_Specs_letter_screen.pdf (accessed on 10 May 2020).
- Eckert, S. Improved forest biomass and carbon estimations using texture measures from worldView-2 satellite data. Remote Sens. 2012, 4, 810–829. [Google Scholar] [CrossRef]
- Wood, E.M.; Pidgeon, A.M.; Radeloff, V.C.; Keuler, N.S. Image texture as a remotely sensed measure of vegetation structure. Remote Sens. Environ. 2012, 121, 516–526. [Google Scholar] [CrossRef]
- Nichol, J.E.; Sarker, M.L.R. Improved Biomass Estimation Using the Texture Parameters of Two High-Resolution Optical Sensors. IEEE Trans. Geosci. Remote Sens. 2011, 49, 930–948. [Google Scholar] [CrossRef]
- Holloway, J.; Mengersen, K. Statistical machine learning methods and remote sensing for sustainable development goals: A review. Remote Sens. 2018, 10, 1365. [Google Scholar] [CrossRef]
- Weiss, M.; Jacob, F.; Duveiller, G. Remote sensing for agricultural applications: A meta-review. Remote Sens. Environ. 2020, 236, 111402. [Google Scholar] [CrossRef]
- Parente, L.; Mesquita, V.; Miziara, F.; Baumann, L.; Ferreira, L. Assessing the pasturelands and livestock dynamics in Brazil, from 1985 to 2017: A novel approach based on high spatial resolution imagery and Google Earth Engine cloud computing. Remote Sens. Environ. 2019, 232, 111301. [Google Scholar] [CrossRef]
- Liu, H.; Dahlgren, R.A.; Larsen, R.E.; Devine, S.M.; Roche, L.M.; Geen, A.T.O.; Wong, A.J.Y.; Covello, S.; Jin, Y. Estimating rangeland forage production using remote sensing data from a small unmanned aerial system (sUAS) and planetscope satellite. Remote Sens. 2019, 11, 595. [Google Scholar] [CrossRef]
- Chen, T.; Guestrin, C. XGBoost: A scalable tree boosting system. In Proceedings of the 22nd Acm Sigkdd International Conference on Knowledge Discovery and Data Mining, New York, NY, USA, 13–17 August 2016; pp. 785–794. [Google Scholar]
- Zhang, H.; Eziz, A.; Xiao, J.; Tao, S.; Wang, S.; Tang, Z.; Zhu, J.; Fang, J. High-resolution vegetation mapping using eXtreme gradient boosting based on extensive features. Remote Sens. 2019, 11, 1505. [Google Scholar] [CrossRef]
- Pham, T.D.; Le, N.N.; Ha, N.T.; Nguyen, L.V.; Xia, J.; Yokoya, N.; To, T.T.; Trinh, H.X.; Kieu, L.Q.; Takeuchi, W. Estimating Mangrove Above-Ground Biomass Using Extreme Gradient Boosting Decision Trees Algorithm with Fused Sentinel-2 and ALOS-2 PALSAR-2 Data in Can Gio Biosphere Reserve, Vietnam. Remote Sens. 2020, 12, 777. [Google Scholar] [CrossRef]
- Zhong, L.; Hu, L.; Zhou, H. Deep learning based multi-temporal crop classification. Remote Sens. Environ. 2019, 221, 430–443. [Google Scholar] [CrossRef]
- De Souza Rolim, G.; de O. Aparecido, L.E. Camargo, Köppen and Thornthwaite climate classification systems in defining climatical regions of the state of São Paulo, Brazil. Int. J. Climatol. 2016, 36, 636–643. [Google Scholar] [CrossRef]
- Alvares, C.A.; Stape, J.L.; Sentelhas, P.C.; de Moraes Gonçalves, J.L.; Sparovek, G. Köppen’s climate classification map for Brazil. Meteorol. Zeitschrift 2013, 22, 711–728. [Google Scholar] [CrossRef]
- Da Silva, S.; Sbrissia, A.; Pereira, L. Ecophysiology of C4 Forage Grasses—Understanding Plant Growth for Optimising Their Use and Management. Agriculture 2015, 5, 598–625. [Google Scholar] [CrossRef]
- Copernicus Climate Change Service. ERA5: Fifth Generation of ECMWF Atmospheric Reanalyses of the Global Climate. Available online: https://cds.climate.copernicus.eu/cdsapp#!/home (accessed on 27 May 2020).
- Pimentel-Gomes, F. Curso de Estatística Experimental; FEALQ: Piracicaba, Brazil, 2009; Volume 15, ISBN 9788571330559. [Google Scholar]
- Planet Surface Reflectance Version 2.0. Available online: https://assets.planet.com/marketing/PDF/Planet_Surface_Reflectance_Technical_White_Paper.pdf (accessed on 10 May 2020).
- Kaufman, Y.J.; Tanre, D. Atmospherically resistant vegetation index (ARVI) for EOS-MODIS. IEEE Trans. Geosci. Remote Sens. 1992, 30, 261–270. [Google Scholar] [CrossRef]
- Tucker, C.J. Red and photographic infrared linear combinations for monitoring vegetation. Remote Sens. Environ. 1979, 8, 127–150. [Google Scholar] [CrossRef]
- Huete, A.; Didan, K.; Miura, T.; Rodriguez, E.; Gao, X.; Ferreira, L. Overview of the radiometric and biophysical performance of the MODIS vegetation indices. Remote Sens. Environ. 2002, 83, 195–213. [Google Scholar] [CrossRef]
- Jiang, Z.; Huete, A.; Didan, K.; Miura, T. Development of a two-band enhanced vegetation index without a blue band. Remote Sens. Environ. 2008, 112, 3833–3845. [Google Scholar] [CrossRef]
- Mao, W.; Wang, Y.; Wang, Y. Real-time Detection of Between-row Weeds Using Machine Vision. In Proceedings of the 2003 American Society of Agricultural and Biological Engineers Annual Meeting, Las Vegas, NV, USA, 27–30 July 2003; p. 031004. [Google Scholar]
- Woebbecke, D.M.; Meyer, G.E.; Von Bargen, K.; Mortensen, D.A. Color Indices for Weed Identification Under Various Soil, Residue, and Lighting Conditions. Trans. ASAE 1995, 38, 259–269. [Google Scholar] [CrossRef]
- Neto, J.C. A combined statistical-soft computing approach for classification and mapping weed species in minimum -tillage systems. Ph.D. Thesis, University of Nebraska – Lincoln, Lincoln, NE, USA, August 2004. [Google Scholar]
- Meyer, G.E.; Neto, J.C. Verification of color vegetation indices for automated crop imaging applications. Comput. Electron. Agric. 2008, 63, 282–293. [Google Scholar] [CrossRef]
- Louhaichi, M.; Borman, M.M.; Johnson, D.E. Spatially Located Platform and Aerial Photography for Documentation of Grazing Impacts on Wheat. Geocarto Int. 2001, 16, 65–70. [Google Scholar] [CrossRef]
- Kanemasu, E.T. Seasonal canopy reflectance patterns of wheat, sorghum, and soybean. Remote Sens. Environ. 1974, 3, 43–47. [Google Scholar] [CrossRef]
- Crippen, R. Calculating the vegetation index faster. Remote Sens. Environ. 1990, 34, 71–73. [Google Scholar] [CrossRef]
- Qi, J.; Chehbouni, A.; Huete, A.R.; Kerr, Y.H.; Sorooshian, S. A modified soil adjusted vegetation index. Remote Sens. Environ. 1994, 48, 119–126. [Google Scholar] [CrossRef]
- Rouse, J.; Haas, R.; Schell, J.; Deering, D.; Harlan, J. Monitoring vegetation systems in the Great Plains with ERTS. In Proceedings of the Third Earth Resources Technology Satellite-1 Symposium, Washington, DC, USA, 10–14 December 1973; pp. 309–317. [Google Scholar]
- Rondeaux, G.; Steven, M.; Baret, F. Optimization of soil-adjusted vegetation indices. Remote Sens. Environ. 1996, 55, 95–107. [Google Scholar] [CrossRef]
- Bendig, J.; Yu, K.; Aasen, H.; Bolten, A.; Bennertz, S.; Broscheit, J.; Gnyp, M.L.; Bareth, G. Combining UAV-based plant height from crop surface models, visible, and near infrared vegetation indices for biomass monitoring in barley. Int. J. Appl. Earth Obs. Geoinf. 2015, 39, 79–87. [Google Scholar] [CrossRef]
- Richardson, A.J.; Wiegand, C.L. Distinguishing vegetation from soil background information. Photogramm. Eng. Remote Sensing 1977, 43, 1541–1552. [Google Scholar]
- Huete, A. A soil-adjusted vegetation index (SAVI). Remote Sens. Environ. 1988, 25, 295–309. [Google Scholar] [CrossRef]
- Jordan, C.F. Derivation of Leaf-Area Index from Quality of Light on the Forest Floor. Ecology 1969, 50, 663–666. [Google Scholar] [CrossRef]
- Gitelson, A.A.; Kaufman, Y.J.; Stark, R.; Rundquist, D. Novel algorithms for remote estimation of vegetation fraction. Remote Sens. Environ. 2002, 80, 76–87. [Google Scholar] [CrossRef]
- Haralick, R.M.; Shanmugam, K.; Dinstein, I. Textural Features for Image Classification. IEEE Trans. Syst. Man. Cybern. 1973, SMC-3, 610–621. [Google Scholar] [CrossRef]
- Jensen, J.R. Remote Sensing of the Environment: An Earth Resource Perspective, 2nd ed.; Prentice Hall: Upper Saddle River, NJ, USA, 2007; ISBN 978-0131889507. [Google Scholar]
- Bischl, B.; Lang, M.; Kotthoff, L.; Schiffner, J.; Richter, J.; Studerus, E.; Casalicchio, G.; Jones, Z.M. Mlr: Machine learning in R. J. Mach. Learn. Res. 2016, 17, 1–5. [Google Scholar]
- Pham, T.D.; Yokoya, N.; Xia, J.; Ha, N.T.; Le, N.N.; Nguyen, T.T.T.; Dao, T.H.; Vu, T.T.P.; Pham, T.D.; Takeuchi, W. Comparison of Machine Learning Methods for Estimating Mangrove Above-Ground Biomass Using Multiple Source Remote Sensing Data in the Red River Delta Biosphere Reserve, Vietnam. Remote Sens. 2020, 12, 1334. [Google Scholar] [CrossRef]
- Fan, J.; Wang, X.; Wu, L.; Zhou, H.; Zhang, F.; Yu, X.; Lu, X.; Xiang, Y. Comparison of Support Vector Machine and Extreme Gradient Boosting for predicting daily global solar radiation using temperature and precipitation in humid subtropical climates: A case study in China. Energy Convers. Manag. 2018, 164, 102–111. [Google Scholar] [CrossRef]
- Li, Y.; Li, C.; Li, M.; Liu, Z. Influence of variable selection and forest type on forest aboveground biomass estimation using machine learning algorithms. Forests 2019, 10, 1073. [Google Scholar] [CrossRef]
- Breiman, L. Random Forests. Mach. Learn. 2001, 45, 5–32. [Google Scholar] [CrossRef]
- Bergstra, J.; Bengio, Y. Random search for hyper-parameter optimization. J. Mach. Learn. Res. 2012, 13, 281–305. [Google Scholar]
- Chandrashekar, G.; Sahin, F. A survey on feature selection methods. Comput. Electr. Eng. 2014, 40, 16–28. [Google Scholar] [CrossRef]
- Kononenko, I.; Robnik-Šikonja, M.; Pompe, U. ReliefF for estimation and discretization of attributes in classification, regression, and ILP problems. Artif. Intell. Methodol. Syst. Appl. 1996, 18, 1–15. [Google Scholar]
- Csillik, O.; Kumar, P.; Asner, G.P. Challenges in Estimating Tropical Forest Canopy Height from Planet Dove Imagery. Remote Sens. 2020, 12, 1160. [Google Scholar] [CrossRef]
- Csillik, O.; Kumar, P.; Mascaro, J.; O’Shea, T.; Asner, G.P. Monitoring tropical forest carbon stocks and emissions using Planet satellite data. Sci. Rep. 2019, 9, 1–12. [Google Scholar] [CrossRef]
- Solórzano, J.V. Contrasting the potential of Fourier transformed ordination and gray level co-occurrence matrix textures to model a tropical swamp forest’s structural and diversity attributes. J. Appl. Remote Sens. 2018, 12, 1. [Google Scholar] [CrossRef]
- Sarker, L.R.; Nichol, J.E. Improved forest biomass estimates using ALOS AVNIR-2 texture indices. Remote Sens. Environ. 2011, 115, 968–977. [Google Scholar] [CrossRef]
- Ozdemir, I.; Karnieli, A. Predicting forest structural parameters using the image texture derived from worldview-2 multispectral imagery in a dryland forest, Israel. Int. J. Appl. Earth Obs. Geoinf. 2011, 13, 701–710. [Google Scholar] [CrossRef]
- Kayitakire, F.; Hamel, C.; Defourny, P. Retrieving forest structure variables based on image texture analysis and IKONOS-2 imagery. Remote Sens. Environ. 2006, 102, 390–401. [Google Scholar] [CrossRef]
- Yuan, W.; Wijewardane, N.K.; Jenkins, S.; Bai, G.; Ge, Y.; Graef, G.L. Early Prediction of Soybean Traits through Color and Texture Features of Canopy RGB Imagery. Sci. Rep. 2019, 9, 14089. [Google Scholar] [CrossRef]
- Li, S.; Yuan, F.; Ata-UI-Karim, S.T.; Zheng, H.; Cheng, T.; Liu, X.; Tian, Y.; Zhu, Y.; Cao, W.; Cao, Q. Combining Color Indices and Textures of UAV-Based Digital Imagery for Rice LAI Estimation. Remote Sens. 2019, 11, 1763. [Google Scholar] [CrossRef]
- Zheng, H.; Cheng, T.; Zhou, M.; Li, D.; Yao, X.; Tian, Y.; Cao, W.; Zhu, Y. Improved estimation of rice aboveground biomass combining textural and spectral analysis of UAV imagery. Precis. Agric. 2019, 20, 611–629. [Google Scholar] [CrossRef]
- Goel, N.S. Models of vegetation canopy reflectance and their use in estimation of biophysical parameters from reflectance data. Remote Sens. Rev. 1988, 4, 1–212. [Google Scholar] [CrossRef]
- Helman, D.; Bahat, I.; Netzer, Y.; Ben-Gal, A.; Alchanatis, V.; Peeters, A.; Cohen, Y. Using Time Series of High-Resolution Planet Satellite images to monitor grapevine stem water potential in commercial vineyards. Remote Sens. 2018, 10, 1615. [Google Scholar] [CrossRef]
- Miller, G.J.; Morris, J.T.; Wang, C. Estimating aboveground biomass and its spatial distribution in coastal wetlands utilizing planet multispectral imagery. Remote Sens. 2019, 11, 2020. [Google Scholar] [CrossRef]
- Zhang, B.; Zhang, L.; Xie, D.; Yin, X.; Liu, C.; Liu, G. Application of synthetic NDVI time series blended from landsat and MODIS data for grassland biomass estimation. Remote Sens. 2016, 8, 10. [Google Scholar] [CrossRef]
- Houborg, R.; McCabe, M.F. A cubesat enabled spatio-temporal enhancement method (cestem) utilizing planet, landsat and MODIS data. Remote Sens. Environ. 2018, 209, 211–226. [Google Scholar] [CrossRef]

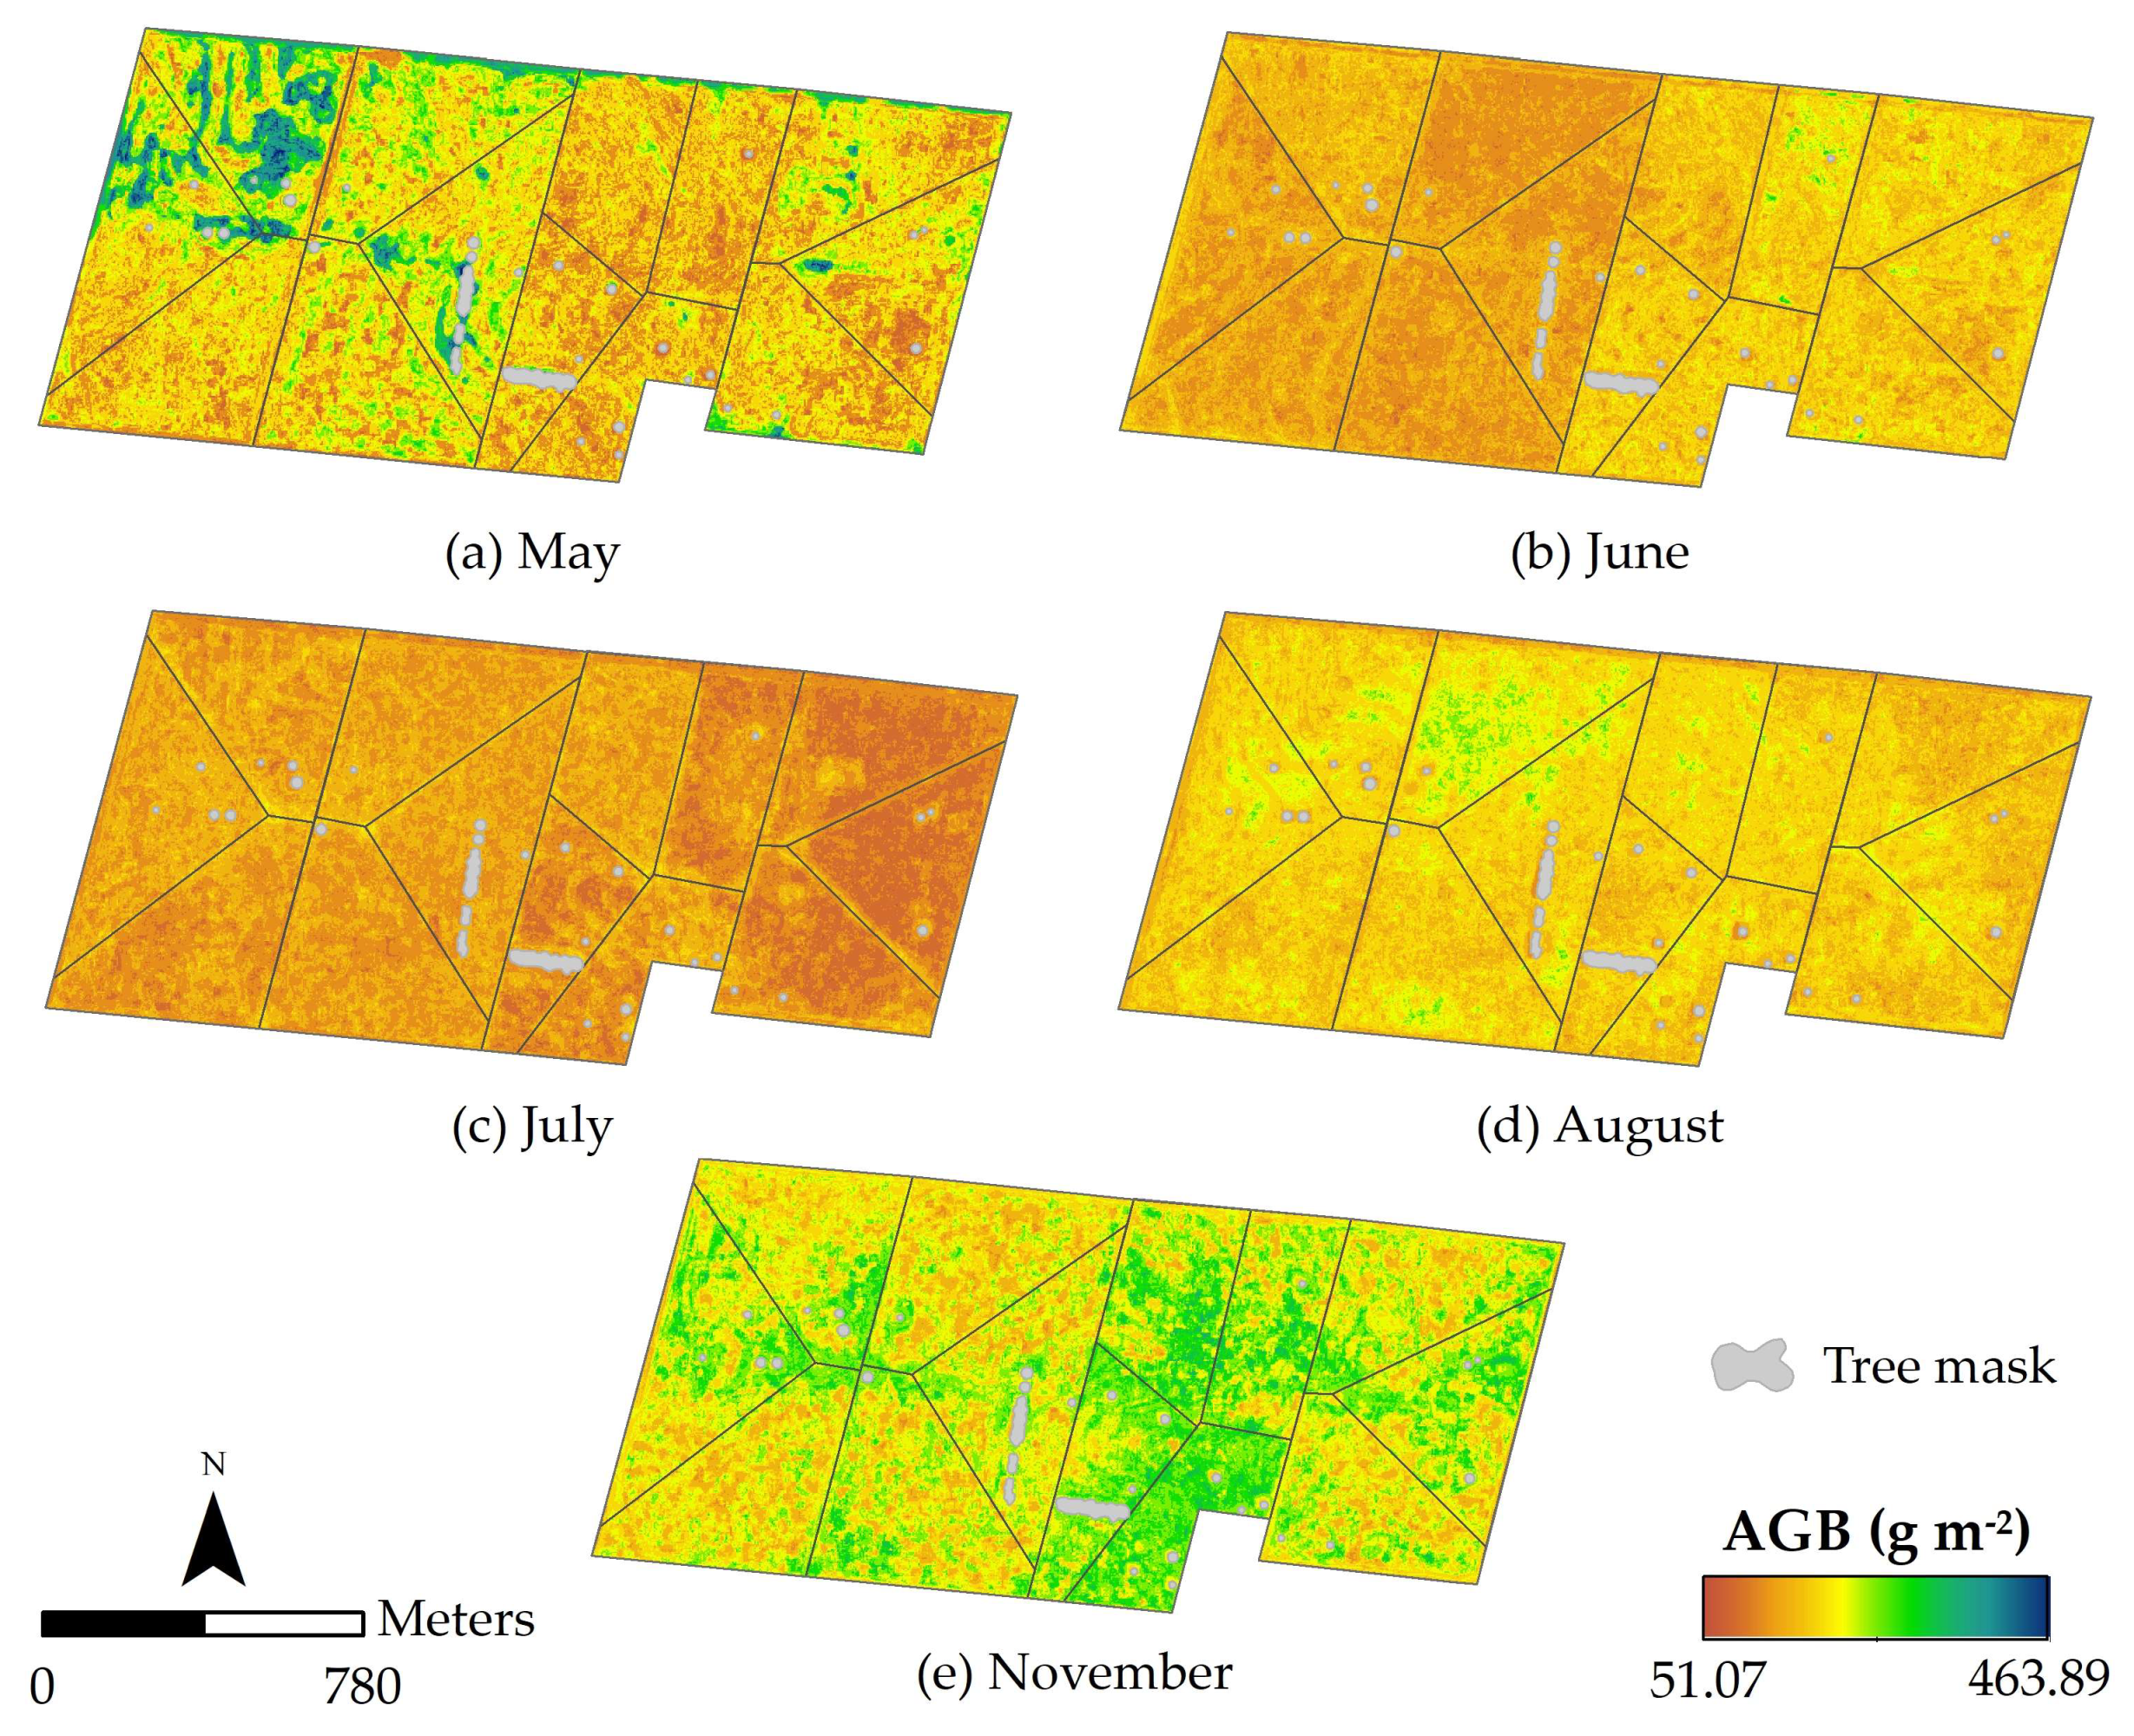
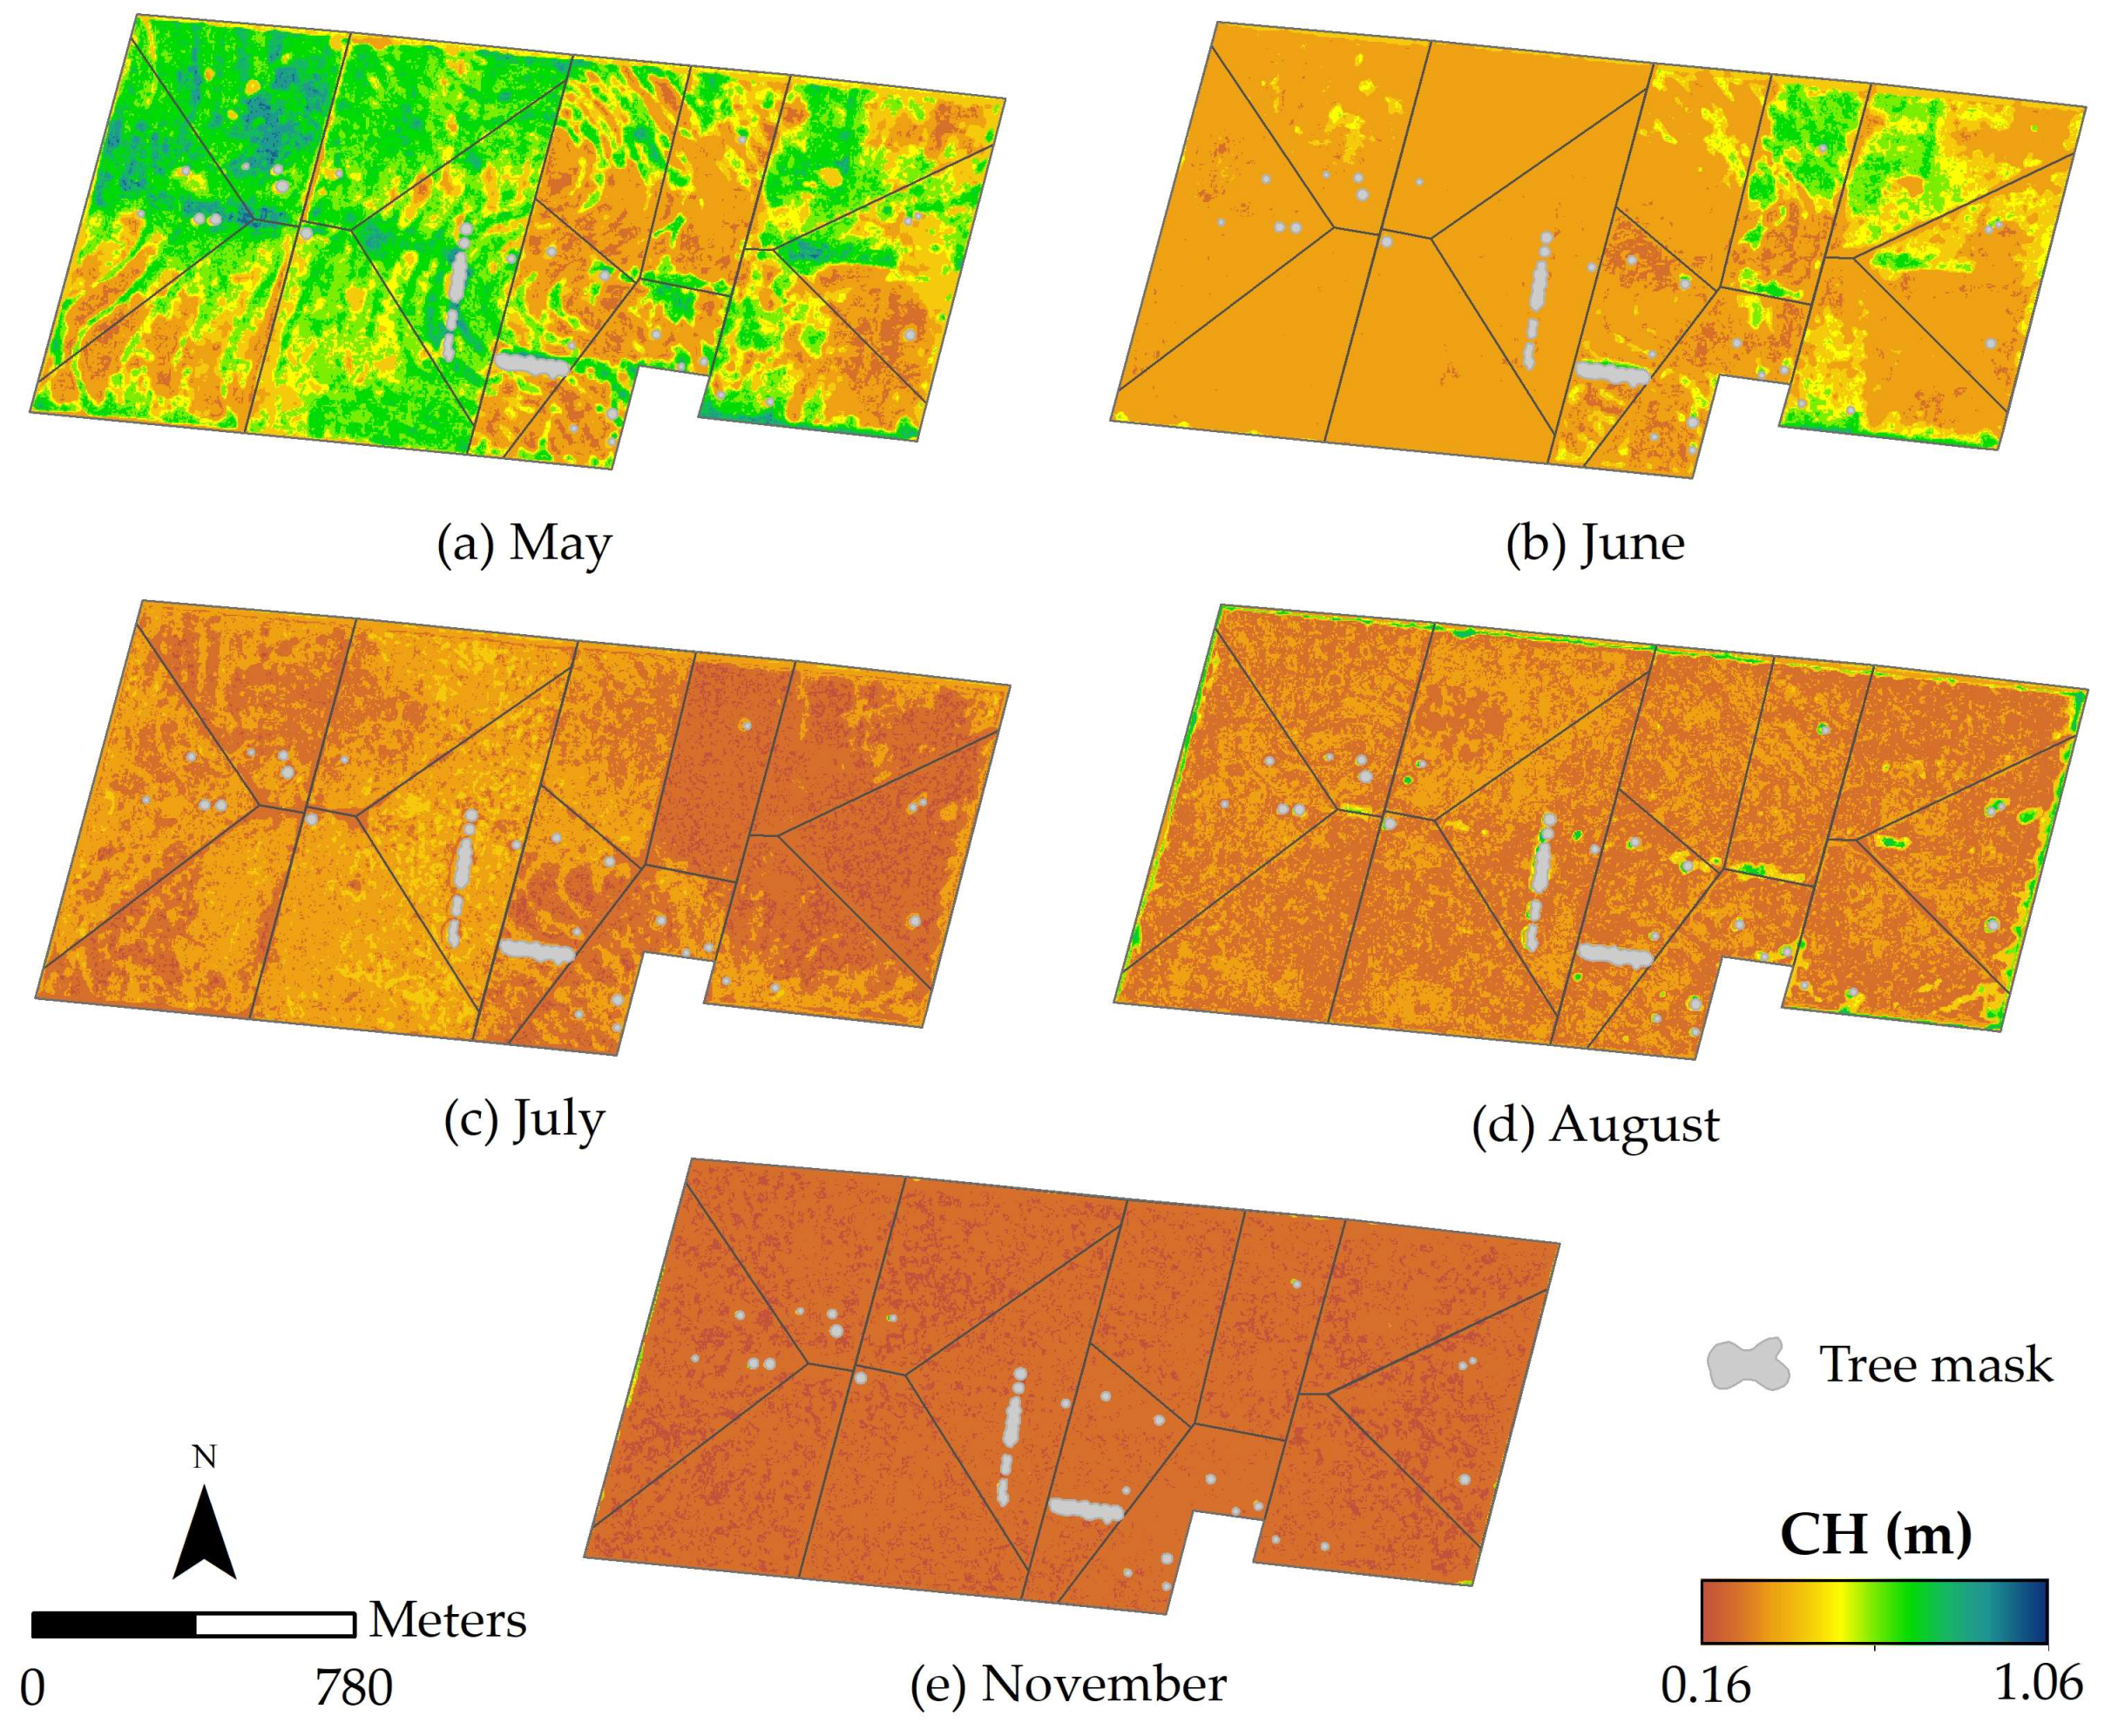
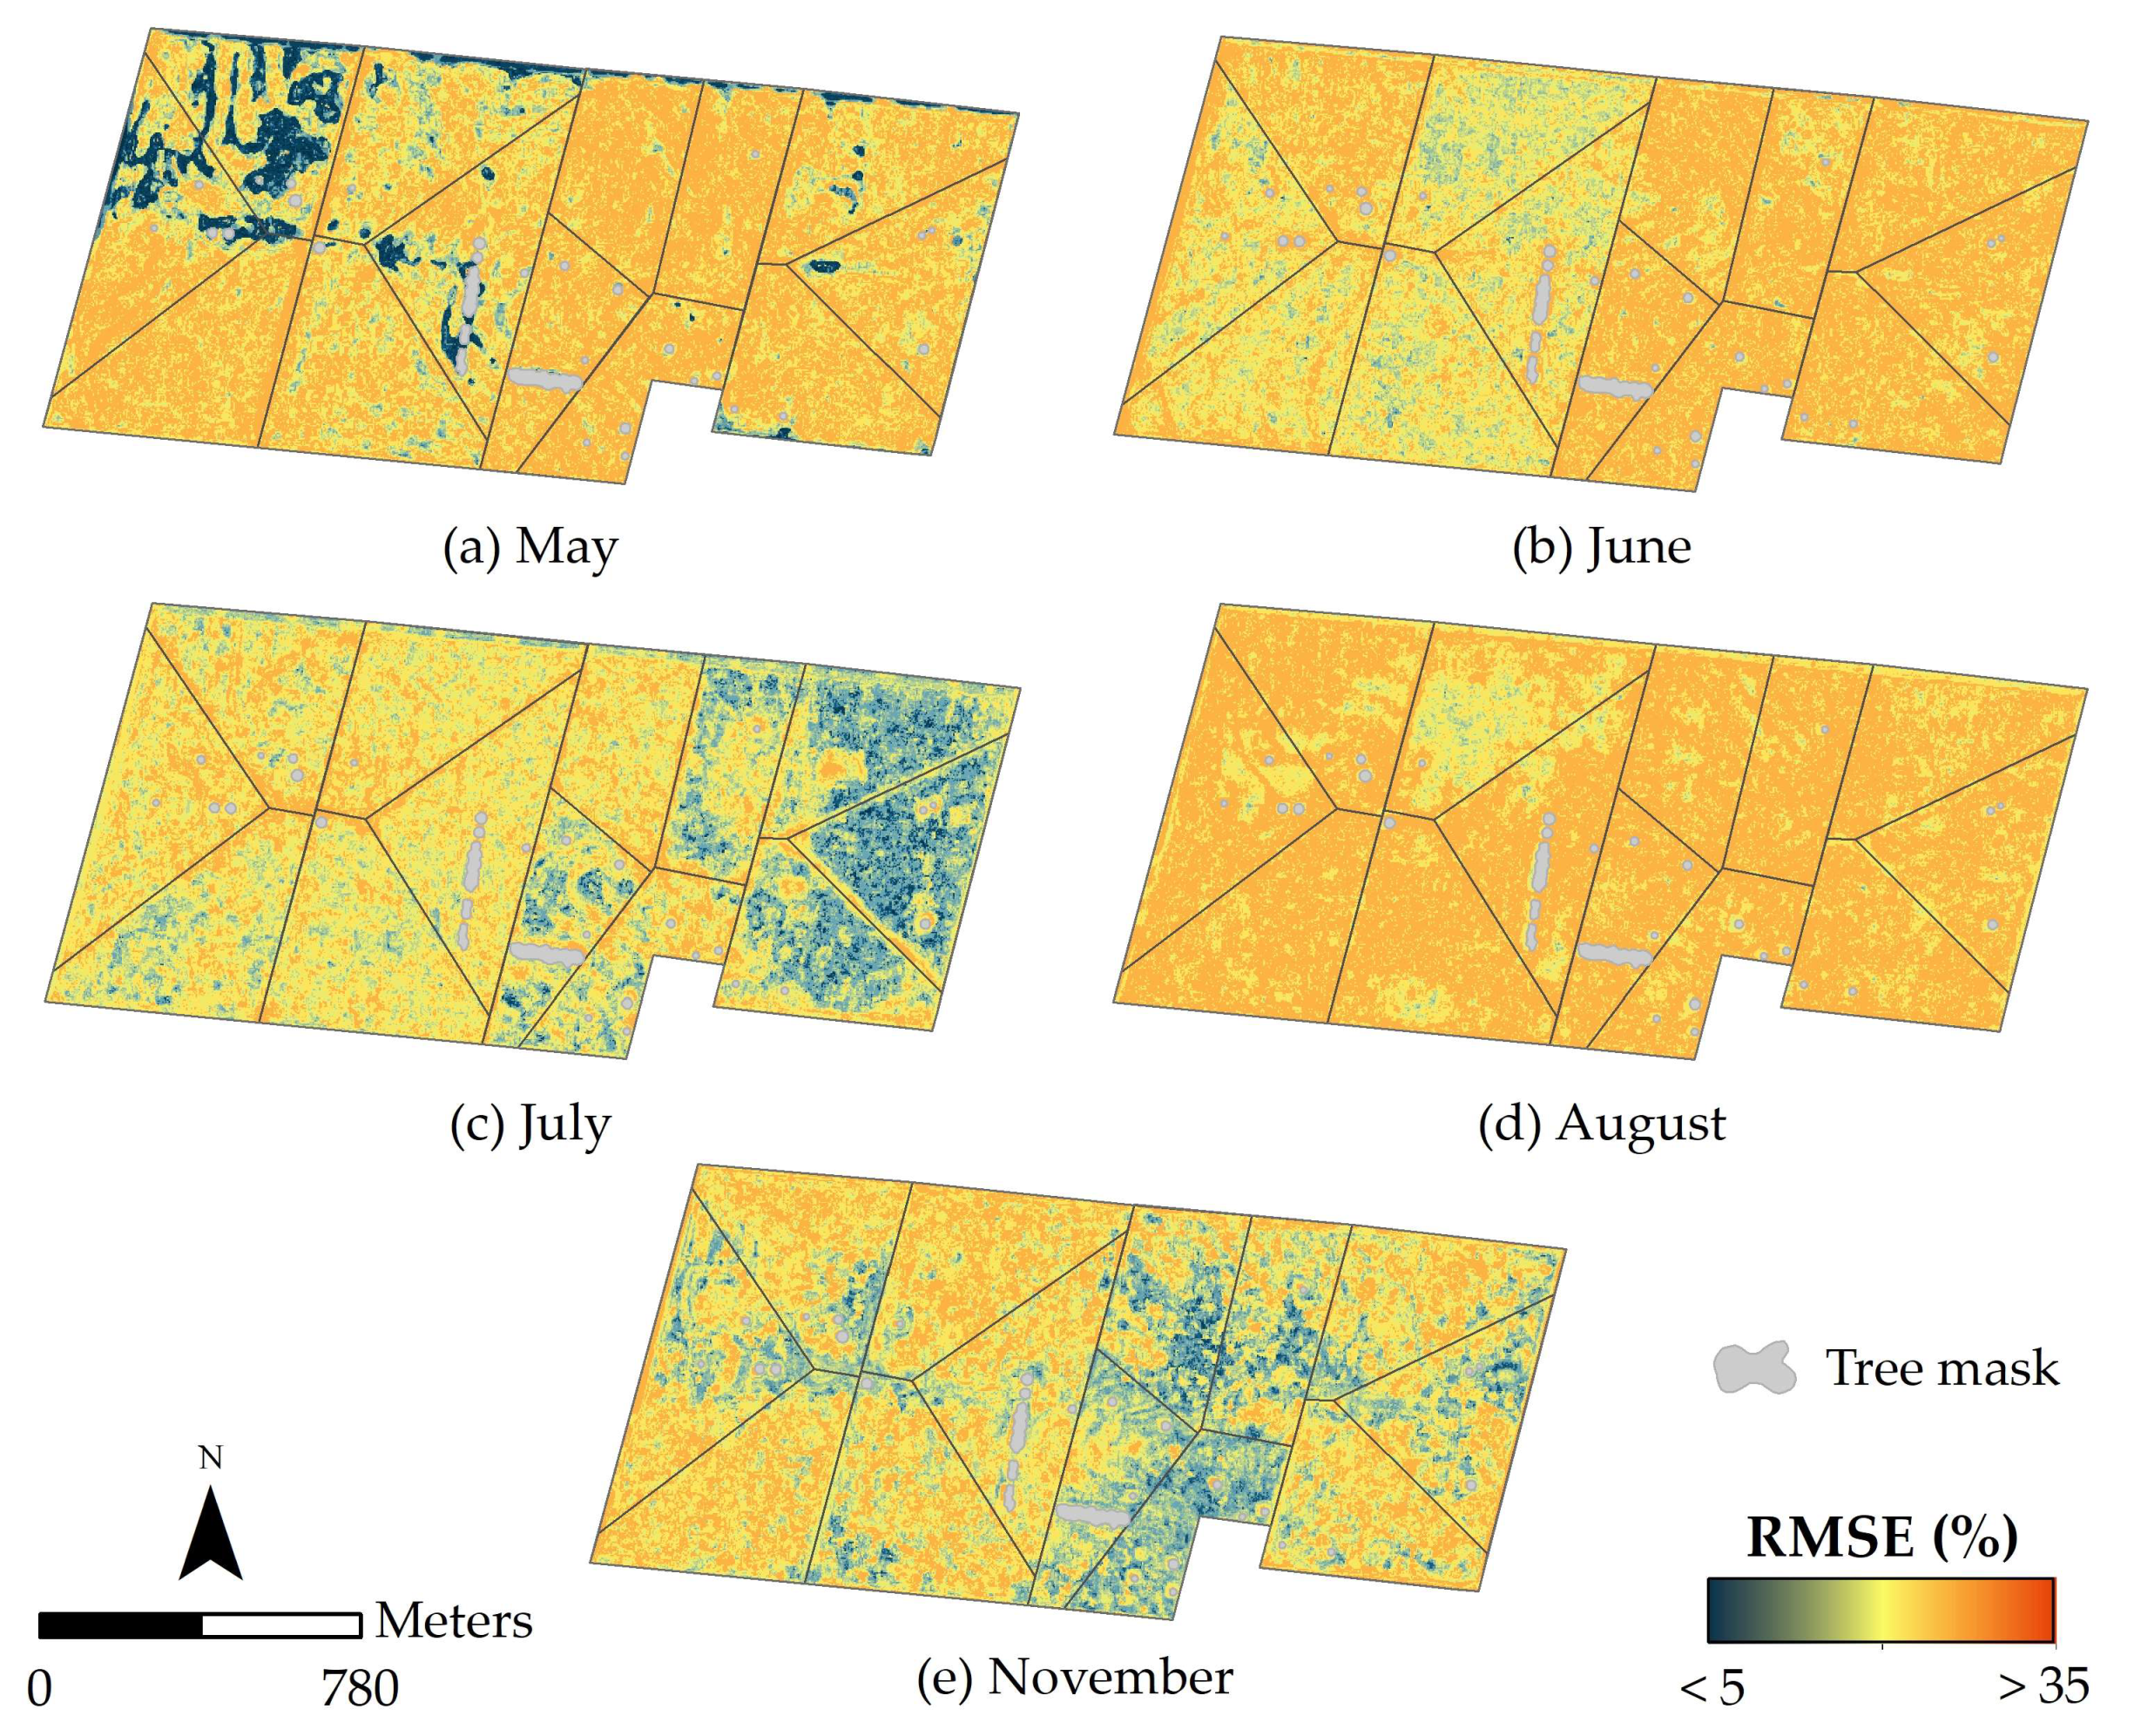
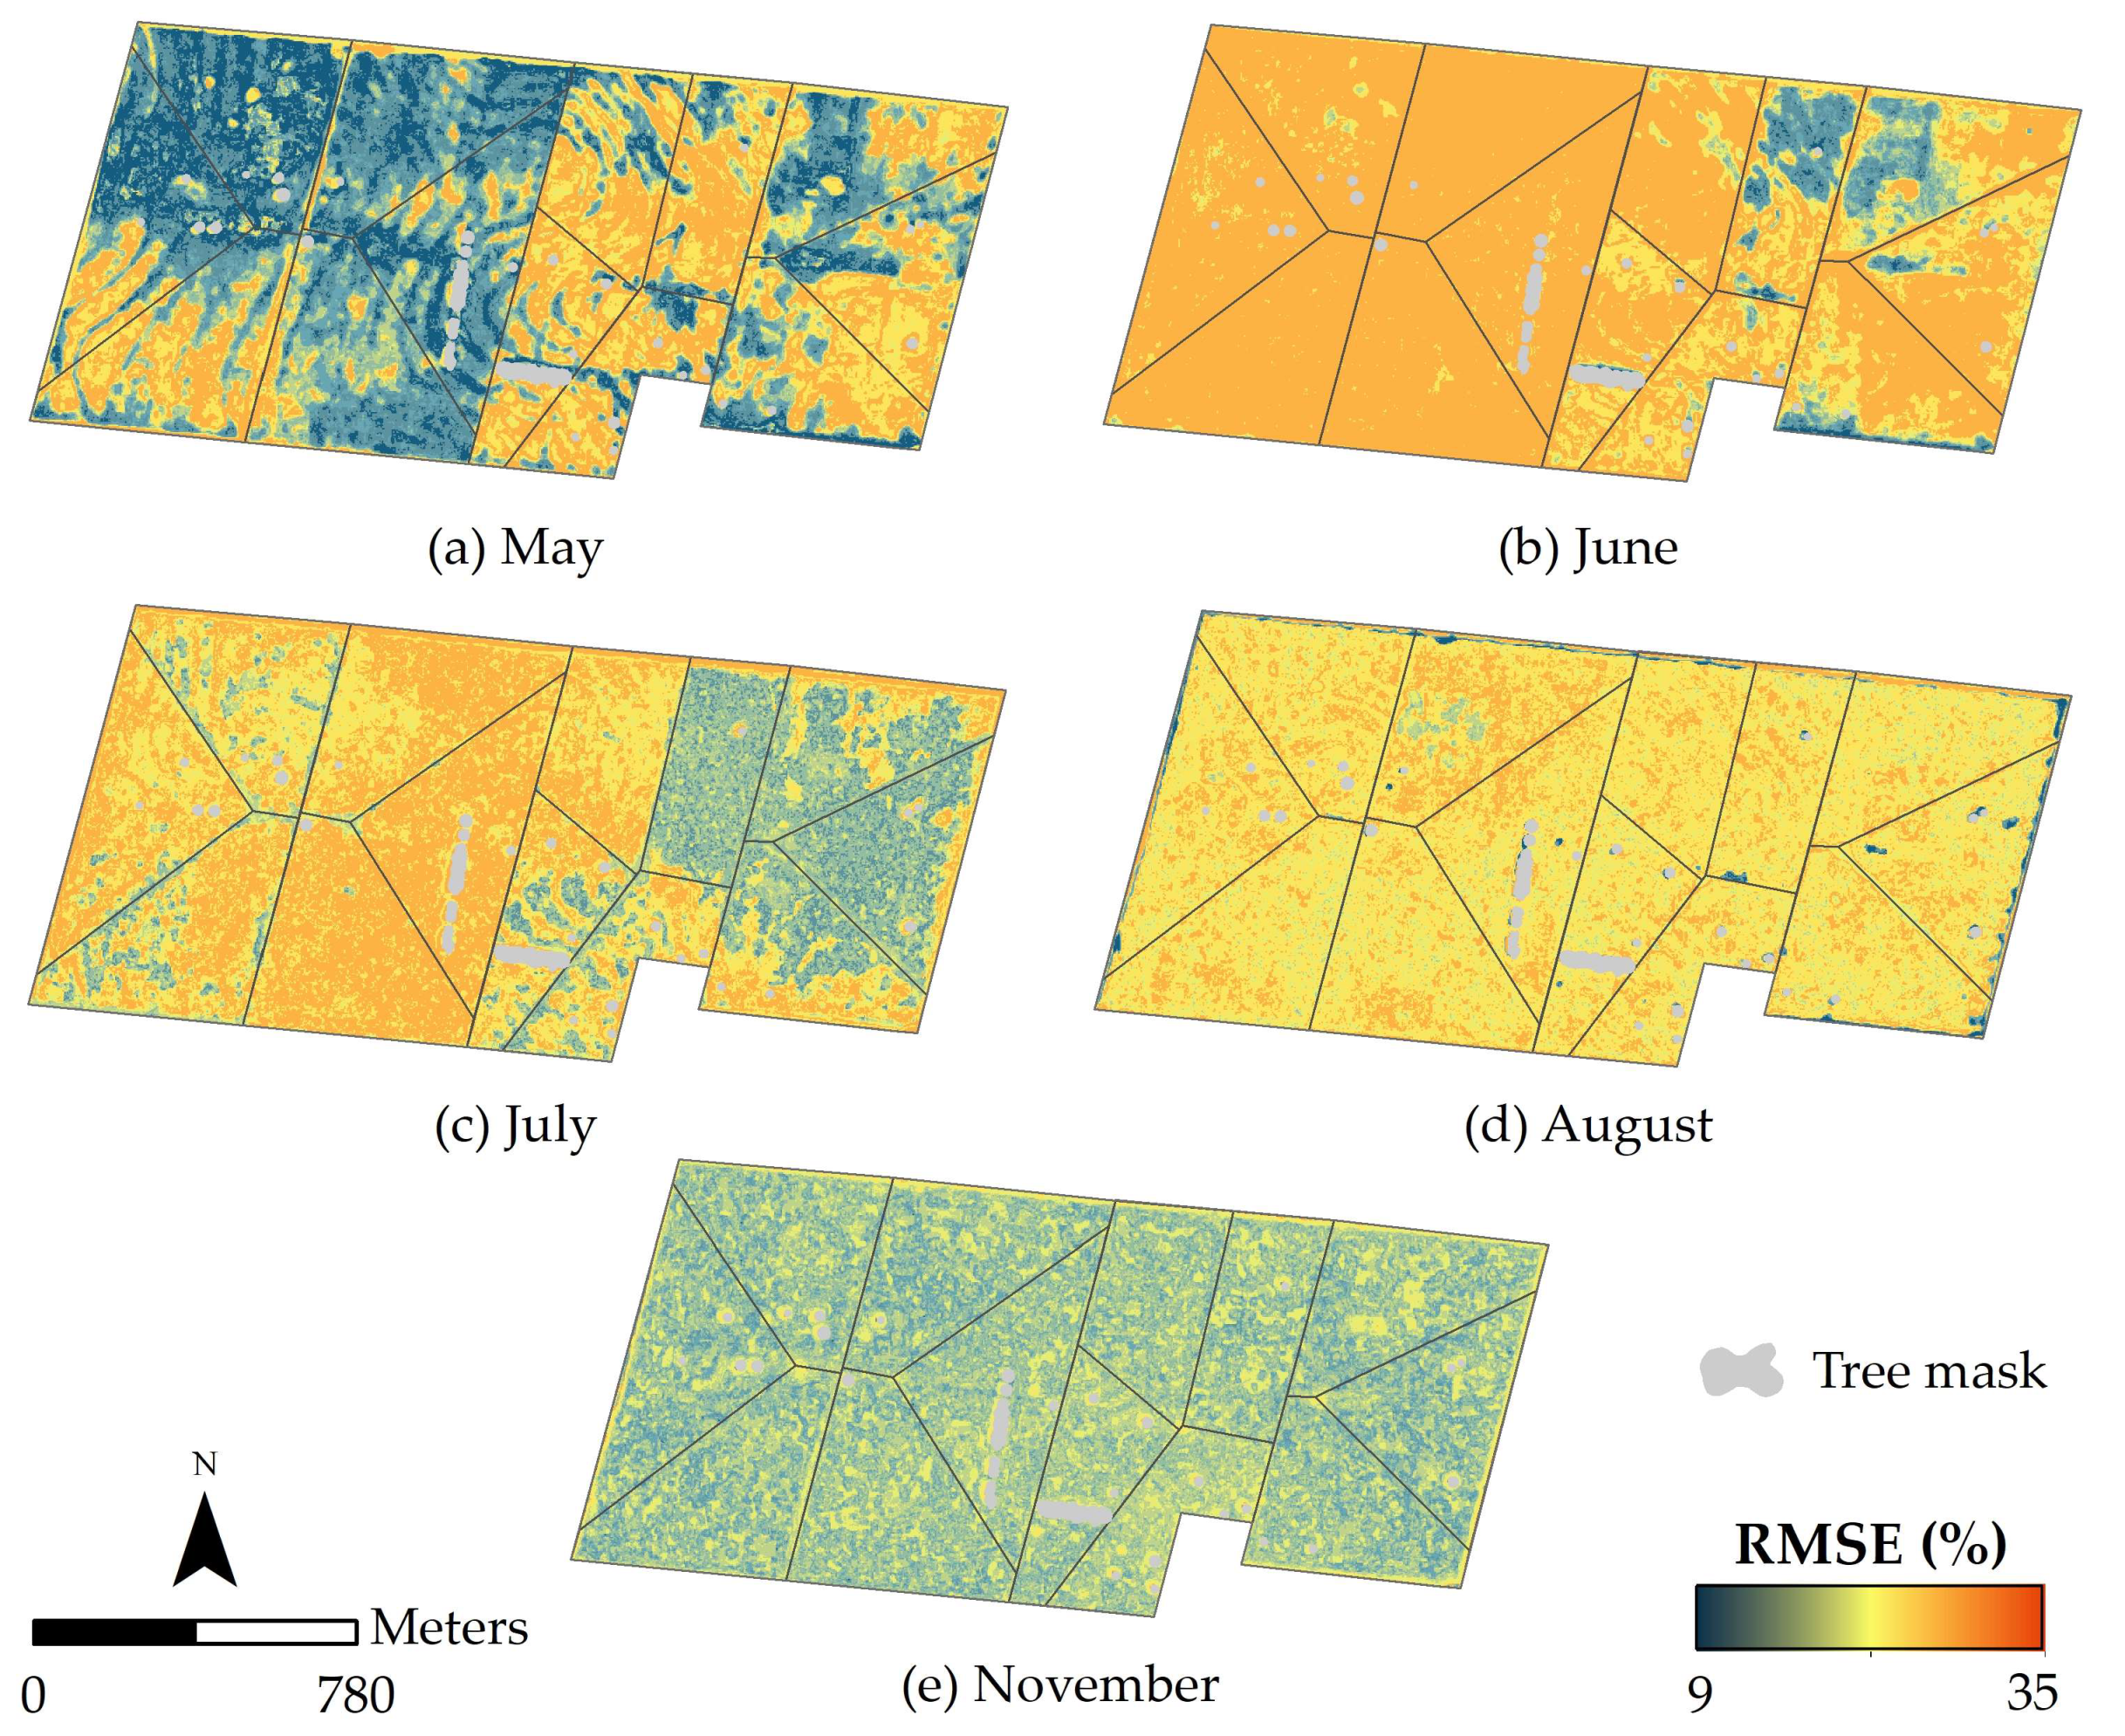
| Target Variable | Field Campaign | Field-Sampled Points | Proportion of Millet: Ruzi Grass (%) | Descriptive Statistics | ||||
|---|---|---|---|---|---|---|---|---|
| Mean | StdDev | Min | Max | CV | ||||
| AGB (g m−2) | May | 100 | 79:21 | 209.53 | 10.82 | 70.33 | 656.08 | 5.16 |
| June | 50 | 44:56 | 136.75 | 54.91 | 61.58 | 259.02 | 40.15 | |
| July | 100 | 14:86 | 106.95 | 39.05 | 41.08 | 241.99 | 36.51 | |
| August | 38 | 03:97 | 162.61 | 53.68 | 86.85 | 336.3 | 33.01 | |
| November | 58 | 0:100 | 202.19 | 65.26 | 107.30 | 401.10 | 32.28 | |
| All data | 346 | - | 163.19 | 81.97 | 41.08 | 656.08 | 50.23 | |
| CH (m) | May | 100 | 79:21 | 0.82 | 0.16 | 0.37 | 1.20 | 19.52 |
| June | 50 | 44:56 | 0.33 | 0.10 | 0.22 | 0.57 | 29.77 | |
| July | 100 | 14:86 | 0.29 | 0.10 | 0.14 | 0.68 | 34.32 | |
| August | 38 | 03:97 | 0.27 | 0.06 | 0.16 | 0.38 | 23.44 | |
| November | 58 | 0:100 | 0.20 | 0.05 | 0.12 | 0.37 | 24.50 | |
| All data | 346 | - | 0.43 | 0.27 | 0.12 | 1.20 | 63.34 | |
| Index | Name | Formula | Reference |
|---|---|---|---|
| ARVI | Atmospherically Resistant Vegetation Index | [39] | |
| BGND | Blue Green Normalized Difference | - | |
| DVI | Difference Vegetation Index | [40] | |
| EVI | Enhanced Vegetation Index | [41] | |
| EVI2 | Enhanced Vegetation Index 2 | [42] | |
| ExB | Excess Blue Vegetation Index | [43] | |
| ExG | Excess Green Vegetation Index | [44] | |
| ExGR | Excess Green minus Excess Red Vegetation Index | [45] | |
| ExR | Excess Red Vegetation Index | [46] | |
| GLA | Green Leaf Algorithm | [47] | |
| GNDVI | Green Normalized Difference Vegetation Index | [41] | |
| GRVI | Green Ratio Vegetation Index | [48] | |
| IPVI | Infrared Percentage Vegetation Index | [49] | |
| MGRDI | Modified Green Red Vegetation Index | [40] | |
| MSAVI | Modified Soil-Adjusted Vegetation Index | [50] | |
| NDVI | Normalized Difference Vegetation Index | [51] | |
| NGRDI | Normalized Green-Red Difference Index | [40] | |
| NIR/GREEN | NIR Green Simple Ratio | - | |
| OSAVI | Optimized Soil-Adjusted Vegetation Index | [52] | |
| RGBVI | Red Green Blue Vegetation Index | [53] | |
| RVI | Ratio Vegetation Index | [54] | |
| SAVI | Soil-Adjusted Vegetation Index | [55] | |
| SR | Simple Ratio | [56] | |
| VARI | Visible Atmospherically Resistant Index | [57] |
| Algorithm | Hyperparameter | Description | Candidate Value Ranges |
|---|---|---|---|
| XGBoost | nrounds | controls the maximum number of iterations | 50–200 |
| eta | controls the learning rate | 0.01–0.3 | |
| max_depth | controls the depth of the tree | 3–10 | |
| min_child_weight | refers to minimum number of instances required in a child node | 1–10 | |
| subsample | controls the number of observations supplied to a tree | 0.5–1.0 | |
| colsample_bytree | controls the number of predictor variables supplied to a tree | 0.5–1.0 | |
| RF | ntree | controls the number of trees | 50–500 |
| mtry | controls for the number of predictor variables randomly sampled at each split | 1– |
| Modelling Algorithm | Window Size | Offset (θ) | AGB | CH | ||||
|---|---|---|---|---|---|---|---|---|
| RMSE (g m−2) | RMSE (%) | R2 | RMSE (m) | RMSE (%) | R2 | |||
| RF | 3 × 3 | 0° | 53.31 | 34.36 | 0.47 | 0.10 | 22.73 | 0.87 |
| 45° | 50.77 | 32.72 | 0.51 | 0.10 | 22.91 | 0.87 | ||
| 90° | 48.49 | 31.25 | 0.52 | 0.10 | 23.09 | 0.87 | ||
| 135° | 51.54 | 33.22 | 0.50 | 0.10 | 22.37 | 0.87 | ||
| 5 × 5 | 0° | 49.72 | 32.05 | 0.51 | 0.10 | 23.00 | 0.87 | |
| 45° | 49.61 | 31.97 | 0.51 | 0.10 | 23.55 | 0.87 | ||
| 90° | 47.79 | 30.80 | 0.54 | 0.10 | 22.84 | 0.87 | ||
| 135° | 47.46 | 30.59 | 0.56 | 0.10 | 22.18 | 0.88 | ||
| 7 × 7 | 0° | 46.43 | 29.93 | 0.57 | 0.10 | 22.34 | 0.87 | |
| 45° | 45.60 | 29.39 | 0.58 | 0.10 | 23.25 | 0.86 | ||
| 90° | 44.09 | 28.42 | 0.60 | 0.10 | 22.89 | 0.87 | ||
| 135° | 46.42 | 29.92 | 0.56 | 0.10 | 22.50 | 0.87 | ||
| XGBoost | 3 × 3 | 0° | 51.56 | 33.23 | 0.46 | 0.10 | 22.63 | 0.87 |
| 45° | 49.12 | 31.66 | 0.52 | 0.10 | 22.30 | 0.87 | ||
| 90° | 47.84 | 30.84 | 0.53 | 0.10 | 22.88 | 0.87 | ||
| 135° | 49.82 | 32.11 | 0.49 | 0.10 | 22.21 | 0.88 | ||
| 5 × 5 | 0° | 49.02 | 31.59 | 0.52 | 0.10 | 22.37 | 0.87 | |
| 45° | 47.53 | 30.63 | 0.54 | 0.10 | 22.20 | 0.87 | ||
| 90° | 47.50 | 30.61 | 0.54 | 0.10 | 21.64 | 0.88 | ||
| 135° | 48.38 | 31.18 | 0.52 | 0.09 | 20.94 | 0.89 | ||
| 7 × 7 | 0° | 46.19 | 29.77 | 0.56 | 0.09 | 21.31 | 0.88 | |
| 45° | 45.22 | 29.15 | 0.58 | 0.10 | 22.02 | 0.87 | ||
| 90° | 41.15 | 26.52 | 0.65 | 0.10 | 22.07 | 0.88 | ||
| 135° | 47.12 | 30.37 | 0.55 | 0.09 | 21.11 | 0.89 | ||
| Modelling Algorithm | Prediction Scenario | AGB | CH | ||||
|---|---|---|---|---|---|---|---|
| RMSE (g m−2) | RMSE (%) | R2 | RMSE (m) | RMSE (%) | R2 | ||
| RF | SC1 | 52.47 | 33.82 | 0.46 | 0.10 | 23.70 | 0.86 |
| SC2 | 50.93 | 32.83 | 0.48 | 0.10 | 22.52 | 0.87 | |
| SC3 | 44.09 | 28.42 | 0.60 | 0.10 | 22.18 | 0.88 | |
| SC4 | 46.49 | 29.96 | 0.55 | 0.10 | 22.50 | 0.87 | |
| XGBoost | SC1 | 49.76 | 32.07 | 0.50 | 0.10 | 23.46 | 0.86 |
| SC2 | 48.99 | 31.58 | 0.50 | 0.10 | 22.61 | 0.87 | |
| SC3 | 41.15 | 26.52 | 0.65 | 0.09 | 20.94 | 0.89 | |
| SC4 | 45.85 | 29.55 | 0.57 | 0.10 | 21.61 | 0.88 | |
© 2020 by the authors. Licensee MDPI, Basel, Switzerland. This article is an open access article distributed under the terms and conditions of the Creative Commons Attribution (CC BY) license (http://creativecommons.org/licenses/by/4.0/).
Share and Cite
Dos Reis, A.A.; Werner, J.P.S.; Silva, B.C.; Figueiredo, G.K.D.A.; Antunes, J.F.G.; Esquerdo, J.C.D.M.; Coutinho, A.C.; Lamparelli, R.A.C.; Rocha, J.V.; Magalhães, P.S.G. Monitoring Pasture Aboveground Biomass and Canopy Height in an Integrated Crop–Livestock System Using Textural Information from PlanetScope Imagery. Remote Sens. 2020, 12, 2534. https://doi.org/10.3390/rs12162534
Dos Reis AA, Werner JPS, Silva BC, Figueiredo GKDA, Antunes JFG, Esquerdo JCDM, Coutinho AC, Lamparelli RAC, Rocha JV, Magalhães PSG. Monitoring Pasture Aboveground Biomass and Canopy Height in an Integrated Crop–Livestock System Using Textural Information from PlanetScope Imagery. Remote Sensing. 2020; 12(16):2534. https://doi.org/10.3390/rs12162534
Chicago/Turabian StyleDos Reis, Aliny A., João P. S. Werner, Bruna C. Silva, Gleyce K. D. A. Figueiredo, João F. G. Antunes, Júlio C. D. M. Esquerdo, Alexandre C. Coutinho, Rubens A. C. Lamparelli, Jansle V. Rocha, and Paulo S. G. Magalhães. 2020. "Monitoring Pasture Aboveground Biomass and Canopy Height in an Integrated Crop–Livestock System Using Textural Information from PlanetScope Imagery" Remote Sensing 12, no. 16: 2534. https://doi.org/10.3390/rs12162534
APA StyleDos Reis, A. A., Werner, J. P. S., Silva, B. C., Figueiredo, G. K. D. A., Antunes, J. F. G., Esquerdo, J. C. D. M., Coutinho, A. C., Lamparelli, R. A. C., Rocha, J. V., & Magalhães, P. S. G. (2020). Monitoring Pasture Aboveground Biomass and Canopy Height in an Integrated Crop–Livestock System Using Textural Information from PlanetScope Imagery. Remote Sensing, 12(16), 2534. https://doi.org/10.3390/rs12162534


