Refinement of Landslide Susceptibility Map Using Persistent Scatterer Interferometry in Areas of Intense Mining Activities in the Karst Region of Southwest China

 ,
,  , and
, and
Abstract
1. Introduction
2. Study Area and SAR Data
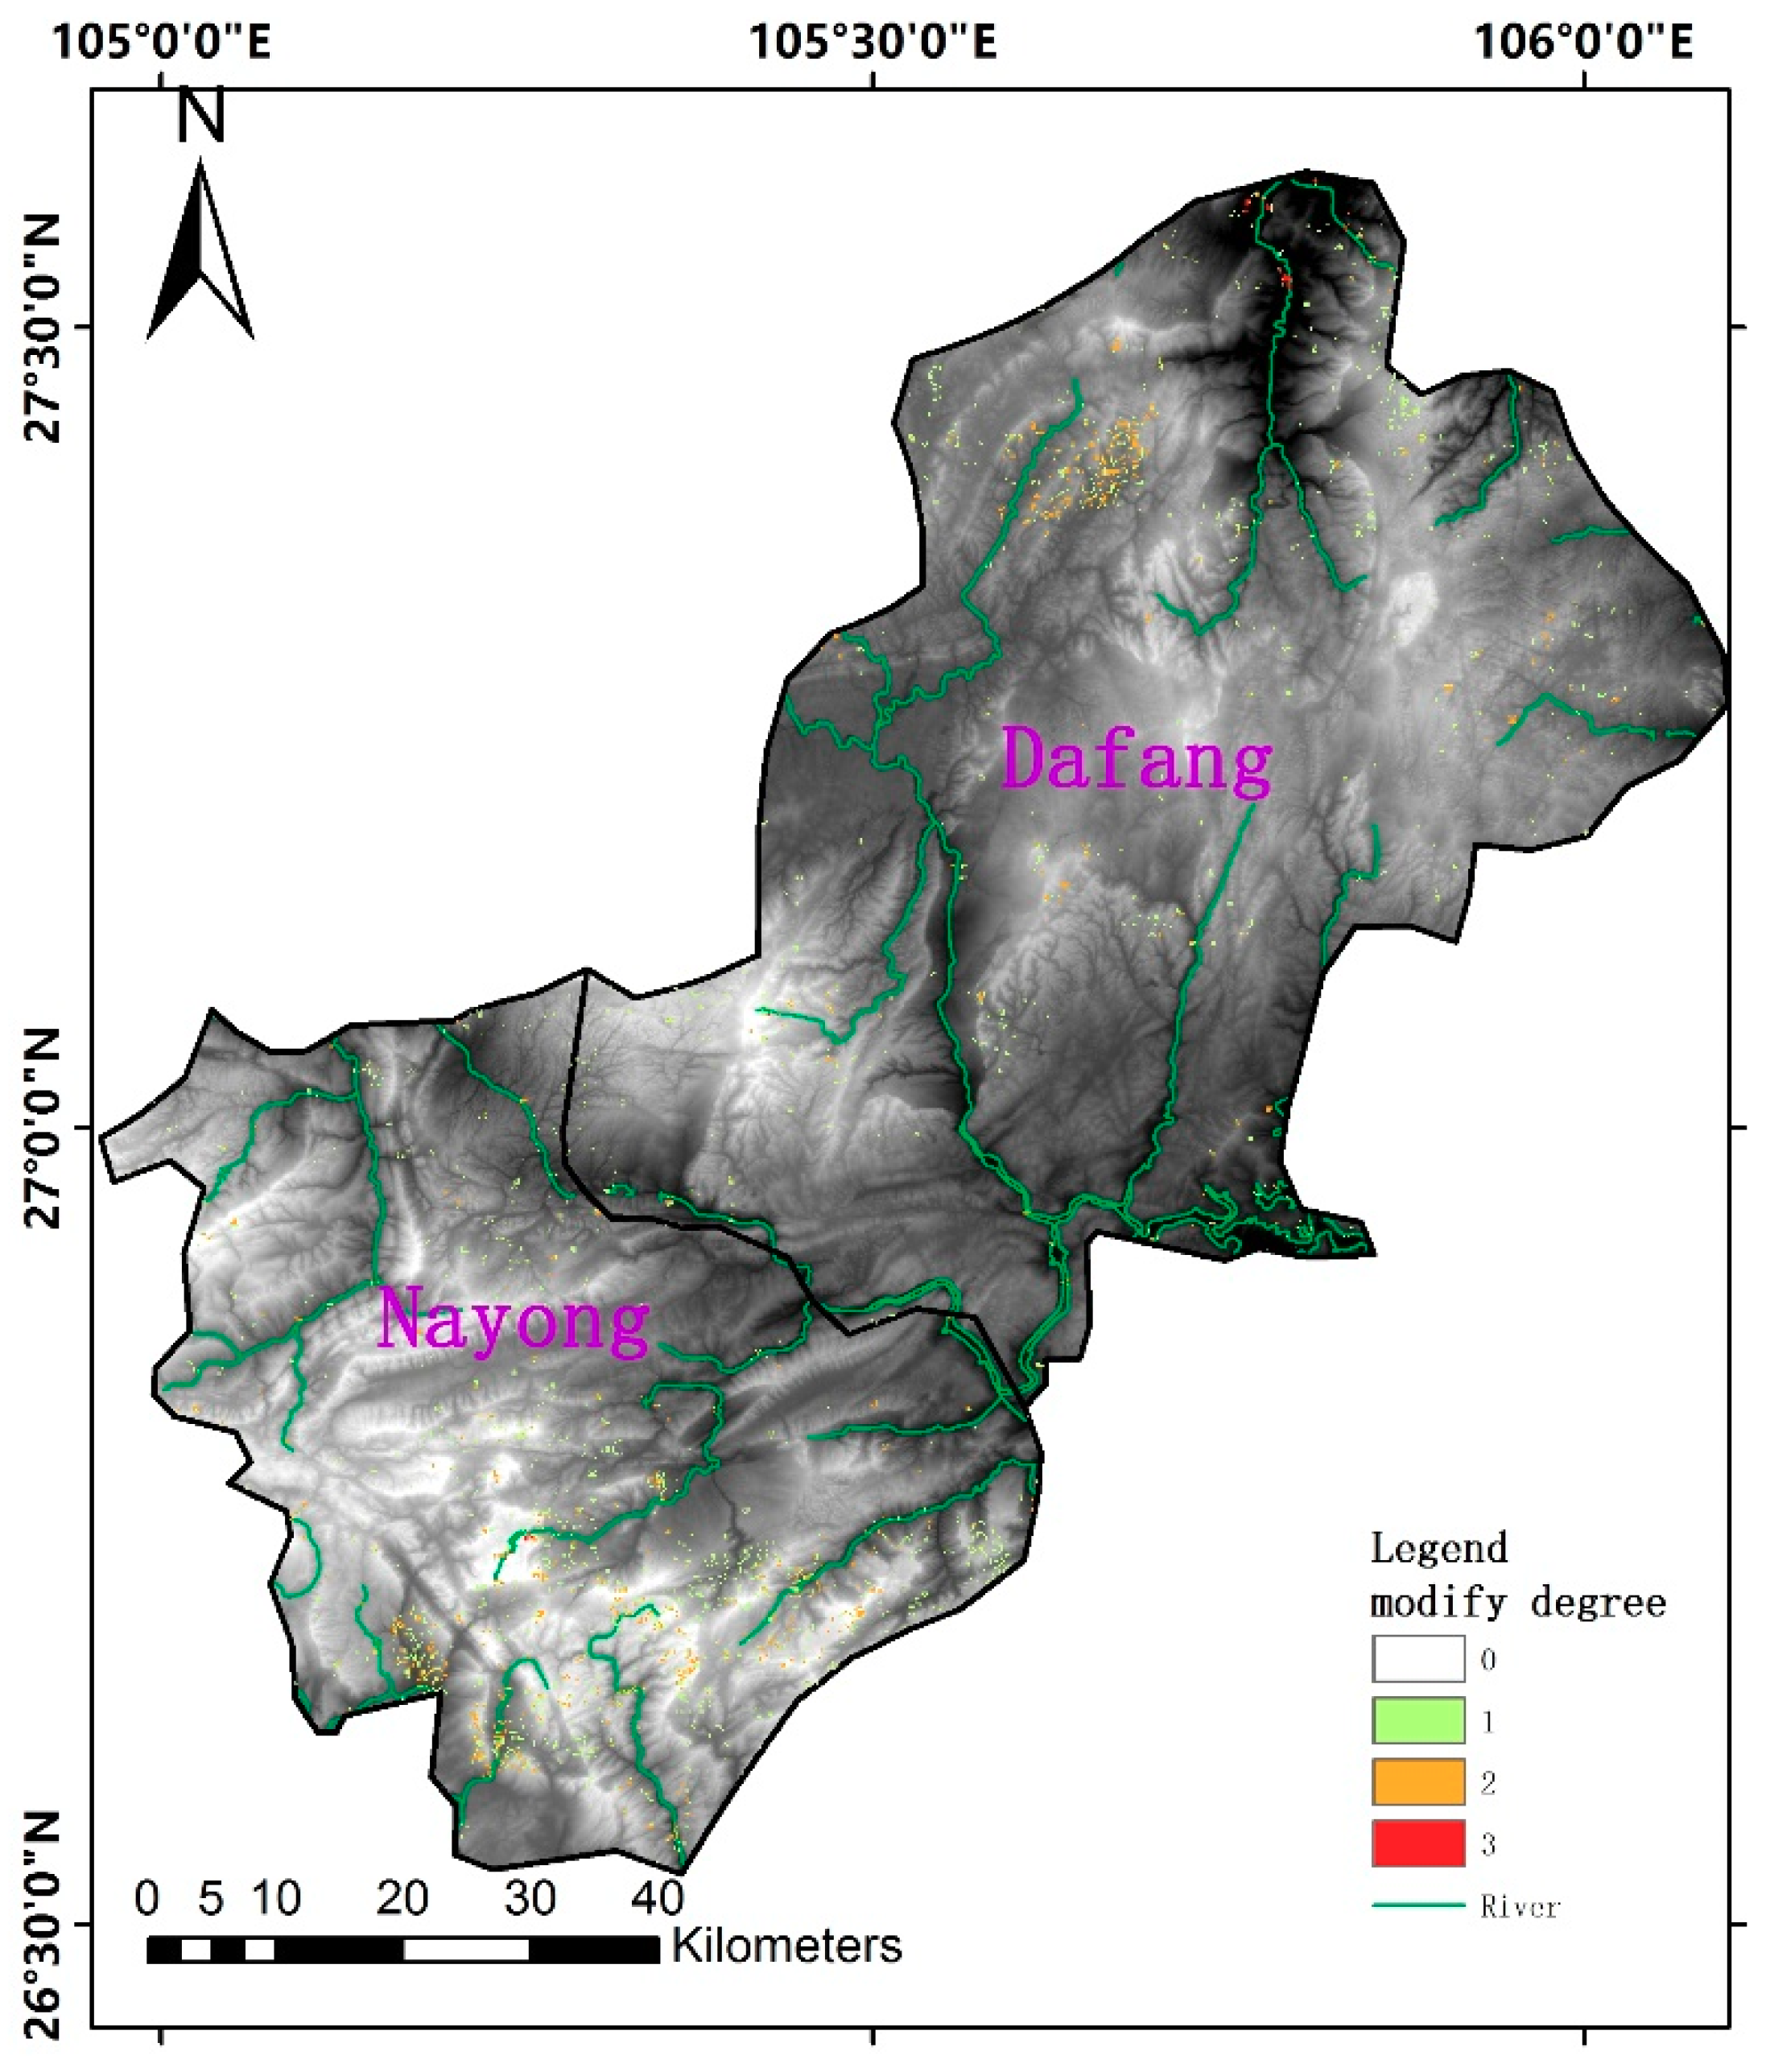
2.1. Study Area
2.2. SAR Data
3. Methodologies
3.1. Landslide Susceptibility Map
3.2. PSInSAR
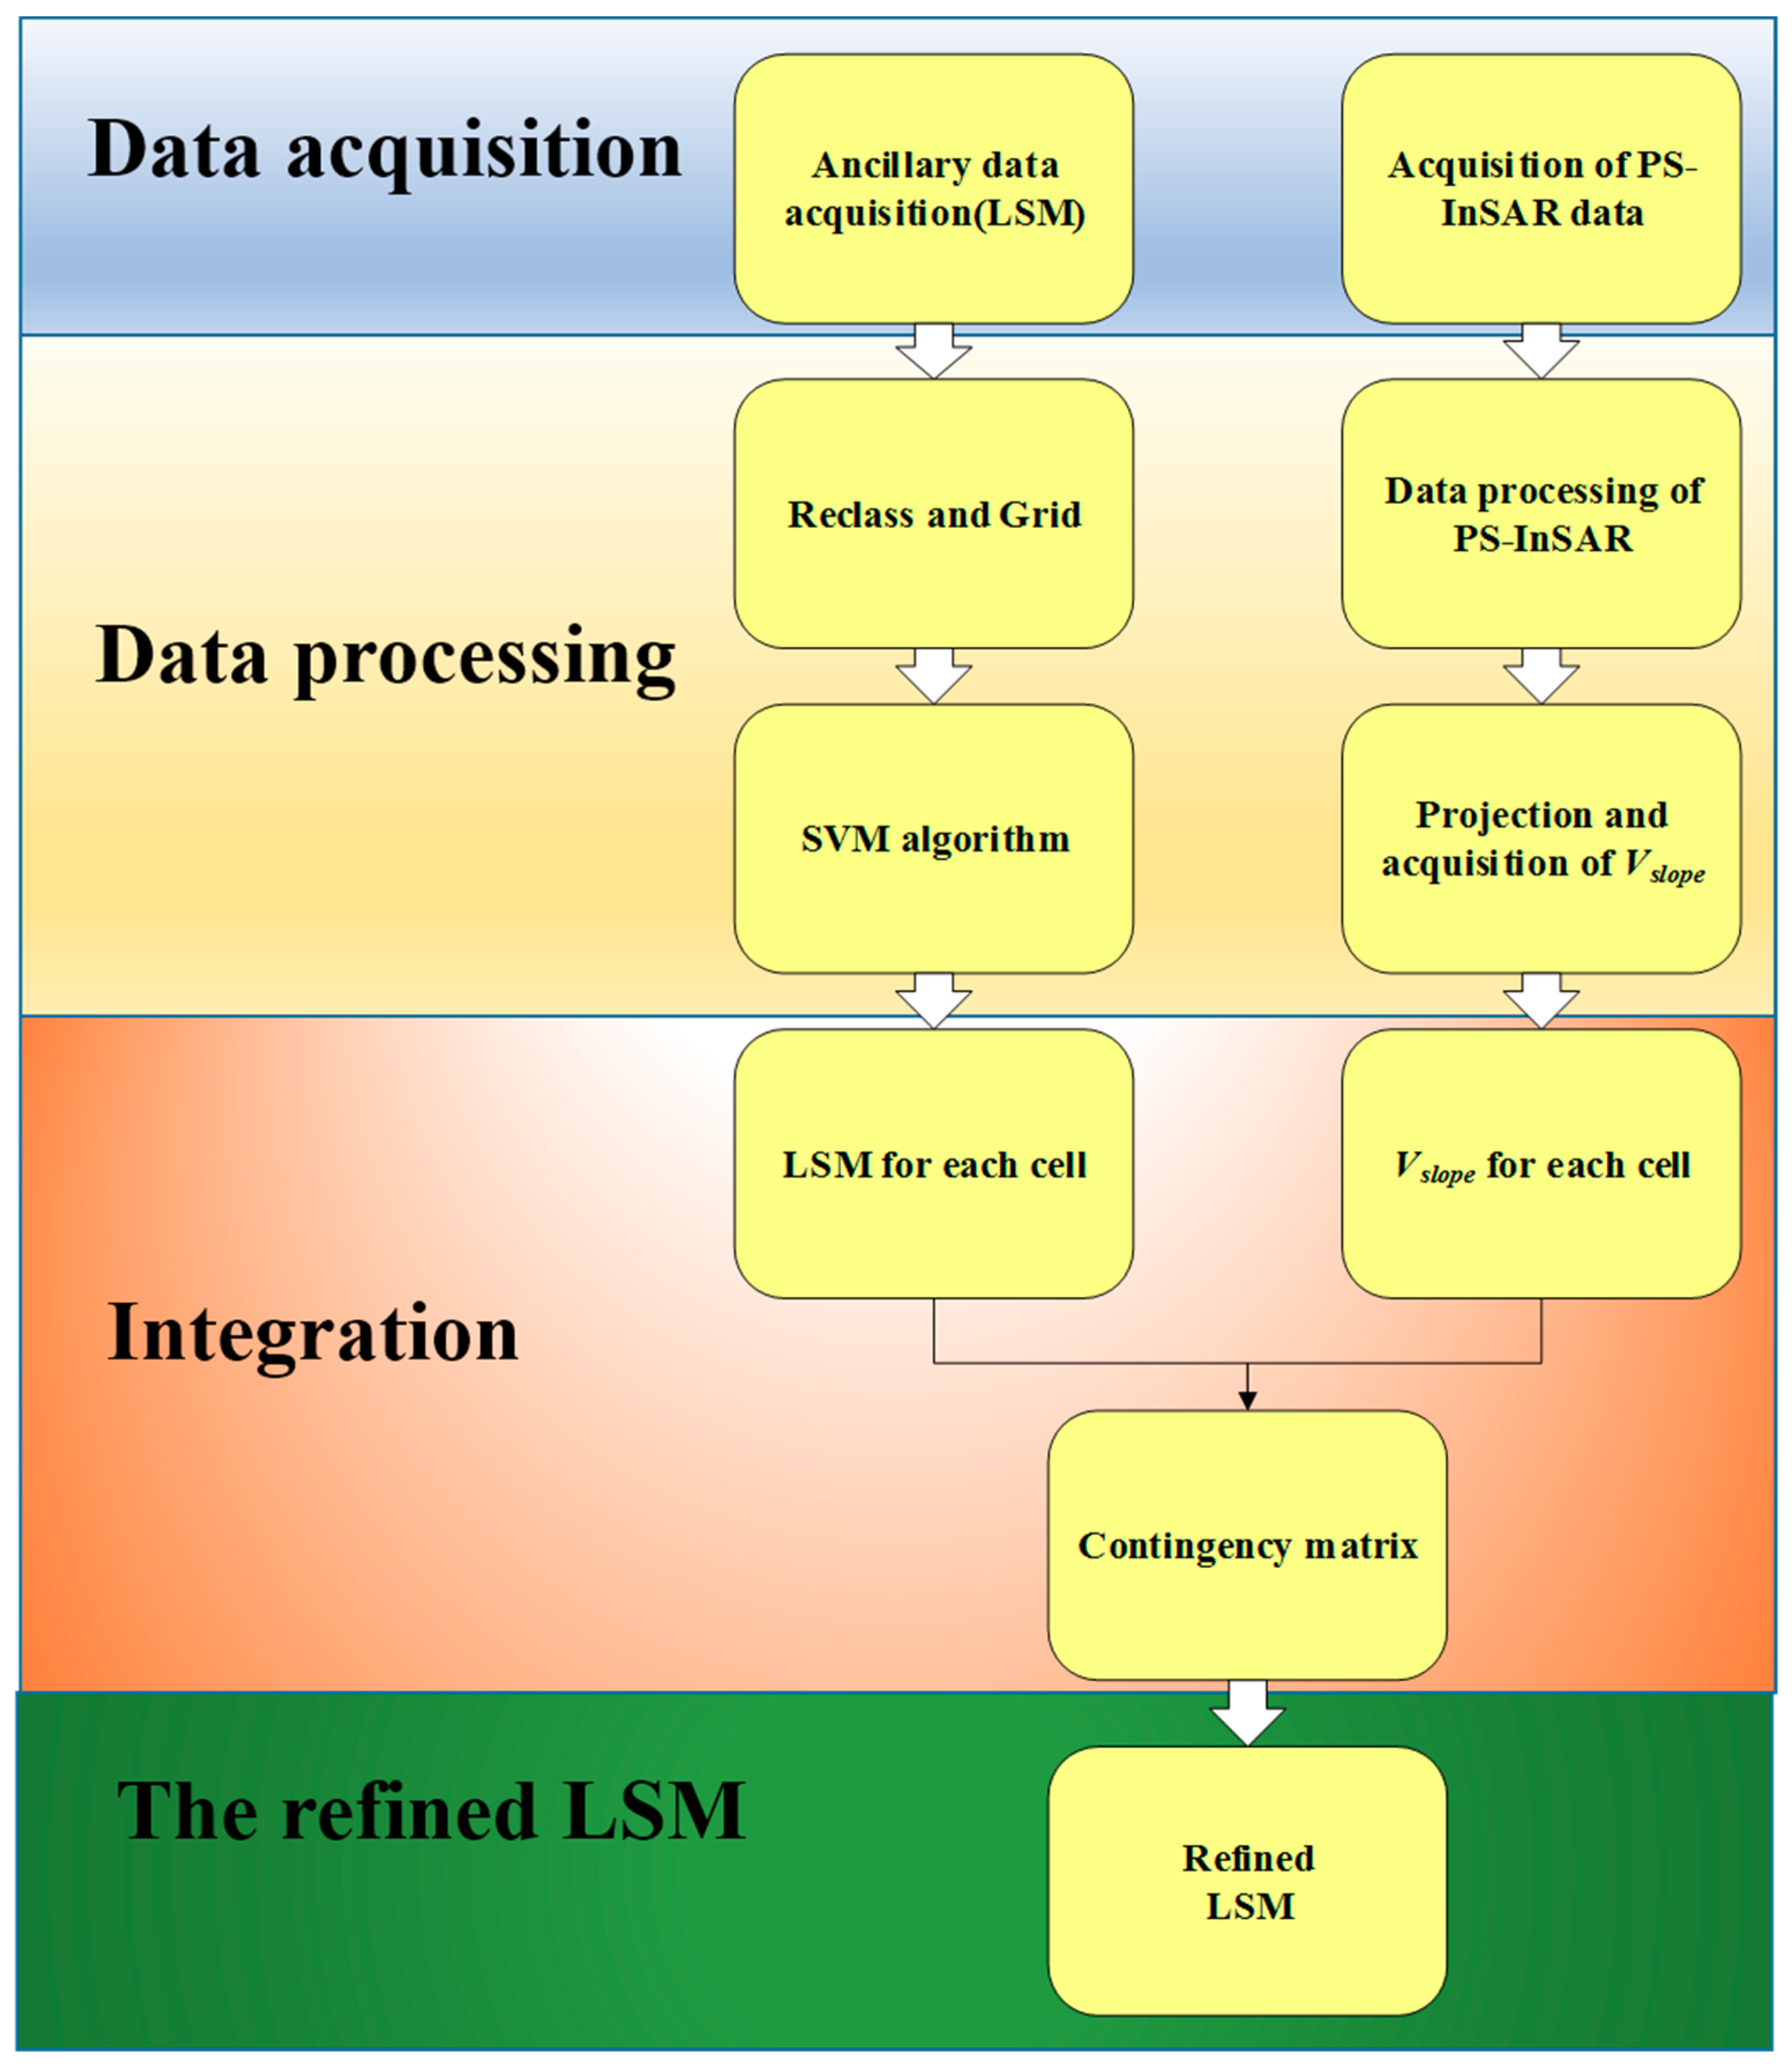
3.3. Integration
4. Results
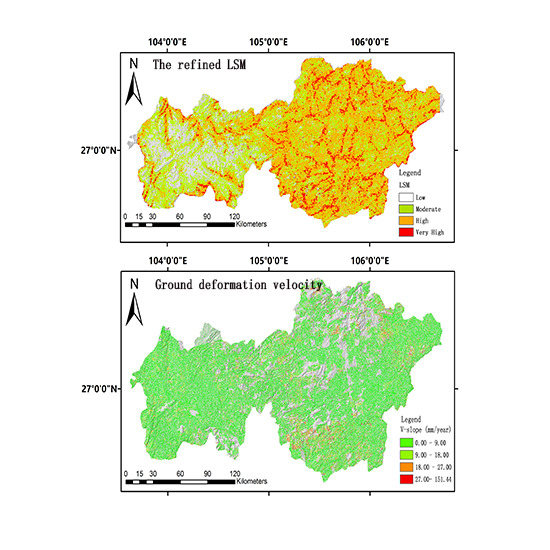
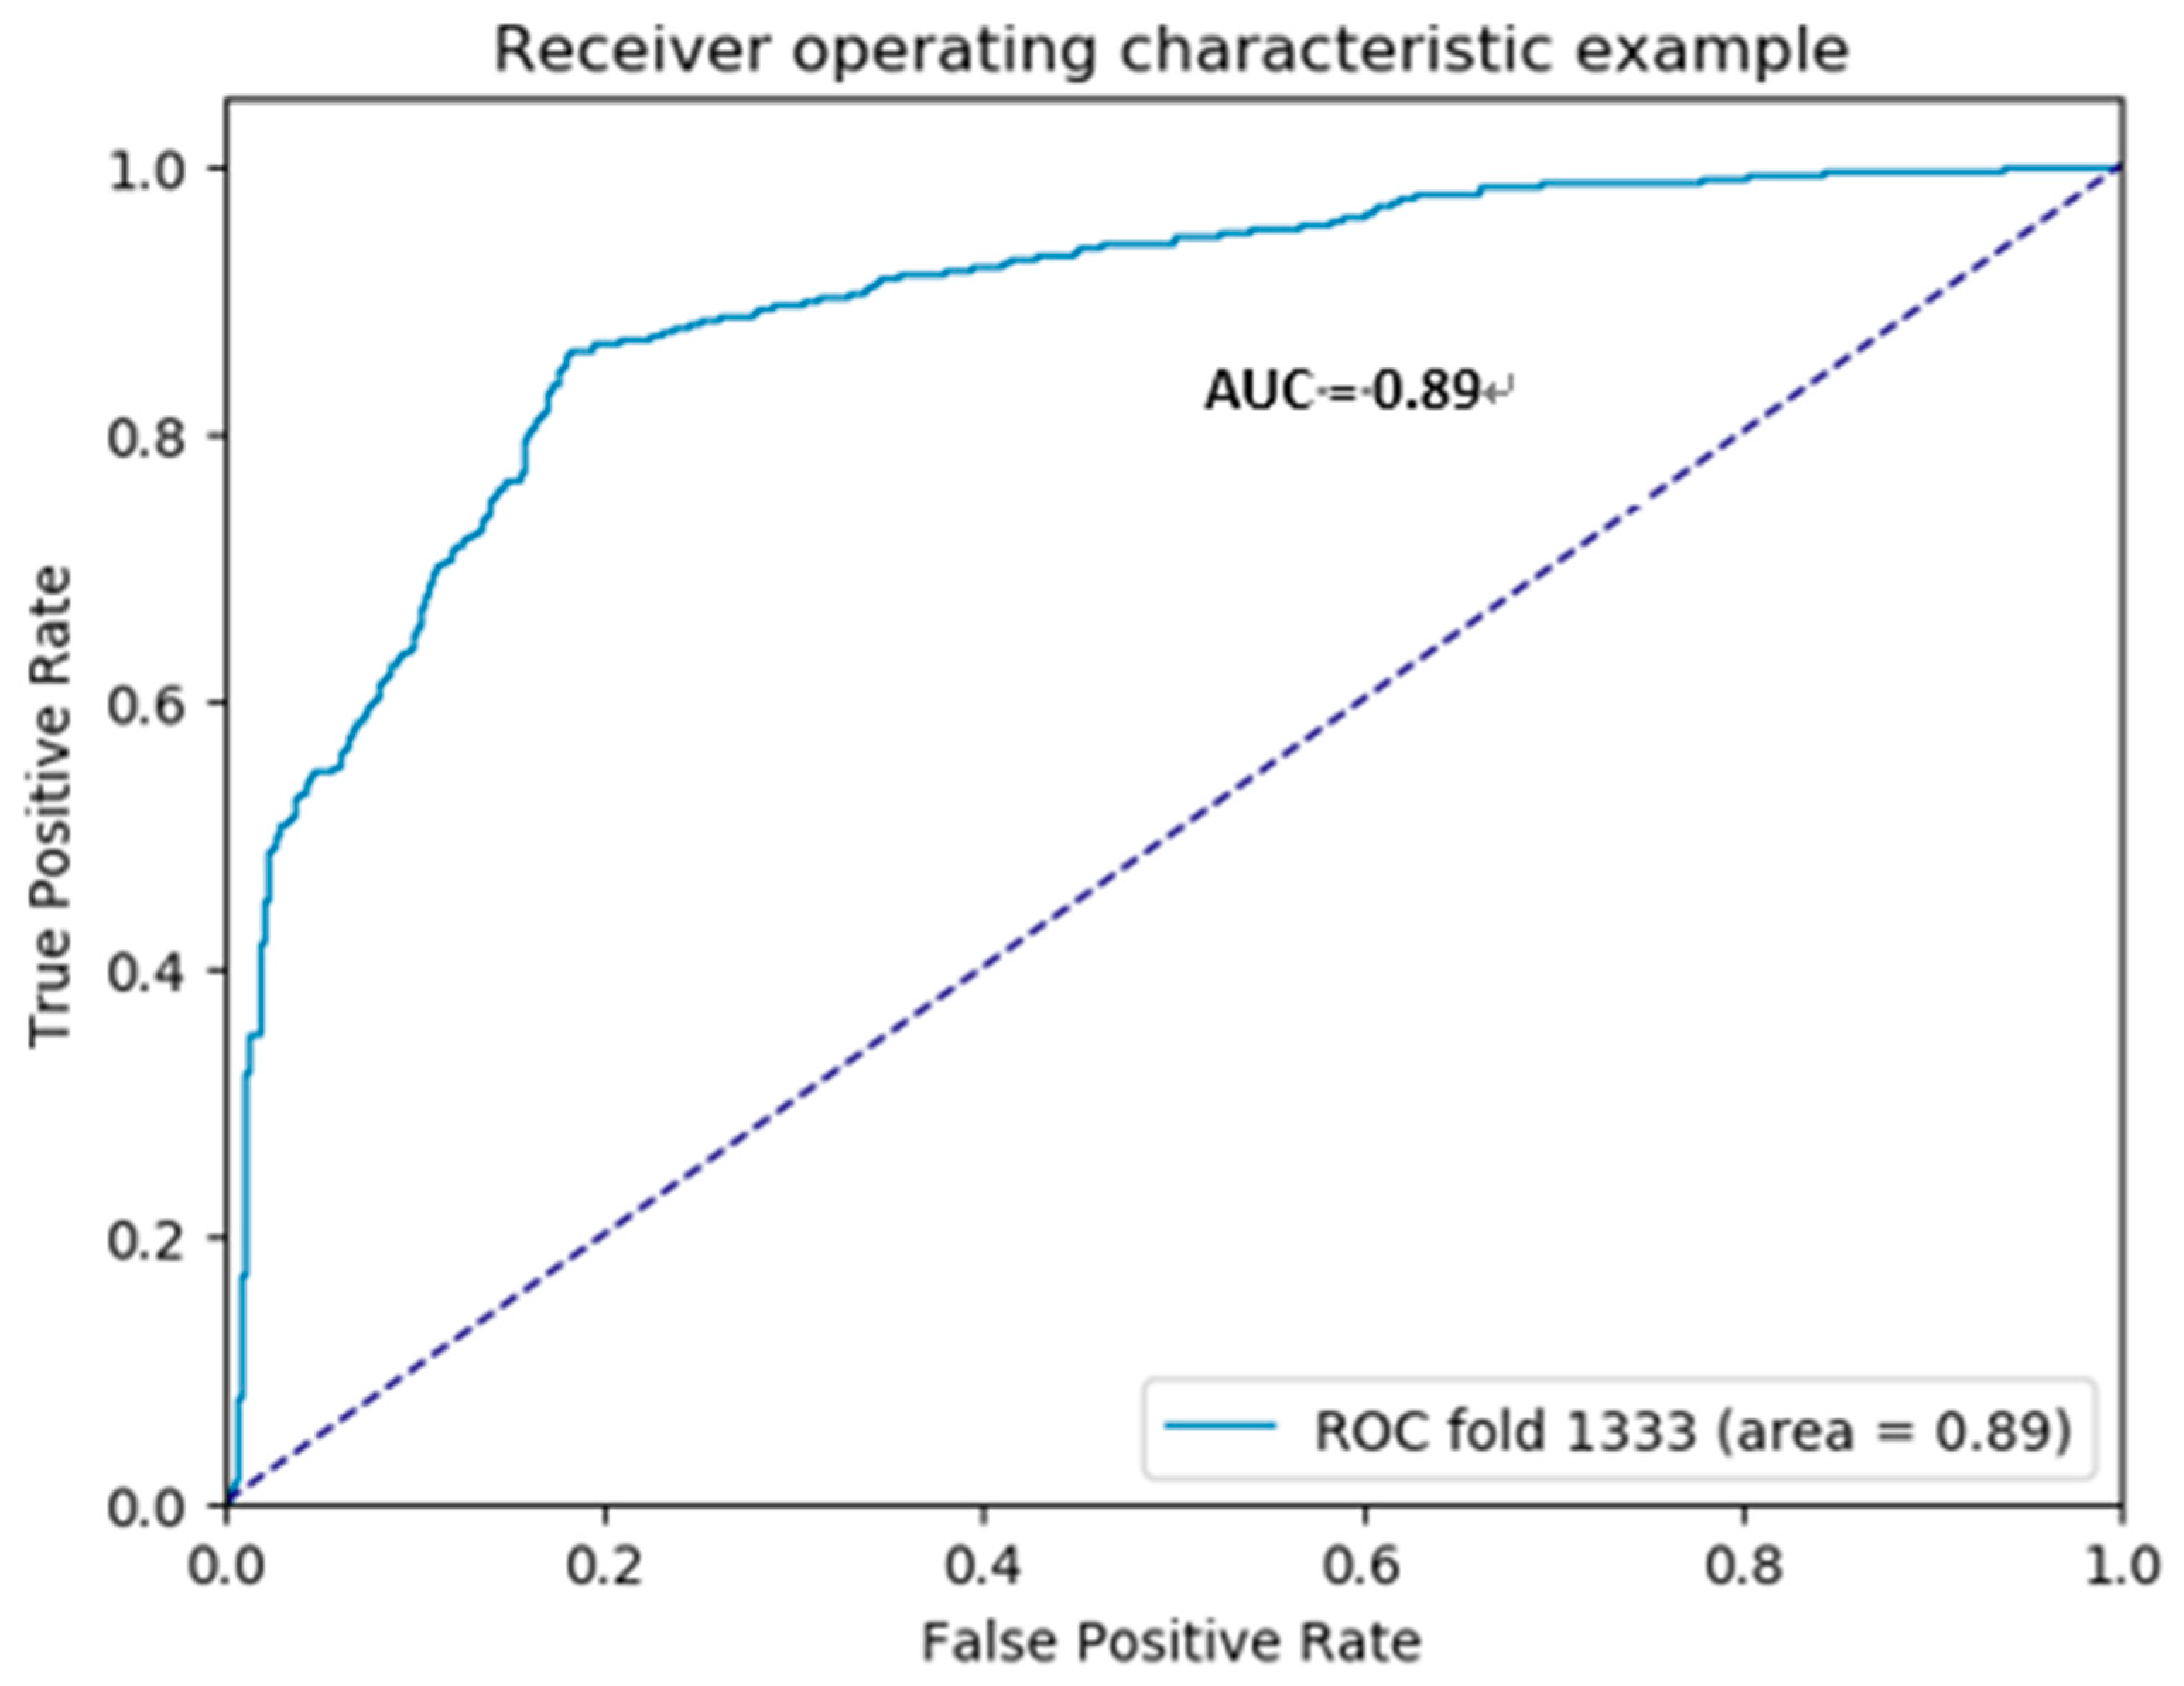
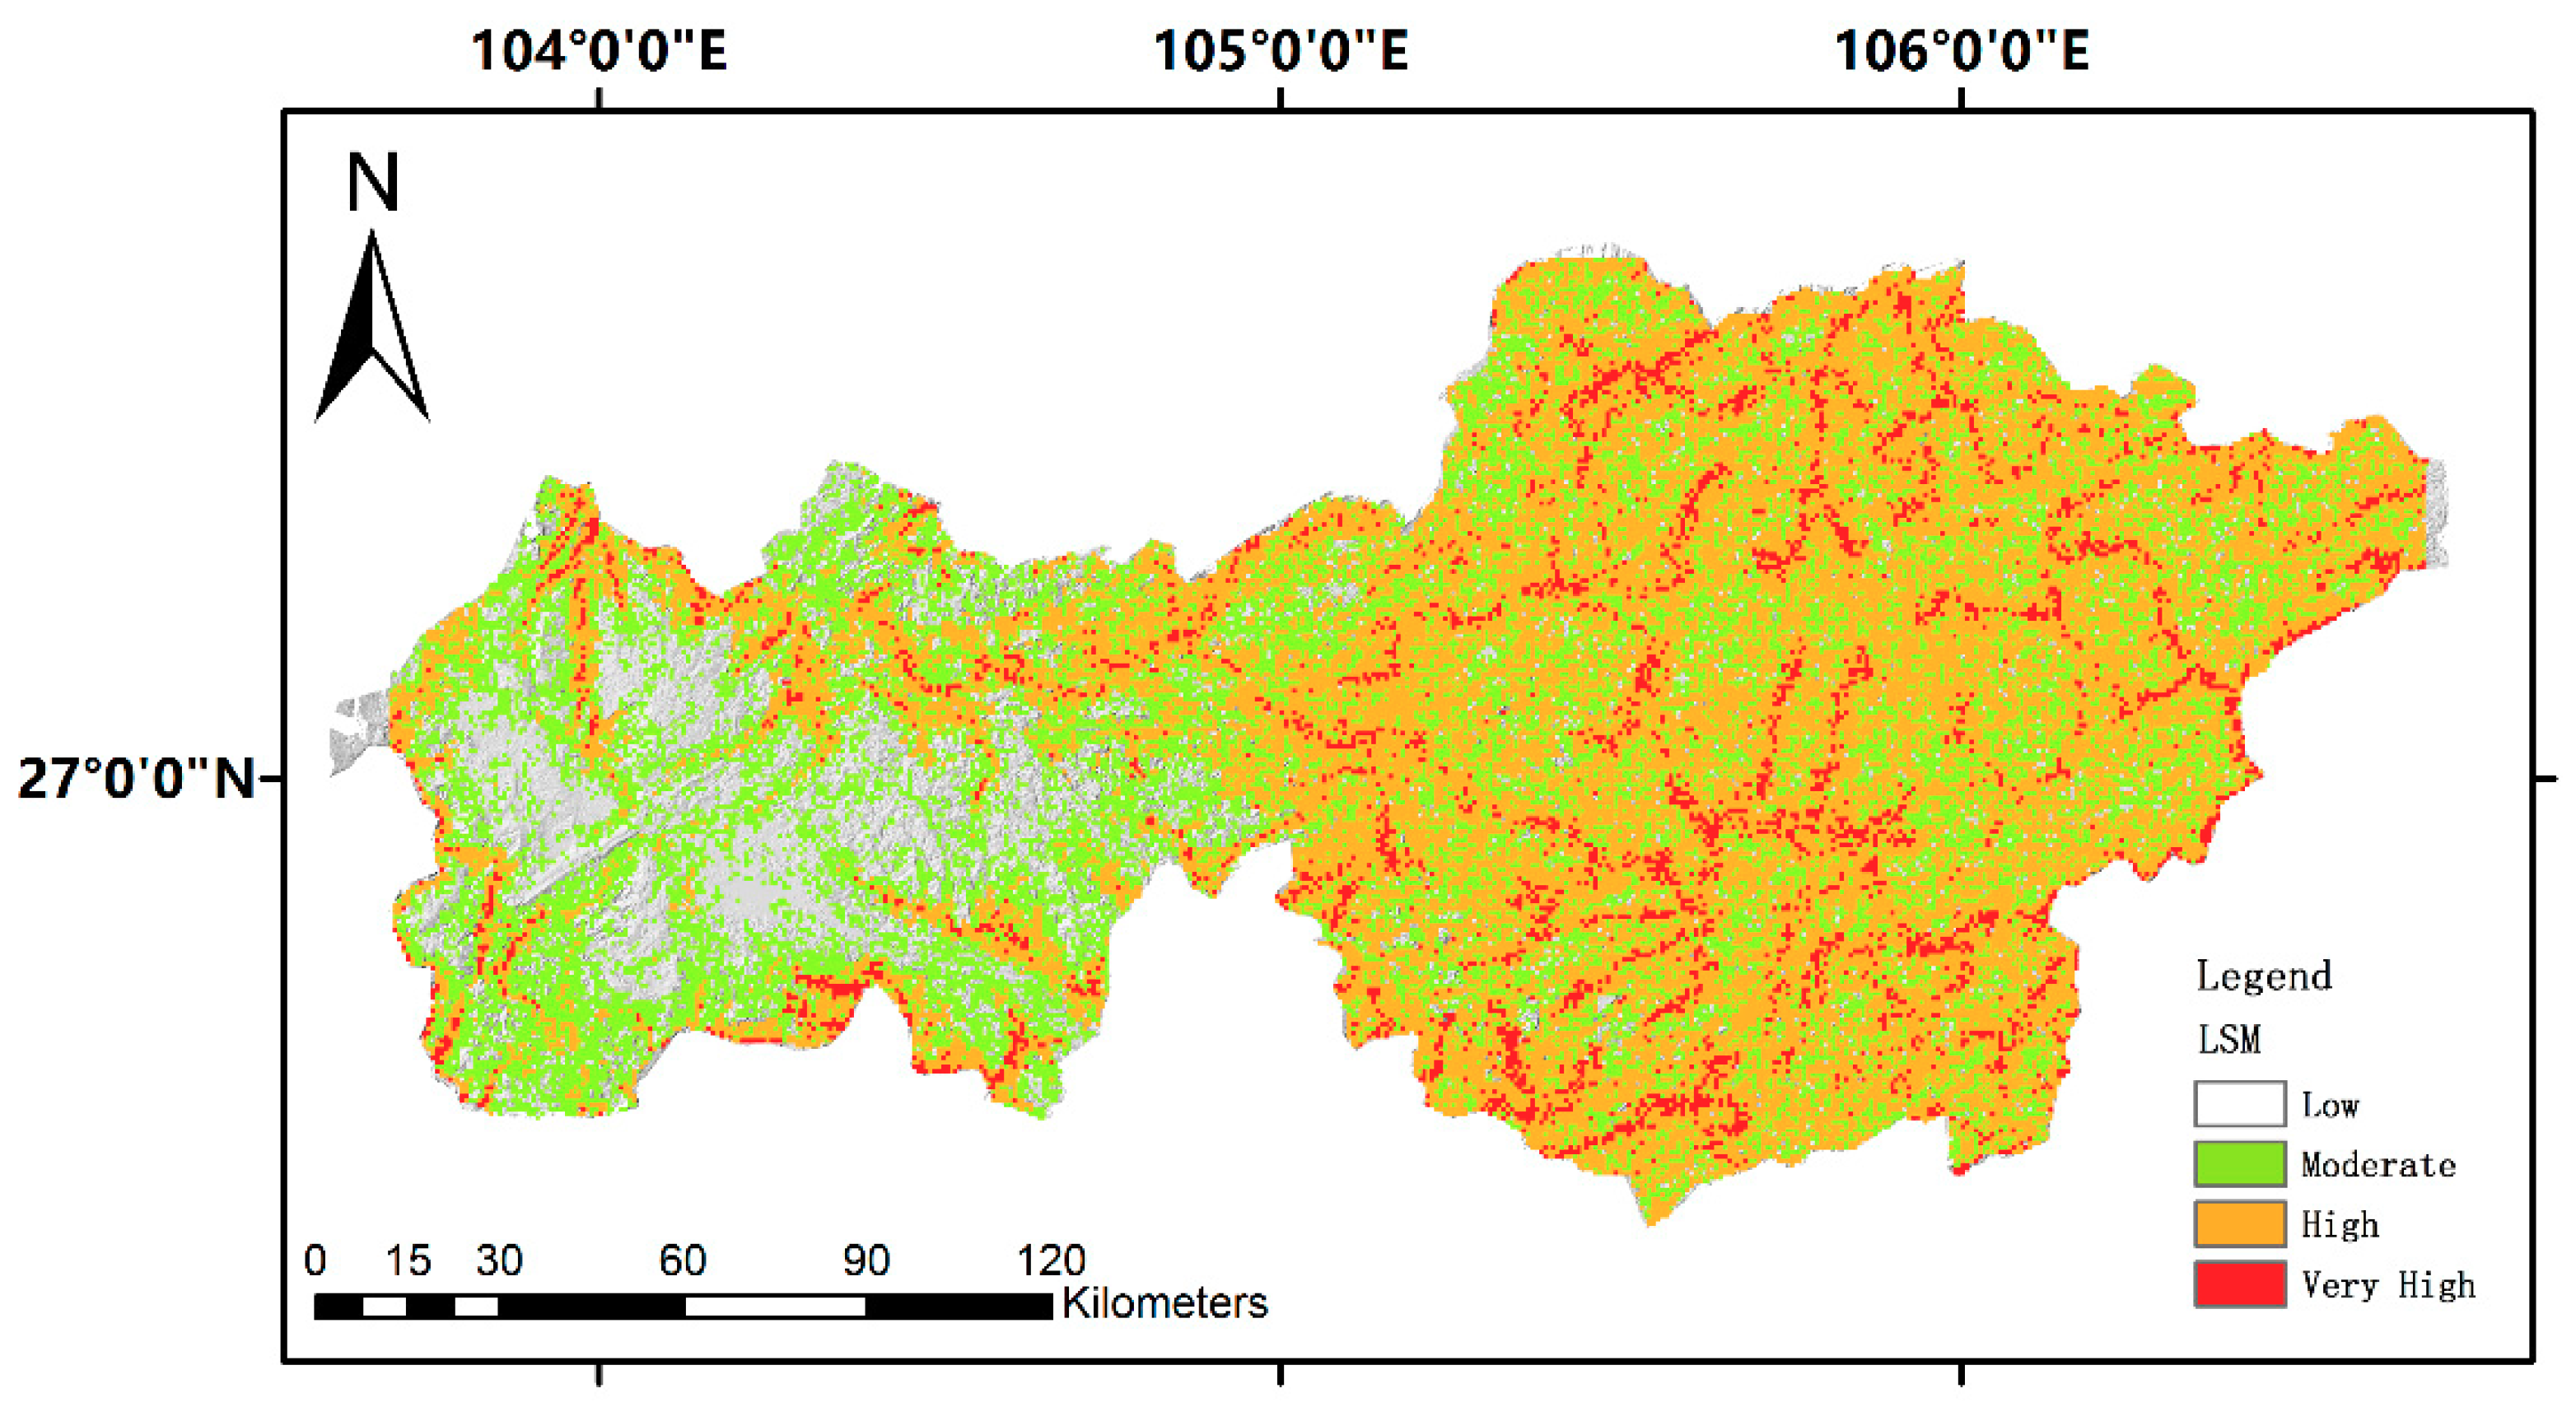
4.1. Landslide Susceptibility Map
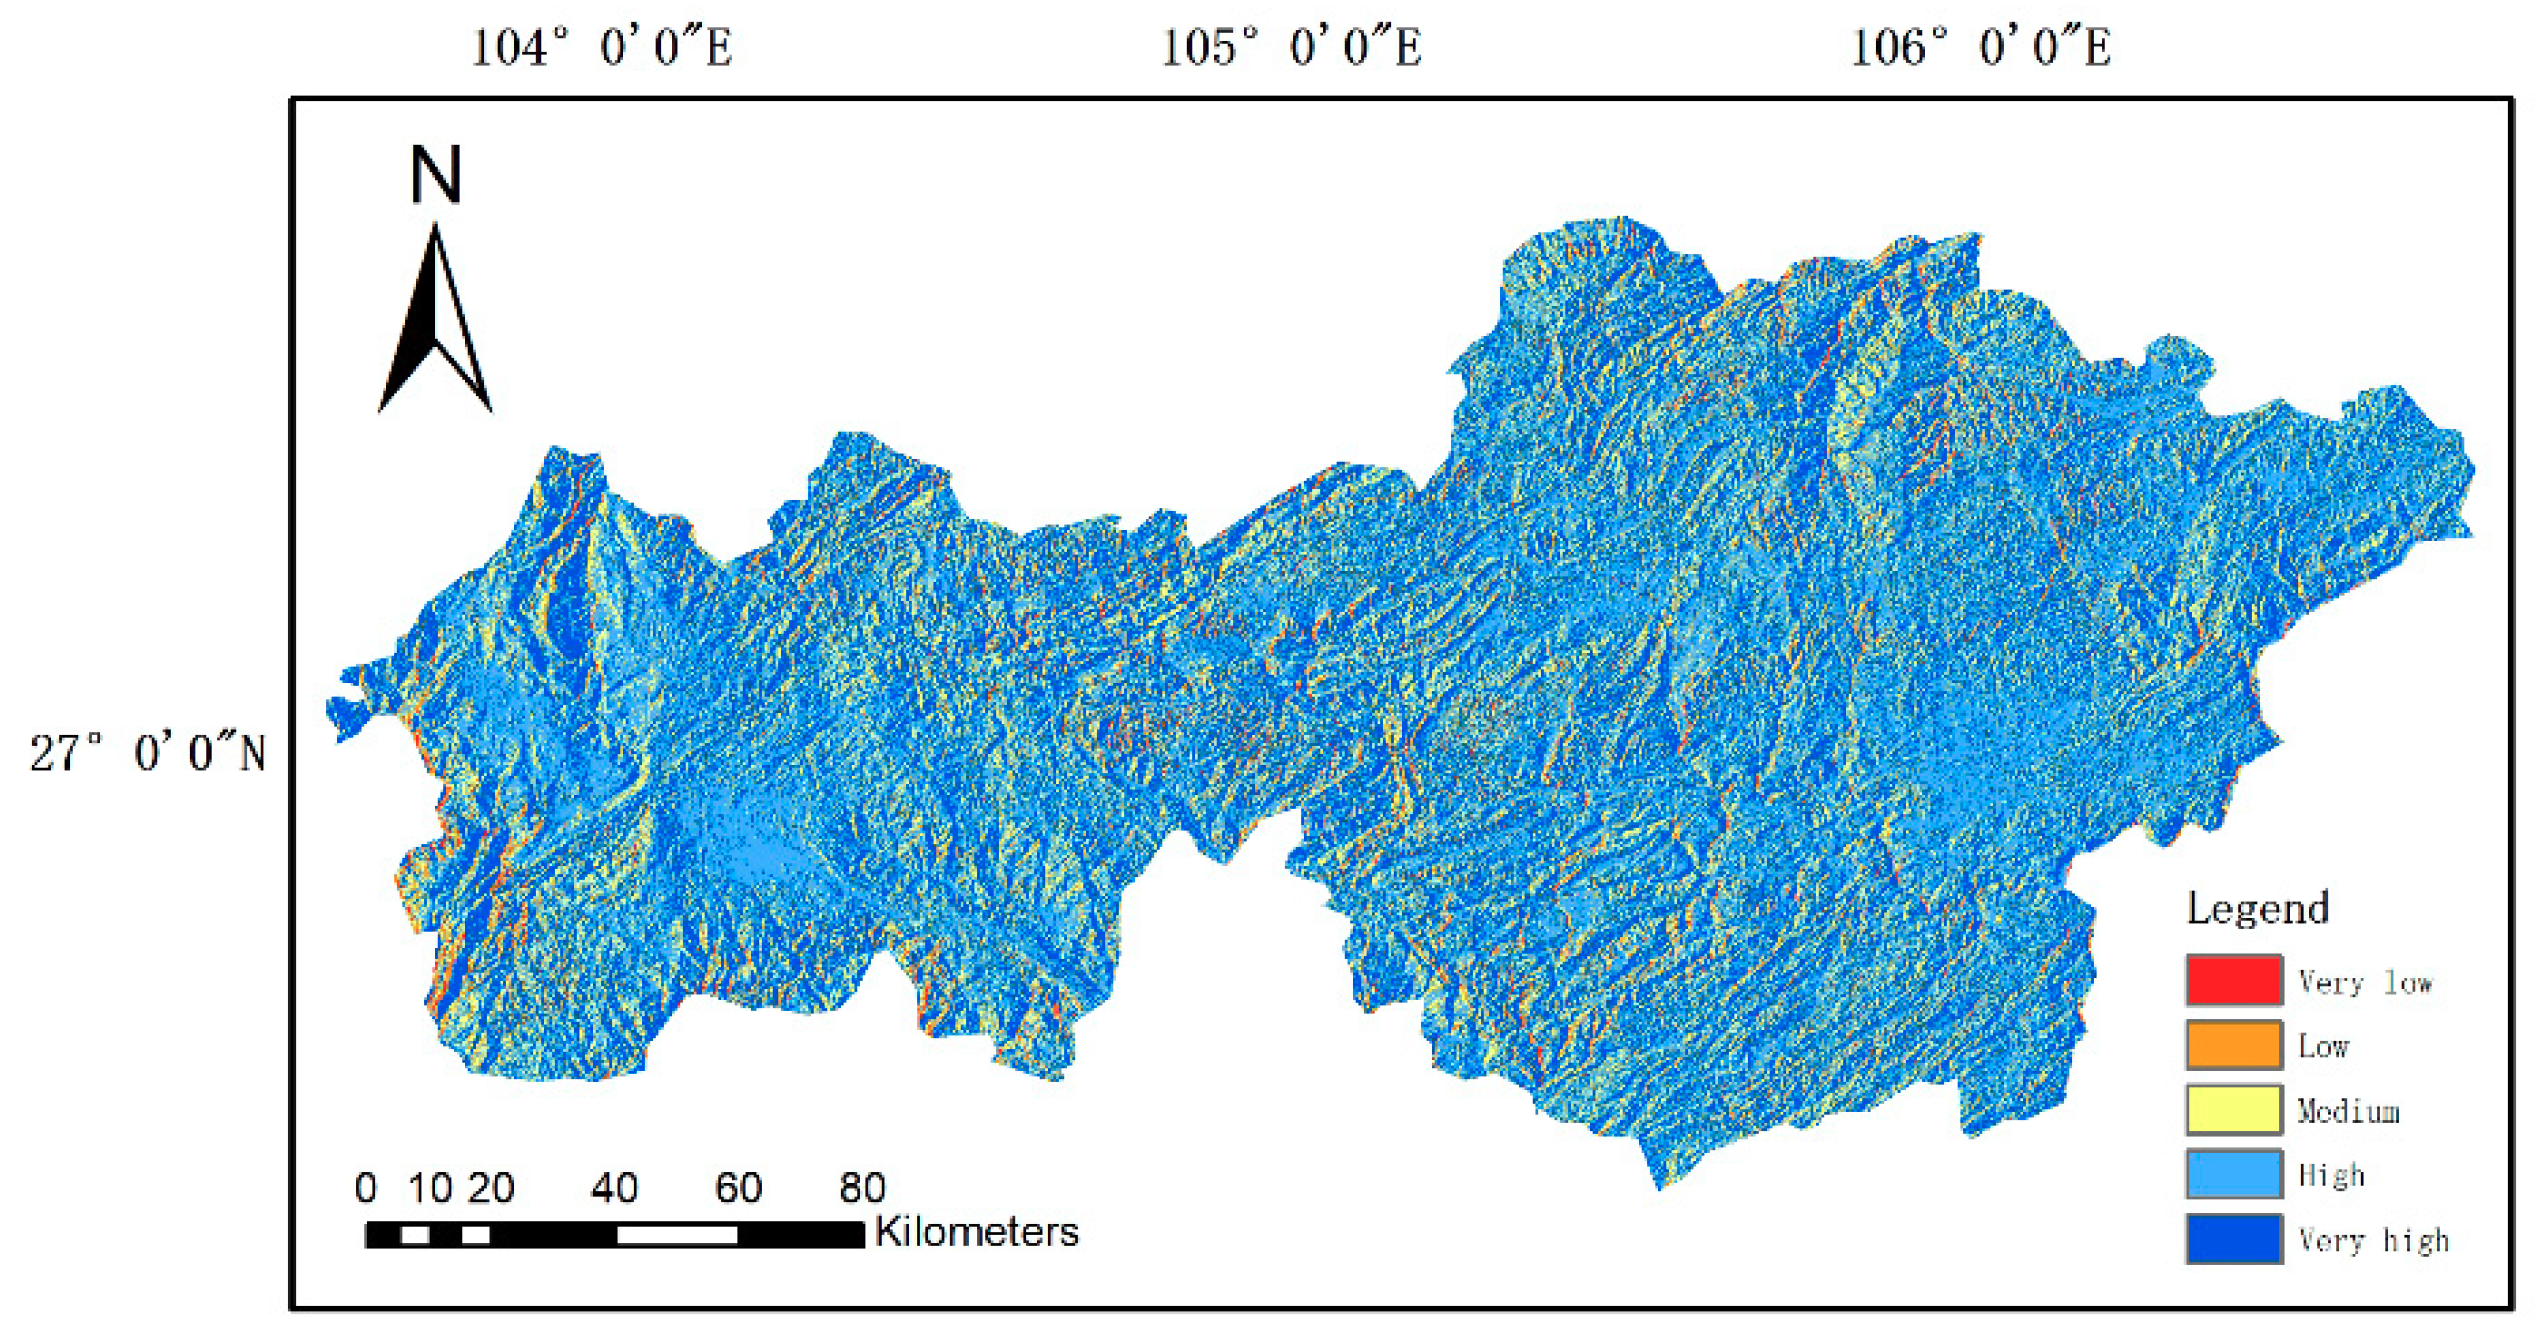
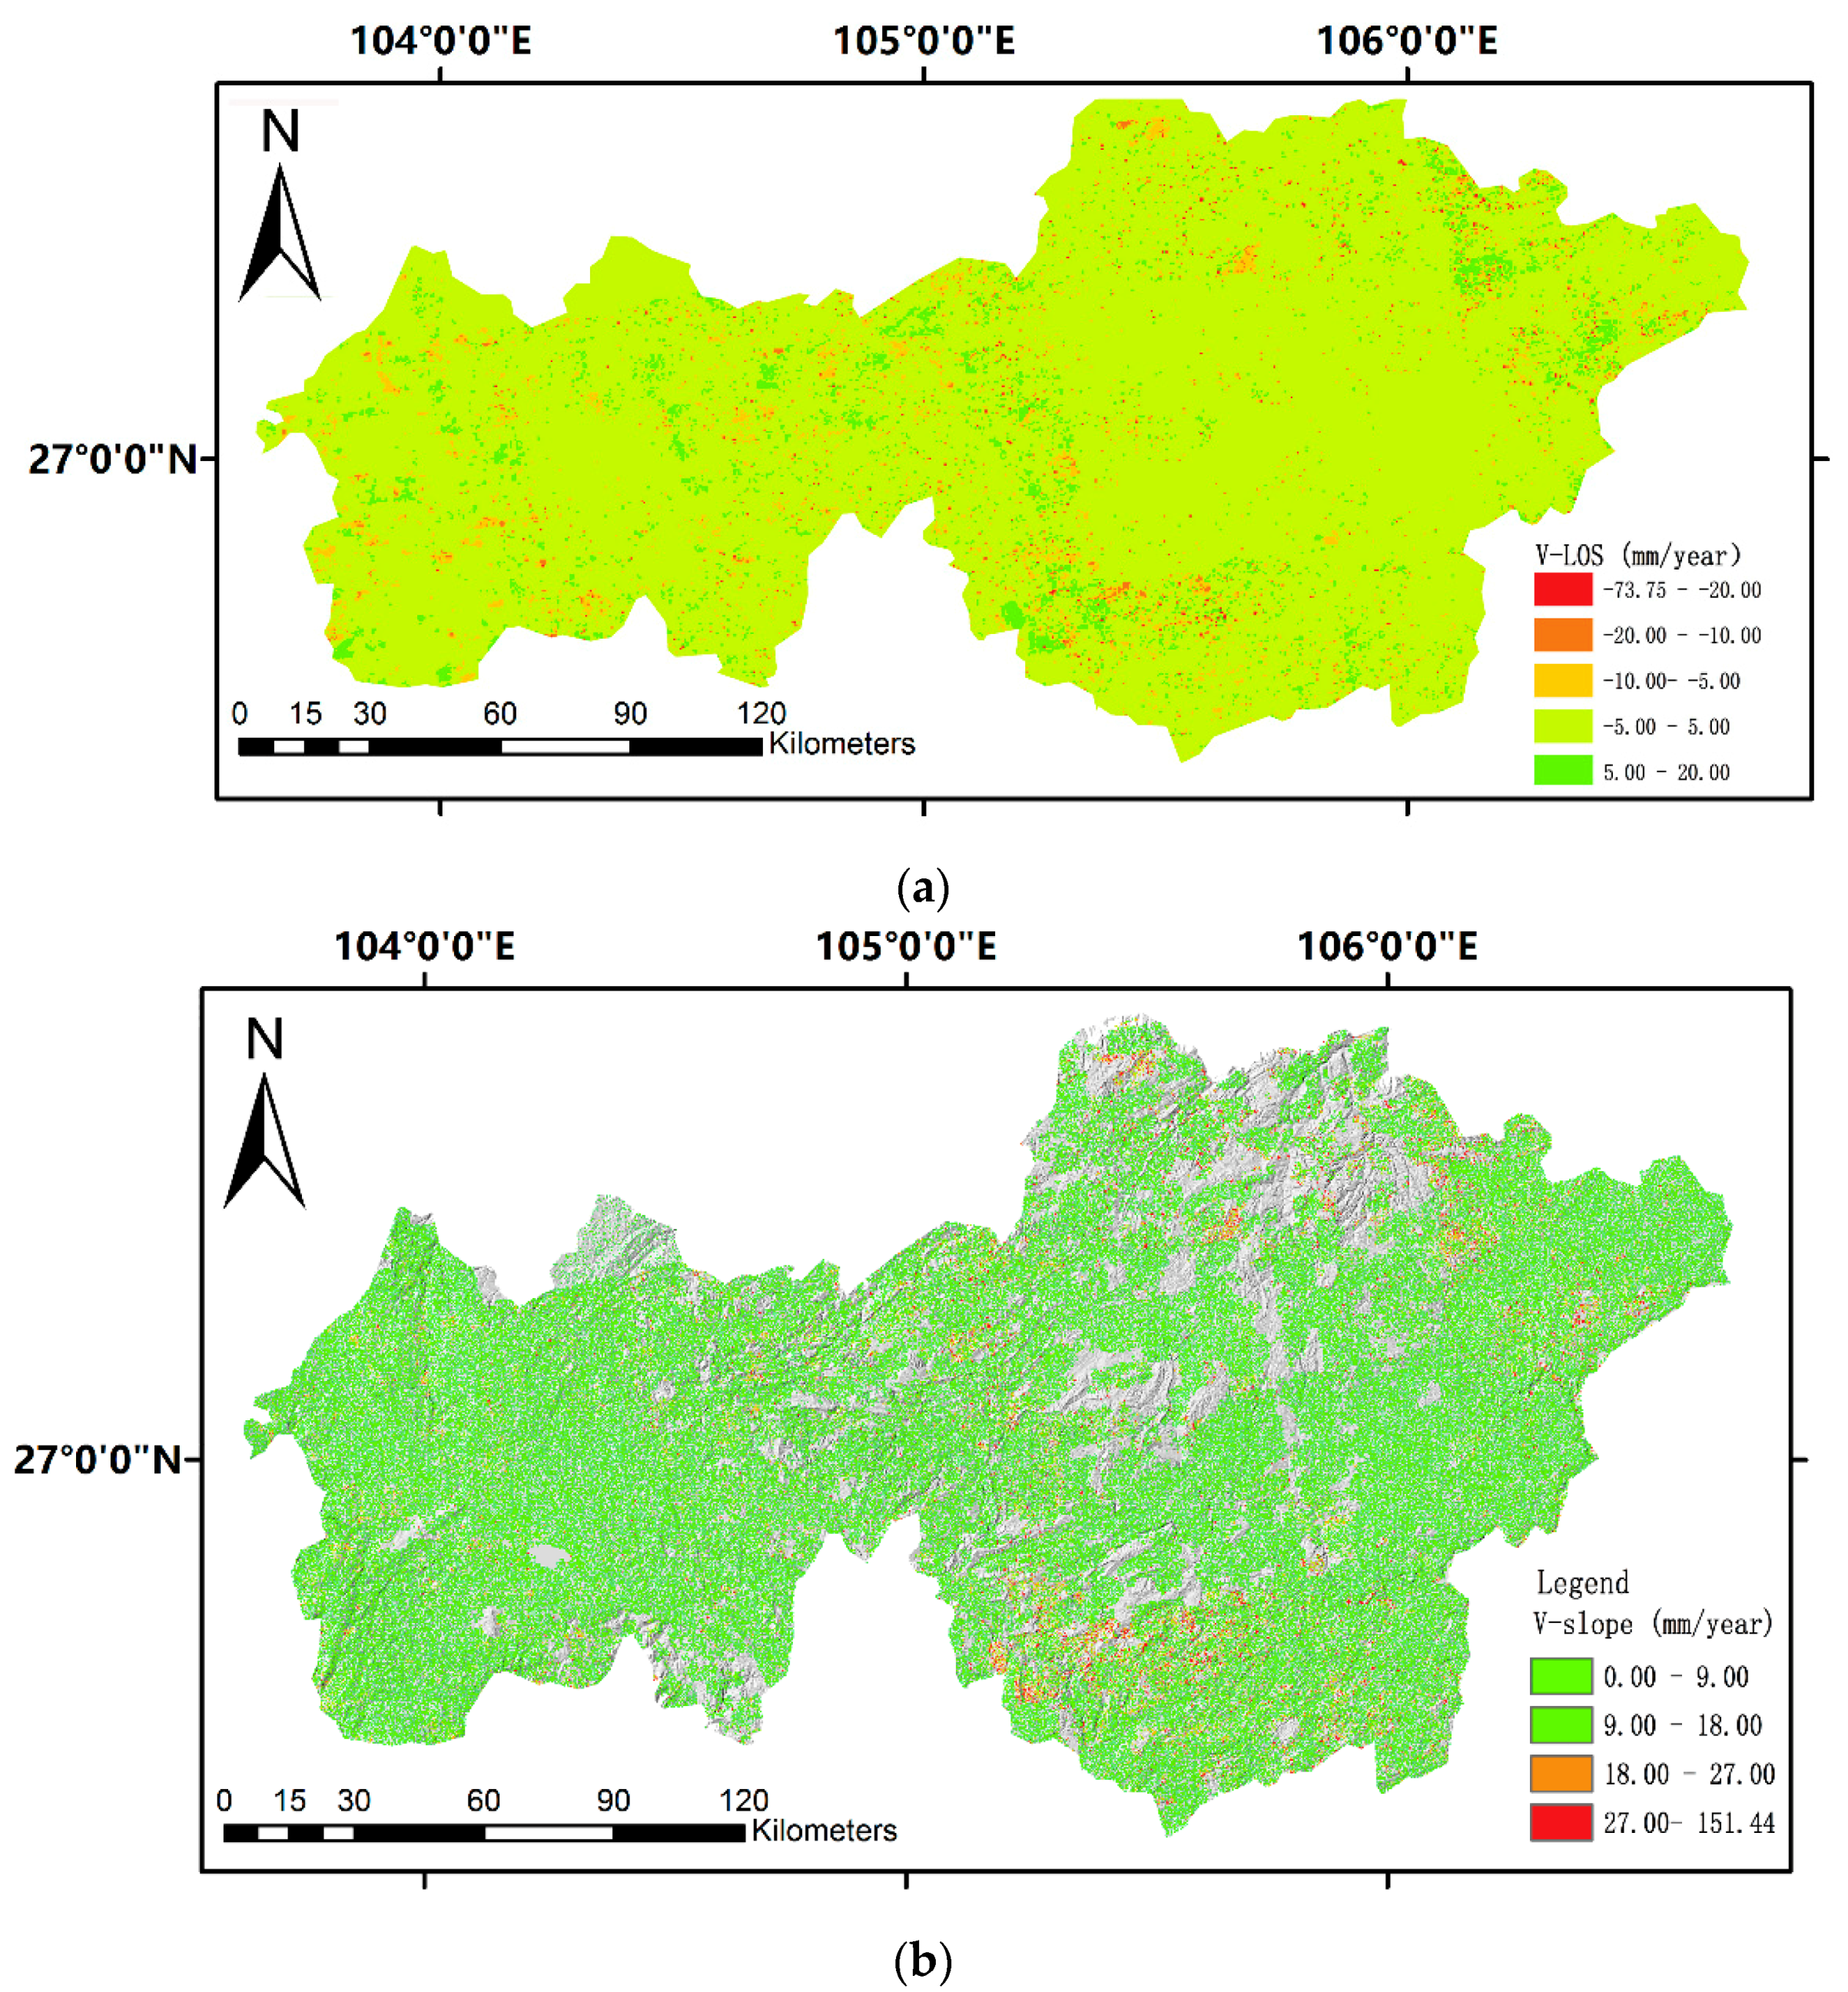
4.2. PSInSAR
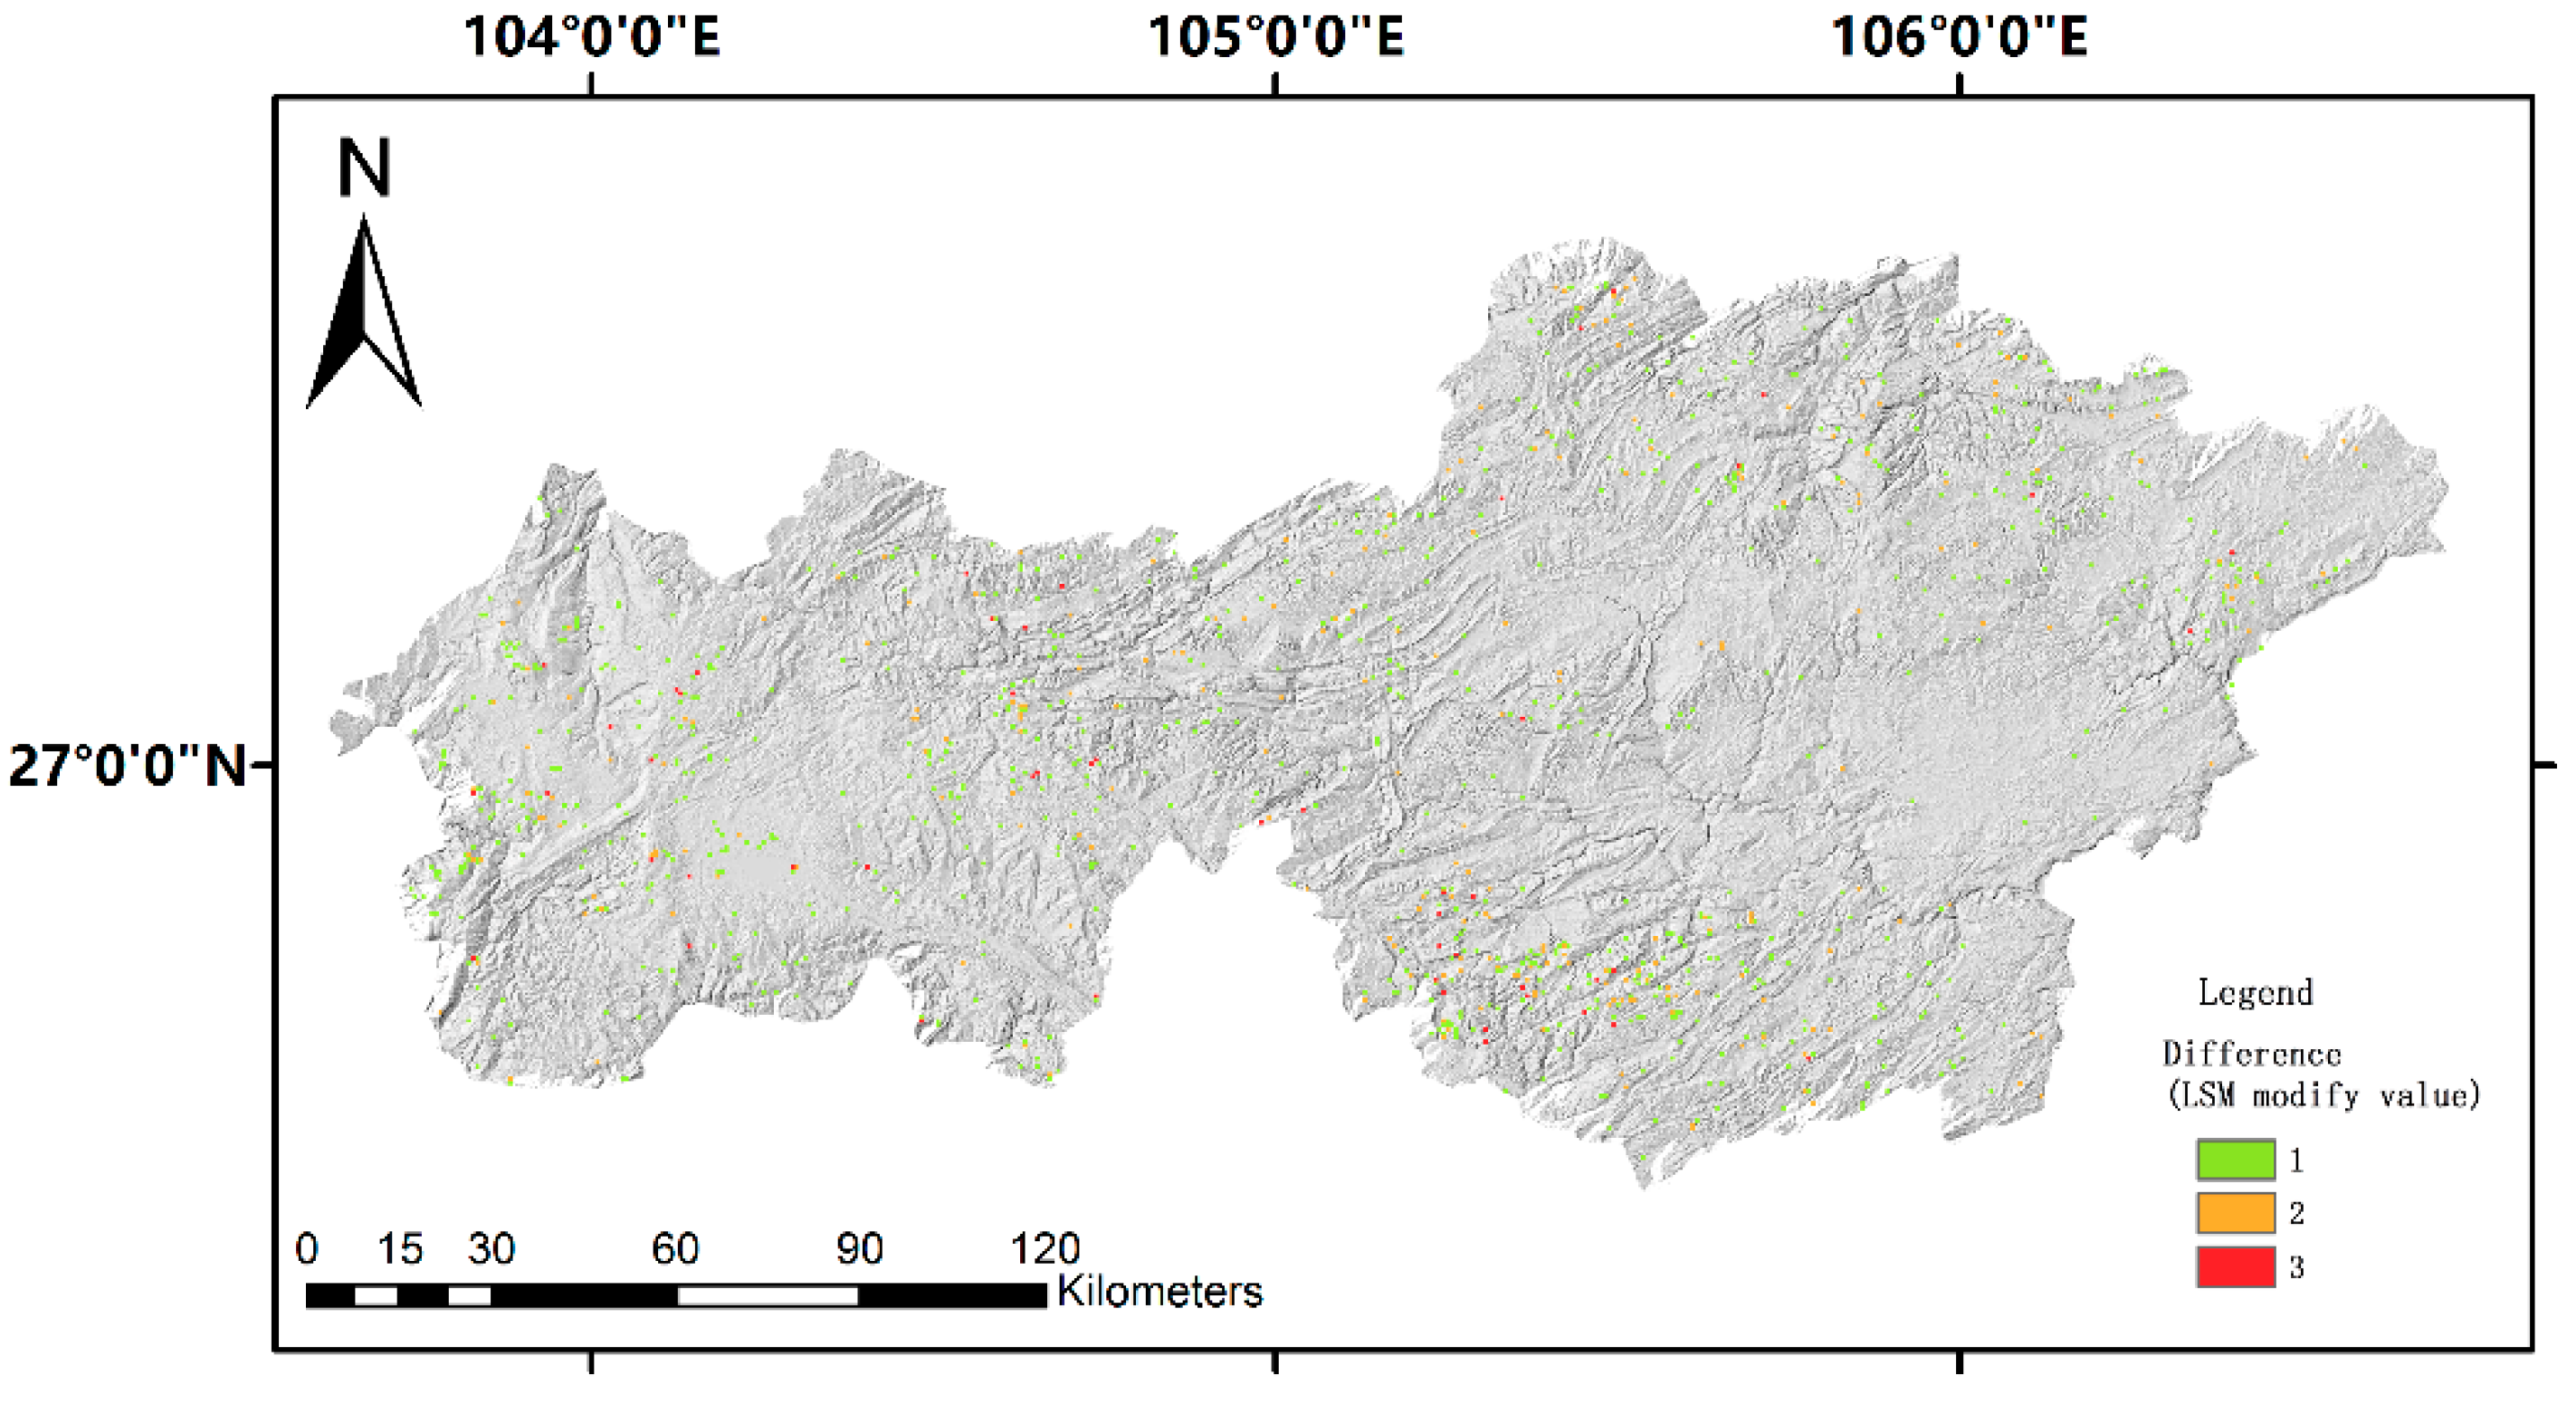
4.3. Integration
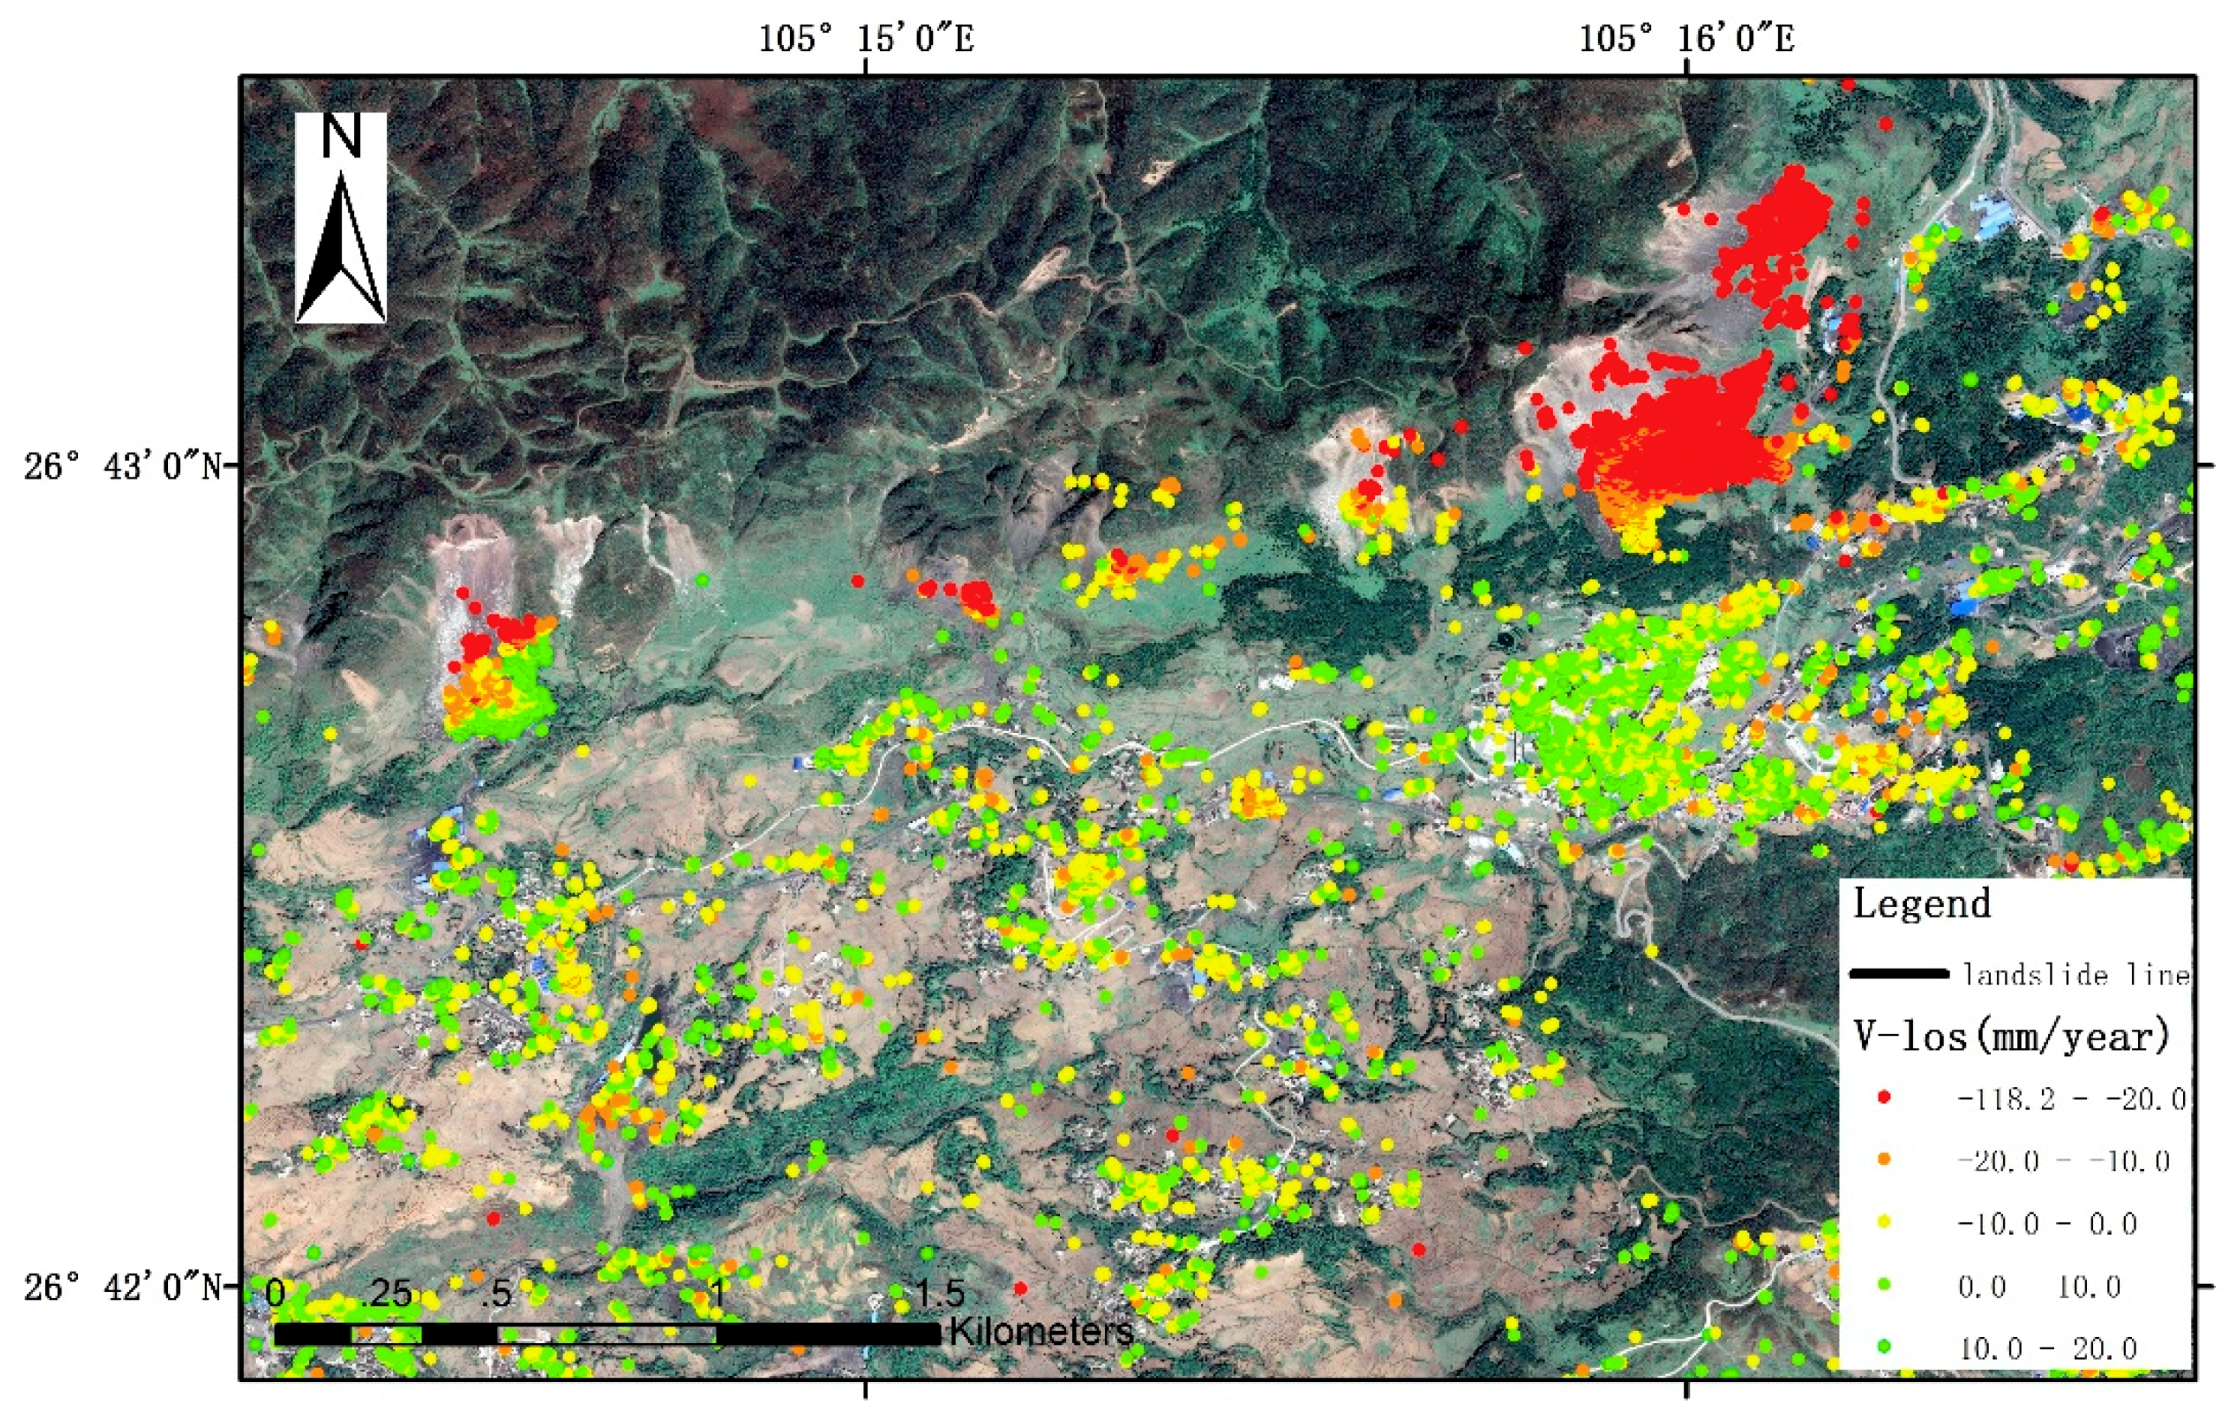
4.3.1. Results of Zongling
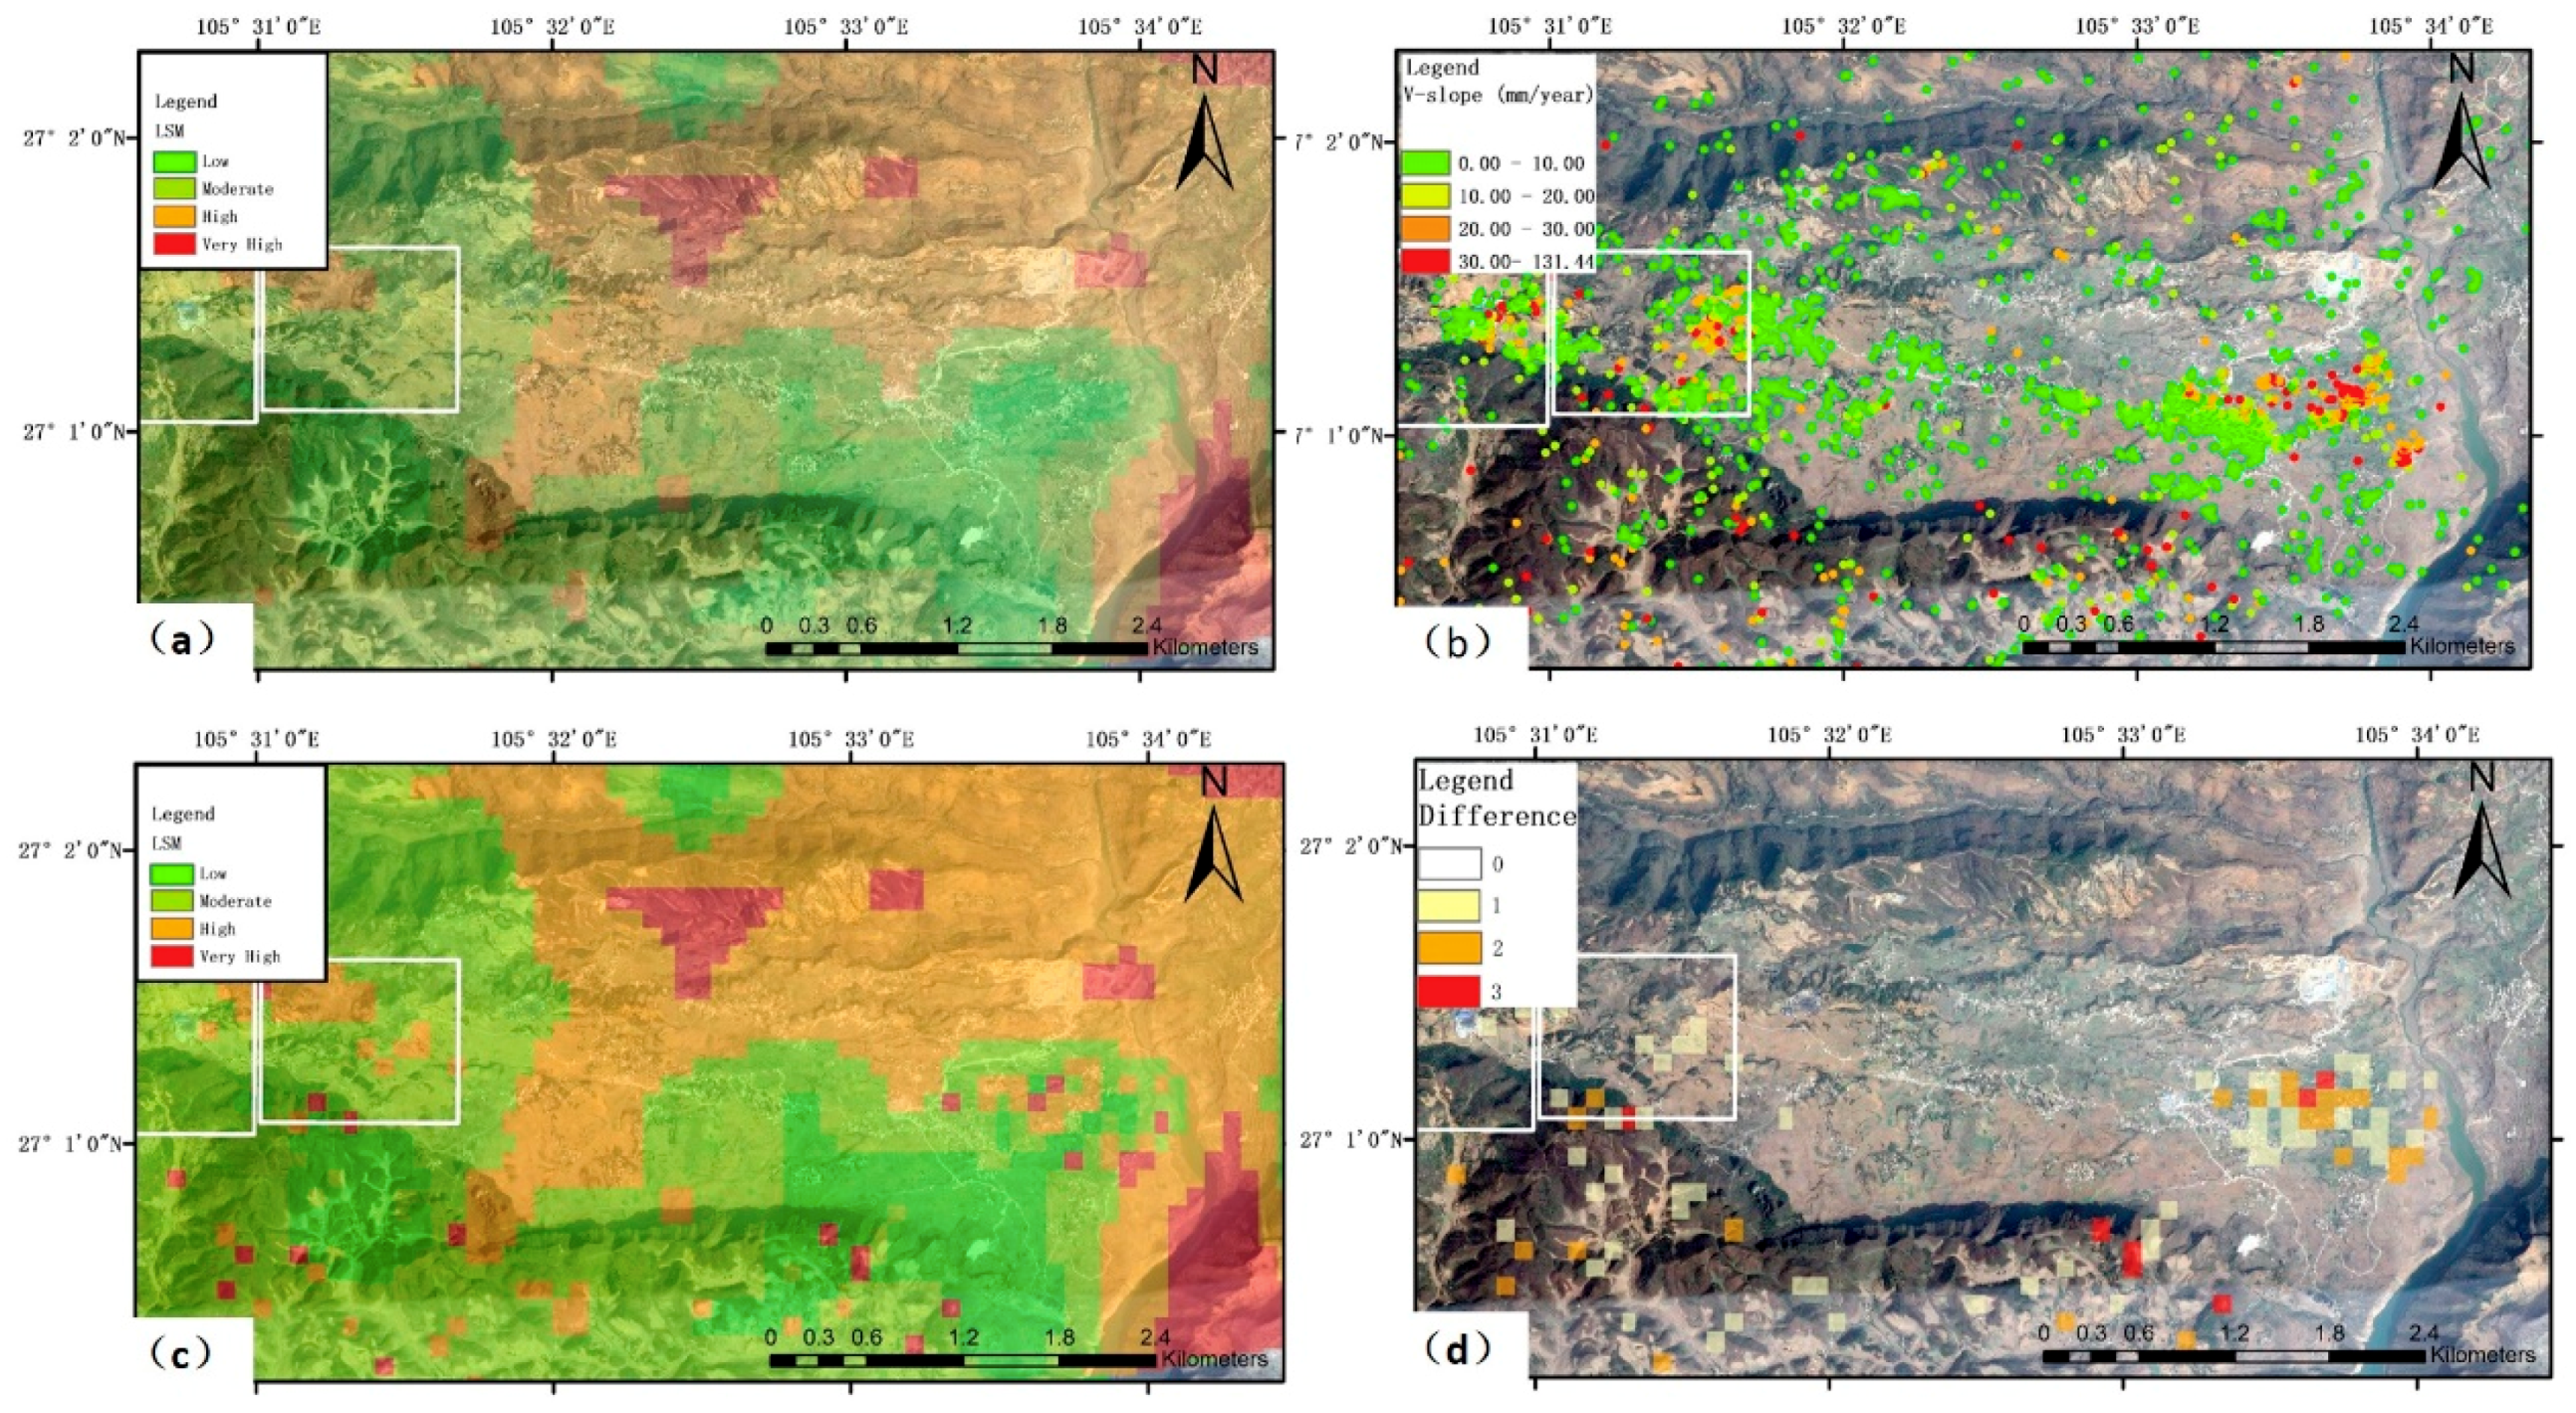
4.3.2. Results of Gaodian
5. Discussion
5.1. Potentials and Limitations of PSInSAR for Karst Region
5.2. Refinement of LSM by Using PSInSAR
6. Conclusions
Author Contributions
Funding
Acknowledgments
Conflicts of Interest
References
- Guzzetti, F.; Mondini, A.C.; Cardinali, M.; Fiorucci, F.; Santangelo, M.; Chang, K.-T. Landslide inventory maps: New tools for an old problem. Earth Sci. Rev. 2012, 112, 42–66. [Google Scholar] [CrossRef]
- Galli, M.; Ardizzone, F.; Cardinali, M.; Guzzetti, F.; Reichenbach, P. Comparing landslide inventory maps. Geomorphology 2008, 94, 268–289. [Google Scholar] [CrossRef]
- van Westen, C.J.; Van Asch, T.W.J.; Soeters, R. Landslide hazard and risk zonation—Why is it still so difficult? Eng. Geol. Environ. 2006, 65, 167–184. [Google Scholar] [CrossRef]
- van Westen, C.J.; Castellanos, A.E.A.; Sekhar, L.K. Spatial data for landslide susceptibility, hazards and vulnerability assessment: An overview. Eng. Geol. 2008, 102, 112–131. [Google Scholar] [CrossRef]
- Prabu, S.; Ramakrishnan, S.S. Combined use of socio economic analysis, remote sensing and GIS data for landslide hazard mapping using ANN. J. Indian Soc. Remote Sens. 2009, 37, 409–421. [Google Scholar] [CrossRef]
- Alimohammadlou, Y.; Najafi, A.; Gokceoglu, C. Estimation of rainfall-induced landslides using ANN and fuzzy clustering methods: A case study in Saeen Slope, Azerbaijan province, Iran. Catena 2014, 120, 149–162. [Google Scholar] [CrossRef]
- Catani, F.; Lagomarsino, D.; Segoni, S.; Tofani, V. Landslide susceptibility estimation by random forests technique: Sensitivity and scaling issues. Nat. Hazard. Earth Syst. Sci. 2013, 13, 2815–2831. [Google Scholar] [CrossRef]
- Reza, P.H.; Norman, K. Random forests and evidential belief function-based landslide susceptibility assessment in Western Mazandaran Province, Iran. Environ. Earth Sci. 2016, 75, 185. [Google Scholar]
- Provost, F.; Hibert, C.; Malet, J.P. Automatic classification of endogenous landslide seismicity using the random forest supervised classifier. Geophys. Res. Lett. 2017, 44, 113–120. [Google Scholar] [CrossRef]
- Yao, X.; Tham, L.G.; Dai, F.C. Landslide susceptibility mapping based on Support Vector Machine: A case study on natural slopes of Hong Kong, China. Geomorphology 2008, 101, 572–582. [Google Scholar] [CrossRef]
- Pradhan, B. A comparative study on the predictive ability of the decision tree support vector machine and neuro-fuzzy models in landslide susceptibility mapping using GIS. Comput. Geosci. 2013, 51, 350–365. [Google Scholar] [CrossRef]
- Lee, S. Application of logistic regression model and its validation for landslide susceptibility mapping using gis and remote sensing data. Int. J. Remote Sens. 2005, 26, 1477–1491. [Google Scholar] [CrossRef]
- Bai, S.B.; Jian, W.; Zhou, P.G.; Hou, S.S.; Xu, S.N. GIS-based logistic regression for landslide susceptibility mapping of the Zhongxian segment in the Three Gorges area, China. Geomorphology 2010, 115, 23–31. [Google Scholar] [CrossRef]
- Singh, L.P.; Westen, C.J.V.; Ray, P.K.C.; Pasquali, P. Accuracy assessment of InSAR derived input maps for landslide susceptibility analysis: A case study from the Swiss Alps. Landslides 2005, 2, 221–228. [Google Scholar] [CrossRef]
- Catani, F.; Casagli, N.; Ermini, L.; Righini, G.; Menduni, G. Landslide hazard and risk mapping at catchment scale in the Arno River basin. Landslides 2005, 2, 329–342. [Google Scholar] [CrossRef]
- Righini, G.; Pancioli, V.; Casagli, N. Updating landslide inventory maps using persistent scatterer interferometry (PSI). Int. J. Remote Sens. 2012, 33, 2068–2096. [Google Scholar] [CrossRef]
- Yang, C.S.; Zhang, Q.; Zhao, C.Y.; Wang, Q.L.; Ji, L.Y. Monitoring land subsidence and fault deformation using the small baseline subset InSAR technique: A case study in the Datong Basin, China. J. Geodyn. 2014, 75, 34–40. [Google Scholar] [CrossRef]
- Kang, Y.; Zhao, C.Y.; Zhang, Q.; Lu, Z.; Li, B. Application of insar techniques to an analysis of the guanling landslide. Remote Sens. 2017, 9, 1046. [Google Scholar] [CrossRef]
- Calabro, M.D.; Schmidt, D.A.; Roering, J.J. An examination of seasonal deformation at the Portuguese Bend landslide, southern California, using radar interferometry. J. Geophys. Res. 2010, 115, F02020. [Google Scholar] [CrossRef]
- Zhao, C.Y.; Lu, Z.; Zhang, Q.; Fuente, J.D.L. Large-area landslide detection and monitoring with ALOS/PALSAR imagery data over Northern California and Southern Oregon, USA. Remote Sens. Environ. 2012, 124, 348–359. [Google Scholar] [CrossRef]
- Colesanti, C.; Wasowski, J. Investigating landslides with space-borne Synthetic Aperture Radar (SAR) interferometry. Eng. Geol. 2006, 88, 173–199. [Google Scholar] [CrossRef]
- Oliveira, S.C.; Nico, G.; Zêzere, J.L.; Catalão, J.; Garcia, R.A.C.; Benevides, P. Application of Persistent Scatterers deformation inventories to assess regional landslide susceptibility. EGU Gen. Assem. 2010, 12, 6143. [Google Scholar]
- Ciampalini, A.; Raspini, F.; Frodella, W.; Bardi, F.; Bianchini, S.; Moretti, S. The effectiveness of high-resolution LiDAR data combined with PSInSAR data in landslide study. Landslides 2016, 13, 399–410. [Google Scholar] [CrossRef]
- Bednarik, M.; Magulová, B.; Matys, M.; Marschalko, M. Landslide susceptibility assessment of the Kralovany-Liptovsky Mikulas railway case study. Phys. Chem. Earth 2010, 35, 162–171. [Google Scholar] [CrossRef]
- Yin, Y.P.; Huang, B.L.; Wang, W.P.; Wei, Y.J.; Ma, X.H.; Ma, F.; Zhao, C.J. Reservoir-induced landslides and risk control in Three Gorges Project on Yangtze River, China. J. Rock Mech. Geotech. Eng. 2016, 8, 577–595. [Google Scholar] [CrossRef]
- Li, L.; Huang, M.; Liu, Z.J.; Xu, Q.L.; Tong, X.J.; Liu, P.L. RS & GIS-based evaluation of landslide hazard in Bijie Prefecture, Guizhou Province. J. Nat. Dis. 2011, 20, 177–182. [Google Scholar]
- Cheng, W.; Yang, R.D.; Zhang, Q.; Cui, Y.C.; Gao, J.B. Distribution characteristics, occurrence modes and controlling factors of trace elements in Late Permian coal from Bijie City, Guizhou Province. J. China Coal Soc. 2013, 38, 103–113. [Google Scholar]
- Wang, L.G.; Wang, Z.F.; Xu, S.R.; Zhou, W.G.; Wu, J.H. A field investigation of the deformation of protected coal and its application for CBM extraction in the Qinglong coalmine in China. J. Nat. Gas Sci. Eng. 2015, 27, 367–373. [Google Scholar] [CrossRef]
- Wang, Q.; Yang, R. Study on REEs as tracers for late permian coal measures in Bijie City, Guizhou Province, China. J. Rare Earths 2008, 26, 121–126. [Google Scholar] [CrossRef]
- Ferretti, A.; Prati, C.; Rocca, F. Permanent scatterers in SAR interferometry. IEEE Trans. Geosci. Remote Sens. 2001, 39, 8–20. [Google Scholar] [CrossRef]
- Taskin, K.; Kutlug, S.E.; Ismail, C. Landslide susceptibility mapping using GIS-based multi-criteria decision analysis, support vector machines, and logistic regression. Landslides 2014, 11, 425–439. [Google Scholar]
- Marjanović, M.; Kovačević, M.; Bajat, B.; Voženílek, V. Landslide susceptibility assessment using svm machine learning algorithm. Eng. Geol. 2011, 123, 225–234. [Google Scholar] [CrossRef]
- Hong, H.Y.; Liu, J.Z.; Zhu, A.X.; Shahabi, H.; Pham, B.T.; Chen, W.; Pradhan, B.; Bui, D.T. A novel hybrid integration model using support vector machines and random subspace for weather-triggered landslide susceptibility assessment in the Wuning area (China). Environ. Earth Sci. 2017, 76, 652. [Google Scholar] [CrossRef]
- Zhao, C.Y.; Kang, Y.; Zhang, Q.; Lu, Z.; Li, B. Landslide Identification and Monitoring along the Jinsha River Catchment (Wudongde Reservoir Area), China, Using the InSAR Method. Remote Sens. 2018, 10, 993. [Google Scholar] [CrossRef]
- Zhao, C.Y.; Lu, Z. Remote sensing of landslides—A review. Remote Sens. 2018, 10, 279. [Google Scholar] [CrossRef]
- Su, Q.M.; Zhang, J.; Zhao, S.; Wang, L.; Liu, J.; Guo, J. Comparative Assessment of Three Nonlinear Approaches for Landslide Susceptibility Mapping in a Coal Mine Area. ISPRS Int. J. Geoinf. 2017, 6, 228. [Google Scholar] [CrossRef]
- Berardino, P.; Fornaro, G.; Lanari, R.; Sansosti, E. A new Algorithm for Surface Deformation Monitoring based on Small Baseline Differential SAR Interferograms. IEEE Trans. Geosci. Remote Sens. 2002, 40, 2375–2383. [Google Scholar] [CrossRef]
- Ferretti, A.; Fumagalli, A.; Novali, F.; Prati, C.; Rocca, F.; Rucci, A. A New Algorithm for Processing Interferometric Data-Stacks: SqueeSAR. IEEE Trans. Geosci. Remote Sens. 2011, 49, 3460–3470. [Google Scholar] [CrossRef]
- Goel, K.; Adam, N. An advanced algorithm for deformation estimation in non-urban areas. ISPRS J. Photogramm. Remote Sens. 2012, 73, 100–110. [Google Scholar] [CrossRef]
- Vasco, D.W.; Rutqvist, J.; Ferretti, A.; Rucci, A.; Bellotti, F.; Dobson, P. Monitoring deformation at The Geysers Geothermal Field, California using C-band and X-band interferometric synthetic aperture radar. Geophys. Res. Lett. 2013, 40, 2567–2572. [Google Scholar] [CrossRef]
- Notti, D.; Calò, F.; Cigna, F.; Manunta, M.; Herrera, G.; Berti, M. A User-Oriented Methodology for DInSAR Time Series Analysis and Interpretation: Landslides and Subsidence Case Studies. J. Appl. Geophys. 2015, 172, 3081–3105. [Google Scholar] [CrossRef]
- Xie, C.; Xu, J.; Shao, Y.; Cui, B.S.; Goel, K.; Zhang, Y.J.; Yuan, M.H. Long term detection of water depth changes of coastal wetlands in the Yellow River Delta based on distributed scatterer interferometry. Remote Sens. Environ. 2015, 164, 238–253. [Google Scholar] [CrossRef][Green Version]


| Sensor | RADARSAT-2 | Sentinel-1 |
|---|---|---|
| Band | C | C |
| Acquisition orbit | Ascending | Descending |
| Incidence angle (°) | 35.2 | 33.9 |
| Swath width (km) | 125 | 240 |
| Repeat cycle (days) | 24 | 12 |
| Number of images | 130 | 41 |
| Ground resolution (m) | 5 | 20 |
| Temporal range | 9 April 2017–28 July 2019 | 4 January 2018–24 July 2019 |
| Vslope (mm/year) | |||||
|---|---|---|---|---|---|
| LSM | 0–10 | 10–20 | 20–30 | >30 | |
| 1 | 0 | +1 | +2 | +3 | |
| 2 | 0 | 0 | +1 | +2 | |
| 3 | 0 | 0 | 0 | +1 | |
| 4 | 0 | 0 | 0 | 0 | |
© 2019 by the authors. Licensee MDPI, Basel, Switzerland. This article is an open access article distributed under the terms and conditions of the Creative Commons Attribution (CC BY) license (http://creativecommons.org/licenses/by/4.0/).
Share and Cite
Shen, C.; Feng, Z.; Xie, C.; Fang, H.; Zhao, B.; Ou, W.; Zhu, Y.; Wang, K.; Li, H.; Bai, H.; et al. Refinement of Landslide Susceptibility Map Using Persistent Scatterer Interferometry in Areas of Intense Mining Activities in the Karst Region of Southwest China. Remote Sens. 2019, 11, 2821. https://doi.org/10.3390/rs11232821
Shen C, Feng Z, Xie C, Fang H, Zhao B, Ou W, Zhu Y, Wang K, Li H, Bai H, et al. Refinement of Landslide Susceptibility Map Using Persistent Scatterer Interferometry in Areas of Intense Mining Activities in the Karst Region of Southwest China. Remote Sensing. 2019; 11(23):2821. https://doi.org/10.3390/rs11232821
Chicago/Turabian StyleShen, Chaoyong, Zhongke Feng, Chou Xie, Haoran Fang, Binbin Zhao, Wenhao Ou, Yu Zhu, Kai Wang, Hongwei Li, Honglin Bai, and et al. 2019. "Refinement of Landslide Susceptibility Map Using Persistent Scatterer Interferometry in Areas of Intense Mining Activities in the Karst Region of Southwest China" Remote Sensing 11, no. 23: 2821. https://doi.org/10.3390/rs11232821
APA StyleShen, C., Feng, Z., Xie, C., Fang, H., Zhao, B., Ou, W., Zhu, Y., Wang, K., Li, H., Bai, H., Mannan, A., & Chen, P. (2019). Refinement of Landslide Susceptibility Map Using Persistent Scatterer Interferometry in Areas of Intense Mining Activities in the Karst Region of Southwest China. Remote Sensing, 11(23), 2821. https://doi.org/10.3390/rs11232821