Article

Analysis and Classification of Natural and Human-Induced Ground Deformations at Regional Scale (Campania, Italy) Detected by Satellite Synthetic-Aperture Radar Interferometry Archive Datasets

Consiglio Nazionale delle Ricerche, Istituto di Scienze Marine (CNR-ISMAR), 80133 Naples, Italy
Remote Sens. 2019, 11(23), 2822; https://doi.org/10.3390/rs11232822
Submission received: 6 November 2019 / Revised: 21 November 2019 / Accepted: 26 November 2019 / Published: 28 November 2019

Abstract

:
The high levels of geo-hydrological, seismic, and volcanic hazards in the Campania region prompted full data collection from C-band satellites ERS-1/2, ENVISAT, and RADARSAT within regional (TELLUS) and national (PST-A) projects. The quantitative analysis, interpretation, and classification of natural and human-induced slow-rate ground deformations across a span of two decades (1992–2010) was performed at regional scale (Campania, Italy) by using interferometric archive datasets, based on the Persistent Scatterer Interferometry approach. As radar satellite sensors have a side-looking view, the post-processing of the interferometric datasets allows for the evaluation of two spatial components (vertical and E-W horizontal ones) of ground deformation, while the N-S horizontal component cannot be detected. The ground deformation components have been analyzed across 89.5% of the Campania territory within a variety of environmental, topographical, and geological conditions. The main part (57%) of the regional territory was characterized during 1992–2010 by stable areas, where SAR signals do not have recorded significant horizontal and vertical components of ground deformation with an average annual rate greater than +1 mm/yr or lower than −1 mm/yr. Within the deforming areas, the coastal plains are characterized by widespread and continuous strong subsidence signals due to sediment compaction locally enhanced by human activity, while the inner plain sectors show mainly scattered spots with locally high subsidence in correspondence of urban areas, sinkholes, and groundwater withdrawals. The volcanic sectors show interplaying horizontal and vertical trends due to volcano-tectonic processes, while in the hilly and mountain inner sectors the ground deformation is mainly controlled by large-scale tectonic activity and by local landslide activity. The groundwater-related deformation is the dominant cause of human-caused ground deformation. The results confirm the importance of using Persistent Scatterer Interferometry data for a comprehensive understanding of rates and patterns of recent ground deformation at regional scale also within tectonically active areas as in Campania region.

Graphical Abstract

1. Introduction

Slow rate deformations of the ground surface can be caused by both natural dynamic processes (landslide, subsidence, groundwater oscillations; glacial, volcanic, and tectonic activity) and human activity (extraction of ground water and hydrocarbons, injection of fluids, exploitation of geothermal fields, mining, tunneling, excavation). These deformations can be measured by means of several geodetic tools, such as topographic leveling, GPS, aerial photogrammetry, and LIDAR surveys, but the interferometric processing of satellite Synthetic Aperture Radar (SAR) images is the most effective technique for local to regional scale analysis [1,2,3,4,5,6,7]. In fact, since the early 90s, several techniques based on the satellite-based SAR Interferometry (InSAR) have been developed and used to assess ground-surface deformation, following two different approaches to extract information from the phase values of SAR images: Differential SAR Interferometry (DInSAR) and Multi-Temporal SAR Interferometry (MT-InSAR) [8,9].
In Italy, the Ministry of Environment and Protection of Land and Sea (MATTM) issued in 2008 the Not-Ordinary Plan of Environmental Remote Sensing (PST-A), in order to develop a national database of active ground deformations affecting the Italian territory for contributing to territorial management and decision-makers’ activities, and supporting topography, cartography, modelling, and GIS activities [10,11]. The PST-A led to the development of SAR images through interferometric technique acquired by satellites ERS-1/2 and ENVISAT. The exploitation of interferometric products provided Persistent Scatterer (PS) ground deformation measurements over all the Italian territory that are available on a dedicated webGIS server (http://www.pcn.minambiente.it/viewer/).
The high levels of geo-hydrological, seismic, and volcanic hazards in the Campania region prompted full data collection from ERS-1/2 and RADARSAT satellites [12] to regional and national stakeholders for gaining a complete environmental monitoring of the territory. A first regional analysis of ground deformations affecting the Campania territory, Italy (Figure 1) was made by Vilardo et al. [5] referring to 1992–2000 by using a single satellite (ERS-1/2) dataset. Thereafter, several individual sites in Campania region have been examined in detail (see for example in [12,13,14,15,16,17,18]), but an updated, regional-scale, synoptic view of anthropogenic and natural deformation is still lacking.
The main aims of the present study are the quantitative analysis, classification, and interpretation of the slow-rate ground deformation processes, which have characterized the whole regional territory of Campania (Italy) across a span of two decades (1992–2010). The analysis strategy for the study area (Campania) is strongly supported by the availability of radar image datasets of different satellites. All the freely available, already processed interferometric products concerning the Campania territory [19,20,21,22,23] have been collected and systematically post-processed to recognize vertical and horizontal components of ground deformation. The source data were obtained from interferometric processing of radar scenes from European Space Agency (ESA), i.e., ERS-1/2 (1992–2001) and ENVISAT (2002–2010), and the Canadian RADARSAT (2003–2007) C-band satellites [19,20,21,22,23].
An inventory of areas affected by anthropogenic and/or natural deformation signals in Campania regional territory over the period 1992–2010 is presented, including their significance (when available by both new analysis or in the scientific literature) and spatial characterization of ground deformation vertical and horizontal components. The focus is on deformations at spatial scales up to 500 km that do not include the longer-wavelength deformation from supra-regional tectonics and isostatic adjustment [24]; the smallest deformations (<0.1 km2) due to very localized causes are not mapped and considered. Even if the results are partly incomplete in terms of spatial and temporal sampling due to the not fully completeness of available SAR datasets, they allow an overall view of ground deformation at regional scale and could serve as a basis for future analyses and monitoring.

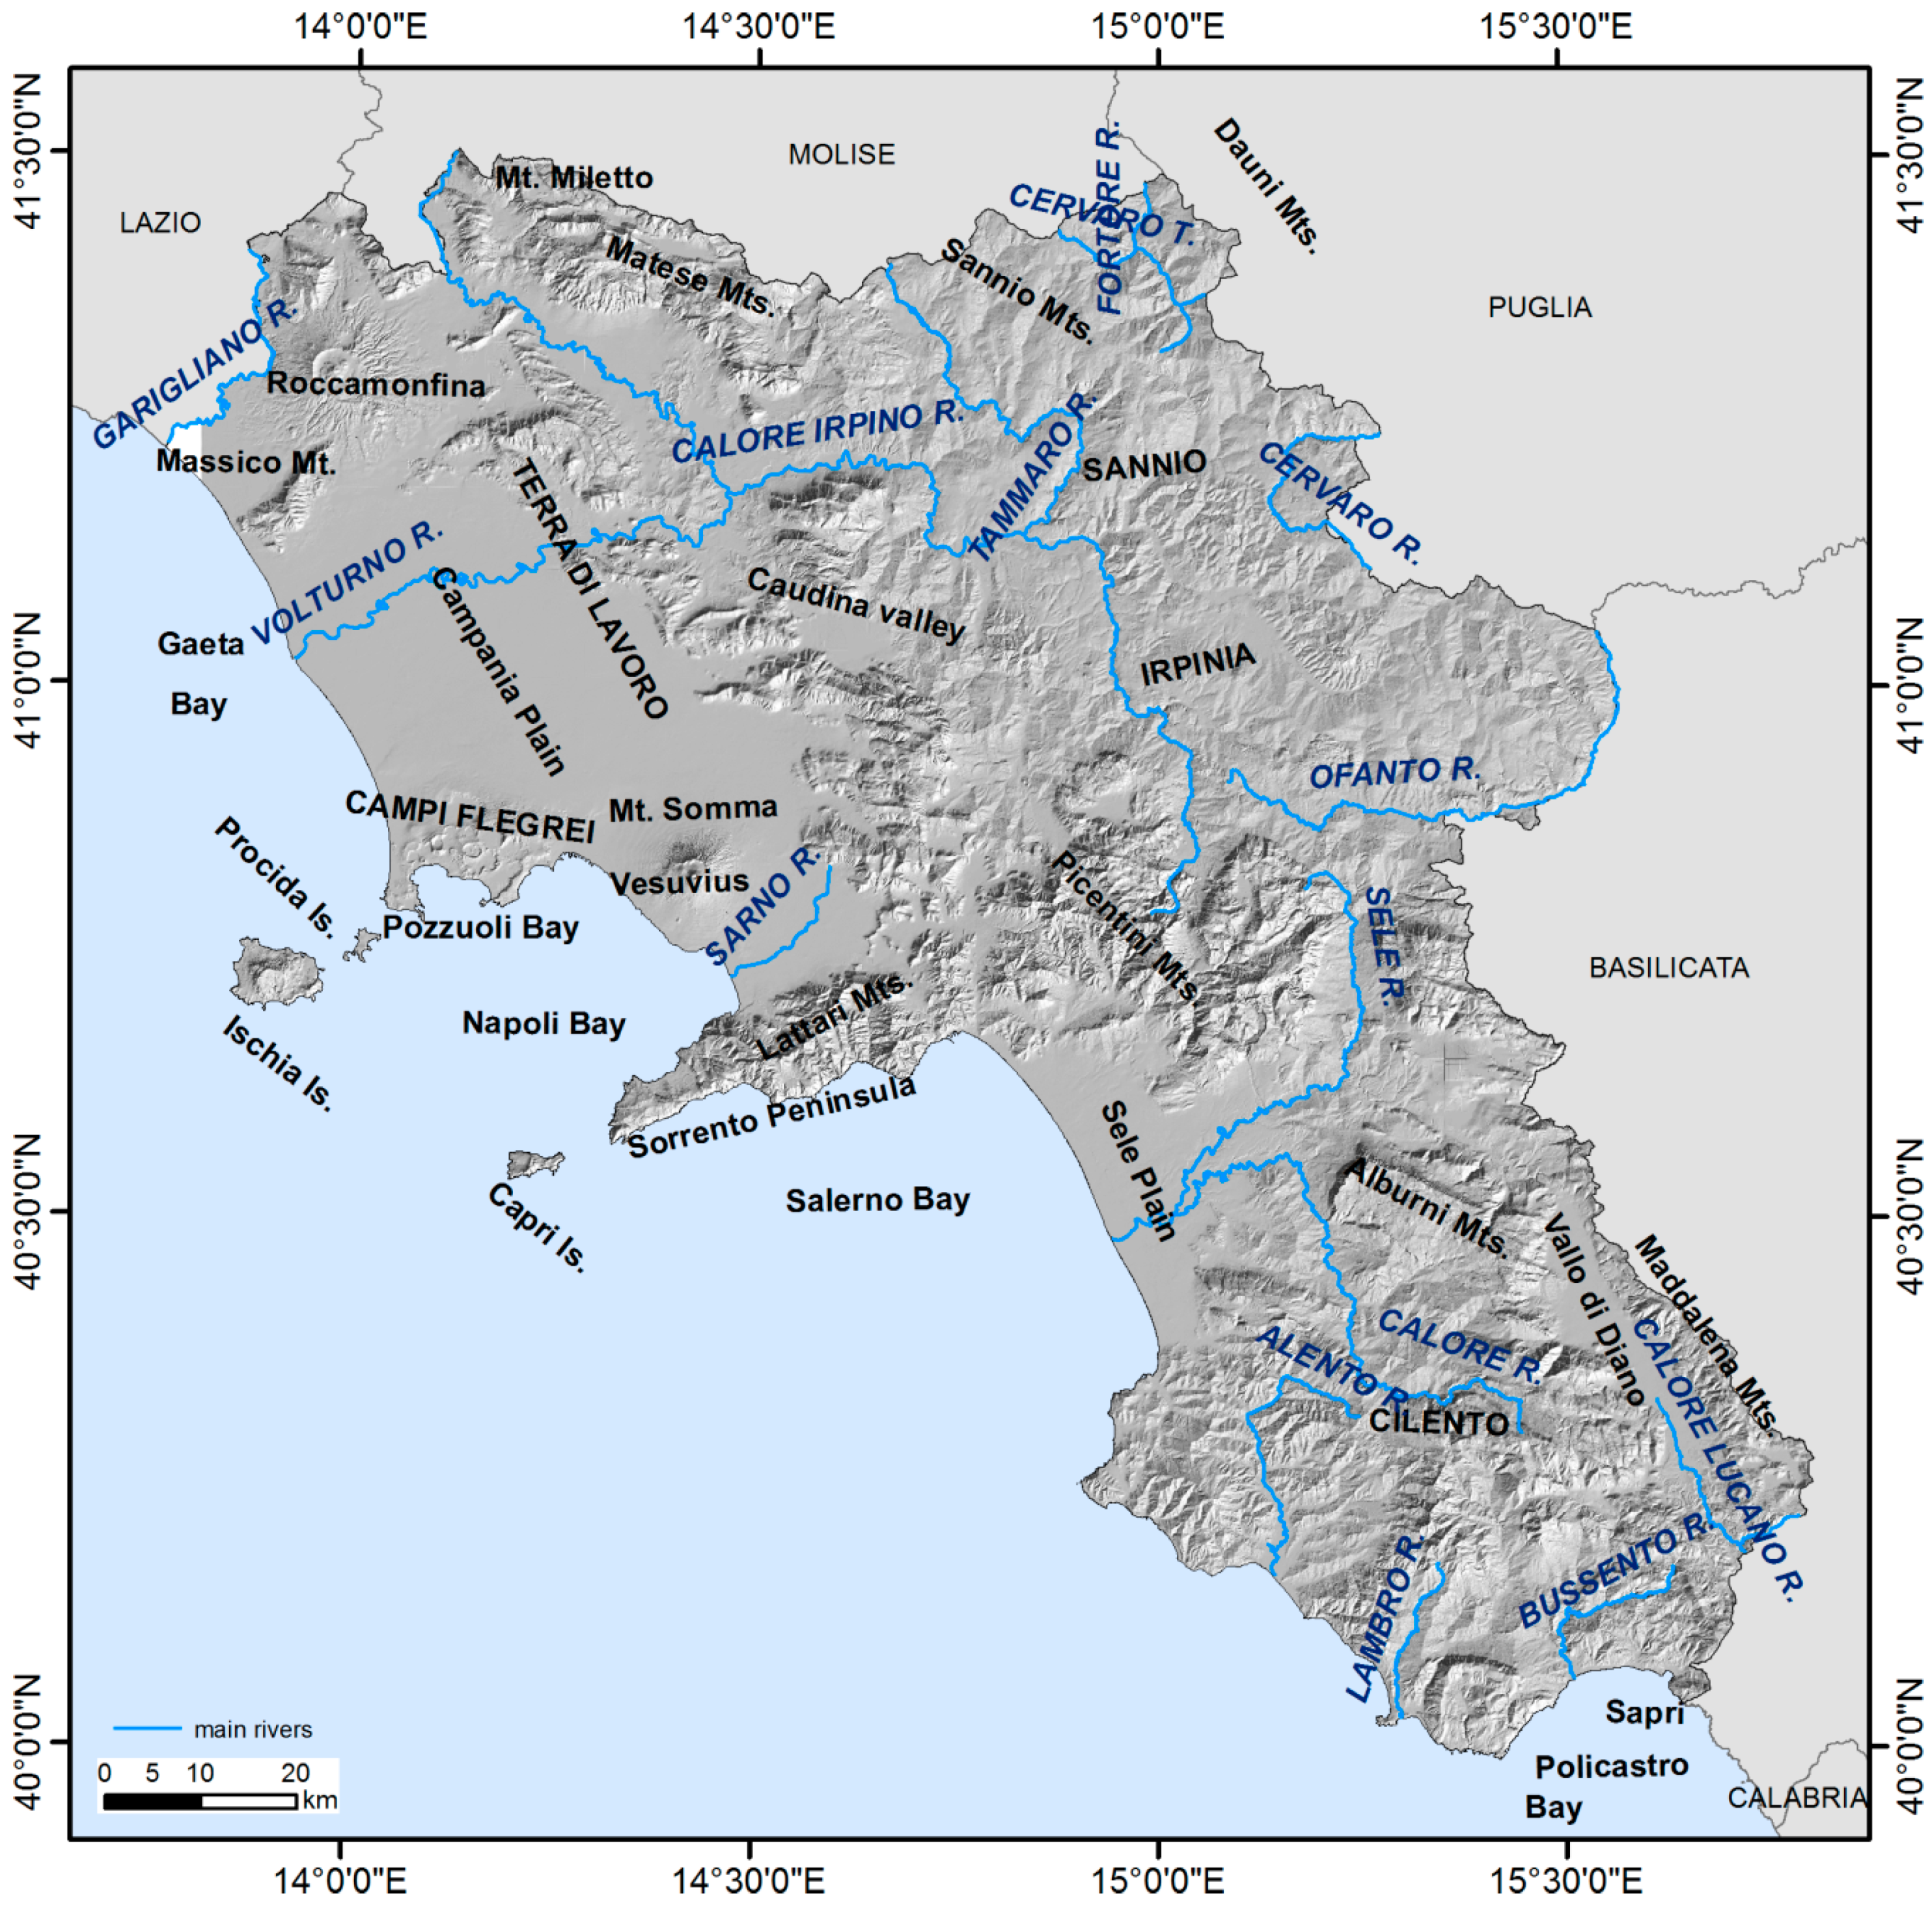
2. Study Area Description

Campania is a densely populated region (430 people per km2), extending 13,590 km2, located on the southwestern sector of the Italian Peninsula. It is bounded by the Tyrrhenian Sea to the west, including Capri and the volcanic Phlegraean Islands (Ischia and Procida), and by the Apennine mountain chain to the east. Close to the coast, there are two hazardous volcanic areas, i.e., the Somma-Vesuvius (1277 m a.s.l.) and Campi Flegrei, and some alluvial plain (Volturno, Sarno and Sele rivers). Several massifs, rarely reaching 2000 m (i.e., Mt. Miletto 2050 m a.s.l.), form the hilly-mountainous inner land. The climate is typically Mediterranean with hot, dry summers and moderately cool rainy winters; mean annual temperatures are in the range of about 10 °C in the mountainous interior, 18 °C along the coast and the plain. The lowest mean annual rainfall (700 mm) occurs in the eastern part of the region, while the highest (1800 mm) occurs in the central part of the Apennine ridge [25].
Triassic to Early Miocene carbonate platform limestone and pelagic basin calcareous-pelitic sequences form the geological units in the Apenninic mountain chain sectors. These units are strongly deformed and thrusted mainly eastward [26,27,28], and are uncomfortably covered by Middle Miocene to Pliocene thrust-top basin fillings, formed by siliciclastic sequences (mainly clays, sandstones, and conglomerates) [29].
The Campania region territory is a tectonically active sector, currently experiencing extension in hinterland and axial sectors, causing opening of fluvio-lacustrine intramontane basins, and along the Tyrrhenian margin forming the Campanian plain [30].
NW-SE and NE-SW striking faults delimit strongly subsiding basins (e.g., Volturno, Campania and Sele plains) along the Campanian Tyrrhenian belt as well as the volcanic complexes of Vesuvius, Phlegraean Fields, Ischia, and Roccamonfina. Historical eruptions occurred at Vesuvius (1944 A.D.), Ischia (1302 A.D.), and Campi Flgrei (1538 A.D.) [31,32]. Diffuse degassing areas, fumarole fields, and hot springs affect these volcanoes and their sea sectors [31,33,34].
The Quaternary extensional tectonic processes are also testified by the presence of active faults and seismogenic sources along the Apennine chain, which are the main cause of the strong seismic activity (M ≤ 7.0) occurring in Campania (http://emidius.mi.ingv.it/CPTI15-DBMI15/). The seismogenic sources are mainly related to NW-SE trending normal faults. Hypocentral depths are typically of about 10–12 km and focal mechanisms show extensional kinematics. In the XX century, destructive earthquakes occurred in 1930 (Ms = 6.7), 1962 (Ms = 6.2), and 1980 (Ms = 6.9); the last strong one occurred at Matese Massif (Mw = 5.0) in December 2013 (http://emidius.mi.ingv.it/CPTI15-DBMI15/).
The documented vertical displacements evidence a Pleistocene uplift rate of Region of 0.24 mm/yr in the southwestern coastal sector, while the chain sector uplifted during Pleistocene at about 0.51 mm/yr [30]. Available leveling lines and GPS data evidence subsidence at Vesuvius and Ischia [35,36] and show current southwestward velocities between 2 and 4 mm/yr at the southwestern corner of the Campanian plain [37]. At Campi Flegrei, a general subsidence between 1985 and 2007 has been interrupted by a still growing uplift phases [38].

3. Materials and Methods

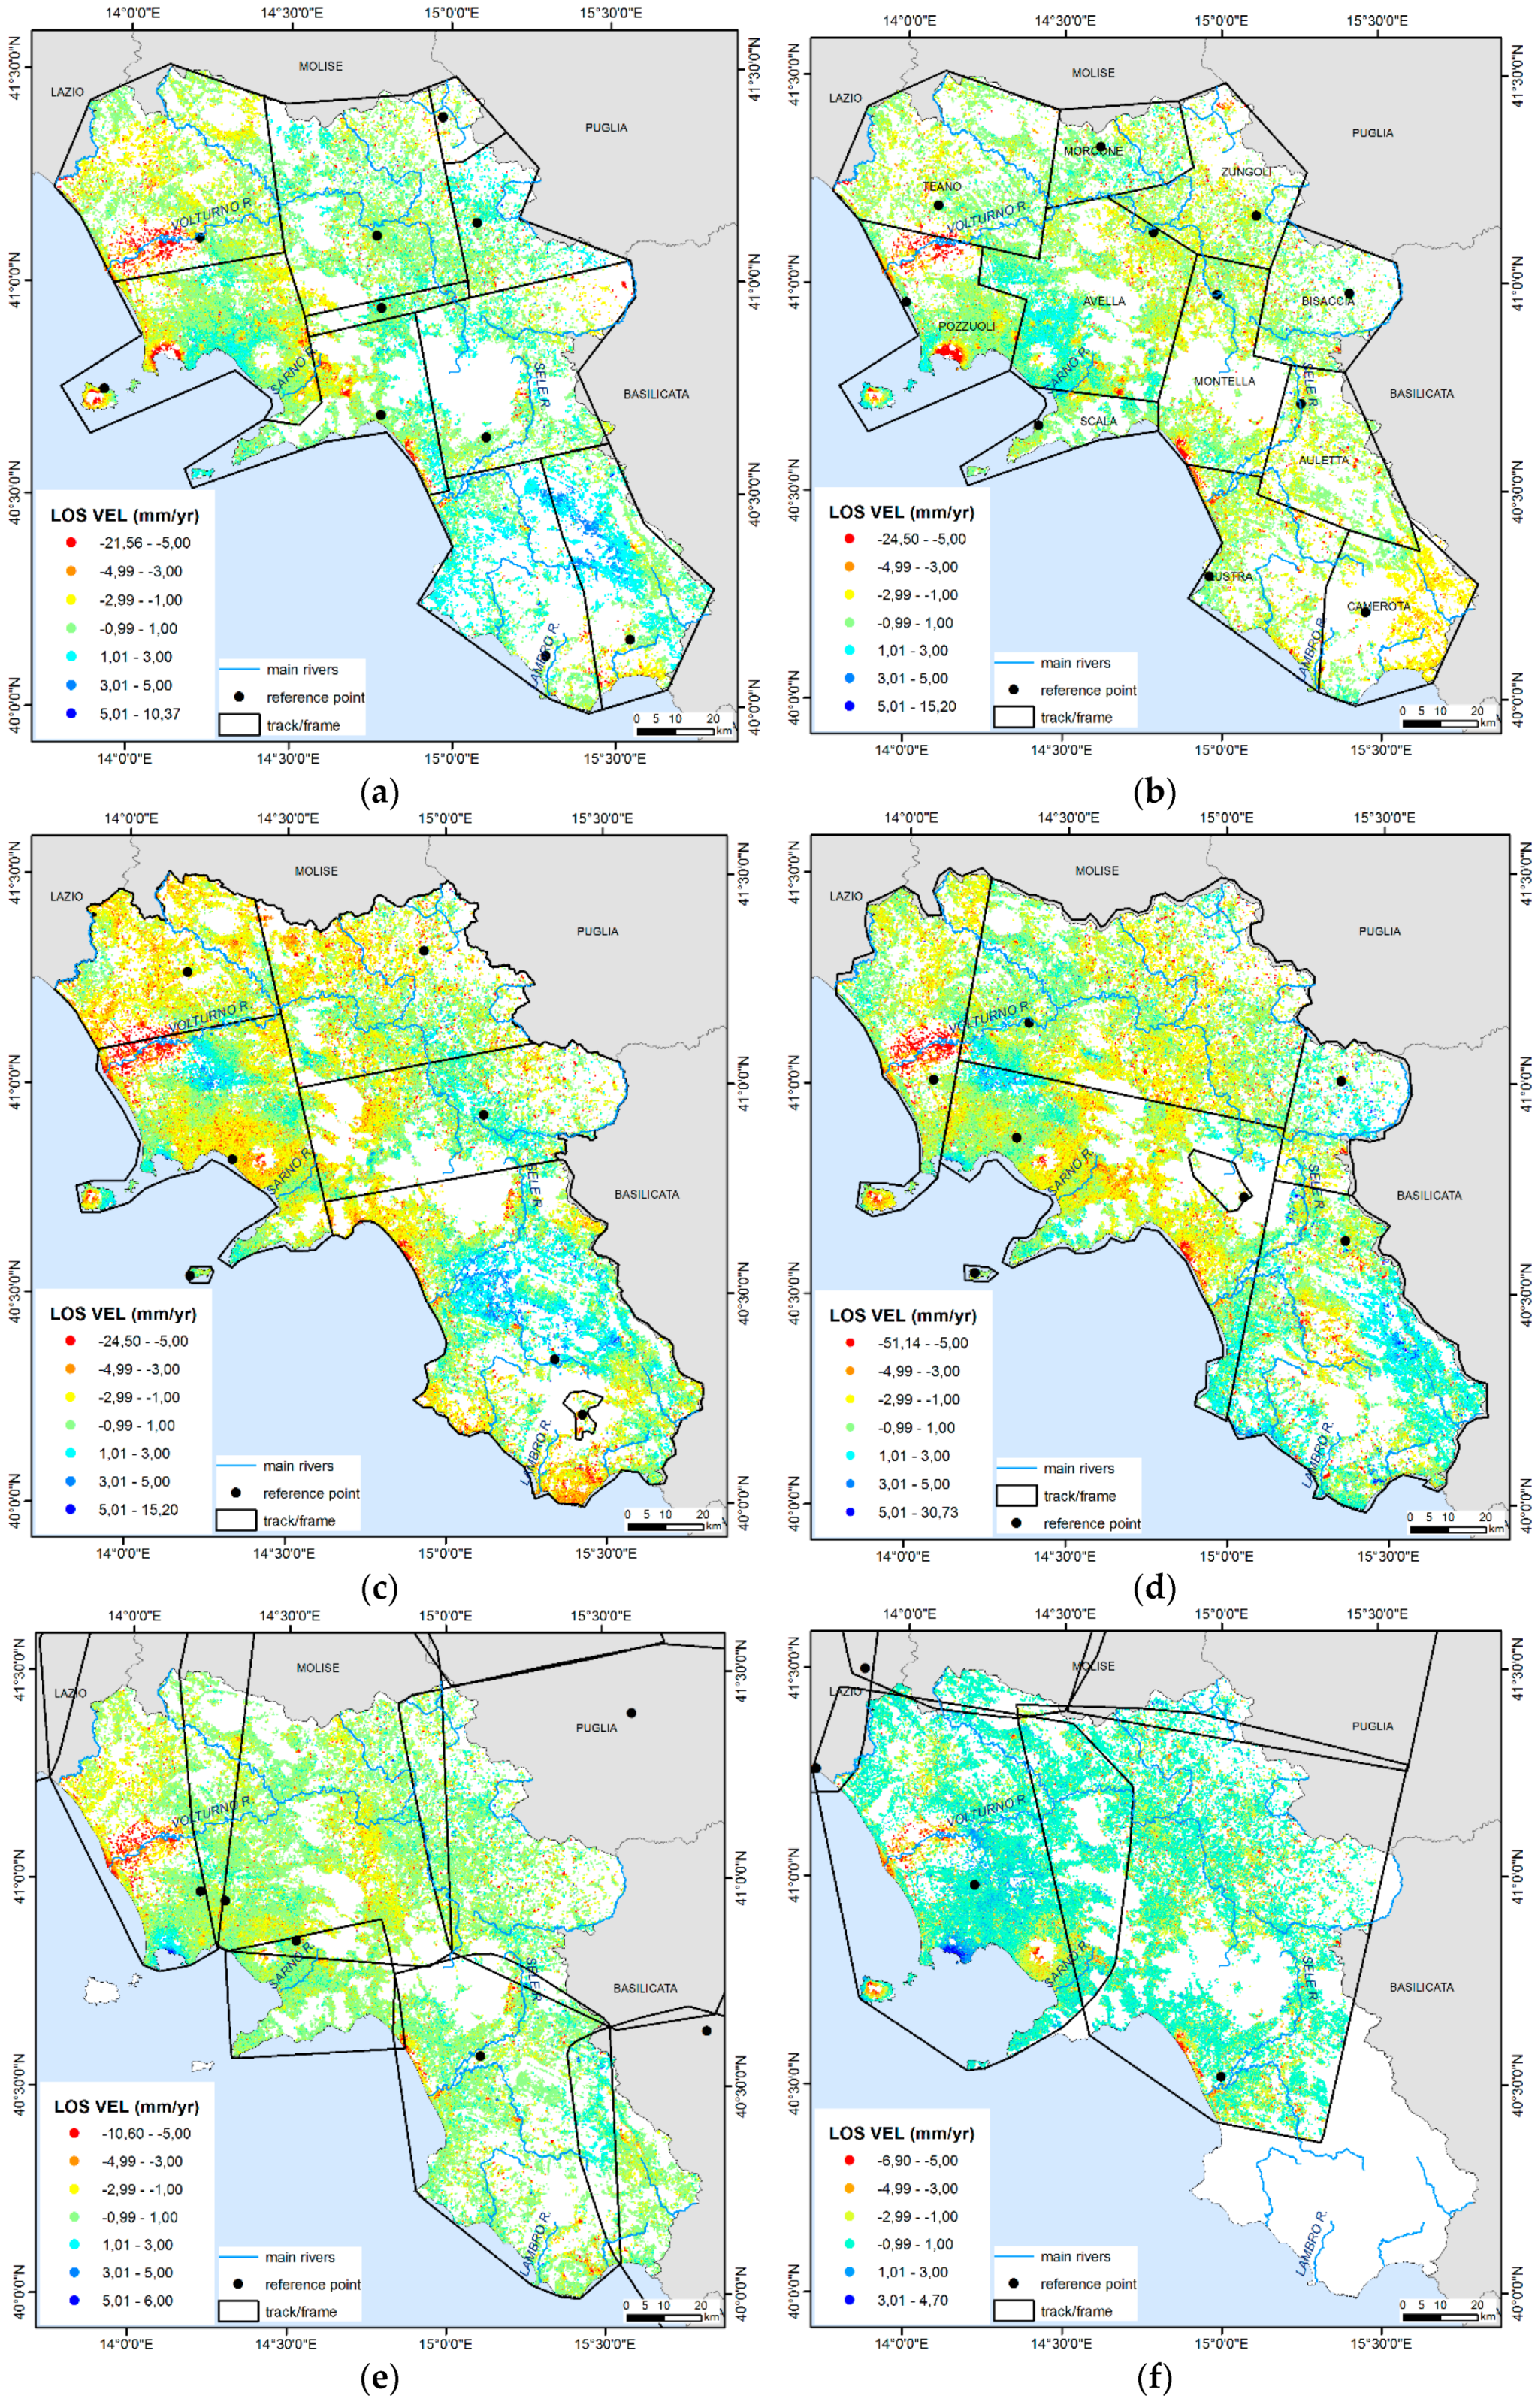
3.1. Persistent Scatterer Interferometry (PSI) Datasets Available for Campania Territory

InSAR is a geodetic tool widely used since the 90s to measure and monitor changes in the ground shape by measuring the difference in the straight line between radar sensor and ground target (line of sight, LOS) between space-borne radar acquisitions taken at different times [2].
In the area of the Campania Region, Persistent Scatterer Interferometry techniques (PSI), based on the analysis of radar images acquired by the C-band (5.6 cm wavelength) sensors onboard ERS-1/2, ENVISAT, and RADARSAT satellites, are able to supply a multi-temporal comprehensive view on the spatial distribution of ground deformation during the early 1990s to late 2000s. As these SAR satellites fly in the near-polar orbit, the N-S surface displacements have little contributions to the PSI derived LOS measurements. A simplified geometry is assumed for the ascending and descending SAR acquisitions, where the N-S horizontal displacement component is not considered in the LOS measurements. The vertical and E-W horizontal displacement components can thus be resolved from the ascending and descending LOS measurements by assuming the same incidence angles for the ascending and descending orbits [8].
Among MT-InSAR techniques, the Persistent Scatterer Interferometry (PSI) approach [2,3,4,5,6,9,12,39,40] is based on the use of a long series of co-registered, multitemporal SAR imagery allowing for precise and robust results [6,41]. The PSI techniques rely on the analysis of pixels that remain coherent over a sequence of interferograms and allow for the production of maps of displacement velocity, which are measured along the LOS. These maps show the temporal evolution of the ground displacement (time series) at each SAR acquisition epoch. The main results for each coherent PS include the annual average velocity of the displacement calculated by linear fitting of the time series of the variation in the sensor-target distance along the LOS over the entire acquisition period. The relative measurements of deformation and the zero in the time series are respectively referred to as a stable reference point, assumed motionless, and a master scene [42].
Several PSI-processed datasets referring to Campania regional territory have been produced by both national (see Not-Ordinary Plan of Environmental Remote Sensing [22,23]) and regional remote sensing projects (see Tellus project [19,20,21] and CNR-IREA database [43,44]) for supporting territorial management and monitoring and research activity. These datasets were implemented with different processing techniques, such as Permanent Scatterers (PS-InSAR) [42], Persistent Scatterers Pairs (PSP) [41,45,46], and Small Baseline Subset (SBAS) [47,48,49], all providing highly accurate, millimetric measurements of displacement along the LOS (for technical details see [42,45,46,47,48,49]).
For the study area, six PSI datasets (Table 1) were collected and post-processed: (a) ENVISAT ascending orbit, (b) ENVISAT descending orbit, (c) RADARSAT ascending orbit, (d) RADARSAT descending orbit, (e) ERS-1/2 ascending orbit, and (f) ERS-1/2 descending orbit (Table 1). The time range of acquisition period is from June 1992 to December 2001 for ERS-1/2, from November 2002 to July 2010 for ENVISAT, partly overlapping with RADARSAT (March 2003 to September 2007).
The PSI datasets include about 5.8 million PSs, which were identified within the study area with a coherence higher than 0.65. The used datasets are characterized by negative mean values of displacement velocities in both ascending and descending orbits (Table 2). Specific PSI techniques adopted for each used dataset are also listed (Table 2). ERS-1/2 datasets were processed both with PS-InSAR [19,20,21] and PSP [22,23] methods, while the ENVISAT dataset is available only with the PSP method [22,23] and RADARSAT dataset only with the PS-InSAR method [19,20,21]. Therefore, for obtaining a greater consistency, the datasets processed with the same method (i.e., PSP [22,23]) were used for both European Agency satellite datasets (ERS and ENVISAT), while the only available dataset was used for RADARSAT (PS-InSAR method [19,20,21]).
Each point of the PSI datasets is identified by a set of attributes (Table 2), including (a) identifier code; (b) coordinates (North, East); (c) time series of measurements (expressed in mm) of the displacement along the LOS; (d) average velocity expressed in mm/yr derived by the linear regression of (c); (e) standard deviation of the average velocity; (f) coherence, that is a normalized index of the local signal-to-noise ratio of the interferometric phase and reflects the accuracy of PS measurements [40,50,51,52].
C-band PS time series are robustly constrained when measuring deformation at rates greater than 0.5–1.0 mm/yr [41,51,53,54]. Costantini et al. [10] confirmed the capabilities of PSI to measure the displacement of corner reflectors with millimetric accuracy, but also on typical PSs, corresponding to man-made structures, rocks, bare soil, and, in general, nonvegetated and noncultivated terrain.
PSI processing usually allows to obtain very accurate measurements within 1.0 mm/year for the PS average velocity along the LOS by assuming a threshold value greater than 0.65 for coherence [51,53,55,56] when a large number of SAR images is used for the processing, as for used datasets in this study (Table 1). Previous studies [5,14] have demonstrated that SAR observations over the Campania territory result in high quality, strongly coherent datasets over time intervals of several years (from 6 to 10).
The validation process of PSI database produced by the Not-Ordinary Plan of Environmental Remote Sensing (PST-A) have been discussed in Di Martire et al. [11], while that referring to the Tellus project have been discussed in Vilardo et al. [5,14,21].
The six PSI datasets were spatially processed and georeferenced to the projection WGS-84 UTM Zone 33N using ArcGIS 10.2 software, producing a LOS velocity point map (i.e., vLOSasc and vLOSdesc maps). In Figure 2, the data distribution for the used datasets is shown, referring to the administrative boundaries of the region to be studied. Specifically, the LOS velocity shows varying trends for the datasets referring to different satellites and orbits. There are some sectors with no data in the areas with high topographic relief and/or unfavorable land cover (vegetation or agricultural crops). Most of the PSs are in the plain sectors, where the density of buildings and infrastructures is very high. The LOS displacement rates vary from −24.5 to +15.2 mm/yr for ERS datasets, −51.1 to +30.7 mm/yr for RADARSAT datasets and −10.6 to +6.0 mm/yr for ENVISAT datasets (Figure 2). The ENVISAT descending dataset is lacking for the southern sector of the regional territory.

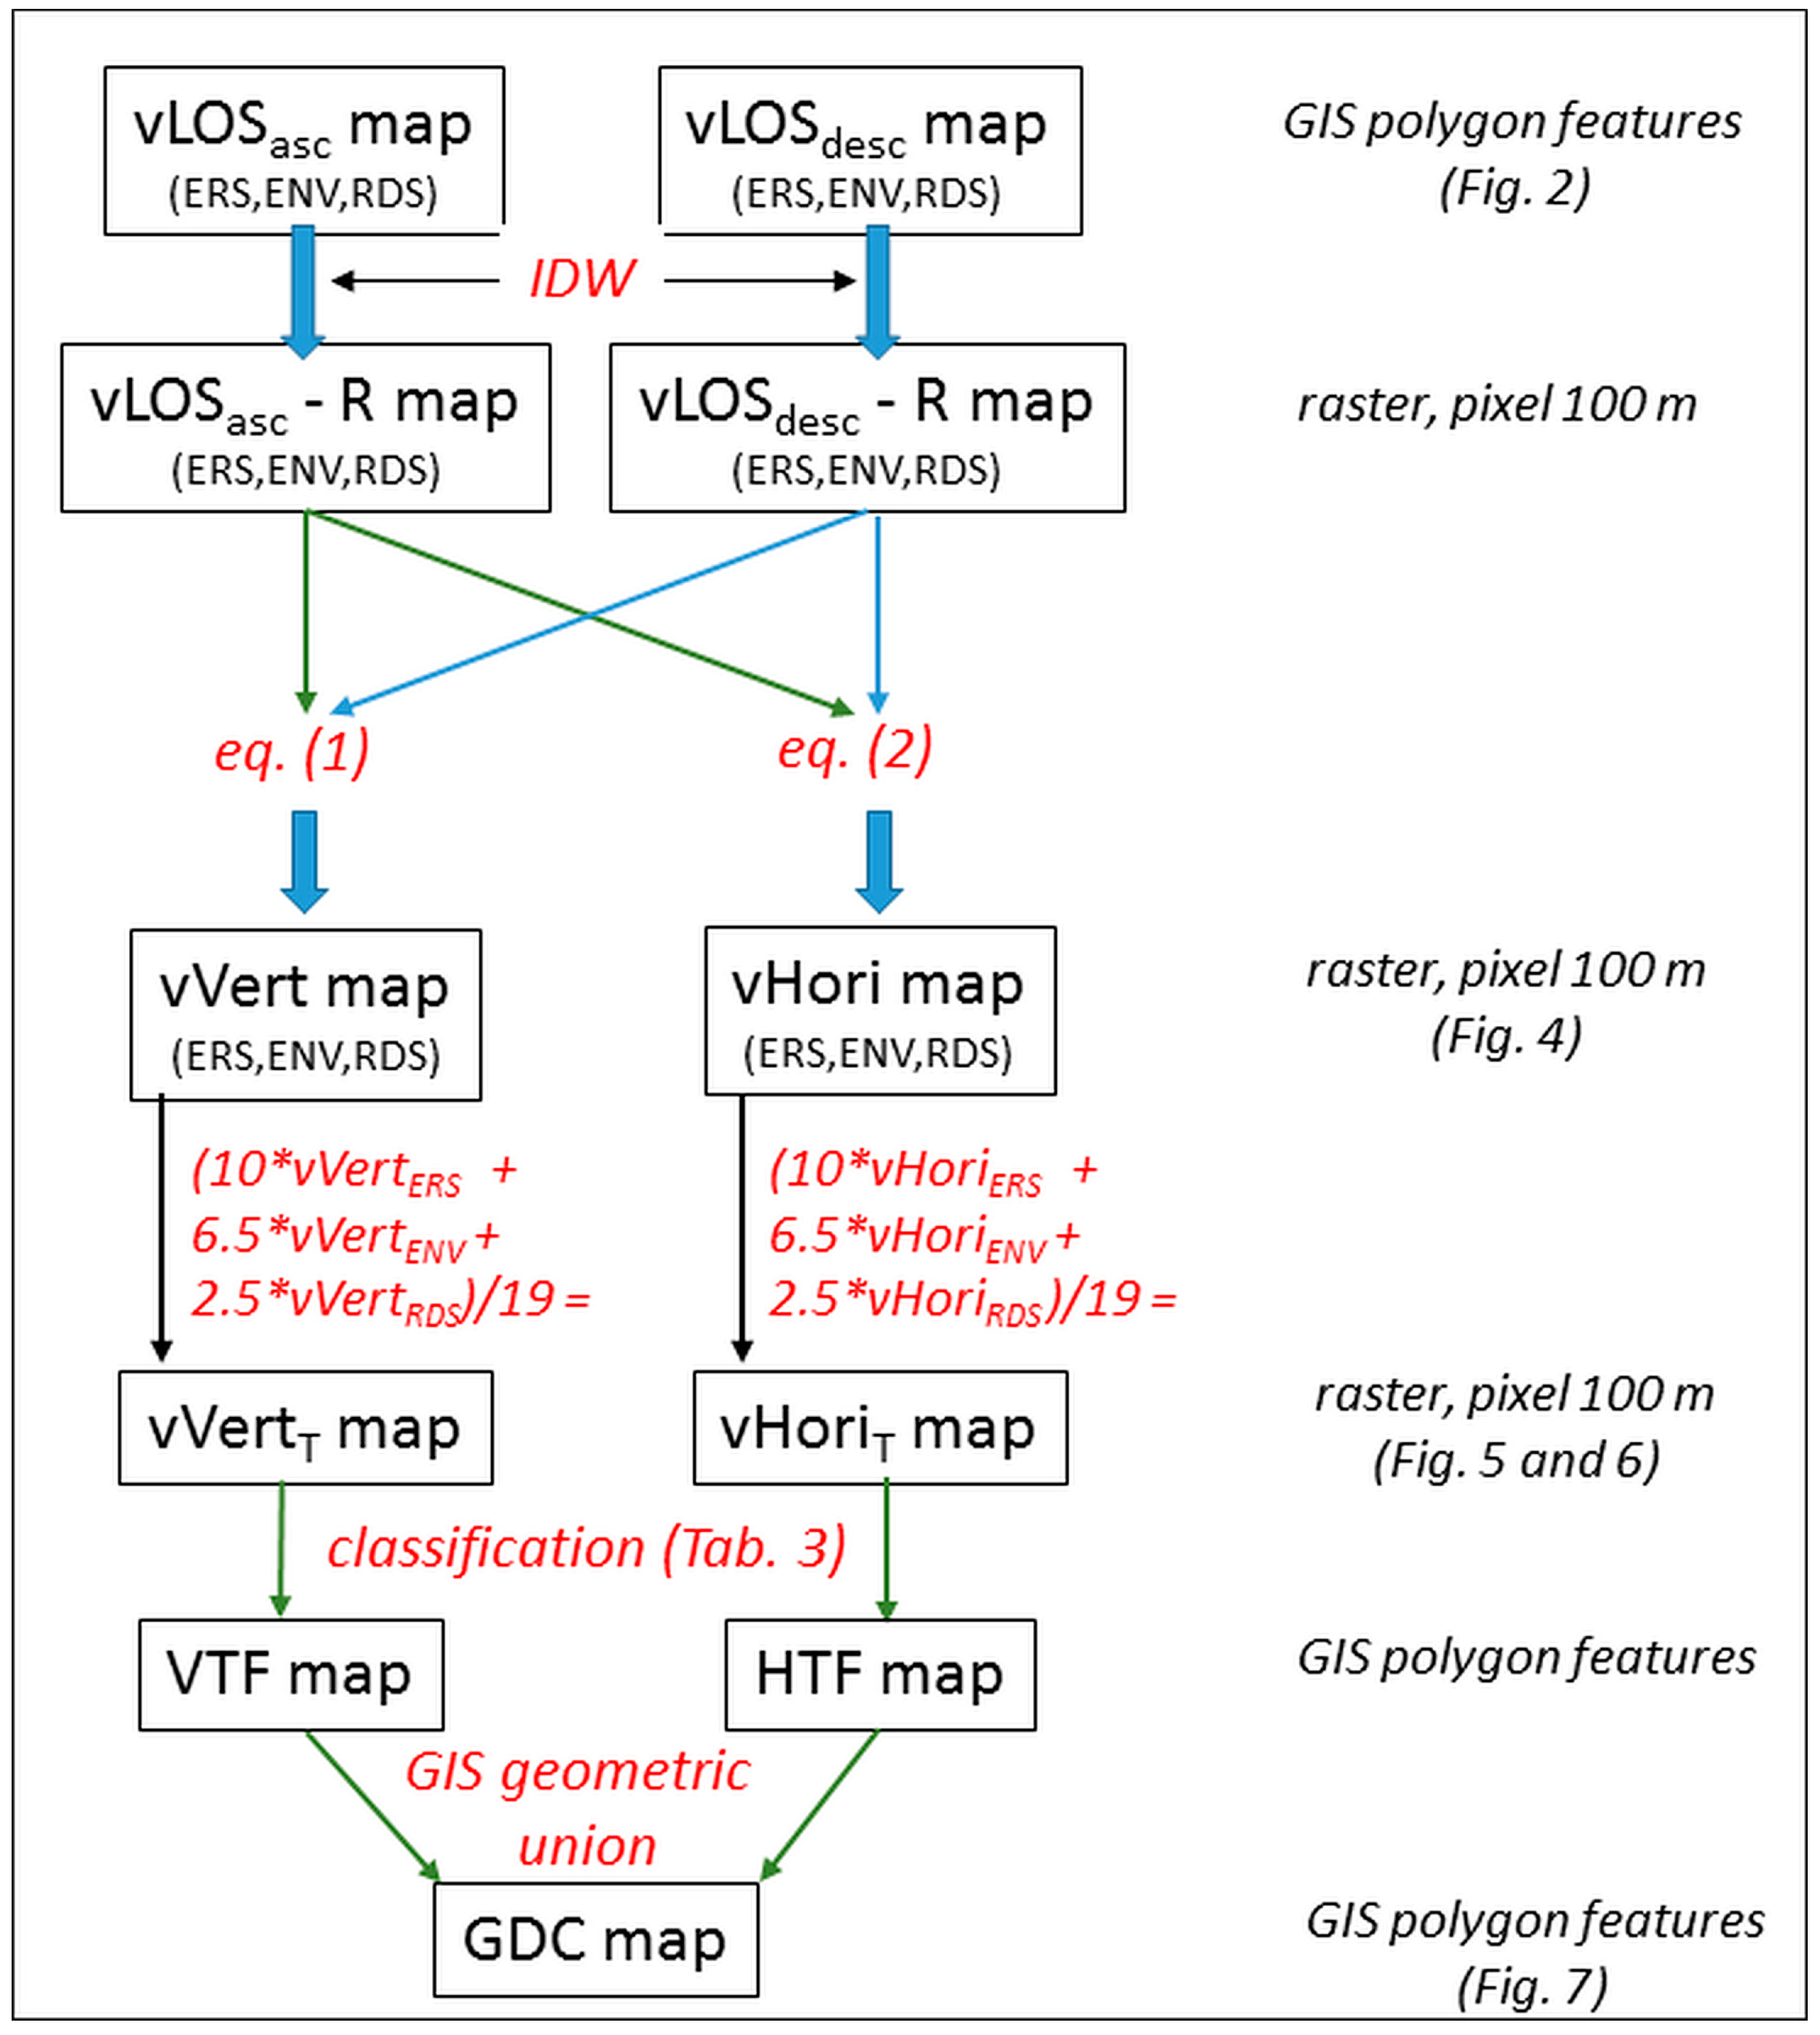
3.2. PSI Datasets Post-Processing for Ground Deformation Components

Post-processing activities (Figure 3) were finalized to the assessment and mapping of ground deformation processes that occurred during 1992–2010 in the Campania territory.
As SAR satellite sensors have a side-looking view, PSI displacements can be measured only along the LOS direction, which in the study area is in the range of 22–34° (Table 1). Observed increases or decreases in the LOS can be due to ground subsidence and uplift, respectively, although horizontal motions do occur and can dominate in some locations [24]. For those areas common to both acquisition geometries, the overlapping availability of ascending and descending PSI datasets allows for the evaluation of two spatial components (vertical and E-W horizontal ones) of ground deformation, based on simple trigonometric rules [5,14], as the N-S horizontal component is not detected by the SAR satellite acquisition system.
Firstly, the regional scale annual average LOS velocity raster maps (vLOSasc-R and vLOSdesc-R maps), referring to ascending and descending orbits of ERS-1/2, RADARSAT and ENVISAT PSI datasets, were produced by applying a spatial interpolation of the average velocity PS’s point values with the Inverse Distance Interpolation Weighted (IDW) method. The IDW approach is commonly used to interpolate datasets formed by scattered points, thus allowing both reliable results and preservation of local variability of the data [17,18,57,58,59]. In this study case, an interpolation method consisting of a quadratic weighting power of 2 within a 1000-m radius neighborhood was used to obtain 100-m regularly spaced grids, namely the ascending and descending LOS velocities raster maps derived from ERS-1/2, RADARSAT, and ENVISAT datasets with coherence > 0.65.
The components of the velocity were calculated by combining the vLOSasc and vLOSdesc raster maps on pixels common to both maps [5,12,14,35,49,60], by assuming that the ascending and descending LOS belong to the same East-Z plane and the look-angle is the same for both ascending and descending geometries. Based on these assumptions, the following equations [5,14] were used:
vVert   = ( vLOSdesc   +   vLOSasc ) / 2 cos ( q ) ,
vHori   = ( vLOSdesc   vLOSasc ) / 2 sin ( q ) ,
where “v” is the displacement velocity vector of an investigated PS; vVert and vHori are, respectively, the v projection along the Cartesian vertical and horizontal axes; vLOSdesc and vLOSasc are the projections of velocity along the LOS of the two orbits; and q is the look-angle. A value of q given by the average of the two LOS incidence angles of the ascending and descending orbits was used for the calculations related to each satellite dataset, which was 22.5° for ERS-1/2, 33.25° for RADARSAT, and 23.5° for ENVISAT.
The obtained 100-m spaced grid maps (Figure 4) show the distribution of the vertical and E-W horizontal components of ground deformation velocity in the Campania region for each dataset referring to its time period, i.e., 8 June 1992 to 23 December 2001 for ERS-1/2 (10 years), 4 March 2003 to 22 September 2007 for RADARSAT (5 years), and 13 November 2002 to 30 July 2010 for ENVISAT (9 years).
In order to obtain a quantitative assessment of the two components of the ground deformation velocities (expressed in mm/yr) referring to the whole analyzed period (evaluated 19 years, as 1992 and 2010 partial acquisitions were considered representative of the full year), the average velocities were calculated with a pixel by pixel weighted average of the velocity of the different grid maps (Figure 3). The weighted average was based on the number of years of the time interval to which each satellite dataset is referred (i.e., 10 years for ERS-1/2, 2.5 years for RADARSAT, and 6.5 years for ENVISAT, as the overlapping years of RADARSAT and ENVISAT datasets count 0.5 year each). With reference to the southern sector of the regional territory, as the ENVISAT descending dataset is lacking, the average velocities were calculated by accounting only for ERS and RADARSAT grid maps.
The results are two 100-m spaced grid maps showing, respectively, the cumulated distribution of vertical (vVertT) and E-W horizontal (vHoriT) movements in the Campania territory (expressed in mm/yr) for the whole period of 1992–2010.
The use of SAR interferometry measurements to analyze ground deformation components has already been tested and validated in several sectors of the Campania Region (i.e., Campi Flegrei, Volturno plain, Sele plain) with millimetric levels of precision [5,13,14].

3.3. PSI Datasets Post Processing for Ground Deformation Classification

After having classified vVertT and vHoriT raster maps (see Table 3 for used codes), the raster datasets were converted to two polygon features (VTF and HTF, respectively). Then a geometric union of the input features was computed for obtaining an output feature class assigning to each polygon feature the attributes related to both vertical and horizontal components of ground deformation within the nine possible combinations, i.e., U-W, U-N, U-E, S-W, S-N, S-E, D-W, D-N, and D-E classes. The class S-N means that no horizontal and vertical ground deformation have been recorded during 1992–2010, and so it designates stable areas. The remaining eight classes were used for areas affected by at least one component of ground deformation with an average annual rate greater than +1 mm/year or lower than −1 mm/year. The final Ground Deformation Classification map (GDC map) includes only features extending more than 0.1 km2 in order to exclude too local deformations.
The interpretation of ground deformation processes was made by comparing the obtained results with the following geological datasets:

4. Results

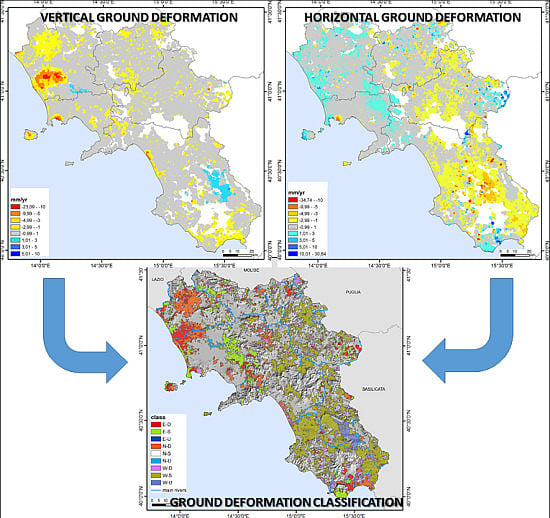
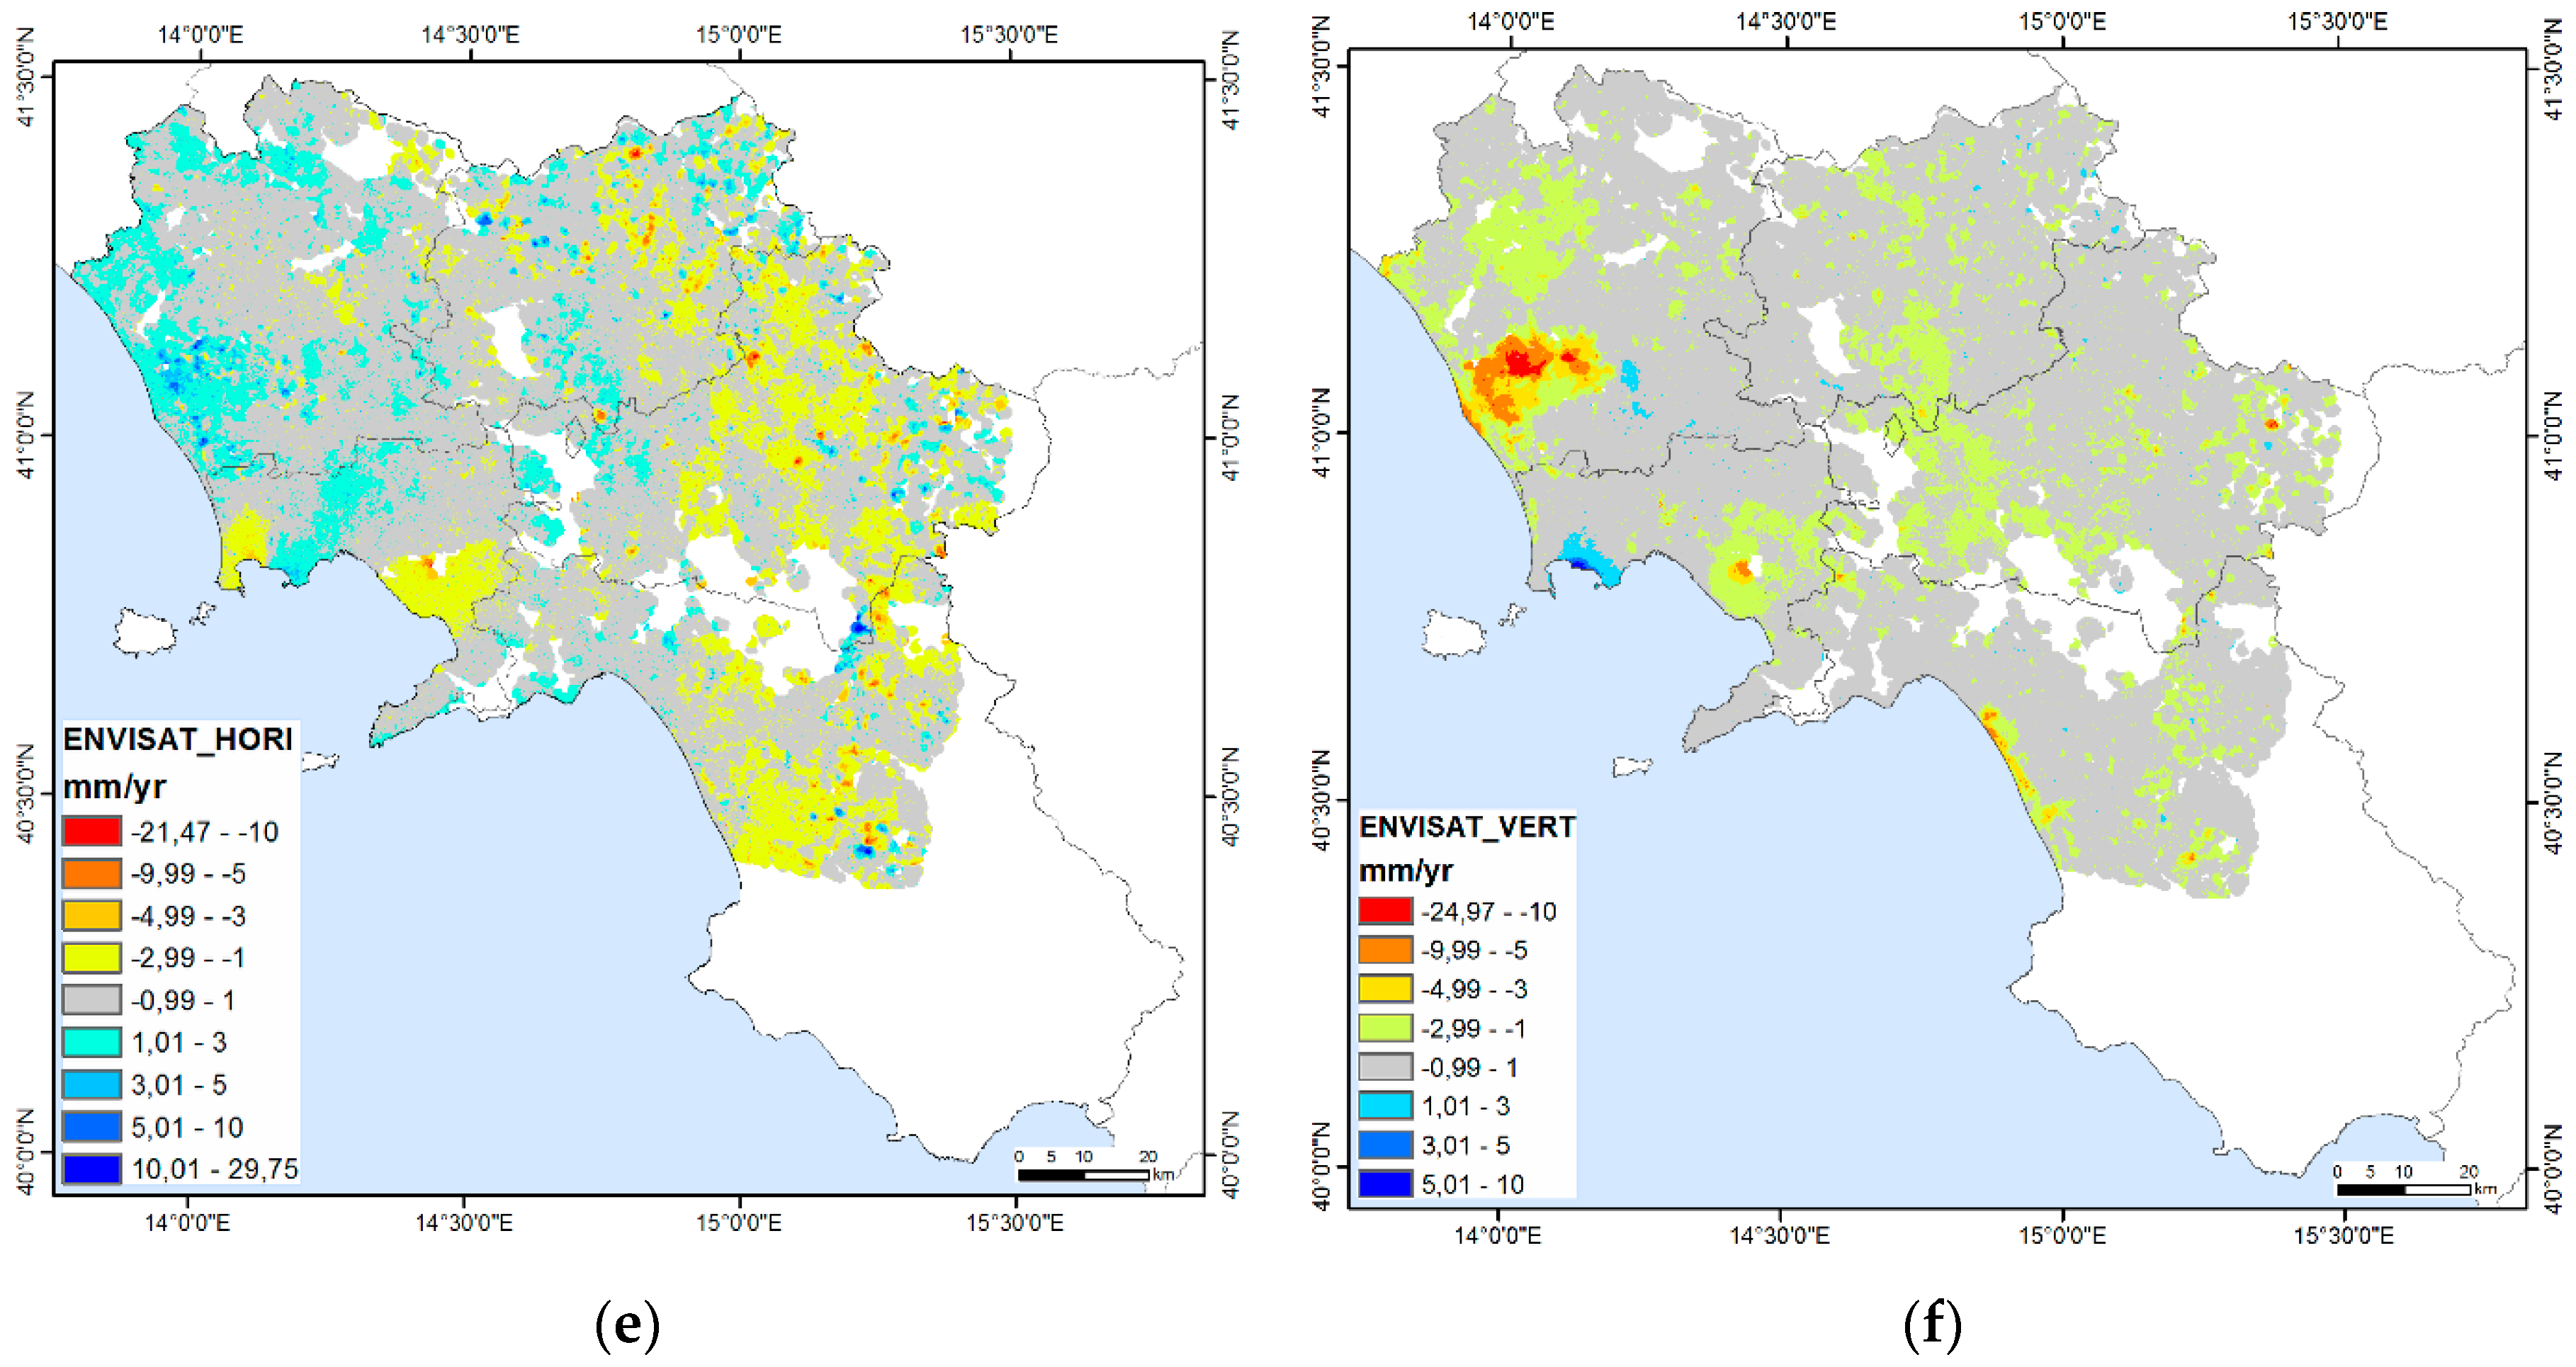
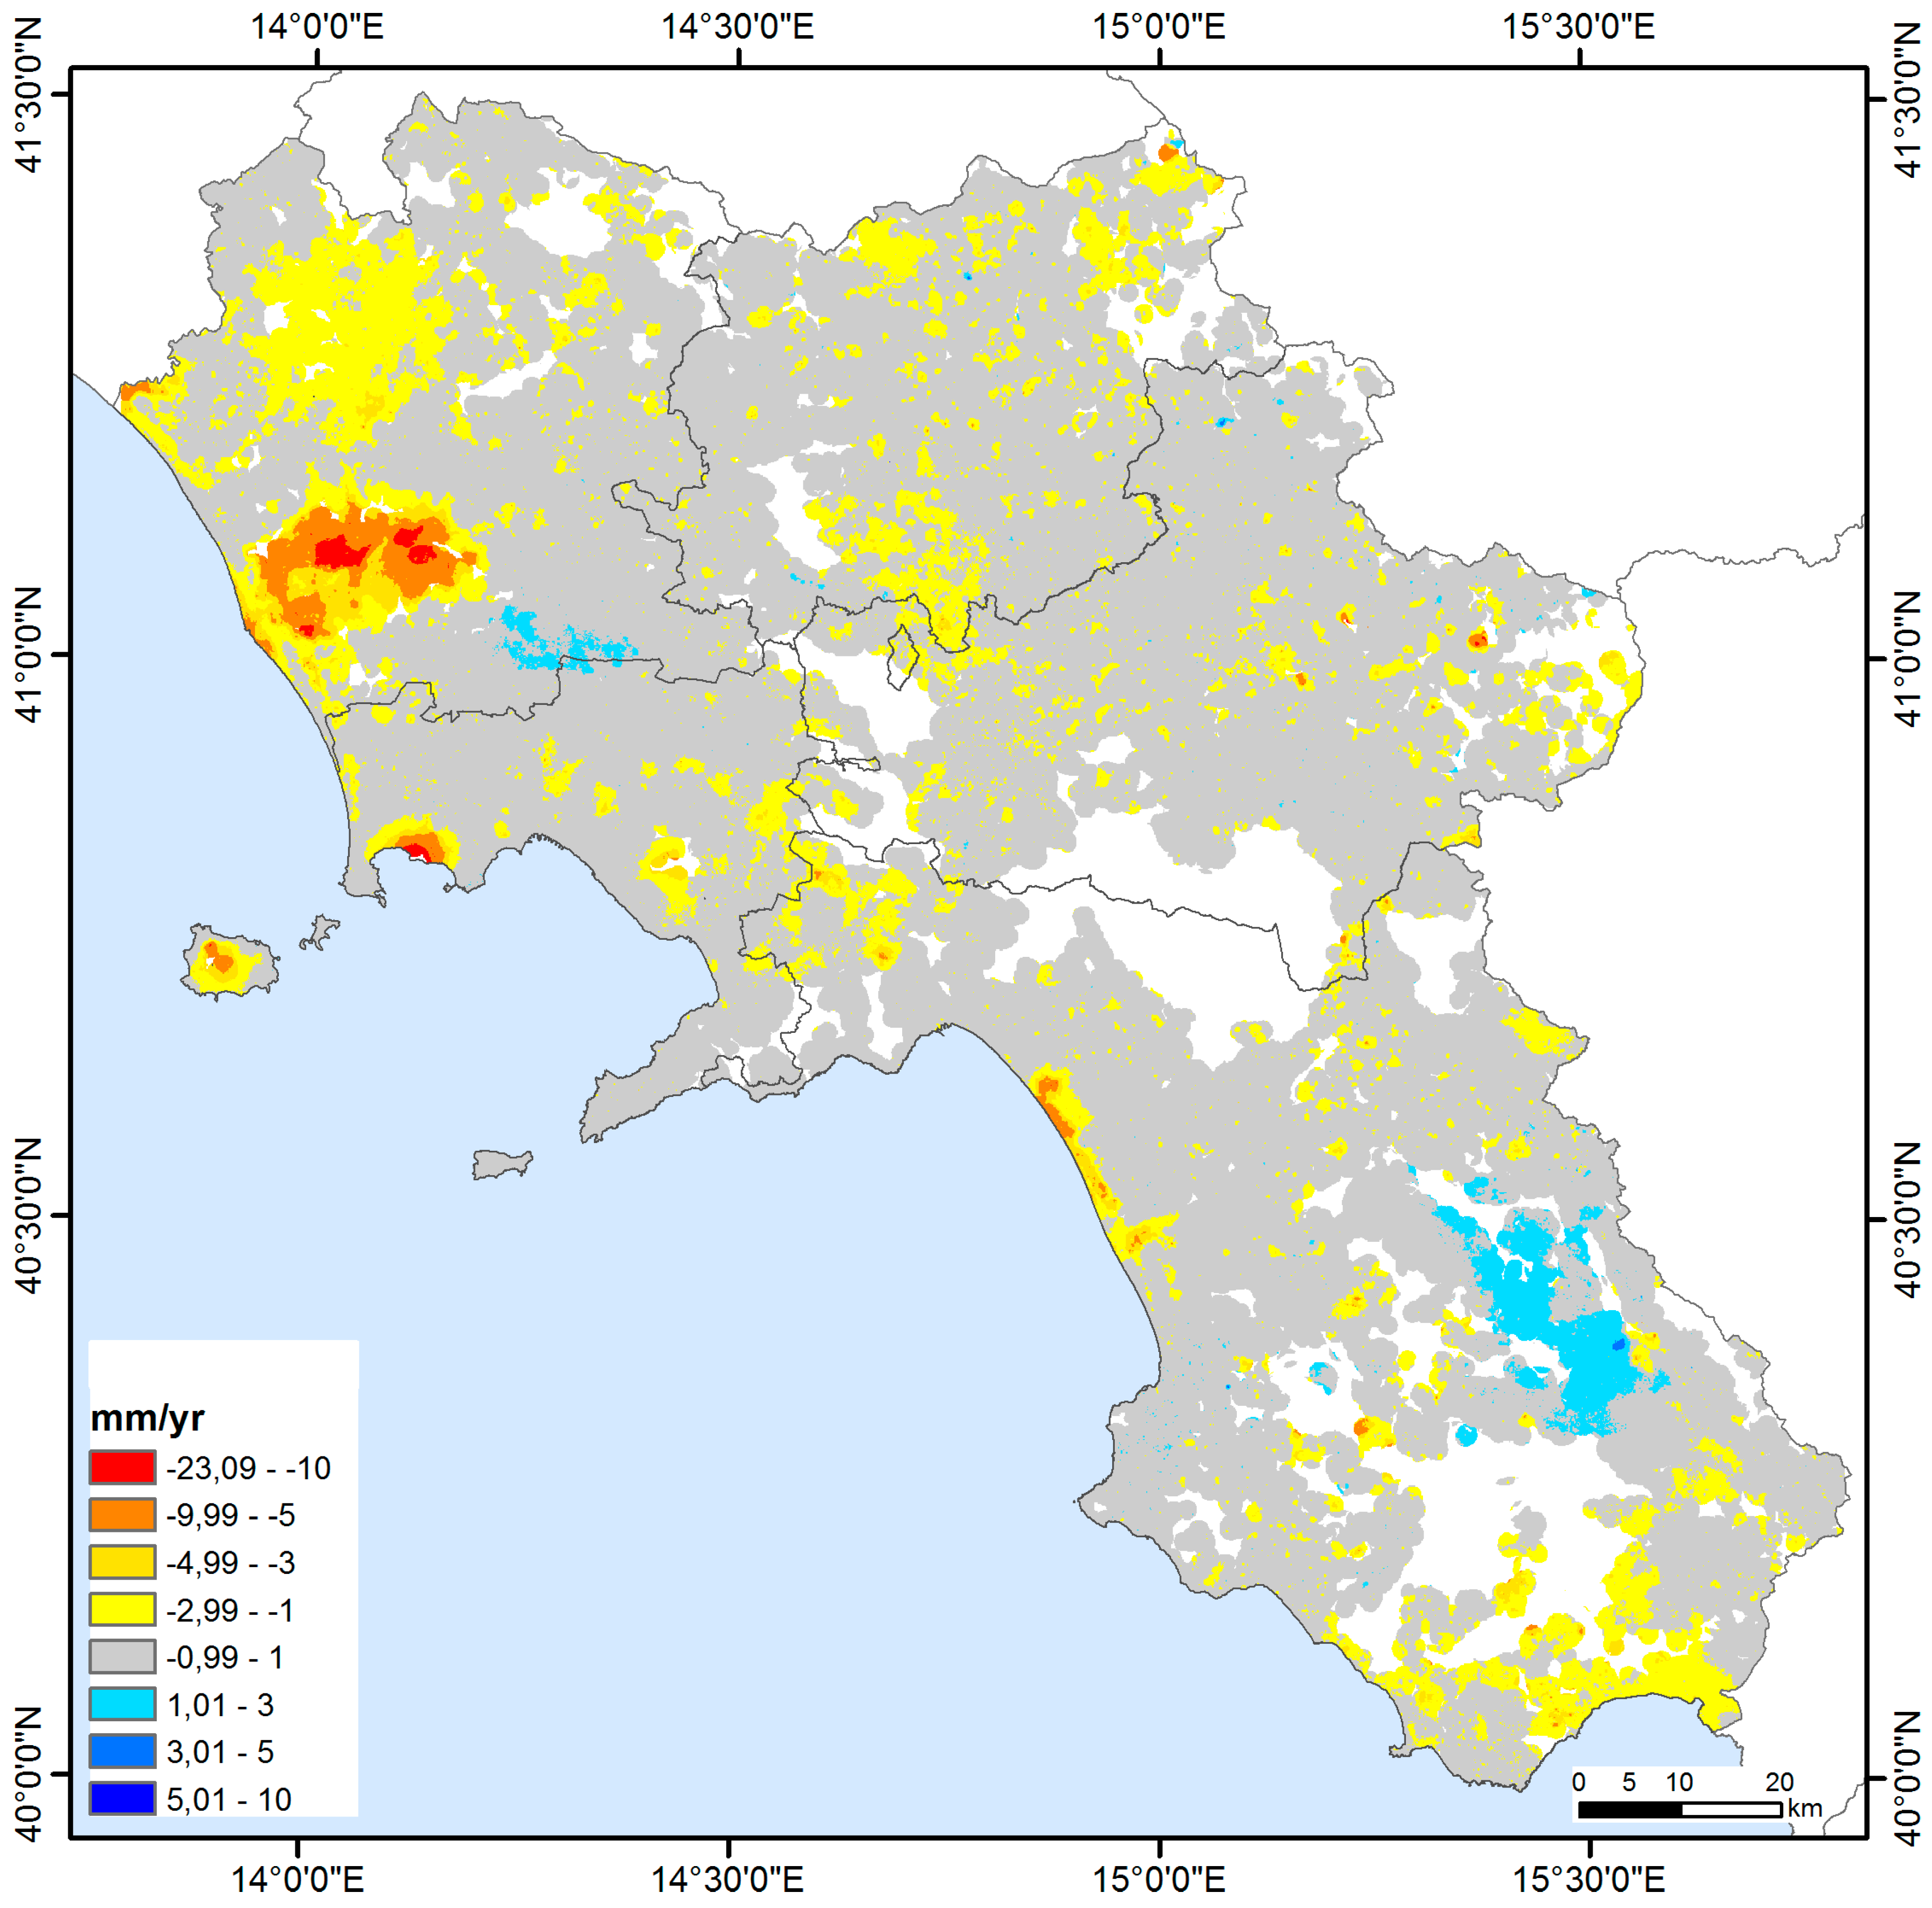
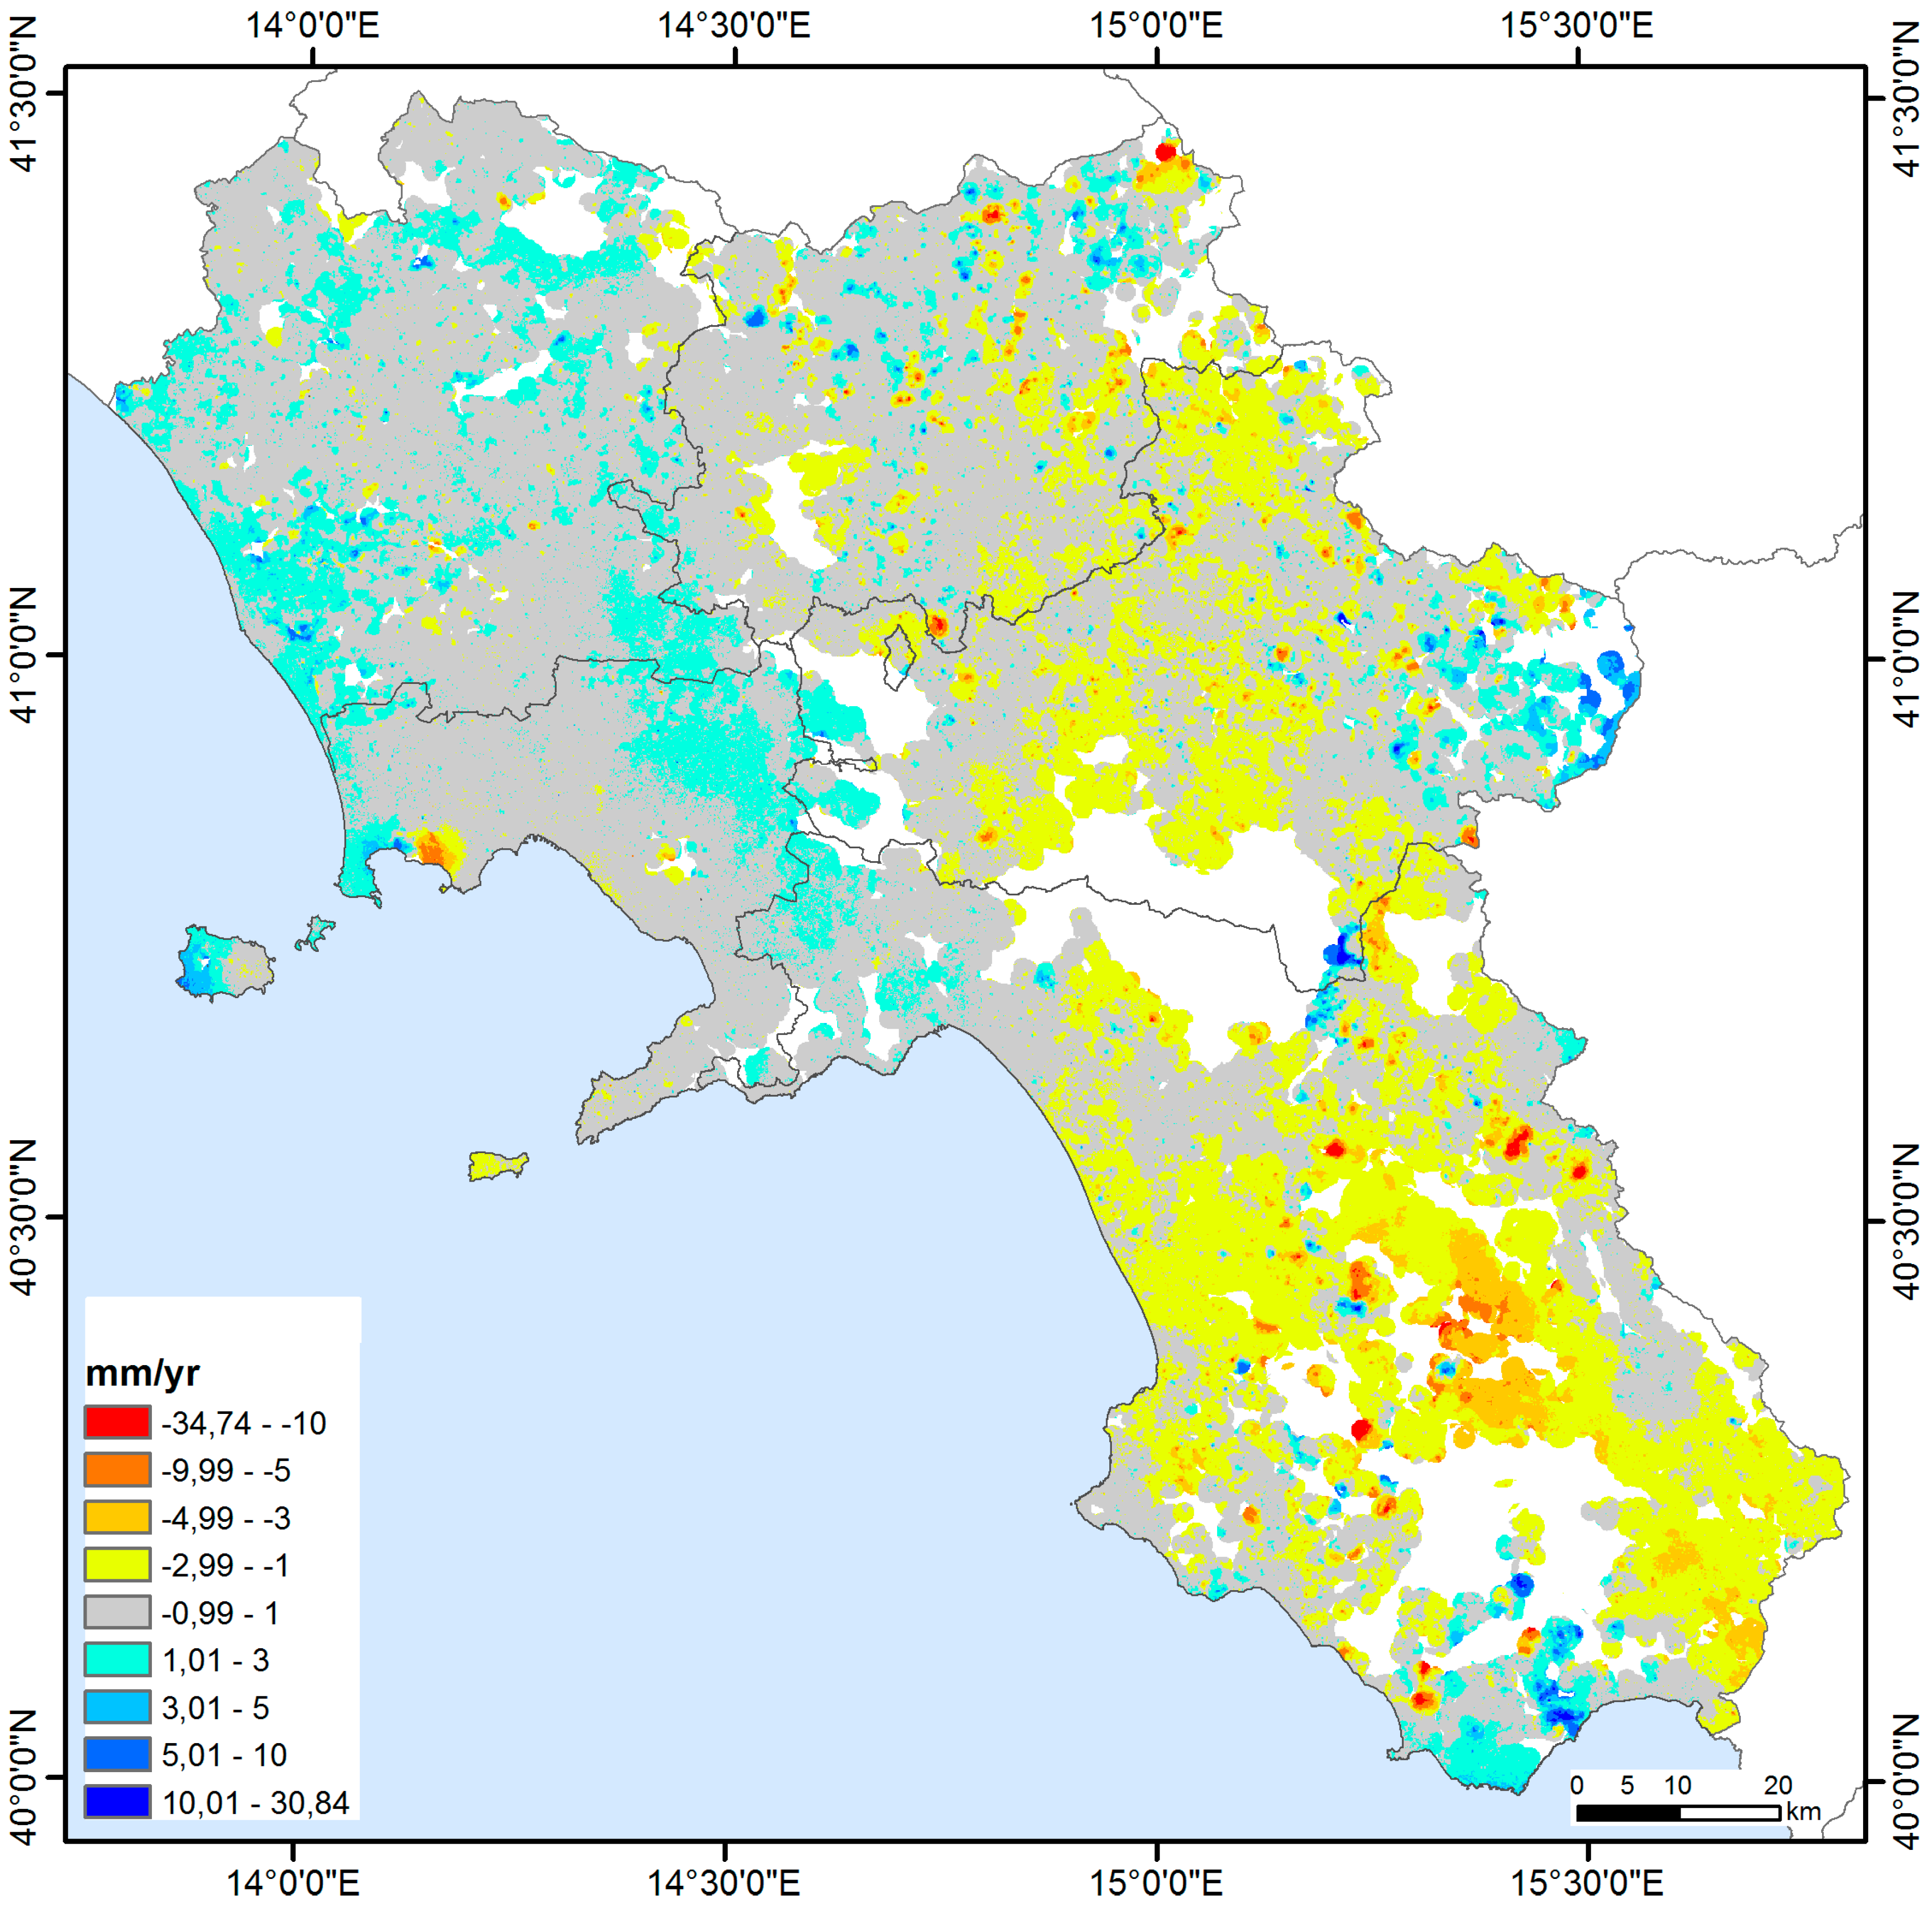
4.1. Ground Deformation Components

The interplay among different deformation processes (i.e., tectonic, volcanic, hydrothermal, hydrogeological, geomorphologic, and anthropic) causes a complex pattern of horizontal and vertical displacements during the 1992–2010 time range (Figure 5 and Figure 6).
The PSI post-processing for the analysis of ground deformation components resulted in the assessment of both vertical and horizontal components for an area of 12,160 km2, representing the 89.5% of the whole regional territory (Table 4). No data areas (10.5%) are mainly located in steep mountainous inner sectors due to the dark gap generated by layover and shadow effects during SAR signals’ acquisition. The almost total coverage of the regional territory allows having an overall and effective view of the effects of the various slow deformation processes acting on the ground at different scales.
The main part (71%) of the classified regional territory results are stable with reference to the vertical component of ground deformation (Figure 5, Table 4). Low subsidence rates (−3 to −1 mm/yr) are widespread (ca. 14.5%) in mountain and hilly Sannio and Irpinia sectors, in several coastal areas, and in southern Cilento; also, Roccamonfina and Vesuvius areas show subsidence trends. The areas affected by significant subsidence are presenting a minor extension (ca. 2.7% of the classified territory) and are characterized by high negative values (−23 to −3 mm/yr). These zones include (Figure 5) the Volturno river plain, the Sele river coastal plain, Ischia Island, Campi Flegrei central sectors, and other sparse spots. The two sectors characterized by moderate uplift, testified by positive values (+1 to +5 mm/yr), are located in the central sector of the Campanian plain and in the eastern sector of the Cilento (i.e., Alburni Massif).
Even if about half (52%) of the classified regional territory results are stable with reference to the E-W horizontal component of ground deformation (Figure 6, Table 4), the regional territory is clearly divided into two main sectors. The western sector, encompassing the Campanian plain, the Roccamonfina relief, and the Sorrento peninsula, shows a slight eastward movement (positive values), while the inner eastern (Sannio and Irpinia) and southern (Cilento) sectors show a slight westward movement (negative values). The highest negative values (−35 to −3 mm/yr) concentrate in the Alburni Massi-Vallo di Diano (Cilento) and in the eastern sector of Campi Flegrei. The highest positive values (+30 to +3 mm/yr) affect the western sectors of Campi Flegrei and Ischia Island, some sectors of Campania Plain, and the easternmost Irpinia and southernmost Cilento sectors.

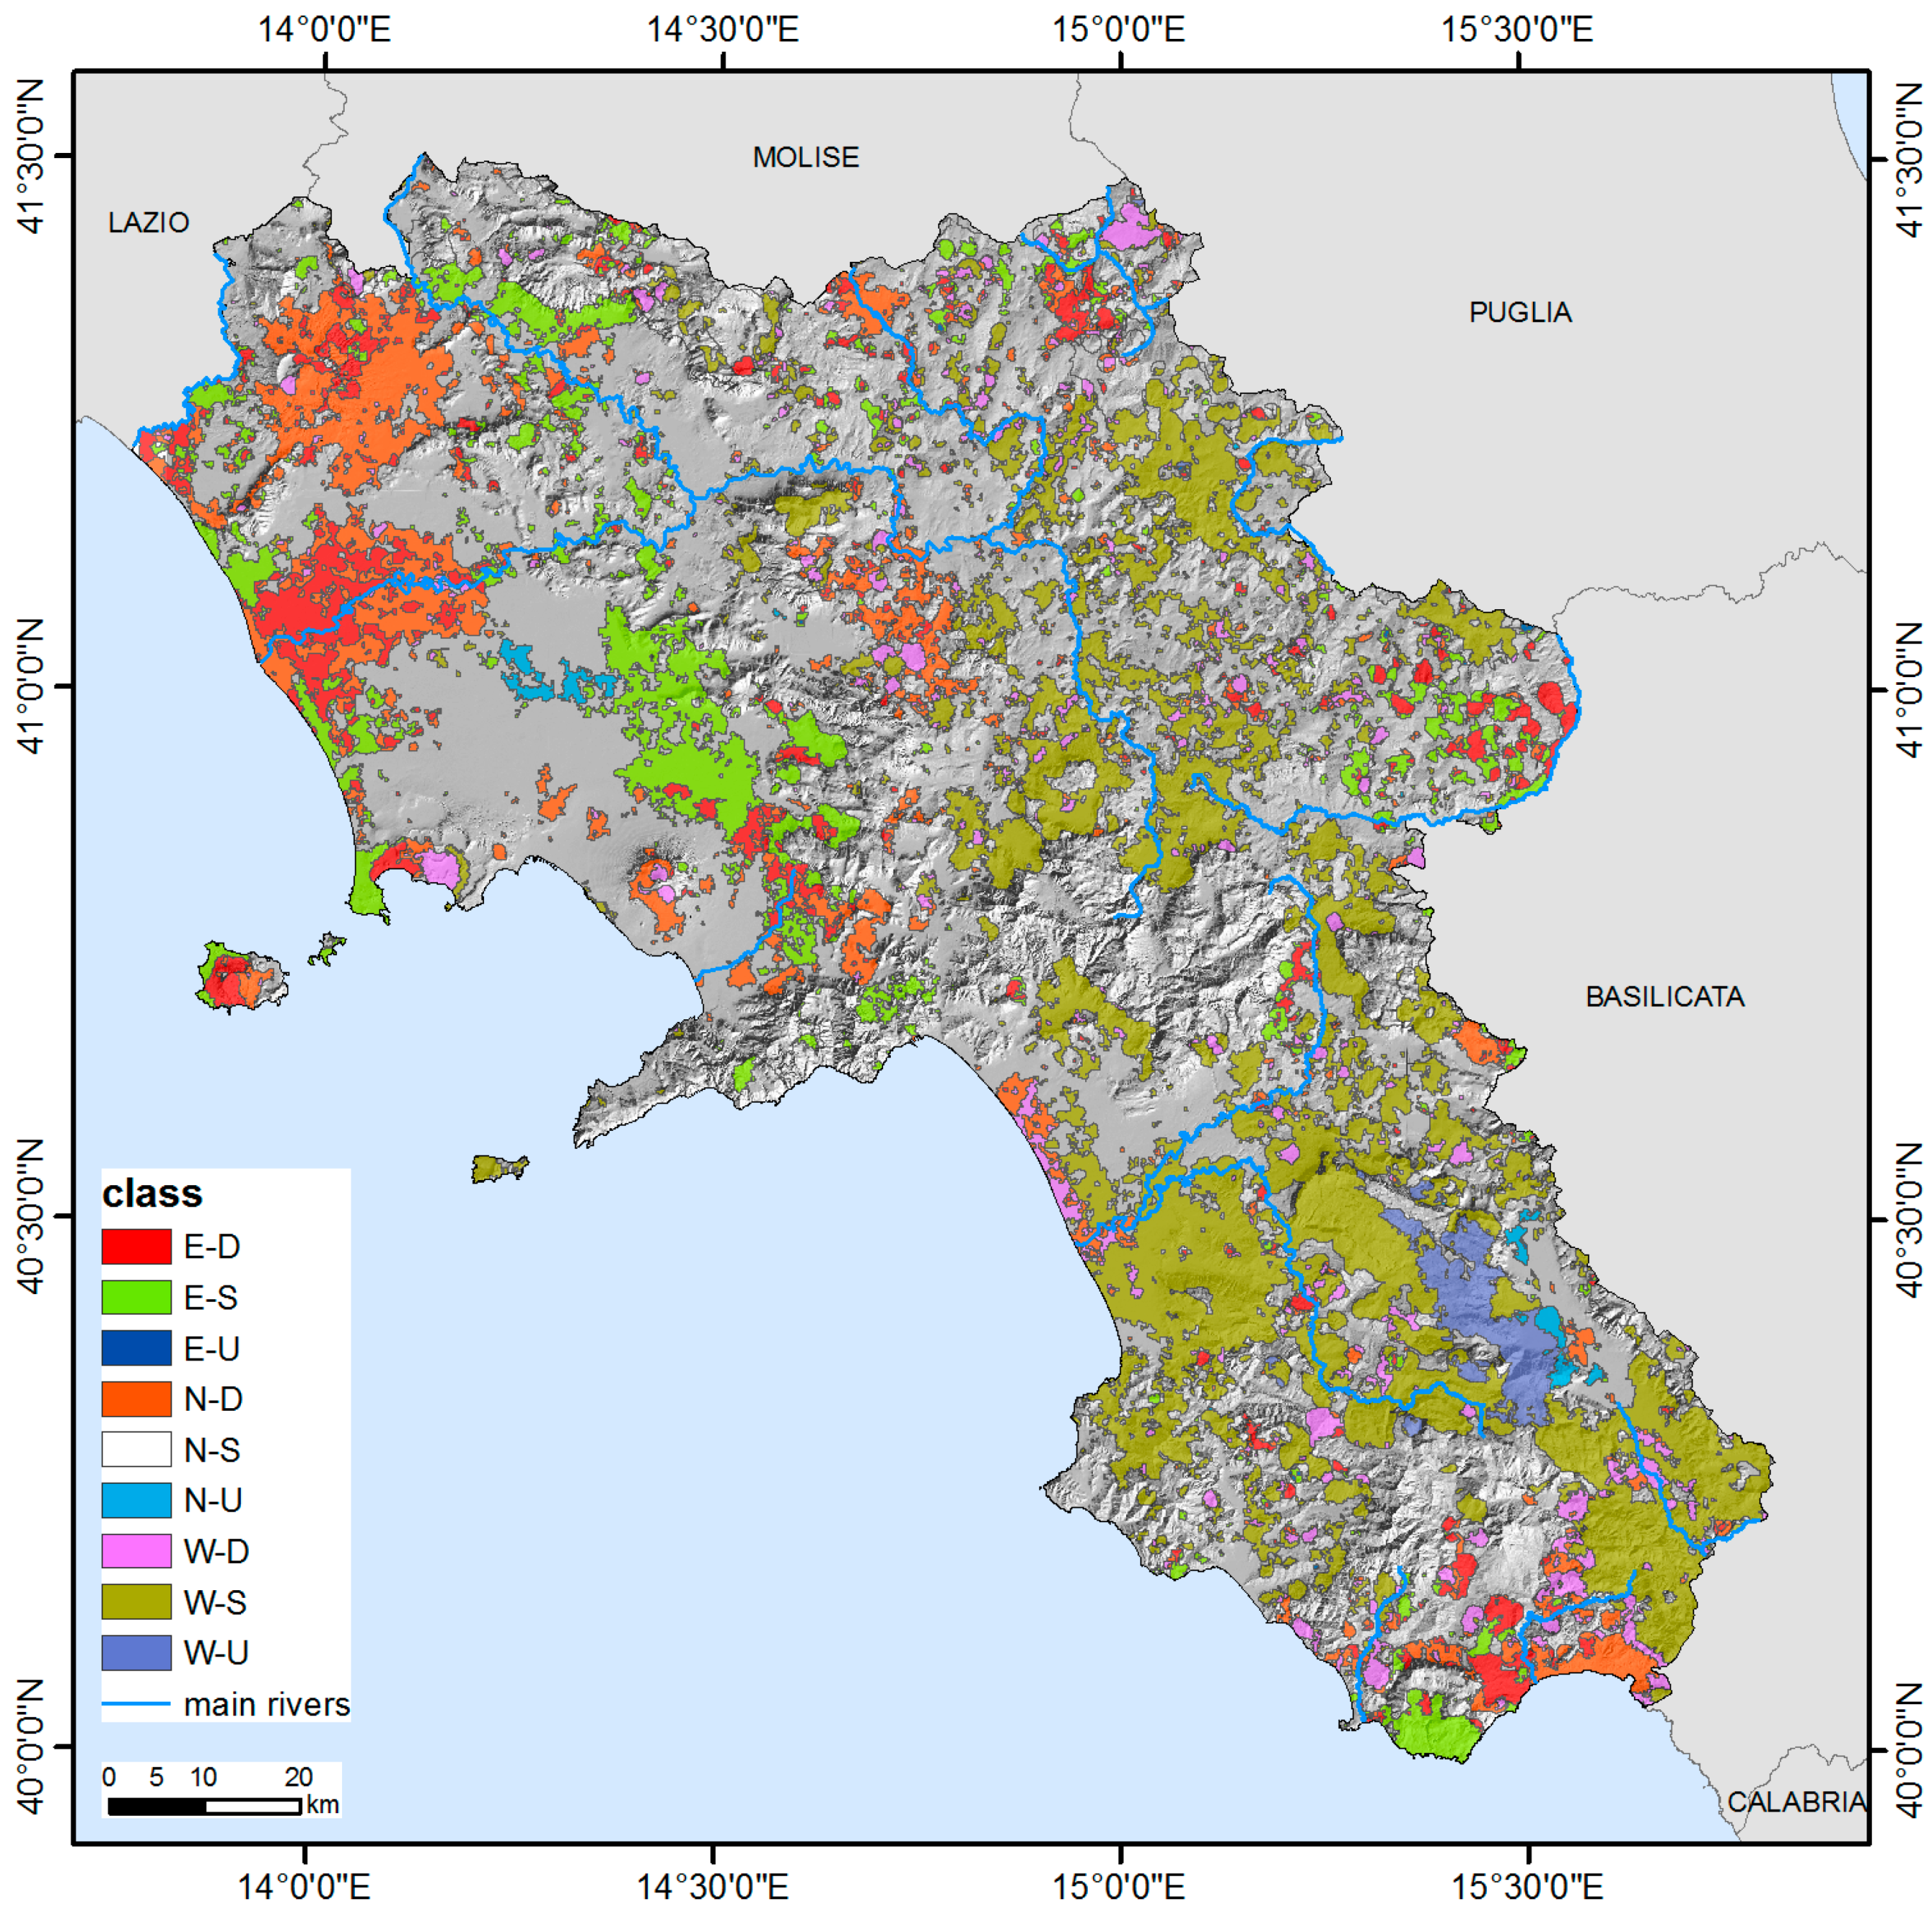
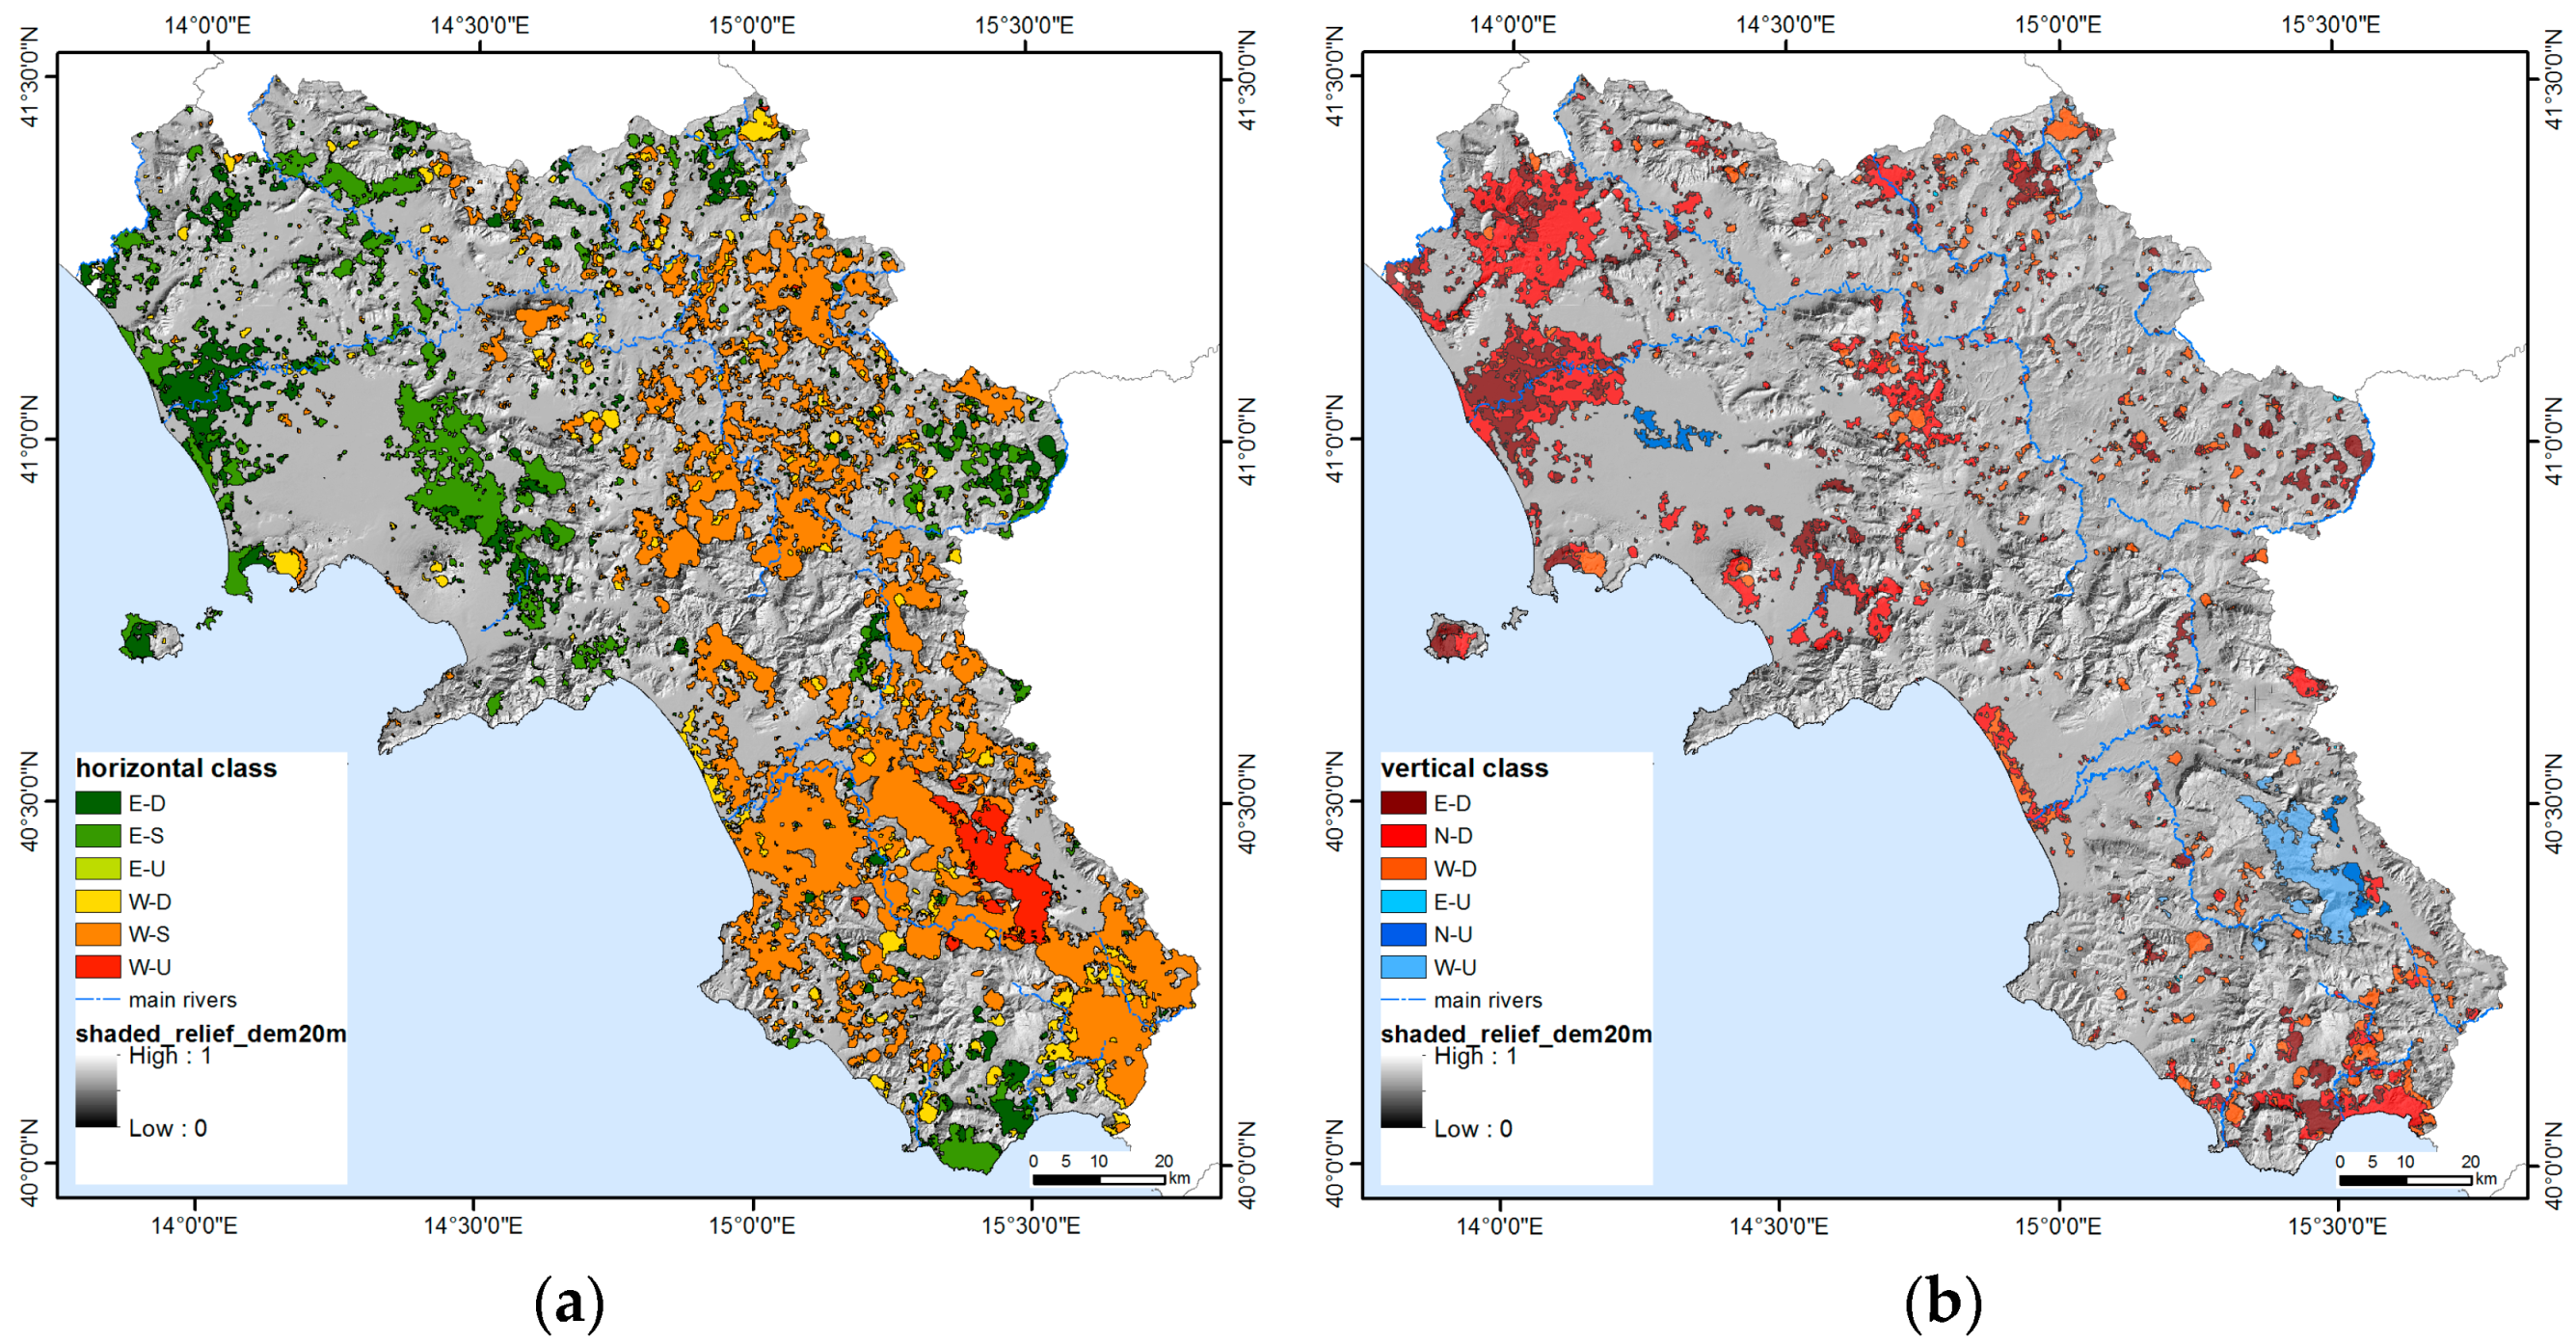
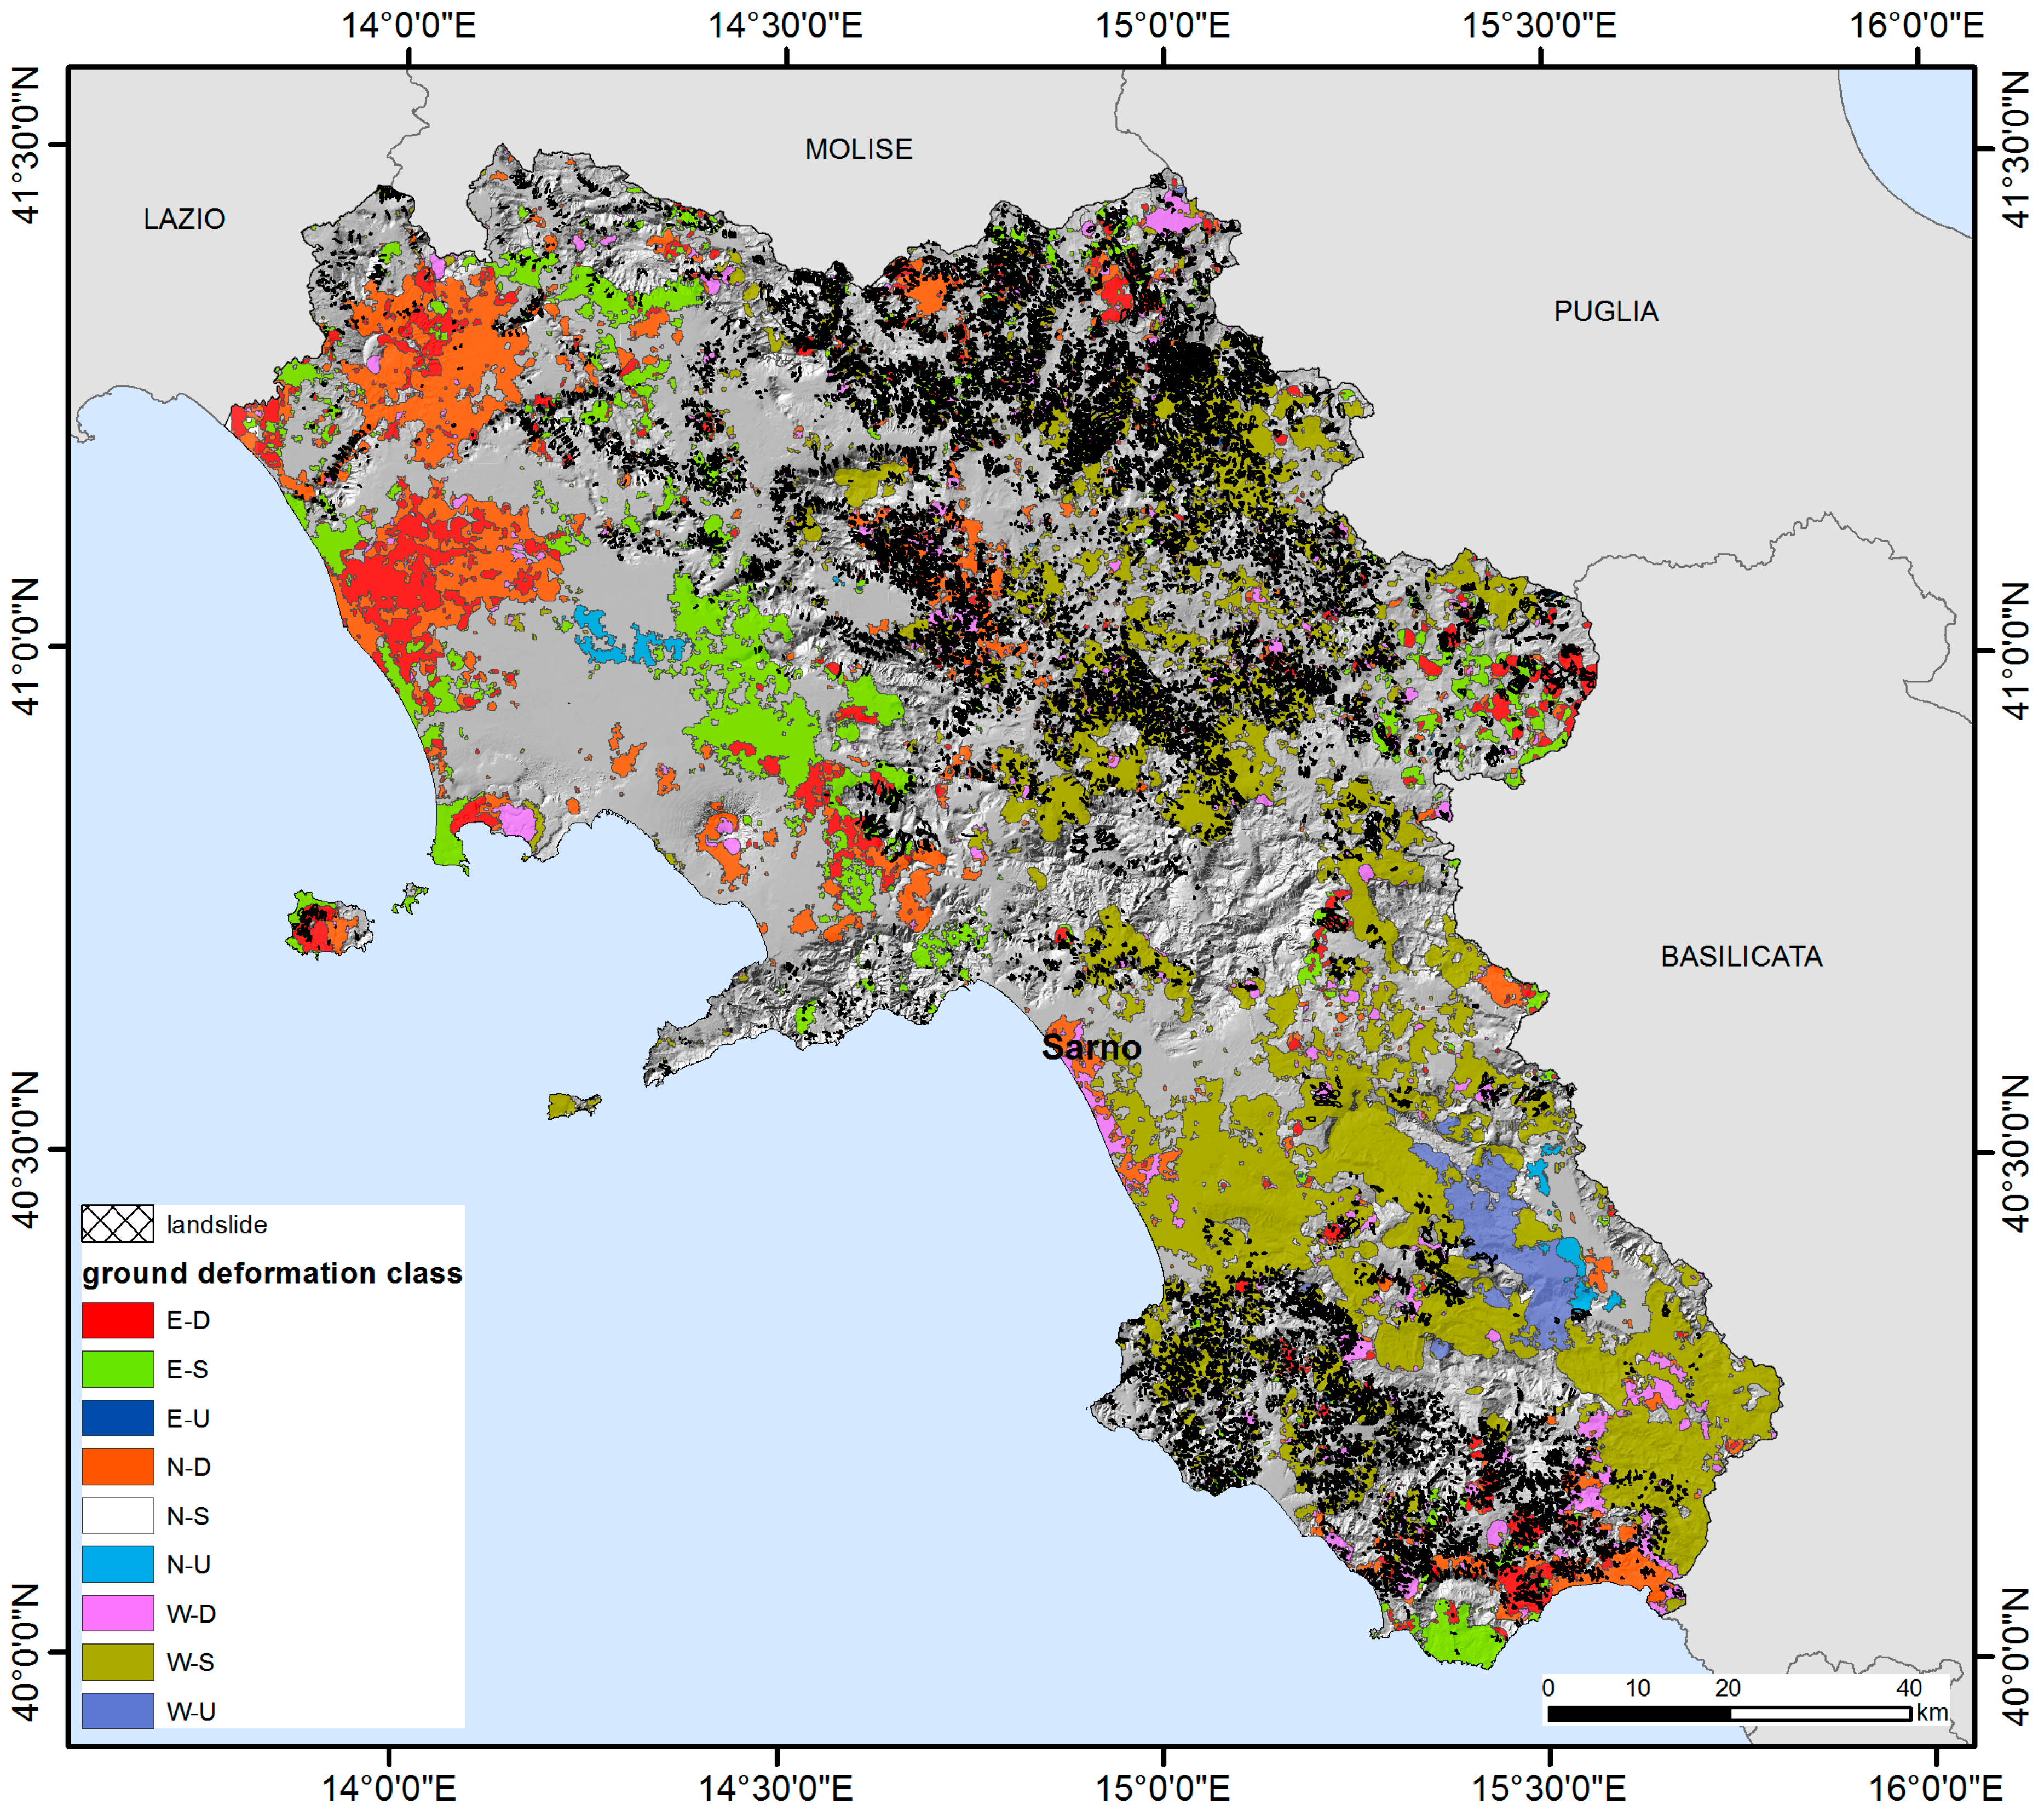
4.2. Ground Deformation Classification

The PSI post-processing for the ground deformation classification allowed the classification for almost all (96.8%) of the regional territory (Table 5). The S-N class characterizes the main part (ca. 57%) of the regional territory and designates stable areas during 1992–2010, where SAR signals do not have recorded significant horizontal and vertical component of ground deformation (Figure 7). The other eight classes characterize areas affected by at least one component of ground deformation with an average annual rate greater than +1 mm/yr or lower than −1 mm/yr.
The most common class (19.7%) is the W-S where only a westward horizontal component was recognized. This deformation type affects large inner hilly and mountainous sectors of Irpinia and Cilento (Figure 8a). The other main common classes are the N-D class (7.5%), where only a subsidence signal was recognized (Figure 8b), and the E-S class (6.7%), characterized by an eastward horizontal component (Figure 8a) mainly affecting coastal and intra-montane plains.
The final ground deformation classification maps (Figure 7) include only features extending more than 0.1 km2 in order to exclude too local deformations. If the areal extension of the mapped classified areas is considered (Table 6), the main part of them falls within the local ranges 0.1–1 km2 and 1–10 km2. The largest classified area (>1000 km2 range) and some others in the intermediate ranges (10–100 km2 and 100–1000 km2) are referred to as stable sectors (class N-S).

5. Analysis of Regional to Local Ground Deformation

In the following, the large scale ground deformation trends occurring in the different sectors (coastal plain, inner plain, Apennine sector, volcanic areas) of the Campania territory were analyzed in light of the available tectonic, volcanological, hydrogeological, geomorphological, and land use data. In addition, some examples of local scale ground deformations are described to show the potentiality of the used approach.

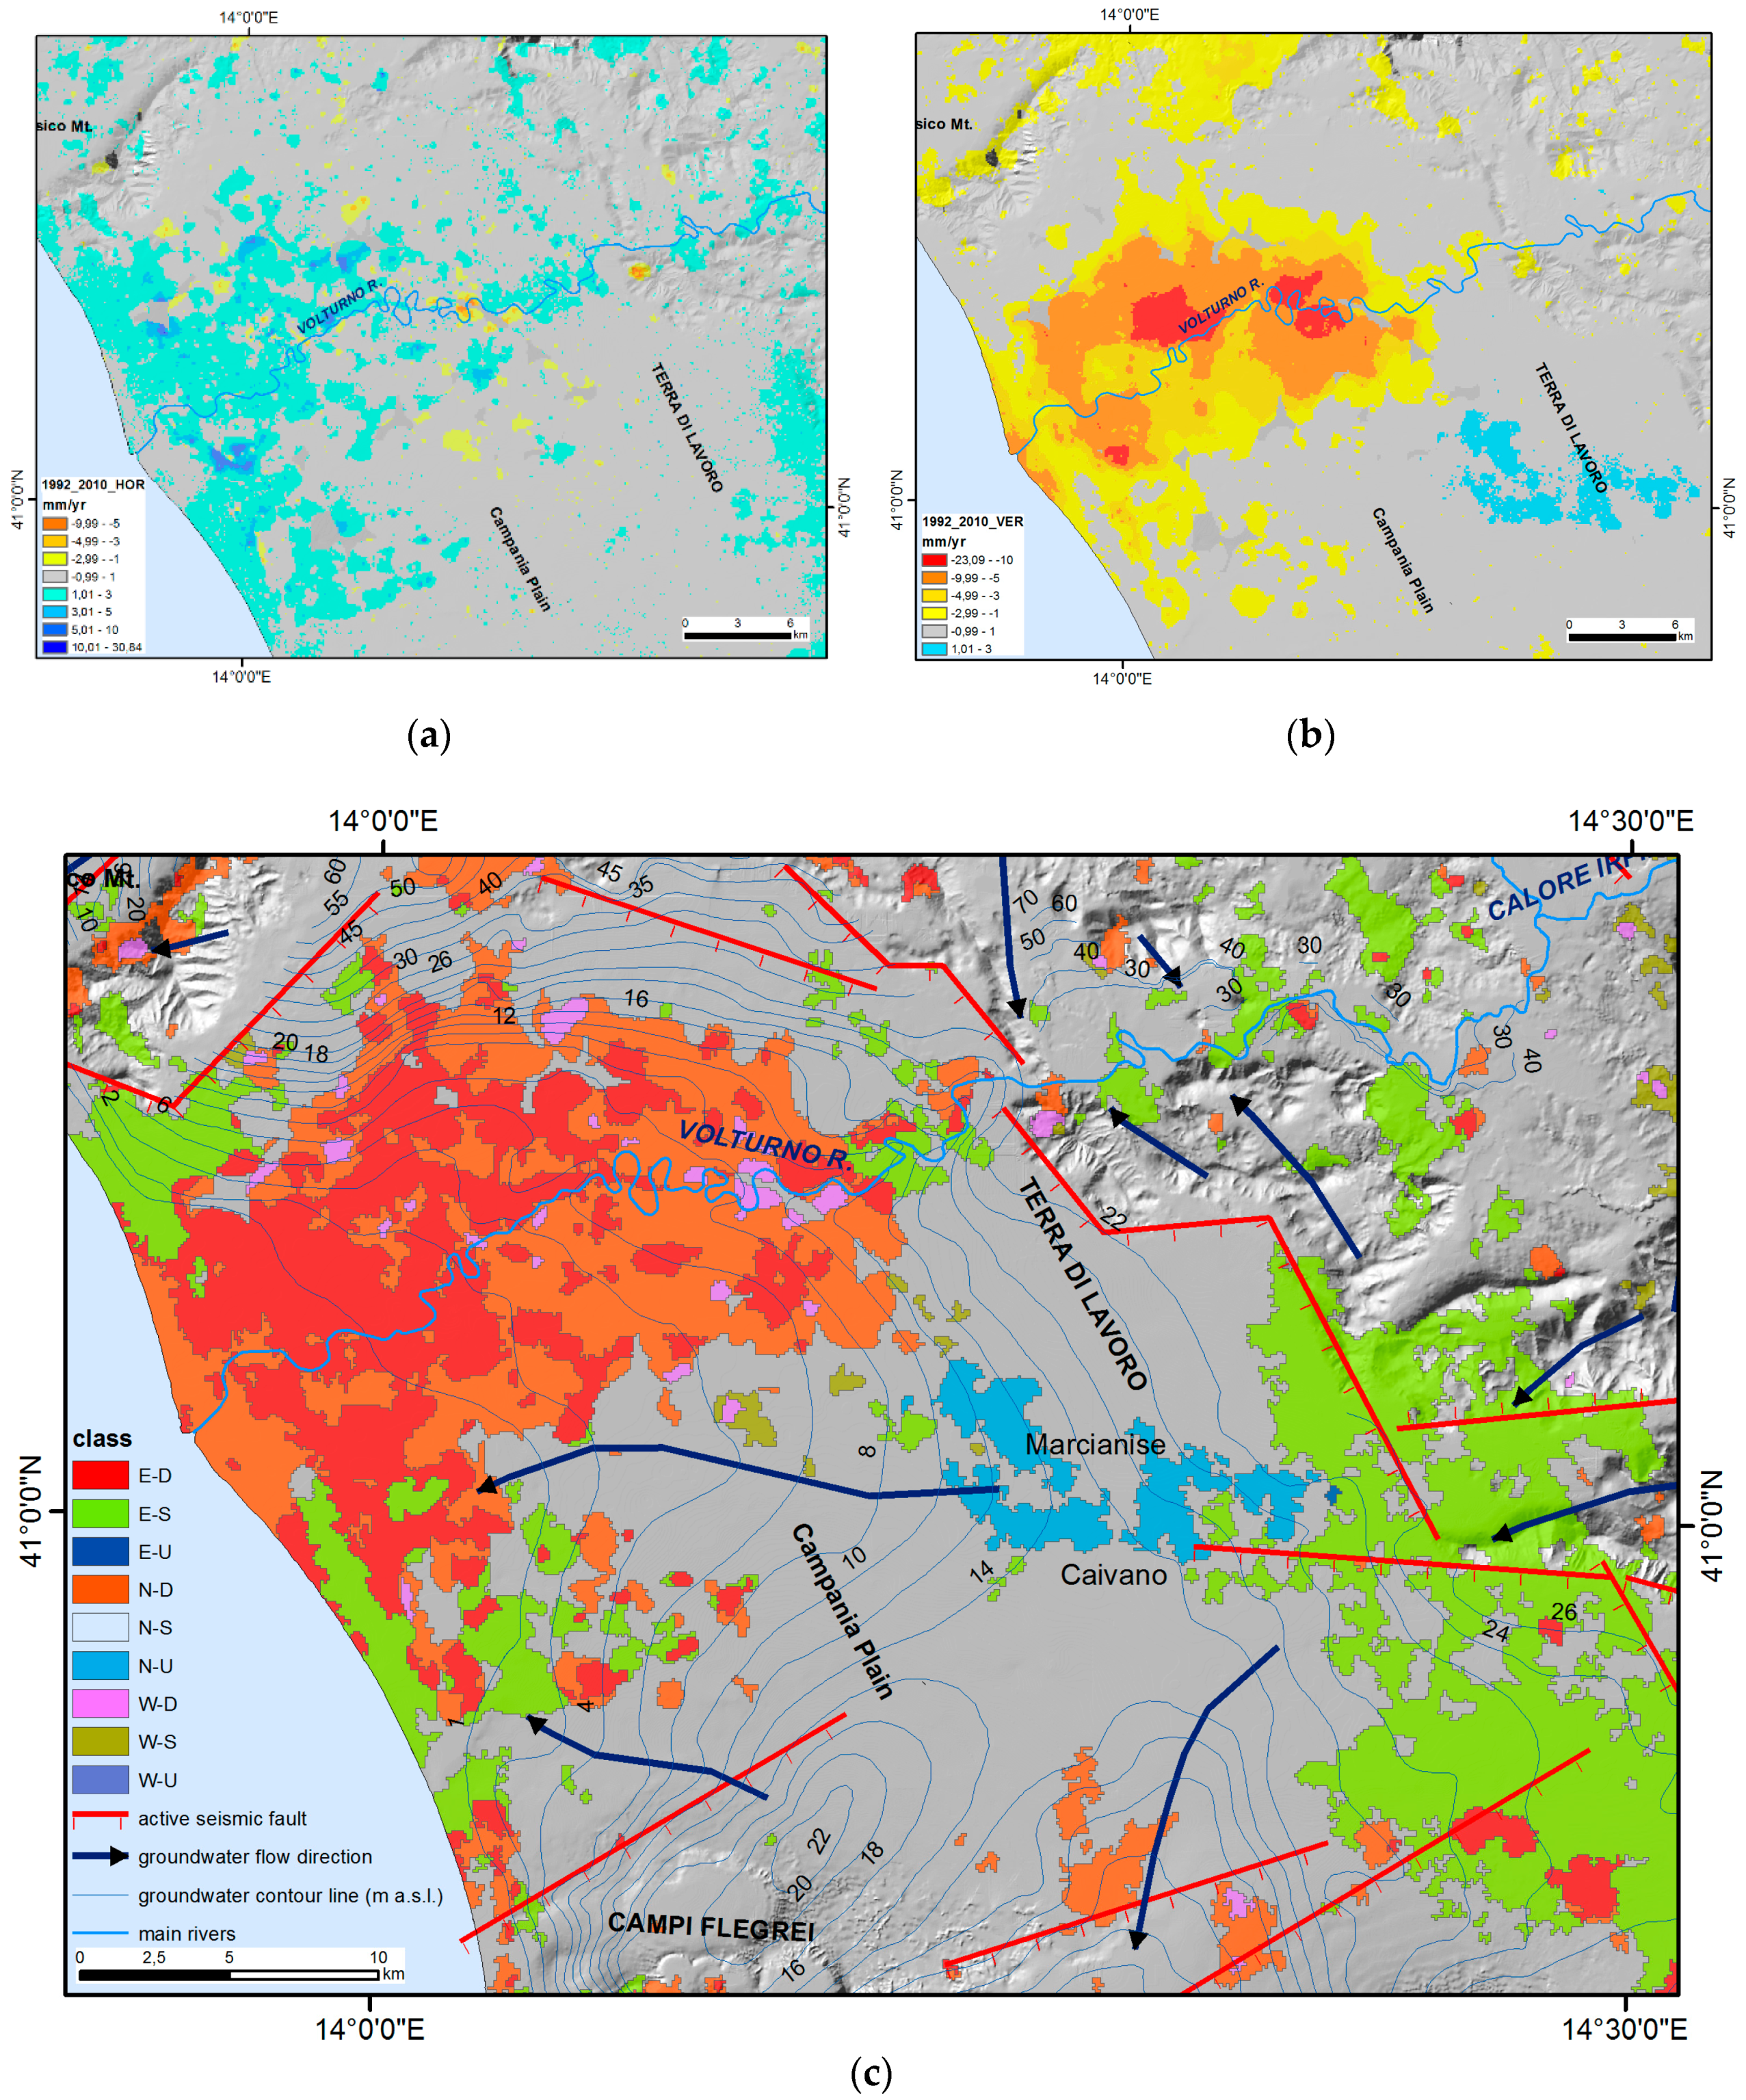
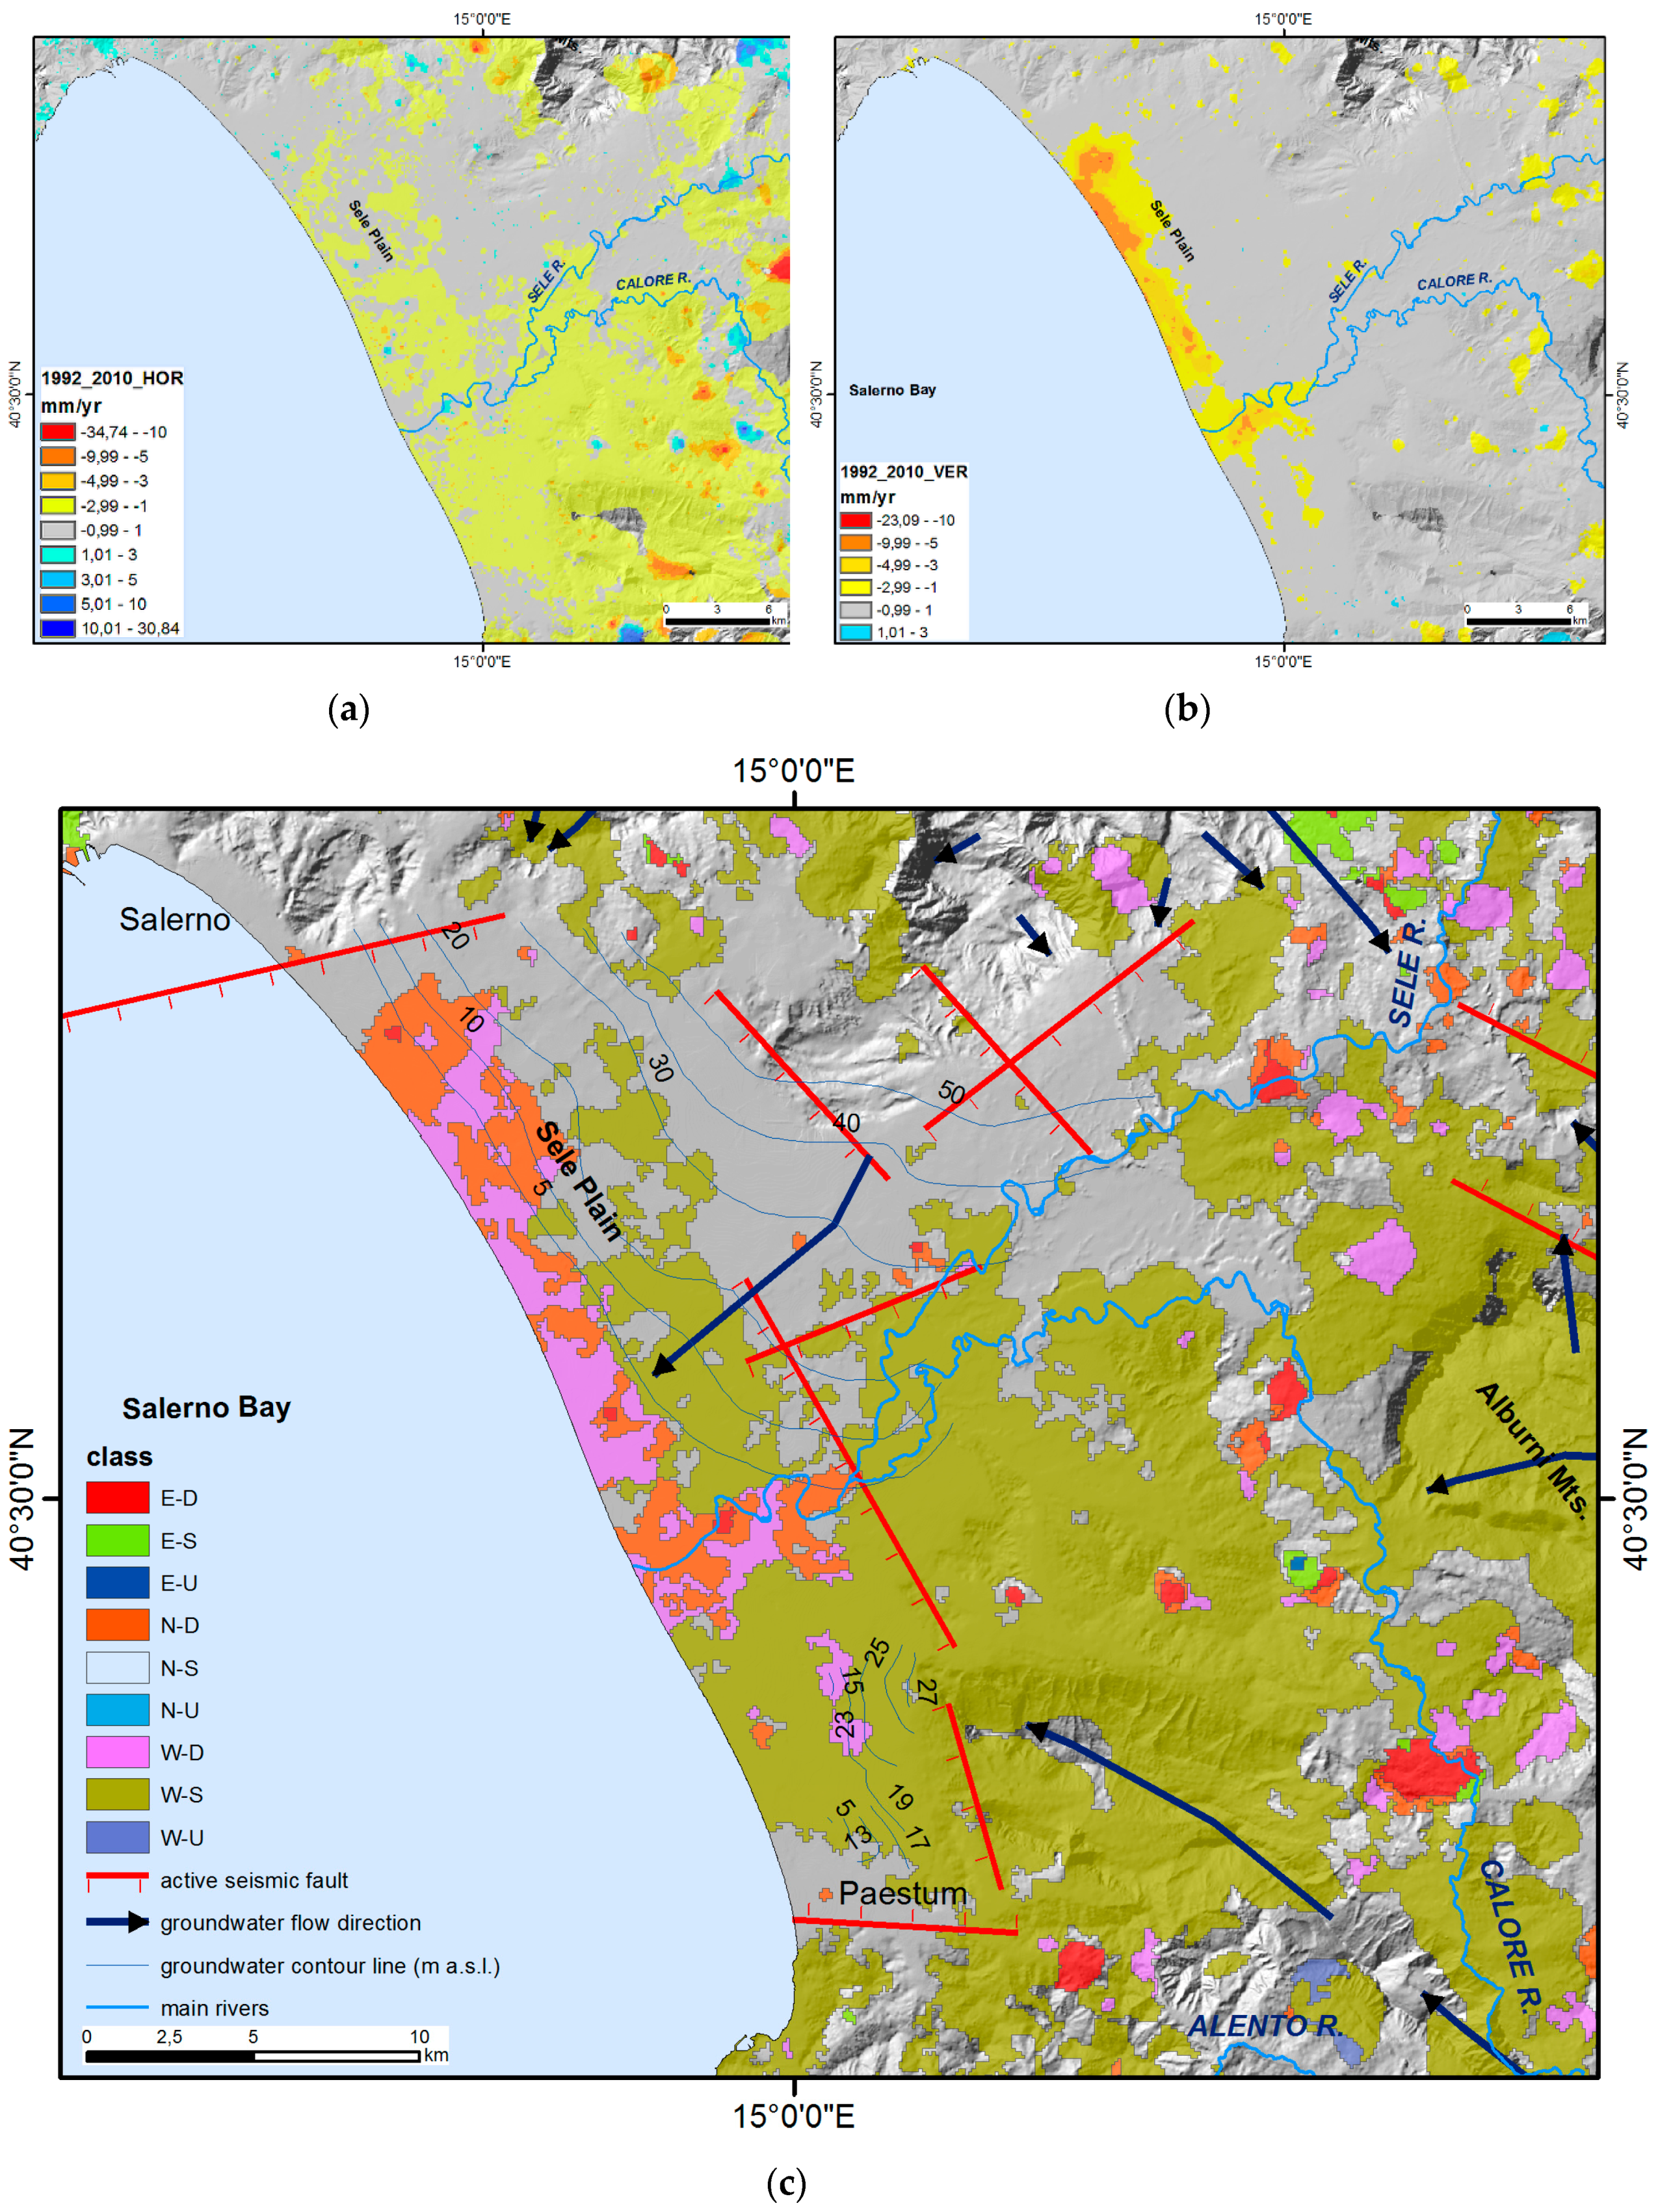
5.1. Coastal Plain Sectors

The Campania coastal plain sectors fall within the passive continental margin of Tyrrhenian Sea affected by a long-term tectonic subsidence process characterized by large-scale downward movements [27,28,61] with an average rate of about –0.2 mm/yr [62]. The analysis of the vertical component of ground deformation within the main coastal plains (Garigliano, Volturno and Sele rivers alluvial coastal plains) highlights the presence of wide low coast sectors characterized by strong subsidence movements with −2.5 mm/yr average rates, while Sarno and Alento rivers alluvial coastal plains show lower average rates (ca. −0.5 mm/yr).
The subsidence of alluvial coastal plain can be considered as a natural process mainly due to the compaction of the alluvial sediments infill under the lithostatic load, and the anthropic influences due to water pumping and urbanization loads are only additional factors that locally enhance the subsidence effects [17,18]. In Volturno, Sarno, and Sele river plains urban areas the subsidence-induced ground displacements due to groundwater withdrawals have relevant consequences to the exposed facilities [63,64]. The coastal subsidence phenomena are contributing to increasing the exposure of the subsiding low coastal areas to hazards related to inundation and erosion processes, and may cause a further increase in future relative sea level rates at local scale [17,65].
The vertical displacement values obtained for the Volturno river plain show a significant subsidence in the central axial sectors (−2.5 to −22 mm/yr) and in the river mouth area (−2.5 to −8 mm/yr). Moderate uplift is detected in the eastern part of the plain (+0.5 to +2.0 mm/yr), whereas other sectors of the study area are characterized by moderate subsidence and/or stability. A general eastward trend is also recognized (Figure 9).
The subsidence recorded in the Volturno plain is mainly a consequence of a natural process related to the compaction under the lithostatic load of the fluvial and palustrine deposits that form the alluvial plain. The magnitude of the recorded subsidence has been found to be greater when thick peat layers occur in the subsoil [18]. The anthropic influences (e.g., water exploitation and urbanization) is able only to locally increase the subsidence effect [18], while in some sectors the negative balance between the water recharge rates of the Volturno hydrographic basin and the drainage operated by the artificial channeling, related to industrial and intense agricultural activities [5,66], may have larger effects on subsidence rates.
The uplift recognized in the eastern sector of the plain is related to the interplay between tectonic activity and hydrogeological conditions (Figure 9). The uplift can be due to the action of an E-W oriented active fault that bounds the area to the south [18]. Besides, the study area is characterized by a porous multi-layered aquifer system, formed by volcaniclastic and alluvial deposits, and the groundwater circulation can be considered unitary in the aquifer system. If the local hydrogeological conditions [67,68] are considered, the area is located on a minor groundwater divide (i.e., Caivano-Campi Flegrei, Figure 9) that is recharged by lateral groundwater flux coming from adjoining carbonatic aquifer sectors made by the calcareous massif bordering to the east the Campanian plain. In these conditions, the water fluxes may locally increase the soil pore pressure causing local soil oversaturation, which could be able to partly explain the local uplift observed in the Marcianise-Caivano sector.
The ground deformation components and classification (Figure 10) show that the coastal sector of the Sele Plain is characterized by a general westward horizontal deformation and a complex vertical pattern, validated by GPS surveys [17]. The northern and central sectors of the plain are characterized by relative subsidence rates of about −3 to −7 mm/yr along the coastline and by stability in the hilly inland area; around the Sele river mouth, a narrow area with subsidence rates up to −8 mm/yr is present, while the southern sector is characterized by general condition of stability with minor subsiding areas.
The vertical ground deformation pattern is correlated with the non-uniform stratigraphy of the coastal Quaternary infill because of the presence of layers of clastic sediments with different thickness and degrees of compaction in the two sectors. In detail, the subsidence is higher in the northern sector of the plain, where the Quaternary alluvial-coastal deposits are thicker because of the structural asymmetry of the graben, while in the southernmost sector the rates are the lowest recorded in the plain due to the minor thickness of Holocene deposits and to the presence of very thick sedimentary bodies of travertine [17]. These differences in ground deformation rates expose the northern and central sectors of the plain to higher levels of inundation and erosion hazard than in the southern sector [17]. The contribution of the local tectonic deformation pattern could suggest prevailing dip-slip movements along the NNW–SSE striking faults and the E-W trending faults bounding the Sele coastal plain [5].
Sarno and Alento river plains show lower rates of subsidence in the coastal sectors (Figure 5) [65]. The Sarno river coastal plain is characterized by moderate subsidence (up to −5 mm/yr) only near the river mouth, while the Alento river coastal plain shows low subsidence rates (up to −2 mm/yr) in the northern sector, while the coastal narrow strip displays stability. Along the Alento River course, a hot spot of subsidence (up to −3 mm/yr), developing 1–2 km inland, is more evident.

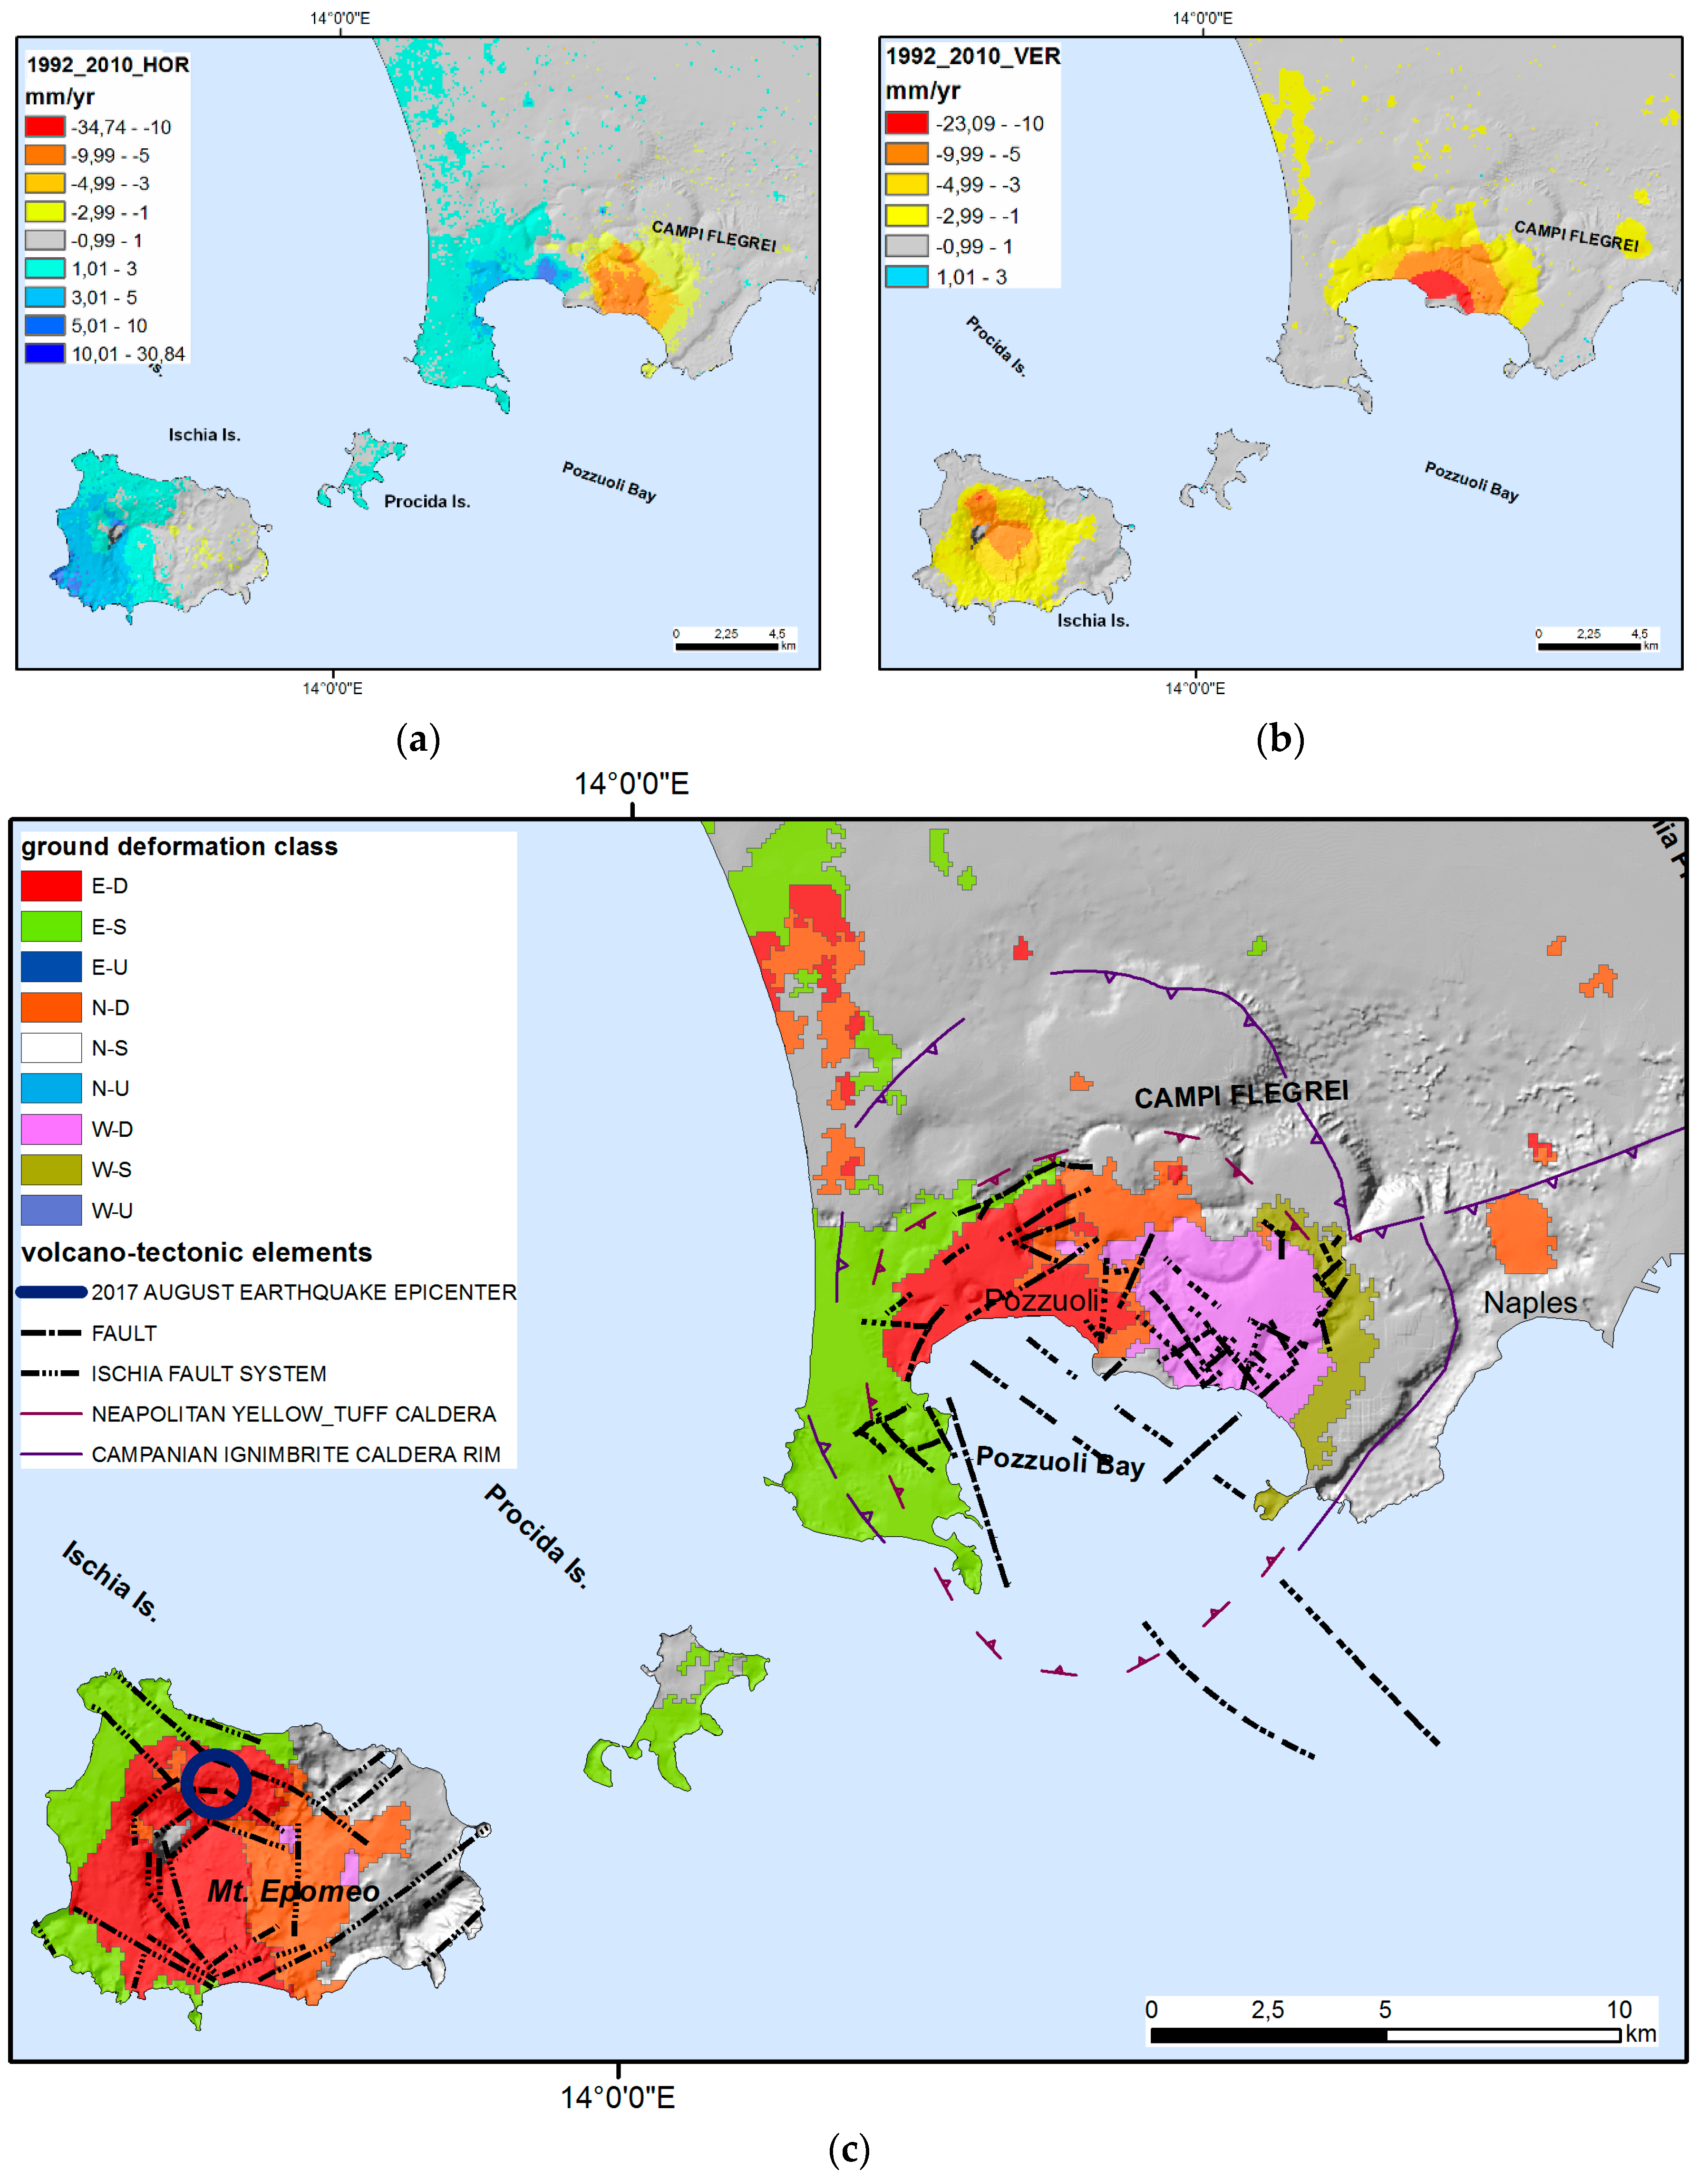
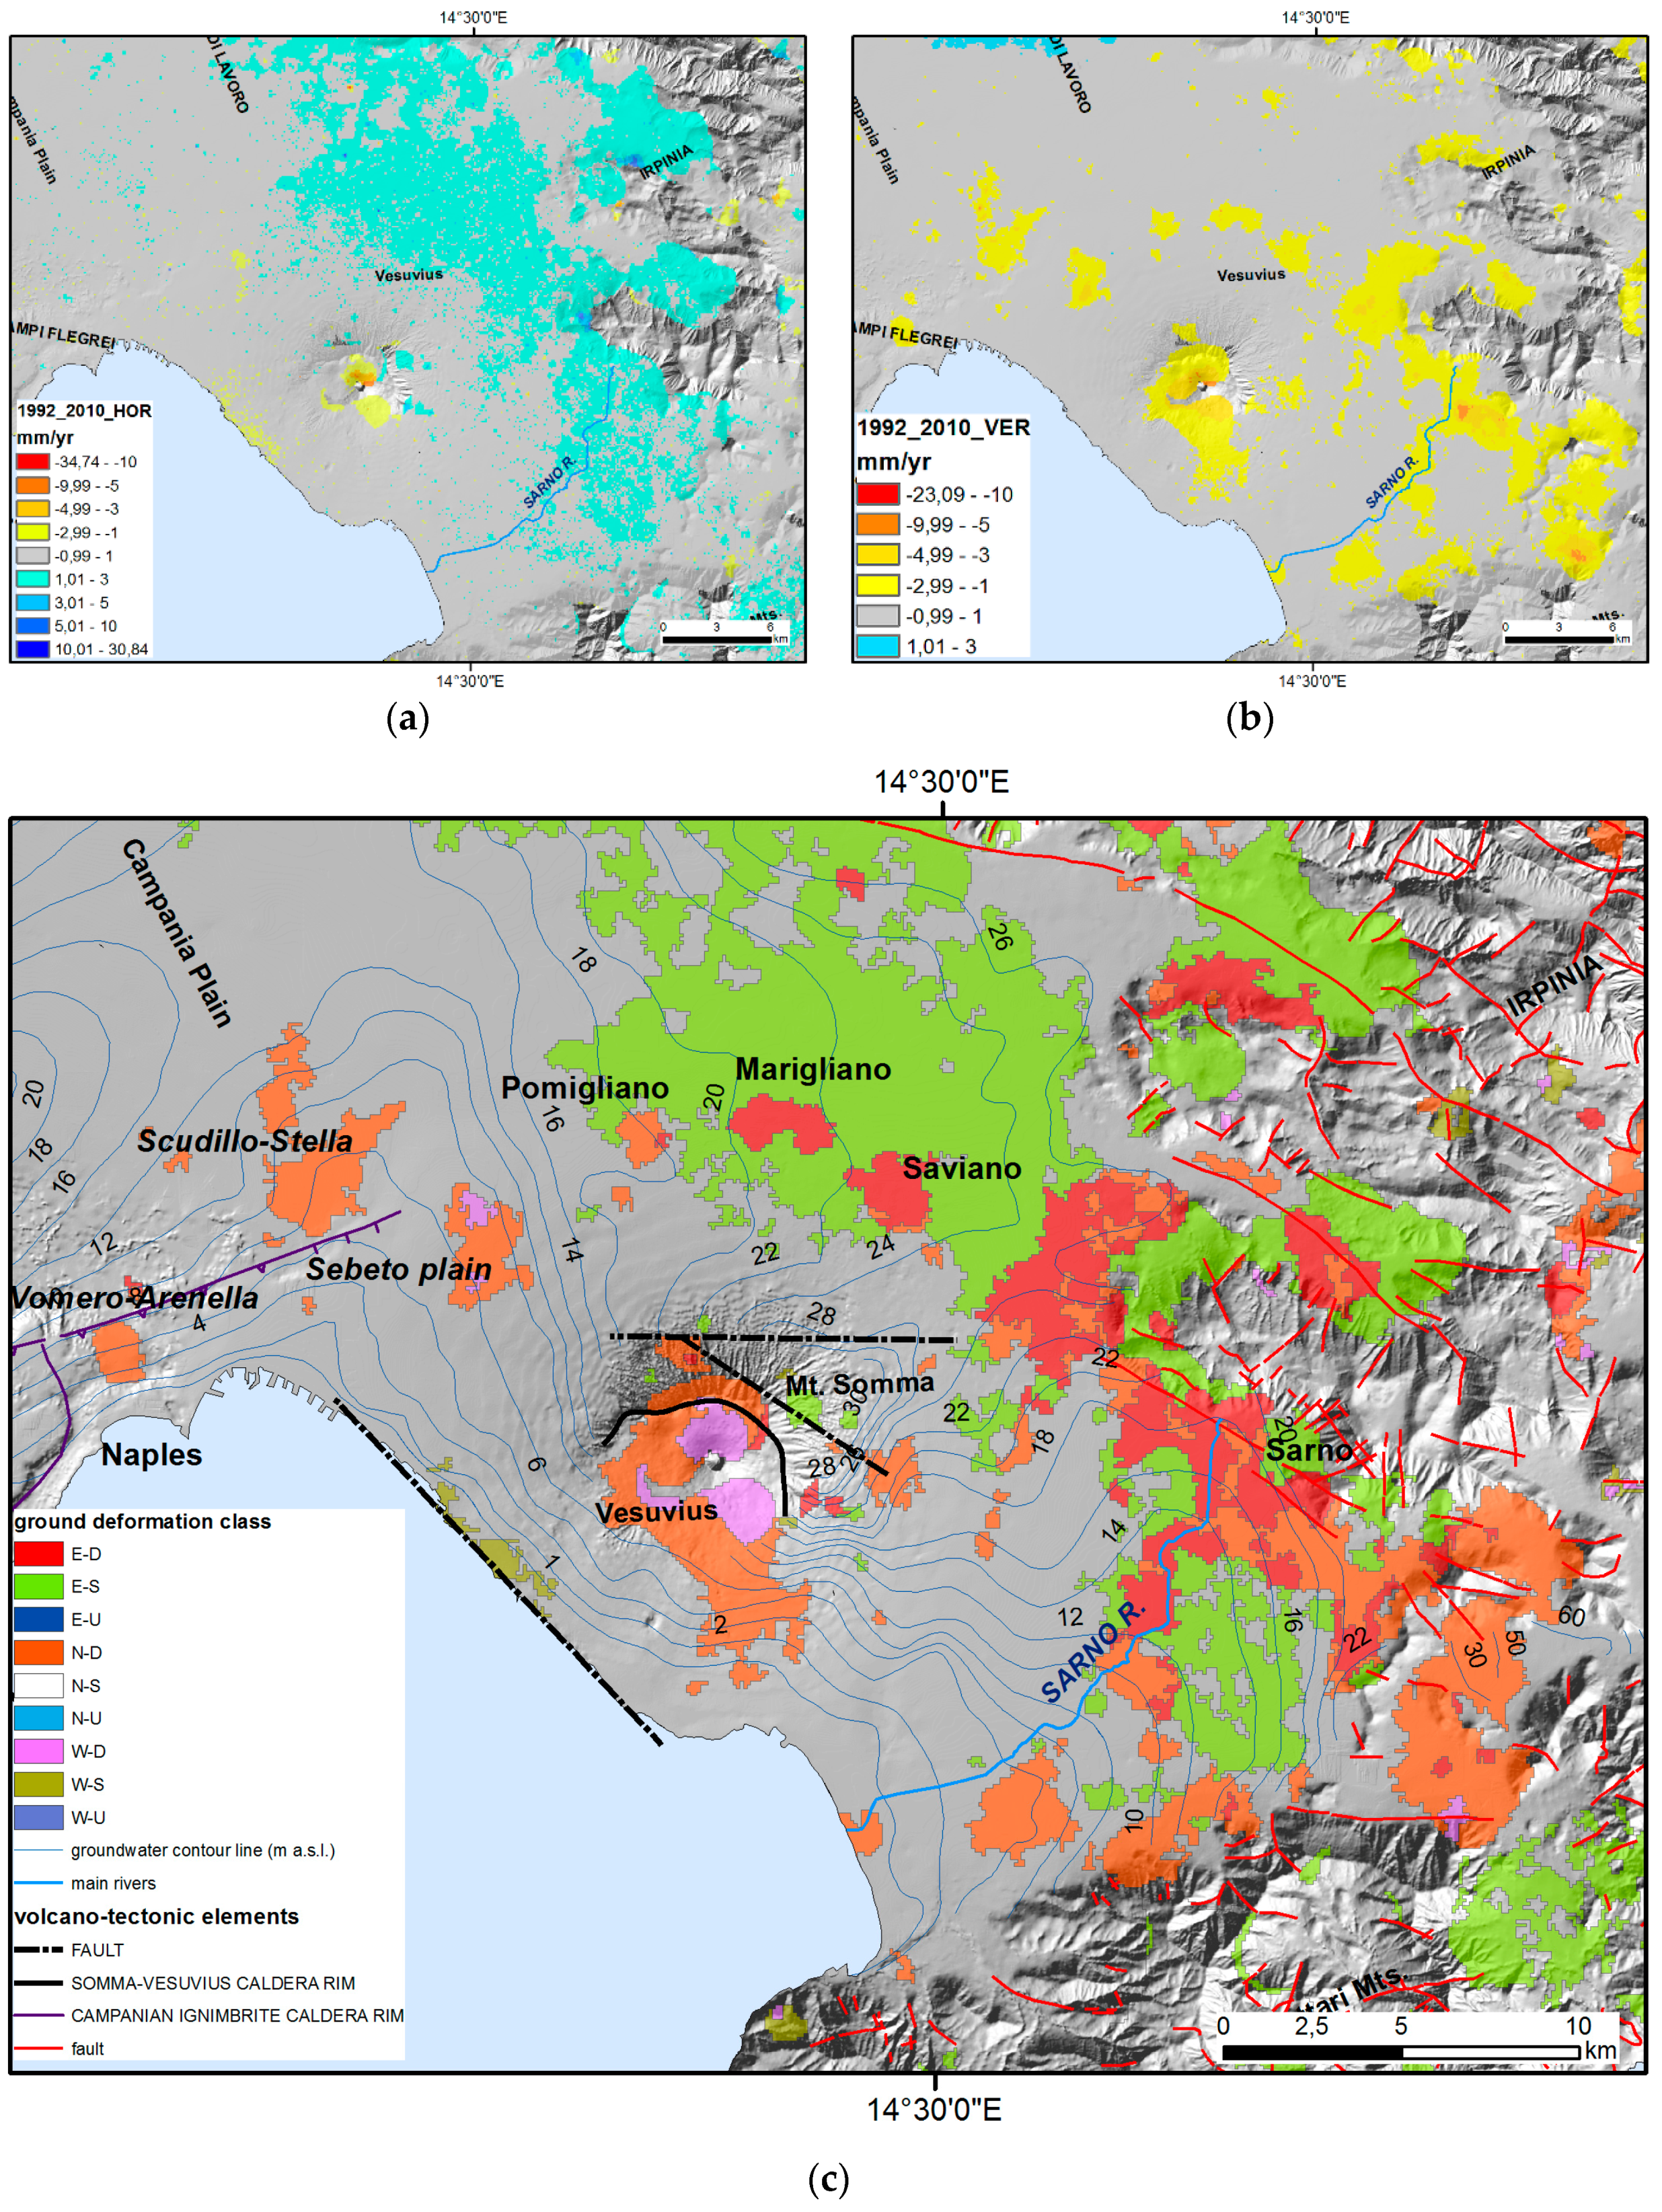
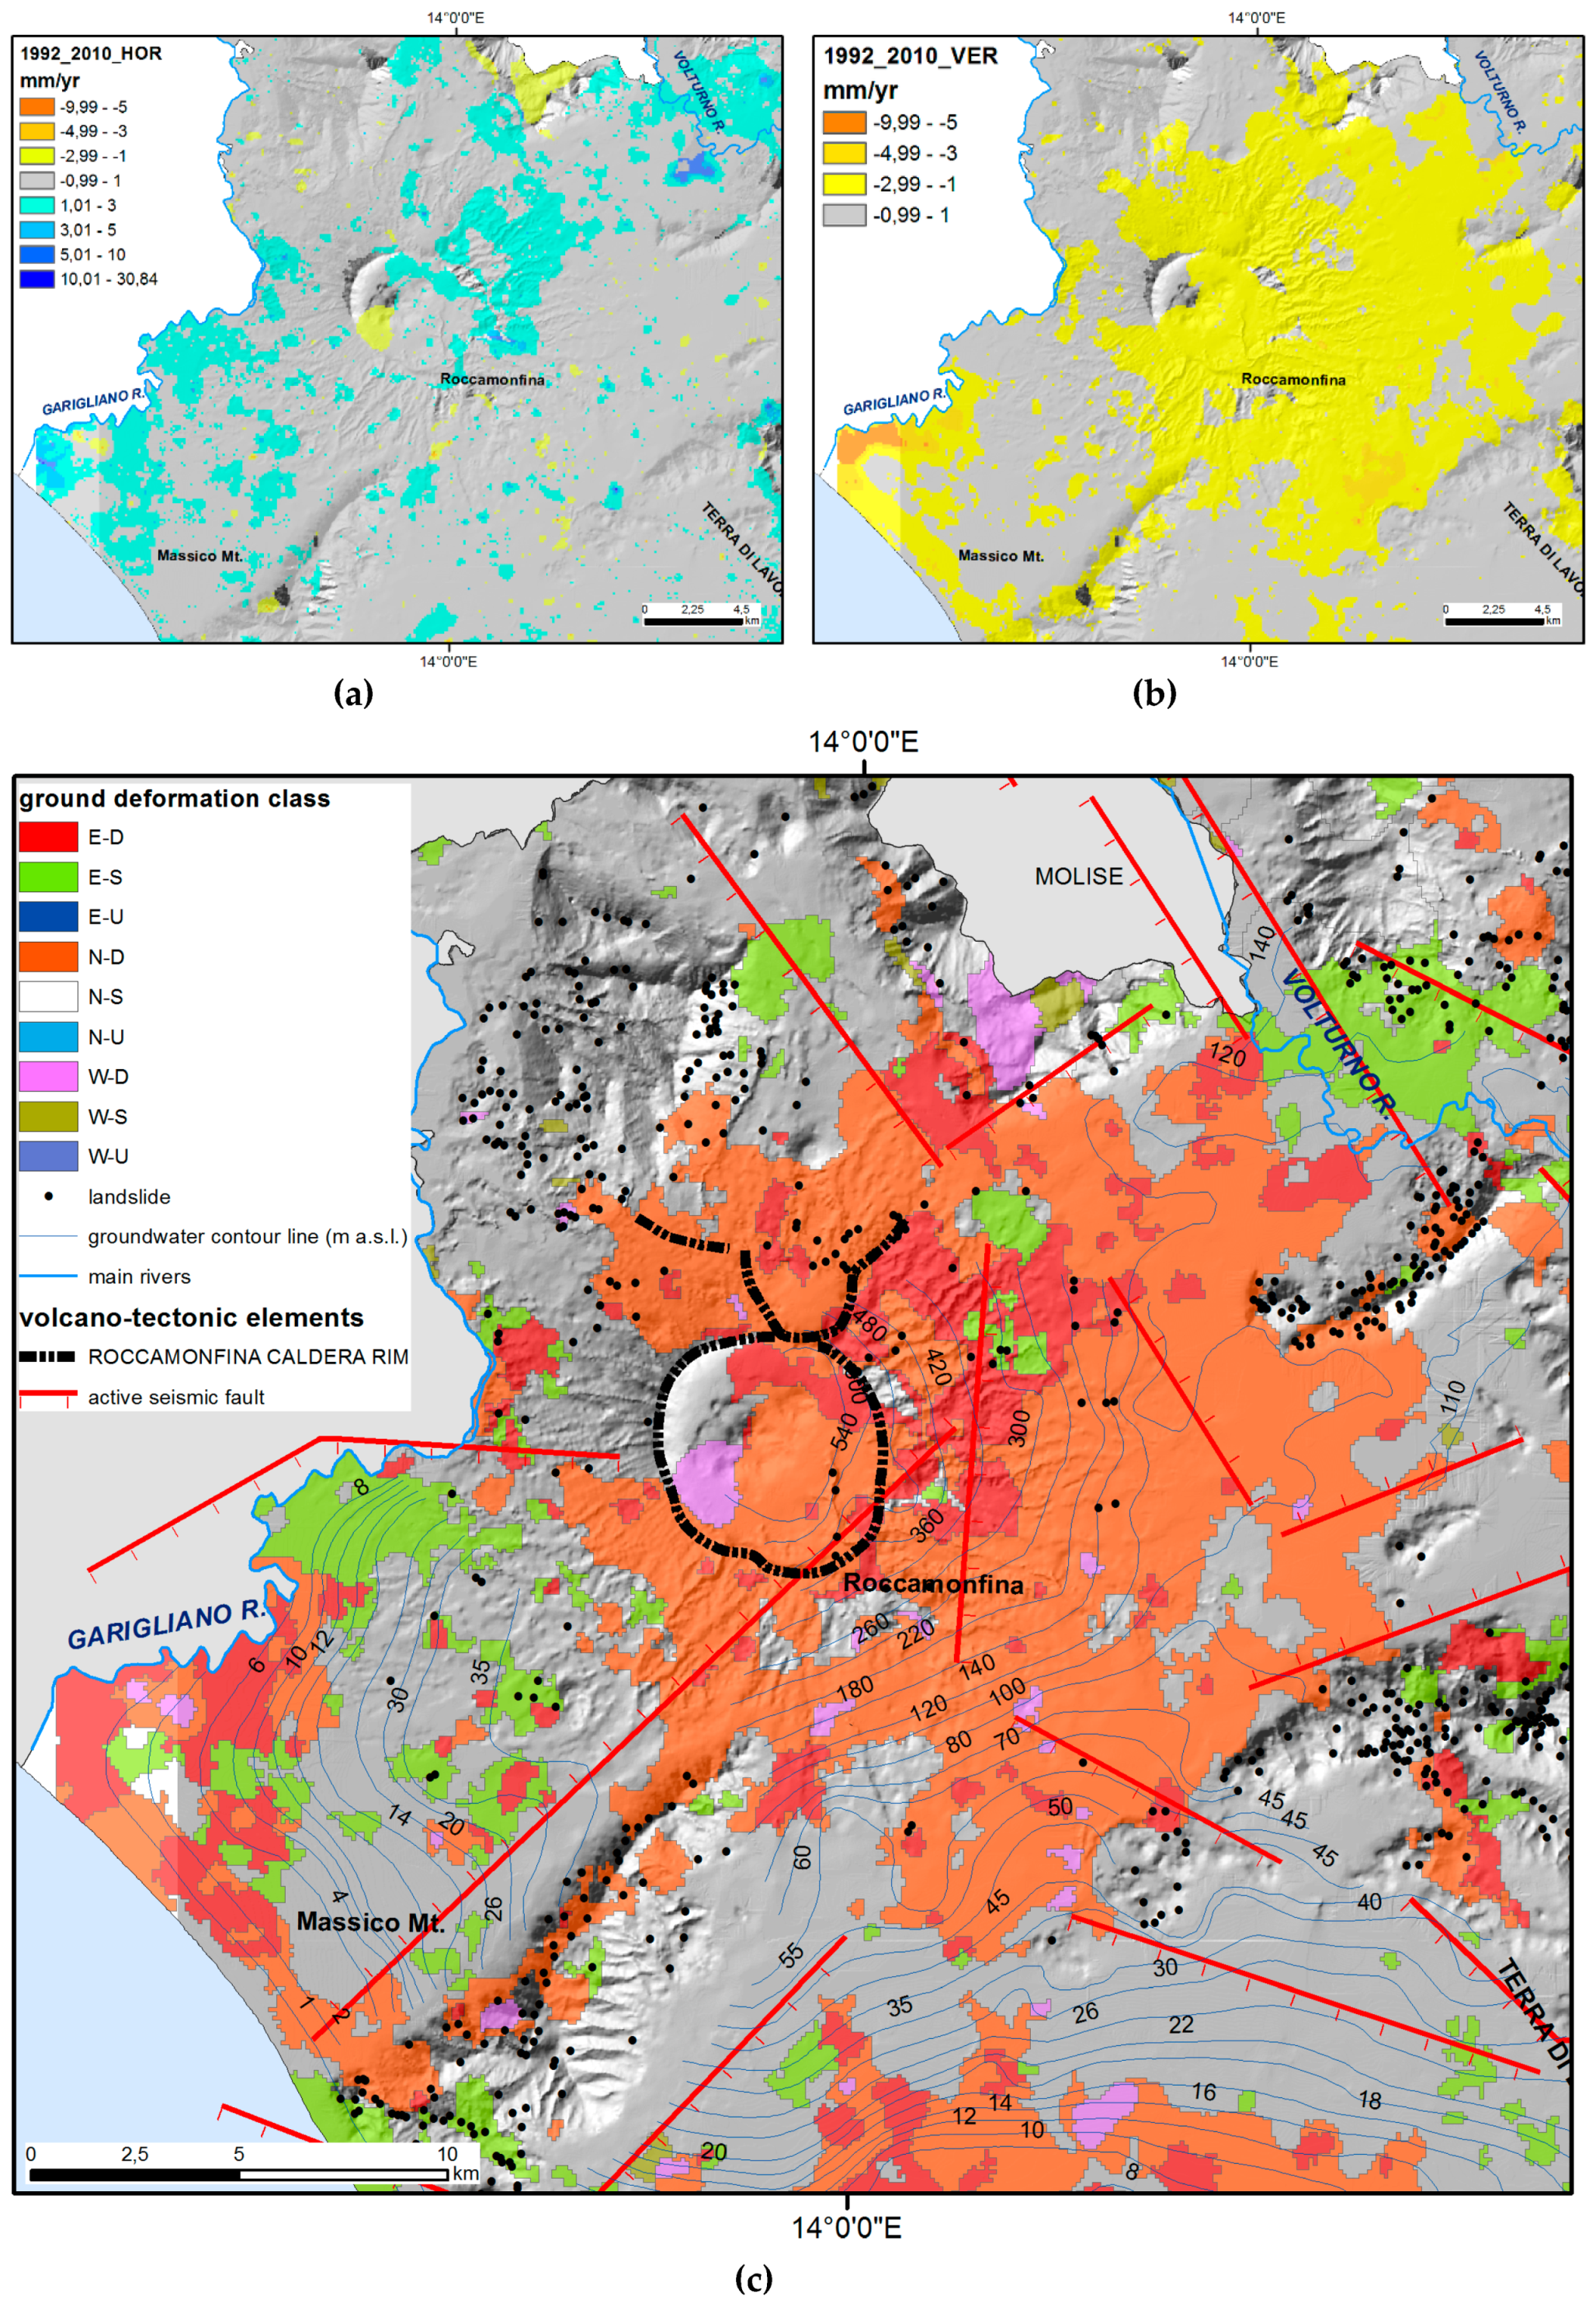
5.2. Volcanic Sectors

Ground deformation in active volcanic areas of Vesuvius, Campi Flegrei and Ischia has been extensively studied with PS-InSAR techniques (in [5,14] and references therein), while no ground deformation analysis has been done about the not active Roccamonfina volcanic system.
The ground deformation patterns referring to the whole 1992–2010 period (Figure 11) show that the eastern sector of Campi Flegrei is characterized by westward velocity whereas the western sector is characterized by eastward velocity with maximum values in the caldera central area (around Pozzuoli), where also subsidence increases. This is only a cumulated deformation related to the different contribution experienced during the 1992–2010 period. In fact, at Campi Flegrei, after a strong uplift (about +3.30 m in Pozzuoli city center) occurred during the two 1970–1972 and 1982–1984 bradyseismic crises, a general subsidence (about −1.00 m in city center) between 1985 and 2004 has been followed by still growing uplift phases (about +0.60 m in city center). This assessment is based on levelling and GPS surveys made by INGV-Osservatorio Vesuviano [38].
Referring to the time interval of SAR acquisition (June 1992–July 2010), the Pozzuoli city center experienced a subsidence of about 30 cm from mid-1992 to late-2004 followed by an uplift of about 10 cm from early 2005 to mid-2010, causing a net subsidence of about 20 cm if referring to the whole period 1992–2010 (see benchmark 25A in [38]). This ground deformation pattern is representative of the whole caldera area, even if with lower magnitudes in peripheral sectors. The largest ground deformation is localized within and around the structural border of the Campi Flegrei caldera and a systematic recurrence of opposite trends (uplift vs. subsidence) in the ground deformation of the inner caldera region with respect to the surrounding areas has been recognized [16]. The analysis of PSI velocity and acceleration annual variations also revealed intense yearly dynamics of the Campi Flegrei caldera collapse-resurgence system. This ground deformation field, combined with the re-activation of the caldera ring-faults, intra-caldera faults, and eruptive fissures, indicates a contraction (deflation) of the caldera due to a depressurization of the hydrothermal system and degassing from a magmatic reservoir (in [14] and references therein). The rates of vertical and horizontal components of ground deformation (Figure 11) are in full agreement with deformation data based on levelling and GPS surveys made in the last decades [14,38].
Ischia Island shows a general vertical subsidence with velocities between −1 and −10 mm/yr, centered in the inner sector of the Mt. Epomeo volcanic complex, coupled with a general eastward horizontal displacement field characterized by a different trend in the eastern sector of the island (higher eastward velocity, from +3 to +25 mm/yr) respect to the central-western one (up to +3 mm/yr), suggesting an overall contraction movement (Figure 11).
The vertical component velocities are comparable with those obtained by levelling lines (for example −12.7 mm/year at benchmark BM100; [36]) referred to the same time period [5]. The E-W striking, south dipping normal fault mechanism of the 21 August 2017 earthquake (Mw 3.9–Md 4.0; Imax EMS 8; hypocenter depth 800 m) that struck the northern sector of Ischia Island is very likely induced by the observed long-term subsidence phase, since the lithostatic load represents the principal vertical stress [69].
Ischia ground deformation pattern (Figure 11) cannot be explained by a typical volcanic source [70,71]. The Ischia deformation pattern is related to a combination of endogenous and exogenous processes that include deflation of the island related to the depressurization of the local hydrothermal system, fault activity and landslides due to gravity instability on slopes [5,35,36], and to the coupling effects of crust rheology and the gravitational loading of the volcano [70].
The Somma-Vesuvius is an asymmetric, polygenic volcanic complex formed by the superimposition of two edifices, as the older Mt. Somma with a summit caldera and the younger Vesuvius cone. Its morphostructure results from the combined action of NW–SE faulting and large caldera collapses that occurred in 18 and 79 AD [72,73].
The ground deformation components (Figure 12) evidence two separated zones of continuous subsidence within the Somma-Vesuvius volcano edifice. The first zone is the Vesuvius central cone and the southern flank, while the second one is represented by a discontinuous strip extending around the volcanic edifice at about 10 km of distance from the crater, where the outer flanks of the volcanic edifice lay on the alluvial-marine sequences of the Campanian plain. The cumulated subsidence rates are mainly comprised between −1 and −10 mm/yr and are confirmed by the available GPS (up to −11.7 mm/yr in 2001–2012 [74]) and levelling data (up to −15.1 mm/yr in 1973–2009 [75]) for the flanks and crater. Somma-Vesuvius is affected by a small contraction phase, more marked in the areas with the greatest altitudes, according to the diffuse and modest subsidence observed in the central cone area [74].
This subsidence pattern is in agreement with the hypothesis that local seismicity, all clustered below the cone itself, is mainly driven by gravitational stress that should produce progressive subsidence of the highest relief zone [76,77,78]. The larger strip of annular, discontinuous subsidence is interpretable in terms of ring-like, shallow normal fault-like movements, occurring at the contact between the volcanic edifice and the rock basement, due to the high gravitational loading coupled with the embedding extensional tectonic stress field. At the main urban centers (Pomigliano D’Arco, Marigliano, and Saviano towns), located in the agricultural and industrial districts north of Somma-Vesuvius, several quasi-circular areas with subsidence rates up to −3 mm/yr can be observed, caused by the effects of water table changes [49,78]. In fact, the observed subsidence could reflect a decrease of pore pressure in the soil related to the intense artificial drainage from wells, causing a water deficit in the local water table [5].
The horizontal deformation (Figure 12) shows a marked difference between the northern and eastern flanks of Mt. Somma, where reaches values up to +3 mm/yr (eastward movement), and the area encompassing the central cone sector and the southern and western flanks characterized by values up to −5 to −10 mm/yr (westward movement).
The available GPS data (up to 5 mm/yr in 2001–2012 [74]) confirm this pattern of horizontal deformation velocity. Vilardo et al. [5] considered the horizontal velocity field consistent with divergent movements between the western and eastern sectors of Vesuvius and Campanian plain due to a NNW–SSE tectonic structure crossing the volcano. Our data suggest that the horizontal pattern is more compatible with a gravitational deformation due to lateral SW- and W-directed collapses of Vesuvius Volcano driven by inherited tectonic faults (i.e., NW-SE normal faults and E-W strike-slip fault) as already hypothesized by Milia et al. [72].
In the sector located between Vesuvius and Campi Flegrei, our data suggest the presence of scattered ground deformation areas. In the north-eastern Naples urban area (Sebeto plain), a subsidence trend with rates of −1 to −5 mm/yr is present (Figure 12).
This ground deformation trend can be caused by piezometric level lowering following groundwater pumping in the multi-layered pyroclastic-alluvial aquifer linked to a poro-elastic mechanism in the aquifer system [68]. Several small areas of subsidence (i.e., Vomero-Arenella and Scudillo-Stella districts) with rates up to −10 mm/yr induced by anthropic and natural processes are affecting residential districts of Naples urban areas.
A multiple association of triggering factors cause these subsidence processes [13] that are both of anthropic (subsoil excavations for the construction of transport infrastructures, filling/emptying cycles of large underground water reservoirs, rise of the water table due to the stop of ground water withdrawal) and natural (gravity slope instability related to local morphological factors, re-activation of the bradyseism phases in the Campi Flegrei caldera) origins.
The Roccamonfina volcanic complex is an extinct stratovolcano that was active from 550 to 150 ka in the Garigliano river rift valley. It and was affected by an intense plinian activity revealed by very large craters.
The central caldera is the result of the eruptive explosions at 353 ± 5 ka, while the latest stage of activity featured the edification of the central shoshonitic domes at 150 ka [79,80]. The ground deformation components (Figure 13) evidence a large area of subsidence with vertical rates between −1 and −3 mm/yr centered on the eastern sector of the caldera rim; the E-W horizontal deformation is less relevant and shows discontinuous positive rates on the NE flanks of the volcanic complex and a localized westward deformation within the caldera southern sector (Figure 13).
Even if no interpretation about the residual volcano-tectonic activity geodynamics of Roccamonfina sector is available in literature, the generalized subsidence could be related to the structures produced by the caldera collapses, while the eastward horizontal movements on the eastern flanks could be also linked to slope instabilities.

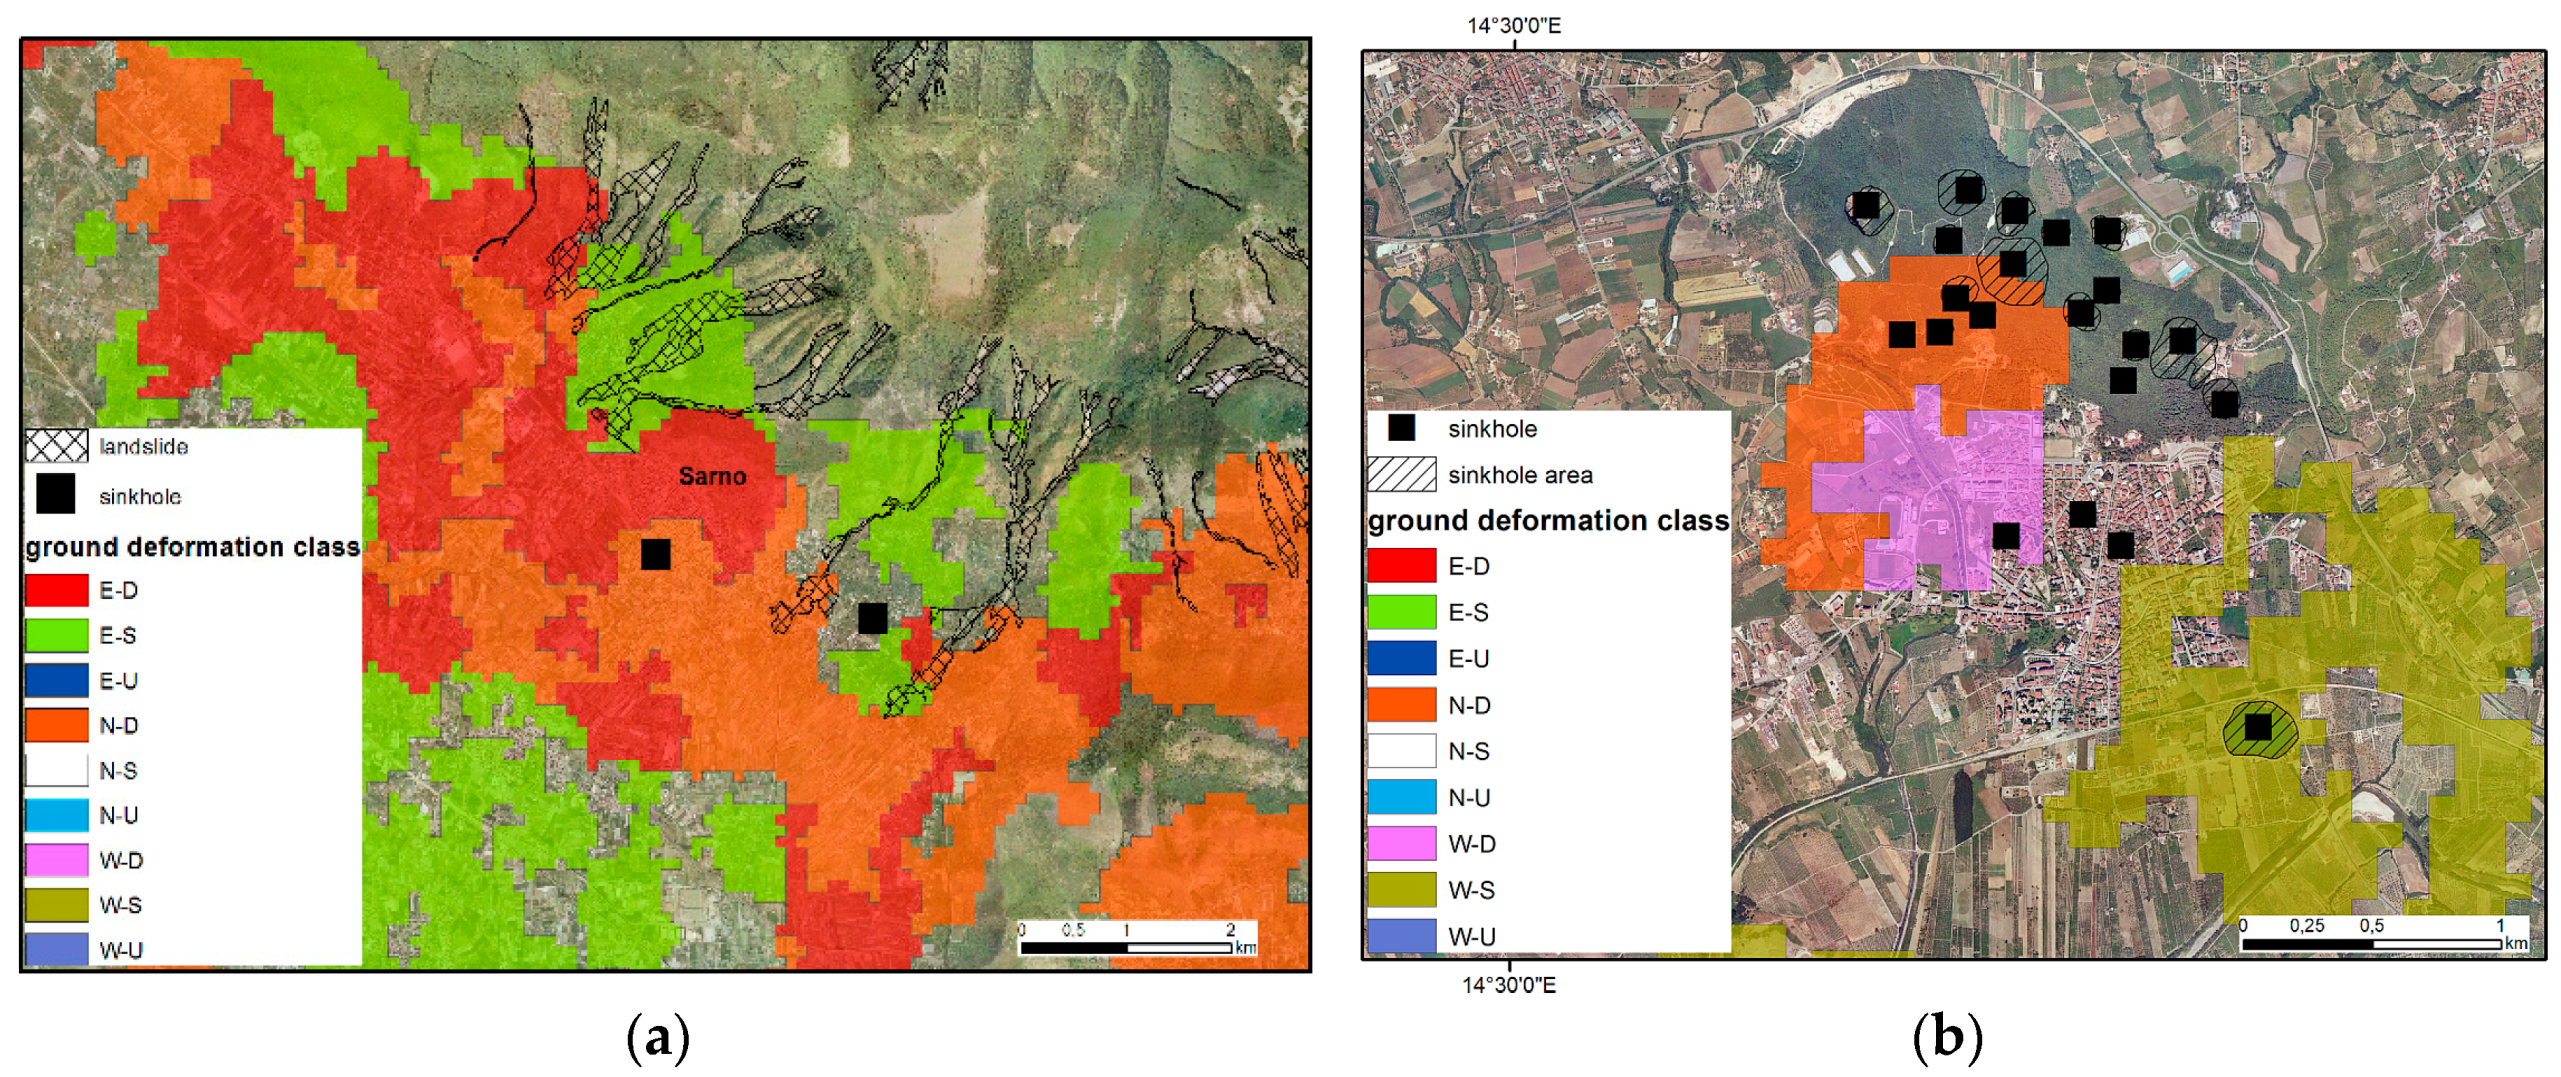
5.3. Inner Plain Sectors

The lowland area located in the inner Sarno plain is characterized by variable subsidence velocity patterns with values up to −6 mm/yr, coupled with eastward horizontal movement up to +3 mm/yr (Figure 12). Several artificial wells for the water extraction occur in this area and are mainly responsible for the observed subsidence [81]. A strong correlation between the amounts of pumped groundwater and the groundwater level in the aquifer and, in turn, between this and the subsidence rates has been demonstrated in a study on ancient masonry buildings located in the urban area of Sarno. The available levelling data show that vertical negative movements up to −5 mm/yr (subsidence) affect the area confirming DInSAR results [63,82]. In addition, the historical and recent ground failures occurring in the densely populated urban center of Sarno can be ascribed either to the presence of underground cavities or to piping sinkholes [83].
Ground failures ascribed to piping sinkholes involved also the urban centers of Telese Terme (Figure 14), where collapses occurred in February 2002 and in August 2006 in a suburban area recently urbanized [21,83]. Our data show that significant vertical negative movements up to −5 mm/yr (subsidence) affect the sinkhole areas during the analyzed period (1992–2010).

5.4. Apennine Sectors

The Southern Apennines sector of the Campania Region appears to be a relatively stable area with reference to vertical deformation (Figure 8b) with scattered and restricted spots of negative vertical rates within −1 to −5 mm/yr. Only the large sector near Alburni massif shows positive vertical rates. Instead, large hilly and mountainous sectors in Irpinia, Sannio and Cilento are characterized by the westward horizontal component of ground deformation (Figure 8a).
The small scattered subsidence areas are probably related to landslide and sinkhole processes along the hilly and mountainous slopes. Most of the mapped landslides overlap the areas with subsidence and westward horizontal deformation (Table 7, Figure 15). Several studies used the PSI data for upgrading landslide maps and inventories in hilly and mountain sectors and defining their state of activity, especially for town-damaging landslides [12,21,84]. PSI data were also used to classify existing landforms susceptible to slow landslides along the Tammaro river valley in the central sector of Sannio area [85,86]. The detailed analysis of several case studies about towns affected by landslides in a mountain site, large landslides along fluvial valleys, and Deep Seated Gravitational Slope Deformation (DSGSD), confirm the results obtained in this study also at local scale.
In the following sections, some relevant examples are described (Figure 16). Castelpagano is a small city located in the high valley of the Fortore river, characterized by severe ground deformation affecting the urban area (Figure 16a) due to different types of landslide (earthflow, rotational slide, translational slide and complex). The ground deformation components show up to −18 mm/yr (westward) and up to −4 mm/yr (subsidence) indicating a general landslide direction toward SW compatible with the local geomorphological conditions. Field monitoring with GPS surveys and clinometer measurements in boreholes are coherent with the results of this study [15]. A large landslide affected the town of Calitri, located in eastern Irpinia in the Ofanto river valley, in the 80s to early 90s. The Calitri landslide is a complex slope movement, composed by a large deep-seated slide, reactivated after the 1980 earthquake, and a limited shallow mudslide showing impulsive activity linked with rainfall events [87]. No significant movements affected the area (Figure 16b) during the analyzed period (1992–2010), as confirmed by field monitoring activities [87].
Moio della Civitella is a small town located in southern Cilento on a slope formed by mainly argillaceous-calcareous rocks. The deformation components along the slope (Figure 16c) are comprised up to −16 mm/yr (westward) and up to −2.5 mm/yr (subsidence) confirming the landslide direction toward SW. The ground deformation effects are related to large slow to very slow landslides, confirmed by GPS surveys, and are coupled with very high levels of damage in masonry old buildings. Actually, the damages are caused by other causes such as thermic effects, bad plans, and inadequate foundations [12,21,88,89] and enhance those induced by slope movements, resulting in very high values of SAR ground deformation signals. Finally, a DSGSD affects Bisaccia, a small town located in eastern Irpinia in the Cervaro river high valley. The DSGSD involves a brittle lithotype (Pliocene conglomerates) resting over a structurally complex, mainly pelitic unit (“Argille Varicolori”). The deformation components measured in this study are comprised of up +8 mm/yr (eastward) and up to −13 mm/yr (subsidence) confirming the slope deformation kinematism. As a consequence of repeated seismic actions (M 6.7 in 1930, M 6.1 in 1962, M 6.9 in 1980 earthquakes), the top rigid plate made up of lithified conglomeratic layers resulted in being split in five portions, showing different rates of vertical and horizontal displacements (within some cm/yr), causing severe damage to the old village settlement [90].
The dams providing lakes forming water reservoirs for agricultural and town needs are another source of ground deformation that is present in the inner sectors. For example, the Conza della Campania earth dam (Figure 17), located in the Ofanto River valley in Pliocene clay, show relevant deformations. The deformation components measured in this study are comprised of up +4 mm/yr (eastward) and up to −2 mm/yr (subsidence) confirming the earth dam ground deformation pattern obtained by in-situ monitoring conventional instrumental data (levelling, extensometers, etc.) [91].
A large sector located south to the Alburni massif (Figure 18) shows significant positive vertical rates (uplift up to +5 mm/yr) combined with negative horizontal rates (westward horizontal motion up to −10 mm/yr), while the Vallo di Diano valley is characterized by subsidence. The observed ground deformation pattern can be caused by tectonic activity. The Alburni Massif and and Vallo di Diano are crossed by NW–SE striking normal active faults, which could act with a strike-slip component of motion. In fact, the major earthquakes (M > 5) univocally indicate active extension, while the minor seismicity shows a more complex pattern with strike-slip, transtensive and occasional compressional events [92].
Very large sectors in Irpinia, Sannio, and Cilento are characterized by a prevailing westward horizontal component of ground deformation with rates within −1 to −5 mm/yr (Figure 7). Smaller areas with eastward velocities of +1 to +3 mm/yr or westward velocities of −5 to −10 mm/yr are also scattered within these sectors, and are likely linked to local movements due to landslides (Figure 15). In the northern part of Campania, the combined vertical and horizontal velocity patterns at the boundary between the Apennines sectors of Sannio and Irpinia and the Campanian plain clearly show that the western sector is affected by subsidence or null vertical deformation and eastward deformations, whereas the eastern sector is characterized by subsidence and westward movements (Figure 8). Additionally, in the southern part of Campania (Cilento sector) the ground deformation pattern is mainly characterized by subsidence and westward movements (Figure 8).
The spatial discontinuity between these two horizontal velocity fields (eastward at the west side and westward at the east and south sides) roughly overlaps the Campanian plain-Apennines morphological boundary (Figure 19), which is marked by NW–SE to NNW–SSE striking faults, moving with prevailing strike-slip movements, as supported by the available seismic data, which show strike-slip to oblique-slip focal mechanisms for the seismic events [5].
The swarm of active seismogenic normal to strike-slip faults along the axis of the mountain belt along Sannio, Irpinia, and inner Cilento sectors has been associated to most of the large historical earthquakes, which concentrate in the extensional domain. The geodetically-estimated rate of regional extension varies from ~2–3.5 [37,93] to ~4–6 mm/yr [94,95,96] and can partly explain the observed ground deformation trends in the easternmost sectors of Sannio and Irpinia (Figure 20).
The GNNS (Global Navigation Satellite System) values available at regional scale [97] are in the range of those estimated by PSI in the same areas and show very similar patterns. The velocity field derived from GNNS surveys spanning the 1995–2011 year interval in sites located throughout southern Italy [97] appears separated in two domains separated along the eastern axis of the mountain chain and characterized by different deformation trends. Velocity patterns evidence on the Tyrrhenian side of Campania region, a W- to SW-oriented motion at a rate of 3 to 6 mm/yr referring to the Apulia frame, while only the easternmost sectors of Sannio and Irpinia have a W-directed motion at a lower rate of 1–2 mm/yr with a differential rates of about 3 mm/yr between the two sectors. Sites located in the Campanian plain show a pattern that differs from the general trend due to local effects deriving from volcanic centers (Vesuvius, Campi Flegrei, Roccamonfina) and local subsiding effects (Volturno plain) on the western Campania margin (Figure 20).

6. Discussion

Although the ground deformation datasets analyzed in this study are extensive, they are not fully complete at the regional scale and some limitations need to be considered, such as short temporal coverage, limited spatial resolution, deformation occurred at a rate that was below or over the threshold deformation rates of the adopted interferometric processing. The limitations in separating E-W horizontal and vertical ground deformation have been strongly dealt with the routine post-processing of ascending and descending interferometric datasets over the same locations. The comparison with available GPS and levelling datasets allowed validating and integrating the ground deformation spatial and temporal information.
The temporal coverage of the regional C-band PSI datasets is limited to 1992–2010 and for the southernmost sectors are limited to 1992–2007 because the spatial coverage is not at full regional scale for the descending ENVISAT dataset. Therefore, the deformation that might have occurred during other time periods (before of 1991 or post 2011 to date) were not detected.
Besides, many areas of anthropogenic or natural activity may be deforming at a level below the detection threshold (−/+1 mm/yr) in the analyzed periods, so in areas without deformation that can be detected by available PSI datasets human activities and natural processes may occur at lower or too fast rates to be detected by SAR processing. Besides, some types of human activity cause significant changes (>50−100 m) to the topography (e.g., quarrying, urbanization) resulting in a phase change in the interferometric processing and in a lack of interferometric data.
Another limitation is that deformation areas must be a few hundred meters in size to be detectable with the followed approach, so smaller areas are neglected, because deformation is too small to be detected.
In spite of these limitations, the deformation signals above the detection thresholds (i.e., area and rate) have been identified throughout the regional territory through the post-processing of the available archive interferometric datasets. Following the proposed approach, the main part of the slow-rate anthropogenic and natural ground deformations occurring in Campania territory were analyzed, classified, and interpreted. Even if the C-band interferometric data are not able to fully characterize all the possible deformations, they give an important contribution to the quantitative analysis of the regional geo- and morpho-dynamics with the integration of other geodetic technologies (i.e., levelling, GPS, LIDAR, and so on).
Attribution as anthropogenic or natural deformation in previous literature was firstly considered in the analysis of the classification results. Then, in order to distinguish an anthropogenic cause of deformation from natural deformation process, the visual assessment of the area with optical imagery was performed to recognize the presence of evidence of human activity (mining, groundwater extraction, infrastructures, urbanization, etc.) together with the geological, tectonic, geomorphological, and land use analysis of the area.
In spite of the limitations of our study, several key conclusions can be drawn. The ground deformation was detected across 89.5% of the Campania territory within a variety of environmental, topographical, and geological conditions. The dominant sources of ground deformation vary with location in Campania, and so individual characteristics such as the pattern and rates of deformation are not diagnostic of the source of deformation.
Classification and analysis of ground deformation components show that the coastal plains are characterized by widespread and continuous strong subsidence signals due to sediment compaction locally enhanced by human activity, while the inner plain sectors show mainly scattered spots with locally high subsidence in correspondence of urban areas, sinkholes, and groundwater withdrawals. The volcanic sectors show interplaying horizontal and vertical trends due to volcano-tectonic processes, while in the hilly and mountain inner sectors the ground deformation is mainly controlled by large scale tectonic activity and by local landslide activity. However, deformation can have complex spatial and temporal patterns that are not always obviously related to a single human activity or natural process.
Only detailed studies at the individual sites may allow to better understand the physical processes driving ground deformation. For example, the groundwater-related deformation is the dominant cause of human-caused ground deformation in our survey (see Volturno, Sele, and Sarno plains [17,18,57,65]), and alone produces signals varying from −1 to −10 mm/yr in the vertical component of ground deformation over areas ranging in diameter up to 2–3 km, while natural subsidence due to compaction of clay-rich sediments in the subsoil is able to cause vertical rates up to −20 mm/yr over larger areas up to 25–30 km in diameter. The interplay of these two subsidence inputs locally enhances the vertical component of ground deformation to larger negative peaks.

7. Conclusions

The results of this study are useful for the analysis both at local and regional scales of the current rates of ground deformations due to known (or unknown) natural processes of endogenous or exogenous origin and human activities. The monitoring of the intensifications of the effects of natural hazards, due for example to subsidence in flooding alluvial areas or to sea level rise in coastal areas, or the monitoring of hazards induced to infrastructure due to severe ground deformation are also relevant tasks.
The analysis of archive interferometric data has been partly limited by poor spatial detail and data quality from C-band ERS-1/2, ENVISAT, and RADARSAT. The new opportunities for wide area mapping using data from CosmoSkyMed, Sentinel-1a/b, and TerraSAR-X would improve the results of the used post-processing approach. On-going X-band SAR satellite missions should make routine observations over the entire region to develop a more complete and detailed understanding of anthropogenic and natural deformation. Besides, ground deformation can be variable in time, so analysis of time series of observations is needed to characterize these temporal variations.
The results of this study confirm the fundamental importance of using PSI data for a comprehensive understanding of rates and patterns of recent ground deformation at regional scale also within tectonically active areas as in the Campania region.

Funding

This research received no external funding.

Acknowledgments

ERS-1/2 and ENVISAT processed archive data were provided by MATTM (project PST-A); ERS-1/2 and RADARSAT processed archive data were provided by Regione Campania-Settore Difesa Suolo (Project Tellus).

Conflicts of Interest

The author declares no conflict of interest.

References

  1. Gabriel, A.K.; Goldstein, R.M.; Zebker, H.A. Mapping small elevation changes over large areas—Differential radar interferometry. J. Geophys. Res. 1989, 94, 9183–9191. [Google Scholar] [CrossRef]
  2. Bürgmann, R.; Rosen, P.A.; Fielding, E.J. Synthetic aperture radar interferometry to measure Earth’s surface topography and its deformation. Annu. Rev. Earth Planet. Sci. 2000, 28, 169–209. [Google Scholar] [CrossRef]
  3. Strozzi, T.; Wegmüller, U.; Tosi, L.; Bitelli, G.; Spreckels, V. Land subsidence monitoring with differential SAR interferometry. Photogramm. Eng. Remote Sens. 2001, 67, 1261–1270. [Google Scholar]
  4. Hooper, A.; Zebker, H.; Segall, P.; Kampes, B. A new method for measuring deformation on volcanoes and other natural terrains using InSAR persistent scatterers. Geophys. Res. Lett. 2004, 31, 1–5. [Google Scholar] [CrossRef]
  5. Vilardo, G.; Ventura, G.; Terranova, C.; Matano, F.; Nardò, S. Ground deformation due to tectonic, hydrothermal, gravity, hydrogeological and anthropic processes in the Campania Region (Southern Italy) from Permanent Scatterers Synthetic Aperture Radar Interferometry. Remote Sens. Environ. 2009, 113, 197–212. [Google Scholar] [CrossRef]
  6. Tofani, V.; Raspini, F.; Catani, F.; Casagli, N. Persistent Scatterer Interferometry (PSI) Technique for Landslide Characterization and Monitoring. Remote Sens. 2013, 5, 1045–1065. [Google Scholar] [CrossRef]
  7. Tomás, R.; Romero, R.; Mulas, J.; Marturià, J.J.; Mallorquí, J.; Lopez-Sanchez, J.M.; Herrera, G.; Gutiérrez, F.; González, P.J.; Fernández, J. Radar interferometry techniques for the study of ground subsidence phenomena: A review of practical issues through cases in Spain. Environ. Earth Sci. 2014, 71, 163–181. [Google Scholar] [CrossRef]
  8. Hu, J.; Li, Z.W.; Ding, X.L.; Zhu, J.J.; Zhang, L.; Sun, Q. Resolving three-dimensional surface displacements from InSAR measurements: A review. Earth-Sci. Rev. 2014, 133, 1–17. [Google Scholar] [CrossRef]
  9. Crosetto, M.; Monserrat, O.; Cuevas-González, M.; Devanthéry, N.; Crippa, B. Persistent Scatterer Interferometry: A review. ISPRS J. Photogramm. Remote Sens. 2016, 115, 78–89. [Google Scholar] [CrossRef]
  10. Costantini, M.; Ferretti, A.; Minati, F.; Falco, S.; Trillo, F.; Colombo, D.; Novali, F.; Malvarosa, F.; Mammone, C.; Vecchioli, F.; et al. Analysis of surface deformations over the whole Italian territory by interferometric processing of ERS, Envisat and COSMO-SkyMed radar data. Remote Sens. Environ. 2017, 202, 250–275. [Google Scholar] [CrossRef]
  11. Di Martire, D.; Paci, M.; Confuorto, P.; Costabile, S.; Guastaferro, F.; Verta, A.; Calcaterra, D. A nation-wide system for landslide mapping and risk management in Italy: The second Not-ordinary Plan of Environmental Remote Sensing. Int. J. Appl. Earth Obs. Geoinf. 2017, 63, 143–157. [Google Scholar] [CrossRef]
  12. Terranova, C.; Iuliano, S.; Matano, F.; Nardò, S.; Piscitelli, E.; Cascone, E.; D’Argenio, F.; Gelli, L.; Alfinito, M.; Luongo, G. The TELLUS Project: A satellite-based slow-moving landslides monitoring system in the urban areas of Campania Region. Rend. Soc. Geol. Ital. 2009, 8, 148–151. [Google Scholar]
  13. Terranova, C.; Ventura, G.; Vilardo, G. Multiple causes of ground deformation in the Napoli metropolitan area (Italy) from integrated Persistent Scatterers DinSAR, geological, hydrological, and urban infrastructure data. Earth-Sci. Rev. 2015, 146, 105–119. [Google Scholar] [CrossRef]
  14. Vilardo, G.; Isaia, R.; Ventura, G.; De Martino, P.; Terranova, C. InSAR Permanent Scatterer analysis reveals fault re-activation during inflation and deflation episodes at Campi Flegrei caldera. Remote Sens. Environ. 2010, 114, 2373–2383. [Google Scholar] [CrossRef]
  15. Arena, L.; Cascini, L.; Ferlisi, S.; Galluccio, F.; Giulivo, I.; Matano, F.; Peduto, D. Analisi di frane lente in area urbana con il contributo dei dati PS-InSAR: il caso di Castelpagano (BN). In IARG 2012; Grafiche Turato Edizioni: Rubano, Italy, 2012; pp. 1–6. [Google Scholar]
  16. Iuliano, S.; Matano, F.; Caccavale, M.; Sacchi, M. Annual rates of ground deformation (1993–2010) at Campi Flegrei, Italy, revealed by Persistent Scatterer Pair (PSP)—SAR interferometry. Int. J. Remote Sens. 2015, 36, 6160–6191. [Google Scholar] [CrossRef]
  17. Di Paola, G.; Alberico, I.; Aucelli, P.P.C.; Matano, F.; Rizzo, A.; Vilardo, G. Coastal subsidence detected by Synthetic Aperture Radar interferometry and its effects coupled with future sea-level rise: The case of the Sele Plain (Southern Italy). J. Flood Risk Manag. 2018, 11, 191–206. [Google Scholar] [CrossRef]
  18. Matano, F.; Sacchi, M.; Vigliotti, M.; Ruberti, D. Subsidence Trends of Volturno River Coastal Plain (Northern Campania, Southern Italy) Inferred by SAR Interferometry Data. Geosciences 2018, 8, 8. [Google Scholar] [CrossRef]
  19. Regione Campania—Settore Difesa Del Suolo. Progetto TELLUS WebGIS (PSInSAR). Available online: http://webgis.difesa.suolo.regione.campania.it:8080/psinsar/map.phtml (accessed on 5 November 2019).
  20. Regione Campania—Settore Difesa Del Suolo. Progetto TELLUS Web Page. Available online: http://www.difesa.suolo.regione.campania.it/content/category/4/64/92/ (accessed on 5 November 2019).
  21. Terranova, C.; Iuliano, S.; Matano, F.; Nardò, S.; Piscitelli, E. Relazione Finale Progetto TELLUS, 79 pp., Napoli, February 2009. PODIS Project of MATTM-Campania Region. Available online: http://www.difesa.suolo.regione.campania.it/content/category/4/64/92/ (accessed on 5 November 2019).
  22. MATTM. Not-Ordinary Plan of Environmental Remote Sensing Web Page. National Geoportal (NG) of the Italian Ministry of Environment and of Protection of Territory and Sea (MATTM). 2015. Available online: http://www.pcn.minambiente.it/GN/en/projects/not-ordinary-plan-of-remote-sensing (accessed on 5 November 2019).
  23. MATTM. Not-Ordinary Plan of Environmental Remote Sensing; ENVISAT Ascending E ENVISAT Descending Interferometric Products. National Geoportal (NG) of the Italian Ministry of Environment and of Protection of Territory and Sea (MATTM). 2015. Available online: http://www.pcn.minambiente.it/viewer/ (accessed on 5 November 2019).
  24. Semple, A.G.; Pritchard, M.E.; Lohman, R.B. An Incomplete Inventory of Suspected Human-Induced Surface Deformation in North America Detected by Satellite Interferometric Synthetic-Aperture Radar. Remote Sens. 2017, 9, 1296. [Google Scholar] [CrossRef]
  25. Ducci, D.; Tranfaglia, G. Effects of climate change on groundwater resources in Campania (southern Italy). In Climate Change and Groundwater; Dragoni, W., Sukhija, B.S., Eds.; Geological Society: London, UK, 2008; Volume 288, pp. 25–38. [Google Scholar]
  26. Bonardi, G.; Ciarcia, S.; Di Nocera, S.; Matano, F.; Sgrosso, I.; Torre, M. Carta delle principali unita cinematiche dell’Appennino meridionale e Nota illustrativa. Boll. Soc. Geol. It. 2009, 128, 47–60. [Google Scholar]
  27. Doglioni, C. A proposal of kinematic modelling for W-dipping subductions–possible applications to the Tyrrhenian–Apennines system. Terra Nova 1991, 3, 423–434. [Google Scholar] [CrossRef]
  28. Patacca, E.; Sartori, R.; Scandone, P. Tyrrhenian basin and Apenninic arcs: Kinematic relations since late Tortonian times. Mem. Soc. Geol. Ital. 1990, 45, 425–451. [Google Scholar]
  29. Di Nocera, S.; Matano, F.; Pescatore, T.; Pinto, F.; Senatore, M.R.; Quarantiello, R.; Torre, M. Schema geologico del transetto Monti Picentini orientali e monti della Daunia meridionali: Evoluzione tettonica e stratigrafica del settore esterno dell’Appennino meridionale. Boll. Soc. Geol. It. 2006, 125, 39–58. [Google Scholar]
  30. Ferranti, L.; Oldow, J.S. Latest Miocene to Quaternary horizontal and vertical displacement rates during simultaneous contraction and extension in the Southern Apennines orogen, Italy. Terra Nova 2005, 17, 209–214. [Google Scholar] [CrossRef]
  31. Rosi, M.; Sbrana, A. Phegrean Fields; CNR, Quaderni De La Ricerca Scientifica: Roma, Italy, 1987; Volume 114, 175p. [Google Scholar]
  32. Santacroce, R. (Ed.) Somma–Vesuvius; CNR, Quaderni De La Ricerca Scientifica: Roma, Italy, 1987; Volume 114, 251p. [Google Scholar]
  33. Chiodini, G.; Frondini, F.; Cardellini, C.; Granieri, D.; Marini, L.; Ventura, G. CO2 degassing and energy release at Solfatara volcano, Campi Flegrei. Italy. J. Geophys. Res. 2001, 106, 16213–16222. [Google Scholar] [CrossRef]
  34. de Lorenzo, S.; Gasparini, P.; Mongelli, F.; Zollo, A. Thermal state of the Campi Flegrei caldera inferred from seismic attenuation tomography. J. Geodyn. 2001, 32, 467–486. [Google Scholar] [CrossRef]
  35. Manzo, M.; Ricciardi, G.P.; Casu, F.; Ventura, G.; Zeni, G.; Borgström, S.; Berardino, P.; Del Gaudio, C.; Lanari, R. Surface deformation analysis in the Ischia island (Italy) based on spaceborne radar interferometry. J. Volcanol. Geotherm. Res. 2006, 151, 399–416. [Google Scholar] [CrossRef]
  36. Sepe, V.; Atzori, S.; Ventura, G. Subsidence due to crack closure and depressurization of hydrothermal systems: A case study from Mt Epomeo (Ischia Island, Italy). Terra Nova 2007, 19, 127–132. [Google Scholar] [CrossRef]
  37. Ferranti, L.; Oldow, J.S.; D’Argenio, B.; Catalano, R.; Lewis, D.; Marsella, E.; Avellone, G.; Maschio, L.; Pappone, G.; Pepe, F.; et al. Active deformation in Southern Italy, Sicily and southern Sardinia fromGPS velocities of the Peri-Tyrrhenian Geodetic Array (PTGA). Boll. Soc. Geol. Ital. (Ital. J. Geosci.) 2008, 127, 299–316. [Google Scholar]
  38. Ricco, C.; Petrosino, S.; Aquino, I.; Del Gaudio, C.; Falanga, M. Some Investigations on a Possible Relationship between Ground Deformation and Seismic Activity at Campi Flegrei and Ischia Volcanic Areas (Southern Italy). Geosciences 2019, 9, 222. [Google Scholar] [CrossRef]
  39. Herrera, G.; Fernández, J.A.; Tomás, R.; Cooksley Mulas, G.J. Advanced interpretation of subsidence in Murcia (SE Spain) using A-DInSAR data-modelling and validation. Nat. Hazards Earth Syst. Sci. 2009, 9, 647–661. [Google Scholar] [CrossRef]
  40. Hanseen, R.F. Radar Interferometry, Data Interpretation and Error Analysis; Kluwer Academic Publishers: Norwell, MA, USA, 2001; ISBN 978-0792369455. [Google Scholar]
  41. Costantini, M.; Falco, S.; Malvarosa, F.; Minati, F.; Trillo, F.; Vecchioli, F. Persistent Scatterer Pair Interferometry: Approach and Application to COSMO-SkyMed SAR Data. IEEE J. Sel. Top. Appl. Earth Obs. Remote Sens. 2014, 7, 2869–2879. [Google Scholar] [CrossRef]
  42. Ferretti, A.; Prati, C.; Rocca, F. Permanent Scatterers in SAR Interferometry. IEEE Trans. Geosci. Remote Sens. 2001, 39, 8–20. [Google Scholar] [CrossRef]
  43. IREA-CNR. InSAR WebGIS. Napoli Study Area. ENVISAT Dataset. Available online: http://webgis.irea.cnr.it/webgis.html (accessed on November 2019).
  44. Trasatti, E.; Casu, F.; Giunchi, C.; Pepe, S.; Solaro, G.; Tagliaventi, S.; Berardino, P.; Manzo, M.; Pepe, A.; Ricciardi, G.P.; et al. The 2004–2006 uplift episode at Campi Flegrei caldera (Italy): Constraints from SBAS-DInSAR ENVISAT data and Bayesian source inference. Geophys. Res. Lett. 2008, 35, 1–6. [Google Scholar] [CrossRef]
  45. Costantini, M.; Falco, S.; Malvarosa, F.; Minati, F. A new method for identification and analysis of persistent scatterers in series of SAR images. In Proceedings of the 2008 IEEE International Geoscience and Remote Sensing Symposium (IGARSS), Boston, MA, USA, 7–11 July 2008; pp. 449–452. [Google Scholar]
  46. Costantini, M.; Falco, S.; Malvarosa, F.; Minati, F.; Trillo, F. Method of Persistent Scatterer Pairs (PSP) and high resolution SAR interferometry. In Proceedings of the 2009 IEEE International Geoscience and Remote Sensing Symposium (IGARSS), Cape Town, Africa, 12–17 July 2009; Volume 3, pp. 904–907. [Google Scholar] [CrossRef]
  47. Berardino, P.; Fornaro, G.; Lanari, R.; Sansosti, E. A new algorithm for surface deformation monitoring based on small baseline differential SAR interferograms. IEEE Trans. Geosci. Remote Sens. 2002, 40, 2375–2383. [Google Scholar] [CrossRef]
  48. Lanari, R.; Mora, O.; Manunta, M.; Mallorqui, J.J.; Berardino, P.; Sansosti, E. A small baseline approach for investigating deformation on full resolution differential SAR interferograms. IEEE Trans. Geosci. Remote Sens 2004, 42, 1377–1386. [Google Scholar] [CrossRef]
  49. Lanari, R.; Casu, F.; Manzo, M.; Zeni, G.; Berardino, P.; Manunta, M. An overview of the Small Baseline subset algorithm: A DInSAR technique for surface deformation analysis. Pure Appl. Geophys. 2007, 164, 637–661. [Google Scholar] [CrossRef]
  50. Colesanti, C.; Locatelli, R.; Novali, F. Ground deformation monitoring exploiting SAR permanent scatterers. IEEE IGARSS 2002, 2, 1219–1221. [Google Scholar]
  51. Colesanti, C.; Ferretti, A.; Locatelli, R.; Novali, F.; Savio, G. Permanent Scatterers: Precision assessment and multi-platform analysis. IEEE IGARSS 2003, 2, 1193–1195. [Google Scholar]
  52. Colesanti, C.; Wasowski, J. Investigating landslides with spaceborne synthetic aperture radar (SAR) interferometry. Eng. Geol. 2006, 88, 173–199. [Google Scholar] [CrossRef]
  53. Ferretti, A.; Savio, G.; Barzaghi, R.; Borghi, A.; Musazzi, S.; Novali, F.; Prati, C.; Rocca, F. Submillimeter accuracy of InSAR time series: Experimental validation. IEEE Trans. Geosci. Remote Sens. 2007, 45, 1142–1153. [Google Scholar] [CrossRef]
  54. Finnegan, N.J.; Pritchard, M.E.; Lohman, R.B.; Lundgren, P.R. Constraints on surface deformation in the Seattle, WA urban corridor from satellite radar interferometry time series analysis. Geophys. J. Int. 2008, 174, 29–41. [Google Scholar] [CrossRef] [Green Version]
  55. Lu, Z.; Kwoun, O.; Rykus, R. Interferometric syntetic aperture radar (InSAR): Its past, present and future. Photogramm. Eng. Remote Sens. 2007, 73, 217–221. [Google Scholar]
  56. Massironi, M.; Zampieri, D.; Bianchi, M.; Schiavo, A.; Franceschini, A. Use of PSInSAR™ data to infer active tectonics: Clues on the differential uplift across the Giudicarie belt (Central-Eastern Alps, Italy). Tectonophysics 2009, 476, 297–303. [Google Scholar] [CrossRef]
  57. Amato, V.; Aucelli, P.P.C.; Corrado, G.; Di Paola, G.; Matano, F.; Pappone, G.; Schiattarella, M. Comparing geological and Persistent Scatterer Interferometry data of the Sele River coastal plain, southern Italy: Implications for recent subsidence trends. Geomorphology 2020, 351. [Google Scholar] [CrossRef]
  58. Franke, R. Scattered data interpolation: Test of some methods. Math. Comput. 1982, 33, 181–200. [Google Scholar]
  59. Mueller, T.G.; Pusuluri, N.B.; Mathias, K.K.; Cornelius, P.L.; Barnhisel, R.I.; Shearer, S.A. Map quality for ordinary kriging and inverse distance weighted interpolation. Soil Sci. Soc. Am. J. 2004, 68, 2042–2047. [Google Scholar] [CrossRef]
  60. Lundgren, P.; Casu, F.; Manzo, M.; Pepe, A.; Berardino, P.; Sansosti, E.; Lanari, R. Gravity and magma induced spreading of Mount Etna volcano revealed by satellite radar interferometry. Geophys. Res. Lett. 2004, 31, 8736. [Google Scholar] [CrossRef] [Green Version]
  61. Oldow, J.S.; D’Argenio, B.; Ferranti, L.; Pappone, G.; Marsella, E.; Sacchi, M. Large-scale longitudinal extension in the southern Apennines contractional belt, Italy. Geology 1993, 21, 1123–1126. [Google Scholar] [CrossRef]
  62. Doglioni, C.; D’Agostino, N.; Mariotti, G. Normal faulting vs regional subsidence and sedimentation rate. Mar. Pet. Geol. 1998, 15, 737–750. [Google Scholar] [CrossRef]
  63. Cascini, L.; Ferlisi, S.; Peduto, D.; Di Nocera, S.; Fornaro, G.; Serafino, F. A land subsidence study via DInSAR technique over large urbanised areas. In Proceedings of the Urban Remote Sensing Joint Event, Paris, France, 11–13 April 2007; pp. 1–7. [Google Scholar] [CrossRef]
  64. Peduto, D.; Cascini, L.; Arena, L.; Ferlisi, S.; Fornaro, G.; Reale, D. A general framework and related procedures for multiscale analyses of DInSAR data in subsiding urban areas. ISPRS J. Photogramm. Remote Sens. 2015, 105, 186–210. [Google Scholar] [CrossRef]
  65. Di Paola, G.; Aucelli, P.P.C.; Matano, F.; Rizzo, A. Proneness to future marine inundation of campania coastal plains (Southern Italy) in relation to their subsidence trends assessed by interferometric SAR techniques. In Earth Observation Advancements in A Changing World; AIT Series; Associazione Italiana di Telerilevamento (AIT): Firenze, Italy, 2019; Volume 1, pp. 157–161. ISBN 978-88-944687-1-7. [Google Scholar]
  66. Aucelli, C.P.P.; Di Paola, G.; Incontri, P.; Rizzo, A.; Vilardo, G.; Benassai, G.; Buonocore, B.; Pappone, G. Coastal inundation risk assessment due to subsidence and sea level rise in a Mediterranean alluvial plain (Volturno coastal plain e southern Italy). Estuar. Coast. Shelf Sci. 2016, 198, 597–609. [Google Scholar] [CrossRef]
  67. Allocca, V.; Celico, F.; Celico, P.; De Vita, P.; Fabbrocino, S.; Mattia, S.; Monacelli, G.; Musilli, I.; Piscopo, V.; Scalise, A.R. Illustrative Notes of the Hydrogeological Map of Southern Italy; Istituto Poligrafico e Zecca dello Stato: Rome, Italy, 2007; pp. 1–211. ISBN 88-448-0215-5. [Google Scholar]
  68. Coda, S.; Tessitore, S.; Di Martire, D.; Calcaterra, D.; De Vita, P.; Allocca, V. Coupled ground uplift and groundwater rebound in the metropolitan city of Naples (southern Italy). J. Hydrol. 2019, 569, 470–482. [Google Scholar] [CrossRef]
  69. De Novellis, V.; Carlino, S.; Castaldo, R.; Tramelli, A.; De Luca, C.; Pino, N.A.; Pepe, S.; Convertito, V.; Zinno, I.; De Martino, P. The 21 August 2017 Ischia (Italy) earthquake source model inferred from seismological, GPS, and DInSAR measurements. Geophys. Res. Lett. 2018, 45, 2193–2202. [Google Scholar] [CrossRef]
  70. Castaldo, R.; Gola, G.; Santilano, A.; De Novellis, V.; Pepe, S.; Manzo, M.; Manzella, A.; Tizzani, P. The role of thermo-rheological properties of the crust beneath Ischia Island (southern Italy) in the modulation of the ground deformation pattern. J. Volcanol. Geotherm. Res. 2017, 344, 154–173. [Google Scholar] [CrossRef]
  71. Selva, J.; Acocella, V.; Bisson, M.; Caliro, S.; Costa, A.; Della Seta, M.; De Martino, P.; de Vita, S.; Federico, C.; Giordano, G. Multiple natural hazards at volcanic islands: A review for the Ischia volcano (Italy). J. Appl. Volcanol. 2019, 8, 1–43. [Google Scholar] [CrossRef]
  72. Milia, A.; Torrente, M.M.; Bellucci, F. A possible link between faulting, cryptodomes and lateral collapses at Vesuvius Volcano (Italy). Glob. Planet. Chang. 2012, 90, 121–134. [Google Scholar] [CrossRef]
  73. Passaro, S.; Sacchi, M.; Tamburrino, S.; Ventura, G. Fluid vents, flank instability, and seafloor processes along the submarine slopes of the Somma-Vesuvius Volcano, Eastern Tyrrhenian Margin. Geosciences 2018, 8, 60. [Google Scholar] [CrossRef] [Green Version]
  74. Tammaro, U.; De Martino, P.; Obrizzo, F.; Brandi, G.; D’Alessandro, A.; Dolce, A.M.; Malaspina, S.; Serio, C.; Pingue, F. Somma Vesuvius volcano: Ground deformations from CGPS observations (2001–2012). Ann. Geophys. 2013, 56, S0456. [Google Scholar] [CrossRef]
  75. Pingue, F.; Bottiglieri, M.; Godano, C.; Obrizzo, F.; Tammaro, U.; Esposito, T.; Serio, C. Spatial and temporal distribution of vertical ground movements at Mt. Vesuvius in the period 1973–2009. Ann. Geophys. 2013, 56, S0451. [Google Scholar] [CrossRef]
  76. De Natale, G.; Petrazzuoli, S.M.; Troise, C.; Pingue, F.; Capuano, P. Internal stress field at Mt. Vesuvius: A model for the generation of background seismicity at a central volcano. J. Geophys. Res. 2000, 105, 16207–16214. [Google Scholar] [CrossRef]
  77. De Natale, G.; Troise, C.; Pingue, F.; Mastrolorenzo, G.; Pappalardo, L. The Somma-Vesuvius volcano (Southern Italy): Structure, dynamics and hazard evaluation. Earth-Sci. Rev. 2006, 74, 73–111. [Google Scholar] [CrossRef]
  78. Lanari, R.; De Natale, G.; Berardino, P.; Sansosti, E.; Ricciardi, G.P.; Borgstrom, S.; Capuano, P.; Pingue, F.; Troise, C. Evidence for a peculiar style of ground deformation inferred at Vesuvius volcano. Geophys. Res. Lett. 2002, 29, 9. [Google Scholar] [CrossRef]
  79. Giannetti, B. Origin of the calderas and evolution of Roccamonfina volcano (Roman region, Italy). J. Volcanol. Geotherm. Res. 2001, 106, 301–319. [Google Scholar] [CrossRef]
  80. Rouchon, V.; Gillot, P.Y.; Quidelleur, X.; Chiesa, S.; Floris, B. Temporal evolution of the Roccamonfina volcanic complex (Pleistocene), Central Italy. J. Volcanol. Geotherm. Res. 2008, 177, 500–514. [Google Scholar] [CrossRef]
  81. Fabbrocino, S.; Lanari, R.; Celico, P.; Termolini, G.; Zeni, G. Groundwater Pumping and Land Subsidence in the Sarno River Plain (Campania). Mem. Descr. Carta Geol. d’It. 2007, 76, 163–174. [Google Scholar]
  82. Cascini, L.; Ferlisi, S.; Fornaro, G.; Lanari, R.; Peduto, D.; Zeni, G. Subsidence monitoring in Sarno urban area via multi-temporal DInSAR technique. Int. J. Remote Sens. 2006, 27, 1709–1716. [Google Scholar] [CrossRef]
  83. Calcaterra, D.; Esposito, A.; Fuschini, V.; Galluccio, F.; Giulivo, I.; Nardò, S.; Russo, F.; Terranova, C. L’utilizzo Della Tecnica PS-Insar™ Per L’individuazione Ed Il Monitoraggio Di Sinkholes in Aree Urbanizzate Della Campania: I Casi Di Telese Terme (BN) E Sarno (SA). 2° Workshop Internazionale “I Sinkholes. Gli Sprofondamenti Catastrofici Nell’ambiente Naturale Ed in Quello Antropizzato”; Nisio, S., Ed.; ISPRA: Roma, Italy, 2009; Volume 6, pp. 931–948. ISBN 978-88-448-0400-8. [Google Scholar]
  84. Guerriero, L.; Confuorto, P.; Calcaterra, D.; Guadagno, F.M.; Revellino, P.; Di Martire, D. PS-driven inventory of town-damaging landslides in the Benevento, Avellino and Salerno Provinces, southern Italy. J. Maps 2019, 15, 619–625. [Google Scholar] [CrossRef] [Green Version]
  85. Cascini, L.; Peduto, D.; Pisciotta, G.; Arena, L.; Ferlisi, S.; Fornaro, G. The combination of DInSAR and facility damage data for the updating of slow-moving landslide inventory maps at medium scale. Nat. Hazards Earth Syst. Sci. 2013, 13, 1527–1549. [Google Scholar] [CrossRef]
  86. Calvello, M.; Peduto, D.; Arena, L. Combined use of statistical and DInSAR data analyses to define the state of activity of slow-moving landslides. Landslides 2017, 14, 473–489. [Google Scholar] [CrossRef]
  87. Calò, F.; Calcaterra, D.; Iodice, A.; Parise, M.; Ramondini, M. Assessing the activity of a large landslide in southern Italy by ground-monitoring and SAR interferometric techniques. Int. J. Remote Sens. 2012, 33, 3512–3530. [Google Scholar] [CrossRef]
  88. Calcaterra, D.; Ramondini, M.; Calò, F.; Longobardi, V.; Parise, M.; Galzerano, G. DInSAR techiques for monitoring slow-moving landslides. In Landslides and Engineered Slopes; Chen, Z., Zhang, J., Ho, K., Wu, F., Li, Z., Eds.; Taylor & Francis Group: London, UK, 2008; ISBN 978-0-415-41196-7. [Google Scholar]
  89. Infante, D.; Di Martire, D.; Confuorto, P.; Tessitore, S.; Tòmas, R.; Calcaterra, D.; Ramondini, M. Assessment of building behavior in slow-moving landslide-affected areas through DInSAR data and structural analysis. Eng. Struct. 2019, 199, 109638. [Google Scholar] [CrossRef] [Green Version]
  90. Di Martire, D.; Novellino, A.; Ramondini, M.; Calcaterra, D. A-Differential Synthetic Aperture Radar Interferometry analysis of a Deep Seated Gravitational Slope Deformation occurring at Bisaccia (Italy). Sci. Total Environ. 2016, 550, 556–573. [Google Scholar] [CrossRef] [PubMed]
  91. Di Martire, D.; Iglesias, R.; Monells, D.; Centolanza, G.; Sica, S.; Ramondini, M.; Pagano, L.; Mallorquí, J.J.; Calcaterra, D. Comparison between Differential SAR interferometry and ground measurements data in the displacement monitoring of the earth-dam of Conza della Campania (Italy). Remote. Sens. Environ. 2014, 148, 58–69. [Google Scholar] [CrossRef]
  92. Amicucci, L.; Barchi, M.R.; Montone, P.; Rubiliani, N. The Vallo di Diano and Auletta extensional basins in the southern Apennines (Italy): A simple model for a complex setting. Terra Nova 2008, 20, 475–482. [Google Scholar] [CrossRef]
  93. Serpelloni, E.; Anzidei, M.; Baldi, P.; Casula, G.; Galvani, A. Crustal velocity and strain-rate fields in Italy and surrounding regions: New results from the analysis of permanent and non permanent GPS networks. Geophys. J. Int. 2005, 161, 861–880. [Google Scholar] [CrossRef] [Green Version]
  94. Giuliani, R.; D’Agostino, N.; D’Anastasio, E.; Mattone, M.; Bonci, V.; Calcaterra, S.; Gambino, P.; Merli, K. Active crustal extension and strain accumulation from GPS data in the Molise region (central-southern Apennines, Italy). Boll. Geofis. Teor. Appl. 2009, 50, 145–156. [Google Scholar]
  95. Hunstad, I.; Selvaggi, G.; D’Agostino, N.; England, P.; Clarke, P.; Pierozzi, M. Geodetic strain in peninsular Italy between 1975 and 2001. Geophys. Res. Lett. 2003, 30, 1181. [Google Scholar] [CrossRef]
  96. Ward, S.N. Constraints on the seismotectonics of the central Mediterranean from Very Long Baseline Interferometry. Geophys. J. Int. 1994, 117, 441–452. [Google Scholar] [CrossRef] [Green Version]
  97. Ferranti, L.; Palano, M.; Cannavò, F.; Mazzella, M.E.; Oldow, J.S.; Gueguen, E.; Mattia, M.; Monaco, C. Rates of geodetic deformation across active faults in southern Italy. Tectonophysics 2014, 621, 101–122. [Google Scholar] [CrossRef]
Figure 1. Study area and geographical names used in the text.
Remotesensing 11 02822 g001
Figure 2. Spatial distribution Persistent Scatterer Interferometry (PSI) line of sight (LOS) average velocity data (vLOSasc and vLOSdesc maps) in the study area for the six used datasets: (a) ERS ascending; (b) ERS descending; (c) RDS ascending; (d) RDS descending; (e) ENV ascending; (f) ENV descending.
Remotesensing 11 02822 g002
Figure 3. Workflow adopted for post-processing activities. See text for used codes and explanation.
Remotesensing 11 02822 g003
Figure 4. ERS, RADARSAT, and ENVISAT-derived ground deformation (GD) components: (a) ERS horizontal; (b) ERS vertical; (c) RDS horizontal; (d) RDS vertical; (e) ENV horizontal; (f) ENV vertical. In vertical GD maps, red and blue colors, respectively, represent subsidence and uplift, while in horizontal GD maps, red and blue colors, respectively, represent westward and eastward movements.
Remotesensing 11 02822 g004aRemotesensing 11 02822 g004b
Figure 5. Ground Deformation Map-Vertical component (V-GDM). Spatial distribution and intensity of the vertical component of regional ground deformation during 1992–2010.
Remotesensing 11 02822 g005
Figure 6. Ground Deformation Map-Horizontal component (H-GDM). Spatial distribution and intensity of the E-W horizontal component of regional ground deformation during 1992–2010.
Remotesensing 11 02822 g006
Figure 7. Ground Deformation Classification regional map during 1992–2010.
Remotesensing 11 02822 g007
Figure 8. Classification of the components of regional ground deformation: (a) E-W horizontal component; (b) vertical component.
Remotesensing 11 02822 g008
Figure 9. Ground deformation in Volturno river plain and surrounding areas: (a) E-W horizontal component; (b) vertical component; (c) ground deformation classification and comparison with hydrogeological conditions [67,68] and active fault datasets.
Remotesensing 11 02822 g009
Figure 10. Ground deformation in Sele river plain and surrounding areas: (a) E-W horizontal component; (b) vertical component; (c) ground deformation classification and comparison with hydrogeological conditions [67,68] and active fault datasets.
Remotesensing 11 02822 g010
Figure 11. Ground deformation in Campi Flegrei and Ischia volcanic districts: (a) E-W horizontal component; (b) vertical component; (c) ground deformation classification and comparison with volcano-tectonic element and fault datasets [31,69].
Remotesensing 11 02822 g011
Figure 12. Ground deformation in Somma-Vesuvius volcanic area and Sarno river plain: (a) E-W horizontal component; (b) vertical component; (c) ground deformation classification and comparison with hydrogeological conditions [67,68] and volcano-tectonic element and fault datasets [31,72,73].
Remotesensing 11 02822 g012
Figure 13. Ground deformation in Roccamonfina volcanic area and Garigliano river plain: (a) E-W horizontal component; (b) vertical component; (c) ground deformation classification and comparison with hydrogeological conditions [67,68], IFFI project landslides, and active fault datasets [79,80].
Remotesensing 11 02822 g013
Figure 14. Comparison of ground deformation classification with sinkhole distribution in Sarno (a) and Telese Terme (b) areas.
Remotesensing 11 02822 g014
Figure 15. Comparison of ground deformation classification with landslide regional inventory (IFFI project).
Remotesensing 11 02822 g015
Figure 16. Examples of ground deformation classification due to landslide and Deep Seated Gravitational Slope Deformation (DSGSD) effects affecting four small towns: (a) Castelpagano; (b) Calitri; (c) Moio della Civitella; and (d) Bisaccia.
Remotesensing 11 02822 g016
Figure 17. Ground deformation classification in the Conza della Campania dam area.
Remotesensing 11 02822 g017
Figure 18. Relations among ground deformation components and active faults systems in Alburni Mt.-Vallo di Diano area in Cilento.
Remotesensing 11 02822 g018
Figure 19. Ground deformation patterns at the transition area between Campanian Plain and Apenninic mountains, and correlation with active faults.
Remotesensing 11 02822 g019
Figure 20. Comparison among E-W horizontal ground deformation, Global Navigation Satellite System (GNNS) data [97], and seismogenic structures in Campania.
Remotesensing 11 02822 g020
Table 1. Orbital parameters and time span of interferometrically processed satellite images [20,21,22,23,24,25].
Satellite-OrbitTrack/FrameLine of Sight Incidence AngleTime Range
(Used Images for PSI Processing)
ENVISAT-Ascending86/798-81622°4 May 2003–11 Jul. 2010(42)
129/801-81913 Nov. 2002–14 Jul. 2010(59)
358/801-81929 Nov. 2002–30 Jul. 2010 (52)
ENVISAT-Descending36/276325°27 Nov 2002–03 Jun. 2010(45)
36/27815 Jun. 2003–03 Jun. 2010(40)
265/2763-27818 March 2003–19 Jun. 2010(43)
RADARSAT-Ascending104/S334°4 March 2003–15 Sept. 2007(52)
204/S328 Apr. 2003–22 Sept. 2007(51)
RADARSAT-Descending11/S332–33°22 March 2003–16 Aug. 2007(51)
111/S35 March 2003–23 Aug. 2007(51)
211/S329 Apr. 2003–30 Aug. 2007 (45)
ERS-1/2-Ascending129/80122°14 Jun. 1992–13 Dec. 2000(69)
129/81910 Jan. 1993–13 Dec. 2000(61)
358/801-8198 Sept. 1992–24 Nov. 2000(47)
ERS-1/2-Descending36/278123°8 Jun. 1992–11 Jan. 2001(81)
265/278111 Nov. 1992–23 Dec. 2001(67)
265/279924 Jun. 1992–23 Dec. 2000(72)
494/2781-279910 July 1992–8 Jan. 2001(81)
Table 2. Summary of Permanent Scatterers (PS) datasets used in this study.
Satellite-OrbitPSI TechniqueCountPS Velocity-Mean (mm/yr)Vel. Stand. Dev.-MeanPS Coherence-MeanPS Density (num./km2)
ENVISAT-AscendingPSP1,362,269−0.370.370.73100
ENVISAT-DescendingPSP1,193,312−0.440.440.7588
RADARSAT-AscendingPS-InSAR628,862−1.011.250.8246
RADARSAT-DescendingPS-InSAR609,915−0.670.800.8445
ERS-1/2-AscendingPSP606,886−0.220.710.7745
ERS-1/2-DescendingPSP645,042−0.350.690.7547
Table 3. Codes used for classification of the ground deformation components.
Grid MapCodeVelocity Rate RangeGround Deformation Component
VGU>+1 mm/yrUplift
VGS−1 to +1 mm/yrStable vertical
VGD<−1 mm/yrSubsidence
HGW>+1 mm/yrWestward horizontal
HGN−1 to +1 mm/yrStable horizontal
HGE<−1 mm/yrEastward horizontal
Table 4. Area distribution for vertical and E-W horizontal velocity value ranges.
Velocity Range (mm/yr)Area (km2) with Vertical VelocityArea (km2) with Horizontal Velocity
>+10--6.1
+10 to +50.152.4
+5 to +31.4156.2
+3 to +1220.41483.7
+1 to −19684.37143.0
−1 to −31976.22855.7
−3 to −5195.3360.1
−5 to −10157.585.7
<−1024.917.2
Total classified12,160.2
No data area1439.8
Regional area13,590.0
Table 5. Ground deformation class distribution in the study area.
ClassNumber of Classified AreasClassified Area Extension (km2)
N-S4817486.77
N-U2555.02
N-D648991.24
W-S5582589.96
W-U26153.17
W-D510413.35
E-S570877.55
E-U184.24
E-D444582.75
Total328013,154.24
Table 6. Distribution of the extension of the classified areas.
Area Range (km2)NumberTotal Area (km2)
0.1–12581771.9
1–106161714.1
10–100701645.8
100–1000123152.6
>100015869.9
Table 7. Landslide distribution within the ground deformation classes.
ClassNumber of LandslidesLandslide Area (km2)Landslide Classified Area (%)
W-S248697.923.8
W-U50.30.1
W-D41314.23.4
E-S2929.72.4
E-U00.00.0
E-D40114.63.5
N-U10.10.0
N-D44613.03.2
N-S6918261.763.6
Classified (total)10,962411.6100.0
Not classified6791489.354.3
Total17,753900.9100.0

