Article

Phenology Patterns Indicate Recovery Trajectories of Ponderosa Pine Forests After High-Severity Fires

by
Jessica J. Walker
1,* and
Christopher E. Soulard
2
1
US Geological Survey, 520 N. Park Ave., Tucson, AZ 85719, USA
2
US Geological Survey, P.O. Box 158, Moffett Field, CA 94035, USA
*
Author to whom correspondence should be addressed.
Remote Sens. 2019, 11(23), 2782; https://doi.org/10.3390/rs11232782
Submission received: 1 October 2019 / Revised: 13 November 2019 / Accepted: 16 November 2019 / Published: 26 November 2019

Abstract

:
Post-fire recovery trajectories in ponderosa pine (Pinus ponderosa Laws.) forests of the southwestern United States are increasingly shifting away from pre-burn vegetation communities. This study investigated whether phenological metrics derived from a multi-decade remotely sensed imagery time-series could differentiate among grass, evergreen shrub, deciduous, or conifer-dominated replacement pathways. We focused on 10 fires that burned ponderosa pine forests in Arizona and New Mexico, USA before the year 2000. A total of 29 sites with discernable post-fire recovery signals were selected within high-severity burn areas. At each site, we used Google Earth Engine to derive time-series of normalized difference vegetation index (NDVI) signals from Landsat Thematic Mapper, Enhanced Thematic Mapper Plus, and Operational Land Imager data from 1984 to 2017. We aggregated values to 8- and 16-day intervals, fit Savitzky–Golay filters to each sequence, and extracted annual phenology metrics of amplitude, base value, peak value, and timing of peak value in the TIMESAT analysis package. Results showed that relative to post-fire conditions, pre-burn ponderosa pine forests exhibit significantly lower mean NDVI amplitude (0.14 vs. 0.21), higher mean base NDVI (0.47 vs. 0.22), higher mean peak NDVI (0.60 vs. 0.43), and later mean peak NDVI (day of year 277 vs. 237). Vegetation succession pathways exhibit distinct phenometric characteristics as early as year 5 (amplitude) and as late as year 20 (timing of peak NDVI). This study confirms the feasibility of leveraging phenology metrics derived from long-term imagery time-series to identify and monitor ecological outcomes. This information may be of benefit to land resource managers who seek indicators of future landscape compositions to inform management strategies.

Graphical Abstract

1. Introduction

In the dryland ponderosa pine (Pinus ponderosa Laws.) forests of the southwestern United States, the primary disturbance regime—fire—is amplified by warming temperatures [1,2,3] and a legacy of human forest use activities and management policies [4,5]. Prior to Euro-American settlement in the mid to late 1800s, the characteristic fire regime in this ecosystem consisted of frequent, low-severity surface fires that maintained landscape mosaics of multi-aged ponderosa stands interspersed with open meadows [6,7,8,9,10,11]. More than a century of fire suppression efforts, extractive forest use, and livestock grazing have altered forest structure dramatically [8,12,13]. Contemporary ponderosa pine ecosystems typically feature dense, unbroken tracts of even-aged pine with a thick understory of shade-tolerant species [9,12,14]. The abundance of dry ladder fuels that promote destructive crown fires [10,15] has primed wildfires to exceed historical norms of severity and extent [12]. These conditions coincide with pronounced warming trends throughout the southwestern US [16,17] that can exacerbate fire potential [2,3,18,19]. Currently, fire seasons in the western US tend to start earlier and consume more acreage [3] and feature greater numbers of large [20,21] and stand-replacing fires [22].
Larger proportions of southwestern forests are recovering from high-severity fires during periods of warmer and drier climatic conditions [23], which complicates the nature of forest recovery. Climatic variability shapes the pace and character of ponderosa pine forest regeneration over extended time periods [14,23]. Precipitation and/or temperature have been linked to the survival of individual fire-damaged trees [24], the relative proportions of native and exotic vegetation species [25], and the germination and survival of tree seedlings [14,26]. Ponderosa pine regrowth depends on the periodic concurrence of viable seed availability with sufficient and timely precipitation [27]. The repeated failure of one or both conditions can deflect recovery trajectories following high-severity fires toward grassland, shrubland, or deciduous replacements of the formerly coniferous ecosystems [23,28,29,30,31,32]
The potential magnitude of ecological conversion across the southwestern United States has led to heightened interest in understanding and quantifying the direction of change in post-fire communities. Remote-sensing analyses of post-fire dynamics are routinely based on multispectral vegetation indices such as the normalized difference vegetation index (NDVI), which is the ratio of near-infrared (NIR) and red band reflectance (NDVI = (NIR − red)/(NIR + red)) [33]. NDVI is sensitive to the photosynthetic capacity of vegetation and is linked to parameters such as greenness and primary production [34]. Imagery-based studies of post-fire regeneration have largely focused on the recovery of post-fire vegetation biomass to pre-fire reference levels (e.g., [35,36,37,38]) and tend to discard seasonal variations that obscure trends in biomass accumulation (e.g., [38,39]).
Few studies have specifically targeted indices of the annually recurring dynamics of vegetation growth and development (i.e., vegetation phenology) to extract information about the nature of post-burn recovery dynamics. Exceptions are [40], which compared eight years of annual phenological metrics (phenometrics) derived from Moderate Resolution Imaging Spectroradiometer (MODIS) time-series over unburned and post-burn sites in a ponderosa pine forest in Arizona, USA. Analyzed phenometrics included the start of season, end of season, lowest and highest seasonal NDVI values (“base” and “peak”, respectively), timing of peak value, and integrated measures of vegetation productivity. The study found earlier timing of peak greenness and lower base and peak values in burned versus unburned sites. A subsequent study [41] used a similar suite of phenometrics derived from a 16-day composite MODIS NDVI time-series to contrast unburned and post-burn vegetation dynamics across dryland forest and woodland sites in Spain, Israel, and the United States over six years. Phenometrics varied significantly among the overall sites, but few significant post-fire trends were observed at individual burn areas. There was also no indication that phenometrics were detecting an apparent pine-to-shrub conversion during the analysis time frame.
We hypothesize that a longer period of analysis can allow phenological distinctions among the major vegetative components of successional tracks in ponderosa pine systems—grass, evergreen shrub, deciduous, and coniferous—to be exploited for tracking landscape compositional changes and overall community recovery. In mixed woody-herbaceous systems, herbaceous species tend to react more quickly to moisture inputs and intermittent climatic extremes than woody species, which have comparatively delayed or muted responses [42,43]. Woody plant cover has also been shown to have explanatory power for NDVI phenometrics in high-elevation dryland systems [44]. The phenology of different species can be exploited via remote sensing to gain an understanding of landscape vegetation composition [45,46], particularly since ponderosa pine ecosystems can display later seasonal peak NDVI values in satellite time-series [47].
The goal of this study is to investigate whether long-term phenology time-series can provide information about the nature of community recovery in post-burn ponderosa pine forests. To that end, we examine vegetation greenness metrics extracted from Landsat imagery in areas of known burn and recovery conditions. We rely on the Landsat series of satellites because of the program’s unparalleled length of acquisition [48], the suitability of the spatial resolution (30 m) for monitoring vegetation dynamics in dryland environments [49], and the open data policy of the imagery distribution and use [50]. We focus on sites that we determined to have experienced high-severity, stand-replacing fires and are subsequently following successional trajectories manifested as predominantly grass, evergreen shrub, deciduous, or coniferous vegetation types. Our objectives are to explore the feasibility of linking phenology metrics to community recovery in order to identify (1) if post-fire recovery trajectories that lead to different ecological outcomes display consistent phenological patterns; and (2) whether the phenological patterns of different recovery pathways are sufficiently distinct to allow the differentiation of landscape-wide recovery trends.

2. Materials and Methods

2.1. Study Area

The study area comprised an assemblage of stand-replacing fires that burned in predominantly ponderosa pine forests in the southwestern states of Arizona (AZ) and New Mexico (NM), USA (Figure 1). These states contain expansive tracts of ponderosa pine that have a history of commercial logging that dates back to the late 1880s [27,51]. In this region, ponderosa pine forests occupy mid-range elevations (1700–2600 m) [27]. Downslope, they are typically bordered by the lowest, warmest forested zone in the United States, pinyon-juniper (Pinus edulis-Juniperus osteosperma) woodlands [52,53]. Upslope, ponderosa pine yields to more shade-tolerant Rocky Mountain Douglas fir (Pseudotsuga menziesii var. glauca) [53,54]. Despite these commonalities, ponderosa pine ecosystems throughout the Southwest exhibit highly heterogeneous stand characteristics [10].

2.2. Selection of Sample Locations

We selected fires from the Monitoring Trends in Burn Severity (MTBS) [55,56] archive (https://www.mtbs.gov/) that met several criteria: the fires were non-prescribed, larger than 2000 acres (808 ha), burned in areas suitable for ponderosa pine or other high-elevation forests according to the LANDFIRE (http://www.landfire.gov/index.php) Environmental Site Potential layer [57], and had areas of high-severity burn. MTBS assessments of burn severity are derived from differenced Normalized Burn Ratio (dNBR) images, which are calculated from the pre- and post-fire contrast of Landsat near-infrared and shortwave infrared band ratios [55]. dNBR images serve as the basis for classification of a fire area into discrete burn severity categories that describe the degree of ecological impact [58,59]. To obtain as lengthy a satellite-documented series as possible for each recovery period, we preferentially chose fires from 1982 to 1996 to coincide with the early Landsat Thematic Mapper (TM) sensor chronology. We added three fires outside that time period: La Mesa, which burned a region of the Jemez mountains of New Mexico in 1977; Rodeo-Chediski, which burned 186,873 hectares in east-central Arizona in 2002; and Las Conchas, which burned across the majority of the La Mesa area in 2011. We additionally chose an area adjacent to La Mesa with no documented contemporary wildfires to function as a reference for the phenology of mature, intact ponderosa pine forest, similar to the approach in [40,41] (Table 1).
Within the perimeters of candidate fires, we relied on time-series of high-resolution data available through Google Earth (GE) to identify locations that satisfied specific criteria: the presence of dense, mature ponderosa pine canopy prior to the fire; near-total tree mortality; and distinct regeneration ground cover types that could be used to indicate the general landscape evolution. The imagery available through GE within the study area is an opportunistic collection of government and commercial aerial and satellite images [59]. The spatial resolution of the imagery does not allow for species verification, but can be adequate for distinguishing broad landcover vegetation categories [45,60]. We relied on the GE reference imagery to classify and group sites by perceived regrowth type: grass, shrub, deciduous, or coniferous/pine (hereafter “forest”, to indicate progression towards the pre-fire composition). Our distinction between “shrub” and “deciduous” is based on the seasonal expression of the dominant vegetation group. We define “shrub” as comprising scattered, low-stature, evergreen vegetation within an herbaceous or barren matrix; “deciduous” may exhibit similar spatial arrangement and structure but is clearly senescent in non-growing-season images. The primary goal was to choose sites representing the range of apparent successional vegetation outcomes. Qualified sites were selected from homogeneous patches (a minimum of 60 m diameter) to lessen the possibility of incorporating spectral information from adjacent Landsat pixels. Due to challenges in meeting these criteria, the final compilation of monitoring sites was not evenly distributed among fires. In total, we examined 29 sites from 10 pre-2000 fires, and five sites from two post-2000 fires (Table 1).

2.3. Imagery Time-Series

We constructed a time-series of moderate-resolution imagery for each sample site by assembling all available 30-m Landsat 4 and Landsat 5 Thematic Mapper (TM), Landsat 7 Enhanced Thematic Mapper Plus (ETM+), and Landsat 8 Operational Land Imager (OLI) surface reflectance datasets from 22 August 1982 to 31 December 2017 over the areas of interest. Pixels contaminated by clouds, cloud shadow, or snow were identified using the pixel quality assurance band and removed. We calculated the normalized difference vegetation index (NDVI) for each scene. We chose NDVI rather than other vegetation indices because of the length of its application in ecological studies and the unlikelihood of the signal saturating over the relatively sparse semiarid vegetation characteristic of this area [61]. We conducted all Landsat imagery processing through the JavaScript application programming interface in Google Earth Engine (GEE) [62].
The assembly of a multi-decade time-series of imagery obtained from different satellites raises the issue of reflectance consistency among sensors and across time. Landsat 4 and 5 TM bandwidth and wavelength configurations are identical, and Landsat 5 TM and Landsat 7 ETM+ data have been shown to have high consistency [63]. The collection parameters of the ETM+ and OLI sensors differ slightly in their specifications [64]. We tested the offsets suggested by [65] to adjust OLI NDVI values to match those derived by the other sensors. Comparison of results with and without the applied offsets indicated little variation, possibly because the metrics were sampled from a curve fit to the original data that filter out minor deviations. We sampled the complete Landsat time-series of unadjusted values at each site and exported the results to an ASCII file for subsequent processing.

2.4. Time-Series Processing

We manipulated NDVI data files in the open-source statistical package R (version 3.5.1) [66] to conform to the data format requirements of the phenology analysis package TIMESAT (version 3.2) [67,68], which includes regular time intervals for each year and few missing or spurious values. To comply with the requirement of consistent time periods, we binned NDVI values into 8- and 16-day intervals for each year starting from 1 January. We generated dual time periods of 8 and 16 days because the simultaneous operation of two Landsat satellites during portions of the study period (i.e., Landsat 4 and 5, 1984–1993; Landsat 5 and 7, 1999–2012; Landsat 7 and 8, 2013–2017) yields the potential for more frequent imagery acquisition than the 16-day revisit cycle of a single sensor, particularly if the sites of interest fall within areas of scene overlap. The 8-day interval is consistent with the higher temporal resolution possible under those circumstances, which could potentially capture the timing of ephemeral or highly dynamic green-up events more precisely. The 16-day interval represents the idealized acquisition of imagery by a single Landsat sensor under cloud-free conditions and is more typical of the data acquisition frequency throughout the entire period of Landsat operation. Barring dropouts due to atmospheric contamination, imagery collected over a 16-day interval from 1984 to 2017 includes 782 possible observations from which to derive phenometrics. Analysis of data from both period lengths provides the opportunity to compare their relative advantages for distinguishing the rapid changes in phenology that can characterize herbaceous species in dryland areas. Additional data preprocessing included averaging multiple values recorded within a single 8- or 16-day period and the removal of outlier values via a smoothing technique. Missing values were linearly interpolated to satisfy TIMESAT requirements of a consistent record of viable data.
To reduce noise within each input time-series [40], we fit an adaptive Savitzky–Golay filter in TIMESAT for each input time-series of NDVI values, with the following data parameters: two iterations, adaptation strength 2–3, window size 3 4, beginning and end of season defined by attainment of 20% of annual maximum value, no adjustments for spikes, and a valid data range of 0 to 1. Standard TIMESAT phenometric outputs derived from the fitted curve included start of season and end of season, which are commonly used metrics for tracking phenology in temperate, deciduous ecosystems; they are not well suited to the more erratic, precipitation-driven dynamics of dryland vegetation [69]. We relied on metrics that are more representative of semiarid vegetation patterns in a growing season: amplitude (the range between maximum and minimum values), base value (the minimum value), peak value (the maximum recorded value), and timing of the peak value. For each fire we coded years as either pre- or post-burn and tagged each post-burn phase with the number of years elapsed since the fire (Figure 2).

2.5. Analysis of Phenology Metrics

Our analysis focused on comparing pre- and post-fire phenology characteristics and quantifying post-fire changes as vegetation communities recovered and matured over time. We analyzed data points grouped by fire as well as by perceived trajectory of ecological outcome to derive general summaries. We also examined the effect of the timing interval (8- or 16-day aggregations) on the results for each metric. To compare results among recovery trajectories, we applied fixed-effect analysis of variance (ANOVA) tests and conducted Tukey’s honestly significant difference (HSD) post hoc tests on results with significant (p < 0.05) findings. We used Welch’s t-tests [70] for comparisons of amplitude, base NDVI, and peak NDVI between the 8- and 16-day groupings, and the Watson–Wheeler test of homogeneity [71] to evaluate peak day of year (DOY) metrics. The peak day of year ranged from early spring to late fall, which complicates standard methods of aggregation [72]. An observed peak on 1 March (DOY 60), for instance, is temporally closer to 1 November (DOY 305) than it is to 1 August (DOY 213). To account for the circular nature of phenology dates, we converted days of year to their angular equivalents:
θ i = i * 360 365 * π 180
where i is the DOY and π 180 is the conversion factor from degrees to radians. We calculated the mean of multiple peak timing dates by summing the sine and cosine values of the contributing angles:
C =   cos θ i
and
S =   sin θ i
and then calculated the arctangent based on those sums:
θ ¯ = atan 2 ( S ,   C )
We calculated the standard deviation of the mean:
δ =   2 ln R ¯
where
R ¯ =   1 n S n 2 +   C n 2 .
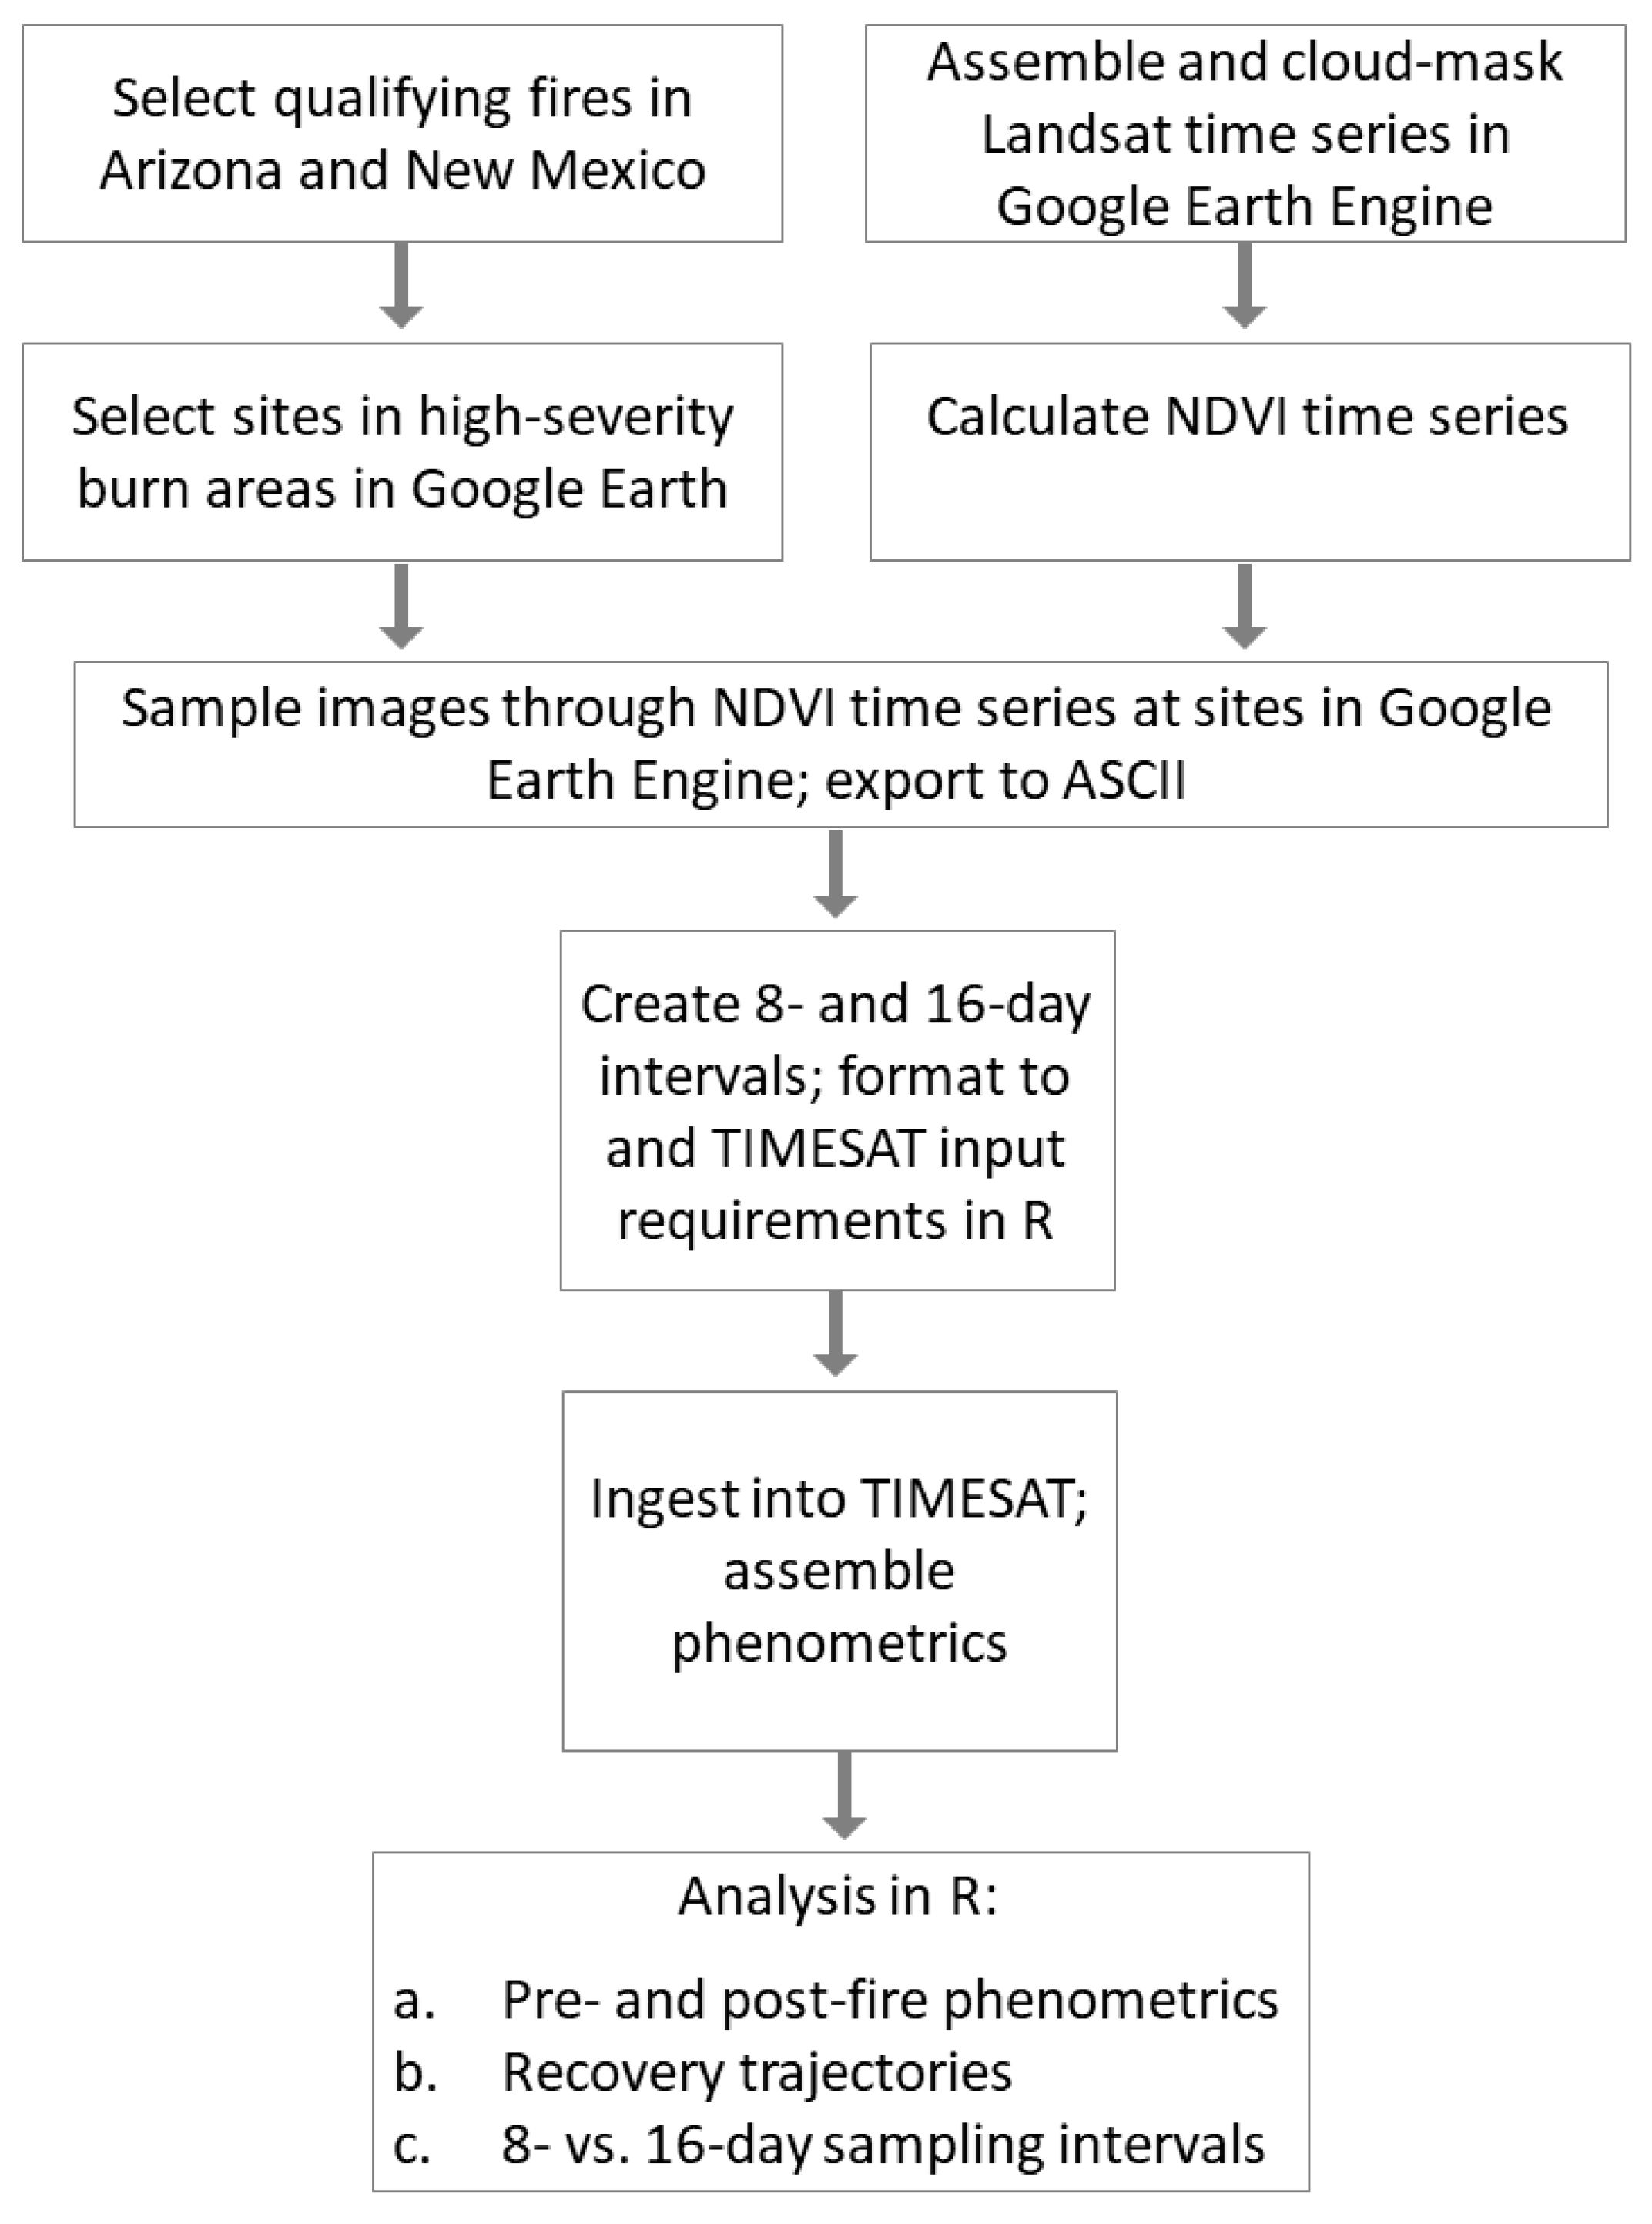
as detailed in [73]. A schematic of the overall methodology workflow is displayed in Figure 3. A compilation of phenometrics for each site can be found in Supplementary Materials.

3. Results

3.1. Comparison of Pre- versus Post-Fire Phenometrics

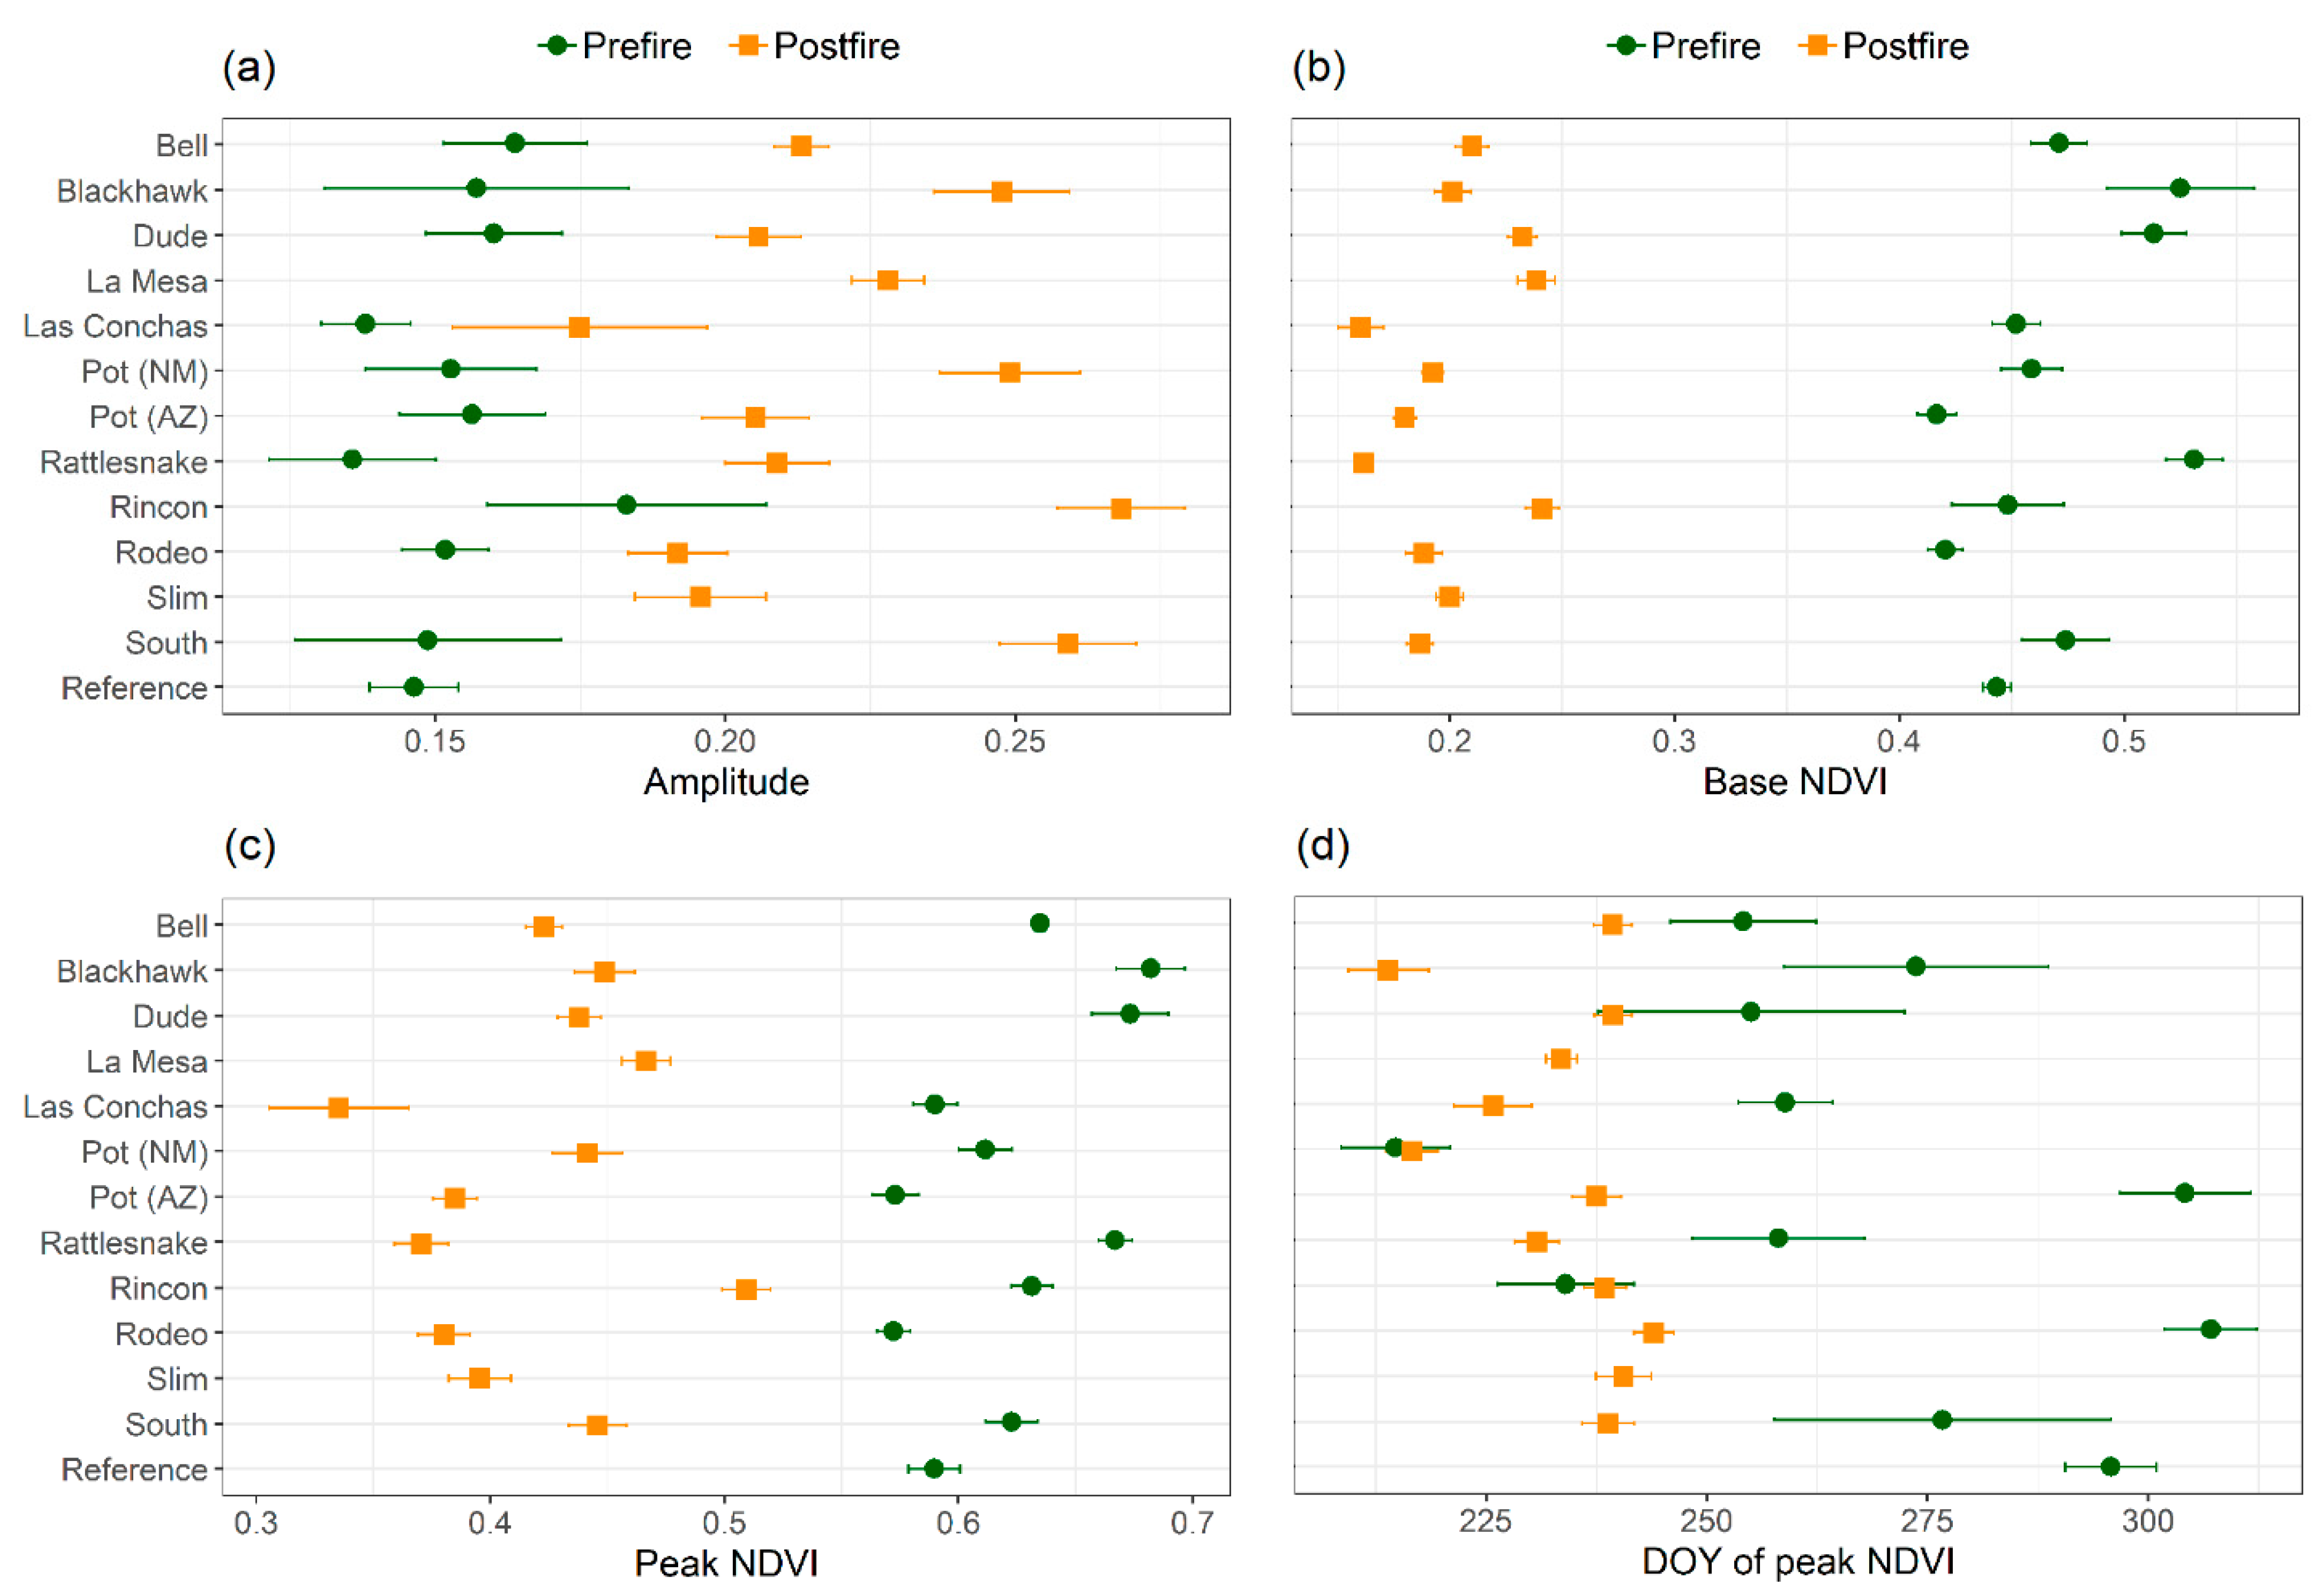
Comparisons of pre- and post-fire dynamics revealed general patterns that were maintained across fires regardless of projected vegetation recovery outcomes. At all sample sites with both sets of values, pre-fire stands of mature ponderosa pine consistently displayed lower mean amplitudes, higher bases, and higher peak NDVIs than post-burn communities (Figure 4a–c). Timing of peak greenness was less consistent, with 8 of the 10 fires displaying later peaks during the pre-fire period (Figure 4d). Sample sites located in the Pot (NM) and Rincon fires exhibited different post-fire behavior. Nevertheless, all pre- and post-fire metrics were statistically different (p < 0.05) when aggregated across all sample sites (Table 2).

3.2. Comparison of Phenometrics by Recovery Trajectory

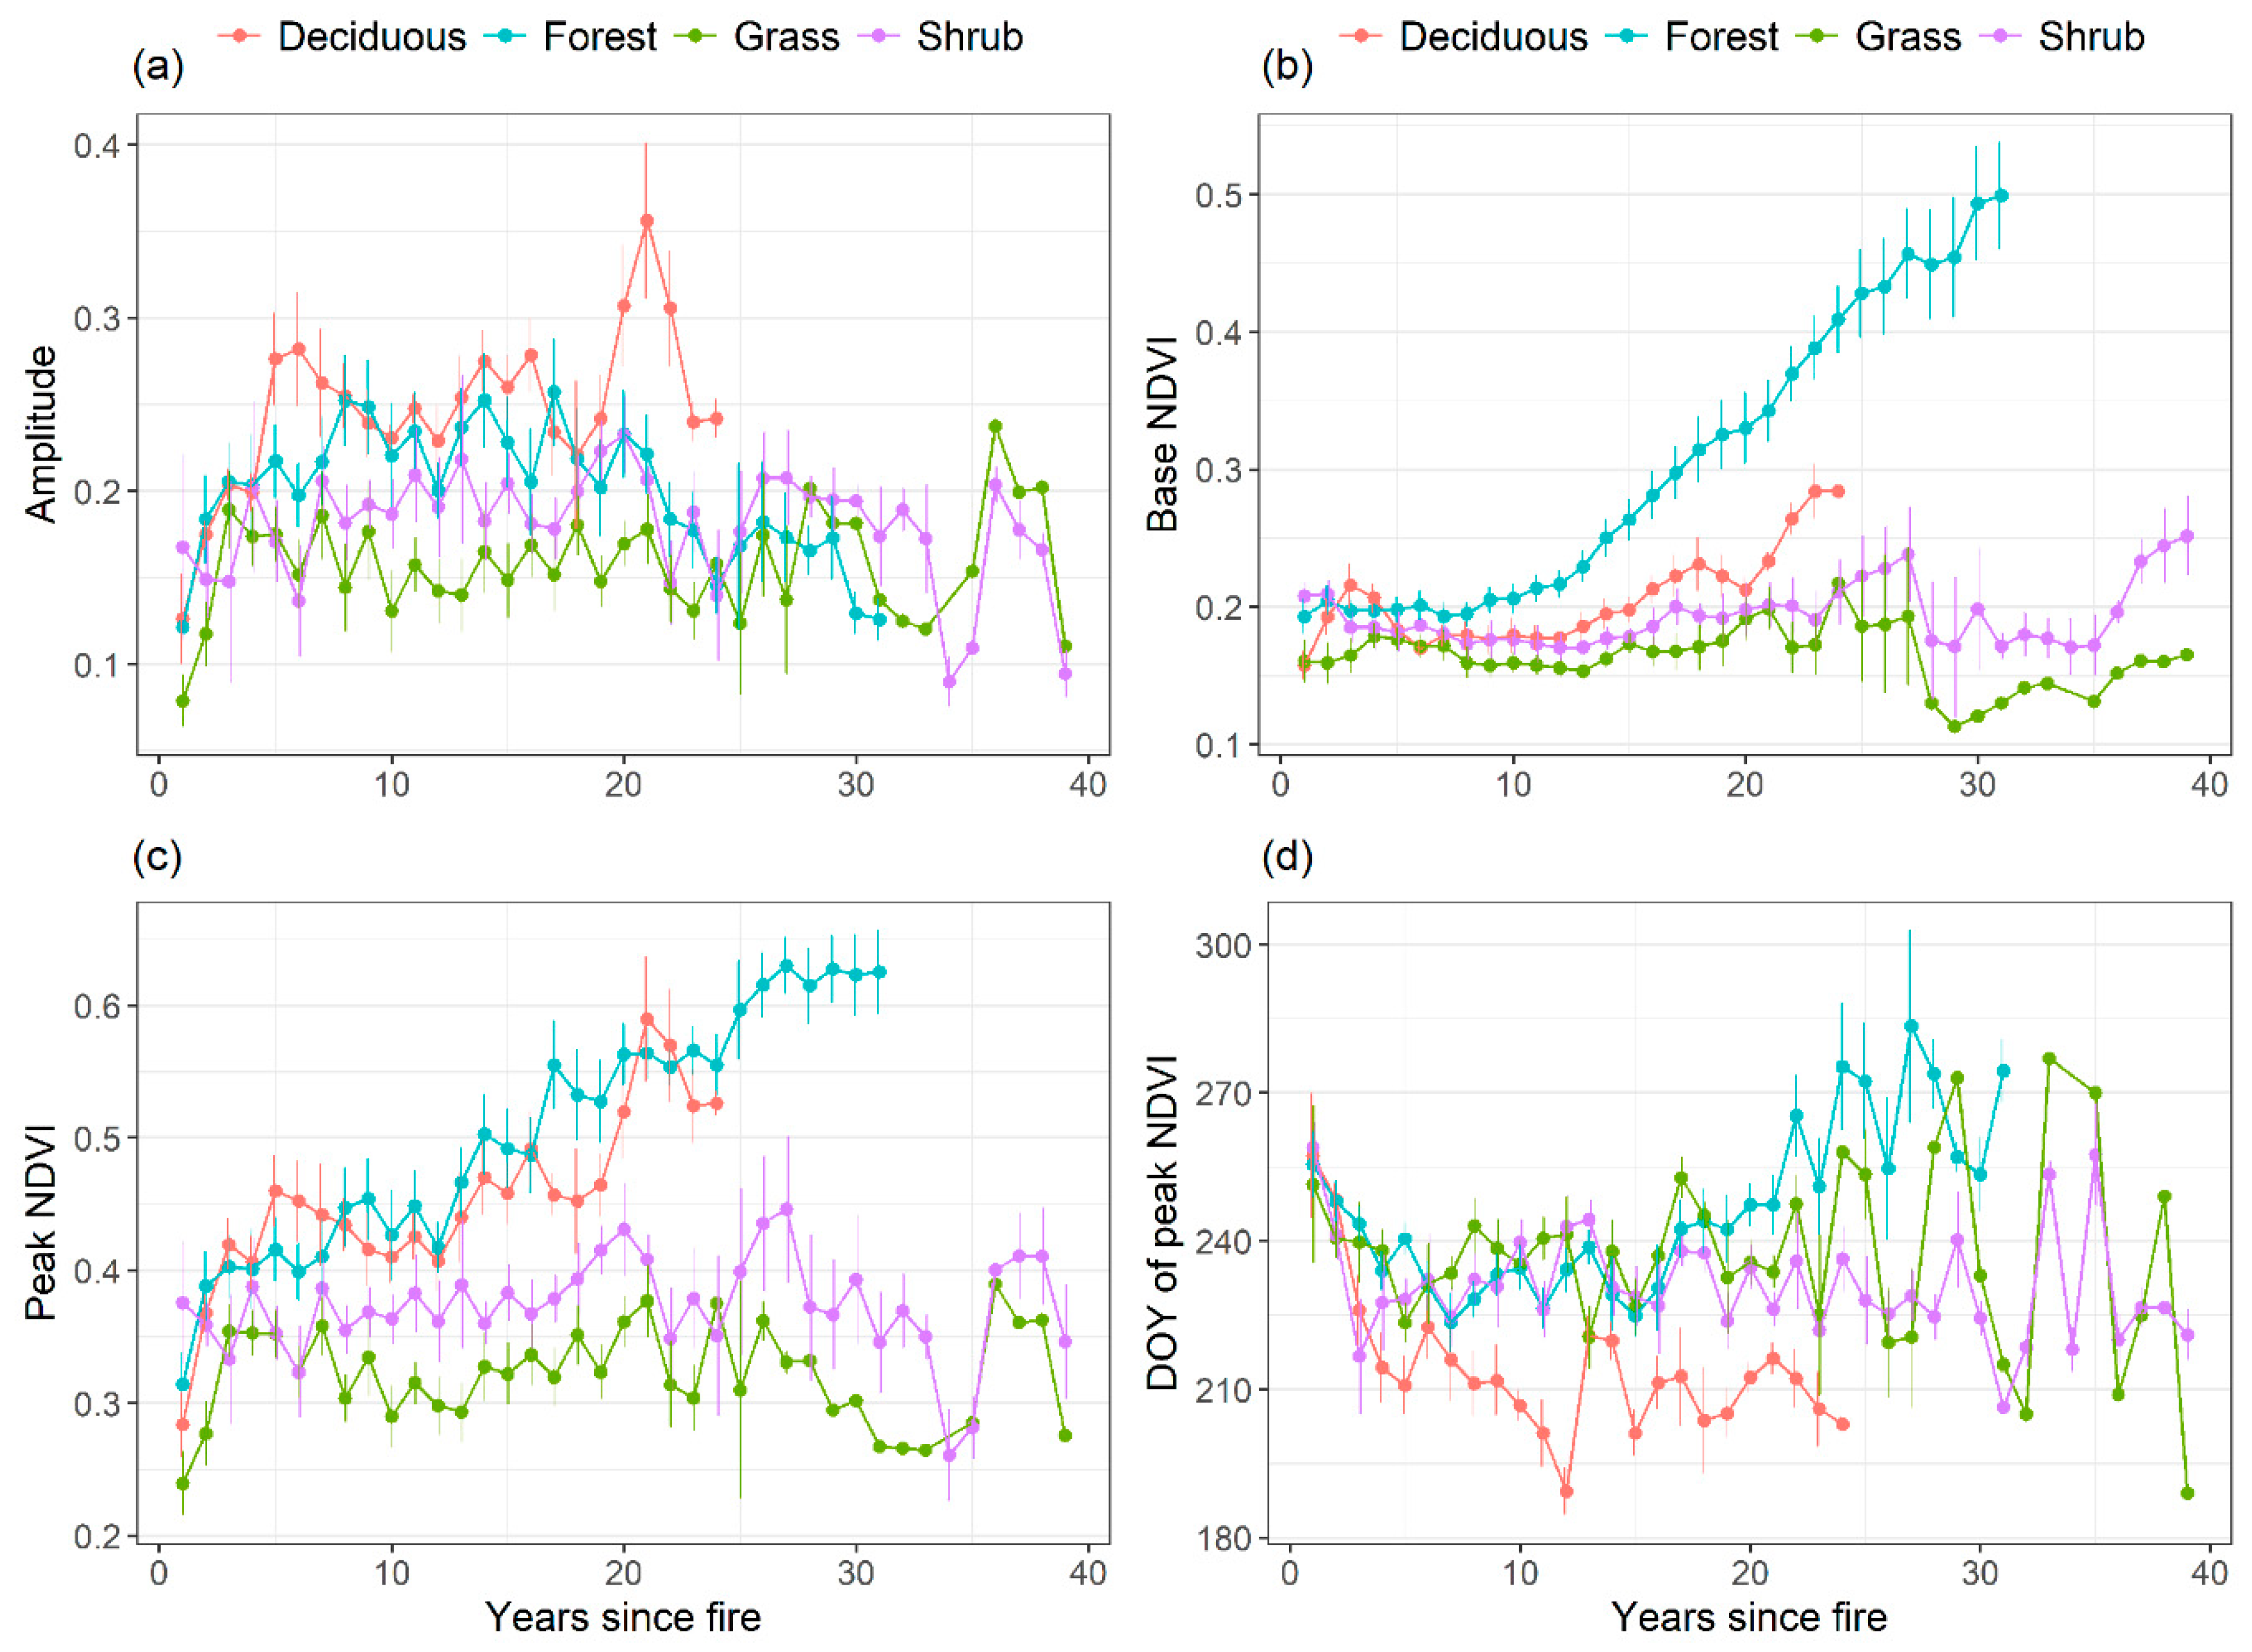
Examining post-burn phenometrics grouped by recovery trajectory allows a comparison of the relative progression of NDVI signals over time (Figure 5a–d). For the first few years of recovery, the groups are indistinguishable in each phenometric. The earliest signs of sustained differentiation are apparent in the base and peak value metrics, where clear and consistent separability of all classes begins around year 8 (Figure 5b,c). In both cases, the forest, deciduous, shrub, and grass classes maintain a highest-to-lowest order for the remainder of the analysis period, with few exceptions. The classes likewise display early separability in amplitude in year 5 (Figure 5a), but the class order is not consistent over the study period. The general pattern (highest to lowest amplitude) of deciduous, forest, shrub, and grass is maintained until year 20, when the shrub and forest classes begin to decline. By year 28, the forest class registers the lowest amplitude. For the timing of peak NDVI, the deciduous class again displays early (year 4) separability and consistently peaks sooner than the other classes (Figure 5d). Forest, shrub, and grass classes are indistinguishable with respect to peak timing until year 20, at which point forest begins a trend towards later peaks, shrub is relatively consistent, and grass is characterized by highly dynamic variation. The record length of each class is determined by the timing of the fire within which it was located, and accounts for the shorter time-series of the forest and deciduous groups.
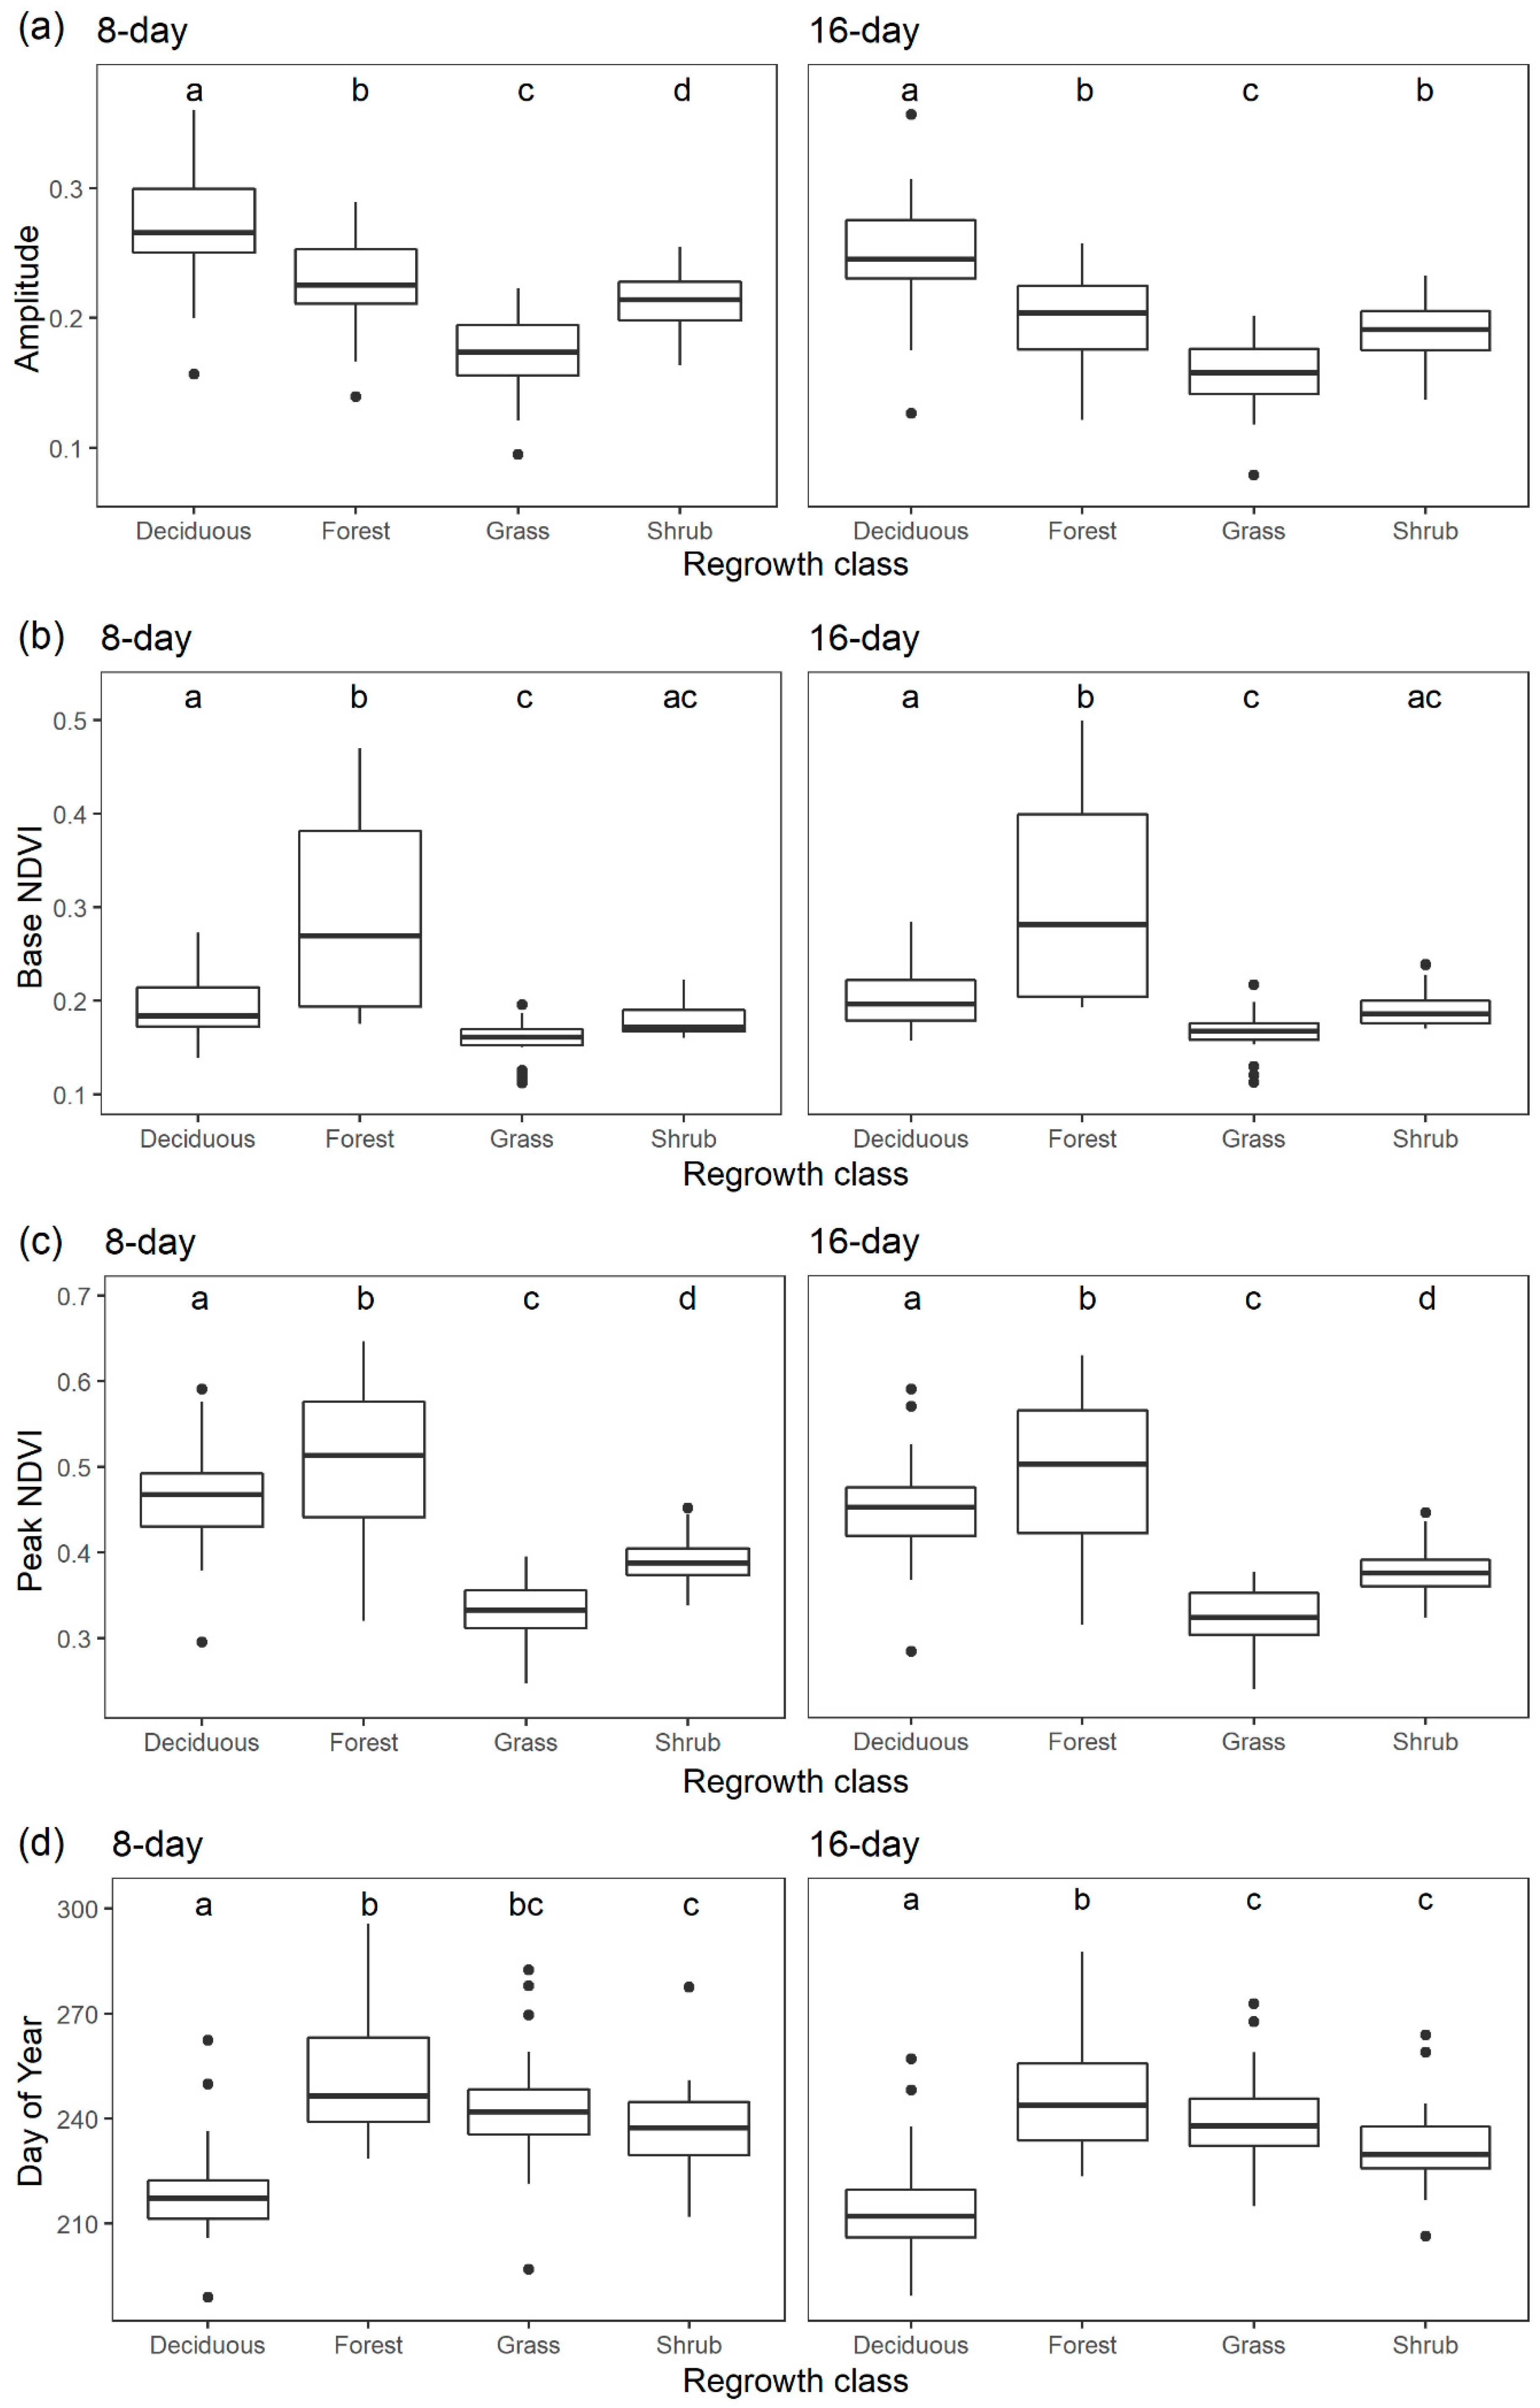
Analysis of variance tests to compare the effect of recovery trajectory on each phenometric yielded significant results in all cases (p < 0.05). Subsequent post hoc Tukey tests identified significant pair-wise differences, which varied among the phenometrics and by sampling interval (Figure 6).

3.3. Differences between 8- and 16-day Aggregations.

When each phenometric was grouped by sampling interval (8- or 16-day) and aggregated across all fires, statistical tests returned significant differences at α = 0.05 for all metrics except peak NDVI value. Amplitude was higher in the 8-day interval (mean +/− SD: 0.20 +/− 0.08) than the 16-day interval (0.18 +/− 0.08) (t(2219) = 6.65, p < 1e10). Base NDVI returned the opposite results, with a lower value in the 8-day interval (0.28 +/− 0.14) than the 16-day (0.30 +/− 0.14) (t(2219) = −2.05, p = 0.04). Timing (day of year) of peak NDVI was later in the 8-day interval: 247.7 +/− 38.5 vs. 16-day 243.0 +/− 37.6 (W(2) = 45.7, p < 1e9). In each case, effect sizes (Cohen’s d) were small: 0.28 (amplitude), 0.87 (base NDVI), and 0.063 (timing of peak NDVI).

4. Discussion

This analysis investigated the potential for using phenology metrics derived from 34 years of 30-m Landsat imagery to interpret and track regional post-fire regeneration trends in ponderosa pine forests of the southwestern US. The major successional vegetation groups in these ecosystems display representative timing and magnitude responses of seasonal greenness and primary productivity. Our results show that these distinctions can be exploited via time-series of Landsat images to gain insights into community-level recovery trends. Depending on the date of fire and the availability of satellite data, these methods may be used to track post-burn recovery over decades. The findings presented here hold promise for their ability to identify different vegetation composition trajectories at relatively early stages of recovery. The ability of forest managers to predict the recovery trajectory of a post-fire landscape can inform and optimize planting and regeneration strategies.

4.1. Pre versus Post-Burn Phenometrics

We identified the characteristic baseline phenometrics of mature ponderosa pine forests as annually low signal amplitude, high base NDVI, high peak NDVI, and late timing of peak NDVI. These results are consistent with those of [40] in a similar biogeographical setting. Post-burn characteristics of the same phenometrics are significantly different across all recovery types when aggregated across the recovery period. The deviations from that pattern are in the Pot (NM) and Rincon fires, which have later timing of peak NDVI in the post-fire period than in the pre-fire period. Inspection of the relevant datasets reveals one year with anomalously early pre-fire timing of peak NDVI in each case. Given the limited number of years of satellite acquisition before each 1994 fire, the low value decisively weighted the pre-fire mean. We cannot definitively state whether the anomalous point was due to an artifact of curve fitting or if it represents true ground conditions. Overall, the high contrast in values confirms that the pre-and post-burn landscapes are phenologically distinct and represent a potentially useful measure for assessing the degree of recovery in post-fire areas. Presumably, convergence of the suite of post-fire values to match pre-fire originals will indicate that the recovery has resulted in coniferous forest conditions.

4.2. Differentiation of Recovery Trajectories

In this study, different recovery tracks begin to exhibit phenological separability within the first decade after stand-replacing fire. By year 8, peak NDVI and base NDVI signals can be used to partition the recovery tracks into general categories; by year 20, the consideration of all phenometrics allows for a high-confidence discrimination of general functional groups. The abbreviated post-burn period of analysis (maximum of seven years) in [41] likely accounts for the lack of perceptible phenometric-based differentiation. The collective evaluation of all phenometrics is necessary because no single metric is a conclusive determinant of landscape assembly; a narrow amplitude, for instance, is characteristic of both low amounts of herbaceous ground cover as well as mature ponderosa pine forest. The combination of a low amplitude with a high base value and high/late peak, however, can rule out alternative composition types. The general characteristics for each of the major vegetation classes can be summarized as:
  • Grass: low amplitude; low base NDVI; low peak NDVI; variable timing of peak NDVI.
  • Shrub: mid amplitude; mid base NDVI; mid peak NDVI; mid timing of peak NDVI.
  • Deciduous: high amplitude; low base NDVI; high peak NDVI; early timing of peak NDVI.
  • Forest: low amplitude; high base NDVI; high peak NDVI; late timing of peak NDVI.
Interpreting the phenology signals in light of knowledge about the responsiveness of herbaceous and woody materials to seasonal-specific conditions such as temperature and the timing and amount of precipitation allows insights into the behavior of the different phenometrics. The high dynamic range of the grass class for the timing of peak NDVI, for instance, is most likely a function of the responsiveness of herbaceous plants to moisture inputs in water-limited environments [42,74].
Although we intended to use Landsat imagery to investigate fine-scale homogeneous vegetation types that might be undetectable at coarser pixel resolutions, pure land-cover classes are difficult to identify in these ecosystems even at a 30-m resolution. Landcover heterogeneity is likely responsible for confusion between some of the trajectory types, such as shrub and grassland. We selected points to represent endmembers of recovery possibilities, but dryland ponderosa pine ecosystems are inherently complex and heterogeneous [10]. The growing array of satellite platforms at finer-scale spatial resolutions (<30 m) (e.g., the Sentinel-2 mission) will be critical for supplying dense time-series of data that can effectively capture nuanced vegetation responses of dryland areas with heterogeneous land cover.

4.3. Effect of Sampling Interval on Derived Phenometrics

The investigation of whether 8 or 16 days is the more appropriate analysis time step returned mixed results. The phenology trajectories of shrub-forest (amplitude) and grass-forest (timing of peak NDVI) are significantly different depending on the grouping interval (Figure 6). Mean differences of each phenometric also identify the 8-day grouping as having significantly higher amplitudes, lower base values, and later peak NDVI, which indicates that the more precise grouping potentially captures extreme values. However, the effect size in each case is small, and visual inspection of the 8- and 16-day phenometric profiles over time reveals only minor contrasting variations. The relative unimportance of the sampling interval here may be due more to the irregular nature of the underlying data acquisition than to the sensitivity of the derived indices to temporal precision. Specifically, no 8- or 16-day period in the time-series necessarily encompasses a clear-sky image, and gaps due to missing NDVI data were linearly interpolated to create an artificially consistent sequence. We are thus limited to the conclusion that partitioning the time-series into 8-day intervals did not practically improve the identification of recovery trajectories. Nevertheless, the collection of clear images at hyper-temporal intervals can exploit the subtle phenology characteristics of different vegetative components for classification purposes (e.g., [75,76]).

4.4. Applicability and Future Efforts

The methods presented here are potentially transferable to any ecosystem in which disturbance events can trigger alternate regeneration pathways with distinct phenological characteristics. Candidate ecosystems include high-latitude boreal forests, where unusual fire activity can promote biome shifts from coniferous to deciduous dominance [77,78], and Mediterranean ecosystems, where fires can convert deciduous forests to evergreen shrublands [79,80] or from pine forests to oak woodlands or grasslands [81,82]. Successful application of this approach requires the collection of sufficient cloud-free imagery to allow the detection of phenometric contrasts. Incorporating imagery from other remote sensing platforms (e.g., Sentinel-2) may be necessary to increase the number of clear acquisitions [50] if phenology differences among vegetation groups can only be observed on the basis of dense time-series.
We foresee multiple avenues for future research. The most immediate is to expand the range of sample locations to determine the extent to which the results seen here are representative of ponderosa pine forest recovery across the western US. This consideration encompasses a temporal as well as a spatial element. The selection of fires from the earlier part of the Landsat TM era allowed for the assembly of a multi-year time-series, but also ensured that most recovery tracks proceeded under similar climatic conditions. Analyzing the sensitivity of successional track response to climatic events such as drought at different points along the recovery timeline will help parameterize the range of variability and lend greater interpretive power to phenology time-series. A geographical expansion beyond ponderosa pine ecosystems will similarly allow for the determination of the suitability of this approach across a range of western US dryland forests. Observations of regeneration failure for other high-elevation pine species (e.g., Pinus engelmannii and Pinus contorta) [83], justify an investigation of the general applicability of this method. Finally, grounding the study in field-based examinations of successional track composition would link remote sensing signals to quantitative measures of vegetation type and proportion. The validation of plant community types and proportions along the recovery timeline would establish an explicit connection between remote-sensing-derived phenology metrics and vegetation composition. This information could potentially provide resource managers with maps of current and predicted vegetation land cover over time.
Vegetation type conversions are not a uniquely modern phenomena in ponderosa pine ecosystems; the shift from forested to grass- or brush-dominated systems was recorded in northern Arizona in the early 20th century, when clear-cut or severely burned areas failed to regenerate to forest [27,84]. The contemporary difference is the potential magnitude of landscape transformation given the convergence of disturbance and climatic regime changes. The conversion of vast tracts of forest to different functional characteristics would have profound implications for the provision of ecosystem services such as economic factors (timber) [85], wildlife habitats, carbon sequestration [29,86], watershed support [87,88], and recreation, all of which are impacted by a restructured vegetation assembly. As an ever-larger proportion of southwestern US ponderosa pine forests is recovering from high-severity burns at a time of increasing climatic warmth and drought [23], the range of potential post-fire vegetation trajectories complicates the prediction of future landscape composition and ecological functions. Early determinations of recovery outcomes would allow for more proactive management intervention and the targeted application of resources. The varied phenological signatures of the likeliest assembly types can be helpful for interpreting observed remote sensing signals in the context of eventual recovery outcomes.

5. Conclusions

Changes in the amount and timing of precipitation play a critical role in redirecting post-fire recovery in ponderosa pine ecosystems towards grassland, shrubland, or deciduous vegetation [23]. Climate-mediated deflections to alternate vegetation communities highlight the need to develop methods for quantifying and predicting the composition of future landscapes. In line with our objectives, we have successfully applied 8- and 16-day phenology metrics derived from Landsat time-series to describe a range of post-fire recovery trajectories and identify unique characteristics that distinguish these recovery pathways from one another. Our results show that phenometrics derived from Landsat time-series can be used to identify key vegetation components of successional tracks in post-burn ponderosa pine forests of the southwestern US. In this study, recovering forests began to exhibit phenological differences among predominantly grass, shrub, deciduous, and coniferous functional groups within 8 to 10 years. A high-confidence resolution of the primary trajectory was possible after 20 years of recovery. The approach outlined here holds promise as a tool for assessing ecosystem trends across the southwestern United States, particularly since computational advances now enable synoptic examinations over extended time spans. Future research will focus on assessments of landscape recovery after fires. The methods presented here may be applicable as well to wider ranges of post-disturbance landscapes. As our understanding of the patterns and rates of recovery continues to expand, we can begin to assess how recovery trajectories are shaped over space and time by different driving forces, including topography, climate, soils, and proximity to land-use types.

Supplementary Materials

A tabular file of the sites and accompanying phenometrics used for this research can be found on ScienceBase (https://doi.org/10.5066/P9Y1Z03F).

Author Contributions

Conceptualization, J.J.W.; Methodology, J.J.W.; Formal analysis, J.J.W. and C.E.S.; Writing—original draft preparation, J.J.W.; Writing—review and editing, J.J.W. and C.E.S.; Visualization, J.J.W.

Funding

This research was funded by the U.S. Geological Survey Mendenhall Postdoctoral program, with additional support by the U.S. Geological Survey Climate Research and Development Program of the Land Resources Mission Area.

Acknowledgments

The authors would like to thank the three anonymous reviewers whose comments strengthened this paper. We also thank Sandra L. Haire and Cynthia S.A. Wallace for their insightful comments and critiques.

Conflicts of Interest

The authors declare no conflict of interest.

References

  1. Liu, Y.; Goodrick, S.L.; Stanturf, J.A. Future U.S. wildfire potential trends projected using a dynamically downscaled climate change scenario. For. Ecol. Manag. 2013, 294, 120–135. [Google Scholar] [CrossRef]
  2. Littell, J.S.; McKenzie, D.; Peterson, D.L.; Westerling, A.L. Climate and wildfire area burned in western U.S. ecoprovinces, 1916-2003. Ecol. Appl. 2009, 19, 1003–1021. [Google Scholar] [CrossRef] [PubMed]
  3. Westerling, A.L.; Hidalgo, H.G.; Cayan, D.R.; Swetnam, T.W. Warming and earlier spring increase western U.S. forest wildfire activity. Science 2006, 313, 940–943. [Google Scholar] [CrossRef] [PubMed]
  4. Hurteau, M.D.; Bradford, J.B.; Fulé, P.Z.; Taylor, A.H.; Martin, K.L. Climate change, fire management, and ecological services in the southwestern US. For. Ecol. Manag. 2014, 327, 280–289. [Google Scholar] [CrossRef]
  5. Fulé, P.Z.; Heinlein, T.A.; Covington, W.W.; Moore, M.M. Assessing fire regimes on Grand Canyon landscapes with fire-scar and fire-record data. Int. J. Wildl. Fire 2003, 12, 129–145. [Google Scholar] [CrossRef]
  6. Cooper, C.F. Pattern in ponderosa pine forests. Ecology 1961, 42, 493–499. [Google Scholar] [CrossRef]
  7. White, A.S. Presettlement regeneration patterns in a southwestern ponderosa pine stand. Ecology 1985, 66, 589–594. [Google Scholar] [CrossRef]
  8. Covington, W.W.; Moore, M.M. Southwestern ponderosa forest structure. J. For. 1994, 92, 39–47. [Google Scholar]
  9. Fulé, P.Z.; Covington, W.W.; Moore, M.M. Determining reference conditions for ecosystem management of southwestern ponderosa pine forests. Ecol. Appl. 1997, 7, 895–908. [Google Scholar] [CrossRef]
  10. Allen, C.D.; Savage, M.; Falk, D.A.; Suckling, K.F.; Swetnam, T.W.; Schulke, T.; Stacey, P.B.; Morgan, P.; Hoffman, M.; Klingel, J.T. Ecological restoration of southwestern ponderosa pine ecosystems: A broad perspective. Ecol. Appl. 2002, 12, 1418–1433. [Google Scholar] [CrossRef]
  11. Friederici, P. Ecological Restoration of Southwestern Ponderosa Pine Forests; Friederici, P., Ed.; Island Press: Washington, DC, USA, 2003. [Google Scholar]
  12. Romme, W.H.; Kaufmann, M.; Veblen, T.; Sherriff, R.; Regan, C.M. Ecological effects of the Hyman Fire—Part 2: Historical (Pre-1860) and current (1860–2002) forest and landscape structure. In Hayman Fire Case Study. Gen. Tech. Rep. RMRS-GTR-114; Graham, R.T., Ed.; U.S. Department of Agriculture, Forest Service, Rocky Mountain Research Station: Ogden, UT, USA, 2003; pp. 196–203. [Google Scholar]
  13. Swetnam, T.W.; Allen, C.D.; Betancourt, J.L. Applied historical ecology: Using the past to manage for the future. Ecol. Appl. 1999, 9, 1189–1206. [Google Scholar] [CrossRef]
  14. Mast, J.N.; Veblen, T.T.; Linhart, Y.B. Disturbance and climatic influences on age structure of ponderosa pine at the pine/grassland ecotone, Colorado Front Range. J. Biogeogr. 1998, 25, 743–755. [Google Scholar] [CrossRef]
  15. Brown, P.M.; Wu, R. Climate and disturbance forcing of episodic tree recruitment in a southwestern ponderosa pine landscape. Ecology 2005, 86, 3030–3038. [Google Scholar] [CrossRef]
  16. Overpeck, J.; Udall, B. Dry times ahead. Science 2010, 328, 1642–1643. [Google Scholar] [CrossRef]
  17. Williams, A.P.; Allen, C.D.; Millar, C.I.; Swetnam, T.W.; Michaelsen, J.; Still, C.J.; Leavitt, S.W. Forest responses to increasing aridity and warmth in the southwestern United States. Proc. Natl. Acad. Sci. USA 2010, 107, 21289–21294. [Google Scholar] [CrossRef]
  18. McKenzie, D.; Gedalof, Z.M.; Peterson, D.L.; Mote, P. Climatic change, wildfire, and conservation. Conserv. Biol. 2004, 18, 890–902. [Google Scholar] [CrossRef]
  19. Stephens, S.L.; Agee, J.K.; Fulé, P.Z.; North, M.P.; Romme, W.H.; Swetnam, T.W.; Turner, M.G. Managing forests and fire in changing climates. Science 2013, 342, 41–42. [Google Scholar] [CrossRef]
  20. Dennison, P.E.; Brewer, S.C.; Arnold, J.D.; Mortiz, M.A. Large wildfire trends in the western United States, 1984-2011. Geophys. Res. Lett. 2014, 41, 2928–2933. [Google Scholar] [CrossRef]
  21. Cohen, W.B.; Yang, Z.; Stehman, S.V.; Schroeder, T.A.; Bell, D.M.; Masek, J.G.; Huang, C.; Meigs, G.W. Forest disturbance across the conterminous United States from 1985–2012: The emerging dominance of forest decline. For. Ecol. Manag. 2016, 360, 242–252. [Google Scholar] [CrossRef]
  22. Adams, M.A. Mega-fires, tipping points and ecosystem services: Managing forests and woodlands in an uncertain future. For. Ecol. Manag. 2013, 294, 250–261. [Google Scholar] [CrossRef]
  23. Savage, M.; Mast, J.N.; Feddema, J.J. Double whammy: High-severity fire and drought in ponderosa pine forests of the Southwest. Can. J. For. Res. 2013, 43, 570–583. [Google Scholar] [CrossRef]
  24. Dieterich, J.H. Recovery Potential of Fire-Damaged Southwestern Ponderosa Pine; Research Note RM-379; U.S. Department of Agriculture, Forest Service, Rocky Mountain Forest and Range Experiment Station: Fort Collins, CO, USA, 1979.
  25. Dodson, E.K.; Root, H.T. Native and exotic plant cover vary inversely along a climate gradient 11 years following stand-replacing wildfire in a dry coniferous forest, Oregon, USA. Glob. Chang. Biol. 2015, 21, 666–675. [Google Scholar] [CrossRef] [PubMed]
  26. Feddema, J.J.; Mast, J.N.; Savage, M. Modeling high-severity fire, drought and climate change impacts on ponderosa pine regeneration. Ecol. Modell. 2013, 253, 56–69. [Google Scholar] [CrossRef]
  27. Schubert, G.H. Silviculture of Southwestern Ponderosa Pine: The Status of Our Knowledge. Res. Paper RM-123; U.S. Department of Agriculture, Forest Service, Rocky Mountain Forest and Range Experiment Station: Fort Collins, CO, USA, 1974.
  28. Savage, M.; Mast, J.N. How resilient are southwestern ponderosa pine forests after crown fires? Can. J. For. Res. 2005, 35, 967–977. [Google Scholar] [CrossRef]
  29. Dore, S.; Montes-Helu, M.; Hart, S.C.; Hungate, B.A.; Koch, G.W.; Moon, J.B.; Finkral, A.J.; Kolb, T.E. Recovery of ponderosa pine ecosystem carbon and water fluxes from thinning and stand-replacing fire. Glob. Chang. Biol. 2012, 18, 3171–3185. [Google Scholar] [CrossRef] [PubMed]
  30. Kuenzi, A.M.; Fulé, P.Z.; Sieg, C.H. Effects of fire severity and pre-fire stand treatment on plant community recovery after a large wildfire. For. Ecol. Manag. 2008, 255, 855–865. [Google Scholar] [CrossRef]
  31. Haire, S.L.; McGarigal, K. Effects of landscape patterns of fire severity on regenerating ponderosa pine forests (Pinus ponderosa) in New Mexico and Arizona, USA. Landsc. Ecol. 2010, 25, 1055–1069. [Google Scholar] [CrossRef]
  32. Roccaforte, J.P.; Fulé, P.Z.; Chancellor, W.W.; Laughlin, D.C. Woody debris and tree regeneration dynamics following severe wildfires in Arizona ponderosa pine forests. Can. J. For. Res. 2012, 42, 593–604. [Google Scholar] [CrossRef]
  33. Tucker, C.J. Red and photographic infrared linear combinations for monitoring vegetation. Remote Sens. Environ. 1979, 8, 127–150. [Google Scholar] [CrossRef]
  34. Tucker, C.J.; Sellers, P.J. Satellite remote sensing of primary production. Int. J. Remote Sens. 1986, 7, 1395–1416. [Google Scholar] [CrossRef]
  35. Casady, G.M.; Marsh, S.E. Broad-scale environmental conditions responsible for post-fire vegetation dynamics. Remote Sens. 2010, 2, 2643–2664. [Google Scholar] [CrossRef]
  36. Díaz-Delgado, R.; Lloret, F.; Pons, X.; Terradas, J. Satellite evidence of decreasing resilience in Mediterranean plant communities after recurrent wildfires. Ecology 2002, 83, 2293–2303. [Google Scholar] [CrossRef] [Green Version]
  37. Gouveia, C.; DaCamara, C.C.; Trigo, R.M. Post-fire vegetation recovery in Portugal based on spot/vegetation data. Nat. Hazards Earth Syst. Sci. 2010, 10, 673–684. [Google Scholar] [CrossRef] [Green Version]
  38. Röder, A.; Hill, J.; Duguy, B.; Alloza, J.; Vallejo, R. Using long time series of Landsat data to monitor fire events and post-fire dynamics and identify driving factors. A case study in the Ayora region (eastern Spain). Remote Sens. Environ. 2008, 112, 259–273. [Google Scholar] [CrossRef]
  39. Telesca, L.; Lasaponara, R. Pre- and post-fire behavioral trends revealed in satellite NDVI time series. Geophys. Res. Lett. 2006, 33, 2–5. [Google Scholar] [CrossRef]
  40. van Leeuwen, W.J.D. Monitoring the effects of forest restoration treatments on post-fire vegetation recovery with MODIS multitemporal data. Sensors 2008, 8, 2017–2042. [Google Scholar] [CrossRef] [PubMed] [Green Version]
  41. van Leeuwen, W.J.D.; Casady, G.M.; Neary, D.G.; Bautista, S.; Alloza, J.A.; Carmel, Y.; Wittenberg, L.; Malkinson, D.; Orr, B.J. Monitoring post-wildfire vegetation response with remotely sensed time-series data in Spain, USA and Israel. Int. J. Wildl. Fire 2010, 19, 75–93. [Google Scholar] [CrossRef]
  42. Crimmins, T.M.; Crimmins, M.A.; Bertelsen, C.D. Onset of summer flowering in a “Sky Island” is driven by monsoon moisture. New Phytol. 2011, 191, 468–479. [Google Scholar] [CrossRef]
  43. Rich, P.M.; Breshears, D.D.; White, A.B. Phenology of mixed woody-herbaceous ecosystems following extreme events: Net and differential responses. Ecology 2008, 89, 342–352. [Google Scholar] [CrossRef]
  44. Davison, J.E.; Breshears, D.D.; van Leeuwen, W.J.D.; Casady, G.M. Remotely sensed vegetation phenology and productivity along a climatic gradient: On the value of incorporating the dimension of woody plant cover. Glob. Ecol. Biogeogr. 2011, 20, 101–113. [Google Scholar] [CrossRef]
  45. Walker, J.; de Beurs, K.; Wynne, R.H. Phenological response of an Arizona dryland forest to short-term climatic extremes. Remote Sens. 2015, 7, 10832–10855. [Google Scholar] [CrossRef] [Green Version]
  46. Brandt, M.; Hiernaux, P.; Tagesson, T.; Verger, A.; Rasmussen, K.; Diouf, A.A.; Mbow, C.; Mougin, E.; Fensholt, R. Woody plant cover estimation in drylands from Earth Observation based seasonal metrics. Remote Sens. Environ. 2016, 172, 28–38. [Google Scholar] [CrossRef] [Green Version]
  47. Walker, J.J.; de Beurs, K.M.; Wynne, R.H. Dryland vegetation phenology across an elevation gradient in Arizona, USA, investigated with fused MODIS and Landsat data. Remote Sens. Environ. 2014, 144. [Google Scholar] [CrossRef]
  48. Cohen, W.B.; Goward, S.N. Landsat’s role in ecological applications of remote sensing. Bioscience 2004, 54, 535–545. [Google Scholar] [CrossRef]
  49. Walker, J.J.; de Beurs, K.M.; Wynne, R.H.; Gao, F. Evaluation of Landsat and MODIS data fusion products for analysis of dryland forest phenology. Remote Sens. Environ. 2012, 117, 381–393. [Google Scholar] [CrossRef]
  50. Wulder, M.A.; Masek, J.G.; Cohen, W.B.; Loveland, T.R.; Woodcock, C.E. Opening the archive: How free data has enabled the science and monitoring promise of Landsat. Remote Sens. Environ. 2012, 122, 2–10. [Google Scholar] [CrossRef]
  51. O’Hara, K.L. Multiaged silviculture of ponderosa pine. In Proceedings of the Symposium on Ponderosa Pine: Issues, Trends, and Management, Klamath Falls, OR, USA, 18–21 October 2004; Gen. Tech. Rep PSW-GTR-198. Ritchie, M.W., Maguire, D.A., Youngblood, A., Eds.; Pacific Southwest Research Station, Forest Service, U.S. Department of Agriculture: Albany, CA, USA, 2005; pp. 59–70. [Google Scholar]
  52. Ronco, F.P.J. Pinus edulis Engelm.: Pinyon. In Silvics of North America: Volume 1. Conifers; Agriculture Handbook 654; Burns, R.M., Honkala, B.H., Eds.; U.S. Department of Agriculture, Forest Service, 1990; pp. 327–337. [Google Scholar]
  53. Howard, J.L. Pinus ponderosa var. brachyptera, P. p. var. scopulorum In: Fire Effects Information System. Available online: https://www.fs.fed.us/database/feis/plants/tree/pinpons/all.html (accessed on 30 September 2019).
  54. Hermann, R.K.; Lavender, D.P. Pseudotsuga mesziesii (Mirb.) Franco: Douglas-Fir. In Silvics of North America: Volume 1. Conifers; Agriculture Handbook 654, Burns, R.M., Honkala, B.H., Eds.; U.S. Department of Agriculture, Forest Service, 1990; pp. 527–540. [Google Scholar]
  55. Eidenshink, J.; Schwind, B.; Brewer, K.; Zhu, Z.; Quayle, B.; Howard, S. A project for monitoring trends in burn severity. Fire Ecol. Spec. Issue 2007, 3, 3–21. [Google Scholar] [CrossRef]
  56. Finco, M.; Quayle, B.; Zhang, Y.; Lecker, J.; Megown, K.A.; Brewer, C.K. Monitoring Trends and Burn Severity (MTBS): Monitoring wildfire activity for the past quarter century using Landsat data. In Proceedings of the Moving from Status to Trends: Forest Inventory and Analysis (FIA) Symposium; Morin, R.S., Liknes, G.C., Eds.; U.S. Department of Agriculture Forest Service, Northern Research Station: Newtown Square, PA, USA, 2012; pp. 222–228. [Google Scholar]
  57. Ryan, K.C.; Opperman, T.S. LANDFIRE—A national vegetation/fuels data base for use in fuels treatment, restoration, and suppression planning. For. Ecol. Manag. 2013, 294, 208–216. [Google Scholar] [CrossRef] [Green Version]
  58. Schwind, B.; Brewer, K.; Quayle, B.; Eidenshink, J.C. Establishing a nationwide baseline of historical burn-severity data to support monitoring of trends in wildfire effects and national fire policies. In Advances in Threat Assessment and Their Application to Forest and Rangeland Management. Gen. Tech. Rep. PNW-GTR-802; Pye, J.M., Rauscher, H.M., Sands, Y., Lee, D.C., Beatty, J.S., Eds.; U.S. Department of Agriculture, Forest Service, Pacific Northwest and Southern Research Stations: Portland, OR, USA, 2010; pp. 381–396. [Google Scholar]
  59. National Wildfire Coordinating Group [NWCG]. Glossary of Wildland Fire. Available online: https://www.nwcg.gov/glossary/ (accessed on 11 January 2019).
  60. Potere, D. Horizontal positional accuracy of Google Earth’s high-resolution imagery archive. Sensors 2008, 8, 7973–7981. [Google Scholar] [CrossRef]
  61. Huete, A.R.; Liu, H.Q.; Batchily, K.; van Leeuwen, W. A comparison of vegetation indices over a global set of TM images for EOS-MODIS. Remote Sens. Environ. 1997, 59, 440–451. [Google Scholar] [CrossRef]
  62. Gorelick, N.; Hancher, M.; Dixon, M.; Ilyushchenko, S.; Thau, D.; Moore, R. Google Earth Engine: Planetary-scale geospatial analysis for everyone. Remote Sens. Environ. 2017, 202, 18–27. [Google Scholar] [CrossRef]
  63. Vogelmann, J.E.; Helder, D.; Morfitt, R.; Choate, M.J.; Merchant, J.W.; Bulley, H. Effects of Landsat 5 Thematic Mapper and Landsat 7 Enhanced Thematic Mapper Plus radiometric and geometric calibrations and corrections on landscape characterization. Remote Sens. Environ. 2001, 78, 55–70. [Google Scholar] [CrossRef] [Green Version]
  64. Flood, N. Continuity of reflectance data between Landsat-7 ETM+ and Landsat-8 OLI, for both top-of-atmosphere and surface reflectance: A study in the Australian landscape. Remote Sens. 2014, 6, 7952–7970. [Google Scholar] [CrossRef] [Green Version]
  65. Huntington, J.; McGwire, K.; Morton, C.; Snyder, K.; Peterson, S.; Erickson, T.; Niswonger, R.; Carroll, R.; Smith, G.; Allen, R. Assessing the role of climate and resource management on groundwater dependent ecosystem changes in arid environments with the Landsat archive. Remote Sens. Environ. 2016, 185, 186–197. [Google Scholar] [CrossRef] [Green Version]
  66. R Core Team. R: A language and environment for statistical computing. 2017. [Google Scholar]
  67. Jönsson, P.; Eklundh, L. TIMESAT—A program for analyzing time-series of satellite sensor data. Comput. Geosci. 2004, 30, 833–845. [Google Scholar] [CrossRef] [Green Version]
  68. Jönsson, P.; Eklundh, L. Seasonality extraction by function fitting to time-series of satellite sensor data. IEEE Trans. Geosci. Remote Sens. 2002, 40, 1824–1832. [Google Scholar] [CrossRef]
  69. White, M.A.; de Beurs, K.M.; Didan, K.; Inouye, D.W.; Richardson, A.D.; Jensen, O.P.; O’Keefe, J.; Zhang, G.; Nemani, R.R.; van Leeuwen, W.J.D.; et al. Intercomparison, interpretation, and assessment of spring phenology in North America estimated from remote sensing for 1982-2006. Glob. Chang. Biol. 2009, 15, 2335–2359. [Google Scholar] [CrossRef]
  70. Welch, B.L. On the comparison of several mean values: An alternative approach. Biometrika 1951, 38, 330–336. [Google Scholar] [CrossRef]
  71. Zar, J.H. Biostatistical Analysis, 4th ed.; Prentice Hall: Upper Saddle River, NJ, USA, 1999. [Google Scholar]
  72. Morellato, L.P.C.; Alberti, L.F.; Hudson, I.L. Applications of circular statistics in plant phenology: A case studies approach. In Phenological Research: Methods for Environmental and Climate Change Analysis; Hudson, I.L., Keatley, M.R., Eds.; Springer: Dordrecht, The Netherlands, 2010; pp. 339–359. ISBN 9789048133352. [Google Scholar]
  73. Fisher, N. Statistical Analysis of Circular Data; University Cambridge Press: New York, NY, USA, 1993. [Google Scholar]
  74. Wallace, C.; Walker, J.; Skirvin, S.; Patrick-Birdwell, C.; Weltzin, J.; Raichle, H. Mapping presence and predicting phenological status of invasive buffelgrass in southern Arizona using MODIS, climate and citizen science observation data. Remote Sens. 2016, 8, 524. [Google Scholar] [CrossRef] [Green Version]
  75. Miura, T.; Nagai, S.; Takeuchi, M.; Ichii, K.; Yoshioka, H. Improved characterisation of vegetation and land surface seasonal dynamics in central Japan with Himawari-8 hypertemporal data. Sci. Rep. 2019, 9, 1–12. [Google Scholar] [CrossRef] [Green Version]
  76. Nguyen, T.T.H.; de Bie, C.A.J.M.; Ali, A.; Smaling, E.M.A.; Chu, T.H. Mapping the irrigated rice cropping patterns of the Mekong delta, Vietnam, through hyper-temporal SPOT NDVI image analysis. Int. J. Remote Sens. 2012, 33, 415–434. [Google Scholar] [CrossRef]
  77. Johnstone, J.F.; Chapin, F.S.I.; Hollingsworth, T.N.; Mack, M.C.; Romanovsky, V.; Turetsky, M. Fire, climate change, and forest resilience in interior Alaska. Can. J. For. Res. 2010, 40, 1302–1312. [Google Scholar] [CrossRef]
  78. Alexander, H.D.; Mack, M.C. A canopy shift in interior Alaskan boreal forests: Consequences for above- and belowground carbon and nitrogen pools during post-fire succession. Ecosystems 2016, 19, 98–114. [Google Scholar] [CrossRef]
  79. Viedma, O.; Melia, J.; Segarra, D.; Garcia-Haro, J. Modeling rates of ecosystem recovery after fires by using Landsat TM data. Remote Sens. Environ. 1997, 61, 383–398. [Google Scholar] [CrossRef]
  80. Barbero, M.; Bonin, G.; Loisel, R.; Quézel, P. Changes and disturbances of forest ecosystems caused by human activities in the western part of the mediterranean basin. Vegetatio 1990, 87, 151–173. [Google Scholar] [CrossRef]
  81. Retana, J.; Espelta, M.; Habrouk, A.; Ordoñez, J.L.; de Solà-Morales, F. Regeneration patterns of three Mediterranean pines and forest changes after a large wildfire in northeastern Spain. Ecoscience 2002, 9, 89–97. [Google Scholar] [CrossRef]
  82. Rodrigo, A.; Retana, J.; Picó, F.X. Direct regeneration is not the only response of Mediterranean forests to large fires. Ecology 2004, 85, 716–729. [Google Scholar] [CrossRef]
  83. Bell, D.M.; Bradford, J.B.; Lauenroth, W.K. Early indicators of change: Divergent climate envelopes between tree life stages imply range shifts in the western United States. Glob. Ecol. Biogeogr. 2014, 23, 168–180. [Google Scholar] [CrossRef]
  84. Pearson, G.A. Reproduction of Western Yellow Pine in the Southwest; Circular 174; United States Department of Agriculture, Forest Service, 1910.
  85. Wu, T.; Kim, Y.S. Pricing ecosystem resilience in frequent-fire ponderosa pine forests. For. Policy Econ. 2013, 27, 8–12. [Google Scholar] [CrossRef]
  86. Dore, S.; Kolb, T.E.; Montes-Helu, M.; Sullivan, B.W.; Winslow, W.D.; Hart, S.C.; Kaye, J.P.; Koch, G.W.; Hungate, B.A. Long-term impact of a stand-replacing fire on ecosystem CO2 exchange of a ponderosa pine forest. Glob. Chang. Biol. 2008, 14, 1801–1820. [Google Scholar] [CrossRef]
  87. Rich, L.R. Managing a ponderosa pine forest to increase water yield. Water Resour. Res. 1972, 8, 422–428. [Google Scholar] [CrossRef]
  88. Ffolliott, P.F.; Dawson, J.O.; Fisher, J.T.; Moshe, I.; DeBoers, D.W.; Fulbright, T.E.; Tracy, J.; Al Musa, A.; Johnson, C.; Chamie, J.P.M. Arid and Semiarid Land Stewardship: A 10-Year Review of Accomplishments and Contributions of the International Arid Lands Consortium. Gen. Tech. Rep. RMRS-GTR-89; U.S. Department of Agriculture, Forest Service, Rocky Mountain Research Station: Fort Collins, CO, USA, 2001.
Figure 1. Location of the study fires in Arizona (AZ) and New Mexico (NM), USA.
Remotesensing 11 02782 g001
Figure 2. Sample normalized difference vegetation index (NDVI) profile for Bell fire site 1. Shown are the time-series of processed data points that were input into TIMESAT and the Savitzky–Golay curve fit to the data. Phenometrics are extracted from pre- and post-fire periods.
Remotesensing 11 02782 g002
Figure 3. Overview of the study methodology. Qualifying fires are those that meet the pre-determined criteria described in the methodology section.
Remotesensing 11 02782 g003
Figure 4. Plots of pre- and post-burn means, by fire, of the phenometrics: (a) amplitude, (b) base NDVI, (c) peak NDVI, and (d) timing (day of year) of peak NDVI. The means shown are aggregated from all sample points within each fire based on 16-day intervals. Error bars indicate +/−1 standard error. Reference sites have only pre-fire values, while La Mesa and Slim sites have only post-fire values.
Remotesensing 11 02782 g004
Figure 5. Annual phenometrics over the post-fire recovery period for different successional trajectories: (a) amplitude, (b) base NDVI, (c) peak NDVI, and (d) timing (day of year) of peak NDVI. Given the consistency of results between the sampling intervals, only the 16-day interval datasets are presented. Error bars indicate +/−1 standard error.
Remotesensing 11 02782 g005
Figure 6. Boxplots of phenometric distributions by recovery trajectory types and sampling intervals. Shown are the range of annual values of (a) amplitude; (b) base NDVI; (c) peak NDVI; and (d) day of year of peak NDVI, each by 8- or 16-day sampling period. In each boxplot, the solid horizontal line denotes the median value, while the upper and lower edges of the boxes represent the first and third quartile values, respectively. Whiskers extend to 1.5 times the highest or lowest quartile value and points beyond the whiskers are outliers. Recovery trajectories with different letters are significantly different (p < 0.05) according to Tukey test results.
Remotesensing 11 02782 g006
Table 1. Characteristics of selected sample sites of fires in Arizona (AZ) and New Mexico (NM), USA. Reference points are located in an area with no contemporary burn history.
Fire/AreaStateDate BurnedArea Burned (ha)Sample PointLatitude (°N)Longitude (°W)Assessed Recovery Trajectory
BellNMMay 19935235133.394108.167Forest
233.393108.165Forest
333.398108.154Deciduous
433.435108.228Forest
BlackhawkNMMay 19931795133.311107.833Deciduous
DudeAZJune 199010,150134.381111.132Forest
234.378111.136Shrub
334.400111.093Shrub
434.397111.093Grass
534.382111.073Forest
634.397111.090Forest
La MesaNMJune 19776249135.825106.314Shrub
235.809106.374Forest
335.807106.378Forest
435.805106.377Forest
535.807106.389Forest
635.828106.307Shrub
735.794106.329Grass
Las ConchasNMJune 201161,057135.819106.390Grass
235.824106.394Grass
PotAZJune 19962208134.601111.377Grass
234.607111.369Grass
PotNMJune 199412,241133.665107.438Deciduous
233.661107.434Deciduous
333.668107.433Grass
RattlesnakeAZJune 199410,213131.818109.247Grass
231.821109.254Deciduous
331.839109.274Grass
RinconAZJune 19946261132.229110.534Forest
Rodeo-ChediskiAZJune 2002186,873134.315110.578Forest
234.298110.679Forest
334.358110.568Forest
SlimAZJuly 19871426134.436110.863Shrub
SouthNMApril 19954417133.383108.243Shrub
Reference NMN/AN/A135.655106.606Forest
235.639106.628Forest
Table 2. Summary of pre- and post-fire phenometric differences for each interval type (8 or 16 days). Each metric was aggregated across all burns. All tests for differences are significant at α = 0.05.
MetricBurn PhaseInterval (Days)Mean (Standard Deviation)
Amplitude Pre80.15 (0.063)
160.13 (0.059)
Post80.22 (0.08)
160.20 (0.08)
Base NDVIPre80.46 (0.071)
160.47 (0.071)
Post80.21 (0.08)
160.22 (0.09)
Peak NDVIPre80.61 (0.071)
160.60 (0.069)
Post80.43 (0.12)
160.42 (0.12)
Timing of peak NDVI (day of year)Pre8279 (53.6)
16274 (52.4)
Post8239 (24.9)
16234 (24.2)