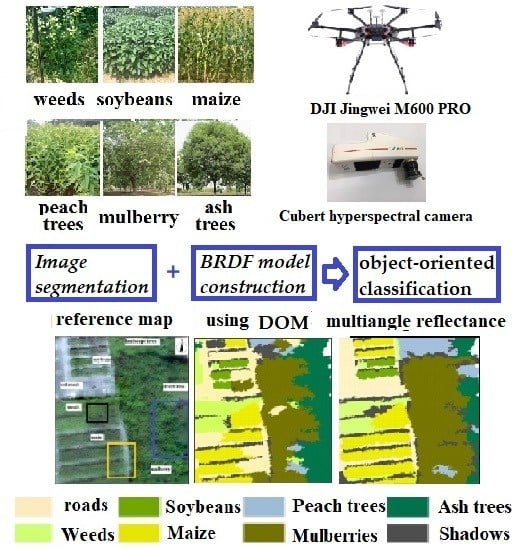
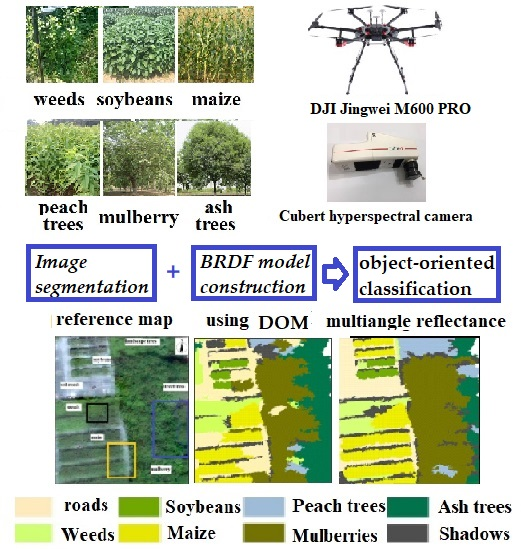
Application of UAV-Based Multi-angle Hyperspectral Remote Sensing in Fine Vegetation Classification


Abstract
:
1. Introduction
2. Date Sets
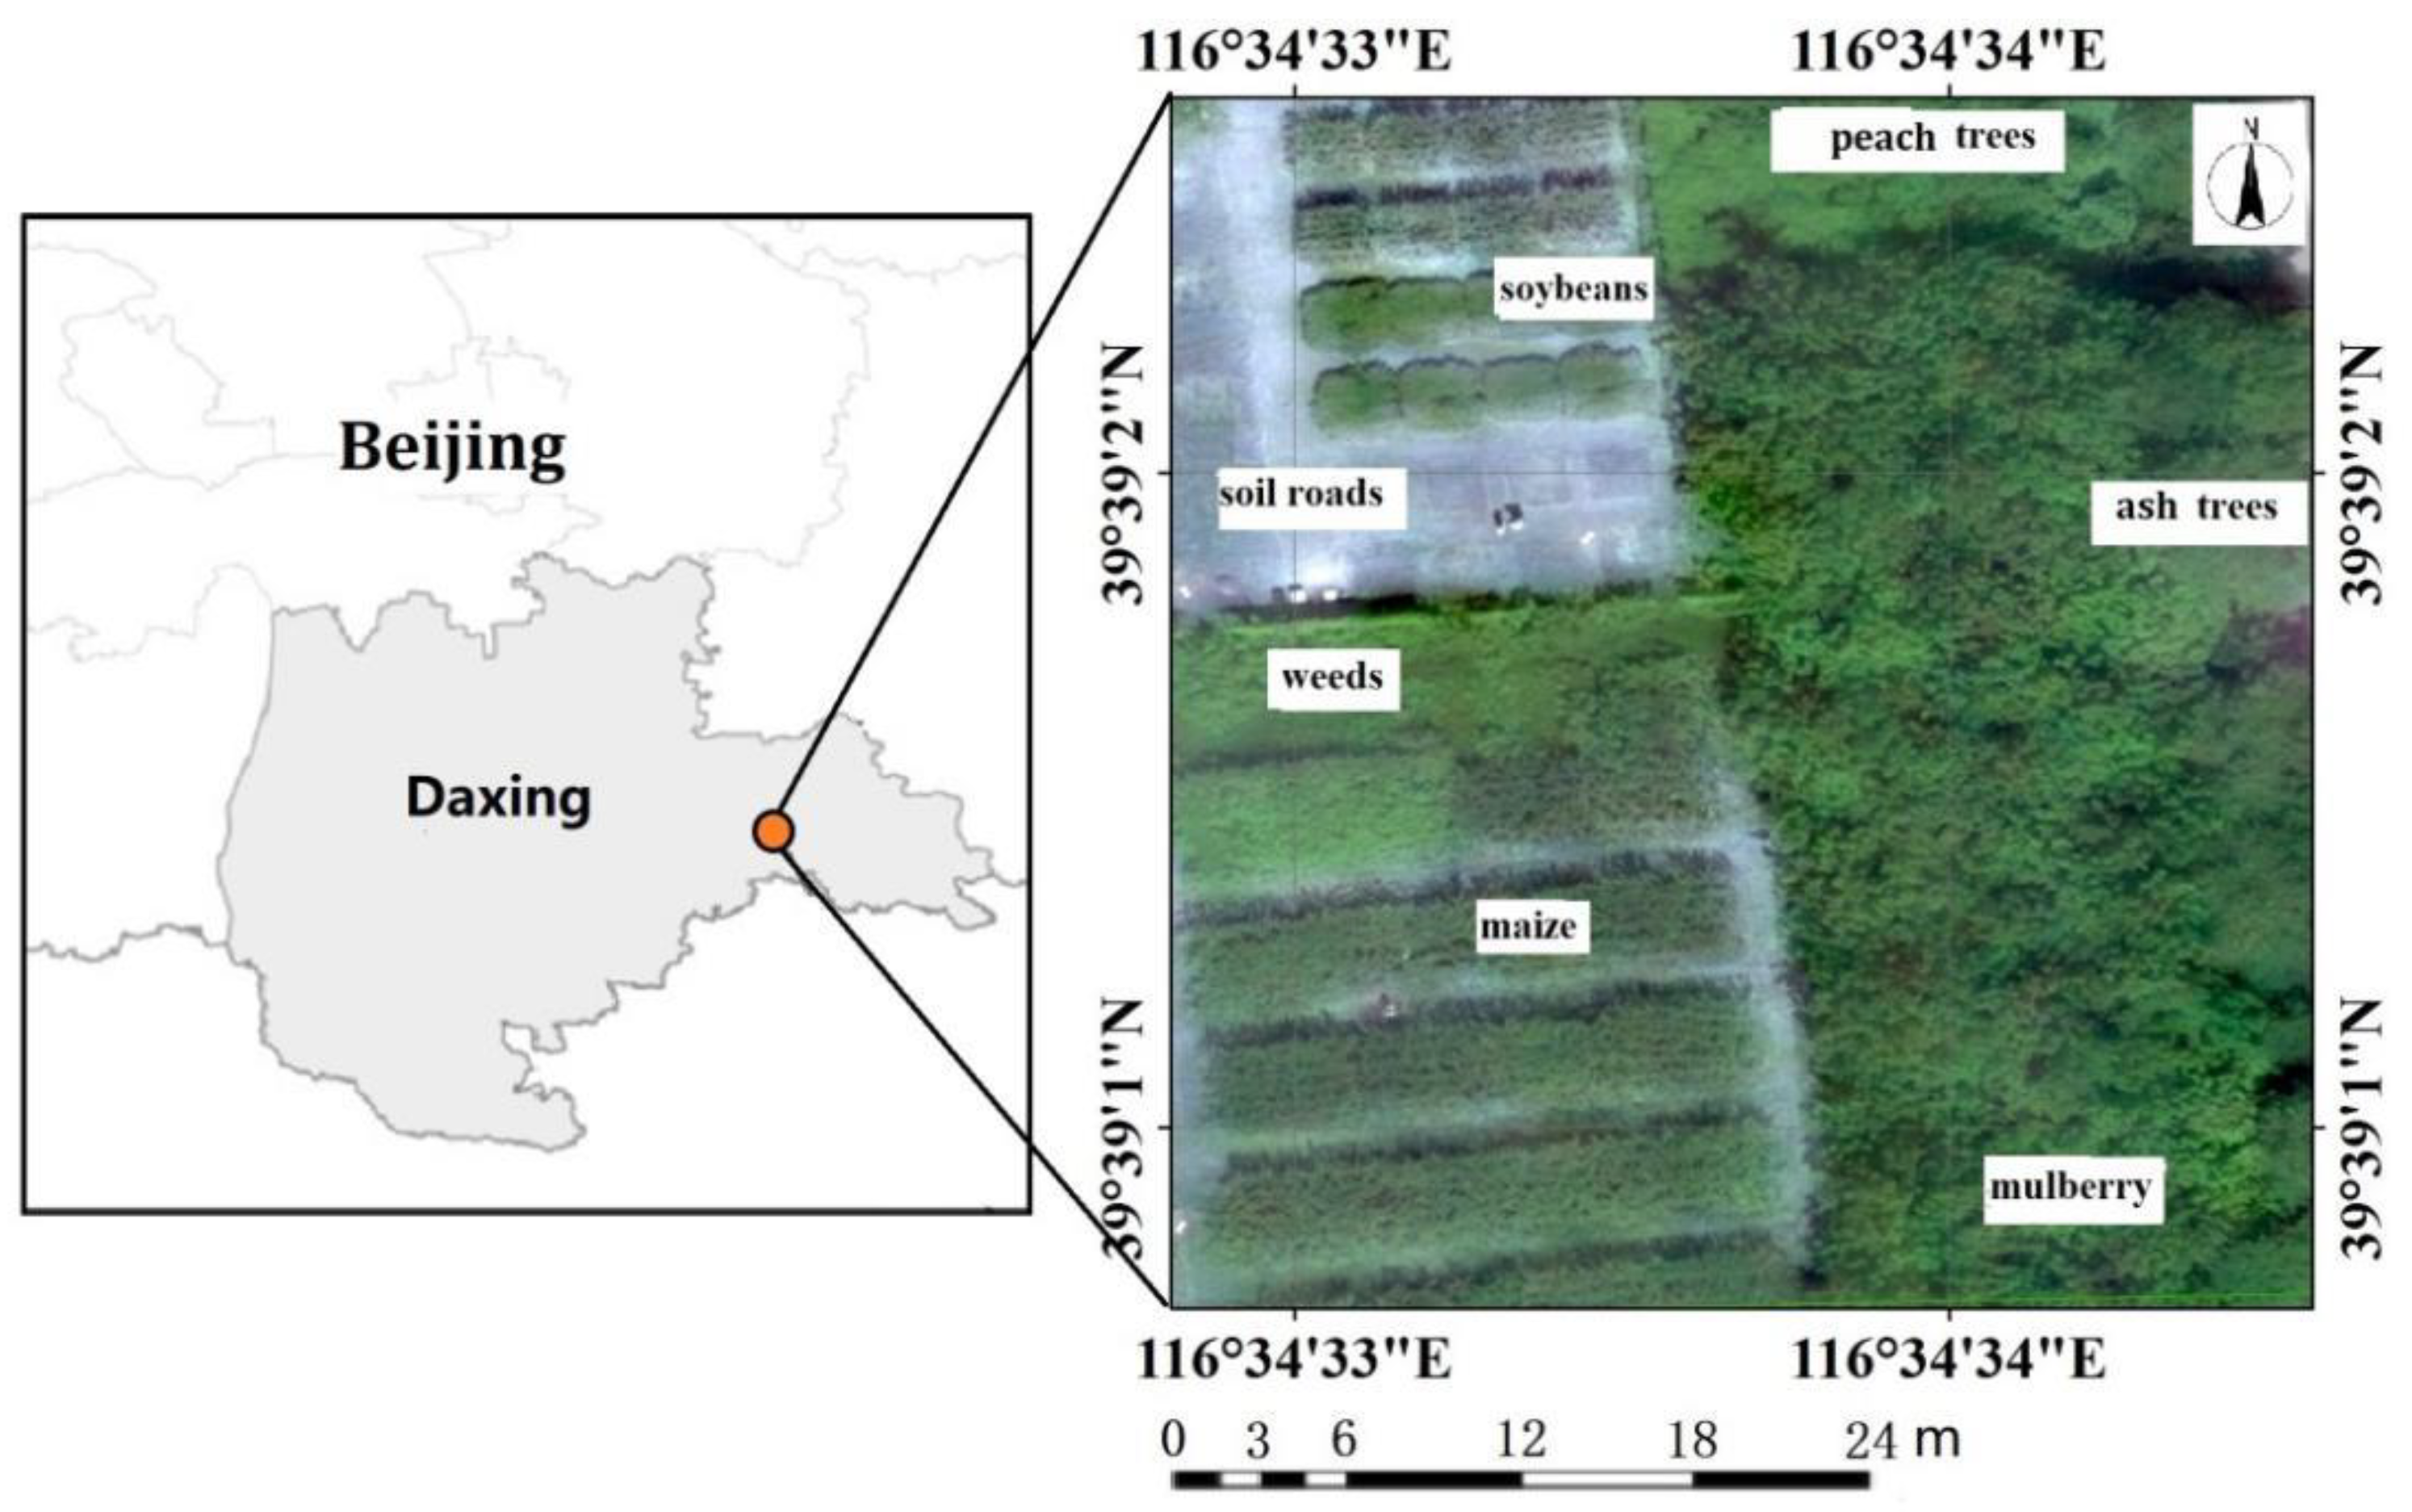
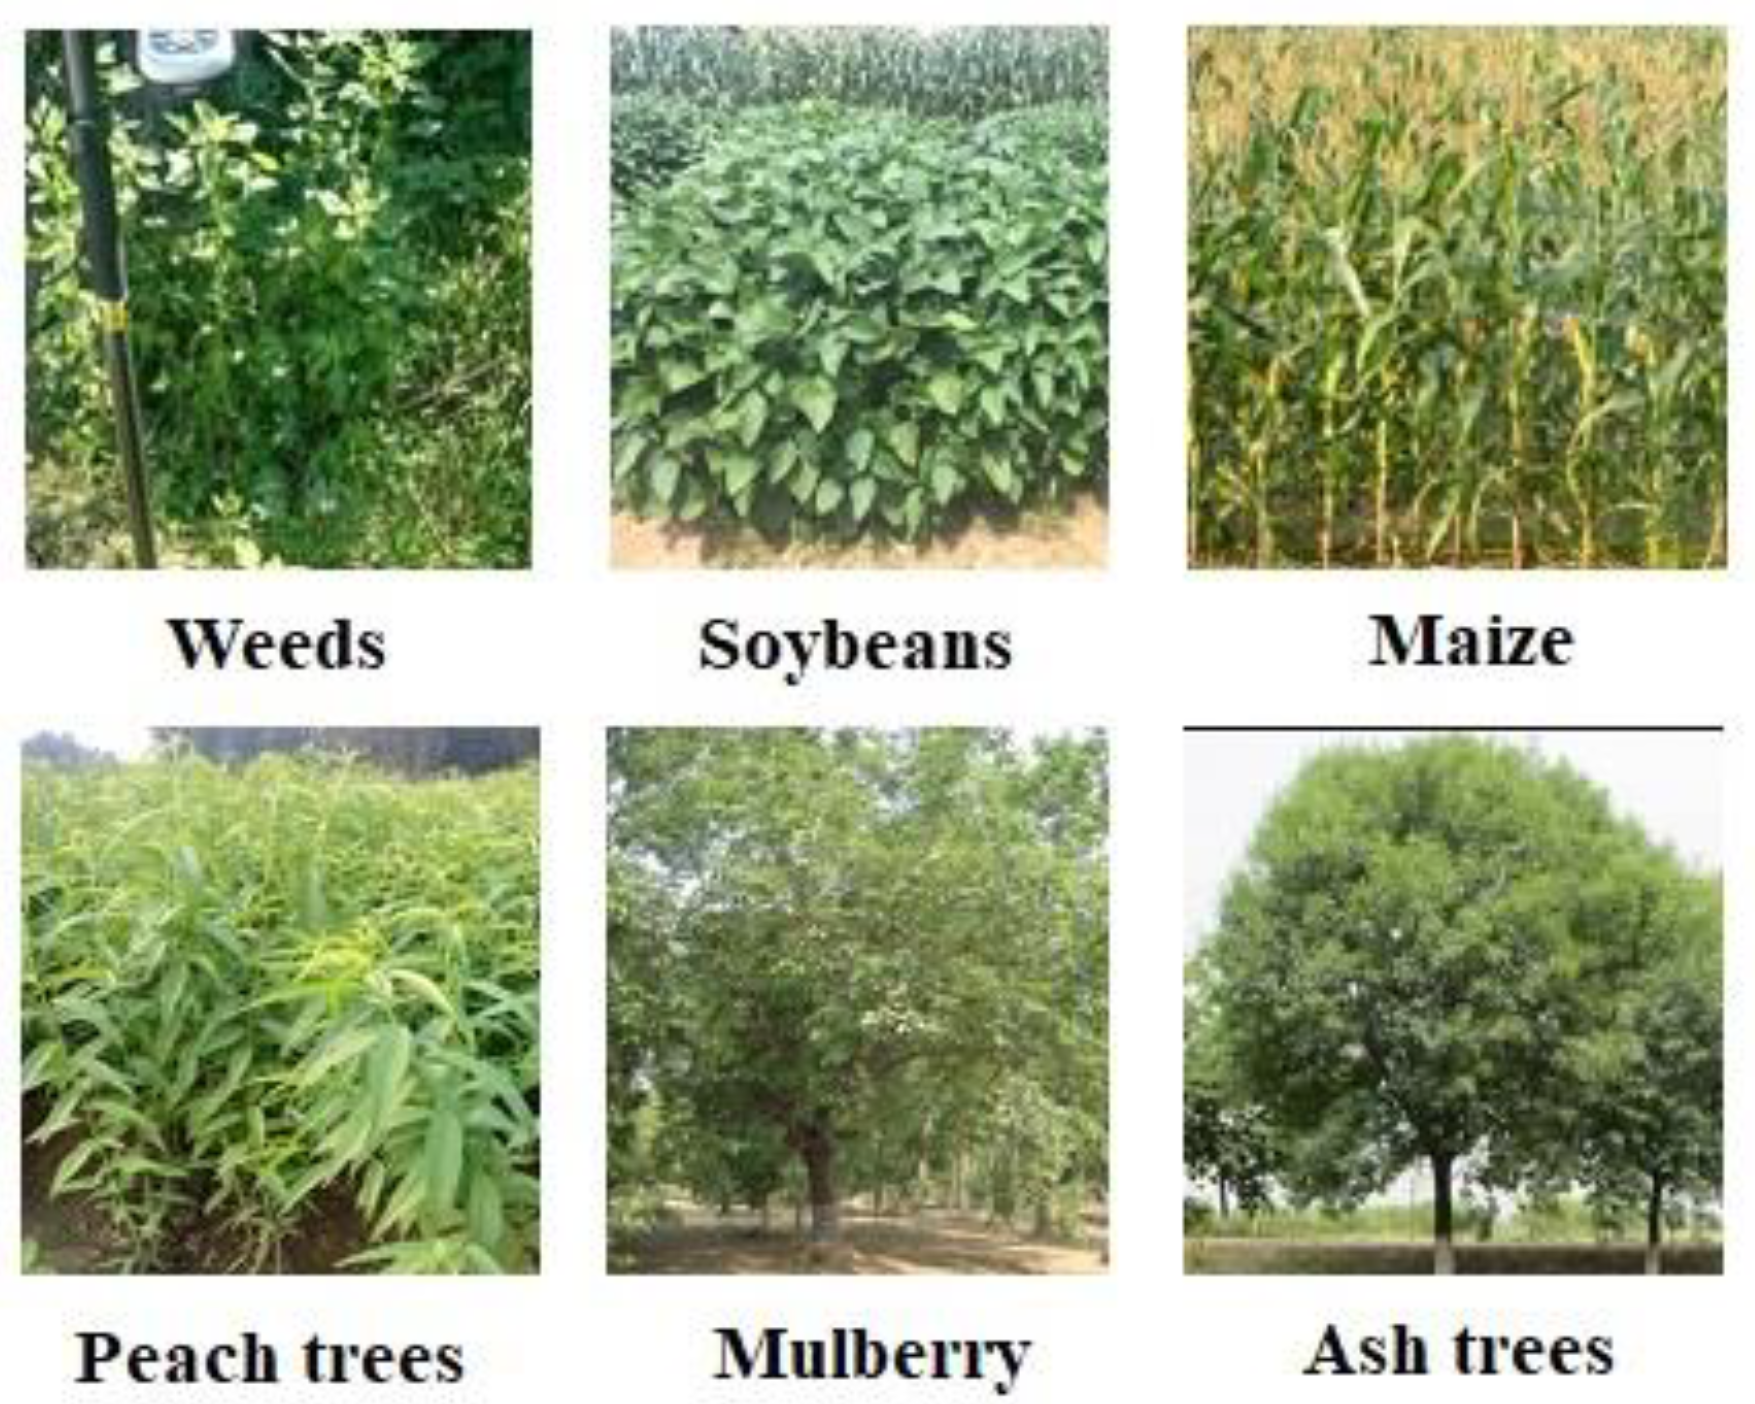
2.1. Study Area
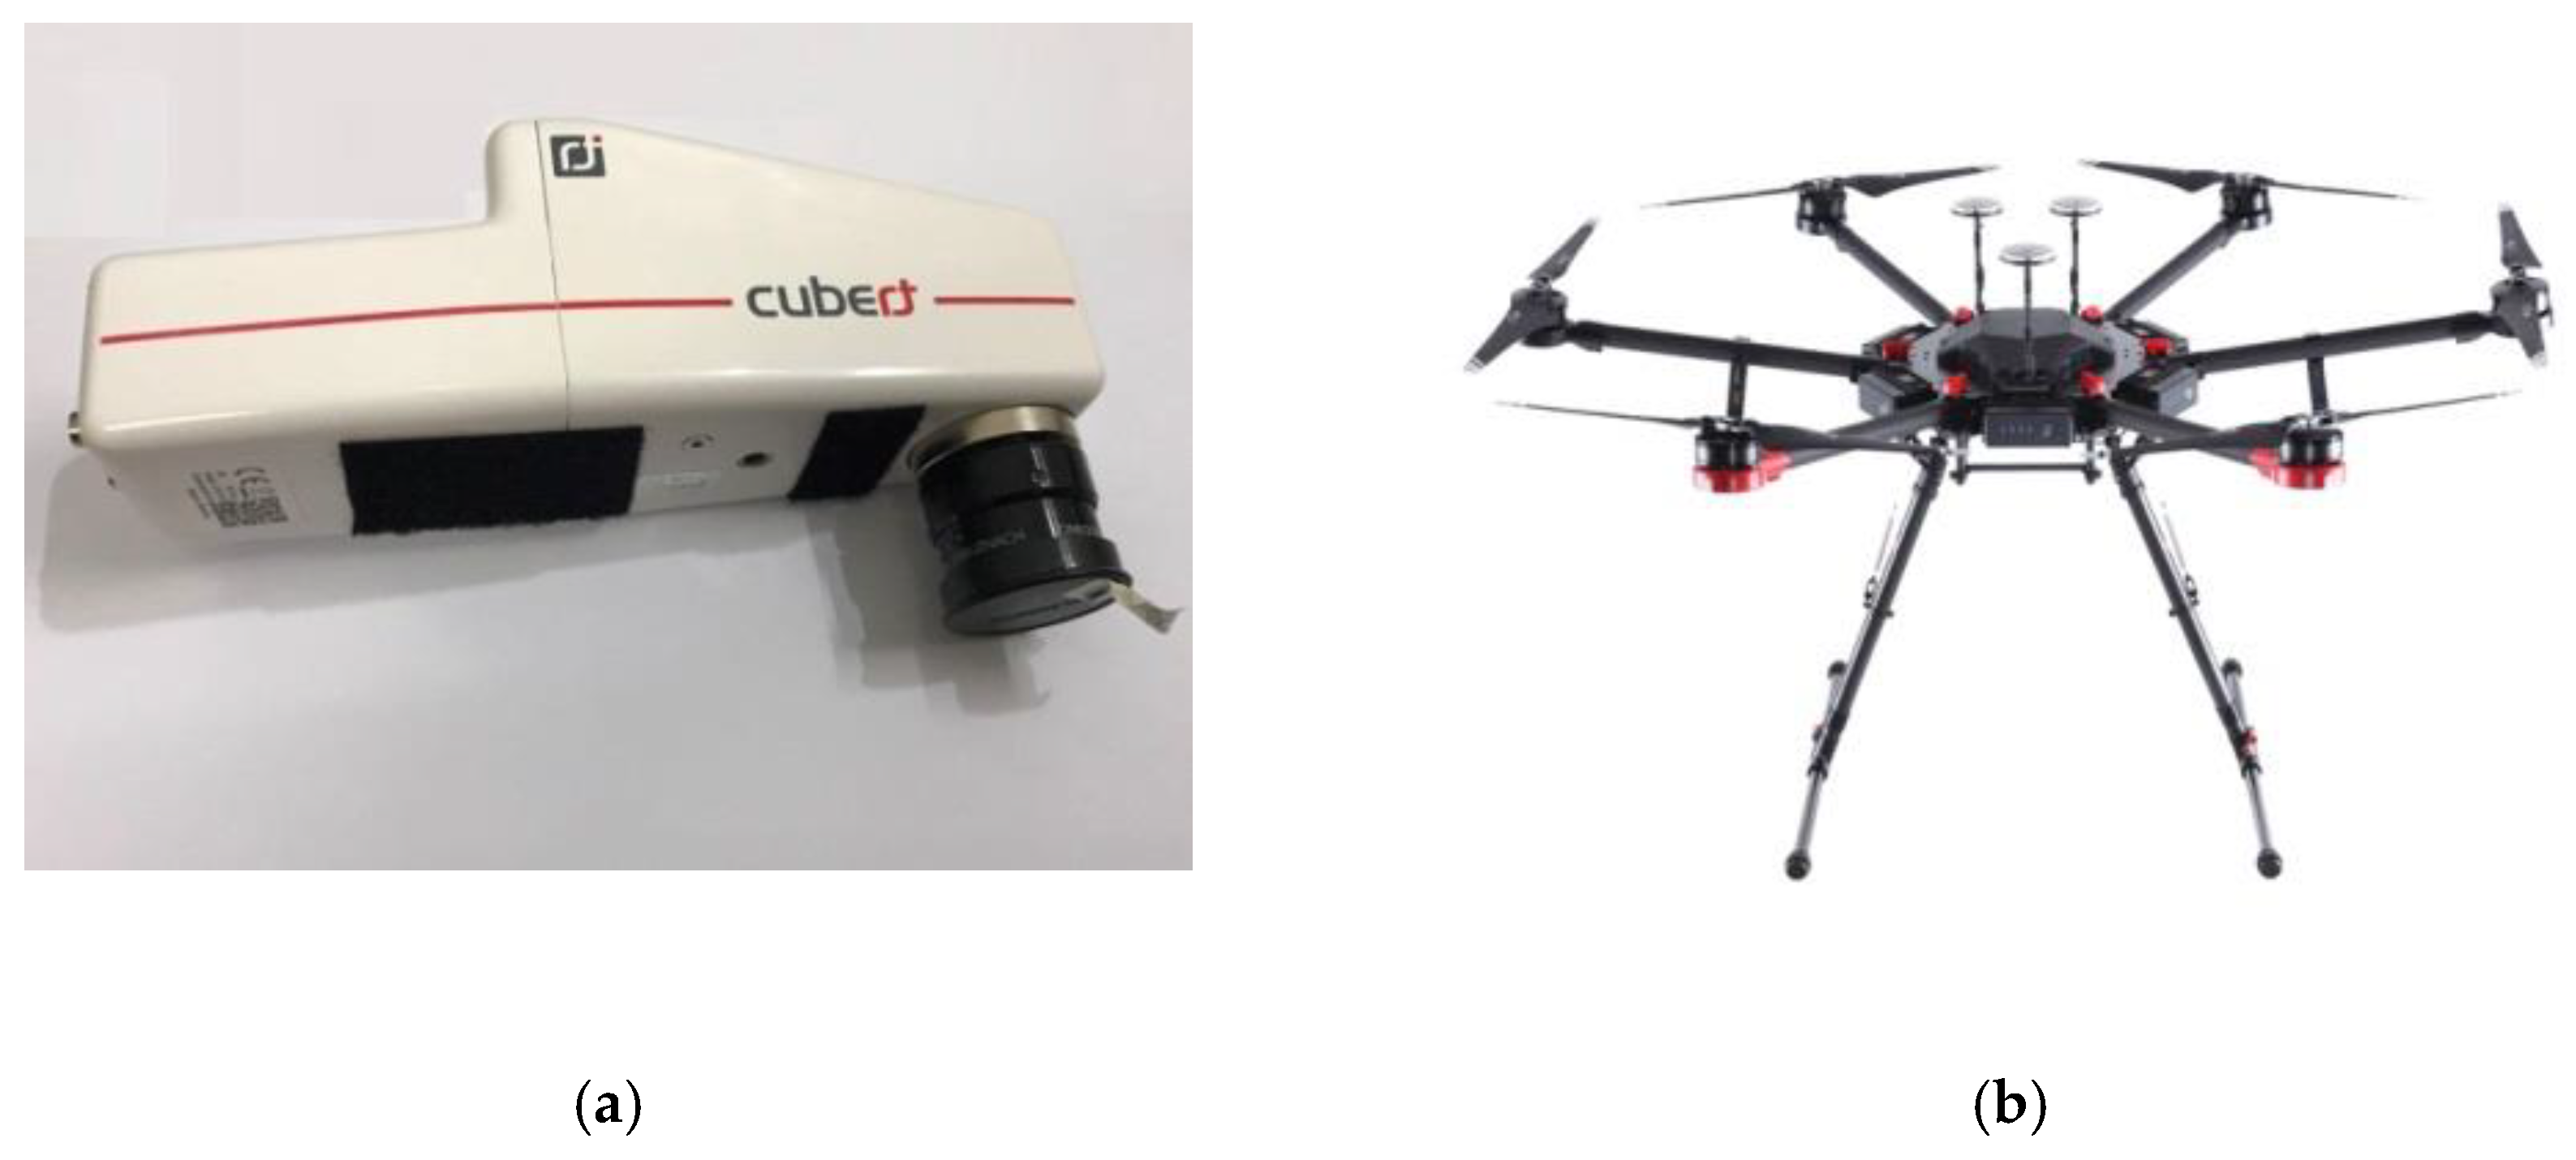
2.2. UAV Hyperspectral Remote Sensing Platform
2.3. Flight Profile and Conditions
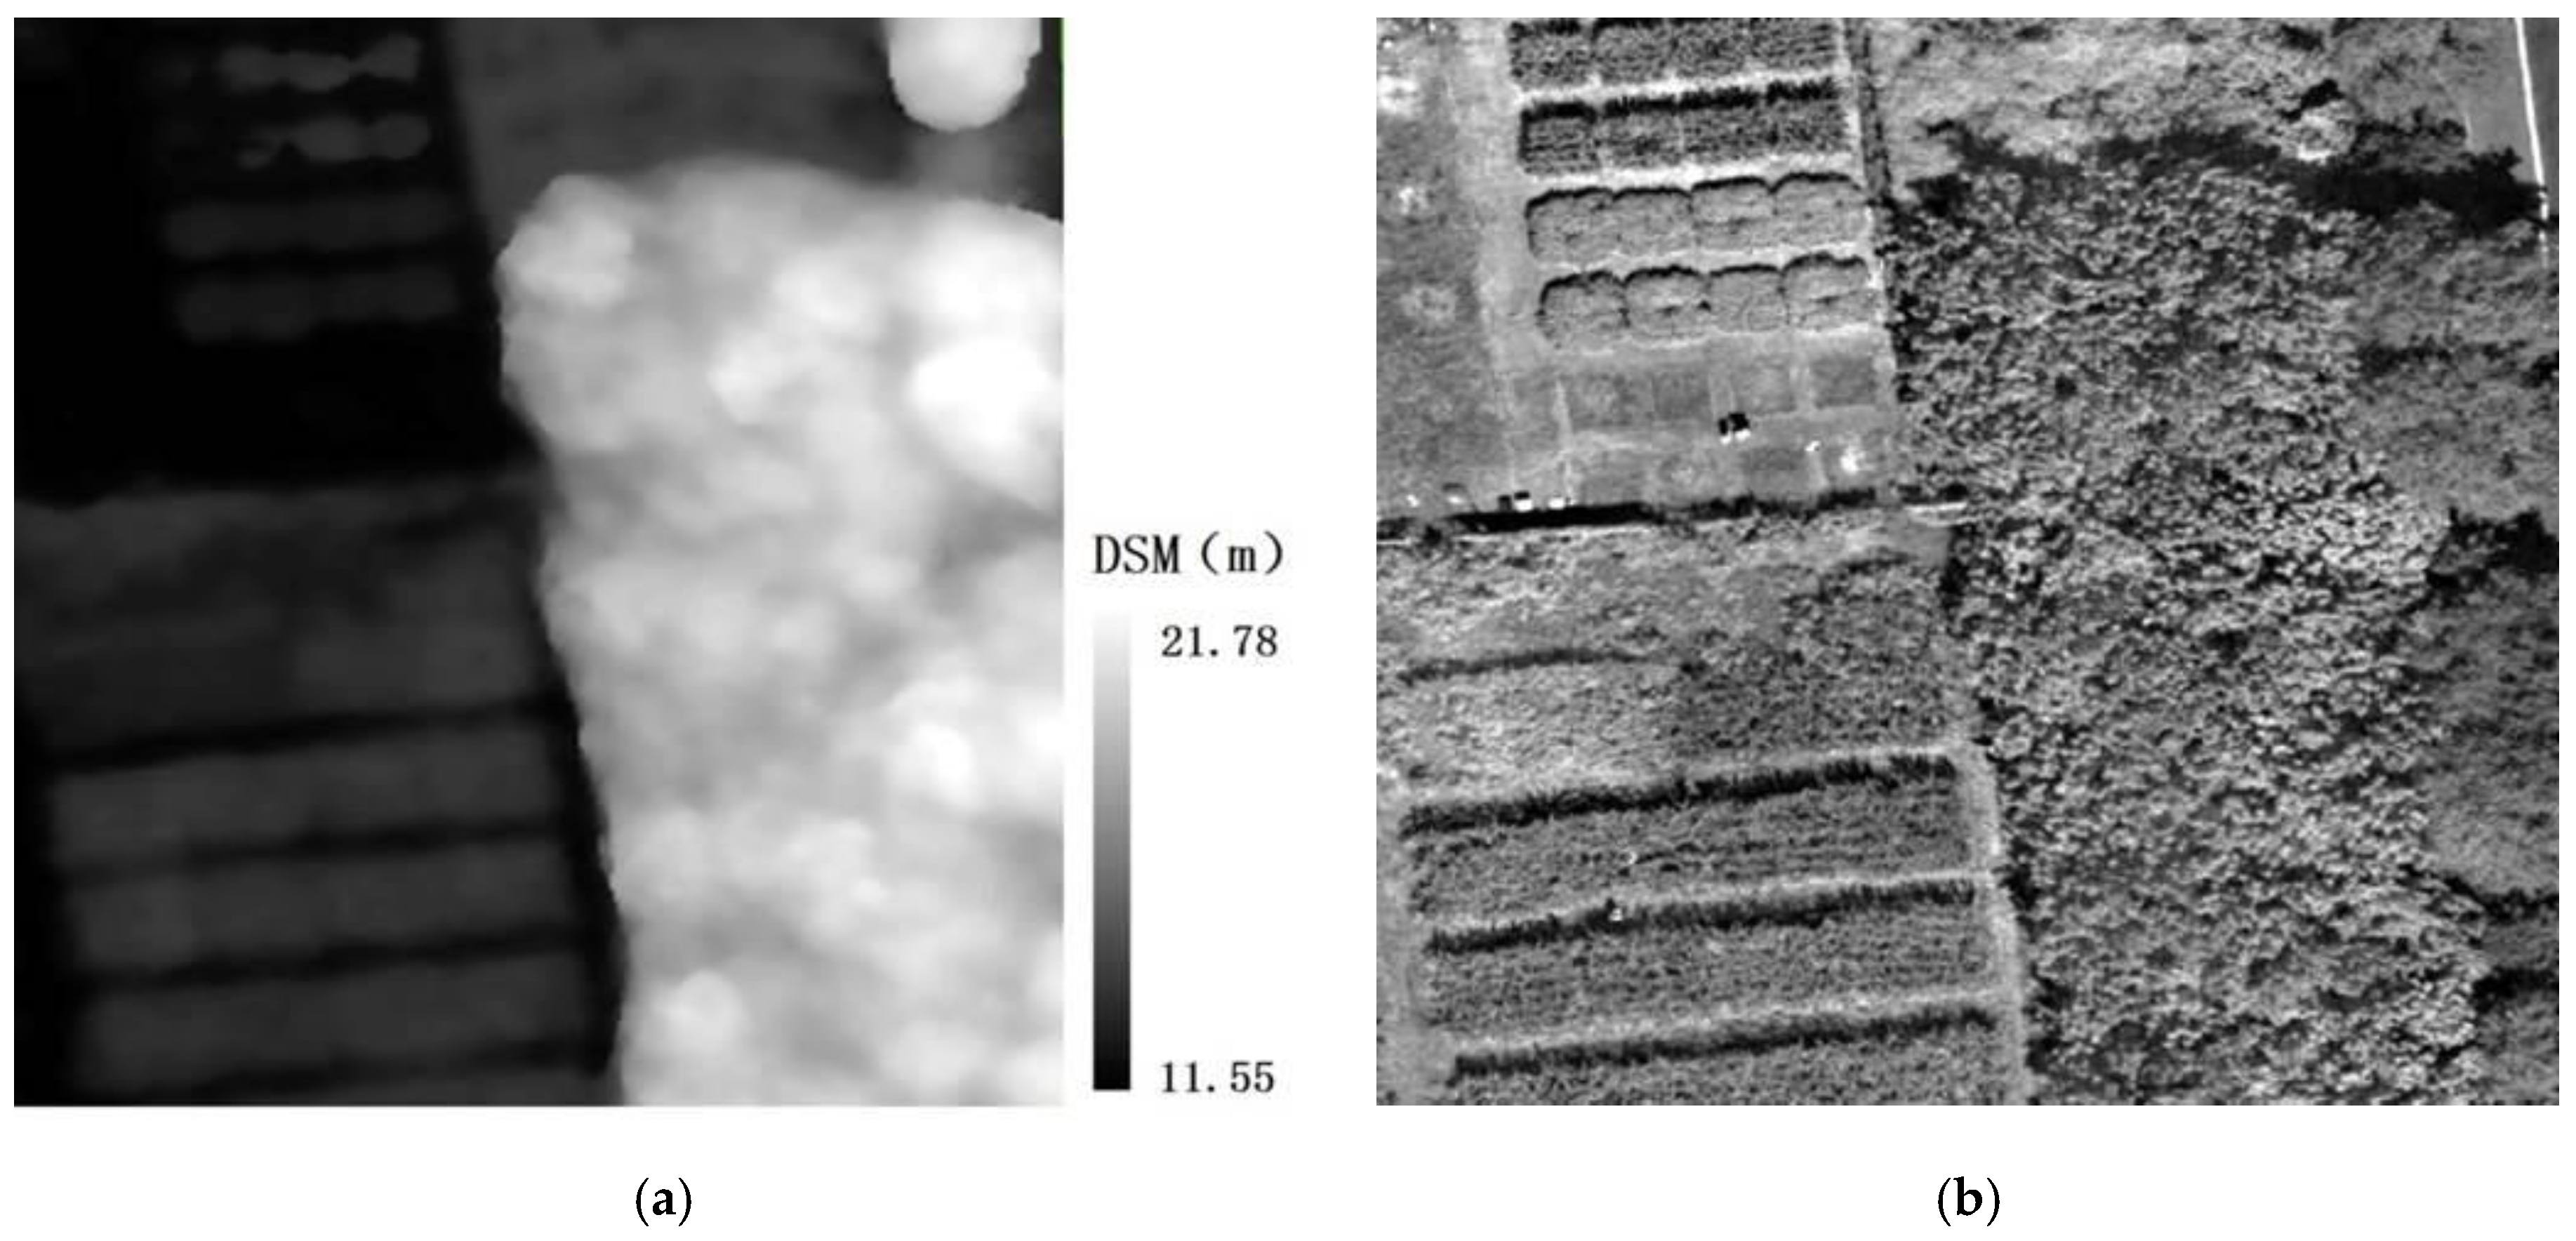
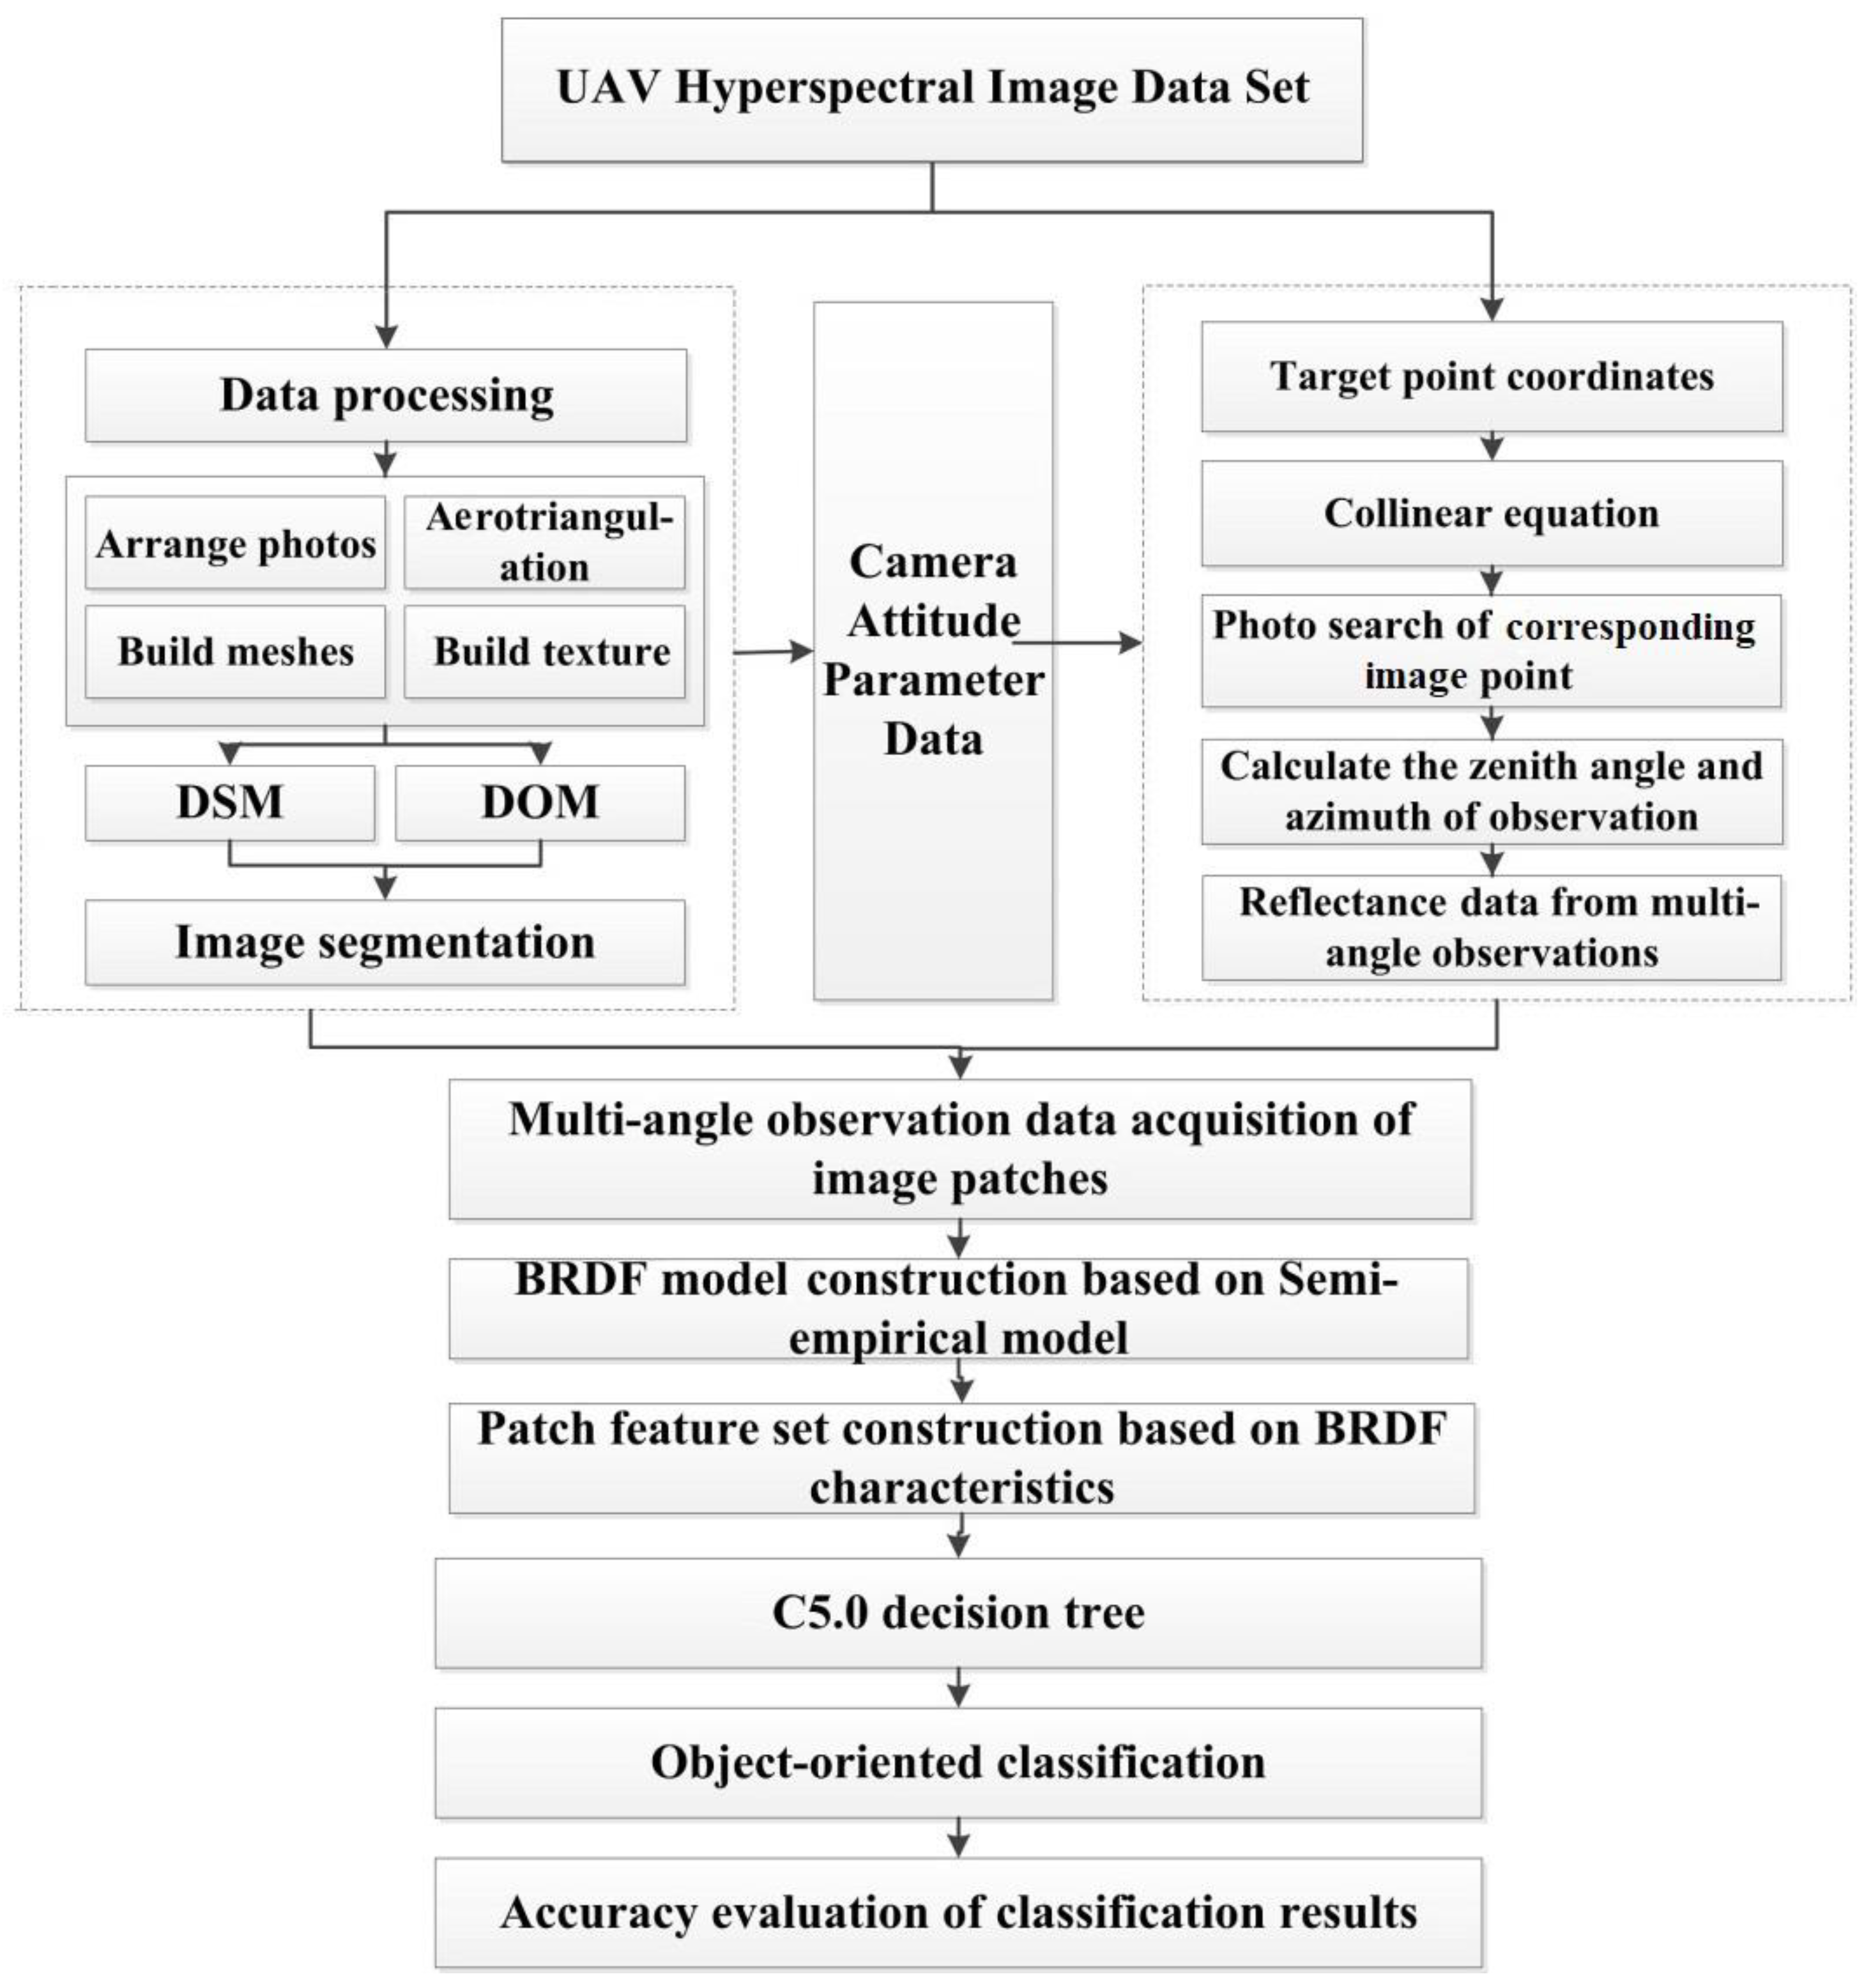
2.4. Data Processing
3. Materials and Methods
3.1. Image Segmentation
3.2. Multi-angle Observation Data Acquisition and BRDF Model Construction
3.3. Feature Set Construction Based on the BRDF
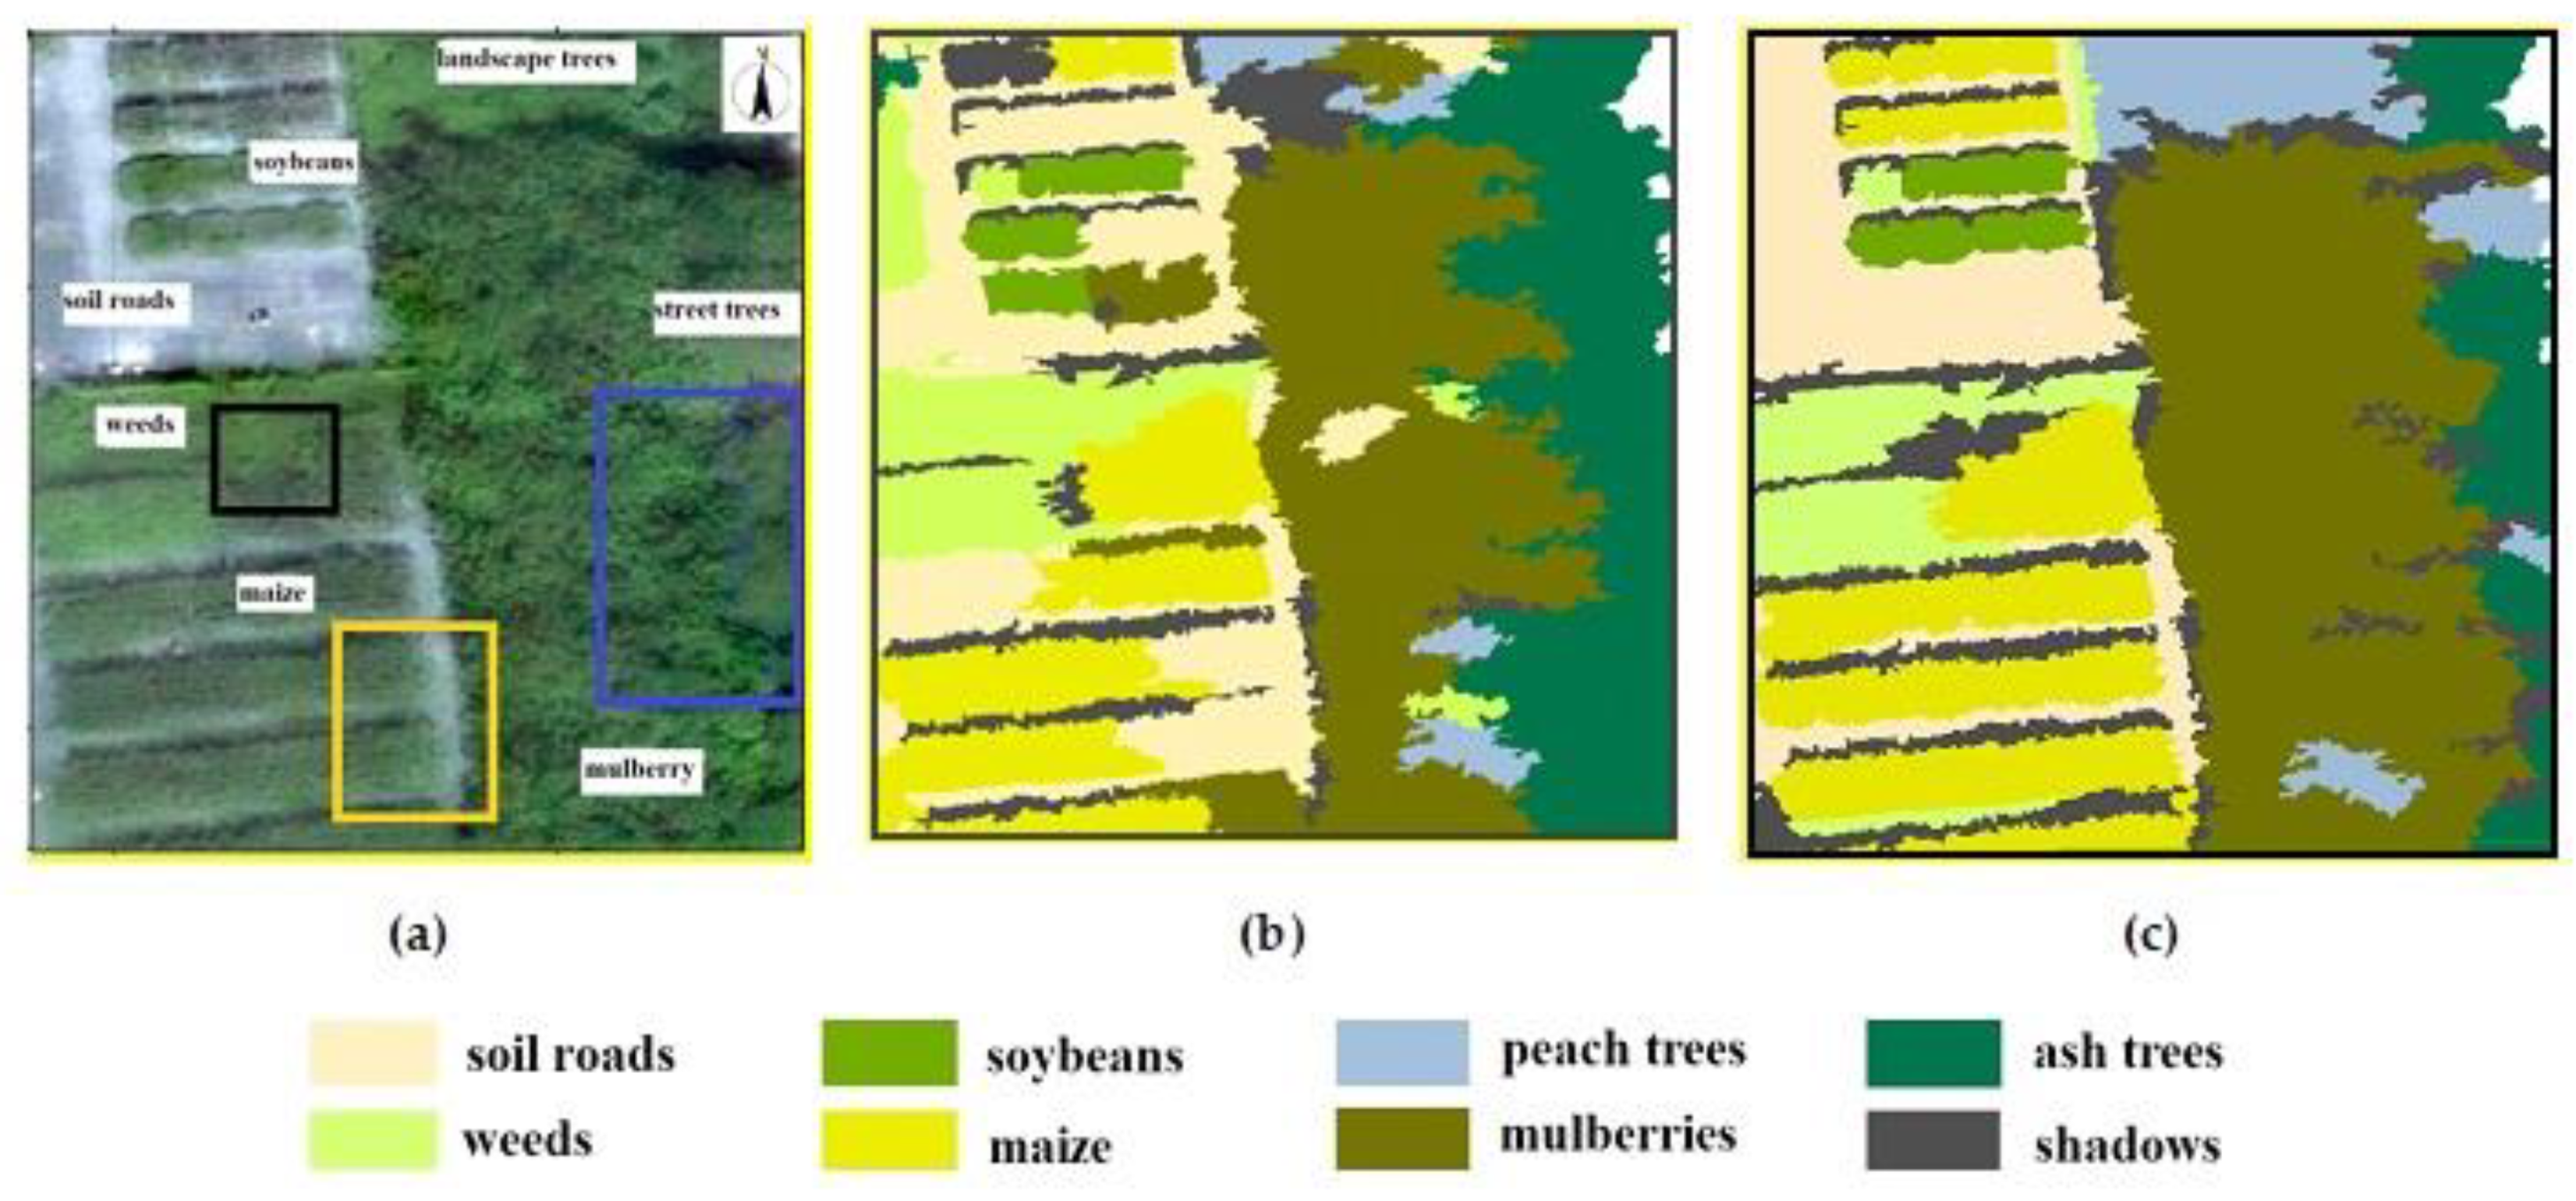
3.4. Vegetation Classification and Accuracy Assessment
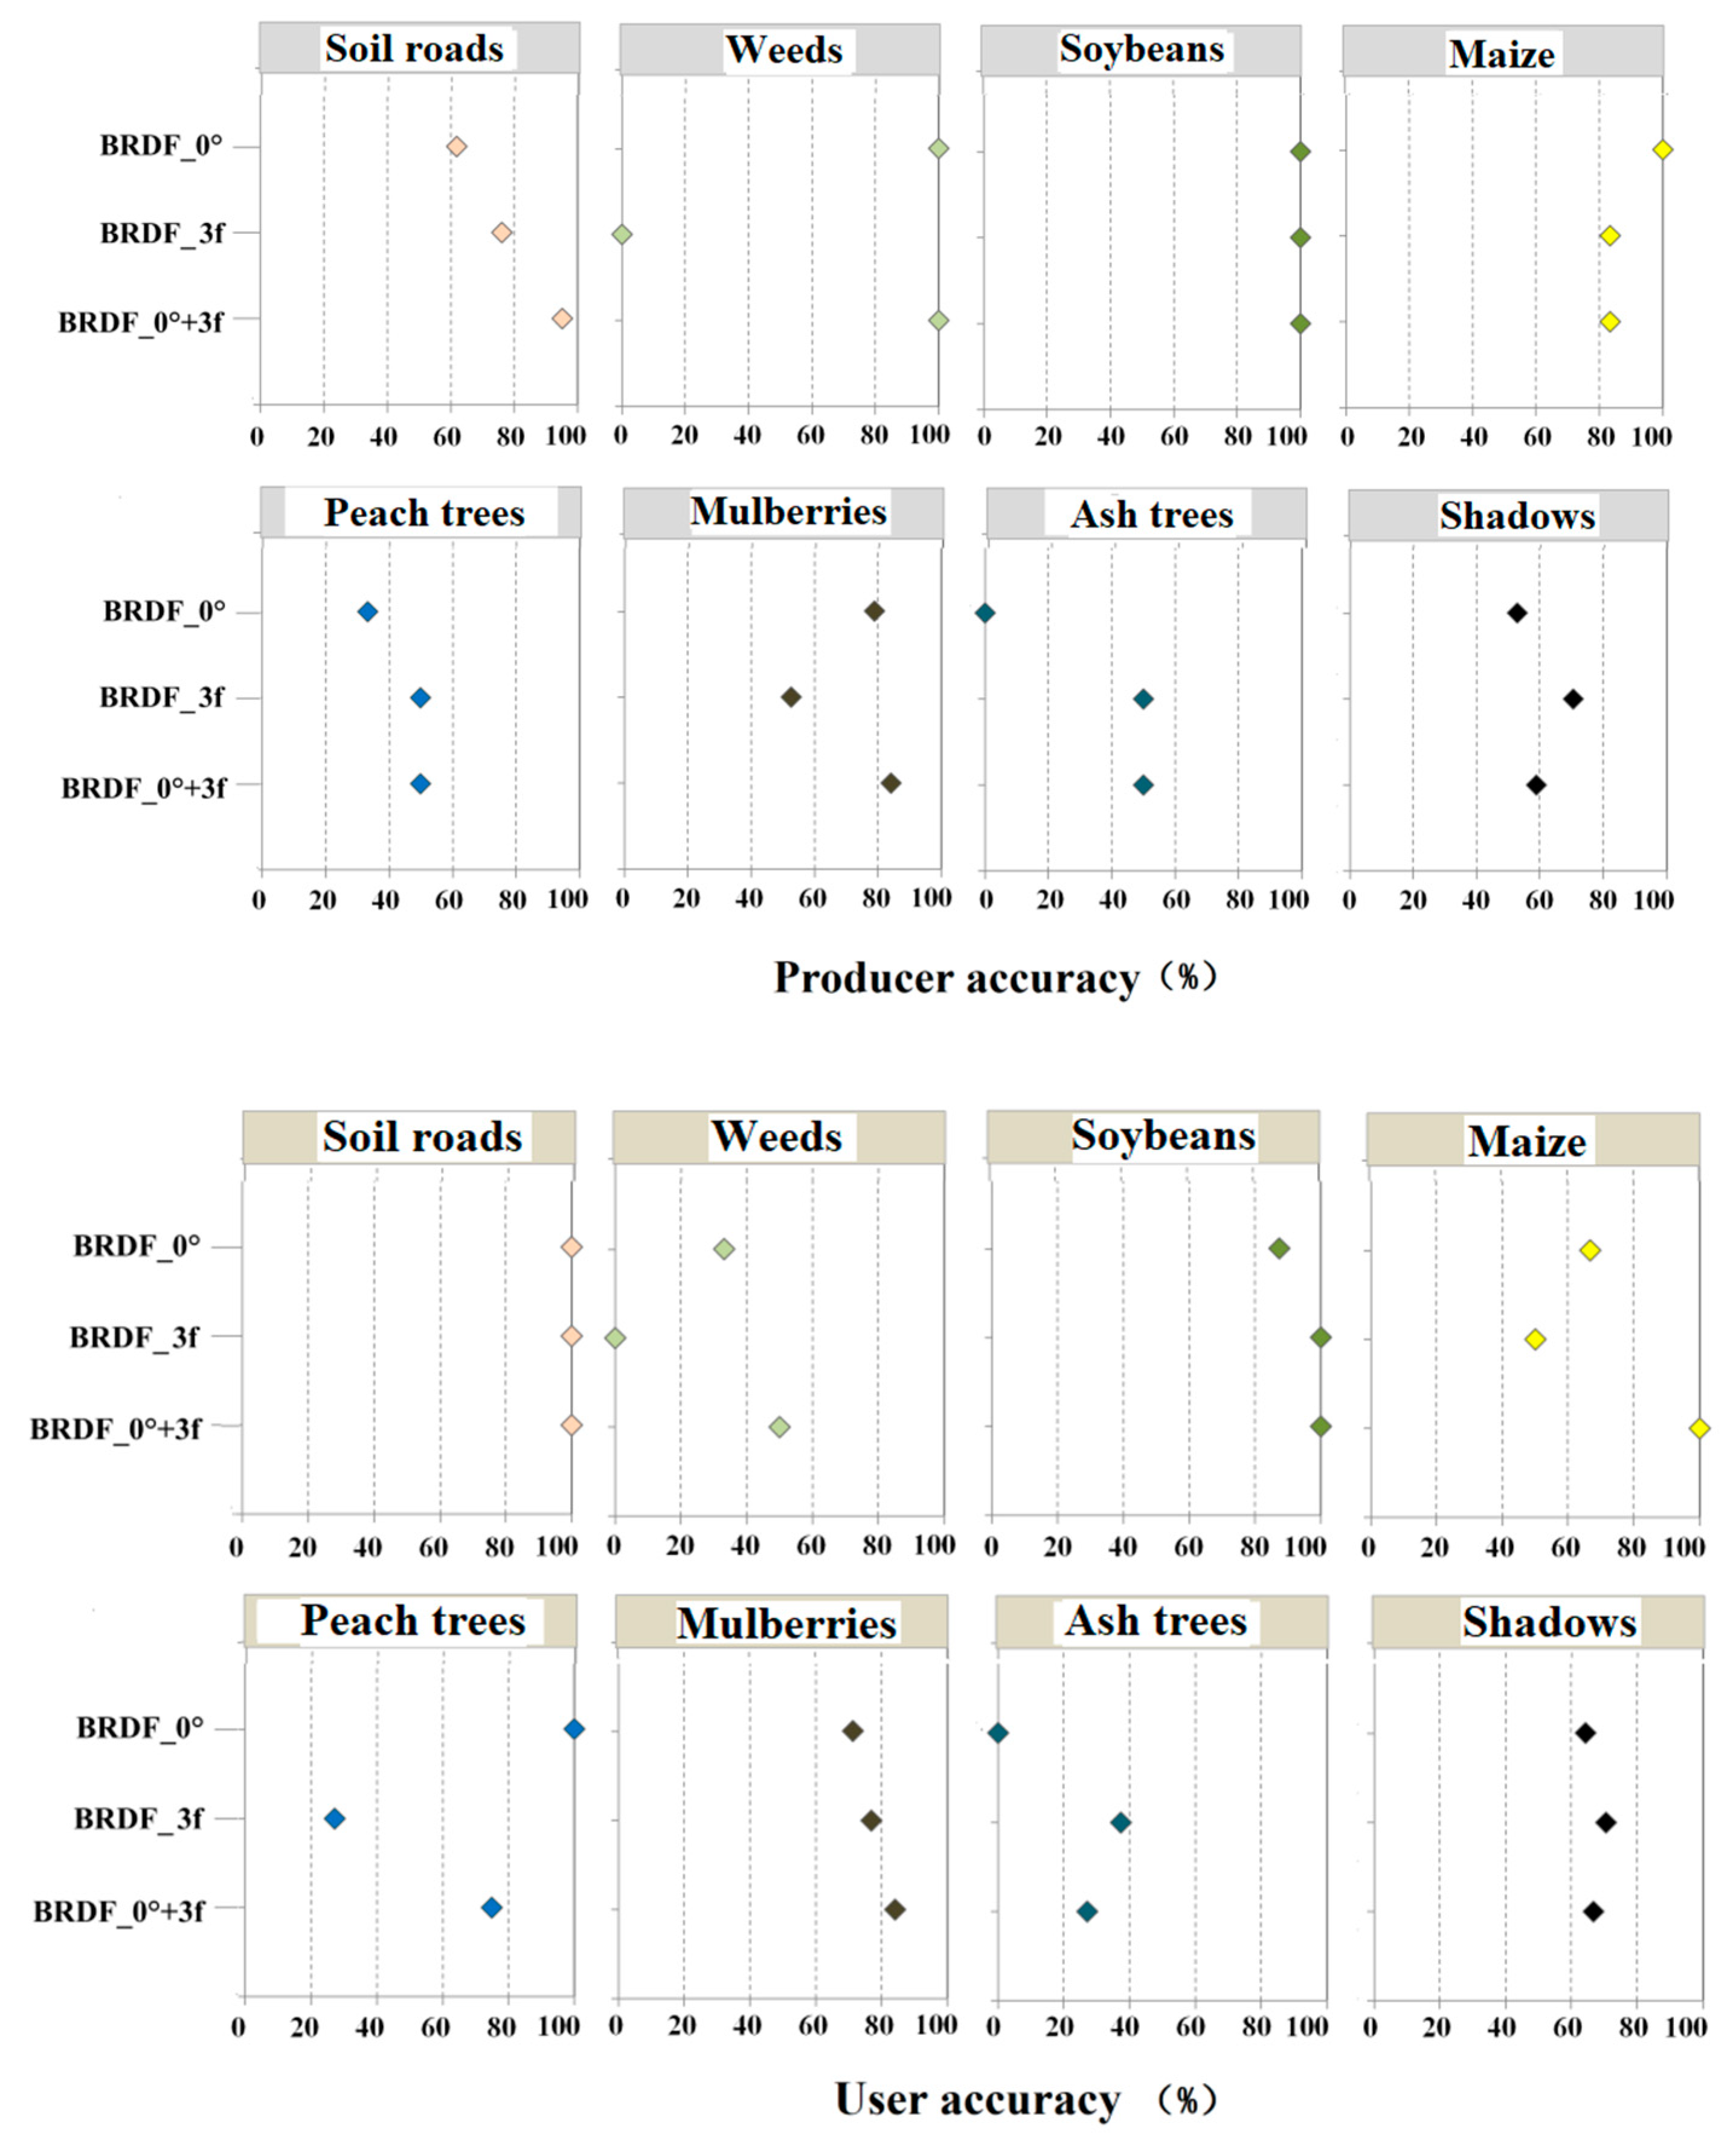
4. Image Classification Results
5. Discussion
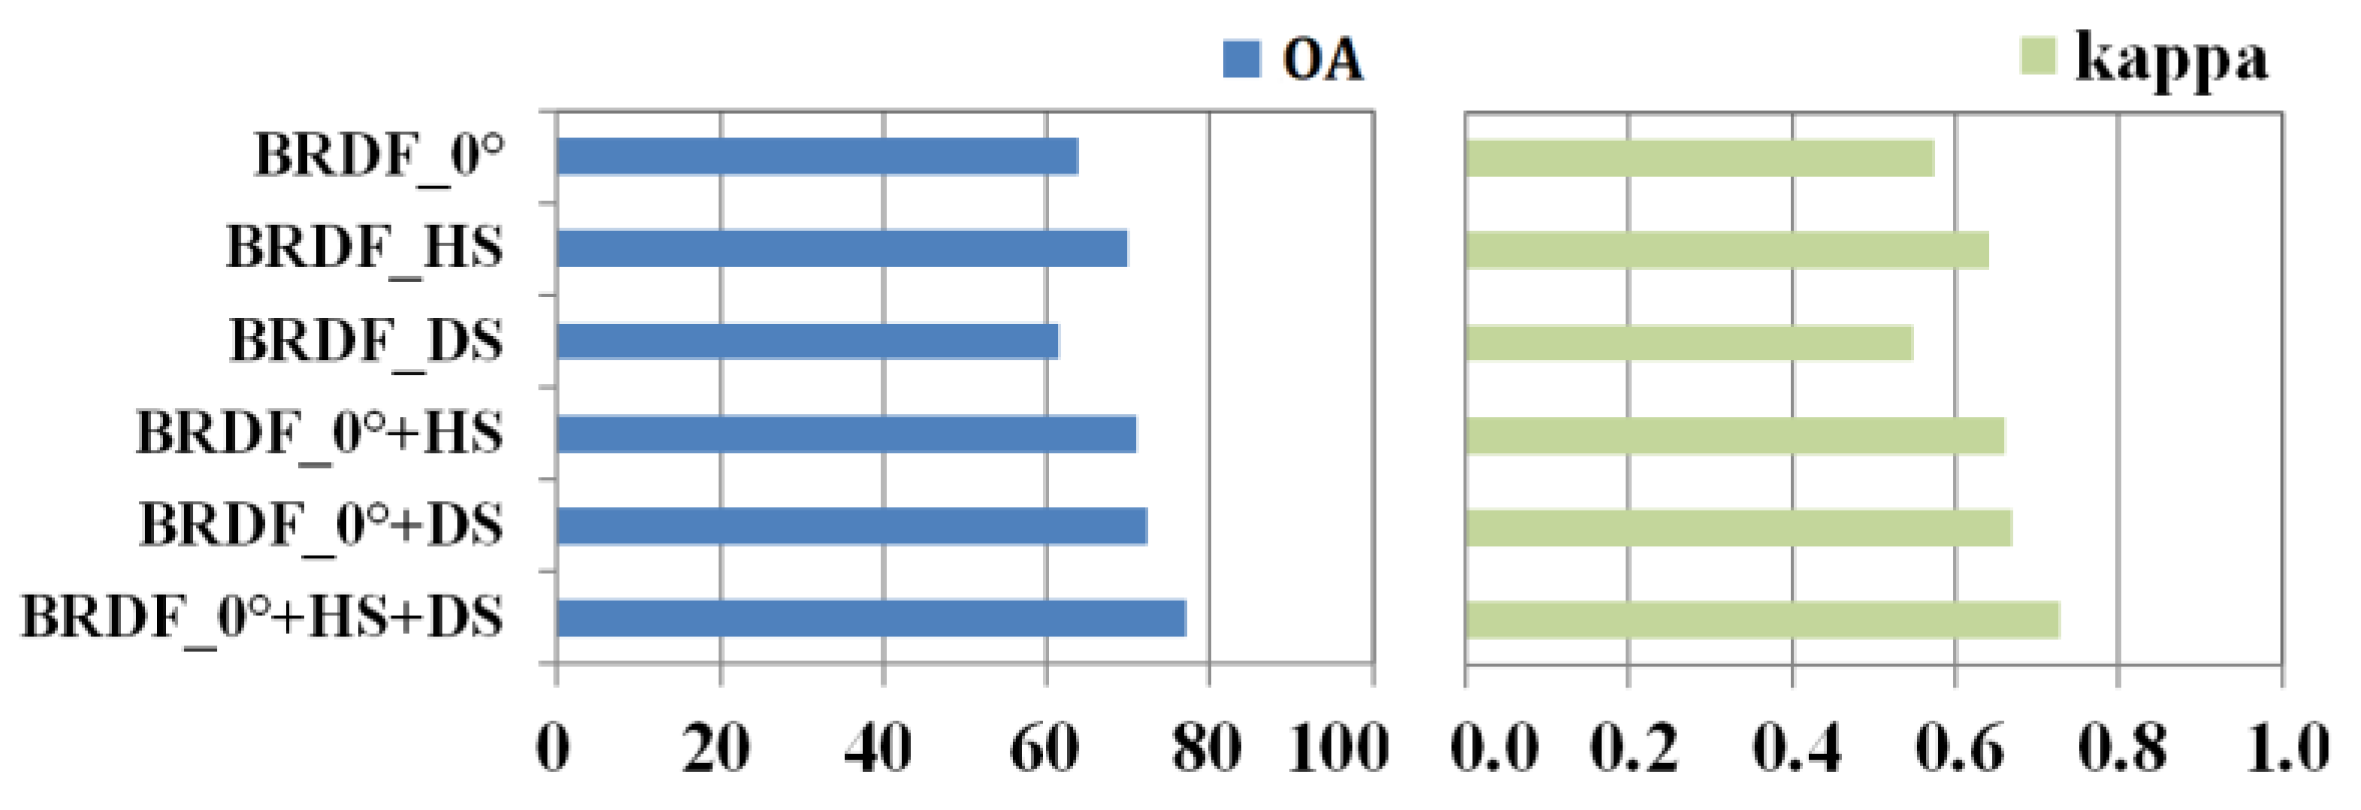
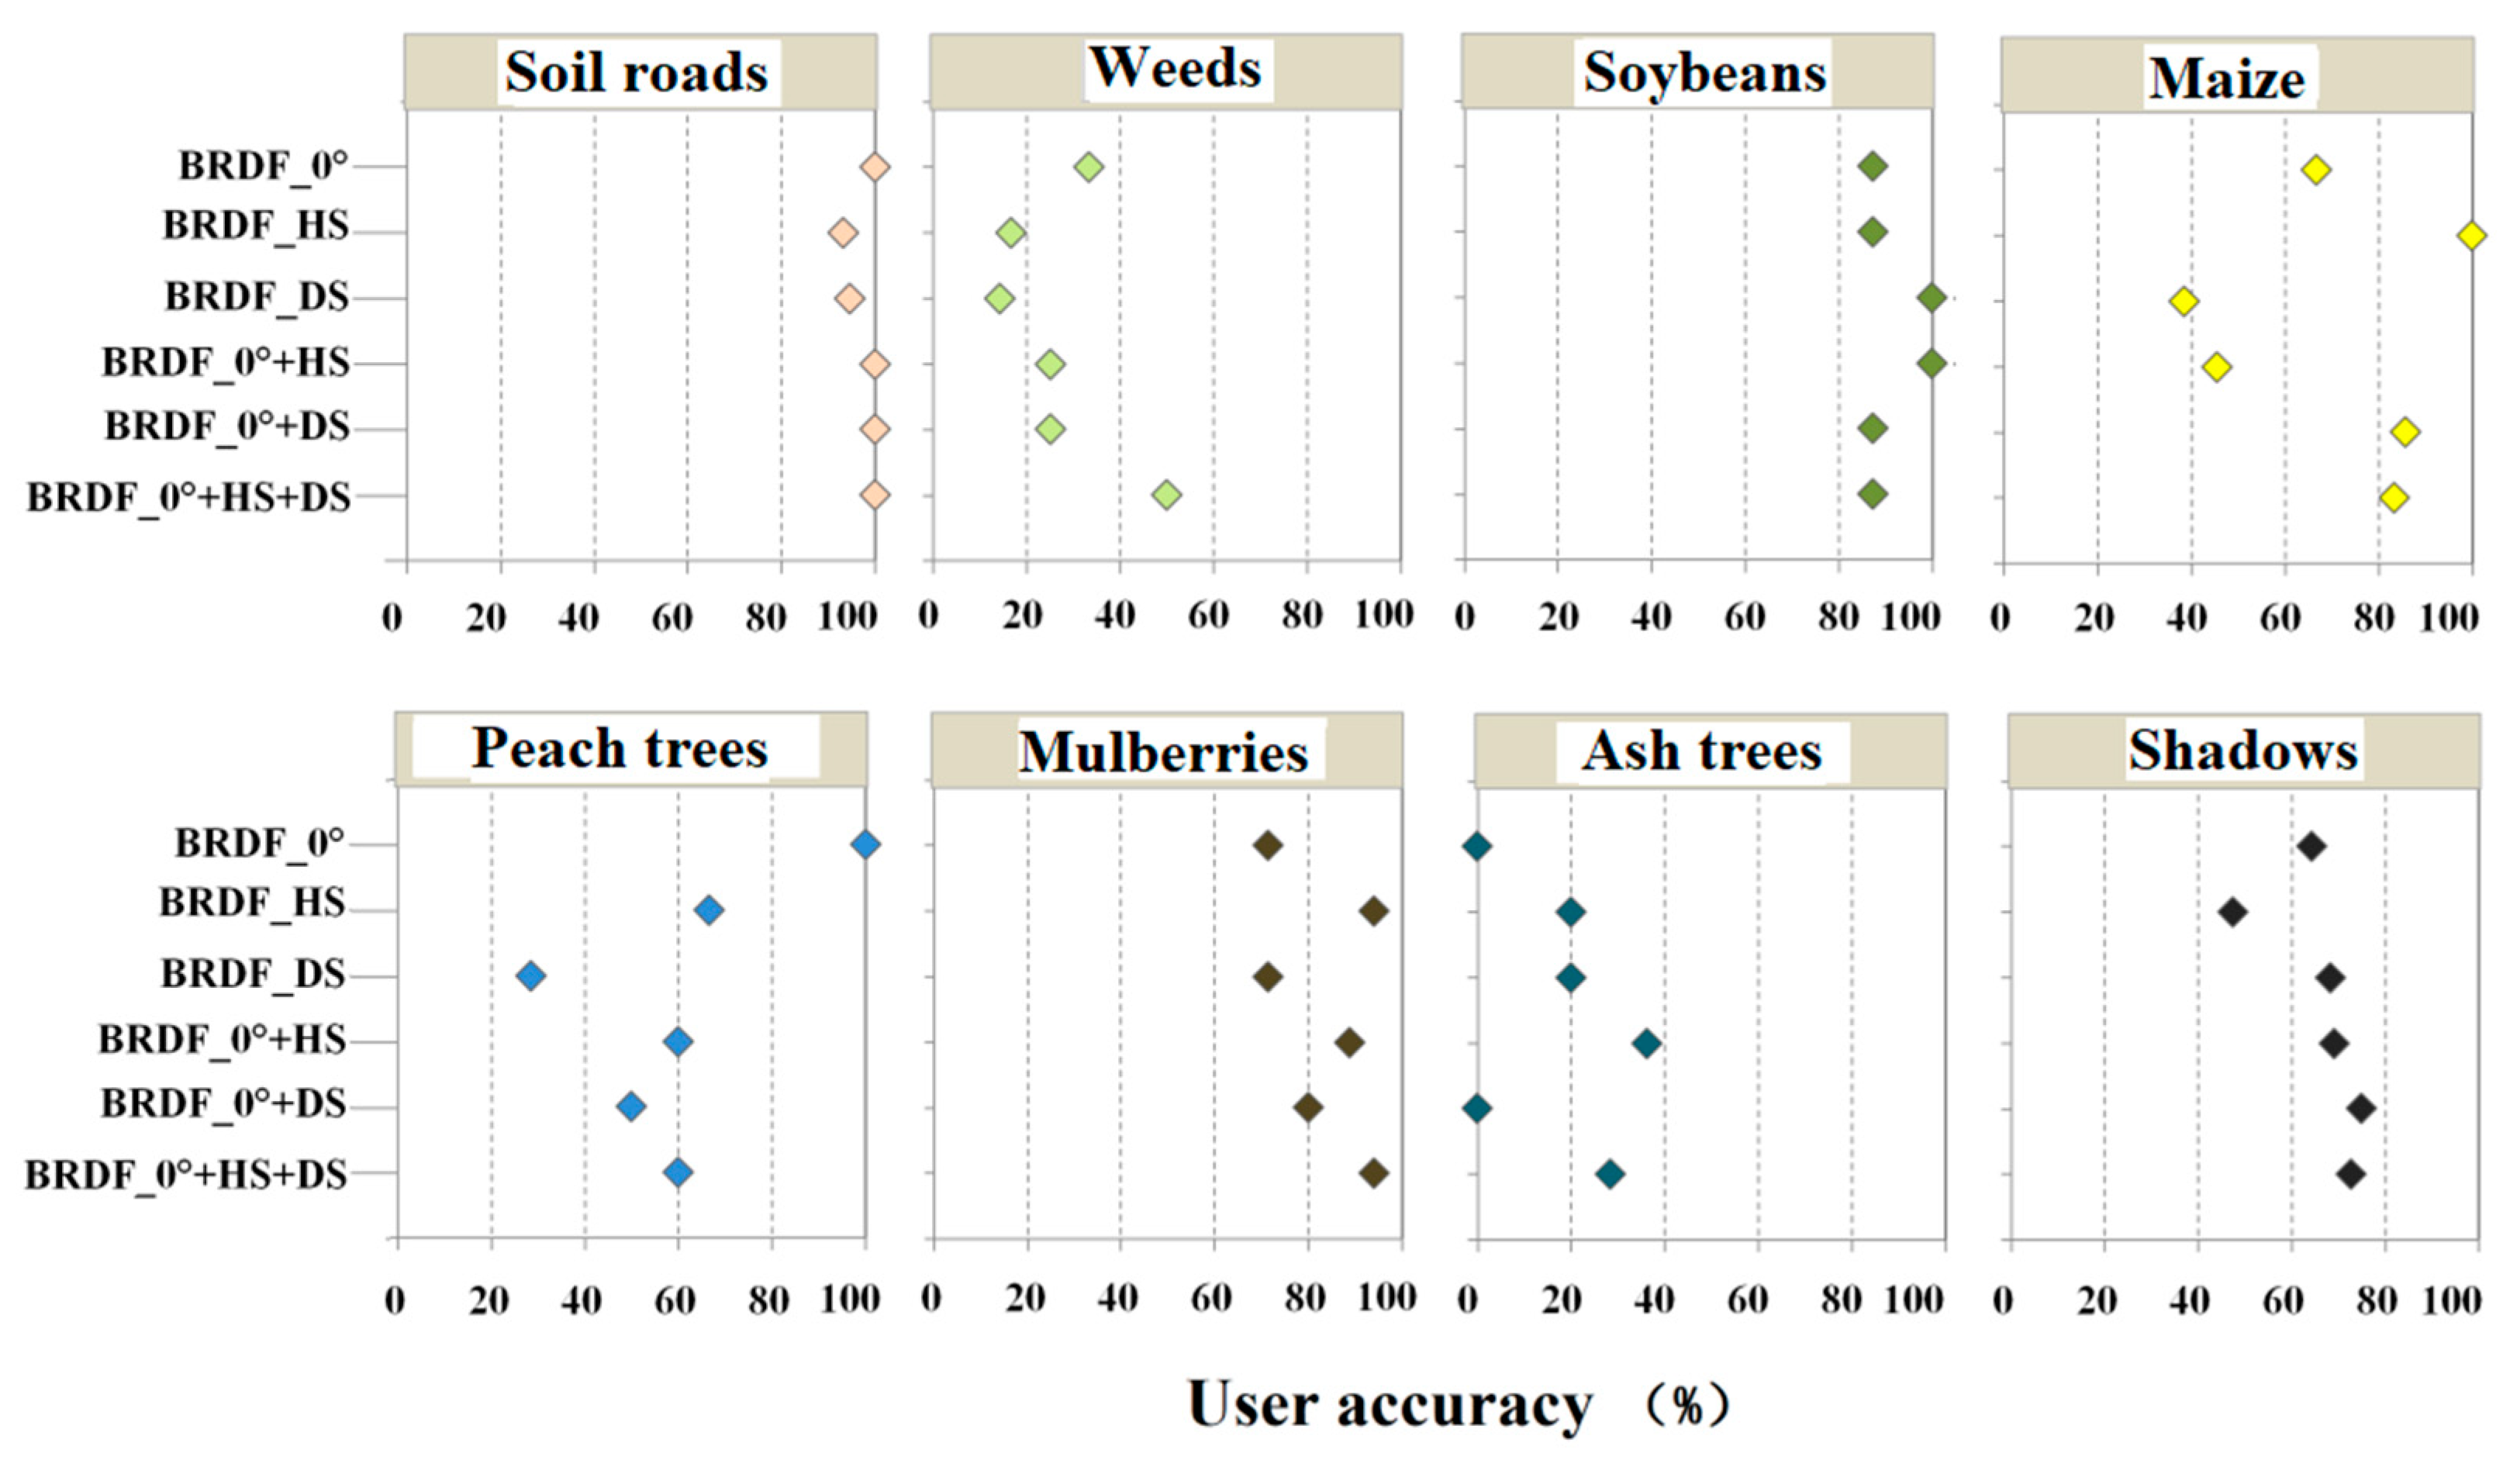
5.1. Applicability Assessment of BRDF Characteristic Types
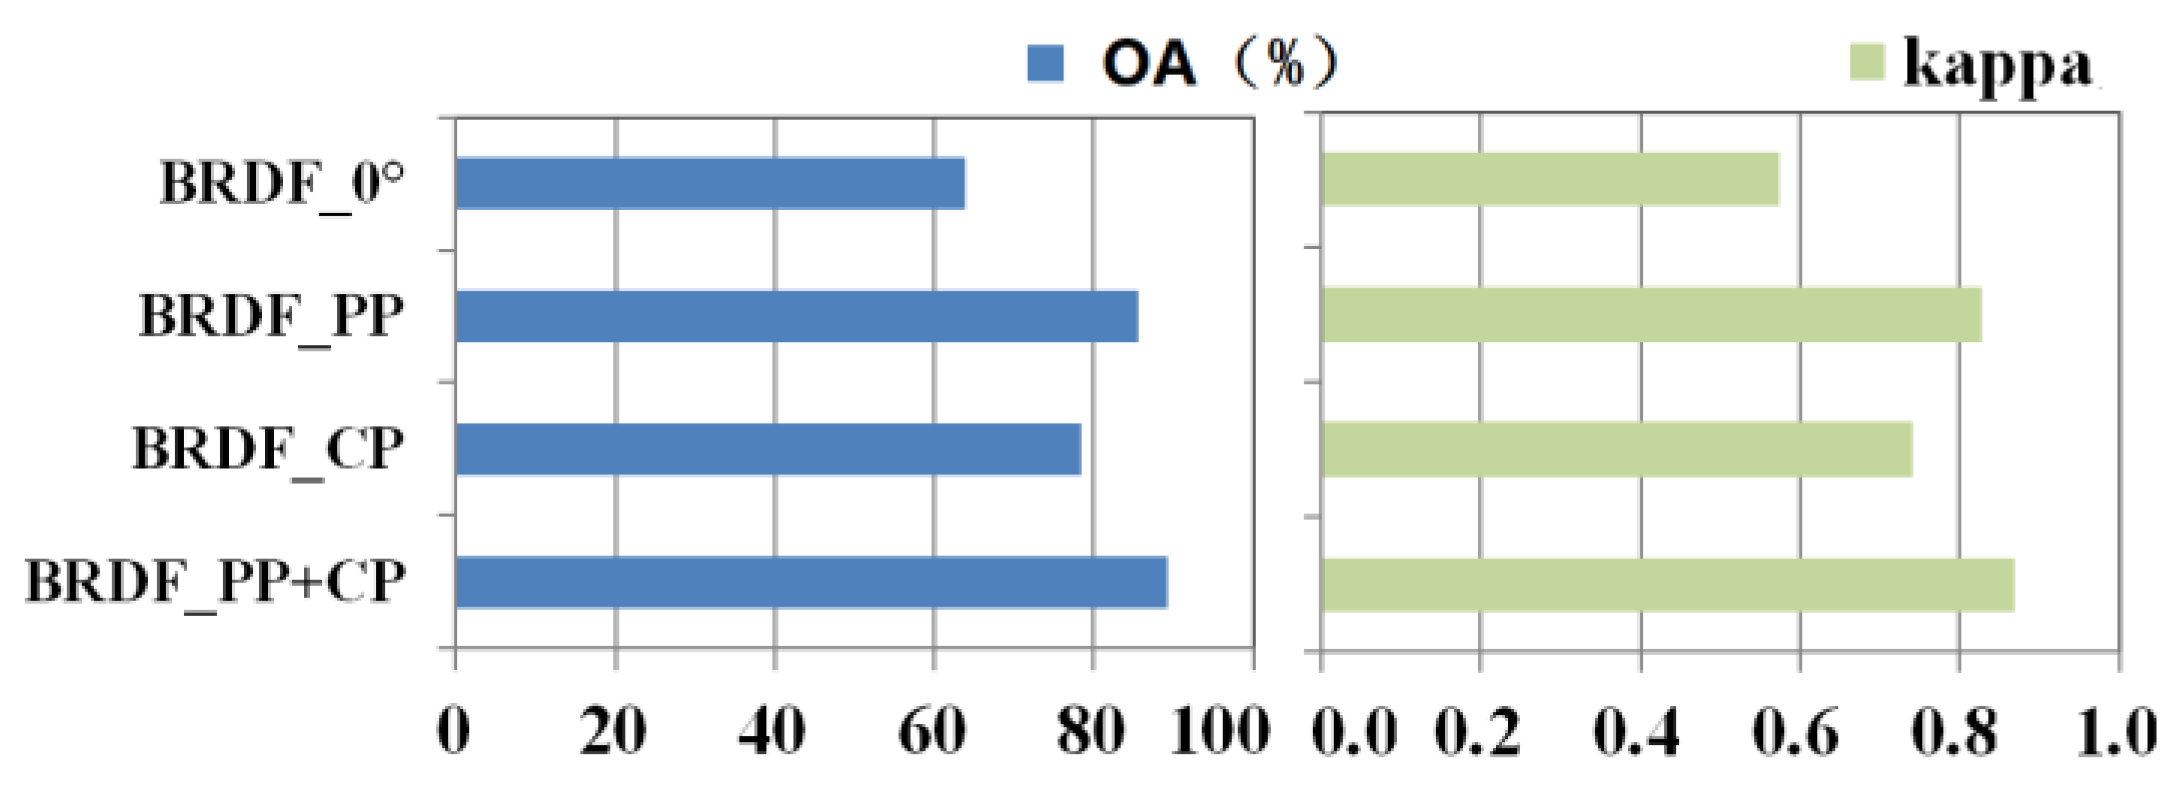
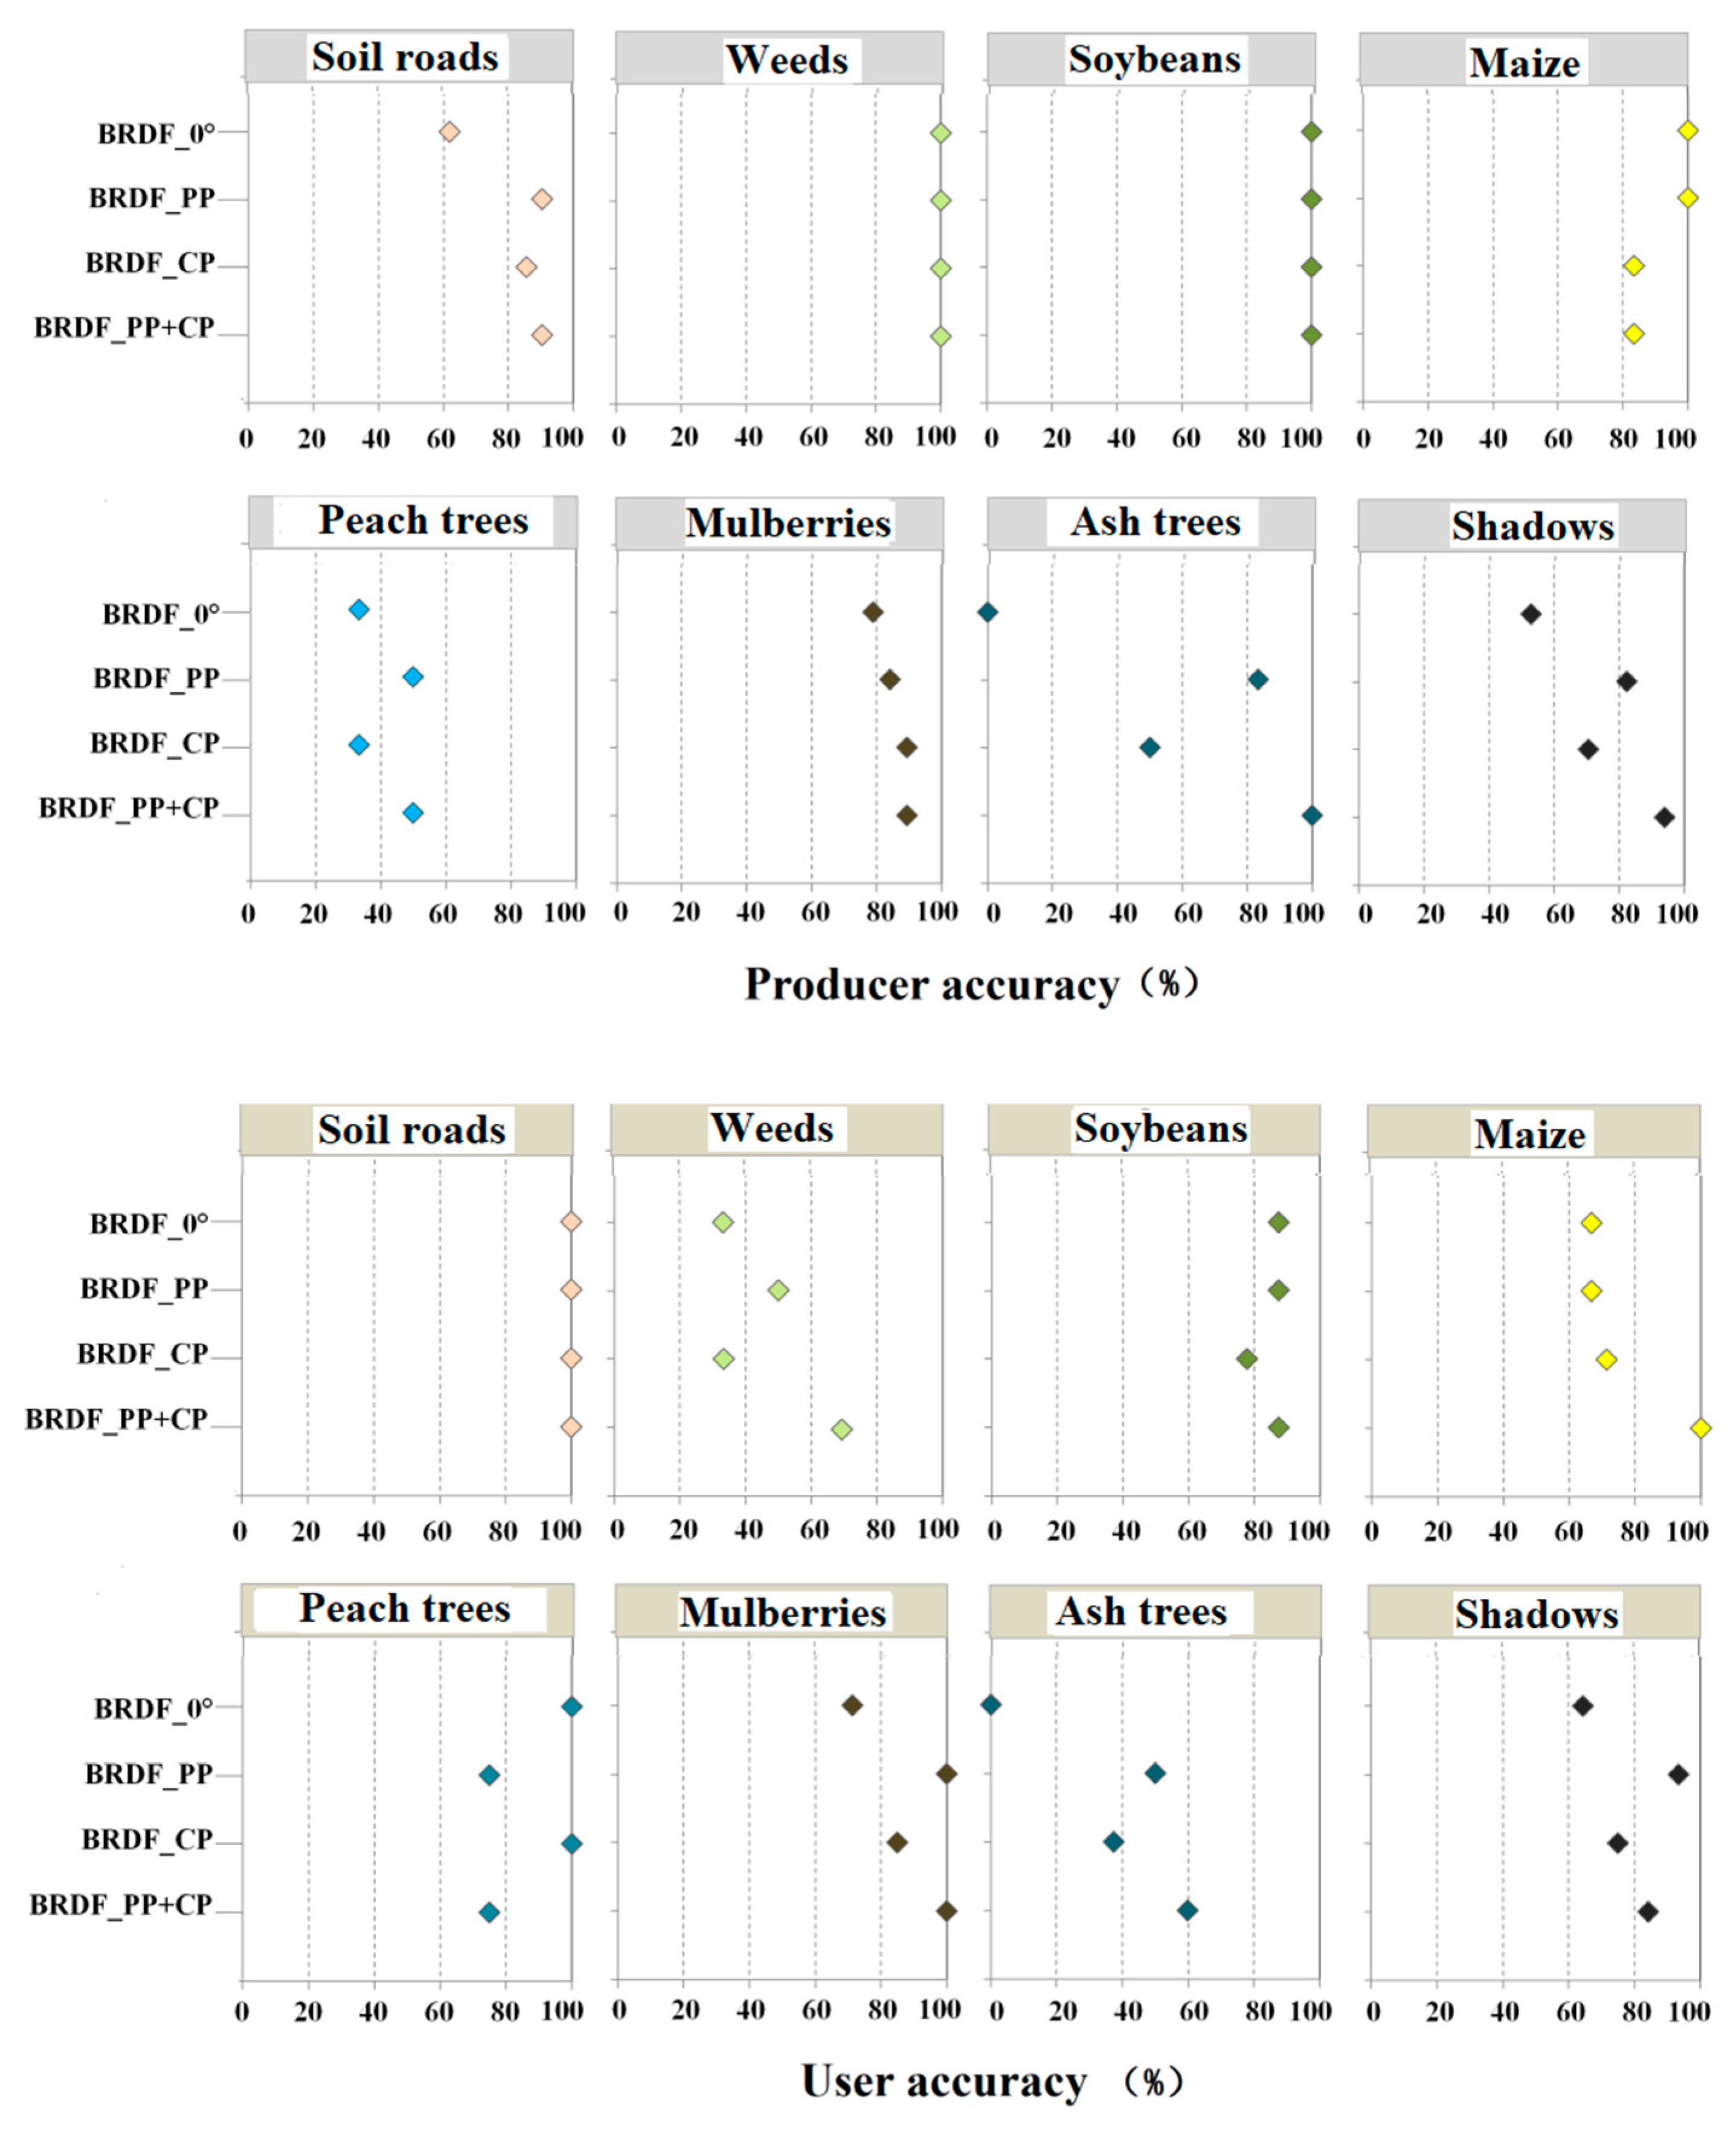
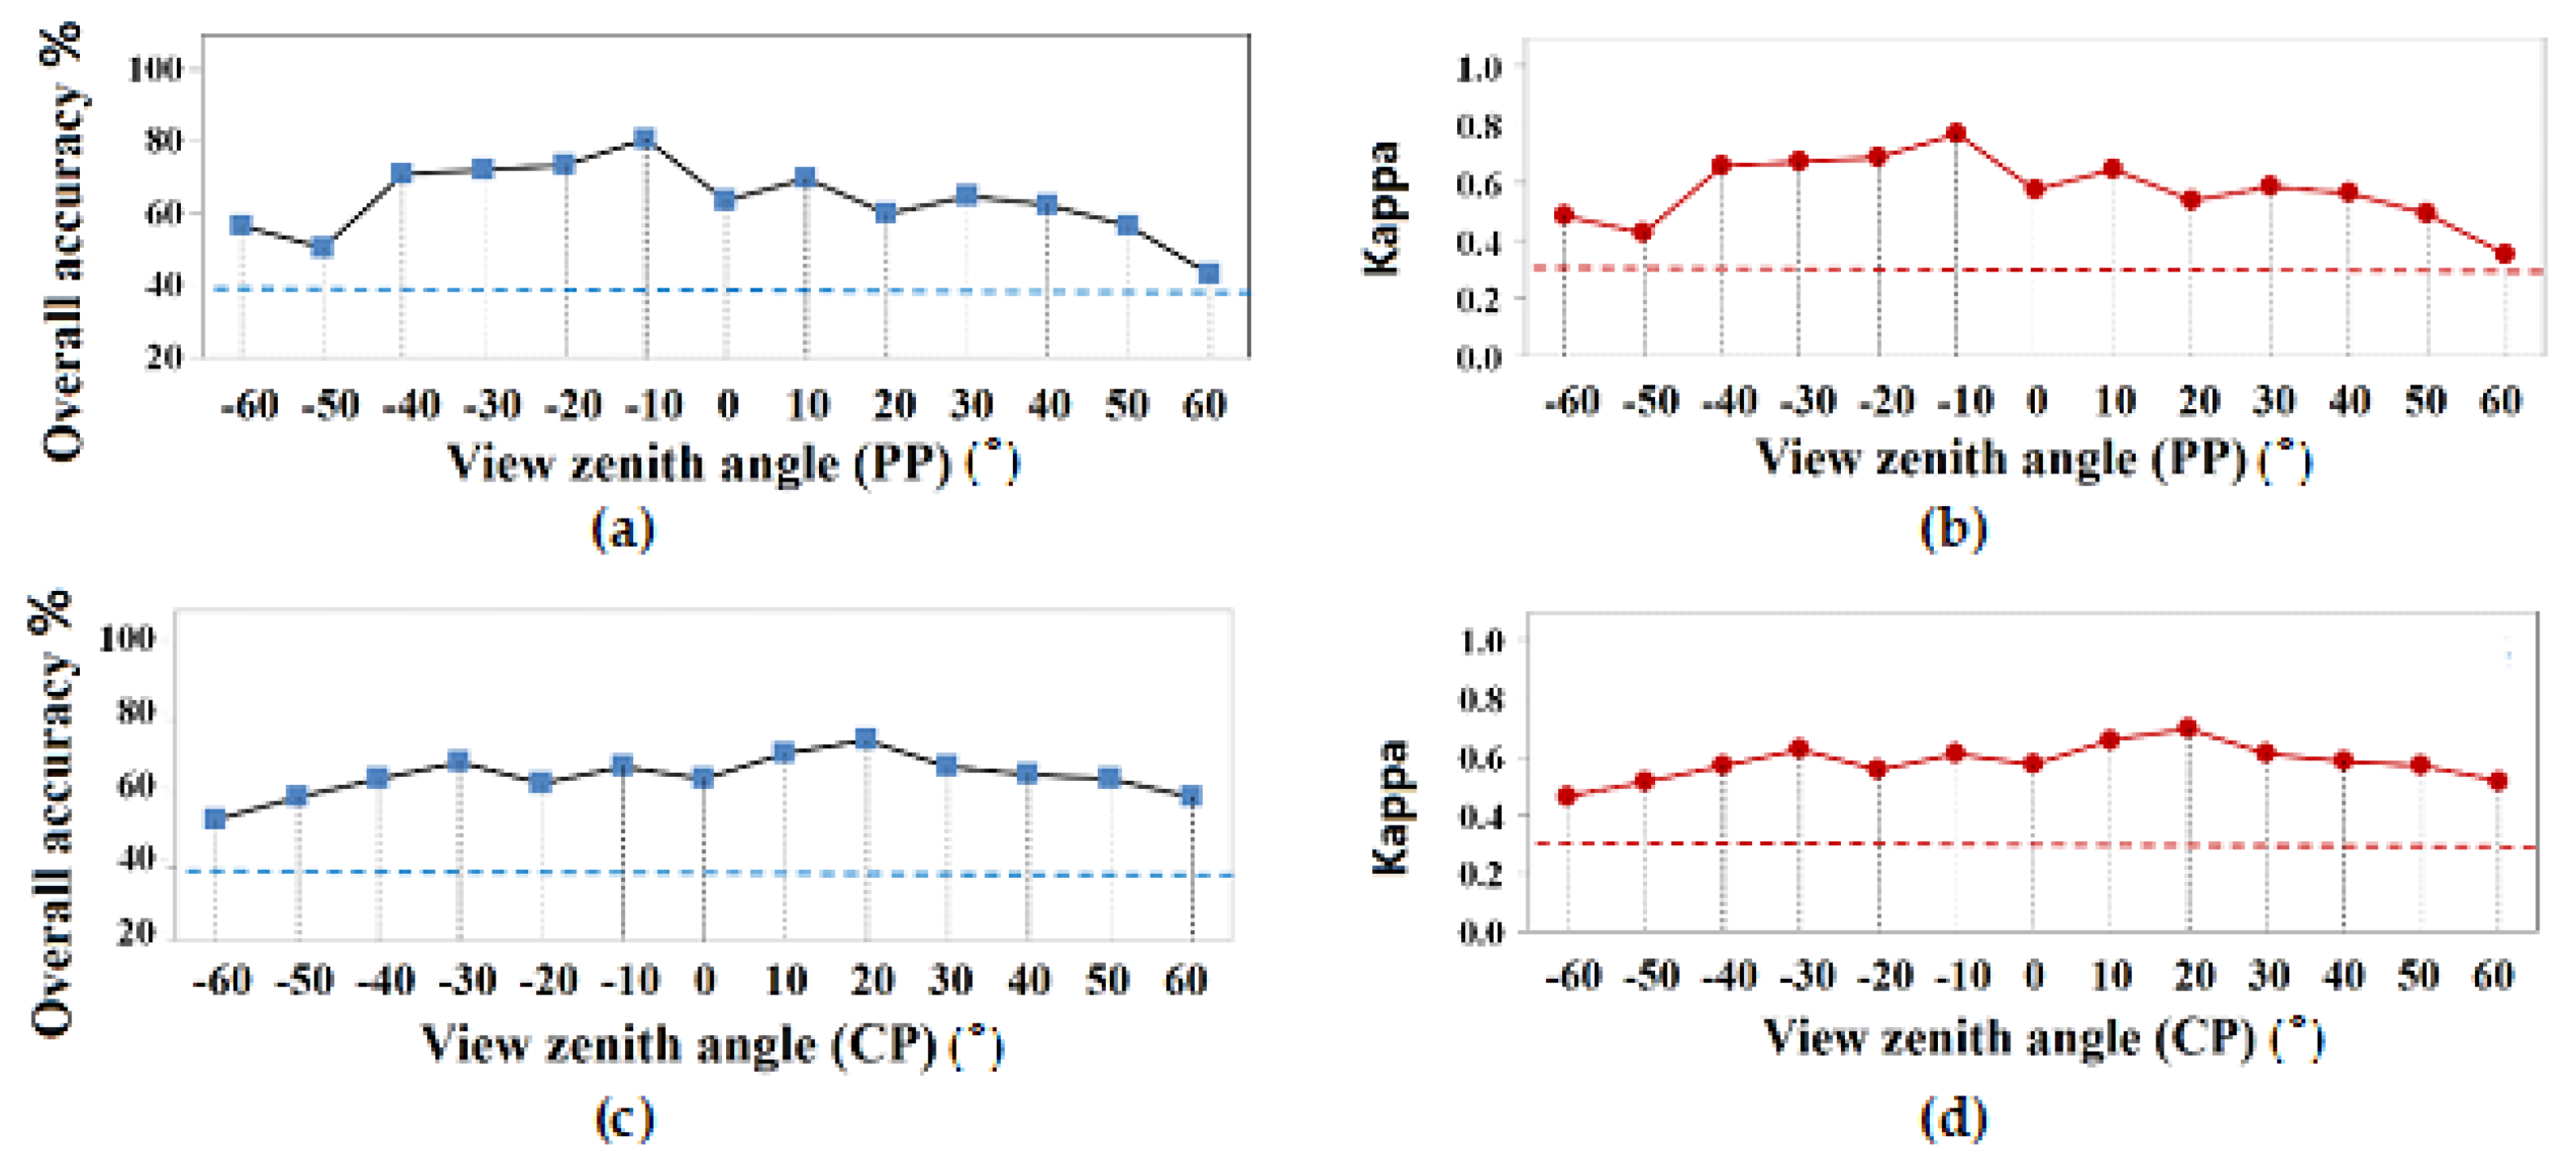
5.2. Importance Evaluation of the Observation Angle and Band Selection
6. Conclusions
Author Contributions
Funding
Conflicts of Interest
References
- Winter, S.; Bauer, T.; Strauss, P.; Kratschmer, S.; Paredes, D.; Popescu, D.; Landa, B.; Guzmán, G.; Gómez, J.A.; Guernion, M. Effects of vegetation management intensity on biodiversity and ecosystem services in vineyards: A meta-analysis. J. Appl. Ecol. 2018, 55, 2484–2495. [Google Scholar] [CrossRef]
- Uuemaa, E.; Antrop, M.; Roosaare, J.; Marja, R.; Mander, Ü. Landscape Metrics and Indices: An Overview of Their Use in Landscape Research. Living Rev. Landsc. Res. 2009, 3, 1–28. [Google Scholar] [CrossRef]
- Patrick, M.J.; Ellery, W.N. Plant community and landscape patterns of a floodplain wetland in Maputaland, Northern KwaZulu-Natal, South Africa. Afr. J. Ecol. 2010, 45, 175–183. [Google Scholar] [CrossRef]
- Liu, G.L.; Zhang, L.C.; Zhang, Q.; Zipporah, M.; Jiang, Q.H. Spatio–Temporal Dynamics of Wetland Landscape Patterns Based on Remote Sensing in Yellow River Delta, China. Wetlands 2014, 34, 787–801. [Google Scholar] [CrossRef]
- Clark, M.L.; Buck-Diaz, J.; Evens, J. Mapping of forest alliances with simulated multi-seasonal hyperspectral satellite imagery. Remote Sens. Envrion. 2018, 210, 490–507. [Google Scholar] [CrossRef]
- Aslan, A.; Rahman, A.F.; Warren, M.W.; Robeson, S.M. Mapping spatial distribution and biomass of coastal wetland vegetation in Indonesian Papua by combining active and passive remotely sensed data. Remote Sens. Envrion. 2016, 183, 65–81. [Google Scholar] [CrossRef]
- Shukla, G.; Garg, R.D.; Kumar, P.; Srivastava, H.S.; Garg, P.K. Using multi-source data and decision tree classification in mapping vegetation diversity. Spat. Inf. Res. 2018, 1–13. [Google Scholar] [CrossRef]
- Shaw, J.R.; Cooper, D.J.; Sutfin, N.A. Applying a Hydrogeomorphic Channel Classification to understand Spatial Patterns in Riparian Vegetation. J. Veg. Sci. 2018, 29, 550–559. [Google Scholar] [CrossRef]
- Melgani, F.; Bruzzone, L. Classification of hyperspectral remote sensing images with support vector machines. IEEE Trans. Geosci. Remote Sens. 2004, 42, 1778–1790. [Google Scholar] [CrossRef]
- Goetz, A.F.H. Three decades of hyperspectral remote sensing of the Earth: A personal view. Remote Sens. Envrion. 2009, 113, S5–S16. [Google Scholar] [CrossRef]
- Lunga, D.; Prasad, S.; Crawford, M.M.; Ersoy, O. Manifold-Learning-Based Feature Extraction for Classification of Hyperspectral Data: A Review of Advances in Manifold Learning. IEEE Signal Proc. Mag. 2013, 31, 55–66. [Google Scholar] [CrossRef]
- Ishida, T.; Kurihara, J.; Viray, F.A.; Namuco, S.B.; Paringit, E.C.; Perez, G.J.; Takahashi, Y.; Marciano, J.J., Jr. A novel approach for vegetation classification using UAV-based hyperspectral imaging. Comput. Elec. Agr. 2018, 144, 80–85. [Google Scholar] [CrossRef]
- Filippi, A.M.; Jensen, J.R. Fuzzy learning vector quantization for hyperspectral coastal vegetation classification. Remote Sens. Envrion. 2006, 99, 512–530. [Google Scholar] [CrossRef]
- Fu, Y.; Zhao, C.; Wang, J.; Jia, X.; Guijun, Y.; Song, X.; Feng, H. An Improved Combination of Spectral and Spatial Features for Vegetation Classification in Hyperspectral Images. Remote Sens. 2017, 9, 261. [Google Scholar] [CrossRef]
- Hall, F.G.; Hilker, T.; Coops, N.C.; Lyapustin, A.; Huemmrich, K.F.; Middleton, E.; Margolis, H.; Drolet, G.; Black, T.A. Multi-angle remote sensing of forest light use efficiency by observing PRI variation with canopy shadow fraction. Remote Sens. Envrion. 2008, 112, 3201–3211. [Google Scholar] [CrossRef]
- Gatebe, C.K.; King, M.D. Airborne spectral BRDF of various surface types (ocean, vegetation, snow, desert, wetlands, cloud decks, smoke layers) for remote sensing applications. Remote Sens. Envrion. 2016, 179, 131–148. [Google Scholar] [CrossRef]
- Xie, D.; Qin, W.; Wang, P.; Shuai, Y.; Zhou, Y.; Zhu, Q. Influences of Leaf-Specular Reflection on Canopy BRF Characteristics: A Case Study of Real Maize Canopies With a 3-D Scene BRDF Model. IEEE Trans. Geosci. Remote Sens. 2016, 55, 619–631. [Google Scholar] [CrossRef]
- Georgiev, G.T.; Gatebe, C.K.; Butler, J.J.; King, M.D. BRDF Analysis of Savanna Vegetation and Salt-Pan Samples. IEEE Trans. Geosci. Remote Sens. 2009, 47, 2546–2556. [Google Scholar] [CrossRef]
- Peltoniemi, J.I.; Kaasalainen, S.; Naranen, J..; Rautiainen, M.; Stenberg, P.; Smolander, H.; Smolander, S.; Voipio, P. BRDF measurement of understory vegetation in pine forests: Dwarf shrubs, lichen, and moss. Remote Sens. Environ. 2005, 94, 343–354. [Google Scholar] [CrossRef]
- Mitchell, J.J.; Glenn, N.F.; Anderson, M.O.; Hruska, R.C.; Halford, A.; Baun, C.; Nydegger, N. 2012 4th Workshop on Hyperspectral Image and Signal Processing: Evolution in Remote Sensing (WHISPERS). In Proceedings of the Unmanned Aerial Vehicle (UAV) Hyperspectral Remote Sensing for Dryland Vegetation Monitoring, Shanghai, China, 4–7 June 2012; pp. 1–10. [Google Scholar]
- Bareth, G.; Aasen, H.; Bendig, J.; Gnyp, M.L.; Bolten, A.; Jung, A.; Michels, R.; Soukkamäki, J. Low-weight and UAV-based Hyperspectral Full-frame Cameras for Monitoring Crops: Spectral Comparison with Portable Spectroradiometer Measurements. Photogramm. Fernerkun. Geoinf. 2015, 1, 69–79. [Google Scholar] [CrossRef]
- Liu, H.; Zhu, H.; Wang, P. Quantitative modelling for leaf nitrogen content of winter wheat using UAV-based hyperspectral data. Int. J. Remote Sens. 2017, 38, 2117–2134. [Google Scholar] [CrossRef]
- Zhang, C.; Kovacs, J.M. The application of small unmanned aerial systems for precision agriculture: A review. Precis. Agric. 2012, 13, 693–712. [Google Scholar] [CrossRef]
- Baixiang, X.U.; Liu, L. A Study of the application of multi-angle remote sensing to vegetation classification. Technol. Innov. Appl. 2018, 13, 1–10. [Google Scholar]
- Roosjen, P.; Bartholomeus, H.; Suomalainen, J.; Clevers, J. Investigating BRDF effects based on optical multi-angular laboratory and hyperspectral UAV measurements. In Proceedings of the Fourier Transform Spectroscopy, Lake Arrowhead, CA, USA, 1–4 March 2015. [Google Scholar] [CrossRef]
- Tao, L.; Amr, A.E. Multi-view object-based classification of wetland land covers using unmanned aircraft system images. Remote Sens. Envrion. 2018, 216, 122–138. [Google Scholar] [CrossRef]
- Tao, L.; Amr, A.E. Deep convolutional neural network training enrichment using multi-view object-based analysis of Unmanned Aerial systems imagery for wetlands classification. ISPRS J. Photogramm. Remote Sens. 2018, 139, 154–170. [Google Scholar] [CrossRef]
- Cubert S185 Frame-Frame Imaging Spectrometer was Producted by Cubert GmbH, Science Park II, Lise-Meitner Straße 8/1, D-89081 Ulm. Available online: http://cubert-gmbh.com/ (accessed on 6 May 2019).
- Mezaal, M.; Pradhan, B.; Rizeei, H. Improving landslide detection from airborne laser scanning data using optimized dempster–shafer. Remote Sens. 2018, 10, 1029. [Google Scholar] [CrossRef]
- Bryson, M.; Sukkarieh, S. Building a robust implementation of bearing-only inertial SLAM for a UAV. J. Field Robot. 2007, 24, 113–143. [Google Scholar] [CrossRef]
- Wanner, W.; Li, X.; Strahler, A.H. On the derivation of kernels for kernel-driven models of bidirectional reflectance. J. Geophys. Res. 1995, 100, 21077–21090. [Google Scholar] [CrossRef]
- Im, J.; Jensen, R.J. A change detection model based on neighborhood correlation image analysis and decision tree classification. Remote Sens. Envrion. 2005, 99, 326–340. [Google Scholar] [CrossRef]
- Pal, M. Random forest classifier for remote sensing classification. Int. J. Remote Sens. 2005, 26, 217–222. [Google Scholar] [CrossRef]


| Specification | Value | Specification | Value |
|---|---|---|---|
| Wavelength range | 450–946 nm | Housing | 28 cm, 6.5 cm, 7 cm |
| Sampling interval | 4 nm | Digitization | 12 bit |
| Full width at half maximum | 8 nm at 532 nm, 25 nm at 850 nm | Horizontal field of view Cube resolution | 22° 1 megapixel |
| Channels | 125 | Spectral throughput | 2500 spectra/cube |
| Focal length | 16 mm | Power | DC 12 V, 15 W |
| Detector | Si CCD | Weight | 470 g |
| Explanatory Variable | Abbreviation | ||
|---|---|---|---|
| Commonly Used | Reflectance obtained from DOM | DOM | |
| BRDF Characteristics | (1) Modeled bidirectional reflectance factors (BRFs) | Vertical observation angle | BRDF_0° |
| Hot and dark spots reflectance signatures | BRDF_HS_DS | ||
| Observation angles on principal plane | BRDF_PP | ||
| Observation angles on cross-principal plane | BRDF_CP | ||
| Observation angles on principal and cross planes | BRDF_PP+CP | ||
| (2) Model parameters | fiso, fvol and fgeo | BRDF_3f | |
| Types | Dirt Roads | Weeds | Soybeans | Maize | Mulberries | Peach Trees | Ash Trees | Shadows |
|---|---|---|---|---|---|---|---|---|
| Number | 36 | 26 | 17 | 29 | 25 | 38 | 26 | 38 |
| Explanatory Variable | OA | Kappa | ||
|---|---|---|---|---|
| Commonly Used | DOM | 39.8 | 0.301 | |
| BRDF Characteristics | Modeled bidirectional reflectance factors (BRFs) | BRDF_0° | 63.9 | 0.573 |
| BRDF_0°+HS+DS | 77.1 | 0.728 | ||
| BRDF_PP | 85.5 | 0.828 | ||
| BRDF_CP | 78.3 | 0.740 | ||
| BRDF_PP+CP | 89.2 | 0.870 | ||
| BRDF model parameters | BRDF_0°_3f | 78.3 | 0.739 |
© 2019 by the authors. Licensee MDPI, Basel, Switzerland. This article is an open access article distributed under the terms and conditions of the Creative Commons Attribution (CC BY) license (http://creativecommons.org/licenses/by/4.0/).
Share and Cite
Yan, Y.; Deng, L.; Liu, X.; Zhu, L. Application of UAV-Based Multi-angle Hyperspectral Remote Sensing in Fine Vegetation Classification. Remote Sens. 2019, 11, 2753. https://doi.org/10.3390/rs11232753
Yan Y, Deng L, Liu X, Zhu L. Application of UAV-Based Multi-angle Hyperspectral Remote Sensing in Fine Vegetation Classification. Remote Sensing. 2019; 11(23):2753. https://doi.org/10.3390/rs11232753
Chicago/Turabian StyleYan, Yanan, Lei Deng, XianLin Liu, and Lin Zhu. 2019. "Application of UAV-Based Multi-angle Hyperspectral Remote Sensing in Fine Vegetation Classification" Remote Sensing 11, no. 23: 2753. https://doi.org/10.3390/rs11232753
APA StyleYan, Y., Deng, L., Liu, X., & Zhu, L. (2019). Application of UAV-Based Multi-angle Hyperspectral Remote Sensing in Fine Vegetation Classification. Remote Sensing, 11(23), 2753. https://doi.org/10.3390/rs11232753