Article

Potential of Photochemical Reflectance Index for Indicating Photochemistry and Light Use Efficiency in Leaves of European Beech and Norway Spruce Trees

1
Global Change Research Institute CAS, Bělidla 986/4a, 603 00 Brno, Czech Republic
2
CSIC, Global Ecology Unit CREAF-CSIC-UAB, E-08193 Bellaterra (Catalonia), Spain
3
CREAF, E-08193 Cerdanyola del Vallès (Catalonia), Spain
*
Author to whom correspondence should be addressed.
Remote Sens. 2018, 10(8), 1202; https://doi.org/10.3390/rs10081202
Submission received: 1 May 2018 / Revised: 19 July 2018 / Accepted: 24 July 2018 / Published: 31 July 2018

Abstract

:
Hyperspectral reflectance is becoming more frequently used for measuring the functions and productivity of ecosystems. The purpose of this study was to re-evaluate the potential of the photochemical reflectance index (PRI) for evaluating physiological status of plants. This is needed because the reasons for variation in PRI and its relationships to physiological traits remain poorly understood. We examined the relationships between PRI and photosynthetic parameters in evergreen Norway spruce and deciduous European beech grown in controlled conditions during several consecutive periods of 10–12 days between which the irradiance and air temperature were changed stepwise. These regime changes induced significant changes in foliar biochemistry and physiology. The responses of PRI corresponded particularly to alterations in the actual quantum yield of photosystem II photochemistry (ΦPSII). Acclimation responses of both species led to loss of PRI sensitivity to light use efficiency (LUE). The procedure of measuring PRI at multiple irradiance-temperature conditions has been designed also for testing accuracy of ΔPRI in estimating LUE. A correction mechanism of subtracting daily measured PRI from early morning PRI has been performed to account for differences in photosynthetic pigments between irradiance-temperature regimes. Introducing ΔPRI, which provided a better estimate of non-photochemical quenching (NPQ) compared to PRI, also improved the accuracy of LUE estimation. Furthermore, ΔPRI was able to detect the effect of drought, which is poorly observable from PRI.

Graphical Abstract

1. Introduction

Photosynthetic CO2 uptake by the leaves is a key process determining plant productivity. A major part of the light absorbed by leaves is used in the photosynthetic light and associated electron transport reactions to form energy carriers ATP and NADPH, which are required to assimilate CO2 in the carbon reduction cycle [1]. The absorbed light energy is used to convert CO2 into carbohydrates, which are used as building blocks for plant growth. Processes involved in photosynthetic CO2 uptake are affected by environmental factors such as light intensity, water availability, and temperature [2]. Accurate measurement of photosynthetic CO2 uptake is possible at leaf level using gas-exchange technique or at ecosystem level using eddy-covariance systems. Moreover, there is increasing potential to use measurements of hyperspectral reflectance in monitoring the functioning and productivity of terrestrial ecosystems and their spatial and temporal variability. Remote sensing is, thus, regarded as an alternative method of estimating CO2 fluxes at large scales [3]. While net productivity and amount of ground biomass can be easily assessed using the normalized difference vegetation index (NDVI) and enhanced vegetation index (EVI), a review of the literature across a range of plant functional types and ecosystems indicates that light use efficiency (LUE) of vegetation is more closely associated with the photochemical reflectance index (PRI). The strength of the relationship between PRI and LUE, however, varies greatly with canopy structure, light conditions, and ontogeny [4].
PRI, typically calculated as [R531 − R570]/[R531 + R570] (where Rx is the reflectance factor at wavelength x), was developed to derive changes in foliar photochemistry [5,6]. PRI was later applied to physiological processes measured at leaf level [6,7] and to fluxes of ecosystems monitored at regional scale [8,9]. Originally, PRI was interpreted as a reflectance parameter enabling to detect the spectral signature of xanthophyll cycle pigments involved in the dissipation of excess light through non-photochemical quenching (NPQ; Demmig-Adams and Adams [10]), since the drop in reflectance factor at 531 nm is functionally related to the de-epoxidation state of the xanthophyll cycle pigments [11] and hence to efficiency of photosynthesis. PRI can track subtle LUE changes in an environment with changing light, or it can serve as a proxy for physiological variables of light-dependent photosynthetic reactions (e.g., quantum yield of photosystem II [PSII] or NPQ). Therefore, PRI is increasingly used as an index of photosynthetic performance in all types of vegetation.
More research is needed towards understanding the factors affecting these relationships, since PRI can explain only about 50–60% of LUE’s variability (reviewed by Garbulsky et al. [4]). Shortcomings that preclude PRI’s generalization to the scale of ecosystems as an estimator of LUE mainly originate from seasonal, acclimatory, or ontogenetic adjustments in pigment pool sizes. Extended periods of strong light, stress conditions, or leaf senescence are often accompanied by a decreased ratio of total chlorophylls to carotenoids (Chla+b/Carx+c), thereby influencing reflectance factors on each side of the green reflectance hump and indicating permanently increased needs for photoprotection by carotenoids [12]. PRI, therefore, varies not only with NPQ dynamics but also as a result of long-term adjustments in plant pigment pools associated with environmental conditions [13,14]. For example, Frechette et al. [15] showed that the changes of Chla+b/Carx+c under changing temperature constitute the main source of variation in the PRI–LUE relationship. Similarly, Chla+b/Carx+c ratios and, hence, PRI values, vary with position in vertical canopy profile and irradiance [16]. These differences reflect ontogenetic and acclimatory responses to prevailing conditions, but these adjustments may lead to substantial confusion in interpreting PRI. Other difficulties may occur due to interference in PRI signal produced by other plant pigments not involved in photoprotection mediated by xanthophyll cycle pigments [17], structural differences in canopies [18], and varying background effects [19]. Interference can be introduced by the cycle of lutein [20] and anthocyanin pigments [21].
Recognition of a link between leaf level PRI and Chla+b/Carx+c ratios prompted efforts to deconvolute the sources of variability in relationships between PRI and LUE and to improve LUE estimations from PRI. Separating the diurnally changing (facultative) and seasonally changing (constitutive) components of the PRI signal by introducing a differential diurnal PRI (ΔPRI) has been proposed as an alternative for obtaining information from spectral data [17]. It has been shown that subtracting PRI from a reference PRI (PRI0) at a low intensity of photosynthetically active radiation (PAR) can correct the signal for foliar pigment concentrations, thereby producing a more consistent relationship between PRI and LUE at a seasonal scale. Gamon and Surfus [22] first demonstrated that ΔPRI was correlated with the de-epoxidation state of xanthophyll-cycle pigments in sunflower leaves. The potential of ΔPRI to detect the effects of water availability [23,24,25] or nitrogen status [26] on photosynthetic performance was subsequently demonstrated.
Although the general link between PAR intensity and PRI is well known, the effects of interactions between PAR intensity and temperature or drought stress on variations in the relationships between PRI and LUE or other photosynthetic parameters are not yet sufficiently understood. Studies exploring the effects of PAR at different temperatures suggest that pigment acclimation is triggered not by PAR directly but by the balance between absorbed light energy and the energy used by photosynthesis [27]. This energy balance may depend on ambient temperature; even though light absorption and charge separation by reaction centers are independent of temperature under most natural conditions, the subsequent photosynthesis is markedly influenced by temperature. That, then, alters the distribution of energy and changes the activities of enzymes that metabolize carbon, particularly RuBisCO [28]. Recent studies have indicated that PRI is sensitive to drought stress, which is associated with de-epoxidation of the xanthophyll cycle pigments under water-limiting conditions [29,30]. Understanding the interactions amongst various environmental drivers that may affect the variation in PRI and evaluating ΔPRI’s potential for improving estimation of photosynthetic parameters are thus key tasks towards improving the prediction potential when estimating key ecosystem processes and functions.
This study was conducted to reveal the mechanisms behind the variation in relationships between photochemistry, CO2 fixation, and PRI in distinct environments. Such mechanisms were studied in saplings of Norway spruce (Picea abies) and European beech (Fagus sylvatica) by measuring PRI simultaneously with physiological parameters under changing environmental conditions of growth chambers with adjusted irradiance and temperature set-up. Reflectance factors and PRI of the examined saplings was measured from proximal distance using automated spectroradiometers. The selected method of measuring canopy reflectance factors offers advantages over the traditional approach of leaf-scale measuring reflectance factors using integrating spheres. Even as the traditional approach can provide us with accurate and reproducible measurements [31], it offers limited opportunities to change the climatic factors affecting the studied leaves. In addition, the setup of fixed irradiance levels allows us to investigate the constitutive role of foliar pigments in the relationship between PRI (ΔPRI) and LUE.
The main objective of this work was to analyze the relationships between the key physiological and reflectance parameters in coniferous (Norway spruce) and broadleaved (European beech) tree species in changing regimes of PAR and temperature, and in particular to: (i) study the impact of changing environment on leaf photosynthetic pigment contents, photosynthetic activity, reflectance factors and estimated PRI of trees; (ii) examine the ability of PRI to capture dynamic changes in processes related to photosynthetic carbon uptake in response to changing environmental conditions and leaf pigment contents; (iii) compare the ability of PRI and ΔPRI to monitor physiological responses to changing environmental conditions; (iv) examine opportunities to detect water stress using PRI and ΔPRI; and (v) re-evaluate the role of constitutive photosynthetic pigments (Chla+b/Carx+c) in establishing PRI, PRI0, and ΔPRI.

2. Materials and Methods

2.1. Plant Material

Four-year-old (0.5–0.6 m tall) saplings of European beech (F. sylvatica) and Norway spruce (P. abies) were planted during early spring in pots with dimensions 25 × 25 × 26 cm (11 L). The pots were filled with a mixture of Base Substrate Standard (Klasmann-Deilmann, Geeste, Germany) and quartz sand (fraction 0–2 mm) in a volumetric ratio of 2:1. The saplings were grown under natural conditions in the garden of the Global Change Research Institute in Brno, Czech Republic (49°12′N, 16°37′E) until they had completed sprouting. Plants were watered once per week with approximately 15 L m−2. The plants were then transferred to controlled conditions in FS-SI 4600 growth chambers (Photon Systems Instruments, Brno, Czech Republic), where they were kept for measurement purposes. Twenty-four saplings of each species were distributed equally into two growth chambers and used in the experiment. Canopy reflectance factors were measured from four saplings arranged in close proximity to one another to create a closed canopy complex. Another six saplings (out of 10 measured) were used for estimating mean physiology response to conditions inside of growth chambers. Leaves of the remaining 10 saplings inside of both growth chambers, which were not used for spectroradiometric and physiological measurements, were sampled randomly for foliar pigments analysis periodically on days of physiological measurements. Each pot was watered daily with 200 mL of deionized water.

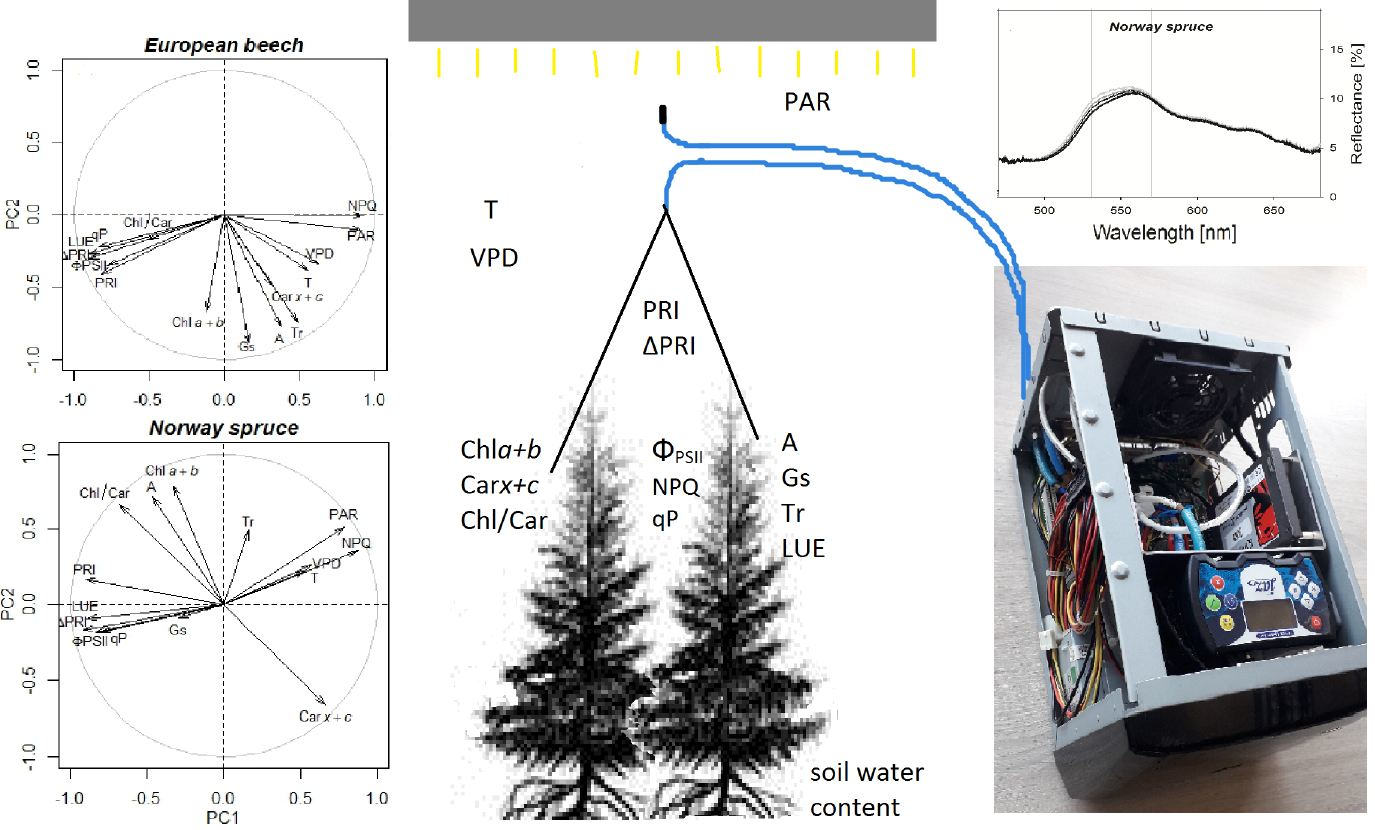
2.2. Experimental Set-Up

During the experiment, the spruce and beech saplings were grown in large (step-in) FS-SI 4600 growth chambers (PSI, Drásov, Czech Republic). Before the start of experimental regimes, the plants were acclimated for two weeks to low PAR and standard temperature conditions with a daily photoperiod of 14 h, PAR intensity of 100 µmol m−2 s−1, day/night temperatures of 23/18 °C, and relative air humidity of 65/80%. The acclimation period was followed by individual experimental regimes lasting 10–12 days each. A low PAR-intensity regime (LI) with a 14 h photoperiod was first applied. In this regime, PAR intensity was gradually increased to a maximum of 300 µmol m−2 s−1 (Table 1). The initial LI regime was followed by a regime with high PAR intensity (HI; daily maximum PAR of 1200 µmol m−2 s−1). On a daily basis, air temperature and relative humidity were adjusted in the same intervals as was the PAR intensity, thereby providing a daily course of environmental conditions (Table 1). The minimum night/maximum day temperatures were 12/21 °C for the low-temperature (LT) regime and 15/26, 22/35, and 24/37 °C for the high-temperature (HT) regimes (HT, HT2, and HT3, respectively). The irradiation and temperature regimes were joined to create combined regimes that followed in this order: LI–LT, HI–HT, HI–HT2, HI–LT, and HI–HT3. The irradiation and temperature changes were set up with the aim of inducing periodic changes in plant physiology and pigment content in response to increasing PAR intensity, rising temperature, and occasional cooling during the trees growth. Periods of regular watering were discontinued in the middle of the HI–LT regime to induce drought stress under the subsequent HI–HT3 regime.

2.3. Measurement of Spectral Reflectance

The spectral reflectance of the beech and spruce saplings was measured under light provided by LED Fyto-panels (PSI, Drásov, Czech Republic), which are mounted inside the growth chambers. The LED Fyto-panels provide uniform light distribution and high homogeneity of irradiances at different levels of intensity as shown in Supplementary Figure S1. The panels are producing intensity of PAR up to 1500 µmol m−2 s−1 at 1 m distance. LED panels allow linear intensity control by current regulation in the range from 1 to 100%. The change of intensity does not have impact on illumination directions and shade fractions of vegetation. Reflectance factors of canopies inside growth chambers were measured using DFOV system operating in hemispherical-conical configuration that uses a pair of JAZ spectrometers (Ocean Optics, Dunedin, FL, USA). The optical fiber tips for collecting data were placed approximately 1 m above the measured canopy and 0.4 m below the light source. Up-welling radiance was measured through QP600-UV-VIS optical fiber (Ocean Optics, Dunedin, FL, USA) with field of view 23°, down-welling irradiance was measured using the same type of optical fiber equipped with a CC-3-UV-T cosine corrector (Ocean Optics, Dunedin, FL, USA). Irradiance and reflected-light spectra were collected on 2048 channels between 340 and 1025 nm with spectral resolution (FWHM) of 1 nm. Within the range of the highest interest (500–600 nm), the spectral sampling interval of the spectrometers is 0.35 nm. The system of two spectrometers is operated through a computer unit connected via a USB port, what allows automated simultaneous operation of both units. Both of the components are placed in the minicomputer case, which offers basic protection and thermal stability of the measuring system. Entire system was placed inside of metallic box of greater dimensions, which offered higher thermal stability during measurements, as the instrument has been placed inside of growth chamber during the measuring campaign. Operation of fans in this metallic box was set-up to hold inner temperature between 22–28 °C to keep the components responsible for conducting and dispersing the light in static environment and thereby to increase stability of measured outputs [32]. Optimization of the DFOV system for measuring reflectance factors inside growth chambers was done using spectralon panel (Labsphere, North Sutton, NH, USA) reflecting down-welling radiance flux at maximum used irradiance 1200 µmol m−2 s−1. Integration time of the both measuring units has been adjusted to stop photon count after reaching a count of 60,000 digital units at a wavelength with maximal photon capture in a single scan to avoid non-linearity effects in the data and reach high stability of photo-generated outputs [33]. The peak of the signal at 60,000 counts lies below the threshold of 95% of the saturation level, which is for this spectrometer reached at counts level >64,000. Reflectance factors for calculating canopy vegetation indices were estimated from radiance data converted from digital counts measured using the two used spectrometers. Calibration of the two measuring spectrometers for acquisition of radiometric data was done using a calibration lamp HL-2000-CAL (Ocean Optics, Dunedin, FL, USA). Dark current signal for each measuring unit was recorded during the lamp calibration and later subtracted from measured signal in each data acquisition. The converting factors for calculating radiance data from digital count units measured using each spectrometer have been saved as a text files and later used for calculating radiance data from measurements at top of canopy irradiances levels 100, 200, 300, 600, and 1200 µmol m−2 s−1. The conversions to radiometric data include also dark current approximation for each measuring unit estimated during radiometric calibration and signal optimization to integration time. The calibration files for calculating radiance data have been created once before the measurements of beech and spruce saplings started. Similarly, measuring signal optimization by spectralon and dark current spectrum for each measuring unit was recorded only before the initiation of the measurements and the outputs have been saved as supporting information for calculating reflectance factors. The created files supported estimations of canopy reflectance factors during each entire measuring cycle of beech and spruce lasting for 45 days. Operation of spectrometers is ensured by the interface and control software provided by the manufacturer of the entire system (Safibra, Říčany, Czech Republic). The software in the computer is responsible also for calculation of reflectance factors at selected wavebands from measured irradiance and reflected radiance data. Varying integration time adjusted to irradiance level should secure high signal-to-noise ratio of measurements at varying light intensities. As a consequence of measurements taken with varying integration times taking into account dark current measured before the initiation of measurements; dark current subtracted from the measured signal may not match the instantaneous dark current signal in the sensor, what may lead to small modifications of vegetation indices at lower light intensities as dark current estimated at high irradiance level may be overestimated for these measurements [33]. We assume these differences should not affect significance of the conclusions coming out as outputs from the data measured at very distinct and static irradiance levels as the dark current represented less than 0.2% of the signal upon lamp calibration. Direct communication between the JAZ spectrometers and computer ensured automated spectral reflectance measurements with temporal resolution of 1 min starting at 07:30 and ending at 19:00. Each saved spectrum was an average calculated directly in the instrument from 50 collected spectra.
PRI was calculated following Gamon et al. [5] as:
PRI = (R531 − R570)/(R531 + R570),
where R531 is the average reflectance factor from wavelengths 530.37, 530.73, 531.08, 531.44, and 531.79 nm, and R570 is the average reflectance factor from wavelengths 570.31, 570.67, and 571 nm. The measured reflectance factors at selected wavebands have been averaged to reduce influence of multicollinearity between neighboring wavebands. This procedure helped to reduce the noise in PRI value originating from the hyperspectral configuration of the used spectrometers (not shown) and increased the stability of PRI at the selected irradiances (Figure 1).
Using PRI0 as a proxy for each day’s steady state pigment content, as proposed by Liu et al. [34], a ΔPRI was computed to account for pigment composition changes in PRI throughout the entire measuring period. ΔPRI for each acquisition of spectral data was calculated as the difference between PRI measured during the day and PRI0 as:
ΔPRI = PRI − PRI0
PRI0 was estimated from measurements taken early in the morning under low PAR intensity (100 µmol m−2 s−1) and given temperature (Table 1) providing minimal de-epoxidation state of xanthophyll cycle pigments. We averaged PRI0 data measured in the final 5 min of the initial low PAR period in order to account for an effect from gradual activation of the photosynthetic system in low light that can reduce the need for non-photochemical quenching and decrease xanthophyll de-epoxidation [35].

2.4. Measurement of Gas Exchange and Chlorophyll Fluorescence

Gas exchange and chlorophyll fluorescence were measured on the second and final day of each regime. Measurements were collected five times per day at PAR intensities of 300, 600, 1200, 600, and 300 µmol m−2 s−1 for the HI regimes and 200, 250, 300, 250, and 200 µmol m−2 s−1 for the LI regimes after 30 min acclimation to the actual irradiation and temperature conditions. Leaves and needles in the uppermost part of the sapling crowns were measured using the LI-6400 XT portable photosynthesis system (LI-COR Biosciences, Lincoln, NE, USA) equipped with an LI-6400-02B leaf assimilation chamber for estimating actual photosynthesis rate (A), stomatal conductance (Gs), and transpiration (Tr). CO2 concentration (400 ppm), PAR intensity, temperature, and relative humidity were adjusted to be identical to the actual conditions in the growth chamber. Flow was fixed at 500 µmol s−1 for measurements in each treatment of both species. The effect of pigment content on PAR absorption under individual irradiance-temperature regimes was tested by changes in Green NDVI calculated from wavebands 555 and 677 nm. The changes have not been found significant, therefore, LUE has not been corrected for changes in absorbed PAR and chlorophylls content. LUE was calculated as the ratio of the rate of CO2 assimilation (A) and actual irradiance level as:
LUE = A/PAR
Chlorophyll fluorescence was measured using a PAM-2500 portable chlorophyll fluorometer (Heinz Walz, Effeltrich, Germany). The measurements were conducted on the same leaves as those used for the measurements of gas exchange. Chlorophyll fluorescence measurements were performed before each set of gas exchange measurements. The minimum (F0) and maximum (Fm) chlorophyll fluorescence in a dark-adapted state were measured before dawn (prior to 07:30) and were used for calculating the maximum quantum yield of PSII photochemistry (Fv/Fm), as:
Fv/Fm = (FmF0)/Fm
Actual quantum yield of PSII photochemistry (ΦPSII) in a light-adapted state, non-photochemical fluorescence quenching (NPQ), and photochemical fluorescence quenching (qP) were calculated as described by Genty et al. [36] from the steady state (Fs), light-adapted maximum (Fm′), and light-adapted minimum (F0′) chlorophyll fluorescence of leaves adapted to the conditions of PAR intensity and temperature as:
ΦPSII = (Fm′ − Fs)/Fm
NPQ = (FmFm′)/Fm
qP = (Fm′ − Fs)/(Fm′ − F0′)
Maximum chlorophyll fluorescence emissions in both the dark- and light-adapted states (Fm and Fm′) were obtained after application of the saturating light pulse for 0.8 s and producing an incident PAR intensity >3500 µmol m–2 s–1. A weak pulse of far-red light was applied to leaves kept in darkness to determine F0′.

2.5. Analysis of Photosynthetic Pigments

The content of photosynthetic pigments was determined throughout the experiment on the days of the physiological measurements to study the impact of changes in total chlorophylls and carotenoids on PRI variation. The contents of the total chlorophylls (Chla+b) and total carotenoids (Carx+c) were measured with a Specord 500 spectrophotometer (Analytik Jena, Jena, Germany) from the supernatant obtained after centrifugation (for 3 min at 480 g) of pigments extracted in 80% acetone with a small amount of MgCO3. The pigment contents were determined using the equations by Lichtenthaler [37] from absorbance measured at 470, 646.8, 663.2, and 750 nm.

2.6. Data Analysis

The data for the individual parameters were tested for normality using the Kolmogorov–Smirnov test before analysis of variance (ANOVA). A one-way fixed-effect ANOVA model was used for general analysis as to the effects of temperature and light regimes. A Tukey’s post-hoc (p < 0.05) multiple range test was used to compare the differences between means. Homogeneous groups with no significant differences were identified in graphs by the same letters. The ANOVA analyses were conducted using Statistica 12 (StatSoft, Tulsa, OK, USA).
In order to visualise and quantitatively summarise the multivariate covariation of optical variables (PRI and ΔPRI) and major vectors of environmental factors, leaf pigment contents, and physiology measures we performed a principal component analysis (PCA) on the correlation matrix of the variables, plotting correlation circle of the principal component analysis between 15 estimated variables. We used PCA axes as PRI and ΔPRI correlates of all variables to eliminate collinearity in the predictors [38]. Since non-linear relationships have been identified between most of the key physiology variables and reflectance indicators, a logarithmic regression model was then used to study the relationships between ΦPSII, NPQ, LUE, PRI, and ΔPRI. Steady-state PRI and ΔPRI are presented as means of six subsequent reflectance measurements after the PRI had stabilized at a given irradiation and temperature (ca. 30–60 min after change of PAR intensity and temperature). A linear regression model was used to study the impact of foliar Chla+b/Carx+c on PRI, PRI0, and ΔPRI. The significance of the statistical model was tested at probability levels p < 0.05, p < 0.01, and p < 0.001 using ANOVA. All regression analyses and PCA were conducted using R 3.1.1 (R Foundation for Statistical Computing, Vienna, Austria).

3. Results

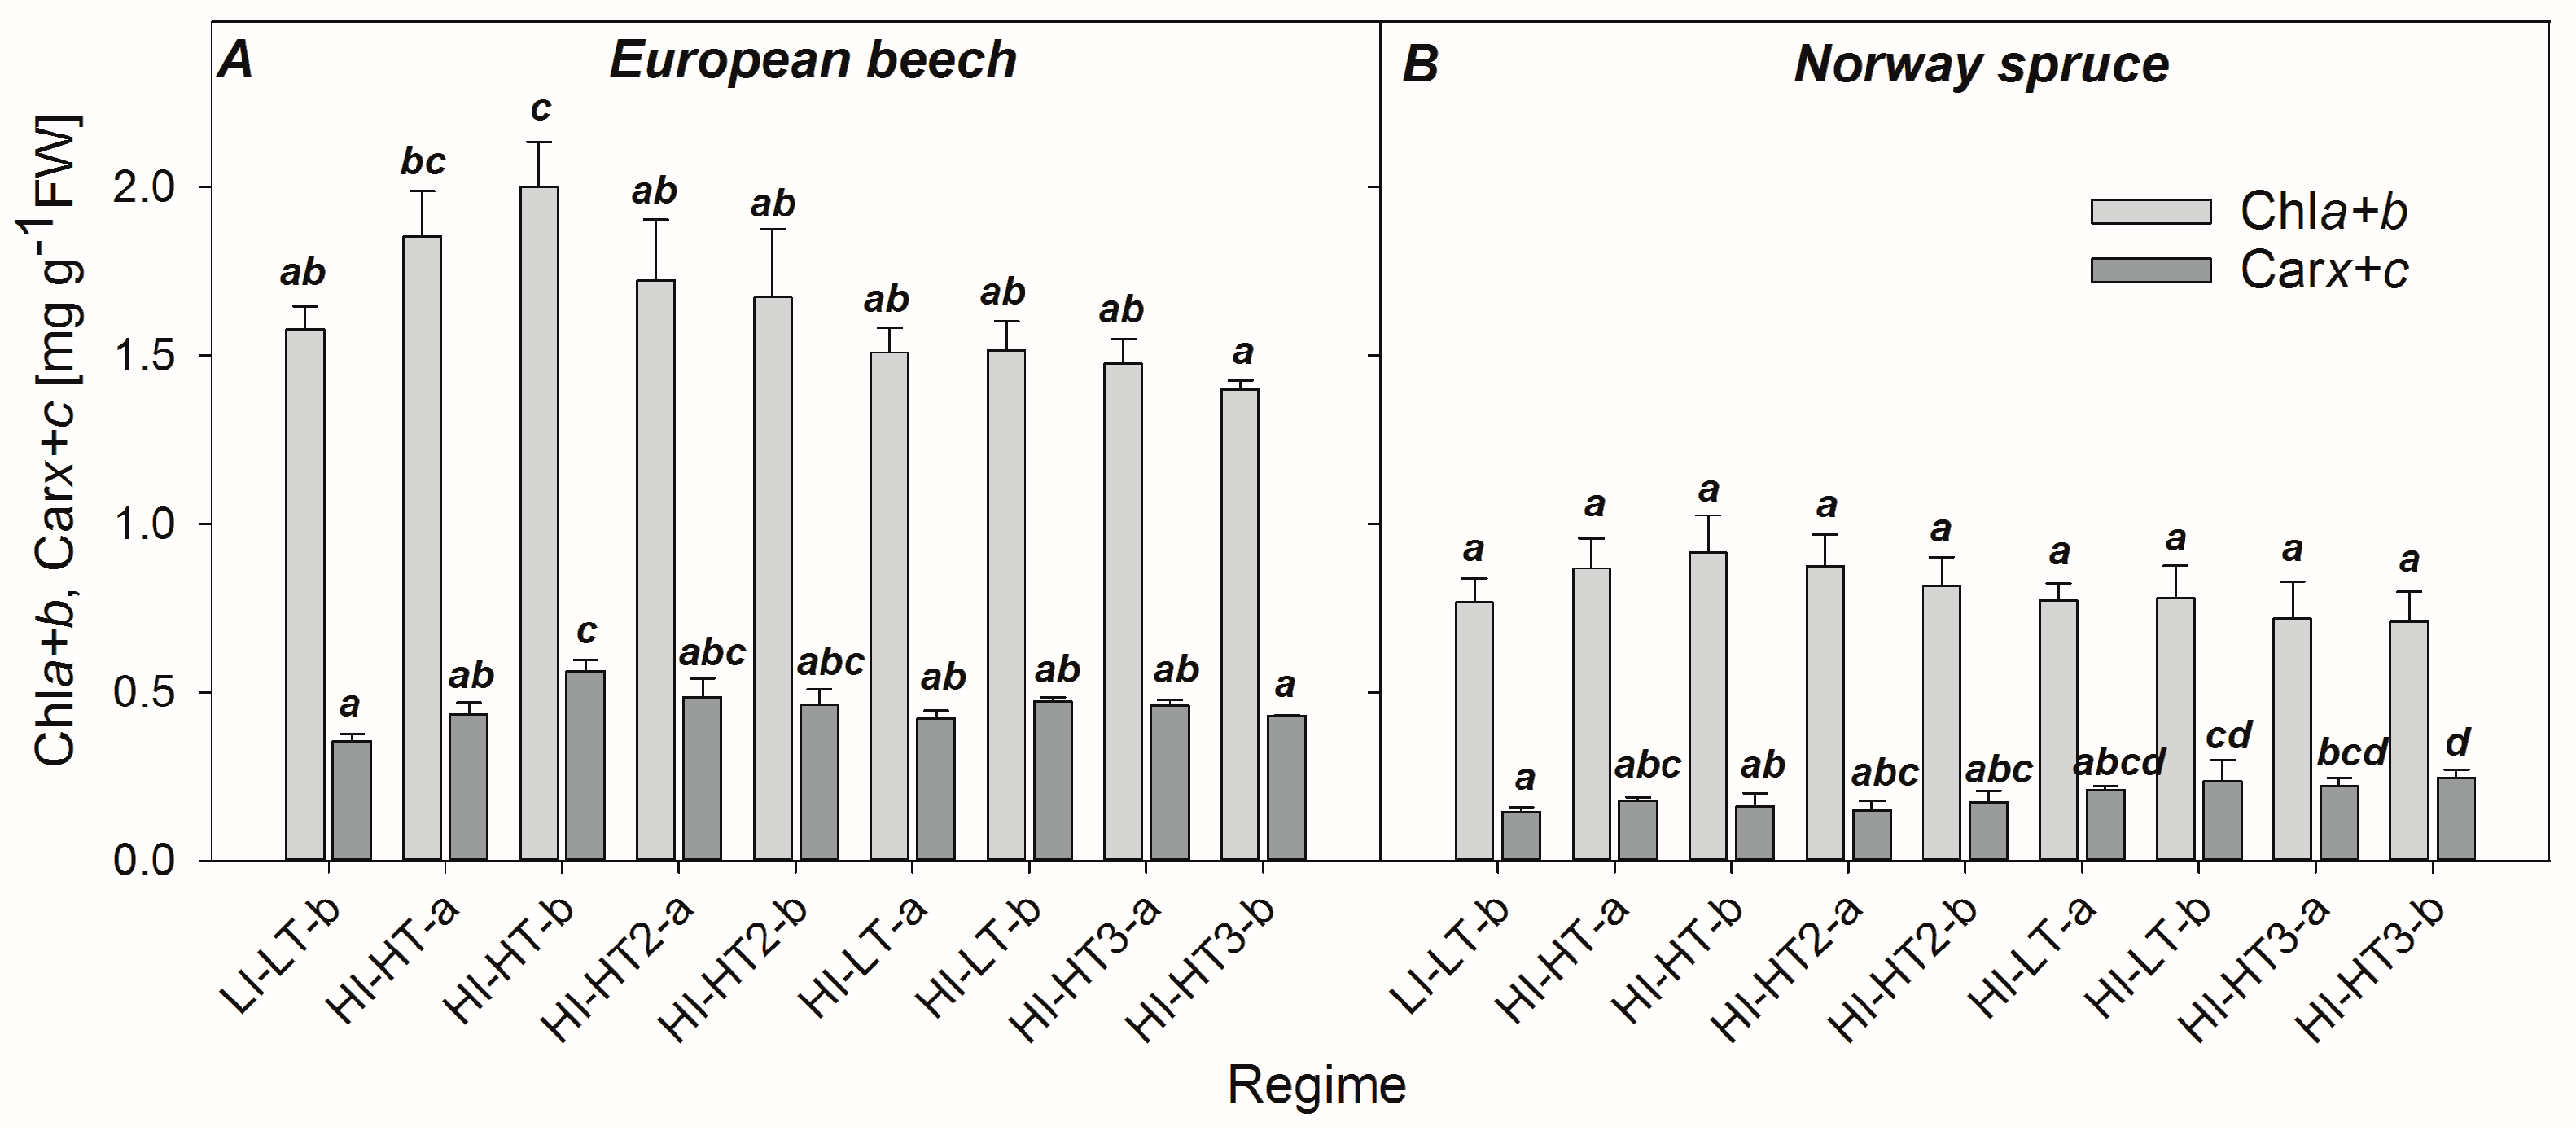
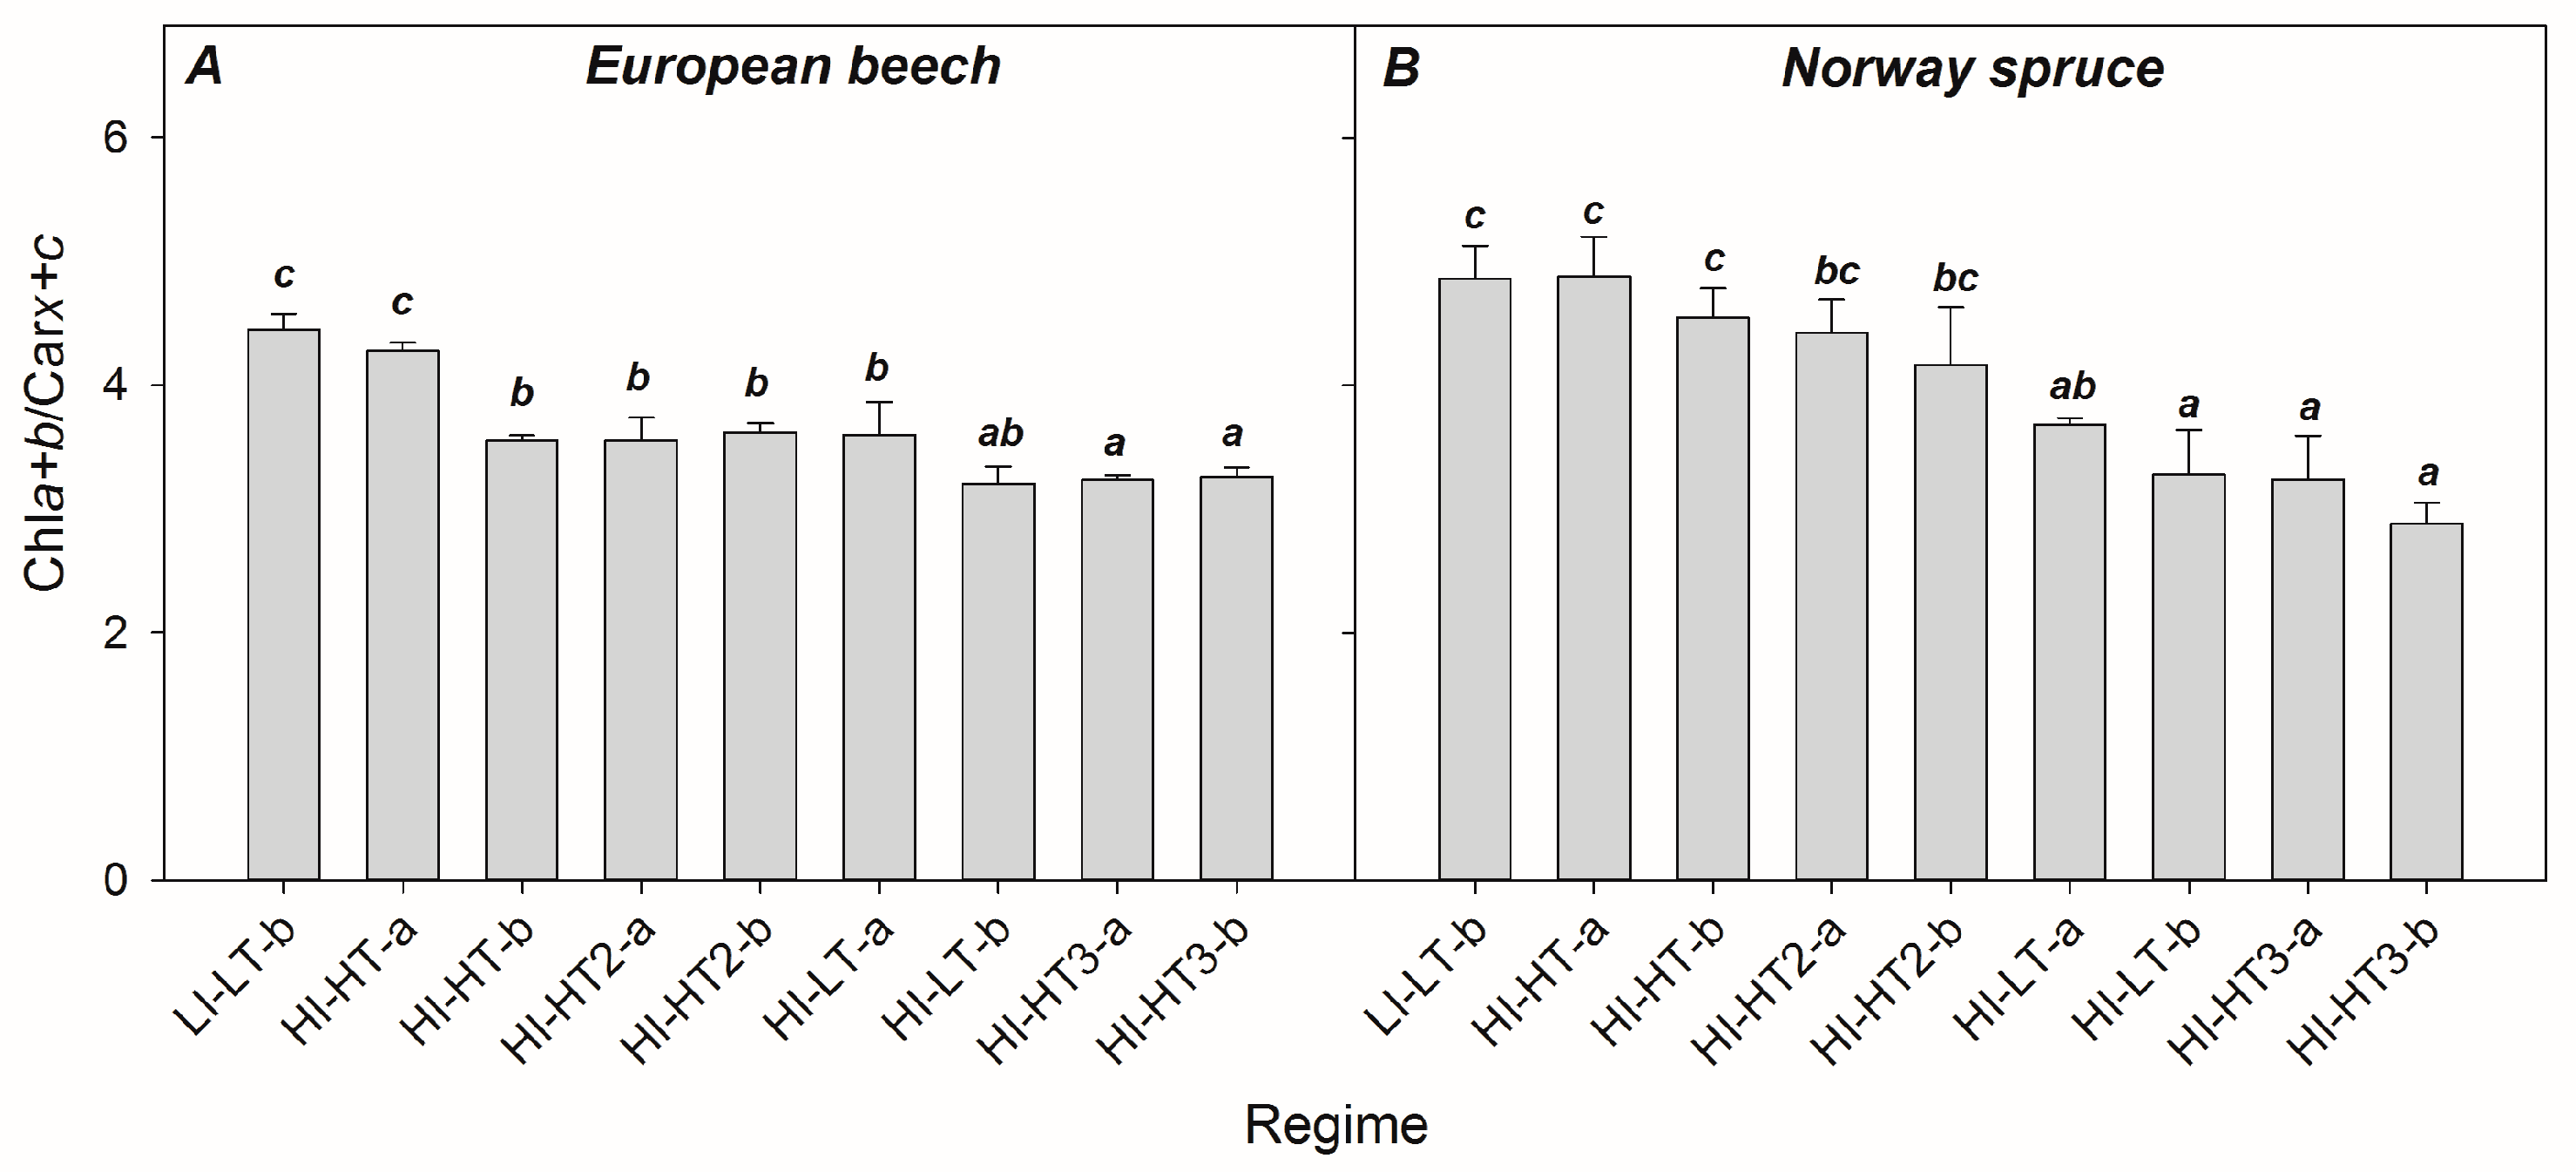
3.1. Changes in Content of Photosynthetic Pigments

The saplings of both species adjusted their foliar chlorophyll contents throughout the experiment in response to changing environmental conditions. Chla+b content changed significantly only in beech, but the pattern of response to PAR and temperature regimes was similar also for spruce (Figure 2). The transition from LI–LT to HI–HT significantly increased Chla+b content in beech, but the subsequent high temperature (HI–HT2) regime led to decline of Chla+b content. Although other changes in Chla+b content were not statistically significant, both regimes HI–LT and HI–HT3 did lead to its slight decrease.
Similarly to Chla+b content, the Carx+c content increased significantly during transition from the LI–LT to HI–HT regime, but only in beech (Figure 2). The subsequent decline in Carx+c was statistically significant first under the HI–LT regime when compared to HI–HT. In spruce, on the other hand, the Carx+c content increased under the HI–LT regime and this increase was statistically significant in comparison to the LI–LT and also the HI–HT regime. Chla+b/Carx+c decreased during the experiment from 4.5 and 4.9 to 3.3 and 2.9 in beech and spruce, respectively (Figure 3). The dynamics of the response of the Chla+b/Carx+c ratio differed between beech and spruce. In beech, Chla+b/Carx+c decreased in two steps, first under the HI–HT and then under the HI–LT regime. In spruce, continuous decline of Chla+b/Carx+c was observed throughout the experiment.

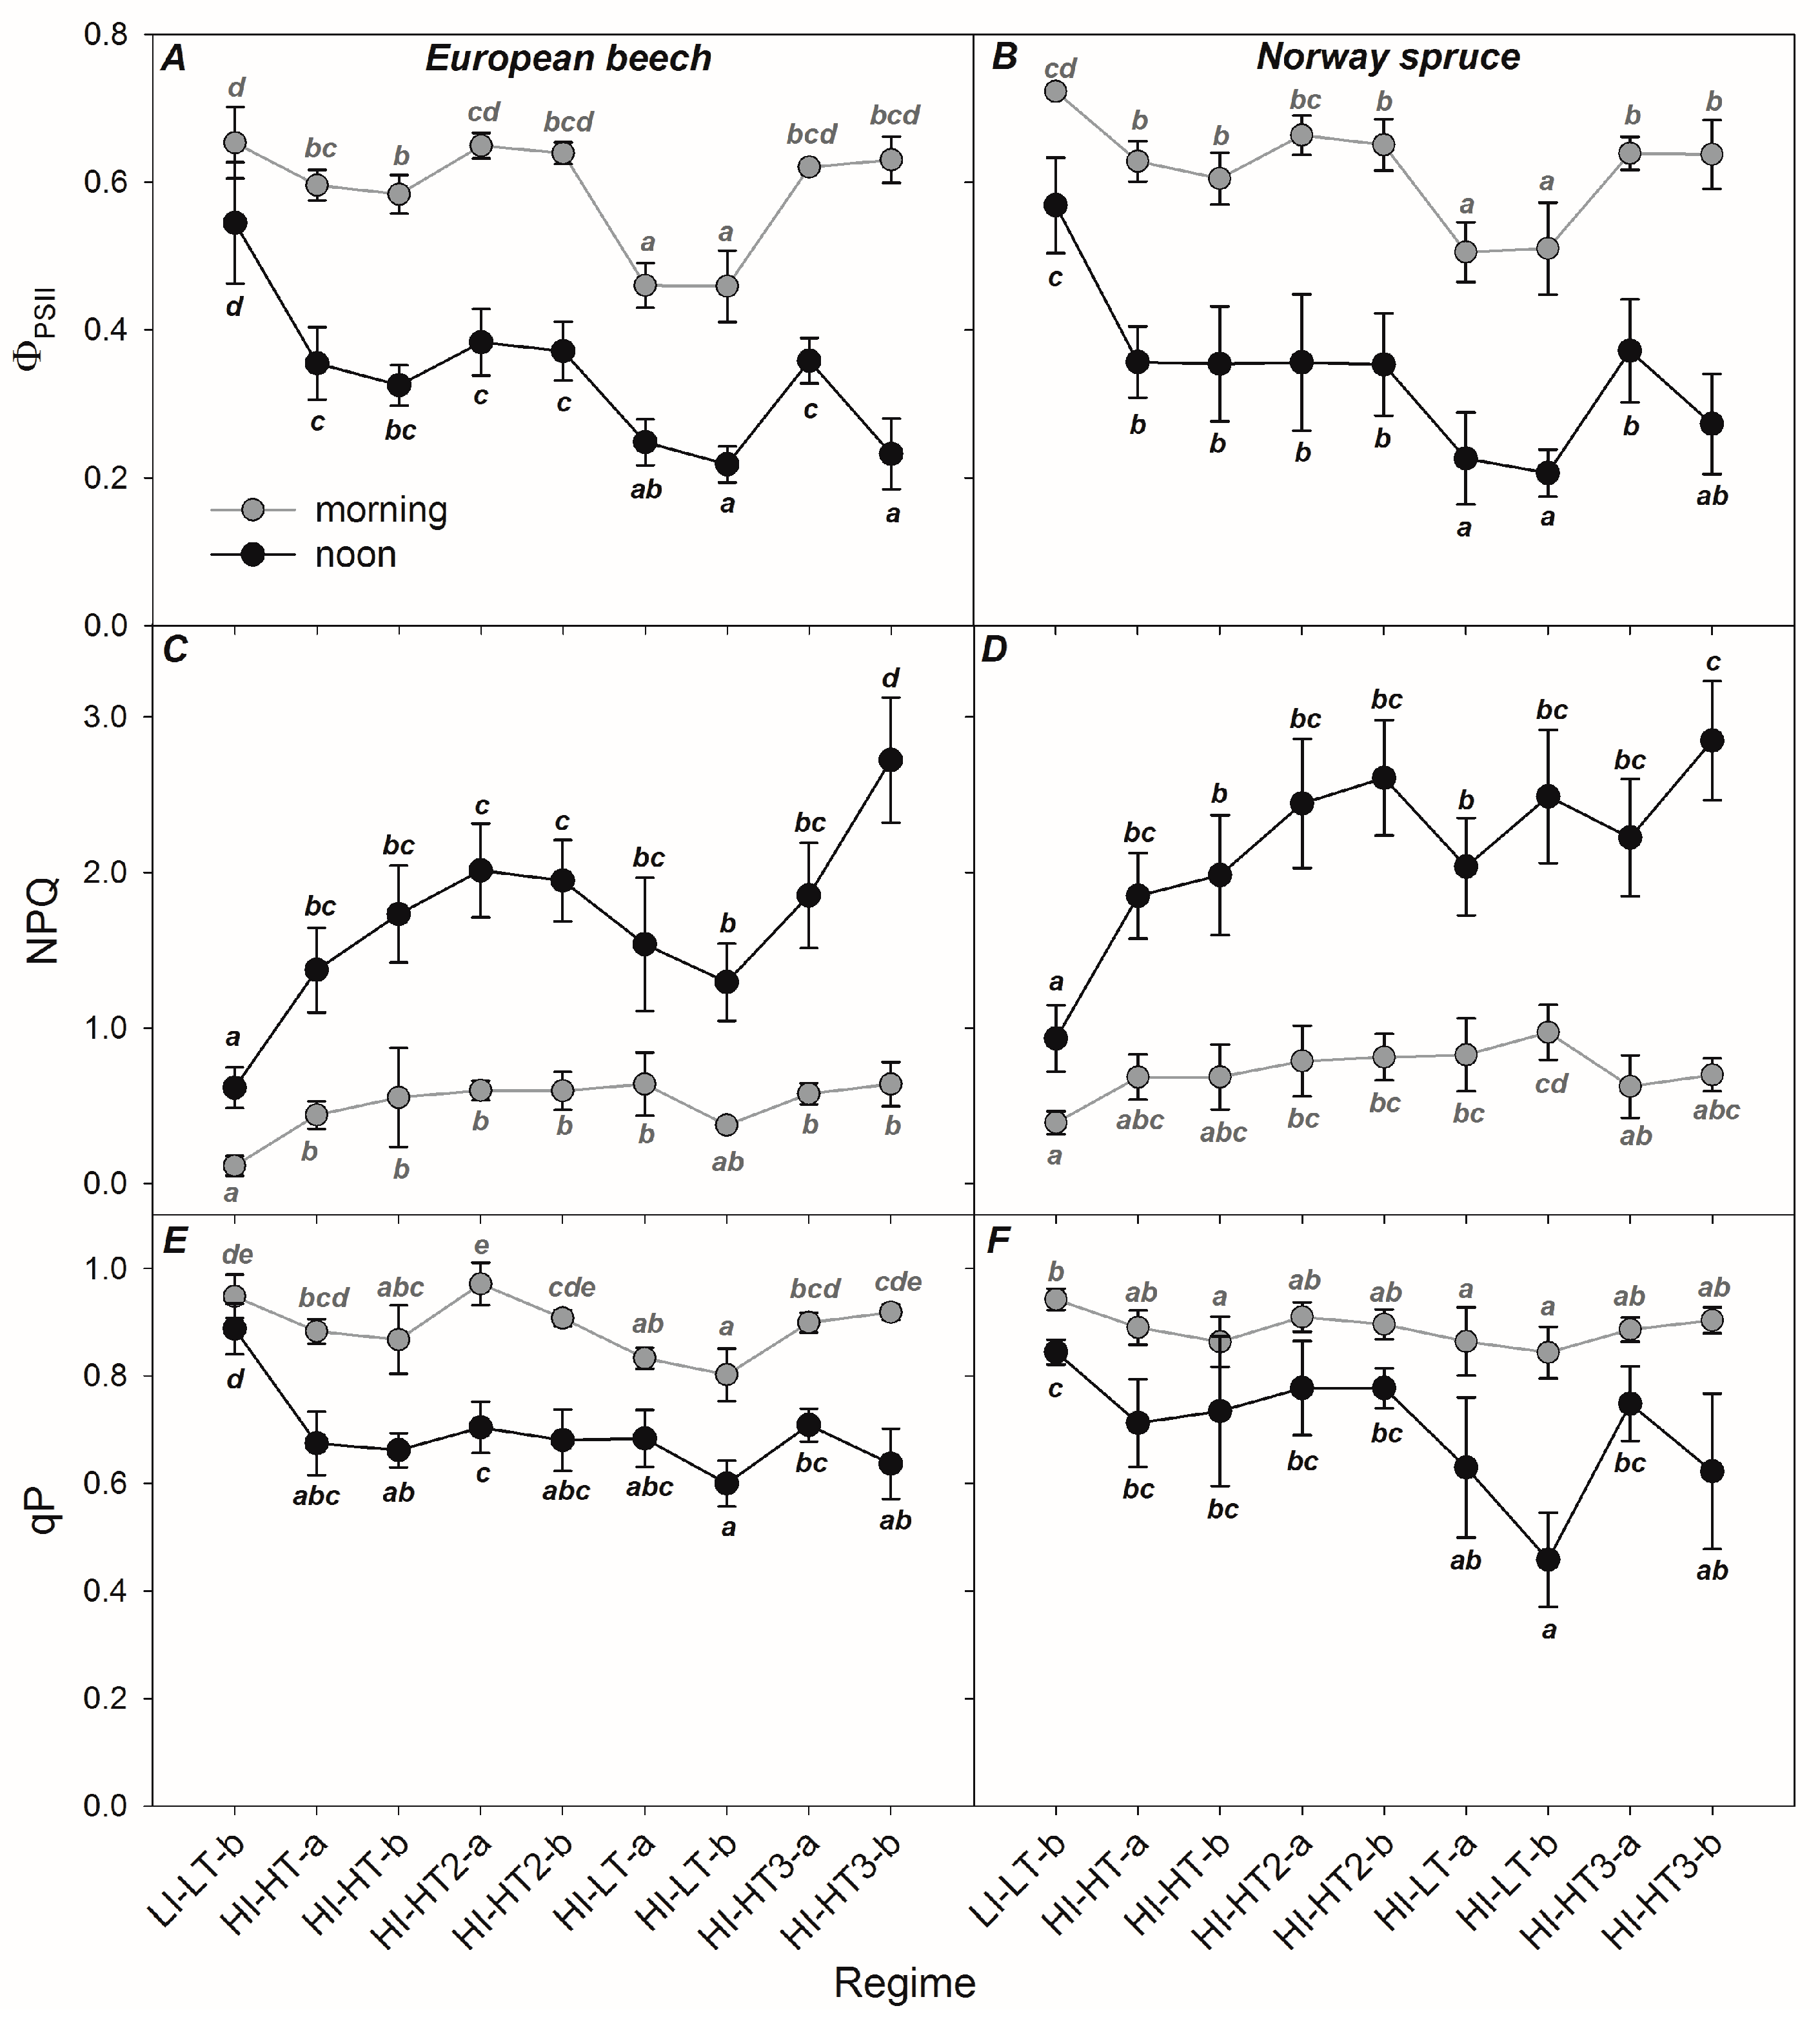
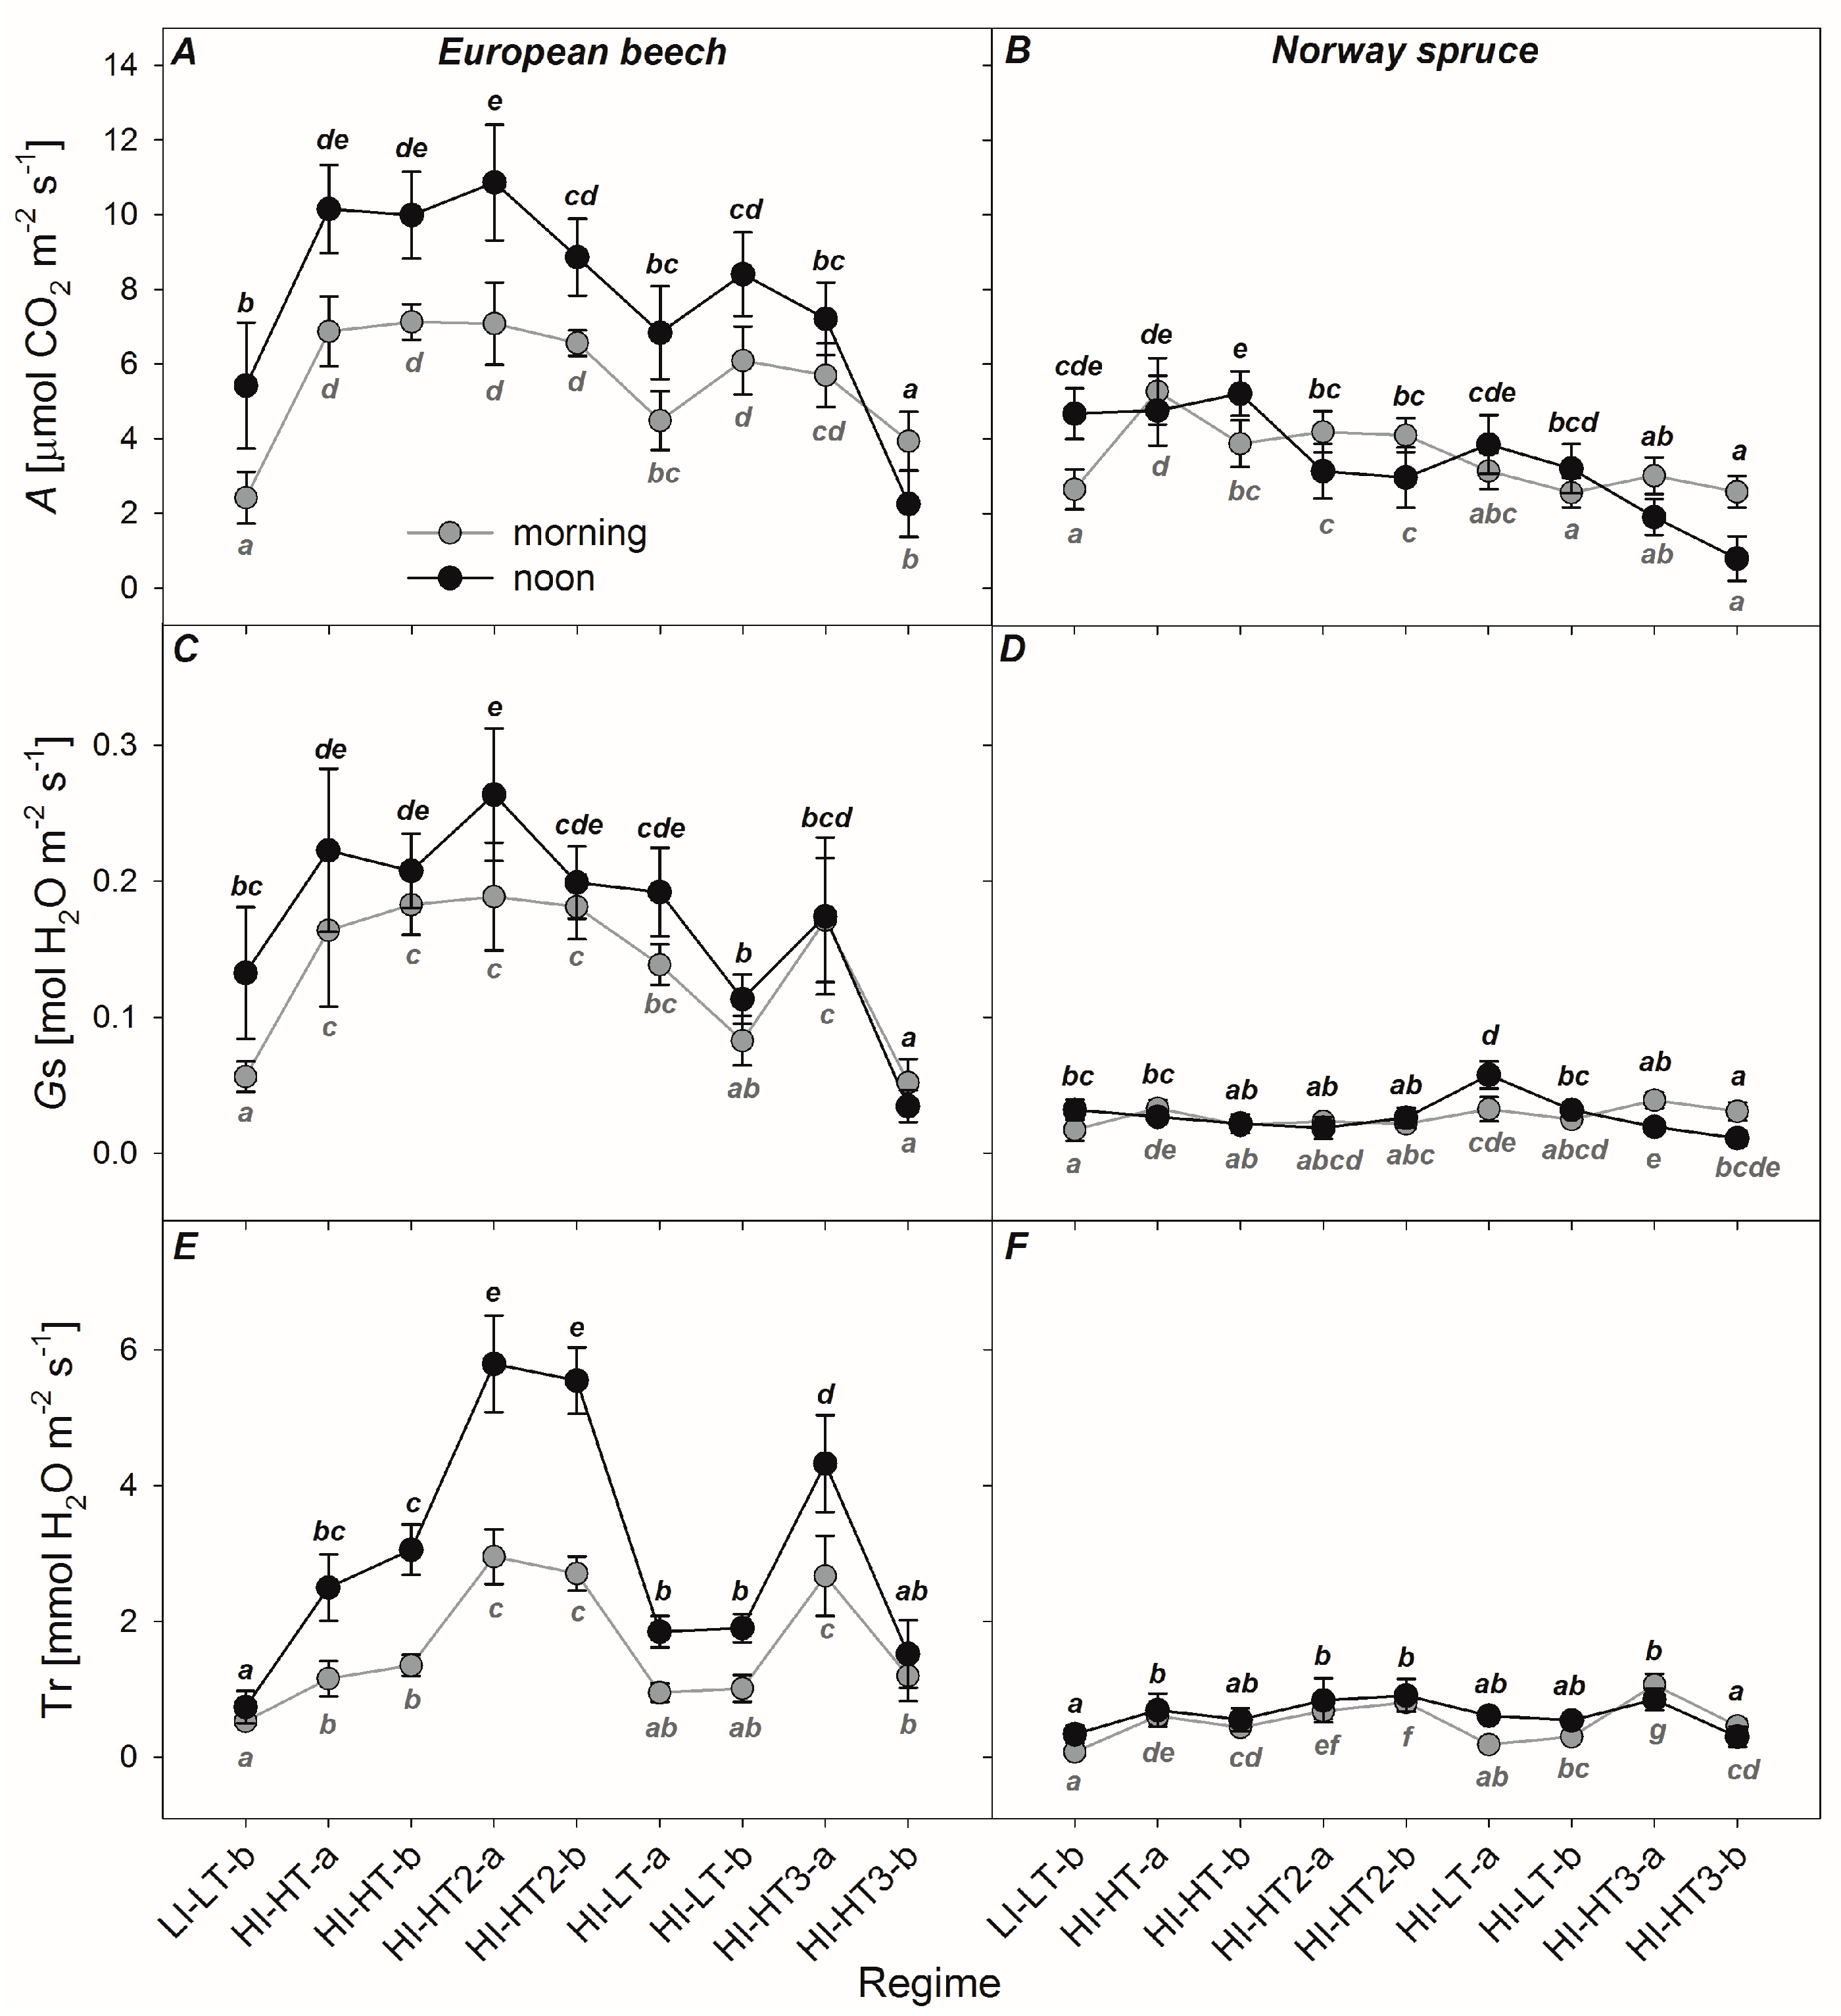
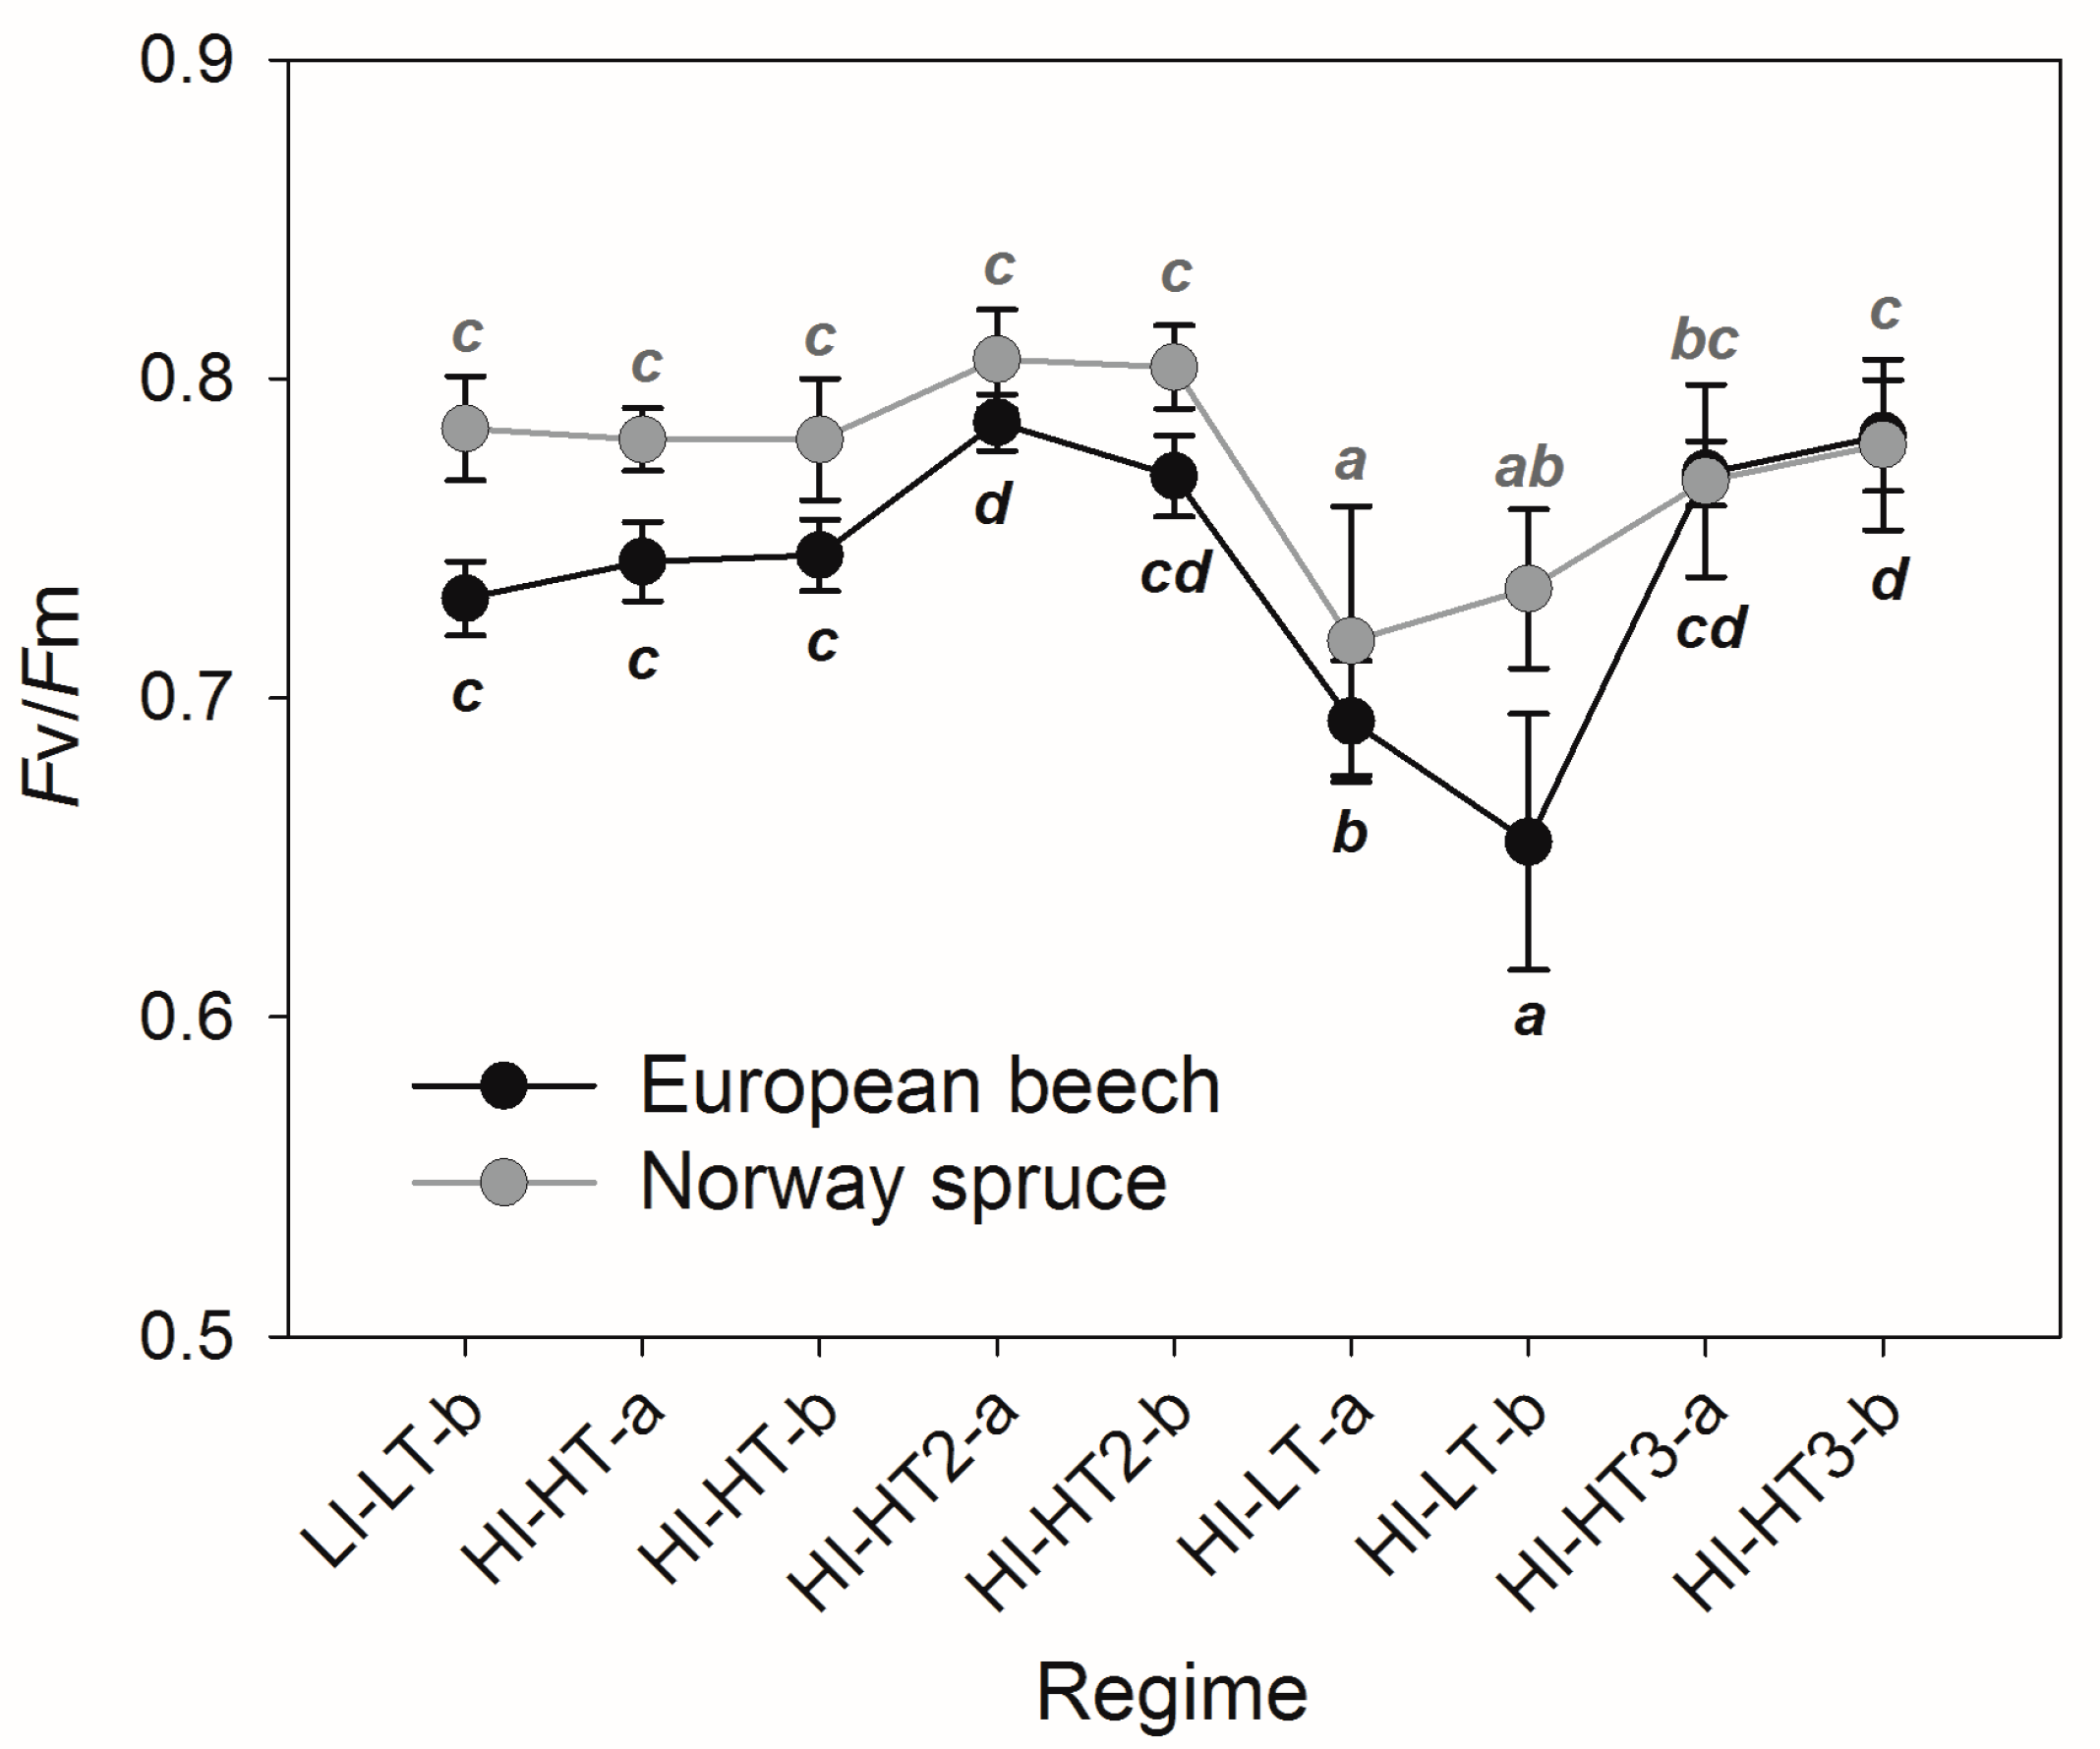
3.2. Responses of the Photosynthetic Parameters

Fv/Fm followed similar dynamics in the spruce and beech saplings throughout the experiment (Figure 4). Fv/Fm remained stable during LI–LT and HI–HT at around 0.74 and 0.78 in beech and spruce, respectively. In beech, Fv/Fm increased significantly (p < 0.05) to near 0.8 immediately after the temperature increased under HI–HT2 (up to 35 °C). Similar, but not statistically significant, increase in Fv/Fm under HI–HT2 was observed in spruce. Subsequent exposure of the saplings to low temperatures under HI–LT decreased Fv/Fm to 0.69 in beech and 0.72 in spruce, which values were significantly lower than those measured under HI–HT conditions (p < 0.05). The HI–HT3 regime returned Fv/Fm to values comparable to those of HI–HT2, and these remained relatively stable thereafter until the end of the experiment.
ΦPSII had similar dynamics as did Fv/Fm under any given PAR and temperature regime, albeit with different magnitudes depending on the PAR intensity at which this parameter was measured (Figure 5A,B). ΦPSII was, therefore, higher in the morning at low PAR intensities and declined with increasing PAR intensity. ΦPSII also responded more negatively to drought and high temperature (HI–HT3) under high irradiance when compared to HI–HT2 and early HI–HT3 (p < 0.05). Similarly to ΦPSII, NPQ was affected more by the regimes of PAR intensity and temperature when measured at maximum PAR intensity near noon than when measured in the morning (Figure 5C,D). NPQ increased significantly (p < 0.05) at the transitions from LI–LT to HI–HT and from HI–LT to HI–HT3. Conversely, NPQ decreased during the transition from HI–HT2 to HI–LT (p < 0.05 in beech). Changes in temperature, thus, played a crucial role in the NPQ responses. The differences in NPQ were generally more pronounced in the beech saplings compared to spruce. In contrast, changes in qP under different conditions of PAR intensity and temperature were more pronounced in the spruce saplings (Figure 5E,F). qP decreased particularly under the transitions from LI–LT to HI–HT and from HI–HT2 to HI–LT. The decrease in qP during transition from HT2 to LT was not statistically significant in beech, but it was significant in spruce (p < 0.05). qP first increased under HI–HT3, but it later decreased. Again, these changes occurred primarily at the peak PAR intensities near noon.
CO2 assimilation rate (A) increased under higher PAR intensities and temperatures (HI–HT) and decreased under lower temperatures and given irradiance (HI–LT; Figure 6A,B). Decreasing temperatures under HI–LT reduced A in both species as compared to the values under HI–HT. A decreased further after transition to the regime of stress from drought and high temperature (HI–HT3, p < 0.05). Distinct responses of A to high temperature treatments HI–HT2 and HI–HT3 were observed in beech and spruce. A decreased upon exposure to high temperatures and high irradiance (around noon) in spruce (p < 0.05), but increased in beech. In these conditions, A was rather stimulated in beech, as indicated by the positive response of stomatal conductance to higher temperature in this species (Figure 6C). Final exposure to HI–HT3 stress initially increased and then significantly decreased Gs of beech leaves in a water-limited environment. Applied principal component analysis revealed quite good agreement between A, Gs, and transpiration rate (Tr) in beech, but poor explanation is given for the photosynthetic rate in spruce needles by Gs and Tr. The high midday PAR intensity and high temperatures under HI–HT and HI–HT2 led to stomatal closure in spruce, and the low-temperature HI–LT regime rapidly increased Gs. Final drought and high temperature stress under HI–HT3 produced a similar decrease in Gs for midday observations as in beech.
The increased PAR intensities and temperatures under HI–HT and HI–HT2 increased the transpiration rate (Tr) in both species (Figure 6E,F). Tr gradually increased until HI–HT2, subsequently declined when the temperature decreased (HI–LT), and then increased again in response to the temperature rise under HI–HT3 (all changes were statistically significant at p < 0.05). Tr, however, decreased rapidly in both species at the end of HI–HT3.

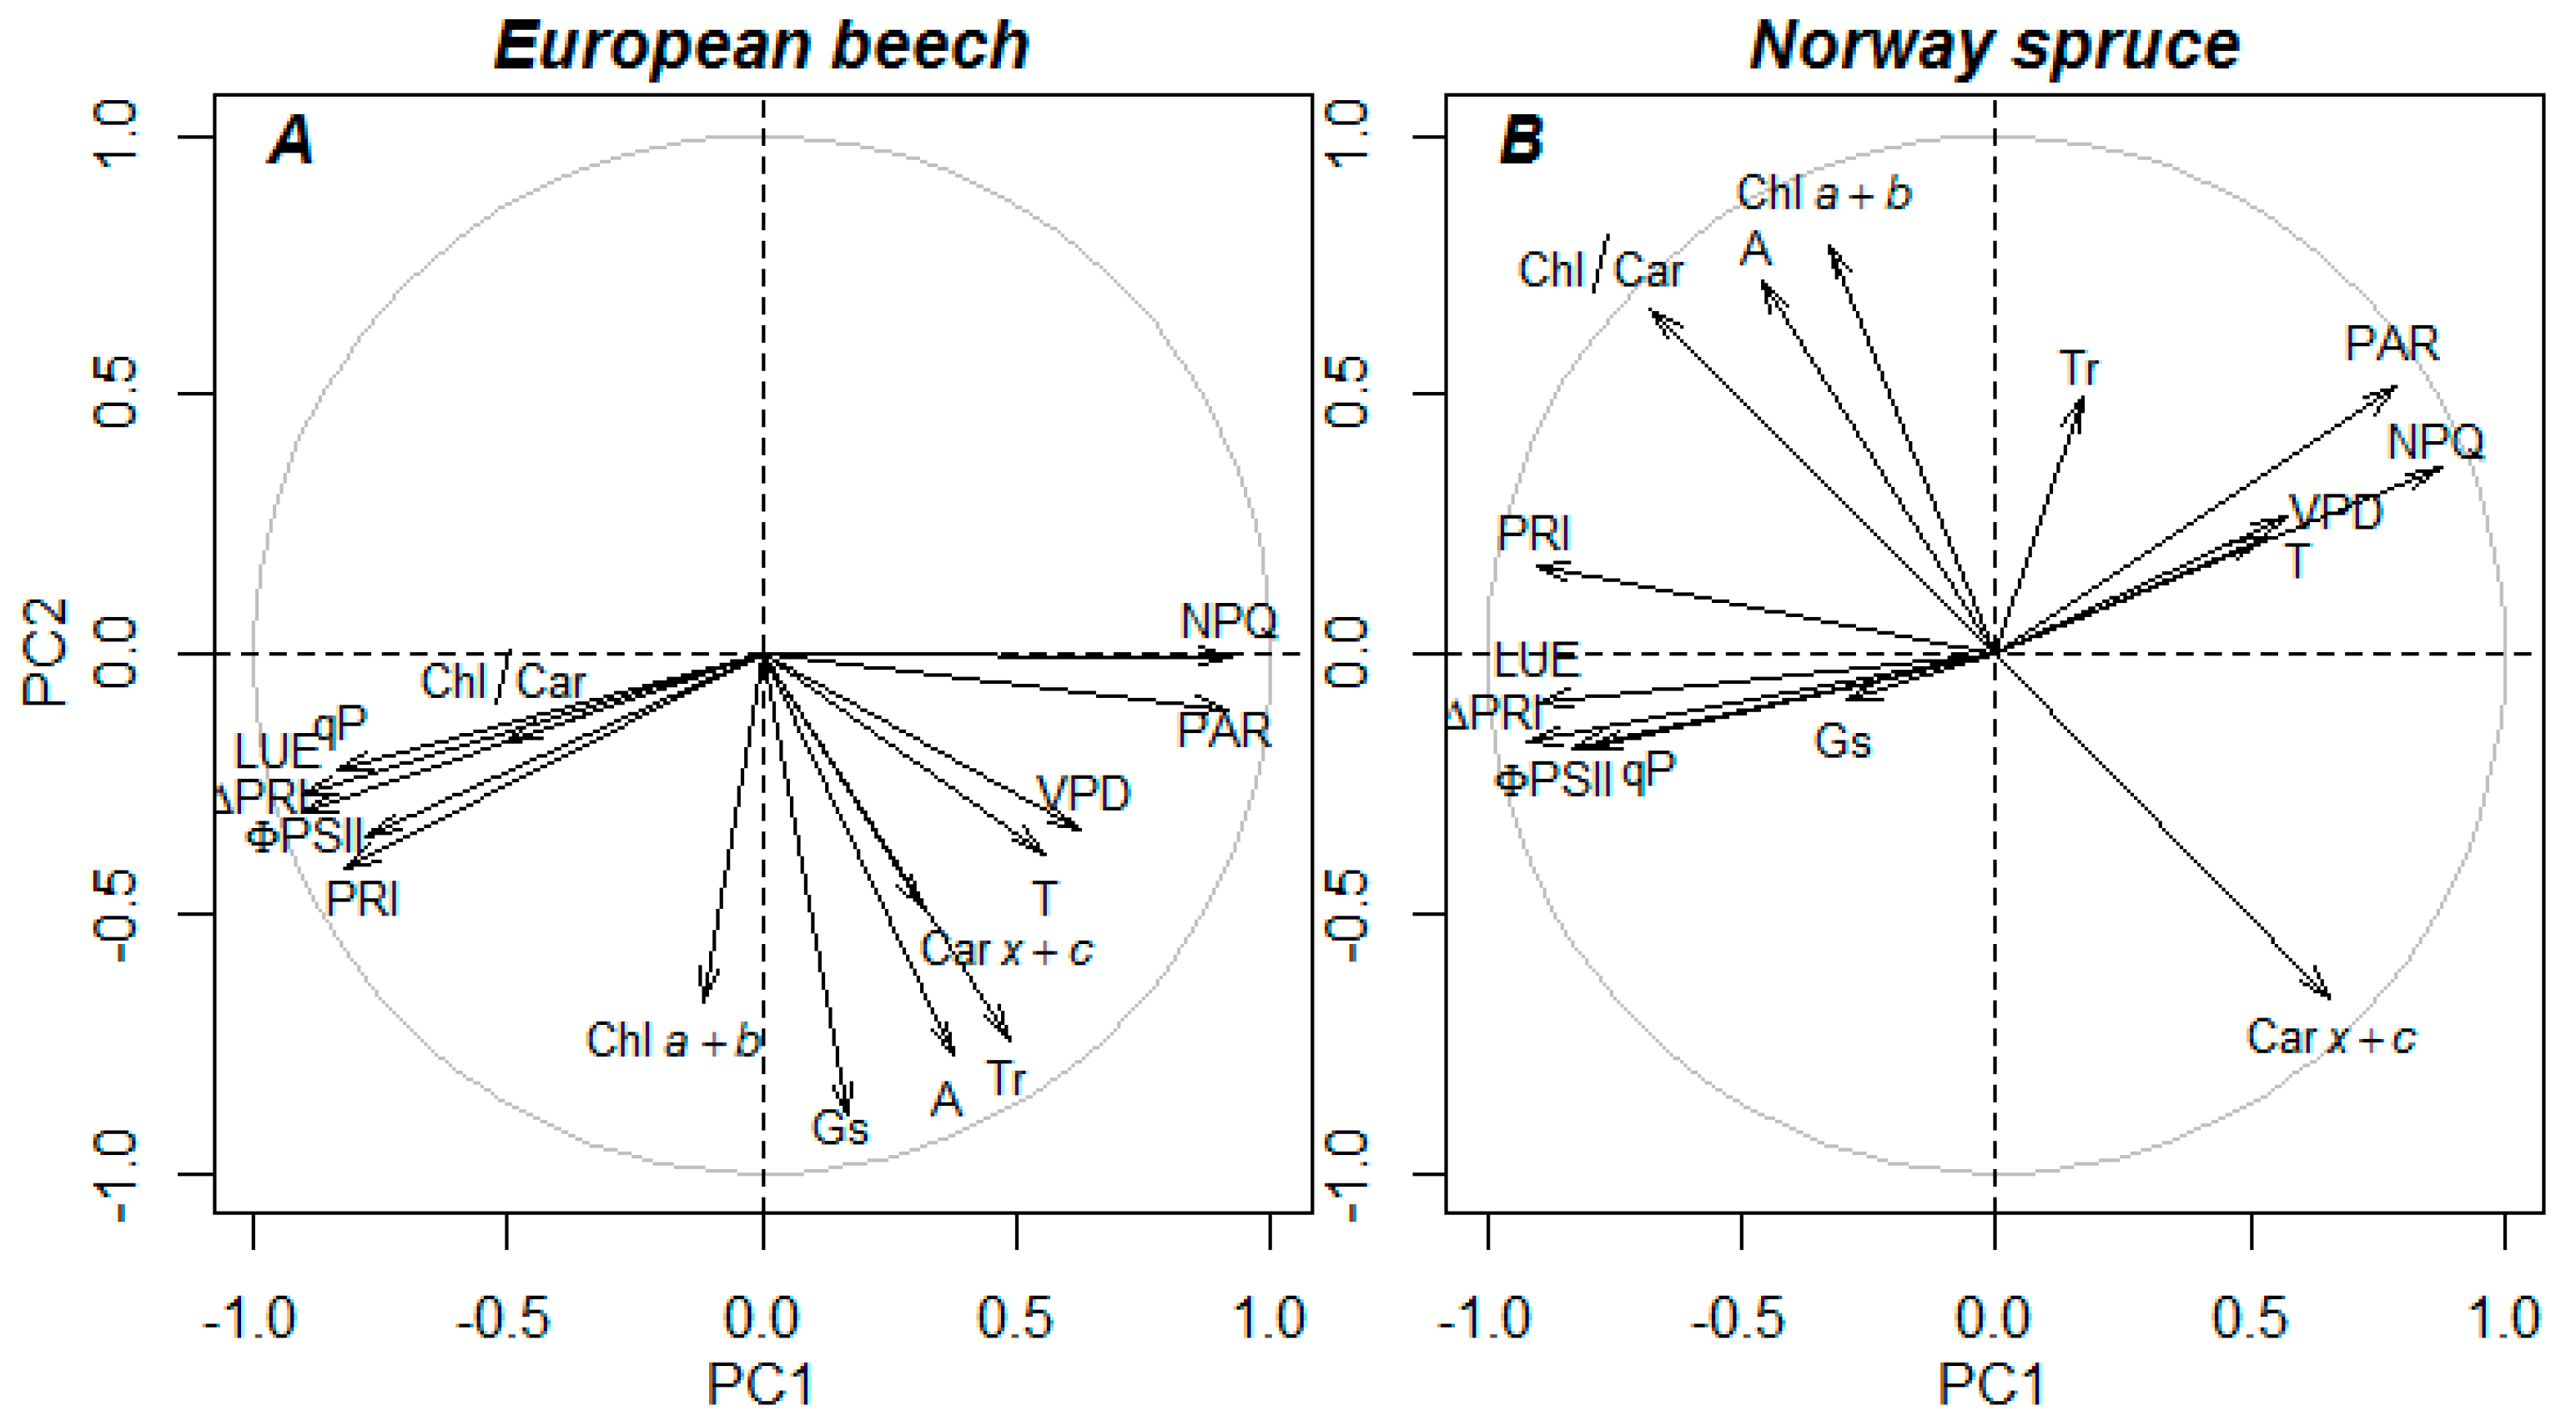
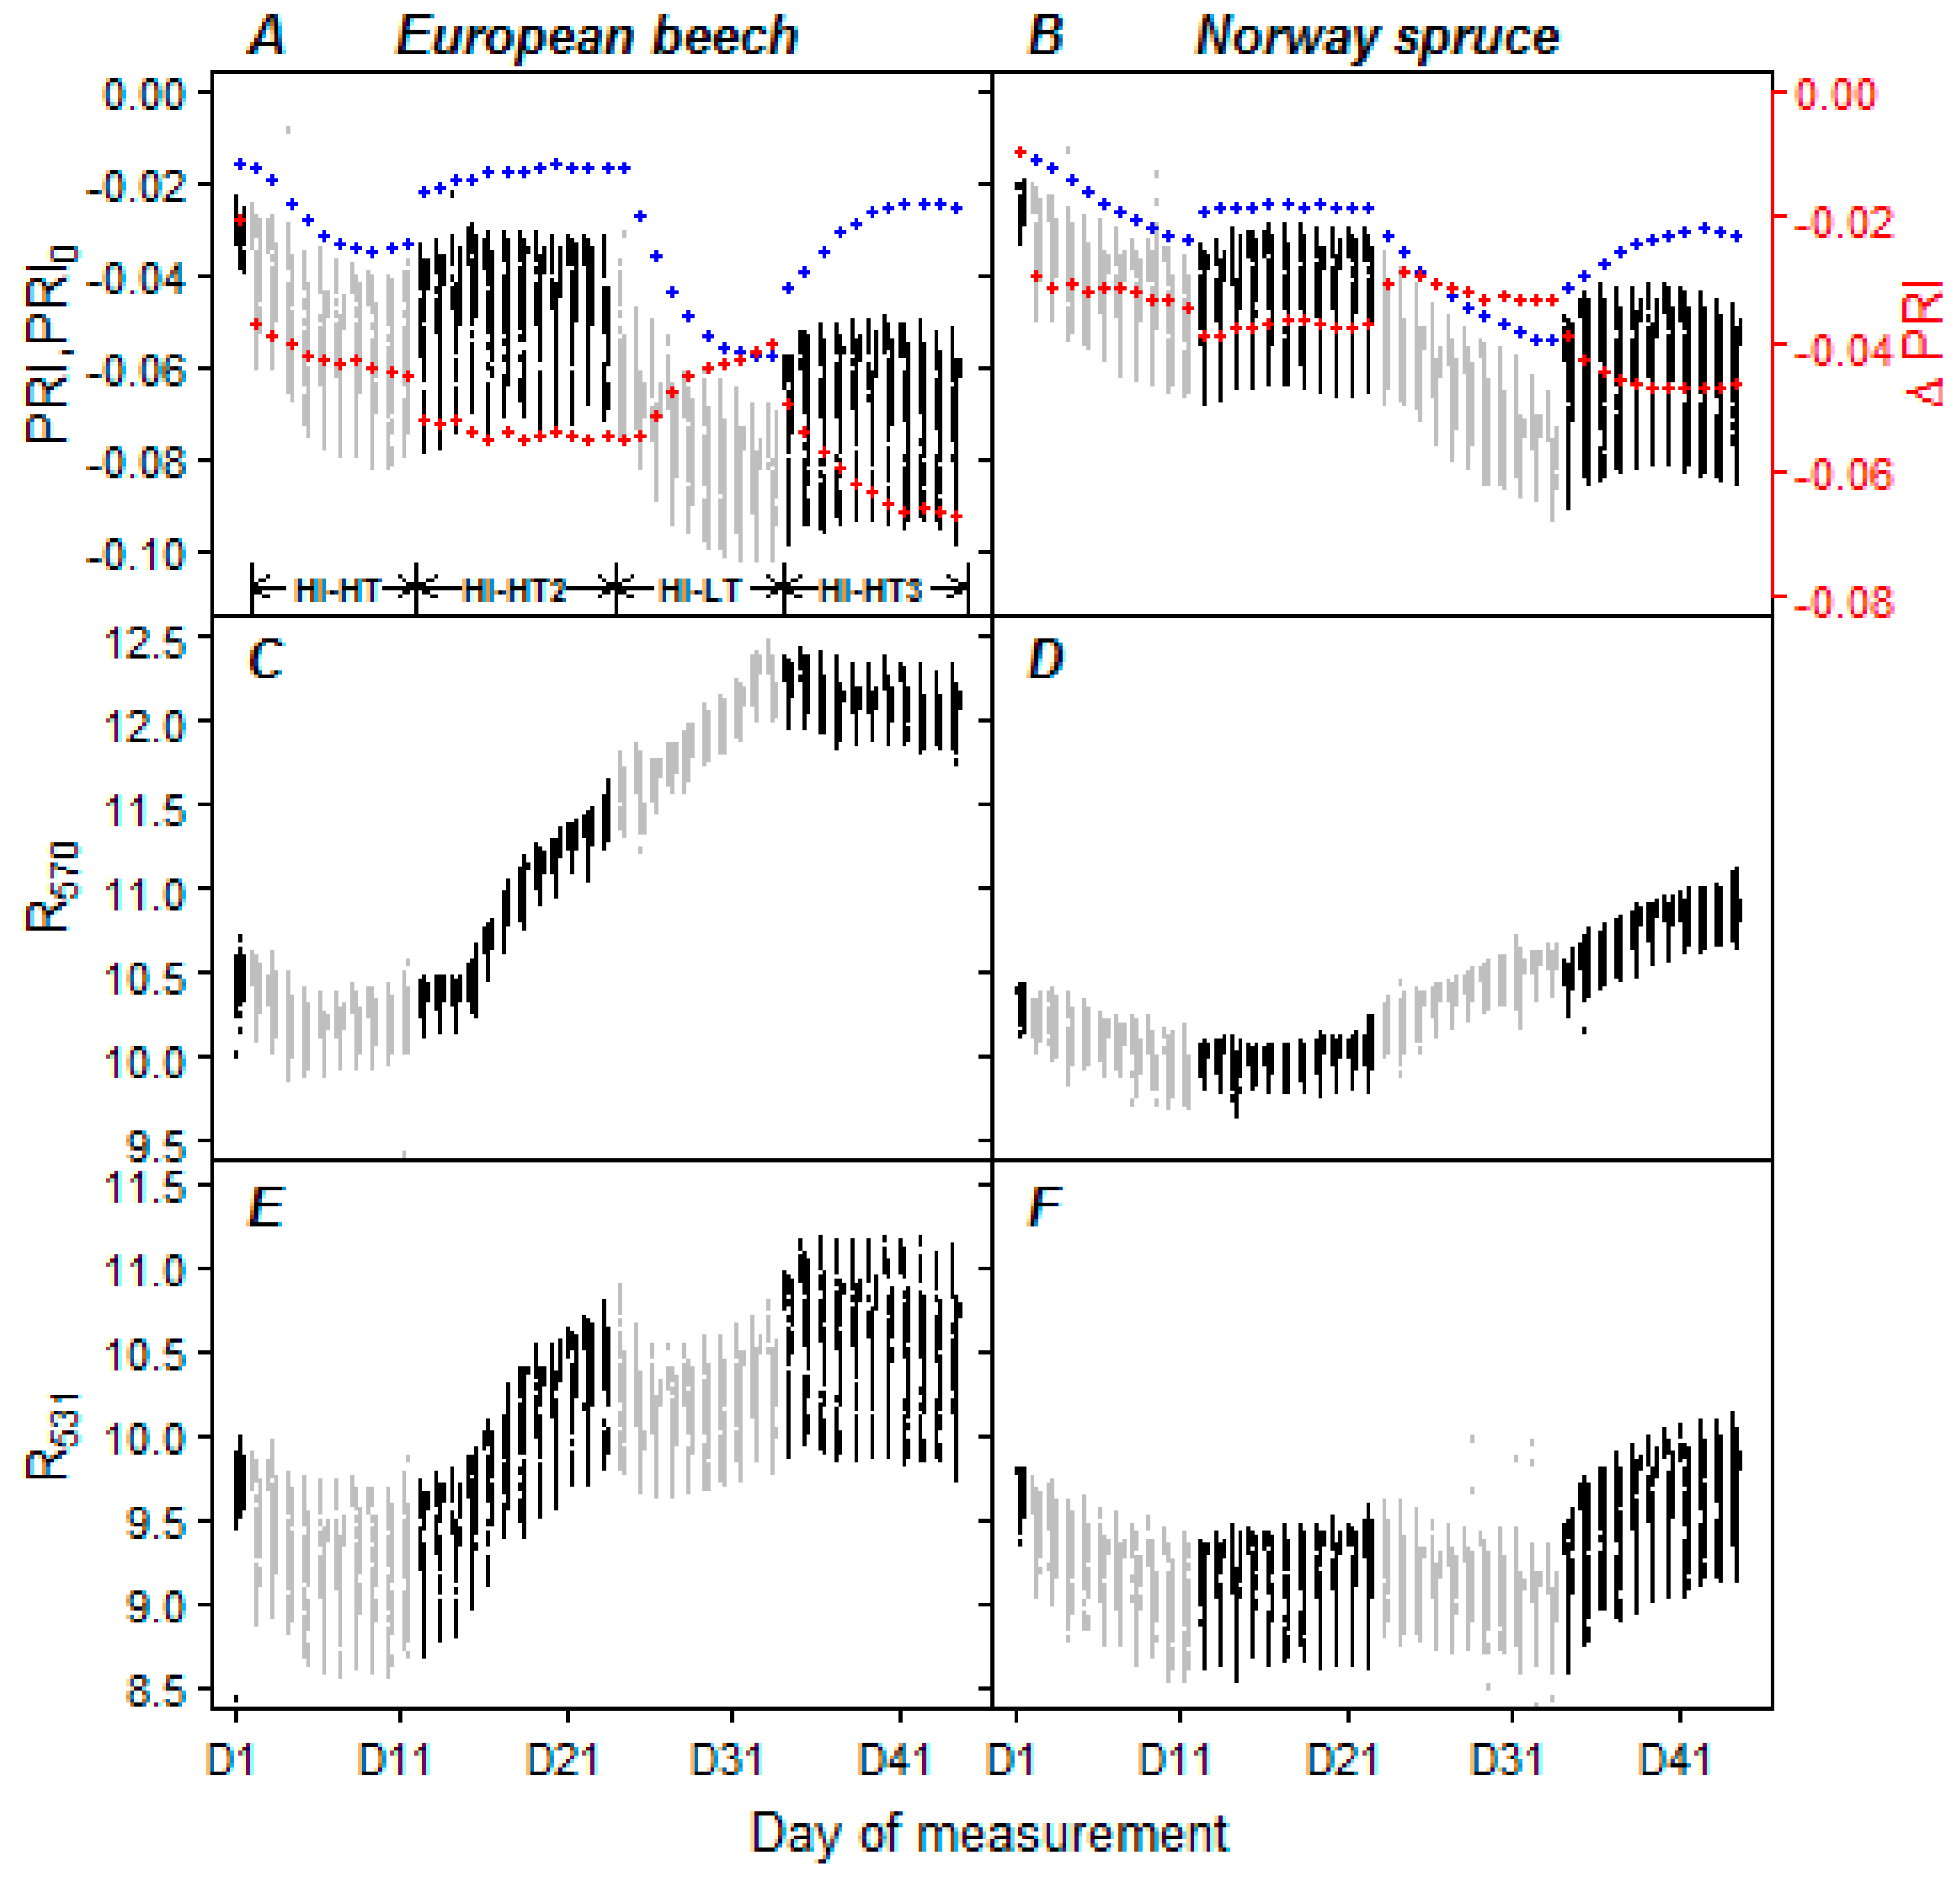
3.3. Optical Properties of Leaves and Needles under the Acclimation Regimes

Daily observed changes of reflectance factors R570 and R531 are displayed in Figure 7C–F. The PRI and PRI0 with the corresponding maximum ΔPRI for each day of measurement are also shown in Figure 7A,B. A detailed example of daily PRI development measured with temporal resolution of 1 min within individual regimes of PAR intensity and temperature is shown in Figure 1.
PRI exhibited a typical diurnal pattern, with lowest PRI near noon (Figure 1 and Figure 7A,B). PRI had generally similar responses in both spruce and beech seedlings at the longer temporal scale of the entire experiment. Acclimation to HI–HT was accompanied by a decrease in PRI throughout this regime (Figure 7A,B). PRI increased immediately after the transition to HI–HT2 to a level at which it then remained stable. The transition to HI–LT was accompanied by a rapid decrease in PRI to an overall minimum. Then early morning PRI and PRI0 values increased rapidly with a gradual increase of midday PRI upon the start of HI–HT3, thus resulting in high ΔPRI. This PRI increase was followed by a decrease at the end of the measuring cycle due to the combined heat and drought stress. A continuous increase in ΔPRI has been observed throughout the HI-HT3. Less pronounced dynamics as compared to PRI or PRI0 was observed for ΔPRI. ΔPRI, in general, produced reversal dynamic as compared to PRI as it estimates daily observed amplitude responses (Figure 7).

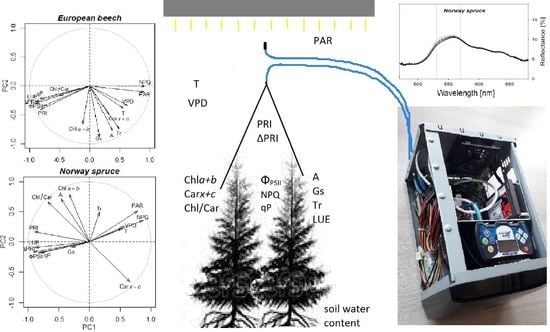
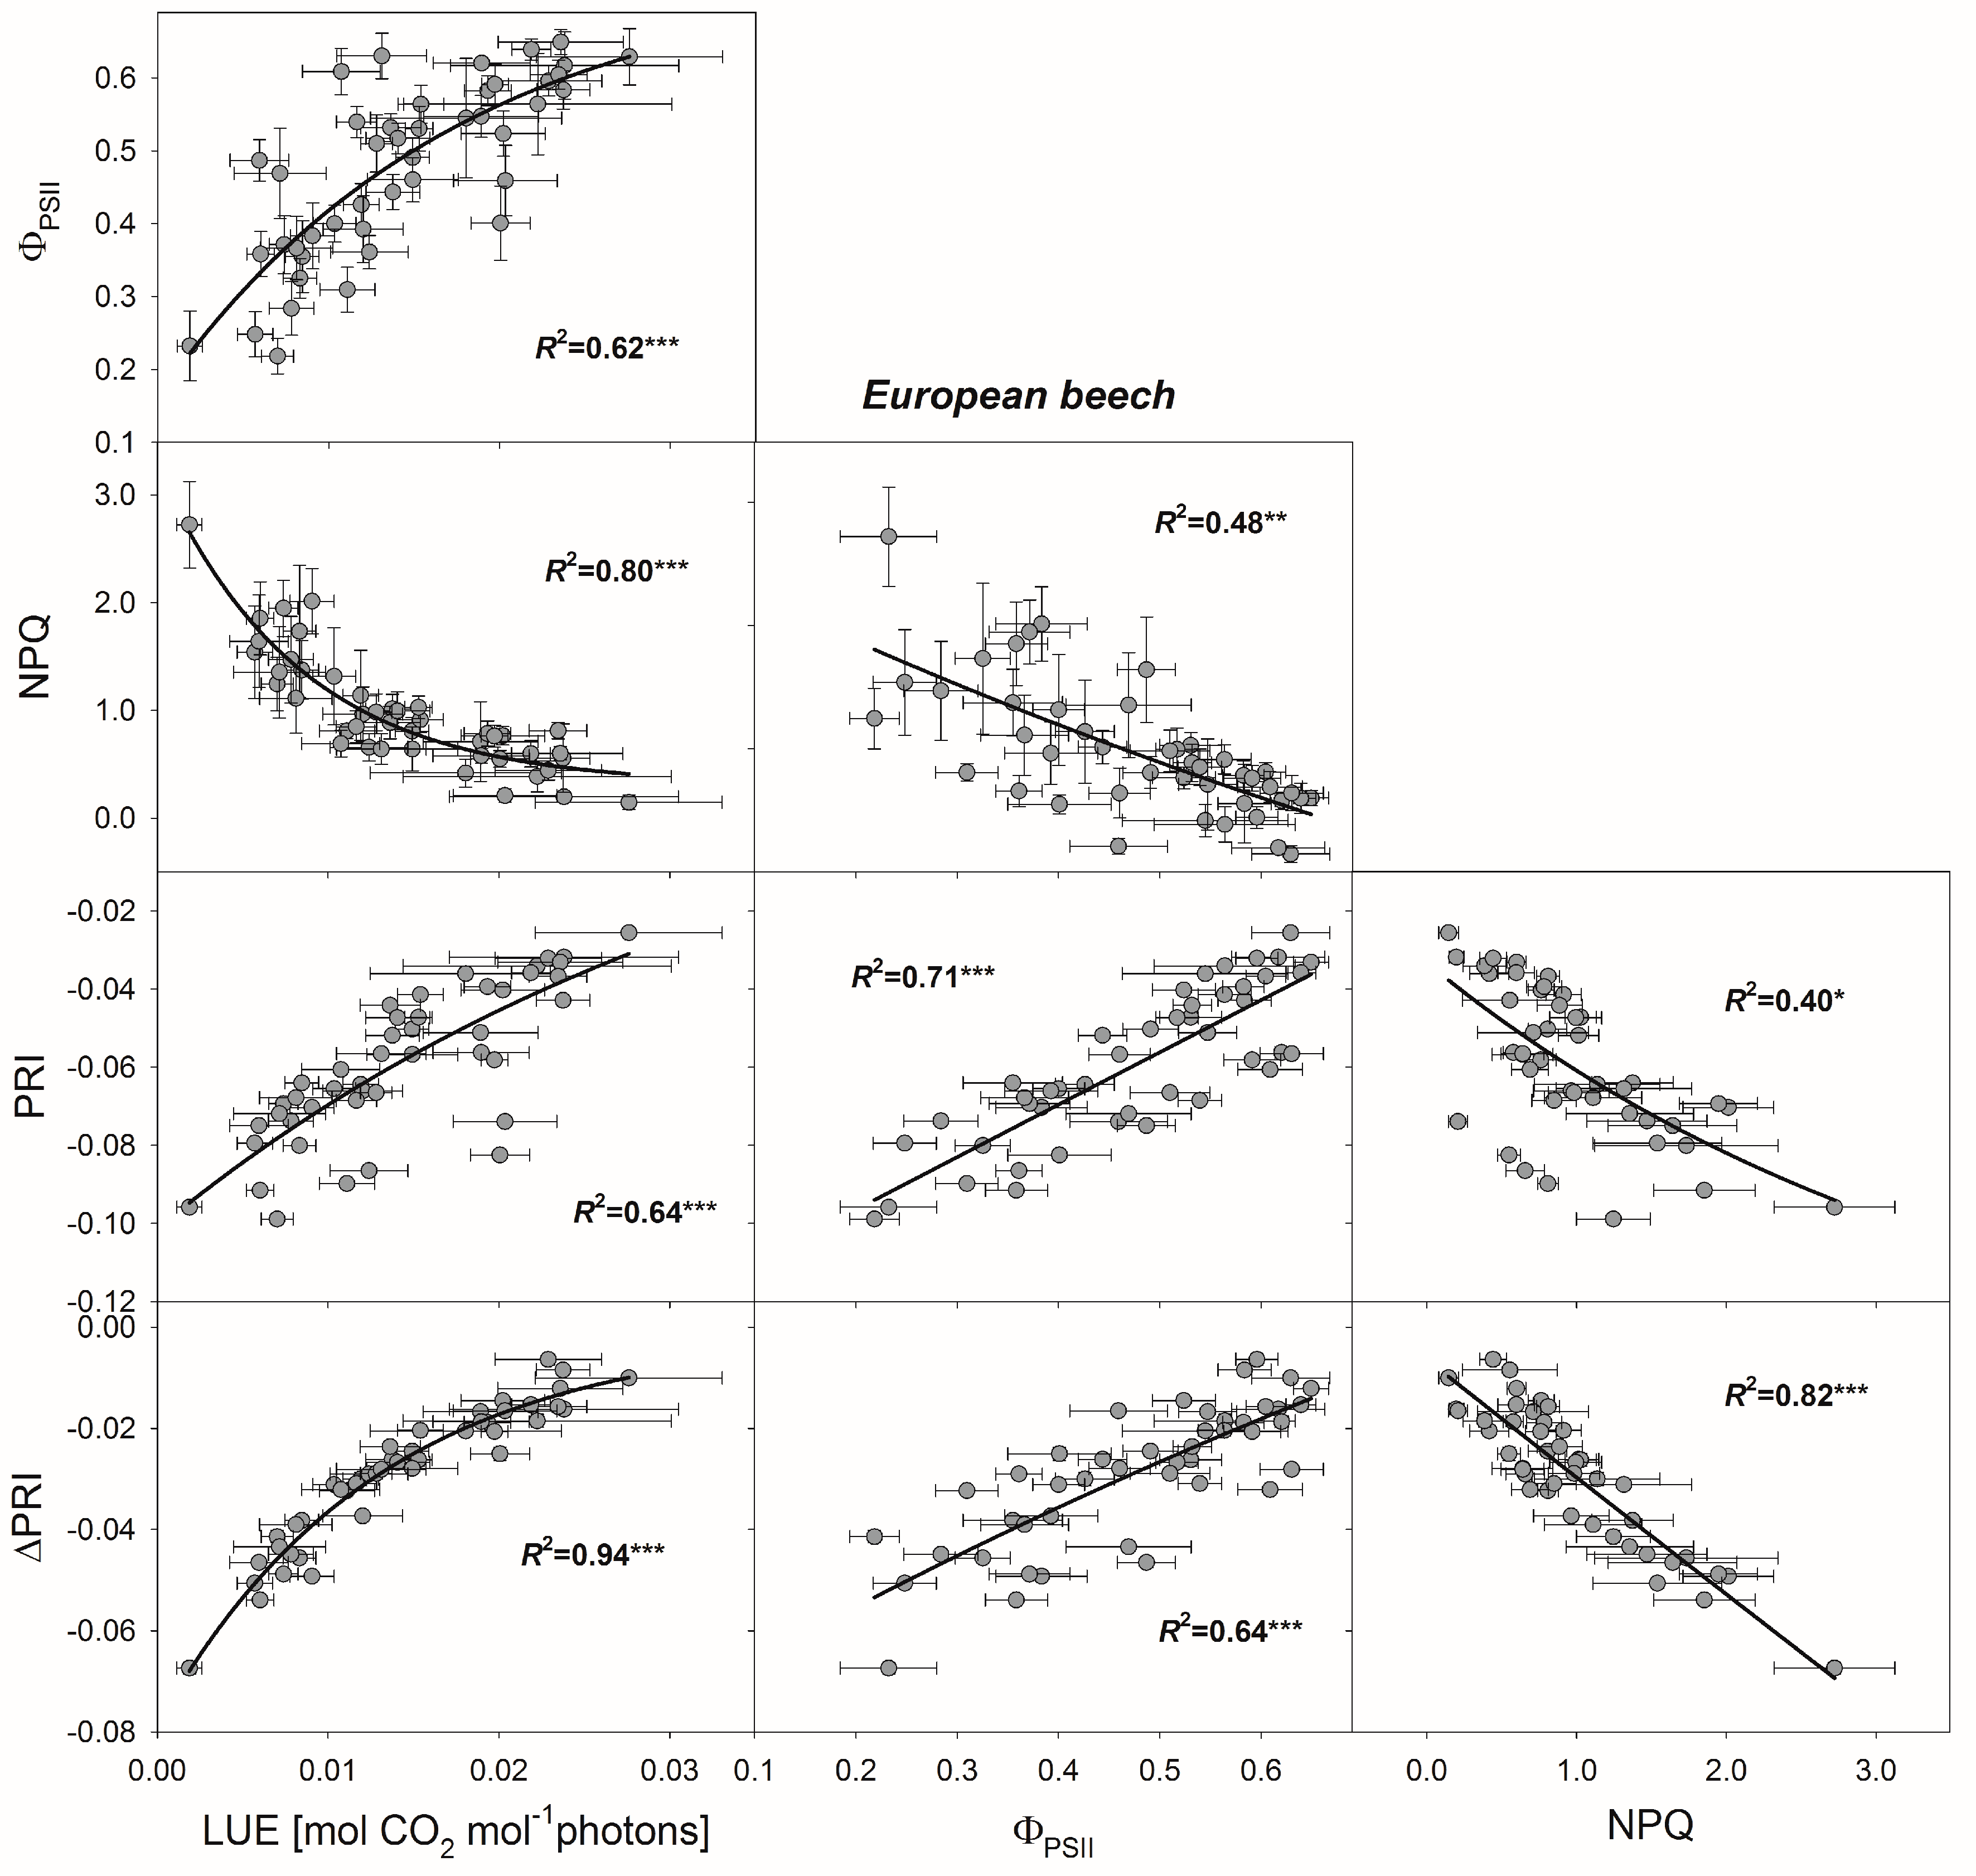
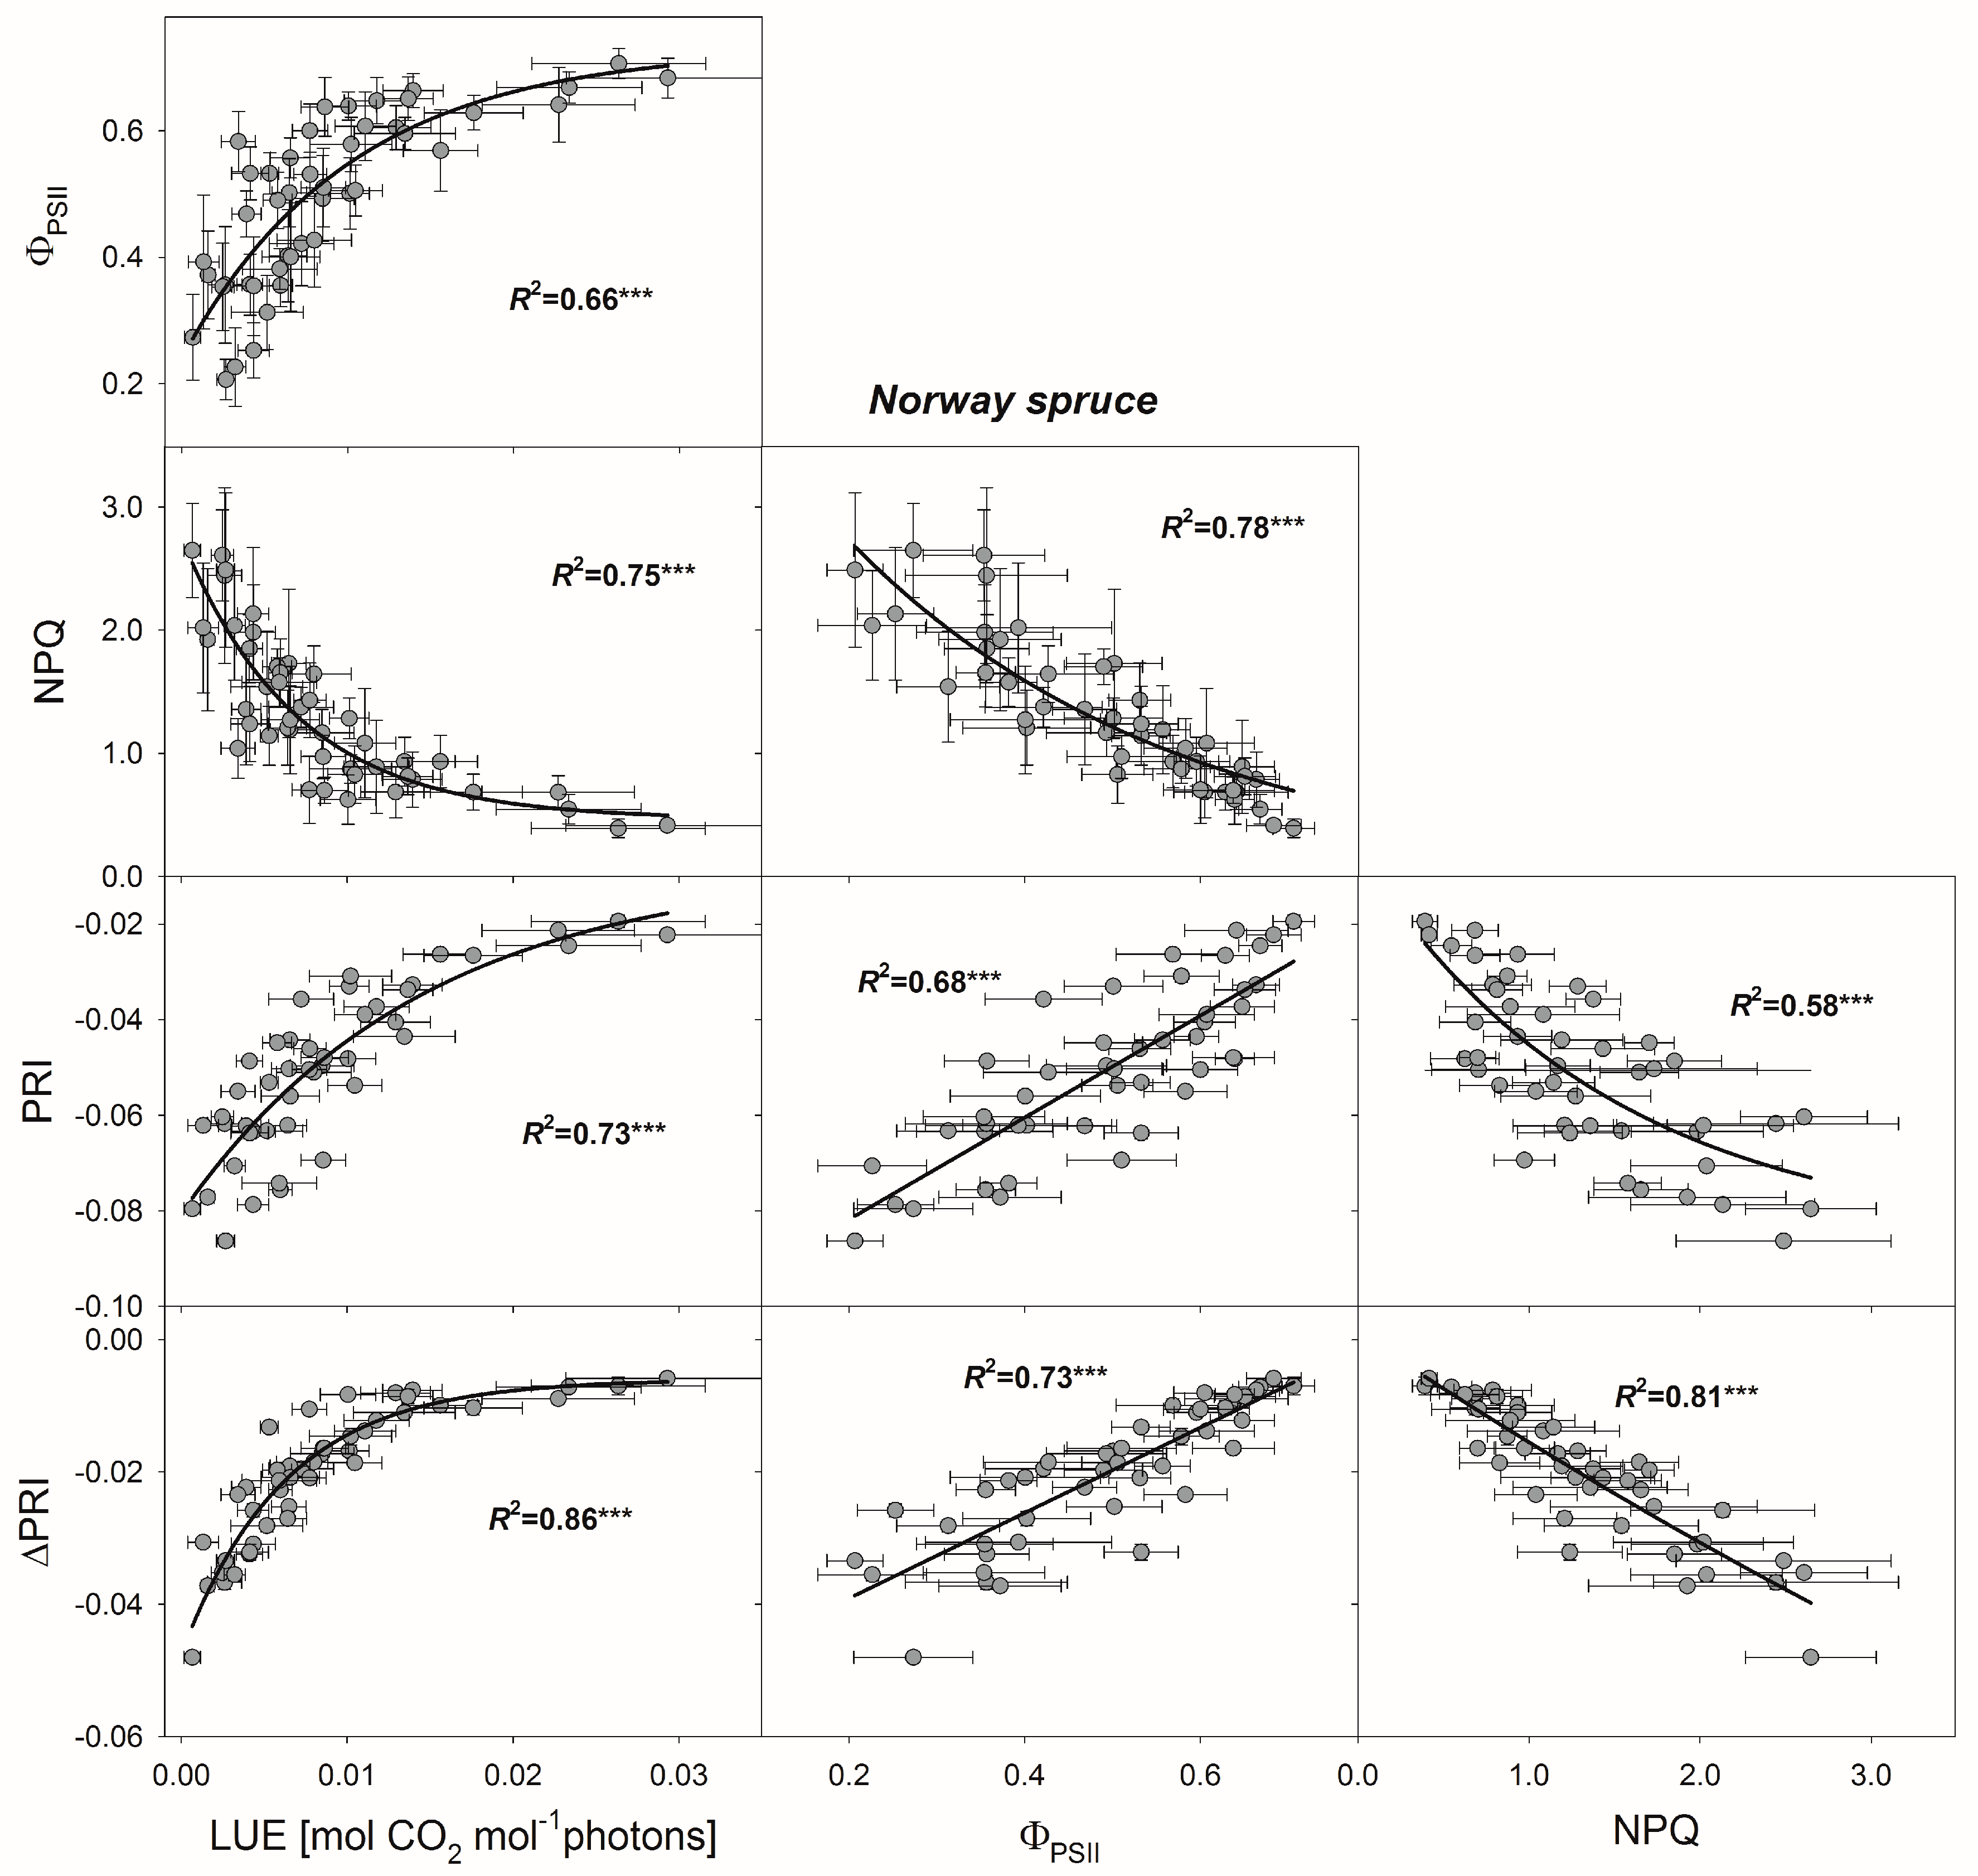
3.4. Relationships between PRI, ΔPRI, and Photosynthetic Parameters

The correlation circle of the PCA ran on the data is presented in Figure 8 for the two axis explaining most of the variance in the data (for beech axis 1:45% and axis 2:22%; for spruce axis 1:46% and axis 2:21%). Overview of the data used for this analysis and the complete correlation plots and its quantitative values are presented in Supplementary Figures S2 and S3, respectively.
A weak explanation for PRI and ΔPRI variation is given by photosynthesis measures estimated using gas-exchange method (A, Gs, Tr). Both PRI and ΔPRI exhibit sensitivity to variables, which are correlated also with PAR. The figure shows positive correlation and mutual interaction between PRI, ΔPRI, ΦPSII, qP and LUE. These variables are irreversibly proportional to NPQ, and PAR. Detailed relationships between PRI, ΔPRI, NPQ, ΦPSII, and LUE are shown in Figure 9 and Figure 10. Within these relationships, the average physiological responses measured for each time period five times per day at different irradiance and temperature conditions were compared with the mean spectral response measured for corresponding intervals. The graphs showing relationships between the variables display mostly nonlinear relationships.
PRI generally provided good estimates of ΦPSII, NPQ, and LUE in both species (R2 = 0.58–0.70), except for NPQ in beech (R2 = 0.40). Higher sensitivity of PRI towards LUE in spruce (R2 = 0.73) as compared to beech (R2 = 0.64) seems to be the result of a more pronounced decrease of Chla+b/Carx+c in spruce. The reason for this may be seen in the comparisons of PRI change between canopies varying in leaf area index (higher for spruce), which, as a consequence of the different scale of drop in Chla+b/Carx+c (Figure 3), produce similar PRI ranges between −0.02 at the beginning of HI–HT and −0.1 at the end of HI–LT (Figure 7A,B) in both species. ΔPRI especially improved the estimates of LUE and NPQ (R2 = 0.80–0.94), providing more sensitive assessment of LUE in beech, whereas the correlation with ΦPSII remained similar to that for PRI (R2 = 0.64–0.68).
Data from the noon measurements showed influence of foliar Chla+b/Carx+c on PRI at high PAR intensities (PRI1200) (Figure 11). In addition, the analysis found that the Chla+b/Carx+c ratios had a lower impact on the corresponding diurnal differential PRI (ΔPRI1200) values, and Chla+b/Carx+c was much less strongly correlated with PRI0.

4. Discussion

The aim of this study was to contribute to improved understanding of ability of photochemical reflectance indices, PRI and ΔPRI, to track variability in the photosynthetic responses of a coniferous tree species, P. abies, and a broadleaved tree species, F. sylvatica, to changing environmental conditions. The experiment was designed to compare PRI responses after short-term (diurnal) and medium-term (10 days) exposure of saplings to changing PAR intensity and air temperature under controlled conditions in growth chambers. Interactions between these two factors are known to determine the activity of photosynthetic enzymes [28], size of photosynthetic pigment pools [27], reflectance signature, and PRI [12]. Since water availability may also strongly influence photosynthesis and spectral responses, water stress was simulated in the final stage of the experiment.

4.1. Effect of Photosynthetic Activity and Pigments on Reflectance Signature

When measuring leaf spectra throughout the day, changes in green reflectance factors are subjected to more than just the xanthophyll cycle change, for example to chloroplast movements, lutein epoxide cycle or temperature stress and in natural conditions also to changing illumination angles. Non-linearity in reflectance measurement output as consequence of the measurements taken under different radiation levels, can also affect observed daily dynamic in reflectance factors [33], and may constitute a part of observed dynamic in R570 and R531 on each day (Figure 7C,D). Observed changes in R570 between days seems to be the result of subtle chlorophylls changes [39]; the extent of change over measuring period (2% and 1% of the total reflectance for beech and spruce) may be dependent on canopy LAI. Responses of reflectance factors at 531 nm to chlorophyll content are more ambiguous. Increasing magnitude of response in R531 after switching to HI–HT corresponded to increasing the need for protective functions under higher PAR intensities (Figure 5C,D; Gamon and Surfus [22]). Decreased diurnal magnitude of the R531 response under HI–LT (Figure 7E,F) can be attributed to maintaining sustained NPQ. The development of NPQ in response to low temperature is typically correlated with the retention of antheraxanthin and zeaxanthin [40] under conditions when generation of the electrochemical potential on thylakoid membrane (ΔpH) or the enzymatic de-epoxidation reaction necessary for optimal functioning of the NPQ are very slow [41,42]. Although most of the published works report increased overnight zeaxanthin levels under freezing temperatures [43], the temperature around 12 °C also seems to produce substantial overnight zeaxanthin retention in studied tree species. The operating mechanism, based on structural reorganization of PSII and aggregation of light harvesting complex, increases the size of the xanthophyll-cycle pigments pool, reorganizes thylakoid membranes in the long-term, and brings a large decrease in PSII components, particularly the D1 protein and oxygen-evolving complex [44].
Cold stress in HI–LT induced the opposite reactions in R531 as compared to R570. An increase of the reflectance factor at 570 nm was detected as a consequence of chlorophyll degradation. Although chlorophyll degradation was initiated during increased temperature (HI–HT2) in accordance with expectations [45] in both species, a low temperature in HI-LT resulted in a decrease of R531 (Figure 7A,B). This simultaneous increase of R570 and decrease of R531 resulted in a rapid decrease of PRI. The decrease in PRI under HI–LT corresponded to the inhibition of photosynthetic reactions observed as a decrease of ΦPSII (Figure 5A,B) and A (Figure 6A,B). With induced low-temperature stress, rapid changes in Chla+b/Carx+c (Figure 3) were observed. Increasing of leaf carotenoids to enhance photon capture and dissipation pathway in cold environments had been reported also by Ensminger et al. [46]. The initial observation of the data suggests that multiplicative factors including xanthophyll cycle pigments conversions are driving the observed changes in PRI, which, resultingly, displays sensitivity to ΦPSII dynamic.

4.2. Use of PRI for Determining Photosynthetic Parameters

PCA showing associations among all the data measured further indicated that leaf Chla+b and Carx+c concentrations cannot be considered within this study as the main factors affecting PRI variations on a daily scale, and also over longer time intervals (Figure 8). In this context, PRI is more likely driven by PAR producing light responses in conversion of carotenoids [47]. The PCA graphs suggest a minor influence of temperature and vapor-pressure deficit (VPD) on PRI value, as well as low sensitivity of PRI towards A, Gs, and Tr. Shortcomings of PRI in detecting CO2 assimilation rate may originate mainly from photorespiratory processes, which are constituting a major sink of excessive energy in stress environments and eliminate excessive energy carriers ATP and NADPH while reducing the accumulation of H+ ions is necessary for the actions of the xanthophyll cycle [48]. As an example, we attribute non-significant change of midday PRI in spruce under the HI–HT2 as compared to HI–HT regime (Figure 7B) which does not correspond to decreasing of Chla+b/Carx+c (Figure 3B) and decreasing of A (Figure 6B) to stomatal limitations (Figure 6D) and increasing respiration. On the other hand, PRI exhibits close association with PAM-derived ΦPSII, qP and NPQ, as well as LUE, all of which, in general, exhibit strong light response (Figure 8).
Regression analysis connecting data measured across all irradiation and temperature conditions (n = 45) showed the closest association of PRI with leaf ΦPSII (Figure 9 and Figure 10), which concurs with results provided by other authors [7,39,49,50]. However, the tight relationship between ΦPSII, LUE, and PRI may exist only under non-stressed conditions [51], typically observed under low light intensities. Stress conditions usually develop into decoupling between photosynthetic electron transport and RuBisCO carboxylation that results in irregularities in the relationship between PRI and LUE as observed in Figure 9 and Figure 10. In addition to the photorespiration already discussed, mechanisms decoupling ΦPSII and LUE and sources of errors in the relationship between LUE and PRI in C3 plants can also involve other processes competing with carboxylation for energetic compounds (ATP, NADPH), such as nitrogen metabolism and electron donation to oxygen in the Mehler reaction [52,53].
It is assumed that electron sinks, and particularly partitioning between PSI and PSII, that determine the amount of light energy that needs to be dissipated non-photochemically via the xanthophyll cycle [54] have an impact on PRI behavior and affect the relationship between PRI and LUE. The balance between photochemical and carbon assimilation processes ensured by the action of the xanthophyll cycle maintains vegetation in a state optimal for photosynthesis [10]. Extensive studies have been conducted in recent years to explain impairment in the PRI–LUE relationship during spring caused by increased PSI activity upon recovering photosynthesis functions [55,56]. It is furthermore assumed that ATP consumption and cyclic electron flow around PSI help maintain the integrity of chloroplasts in cold environments [57]. As the cold temperature regime was not severe in our study, the recorded rapid decrease of PRI during HI–LT (Figure 7A,B) corresponded mainly with decreasing of Chla+b/Carx+c in both species. The observed PRI rise after increasing temperature from HI–LT to HI–HT3 (Figure 7A,B) can be attributed to a subsequent recovery of PSII reaction centers in the initial phase of the HI–HT3 regime. Also Huang et al. [58] reported a positive correlation between the extent of PSII photodamage under low temperatures and stimulation of electron transfer flow during the recovery when temperature increased. This can be confirmed by the initial rapid increase of PRI on the first and second days of HI–HT3 and later slow increase towards the peak PRI value during HI–HT3 (Figure 7A,B). Consuming ATP in a protective process and synthesis of PSII, thus, serve as zeaxanthin-independent NPQ mechanisms reducing the demand for de-excitation via the xanthophyll cycle and leading in both species to an overestimation of LUE when using PRI. As a consequence of high temperatures, PSII and the stroma become more oxidized and high electron flow around PSII helps maintain an energy gradient across the thylakoid membrane via processes of photosynthesis and photorespiration, thereby helping to prevent irreversible damage [59,60]. Because PSI itself is also heat-tolerant, interruption of the photosynthetic functions under high temperatures observed as PRI decrease in late HI–HT3 (Figure 7A,B) may originate primarily from inactivation of PSII reactions [61] in drought-stressed plants observed as ΦPSII decreases (Figure 5A,B).
The observed generally higher sensitivity of PRI to LUE in the evergreen spruce (Figure 10) was in accordance with the observations of Nichol et al. [62], who reported a greater sensitivity of airborne-measured PRI to LUE measured by eddy covariance of coniferous evergreen Picea mariana and Pinus banksiana forests than to LUE of a broadleaved Populus tremuloides forest. Some reports demonstrated that larger change in Chla+b/Carx+c during the vegetative period can have important implications for the use of PRI as an estimator of photosynthetic LUE [6,63]. Our experimental work, revealing a higher PRI-LUE relationship in spruce with a larger Chla+b/Carx+c drop, suggests that the response of PRI to pigments content change may significantly improve decoupling in the relationship between PRI and LUE.
Inasmuch as PRI of natural canopies is particularly sensitive to directional irradiance [64], our results suggest that shifts in carotenoid contents are responsible for the variation in the PRI–LUE relationship when PRI is measured at viewing angles close to the nadir in the field [16]. A similar mechanism can be responsible for increased PRI–LUE correlations for observations from satellites at higher viewing angles from the zenith [65]. Our results furthermore suggest that PRI of canopies with lower Chla+b/Carx+c may vary particularly with mechanisms operating at the level of electron transport chain, thus displaying a weaker PRI–LUE relationship. Another factor that precludes generalizing PRI on large canopies is that the LUE at the top of the crown can be as little as half the LUE of the lower canopy [66]. Although the contribution of the lowest canopy layer to the overall canopy LUE remains questionable, LUE is expected to increase markedly when moving downwards through the canopy. Nevertheless, the lower Chla+b/Carx+c of sunlit foliage improves the estimation of LUE using PRI in comparison with shade foliage, as reported by Hall et al. [67], who noted that the PRI–LUE relationship is stronger for a sunlit foliage surface.

4.3. Use of ΔPRI for Tracking Photosynthetic Performance

Some studies have demonstrated a strong correlation between PRI and NPQ (reviewed by Garbulsky et al. [4]), but our measurements indicated a poorer performance of PRI in tracking NPQ over longer periods, which is similar to results of Nichol et al. [7] and Rahimzadeh-Bajgiran et al. [50]. Porcar-Castell et al. [56] attributed disruptions in the relationship between PRI and NPQ to differences in the physiological mechanisms controlling each variable and to other forms of energy dissipation independent of the xanthophyll cycle, particularly at low temperatures. They summarized that PRI is driven primarily by Chla+b/Carx+c, whereas NPQ is driven by dynamic changes in the xanthophyll cycle. The correction mechanism of subtracting steady-state PRI at an actual PAR level from the initial PRI0 each day provides a more accurate NPQ estimation. Foliar LUE was, in our study, closely associated with NPQ, which is consistent with numerous earlier studies [39,68], and introducing ΔPRI improved the determination of LUE (Figure 9 and Figure 10).
Similarly as did Wong and Gamon [69], who observed a drop of ΔPRI values in winter that coincided with photosynthetic downregulation, we detected declining ΔPRI after exposing trees to HI–LT. Significant decreases in electron transport associated with this drop result in lower CO2 assimilation rates [70]. Later during HI–LT, the magnitude of ΔPRI response differed between beech and spruce (Figure 7A,B). The reduced need for xanthophyll cycle pigments conversions in beech trees increasing their photosynthetic capacity in late HI–LT (Figure 6A), appeared as lower NPQ (Figure 5C) and ΔPRI (Figure 7A). An opposite response showing a negative relationship between photosynthesis and NPQ (as well as ΔPRI) was observed in spruce. This has been reported also for pine trees [15]. In accordance with work conducted on different plant species, the highest ΔPRI values have been observed in seedlings suffering from drought and exposed to high irradiance [23,24]. Observed stomata closure (Figure 6C,D), photosynthetic downregulation (Figure 6A,B), and extensive synthesis of carotenoids (Figure 3) constitute the basis for high NPQ (Figure 5C,D) in many species during drought episodes [71]. The contrasting difference between ΔPRI data points at the start and end of measurements coincides with an observation by Gamon and Berry [17], who demonstrated that ΔPRI within a tree canopy is larger in sun needles than in shade needles.
A lower ΔPRI in Norway spruce does not correspond to a naturally increased capacity for photoprotection by xanthophylls in evergreen species [72]. The greater importance of the xanthophyll cycle in protecting spruce was supported by the higher NPQs during high-temperature regimes HI–HT2 (Figure 5C,D). The ΔPRI response was larger in beech saplings, which can be attributed to lower chlorophyll content decreasing also reflectance in the visible region (Supplementary Figure S1), and thereby providing a greater capacity to intercept light. Future work also should include studying the interferences introduced to the signal from changing illumination geometry during the day and variability of ΔPRI with canopy LAI. Magney et al. [26] reported that ΔPRI is more useful for comparing plots with different LAIs because it is less sensitive to LAI than is PRI, and our measurements suggest that LAI can produce variability in ΔPRI.

4.4. Evaluation of Water Limitation from PRI

Under severe water and heat stress, downregulation of the whole-canopy LUE due to stomata closure should be detectable through PRI, but only limited information suggests a close relationship between plant water status and PRI [48,73]. Moreover, there are reports of difficulties with tracking LUE changes in drought-stressed vegetation that may originate from enhancement of respiration processes [74,75,76]. Probably due to interference with respiration we were also unable to distinguish between the effects of low temperature (HI–LT) versus the combined drought and high temperature stress (HI–HT3) using PRI in our dataset (Figure 7A,B). The observed decrease in Chla+b/Carx+c (Figure 3), though, also did not induce a decrease in PRI under conditions of water stress [13]. The drought-induced photosynthetic changes were matched, however, by PRI first at the end of HI–HT3.
The findings of close connection between high NPQ and increased ΔPRI in water-stressed plants are in agreement with those reported by Elsheery and Cao [23], who were able to discriminate between irrigated and water-stressed mango cultivars based on NPQ and using ΔPRI. Similarly, Rippullone et al. [77] tracked the photosynthetic responses of various tree species using ΔPRI under varying conditions of water stress. Hmimina et al. [25] used ΔPRI to detect changes in LUE induced by water limitation in oak, beech, and pine saplings. Zhang et al. [78] used ΔPRI to track photosynthesis responses to experimental drought and warming in a Mediterranean shrubland. The lower Chla+b/Carx+c in our study did not facilitate separating the effect of drought using PRI, but the higher carotenoid levels in HI–HT3 did increase the magnitude of ΔPRI in saplings stressed by high temperature and drought. Increased carotenoids levels provide higher capacity for dynamic NPQ, which generates larger amplitudes of ΔPRI under given conditions [79].

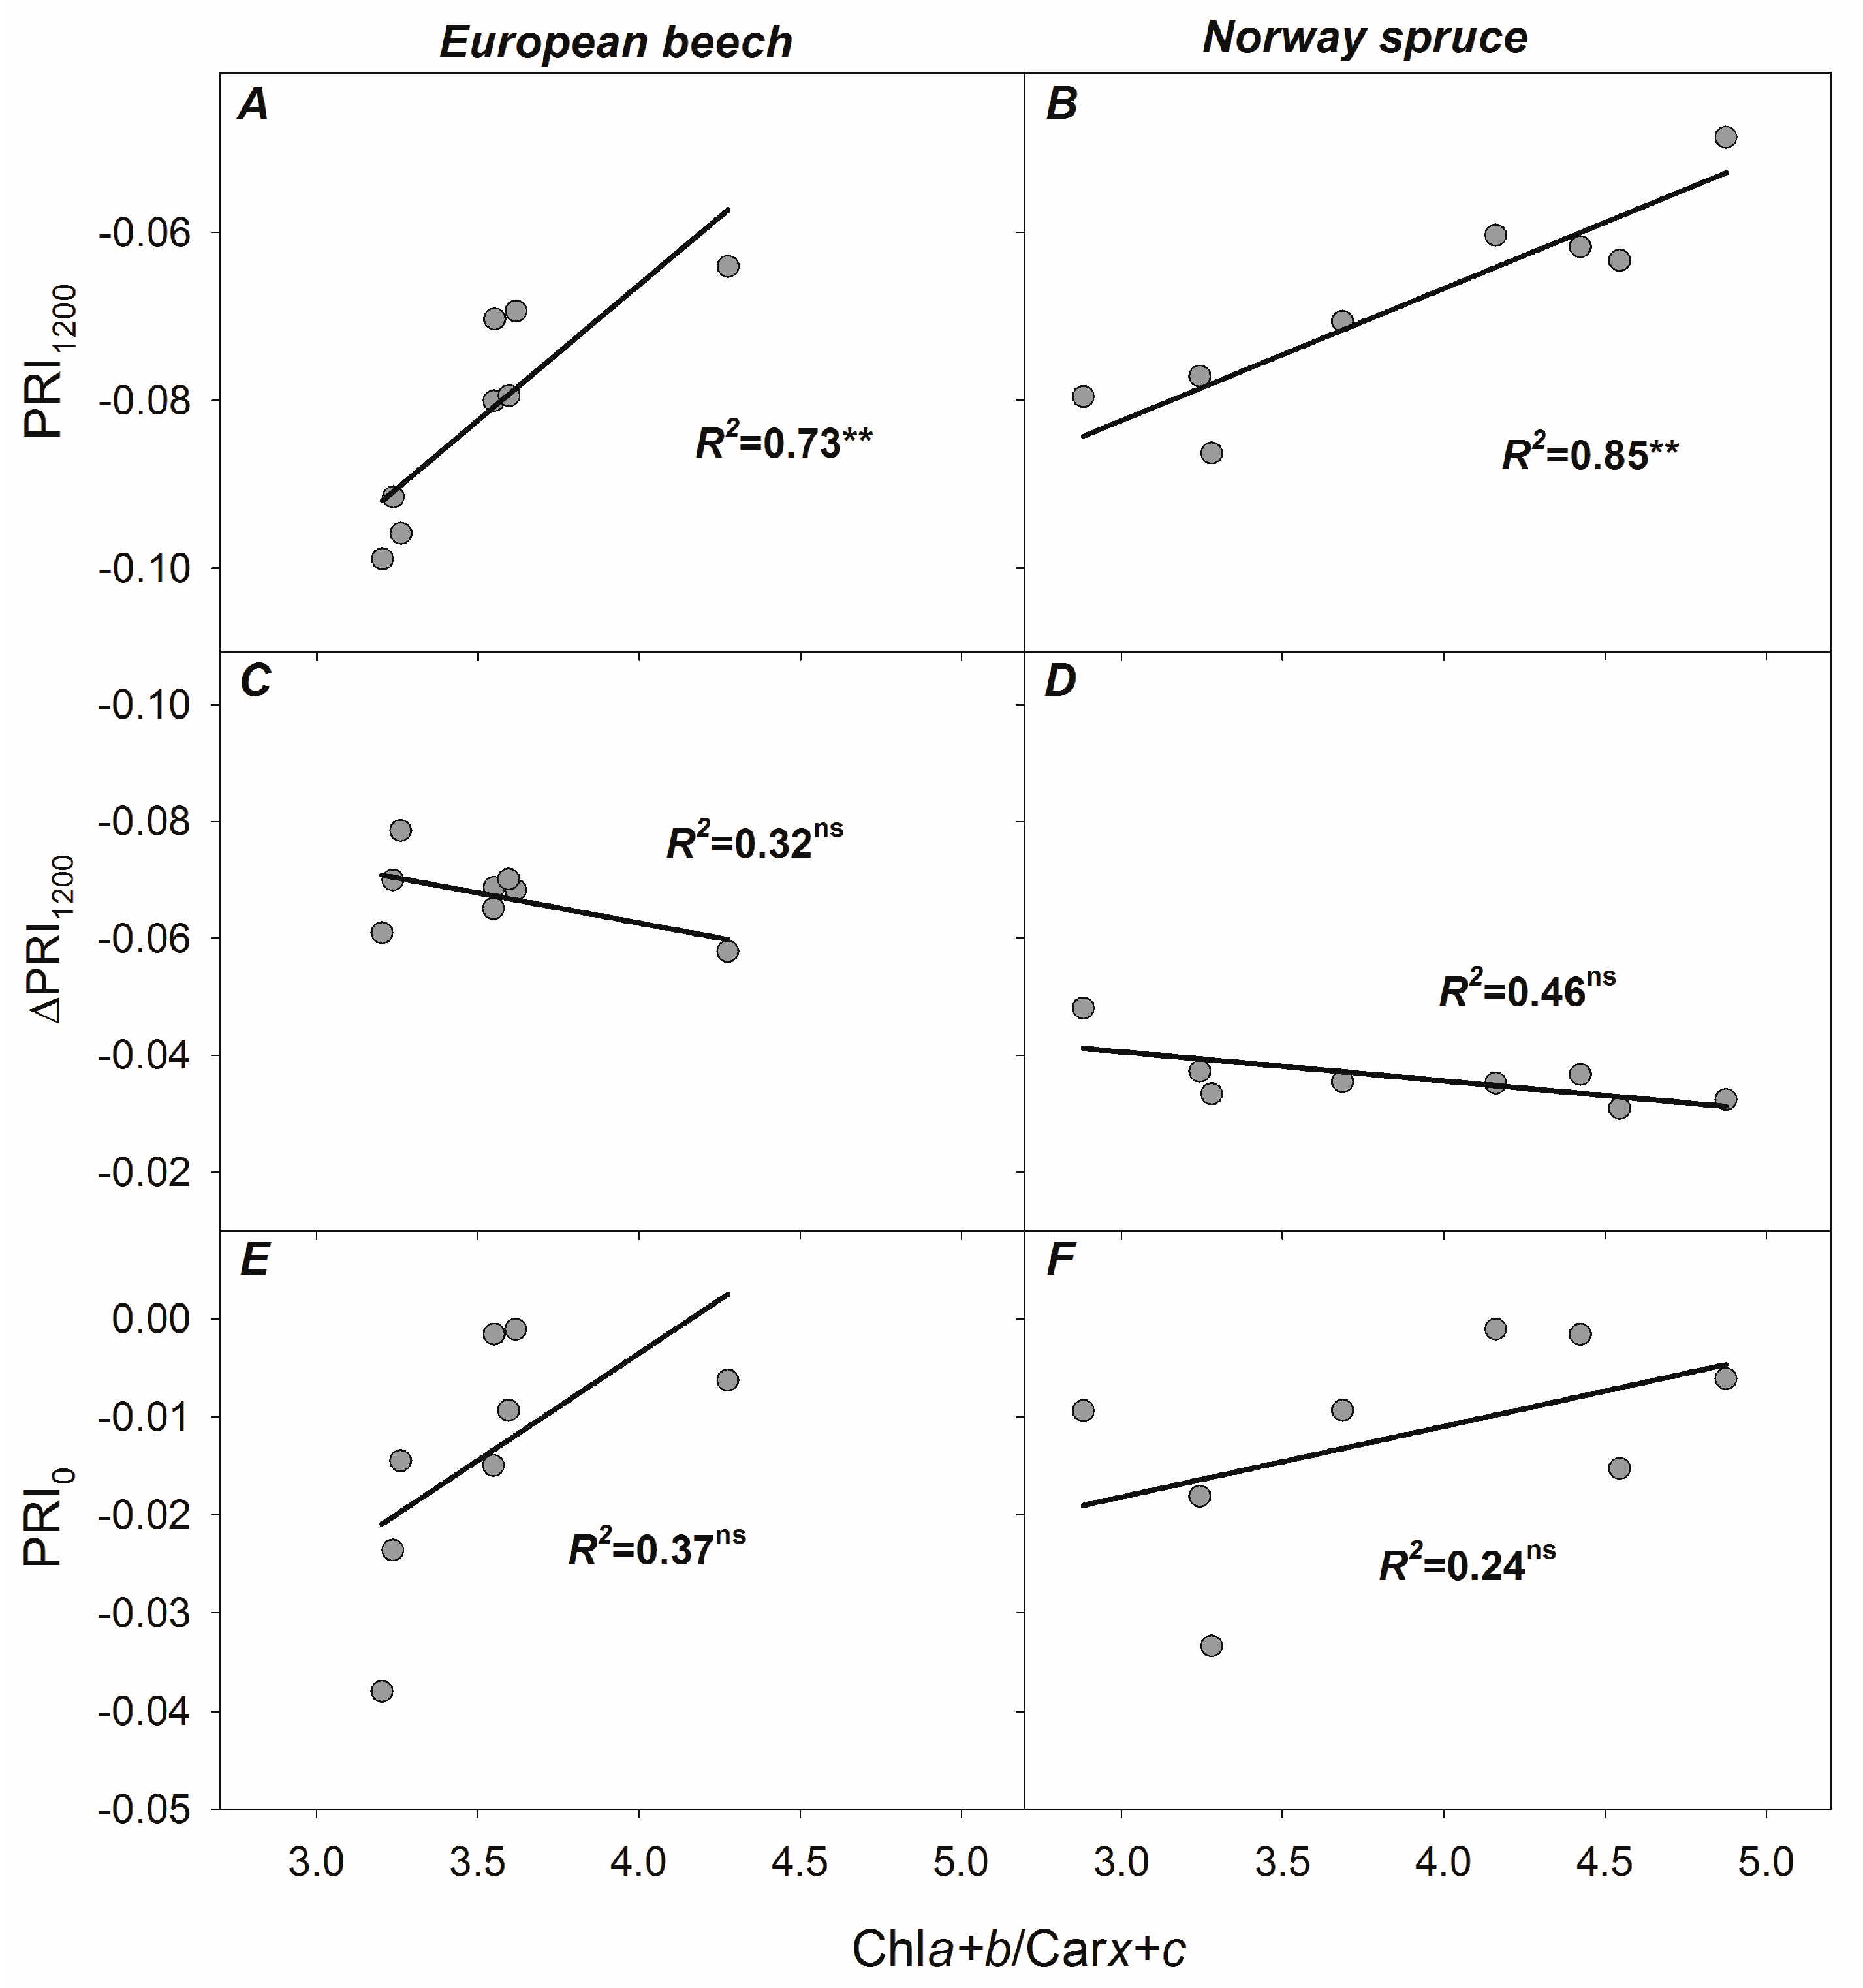
4.5. Re-Evaluating the Role of Constitutive Chla+b/Carx+c Ratio in Developing PRI, PRI0, and ΔPRI

Measurements at constant irradiance levels allowed discriminating the influence of photosynthetic pigments on PRI and its derivatives PRI0 and ΔPRI (Figure 11). Additional control of temperature during the experiment allowed investigating in greater detail the role of dominant physiological processes under defined environmental conditions in forming PRI and ΔPRI. Regression established between PRI and Chla+b/Carx+c confirmed a strong effect of Chla+b/Carx+c on PRI at constant high irradiance levels (as reported also by, for example, Stylinski et al. [14] and Garrity et al. [12]). Our measurements, furthermore, confirmed that additional processes removing excessive energy accumulated in chloroplasts and not directly linked to photosynthetic CO2 uptake have a likely impact on the magnitude of the PRI response [48]. Additional PRI differences can originate from exposure of plants to light of higher or lower intensity that enhances protective mechanisms by changing the photochemistry of leaves.
Regression analysis of PRI0 and Chla+b/Carx+c revealed no significant correlation between them. Our measurements thereby suggested that PRI0 is more dependent on transitions between dynamic and sustained NPQ, which is related to the retention of de-epoxided forms of xanthophyll cycle pigments during night-time [80]. Since PRI at high light intensity is the result of changes in Chla+b/Carx+c and, to a certain, but not large, extent of enhanced zeaxanthin-independent de-excitation processes, the resulting magnitude of ΔPRI is highly influenced by sustaining levels of NPQ. Our measurements demonstrated that an accurate and reproducible assessment of PRI0 can produce consistent estimations of LUE. Several methods for estimating PRI0 from field measurements have appeared in the literature in recent few years. Determining PRI from measurements within a certain time interval in the morning based on measurements under a certain illuminating geometry has been shown to be the easiest method for estimating PRI0 from canopy reflectance measurements [26,34]. These authors also emphasize the necessity to estimate PRI0 from measurements under low PAR intensities in vegetation with inactivated light-protective functions. Such PRI0 determination is complicated under natural conditions for measurements under low sun elevations in the morning, however, due to the constraint created by the bidirectional reflectance distribution function. At this point, mathematical deconvolution of PRI0 derived from early morning measurements of PRI under increasing PAR intensities as the intercept of the linear regressions of PRI versus PAR, proposed by Hmimina et al. [24], seems a proper method for estimating PRI0. In this study the problems with PRI0 estimation were reduced by measurement at a constant low irradiance level and constant (nadir) illumination geometry.
Gamon and Berry [17] showed that PRI consists of constitutive and facultative components, and our measurements suggest that an ability to discriminate between these two components may play a crucial role in evaluating PRI data. Separate modelling between sunlit and shaded portions of canopy yielding different Chla+b/Carx+c and PRI was the most efficient way to simulate daily photosynthesis from multi-angular PRI measurements [81]. Contrary to the direct use of PRI, recent pioneering studies employing procedures to estimate ΔPRI from PRI0 and PRI are leading to attempts to use ΔPRI for the purpose of estimating various stresses [25,75,78]. We also suggest that ability to discern between the two effects of Chla+b/Carx+c and daily dynamics in xanthophylls in PRI0 should play a crucial role in evaluating ΔPRI. This study clarifies some of the leaf-level responses that affect the PRI signal over a range of timescales, but further consideration of scaling effects would also be needed to identify the opportunities for measuring that signal in the field.

5. Conclusions

Our measurements showed that processes that reduce energy carriers for use in photosynthetic CO2 uptake result in decoupling in the ΦPSII–LUE and PRI–LUE relationships that may occur at the daily timescale. We furthermore suggested that acclimation responses of plants that adjust the amount of energy needing to be dissipated via the xanthophyll cycle constitute additional causes of impairment in the PRI–LUE relationship over the long-term. We also provided a description of the mechanisms involved in improving LUE estimation using ΔPRI and insight into mechanisms behind the variation of ΔPRI in distinct environments caused by change in leaf Chla+b/Carx+c. It will be still important to further validate the mechanisms identified here on mature trees and in natural systems, where additional causes of PRI variation such as sun angle or canopy structure are likely to add further complexity to the signal detected from reflectance measurements. Studies assuming a variety of stresses should be performed to validate the suggested relationships between ΔPRI and LUE.

Supplementary Materials

The following are available online at https://www.mdpi.com/2072-4292/10/8/1202/s1. Figure S1. (A) Spectral intensity emitted by white LED panels (Iin) in growth chambers under four photosynthetically active radiation (PAR) intensities: 100, 300, 600, and 1200 µmol m−2 s−1; (B) spectral intensity reflected from spruce saplings under corresponding PAR intensities (Iref); reflectance spectra of European beech (C) and Norway spruce (D) saplings under corresponding irradiances in one day during the HI–HT2 regime (high PAR intensity and second highest of 3 different high temperature conditions). Vertical lines indicate the reflectance wavelengths 531 and 570 nm used for calculating photochemical reflectance index (PRI). Figure S2. Graphs showing the correlation map between environmental factors (PAR, T, and VPD) and photosynthetic parameters (PRI, ΔPRI, Chla+b, Carx+c, Chla+b/Carx+c, A, Gs, Tr, LUE, ΦPSII, qP, and NPQ) of the beech trees. Data serve as input for the correlation circle of the principal component analysis shown in Figure 7A. Correlation coefficients have been estimated for 45 pairs of data points, and asterisks indicate statistical significance of the correlation coefficient (R): p < 0.05 (*), p < 0.01 (**), and p < 0.001 (***). Figure S3. Graphs showing correlation map between environmental factors (PAR, T, and VPD) and photosynthetic parameters (PRI, ΔPRI, Chla+b, Carx+c, Chla+b/Carx+c, A, Gs, Tr, LUE, ΦPSII, qP, and NPQ) of the spruce trees. Data serve as input for the correlation circle of the principal component analysis shown in Figure 7B. Correlation coefficients have been estimated for 45 pairs of data points, and asterisks indicate statistical significance of the correlation coefficient (R): p < 0.05 (*), p < 0.01 (**), and p < 0.001 (***).

Author Contributions

Data curation, P.V. and K.V.; Formal analysis, D.K. and K.K.; Funding acquisition, O.U.; Methodology, A.A.; Supervision, D.K.; Writing–original draft, D.K.; Writing–review & editing, K.K., J.P. and O.U.

Funding

This work was supported by the Ministry of Education, Youth, and Sports of the Czech Republic within the National Sustainability Program I (No. LO1415), National Infrastructure for Carbon Observations−CzeCOS (No. LM2015061) and CzeCOS ProCES (No. CZ.02.1.01/0.0/0.0/16_013/0001609). D.K. has been involved in activities of COST Action ES1309. J.P.’s research was supported by the Spanish Government grant CGL2016-79835-P, the European Research Council Synergy grant ERC-2013-SyG 610028-IMBALANCE-P, and the Catalan Government project SGR 2014-274.

Acknowledgments

D.K. is thankful to the Czech Academy of Sciences for financial support via his postdoctoral program during years 2015–2016. The authors thank Petra Dreveňáková for her valuable contributions during the measuring campaigns.

Conflicts of Interest

The authors declare no conflict of interest.

References

  1. Buschmann, C. Variability and application of the chlorophyll fluorescence emission ratio red/far-red of leaves. Photosynth. Res. 2007, 92, 261–271. [Google Scholar] [CrossRef] [PubMed]
  2. Lawlor, D.W. Photosynthesis, productivity and environment. J. Exp. Bot. 1995, 46, 1449–1461. [Google Scholar] [CrossRef]
  3. Porcar-Castell, A.; Mac Arthur, A.; Rossini, M.; Eklundh, L.; Pacheco-Labrador, J.; Anderson, K.; Balzarolo, M.; Martín, M.P.; Jin, H.; Tomelleri, E.; et al. EUROSPEC: At the interface between remote-sensing and ecosystem CO2 flux measurements in Europe. Biogeosciences 2015, 12, 6103–6124. [Google Scholar] [CrossRef]
  4. Garbulsky, M.F.; Peñuelas, J.; Gamon, J.; Inoue, Y.; Filella, I. The photochemical reflectance index (PRI) and the remote sensing of leaf, canopy and ecosystem radiation use efficiencies. A review and meta-analysis. Remote Sens. Environ. 2011, 115, 281–297. [Google Scholar] [CrossRef]
  5. Gamon, J.A.; Peñuelas, J.; Field, C.B. A narrow-waveband spectral index that tracks diurnal changes in photosynthetic efficiency. Remote Sens. Environ. 1992, 41, 35–44. [Google Scholar] [CrossRef]
  6. Peñuelas, J.; Filella, I.; Gamon, J. Assessment of photosynthetic radiation-use efficiency with spectral reflectance. New Phytol. 1995, 131, 291–296. [Google Scholar] [CrossRef] [Green Version]
  7. Nichol, C.J.; Rascher, U.; Matsubara, S.; Osmond, B. Assessing photosynthetic efficiency in an experimental mangrove canopy using remote sensing and chlorophyll fluorescence. Trees 2006, 20, 9–15. [Google Scholar] [CrossRef]
  8. Peñuelas, J.; Garbulsky, M.F.; Filella, I. Photochemical reflectance index (PRI) and remote sensing of plant CO2 uptake. New Phytol. 2011, 191, 596–599. [Google Scholar] [CrossRef] [PubMed]
  9. Drolet, G.G.; Huemmrich, K.F.; Hall, F.G.; Middleton, E.M.; Black, T.A.; Barr, A.G.; Margolis, H.A. A MODIS-derived photochemical reflectance index to detect inter-annual variations in the photosynthetic light-use efficiency of a boreal deciduous forest. Remote Sens. Environ. 2005, 98, 212–224. [Google Scholar] [CrossRef]
  10. Demmig-Adams, B.; Adams, W. The role of xanthophyll cycle carotenoids in the protection of photosynthesis. Trends Plant Sci. 1996, 1, 21–26. [Google Scholar] [CrossRef]
  11. Gamon, J.A.; Field, C.B.; Bilger, W.; Björkman, O.; Fredeen, A.L.; Peñuelas, J. Remote sensing of the xanthophyll cycle and chlorophyll fluorescence in sunflower leaves and canopies. Oecologia 1990, 85, 1–7. [Google Scholar] [CrossRef] [PubMed]
  12. Garrity, S.R.; Eitel, J.U.H.; Vierling, L.A. Disentangling the relationships between plant pigments and the photochemical reflectance index reveals a new approach for remote estimation of carotenoid content. Remote Sens. Environ. 2011, 115, 628–635. [Google Scholar] [CrossRef]
  13. Sims, D.A.; Gamon, J.A. Relationships between leaf pigment content and spectral reflectance across a wide range of species,leaf structures and developmental stages. Remote Sens. Environ. 2002, 81, 337–354. [Google Scholar] [CrossRef]
  14. Stylinski, C.D.; Gamon, J.A.; Oechel, W.C. Seasonal patterns of reflectance indices, carotenoid pigments and photosynthesis of evergreen chaparral species. Oecologia 2002, 131, 366–374. [Google Scholar] [CrossRef] [PubMed]
  15. Fréchette, E.; Chang, C.Y.Y.; Ensminger, I. Photoperiod and temperature constraints on the relationship between the photochemical reflectance index and the light use efficiency of photosynthesis in Pinus strobus. Tree Physiol. 2016, 36, 311–324. [Google Scholar] [CrossRef] [PubMed]
  16. Hilker, T.; Coops, N.C.; Hall, F.G.; Black, T.A.; Wulder, M.A.; Nesic, Z.; Krishnan, P. Separating physiologically and directionally induced changes in PRI using BRDF models. Remote Sens. Environ. 2008, 112, 2777–2788. [Google Scholar] [CrossRef] [Green Version]
  17. Gamon, J.A.; Berry, J.A. Facultative and constitutive pigment effects on the Photochemical Reflectance Index (PRI) in sun and shade conifer needles. Isrl. J. Plant Sci. 2012, 60, 85–95. [Google Scholar] [CrossRef]
  18. Hernández-Clemente, R.; Navarro-Cerrillo, R.M.; Suárez, L.; Morales, F.; Zarco-Tejada, P.J. Assessing structural effects on PRI for stress detection in conifer forests. Remote Sens. Environ. 2011, 115, 2360–2375. [Google Scholar] [CrossRef]
  19. Barton, C.V.M.; North, P.R.J. Remote sensing of canopy light use efficiency using the photochemical reflectance index model and sensitivity analysis. Remote Sens. Environ. 2001, 78, 264–273. [Google Scholar] [CrossRef]
  20. Esteban, R.; Becerril, J.M.; García-Plazaola, J.I. Lutein epoxide cycle, more than just a forest tale. Plant Signal. Behav. 2009, 4, 342–344. [Google Scholar] [CrossRef] [PubMed] [Green Version]
  21. Gitelson, A.A.; Gamon, J.A.; Solovchenko, A. Multiple drivers of seasonal change in PRI: Implications for photosynthesis 1. Leaf level. Remote Sens. Environ. 2017, 191, 110–116. [Google Scholar] [CrossRef] [Green Version]
  22. Gamon, J.A.; Surfus, J.S. Assessing leaf pigment content and activity with a reflectometer. New Phytol. 1999, 143, 105–117. [Google Scholar] [CrossRef] [Green Version]
  23. Elsheery, N.I.; Cao, K.F. Gas exchange, chlorophyll fluorescence, and osmotic adjustment in two mango cultivars under drought stress. Acta Physiol. Plant. 2008, 30, 769–777. [Google Scholar] [CrossRef]
  24. Hmimina, G.; Dufrêne, E.; Soudani, K. Relationship between photochemical reflectance index and leaf ecophysiological and biochemical parameters under two different water statuses: Towards a rapid and efficient correction method using real-time measurements. Plant Cell Environ. 2014, 37, 473–487. [Google Scholar] [CrossRef] [PubMed]
  25. Hmimina, G.; Merlier, E.; Dufrêne, E.; Soudani, K. Deconvolution of pigment and physiologically related photochemical reflectance index variability at the canopy scale over an entire growing season. Plant Cell Environ. 2015, 38, 1578–1590. [Google Scholar] [CrossRef] [PubMed]
  26. Magney, T.S.; Vierling, L.A.; Eitel, J.U.H.; Huggins, D.R.; Garrity, S.R. Response of high frequency Photochemical Reflectance Index (PRI) measurements to environmental conditions in wheat. Remote Sens. Environ. 2016, 173, 84–97. [Google Scholar] [CrossRef]
  27. Maxwell, D.P.; Falk, S.; Huner, N. Photosystem II Excitation Pressure and Development of Resistance to Photoinhibition (I. Light-Harvesting Complex II Abundance and Zeaxanthin Content in Chlorella vulgaris). Plant Physiol. 1995, 107, 687–694. [Google Scholar] [CrossRef] [PubMed]
  28. Salvucci, M.E.; Crafts-Brandner, S.J. Inhibition of photosynthesis by heat stress: The activation state of Rubisco as a limiting factor in photosynthesis. Physiol. Plant. 2004, 120, 179–186. [Google Scholar] [CrossRef] [PubMed]
  29. Suárez, L.; Zarco-Tejada, P.J.; Sepulcre-Cantó, G.; Pérez-Priego, O.; Miller, J.R.; Jiménez-Muñoz, J.C.; Sobrino, J. Assessing canopy PRI for water stress detection with diurnal airborne imagery. Remote Sens. Environ. 2008, 112, 560–575. [Google Scholar] [CrossRef]
  30. Zarco-Tejada, P.J.; González-Dugo, V.; Williams, L.E.; Suárez, L.; Berni, J.A.J.; Goldhamer, D.; Fereres, E. A PRI-based water stress index combining structural and chlorophyll effects: Assessment using diurnal narrow-band airborne imagery and the CWSI thermal index. Remote Sens. Environ. 2013, 138, 38–50. [Google Scholar] [CrossRef] [Green Version]
  31. Lukeš, P.; Homolová, L.; Navrátil, M.; Hanuš, J. Assessing the consistency of optical properties measured in four integrating spheres. Int. J. Remote Sens. 2017, 38, 3817–3830. [Google Scholar] [CrossRef]
  32. Pacheco-Labrador, J.; Martín, M.P. Characterization of a field spectroradiometer for unattended vegetation monitoring. Key sensor models and impacts on reflectance. Sensors 2015, 15, 4154–4175. [Google Scholar] [CrossRef] [PubMed]
  33. Pacheco-Labrador, J.; Martin, M.P. Nonlinear response in a field portable spectroradiometer: Characterization and effects on output reflectance. IEEE Trans. Geosci. Remote Sens. 2014, 52, 920–928. [Google Scholar] [CrossRef]
  34. Liu, L.; Zhang, Y.; Jiao, Q.; Peng, D. Assessing photosynthetic light-use efficiency using a solar-induced chlorophyll fluorescence and photochemical reflectance index. Int. J. Remote Sens. 2013, 34, 4264–4280. [Google Scholar] [CrossRef]
  35. Gamon, J.A.; Bond, B. Effects of irradiance and photosynthetic downregulation on the photochemical reflectance index in Douglas-fir and ponderosa pine. Remote Sens. Environ. 2013, 135, 141–149. [Google Scholar] [CrossRef]
  36. Genty, B.; Briantais, J.M.; Baker, N.R. The relatioship between the quantum yield of photosynthetic electron transport and quenching of chlorophyll fluorescence. Biochim. Biophys. Acta 1989, 990, 87–92. [Google Scholar] [CrossRef]
  37. Lichtenthaler, H.K. Chlorophylls and carotenoids: Pigments of photosynthetic biomembranes. Methods Enzymol. 1987, 148, 350–382. [Google Scholar] [CrossRef]
  38. Gotelli, N.J.; Ellison, A. Framing and testing hypotheses. In A Primer of Ecological Statistics; Sinauer: Sunderland, MA, USA, 2004; pp. 79–106. [Google Scholar]
  39. Gamon, J.A.; Serrano, L.; Surfus, J.S. The photochemical reflectance index: An optical indicator of photosynthetic radiation use efficiency across species, functional types, and nutrient levels. Oecologia 1997, 112, 492–501. [Google Scholar] [CrossRef] [PubMed]
  40. Savitch, L.V.; Leonardos, E.D.; Krol, M.; Jansson, S.; Grodzinski, B.; Huner, N.P.A.; Öquist, G. Two different strategies for light utilization in photosynthesis in relation to growth and cold acclimation. Plant Cell Environ. 2002, 25, 761–771. [Google Scholar] [CrossRef] [Green Version]
  41. Gilmore, A.M.; Björkman, O. Temperature-sensitive coupling and uncoupling of ATPase-mediated, nonradiative energy dissipation: Similarities between chloroplasts and leaves. Planta 1995, 197, 646–654. [Google Scholar] [CrossRef]
  42. Eskling, M.; Arvidsson, P.O.; Akerlund, H.E. The xanthophyll cycle, its regulation and components. Physiol. Plant. 1997, 100, 806–816. [Google Scholar] [CrossRef]
  43. Adams, W.W.; Demmig-Adams, B. The xanthophyll cycle and sustained thermal energy dissipation activity in Vinca minor and Euonymus kiautschovicus in winter. Plant Cell Environ. 1995, 18, 117–127. [Google Scholar] [CrossRef]
  44. Zarter, C.R.; Adams, W.W.; Ebbert, V.; Adamska, I.; Jansson, S.; Demmig-Adams, B. Winter acclimation of PsbS and related proteins in the evergreen Arctostaphylos uva-ursi as influenced by altitude and light environment. Plant Cell Environ. 2006, 29, 869–878. [Google Scholar] [CrossRef] [PubMed] [Green Version]
  45. Kirchgeßner, H.D.; Reichert, K.; Hauff, K.; Steinbrecher, R.; Schnitzler, J.P.; Pfündel, E.E. Light and temperature, but not UV radiation, affect chlorophylls and carotenoids in Norway spruce needles (Picea abies (L.) Karst.). Plant Cell Environ. 2003, 26, 1169–1179. [Google Scholar] [CrossRef]
  46. Ensminger, I.; Busch, F.; Huner, N.P.A. Photostasis and cold acclimation: Sensing low temperature through photosynthesis. Physiol. Plant. 2006, 126, 28–44. [Google Scholar] [CrossRef]
  47. Demmig-Adams, B.; Cohu, C.M.; Muller, O.; Adams, W.W. Modulation of photosynthetic energy conversion efficiency in nature: From seconds to seasons. Photosynth. Res. 2012, 113, 75–88. [Google Scholar] [CrossRef] [PubMed]
  48. Evain, S.; Flexas, J.; Moya, I. A new instrument for passive remote sensing: 2. Measurement of leaf and canopy reflectance changes at 531 nm and their relationship with photosynthesis and chlorophyll fluorescence. Remote Sens. Environ. 2004, 91, 175–185. [Google Scholar] [CrossRef]
  49. Cordon, G.; Lagorio, M.G.; Paruelo, J.M. Chlorophyll fluorescence, photochemical reflective index and normalized difference vegetative index during plant senescence. J. Plant Physiol. 2016, 199, 100–110. [Google Scholar] [CrossRef] [PubMed]
  50. Rahimzadeh-Bajgiran, P.; Munehiro, M.; Omasa, K. Relationships between the photochemical reflectance index (PRI) and chlorophyll fluorescence parameters and plant pigment indices at different leaf growth stages. Photosynth. Res. 2012, 113, 261–271. [Google Scholar] [CrossRef] [PubMed]
  51. Di Marco, G.; Manes, F.; Tricoli, D.; Vitale, E. Fluorescence Parameters Measured Concurrently with Net Photosynthesis to Investigate Chloroplastic CO2 Concentration in Leaves of Quercus ilex L. J. Plant Physiol. 1990, 136, 538–543. [Google Scholar] [CrossRef]
  52. Baker, N.R. Chlorophyll fluorescence: A probe of photosynthesis in vivo. Annu. Rev. Plant Biol. 2008, 59, 89–113. [Google Scholar] [CrossRef] [PubMed]
  53. Busch, F.; Huner, N.P.A.; Ensminger, I. Biochemical constrains limit the potential of the photochemical reflectance index as a predictor of effective quantum efficiency of photosynthesis during the winter spring transition in Jack pine seedlings. Funct. Plant Biol. 2009, 36, 1016–1026. [Google Scholar] [CrossRef]
  54. Caffarri, S.; Tibiletti, T.; Jennings, R.C.; Santabarbara, S. A comparison between plant photosystem I and photosystem II architecture and functioning. Curr. Protein Pept. Sci. 2014, 15, 296–331. [Google Scholar] [CrossRef] [PubMed]
  55. Fréchette, E.; Wong, C.Y.S.; Junker, L.V.; Chang, C.Y.Y.; Ensminger, I. Zeaxanthin-independent energy quenching and alternative electron sinks cause a decoupling of the relationship between the photochemical reflectance index (PRI) and photosynthesis in an evergreen conifer during spring. J. Exp. Bot. 2015, 66, 7309–7323. [Google Scholar] [CrossRef] [PubMed] [Green Version]
  56. Porcar-Castell, A.; Garcia-Plazaola, J.I.; Nichol, C.J.; Kolari, P.; Olascoaga, B.; Kuusinen, N.; Fernández-Marín, B.; Pulkkinen, M.; Juurola, E.; Nikinmaa, E. Physiology of the seasonal relationship between the photochemical reflectance index and photosynthetic light use efficiency. Oecologia 2012, 170, 313–323. [Google Scholar] [CrossRef] [PubMed]
  57. Ivanov, A.; Sane, P.; Zeinalov, Y.; Malmberg, G.; Gardeström, P.; Huner, N.; Öquist, G. Photosynthetic electron transport adjustments in overwintering Scots pine (Pinus sylvetris L.). Planta 2001, 213, 575–585. [Google Scholar] [CrossRef] [PubMed]
  58. Huang, W.; Zhang, S.B.; Cao, K.F. Stimulation of cyclic electron flow during recovery after chilling-induced photoinhibition of PSII. Plant Cell Physiol. 2010, 51, 1922–1928. [Google Scholar] [CrossRef] [PubMed]
  59. Hald, S.; Pribil, M.; Leister, D.; Gallois, P.; Johnson, G.N. Competition between linear and cyclic electron flow in plants deficient in Photosystem I. Biochim. Biophys. Acta Bioenerg. 2008, 1777, 1173–1183. [Google Scholar] [CrossRef] [PubMed] [Green Version]
  60. Sharkey, T.D.; Zhang, R. High Temperature Effects on Electron and Proton Circuits of Photosynthesis. J. Integr. Plant Biol. 2010, 52, 712–722. [Google Scholar] [CrossRef] [PubMed]
  61. Bukhov, N.G.; Wiese, C.; Neimanis, S.; Heber, U. Heat sensitivity of chloroplasts and leaves: Leakage of protons from thylakoids and reversible activation of cyclic electron transport. Photosynth. Res. 1999, 59, 81–93. [Google Scholar] [CrossRef]
  62. Nichol, C.J.; Huemmrich, K.F.; Black, T.A.; Jarvis, P.G.; Walthall, C.L.; Grace, J.; Hall, F.G. Remote sensing of photosynthetic-light-use efficiency of boreal forest. Agric. For. Meteorol. 2000, 101, 131–142. [Google Scholar] [CrossRef] [Green Version]
  63. Filella, I.; Porcar-Castell, A.; Munné-Bosch, S.; Bäck, J.; Garbulsky, M.F.; Peñuelas, J. PRI assessment of long-term changes in carotenoids/chlorophyll ratio and short-term changes in de-epoxidation state of the xanthophyll cycle. Int. J. Remote Sens. 2009, 30, 4443–4455. [Google Scholar] [CrossRef]
  64. Damm, A.; Guanter, L.; Verhoef, W.; Schläpfer, D.; Garbari, S.; Schaepman, M.E. Impact of varying irradiance on vegetation indices and chlorophyll fluorescence derived from spectroscopy data. Remote Sens. Environ. 2015, 156, 202–215. [Google Scholar] [CrossRef]
  65. Goerner, A.; Reichstein, M.; Rambal, S. Tracking seasonal drought effects on ecosystem light use efficiency with satellite-based PRI in a Mediterranean forest. Remote Sens. Environ. 2009, 113, 1101–1111. [Google Scholar] [CrossRef]
  66. Coops, N.C.; Hermosilla, T.; Hilker, T.; Andrew Black, T. Linking stand architecture with canopy reflectance to estimate vertical patterns of light-use efficiency. Remote Sens. Environ. 2017, 194, 322–330. [Google Scholar] [CrossRef]
  67. Hall, F.G.; Hilker, T.; Coops, N.C.; Lyapustin, A.; Huemmrich, K.F.; Middleton, E.; Margolis, H.; Drolet, G.; Black, T.A. Multi-angle remote sensing of forest light use efficiency by observing PRI variation with canopy shadow fraction. Remote Sens. Environ. 2008, 112, 3201–3211. [Google Scholar] [CrossRef] [Green Version]
  68. Garbulsky, M.F.; Peñuelas, J.; Papale, D.; Filella, I. Remote estimation of carbon dioxide uptake by a Mediterranean forest. Glob. Chang. Biol. 2008, 14, 2860–2867. [Google Scholar] [CrossRef] [Green Version]
  69. Wong, C.Y.S.; Gamon, J.A. Three causes of variation in the photochemical reflectance index (PRI) in evergreen conifers. New Phytol. 2015, 206, 187–195. [Google Scholar] [CrossRef] [PubMed]
  70. Cavender-Bares, J.; Apostol, S.; Moya, I.; Briantais, J.M.; Bazzaz, F.A. Chilling-induced photoinhibition in two oak species: Are evergreen leaves inherently better protected than deciduous leaves? Photosynthetica 1999, 36, 587–596. [Google Scholar] [CrossRef]
  71. Gulías, J.; Flexas, J.; Abadía, A.; Madrano, H. Photosynthetic responses to water deficit in six Mediterranean sclerophyll species: Possible factors explaining the declining distribution of Rhamnus ludovici-salvatoris, an endemic Balearic species. Tree Physiol. 2002, 22, 687–697. [Google Scholar] [CrossRef] [PubMed]
  72. Ishida, A.; Yamazaki, J.Y.; Harayama, H.; Yazaki, K.; Ladpala, P.; Nakano, T.; Adachi, M.; Yoshimura, K.; Panuthai, S.; Staporn, D.; et al. Photoprotection of evergreen and drought-deciduous tree leaves to overcome the dry season in monsoonal tropical dry forests in Thailand. Tree Physiol. 2014, 34, 15–28. [Google Scholar] [CrossRef] [PubMed]
  73. Dobrowski, S.Z.; Pushnik, J.C.; Zarco-Tejada, P.J.; Ustin, S.L. Simple reflectance indices track heat and water stress-induced changes in steady-state chlorophyll fluorescence at the canopy scale. Remote Sens. Environ. 2005, 97, 403–414. [Google Scholar] [CrossRef]
  74. Coops, N.C.; Hilker, T.; Hall, F.G.; Nichol, C.J.; Drolet, G.G. Estimation of light-use efficiency of terrestrial ecosystems from space: A status report. Bioscience 2010, 60, 788–797. [Google Scholar] [CrossRef]
  75. Soudani, K.; Hmimina, G.; Dufrêne, E.; Berveiller, D.; Delpierre, N.; Ourcival, J.M.; Rambal, S.; Joffre, R. Relationships between photochemical reflectance index and light-use efficiency in deciduous and evergreen broadleaf forests. Remote Sens. Environ. 2014, 144, 73–84. [Google Scholar] [CrossRef]
  76. Zhang, Q.; Ju, W.; Chen, J.M.; Wang, H.; Yang, F.; Fan, W.; Huang, Q.; Zheng, T.; Feng, Y.; Zhou, Y.; et al. Ability of the photochemical reflectance index to track light use efficiency for a sub-tropical planted coniferous forest. Remote Sens. 2015, 7, 16938–16962. [Google Scholar] [CrossRef]
  77. Ripullone, F.; Rivelli, A.R.; Baraldi, R.; Guarini, R.; Guerrieri, R.; Magnani, F.; Peñuelas, J.; Raddi, S.; Borghetti, M. Effectiveness of the photochemical reflectance index to track photosynthetic activity over a range of forest tree species and plant water statuses. Funct. Plant Biol. 2011, 38, 177–186. [Google Scholar] [CrossRef]
  78. Zhang, Q.; Chen, J.M.; Ju, W.; Wang, H.; Qiu, F.; Yang, F.; Fan, W.; Huang, Q.; Wang, Y.P.; Feng, Y.; et al. Improving the ability of the photochemical reflectance index to track canopy light use efficiency through differentiating sunlit and shaded leaves. Remote Sens. Environ. 2017, 194, 1–15. [Google Scholar] [CrossRef]
  79. Zhang, C.; Filella, I.; Liu, D.; Ogaya, R.; Llusià, J.; Asensio, D.; Peñuelas, J. Photochemical Reflectance Index (PRI) for detecting responses of diurnal and seasonal photosynthetic activity to experimental drought and warming in a Mediterranean shrubland. Remote Sens. 2017, 9, 1189. [Google Scholar] [CrossRef]
  80. García-Plazaola, J.I.; Esteban, R.; Fernández-Marín, B.; Kranner, I.; Porcar-Castell, A. Thermal energy dissipation and xanthophyll cycles beyond the Arabidopsis model. Photosynth. Res. 2012, 113, 89–103. [Google Scholar] [CrossRef] [PubMed]
  81. Hilker, T.; Hall, F.G.; Coops, N.C.; Lyapustin, A.; Wang, Y.; Nesic, Z.; Grant, N.; Black, T.A.; Wulder, M.A.; Kljun, N.; et al. Remote sensing of photosynthetic light-use efficiency across two forested biomes: Spatial scaling. Remote Sens. Environ. 2010, 114, 2863–2874. [Google Scholar] [CrossRef]
Figure 1. Examples of diurnal photochemical reflectance index (PRI) courses in European beech (A) and Norway spruce (B) saplings during regimes of high photosynthetically active radiation (PAR) intensity and high temperature (HI–HT), high PAR intensity and low temperature (HI–LT), and high PAR intensity and the highest of three different high temperature conditions (HI–HT3).
Remotesensing 10 01202 g001
Figure 2. Content of total chlorophylls (Chla+b) and carotenoids (Carx+c) expressed per mg fresh weight (FW) before dawn for European beech (A) and Norway spruce (B) in response to five consecutive regimes of photosynthetically active radiation (PAR) intensity and temperature (LI–LT, HI–HT, HI–HT2, HI–LT, and HI–HT3). Lowercase letters in the regime labels indicate data from measurements at the beginning (a) and end (b) of acclimation to the given regime. Means (columns) and standard deviations (error bars) are presented (n = 3). Letters above the bars indicate homogeneous groups (p < 0.05; Tukey’s post hoc test) separately for each parameter. Different letters represent statistically significant differences between means.
Remotesensing 10 01202 g002
Figure 3. Total chlorophyll/carotenoid ratio (Chla+b/Carx+c) in European beech (A) and Norway spruce (B) saplings in response to five consecutive regimes of irradiation and temperature (LI–LT, HI–HT, HI–HT2, HI–LT, and HI–HT3). Lowercase letters in the regime labels indicate data from measurements at the beginning (a) and end (b) of acclimation to the given regime. Means (columns) and standard deviations (error bars) are presented (n = 3). Letters above the bars indicate homogeneous groups (p < 0.05; Tukey’s post hoc test), different letters represent statistically-significant differences between means.
Remotesensing 10 01202 g003
Figure 4. Changes in maximum quantum yield of photosystem II photochemistry (Fv/Fm) measured on dark-adapted leaves and needles at predawn in response to five consecutive regimes of photosynthetically active radiation (PAR) intensity and temperature (LI–LT, HI–HT, HI–HT2, HI–LT, and HI–HT3). Lowercase letters in the regime labels indicate data from measurements at the beginning (a) and end (b) of acclimation to the given regime. Means (points) and standard deviations (error bars) of the measurements on European beech (black points) and Norway spruce (grey points) are presented (n = 6). Letters above (spruce) and below (beech) the error bars indicate homogeneous groups (p < 0.05; Tukey’s post hoc test) within individual tree species. Different letters represent statistically significant differences between means.
Remotesensing 10 01202 g004
Figure 5. Changes in actual quantum yield of photosystem II photochemistry (ΦPSII, (A,B)), non-photochemical fluorescence quenching (NPQ, (C,D)), and photochemical fluorescence quenching (qP, (E,F)) in response to five consecutive regimes of photosynthetically active radiation (PAR) intensity and temperature (LI–LT, HI–HT, HI–HT2, HI–LT, and HI–HT3). Lowercase letters in the regime labels indicate data from measurements at the beginning (a) and end (b) of acclimation to the given regime. Data from morning (grey lines and points) and noon (black lines and points) measurements are shown. Means (points) and standard deviations (error bars) of the measurements are presented (n = 6). Letters indicate homogeneous groups (p < 0.05; Tukey’s post hoc test) separately for morning and noon measurements. Different letters represent statistically significant differences between the means.
Remotesensing 10 01202 g005
Figure 6. Changes in the rate of CO2 assimilation (A, (A,B)), stomatal conductance (Gs, (C,D)), and transpiration (Tr, (E,F)) in response to five consecutive regimes of photosynthetically active radiation (PAR) intensity and temperature (LI–LT, HI–HT, HI–HT2, HI–LT, and HI–HT3). Lowercase letters in the regime labels indicate data from measurements at the beginning (a) and end (b) of acclimation to the given regime. Data from morning (grey lines and points) and noon (black lines and points) measurements are shown. Means (points) and standard deviations (error bars) of the measurements are presented (n = 6). Different letters indicate significant differences between the means of the noon values (p < 0.05; Tukey’s post hoc test).
Remotesensing 10 01202 g006
Figure 7. Dynamics of changes in photochemical reflectance index (PRI; black or grey points), reference PRI (PRI0; blue points), and differential PRI (ΔPRI; red points) in response to five consecutive regimes of irradiation and temperature (LI–LT, HI–HT, HI–HT2, HI–LT, and HI–HT3) in European beech (A) and Norway spruce (B) saplings. Alternations between black and grey indicate different regimes of photosynthetically active radiation (PAR) intensity and temperature. Dynamics are for reflectance factor at 570 (C,D) and 531 nm (E,F) for beech and spruce saplings, respectively.
Remotesensing 10 01202 g007
Figure 8. Two-dimensional canonical graph of the variable factorial map (correlation circle of the principal component analysis) showing interactions between spectral information (PRI, photochemical reflectance index; ΔPRI, differential PRI), environmental conditions inside growth chambers (PAR, photosynthetically active radiation; T, temperature; VPD, vapor-pressure deficit), data measured with the use of active fluorimeter (ΦPSII, quantum yield of photosystem II photochemistry; qP, photochemical fluorescence quenching; NPQ, non-photochemical quenching), gas-exchange system (A, CO2 assimilation; LUE, light use efficiency; Gs, stomatal conductance; Tr, transpiration) and foliar pigment (chlorophyll and carotenoids) contents (Chla+b, Carx+c, Chla+b/Carx+c). Direction indicate responsibility for PC1 (horizontal) or for PC2 (vertical), length reflect the correlations between active variables and principal components. Angle between variable shifts indicates correlation between variables vectors, and values are listed in Supplementary Figures S2 and S3.
Remotesensing 10 01202 g008
Figure 9. Relationships between actual quantum yield of photosystem II photochemistry (ΦPSII), non-photochemical fluorescence quenching (NPQ), light-use efficiency (LUE), photochemical reflectance index (PRI), and differential PRI (ΔPRI) in European beech saplings. Means (points) and standard deviations (error bars) are presented (n = 6). Each point represents one of five measurements during the nine measuring days. Exponential regressions have been estimated for 45 pairs of data points. Asterisks indicate statistical significance of the coefficients of determination (R2): * p < 0.05, ** p < 0.01, and *** p < 0.001.
Remotesensing 10 01202 g009
Figure 10. Relationships between actual quantum yield of photosystem II photochemistry (ΦPSII), non-photochemical fluorescence quenching (NPQ), light-use efficiency (LUE), photochemical reflectance index (PRI), and ΔPRI in Norway spruce saplings. Means (points) and standard deviations (error bars) are presented (n = 6). Each point represents one of five measurements during the nine measuring days. Exponential regressions have been estimated for 45 pairs of data points. Asterisks indicate statistical significance of the coefficients of determination (R2): * p < 0.05, ** p < 0.01, and *** p < 0.001.
Remotesensing 10 01202 g010
Figure 11. Relationships of noon photochemical reflectance index (PRI) measured under a photosynthetically active radiation (PAR) irradiance of 1200 µmol m−2 s−1 (PRI1200, (A,B)), the corresponding differential PRI (ΔPRI1200, (C,D)), and morning PRI (PRI0, (E,F)) of each day measured under a PAR intensity of 100 µmol m−2 s−1 with the foliar Chla+b/Carx+c ratio in dark-adapted leaves and needles. Linear regressions have been estimated for eight pairs of data-points (individual days of measurement). Statistical significance of the coefficients of determination (R2) is indicated: ** p < 0.01, non-significant (ns).
Remotesensing 10 01202 g011
Table 1. Daily courses of photosynthetically active radiation intensity (PAR), air temperature (T), relative air humidity (RH), and vapor-pressure deficit (VPD) in growth chambers during the individual combined regimes of PAR intensity and temperature.
Regime 07:3008:0010:0012:0014:0016:0019:0021:30
LI–LTPAR(µmol m−2 s−1)1002002503002502001000
HI–HT10030060012006003001000
HI–HT210030060012006003001000
HI–LT10030060012006003001000
HI–HT310030060012006003001000
LI–LTT(°C)1416182118161412
HI–HT1720222622201715
HI–HT22527313531272522
HI–LT1416182118161412
HI–HT32729333733292724
LI–LTRH(%)7060555055607080
HI–HT6855504550556880
HI–HT26855504550556880
HI–LT7060555055607080
HI–HT36550454045506580
LI–LTVPD(kPa) 0.730.931.240.930.73
HI–HT 1.051.321.851.321.05
HI–HT2 1.602.253.092.251.60
HI–LT 0.730.931.240.930.73
HI–HT3 2.002.773.762.772.00

