Article

Evaluation of the Effectiveness of Irrigation and Slow-Release Fertilizer Application on Carrots in Reducing Greenhouse Gas (GHG) Emissions


1
Faculty of Agriculture and Economics, University of Agriculture in Krakow, 31-120 Krakow, Poland
2
Department of Biosystems Engineering, Faculty of Engineering, Alanya Alaaddin Keykubat University, 07425 Alanya, Turkey
3
Faculty of Engineering and Economics, Ignacy Mościcki University of Applied Sciences in Ciechanów, Narutowicza 9, 06-400 Ciechanów, Poland
4
Department of Processing Technology, Standardization and Certification of Agricultural Products, Faculty of Processing Technology and Product Standardization, Livestock and Biotechnology, Samarkand State University of Veterinary Medicine, Samarkand 140103, Uzbekistan
5
Department of Statistics and Social Policy, Faculty of Agriculture and Economics, University of Agriculture in Krakow, al. Mickiewicza 21, 30-120 Krakow, Poland
6
Faculty of Agroeconomics, Logistics and Services, Tashkent State Agrarian University, Universitet Ko’chasi 2, Tashkent 100142, Uzbekistan
*
Authors to whom correspondence should be addressed.
Sustainability 2026, 18(7), 3513; https://doi.org/10.3390/su18073513
Submission received: 2 February 2026 / Revised: 13 March 2026 / Accepted: 20 March 2026 / Published: 3 April 2026

Abstract

The optimization of crop production in the context of agricultural land use and production inputs is a strategic element of sustainable development. Fertilization and irrigation are vital components of agricultural engineering, driving crop quantity and quality. The objective of the study discussed here was to assess greenhouse gas emissions from carrot cultivation depending on the variant of the fertilization and irrigation processes. One tonne of marketable carrot yield was selected as the functional unit. A controlled field experiment in a split-plot configuration was carried out to deliver the objective. Calculation of the total quantity of greenhouse gases emitted from the crop was carried out according to ISO 14040 and ISO 14044. Boundaries of the system encompassed the production and use of fertilizers and pesticides, the consumption of energy for agro-engineering activities and irrigation, as well as GHG emissions from soil resources and crop residue. The reference unit for the study was an object (plot) irrigated according to production practice in the area where the study was conducted. Under those conditions, greenhouse gas emissions totaled 75.68 kg CO2 ⸱ t−1 of the commercial product. Optimization, involving precise irrigation and fertilization using slow-release fertilizers, reduced the carbon footprint to 54.33 kg CO2 ⸱ t−1 of the commercial product. GHG emissions were thus reduced by 30%. The use of slow-release fertilizers resulted in a reduction of total greenhouse gas emissions per unit of marketable yield by 15% for non-irrigated crops and by 17% for irrigated crops. Irrigation, in turn, resulted in a reduction of total GHG emissions by 8% for conventional fertilization and by 11% for slow-release fertilization.

1. Introduction

The dynamic growth of the global population and the increasing level of affluence requires that the volume of food produced globally increase. The growing consumption of food products also results in longer supply chains, which increases energy consumption for product transport, storage and processing, and in the need to use large quantities of materials for packaging [1]. Increased food production also requires farming in areas where conditions are unfavorable, which also requires a more extensive use of production inputs such as fertilization and irrigation [2,3]. According to the data published by the Food and Agriculture Organization [4], greenhouse gas emissions from agricultural sources have doubled over the last 50 years. One of the primary factors behind global greenhouse gas emissions from agricultural sources is the development of agriculture in developing countries. Greenhouse gas emissions result not only from the direct consumption of fuels and production inputs, but also from changes in the way land is used [5]. Deforestation and transforming permanent grassland into arable land are important factors driving greenhouse gas emissions [6]. Irrigation is a very important source of greenhouse gas emissions from agricultural sources [7].
Agriculture worldwide accounts for 95% of irrigated land, 92% of global water use for irrigation, and 70% of the nitrogen and phosphorus applied to agricultural soils. Nitrogen and phosphorus fertilization, in particular for vegetable crops, is often unreasonable, reducing the economic and environmental efficiency of agricultural production. In 2010, global nitrogen emissions totaled 189 teragrams (Tg), of which 161 Tg came from industry and agriculture [8]. Climate change is driven by the growing quantity of greenhouse gases in the atmosphere. The effect is not only higher average temperatures but also a reduction in the available water resources. Food production systems are particularly vulnerable to climate change, be it in temperature, precipitation, or their quantity and distribution in vegetation season [9]. Climate change results in the mass presence of pests and diseases in areas where they were originally absent. That reduces crop size, which ultimately reduces food security for regions, macro-regions, and globally [10]. The level of risk for food security in the foreseeable future will be driven by the direction and intensity of climate change and the capacity of science and production practice to change production technologies so as to allow optimum utilization of natural resources and production inputs. Agriculture under new climate and soil conditions will require crop species and variety changes and the adaptation of sowing and harvest times [11]. Changes to production technology to allow a reduction in greenhouse gas emissions must be preceded by a thorough survey of the sources of those emissions at the respective stages of crop and animal production. The life cycle assessment methodology is used for that purpose. Irrigation is an important agricultural practice that increases production efficiency and reduces greenhouse gas emissions by improving nitrogen use efficiency. Sikora et al. [12] found that greenhouse gas emissions from irrigation for Chinese cabbage totaled from 4.2 to 11.6 kg CO2 · t−1 of the commercial product, depending on the fertilization strategy. However, the authors emphasize that the irrigation rate was only 80 m3 ⸱ ha−1. Poor management of production inputs inflates costs and increases the impact of crop production on the natural environment. Improving fertilization efficiency and the use of water resources is the best way to improve the economic and environmental efficiency of agriculture [12,13,14,15]. Greenhouse gas emissions from agricultural production also result from the use of fuels and electricity, as well as biogenic dispersion in the environment. Mineral fertilizers not used by crops, mineralized organic fertilizers and soil organic matter result in the emission of carbon dioxide and nitrogen oxides. High rates of methane emissions from irrigated areas can be observed [16]. The consumption of energy is present at all stages of the production, processing and logistics of agricultural products [17]. Elements from the fertilizers that are not used by plants are dispersed into the atmosphere as greenhouse gases and into subsurface and surface water, thus intensifying water eutrophication. Food production at all its stages involves the use of natural resources such as soil, water, space or energy carriers [3,18]. Intensified agricultural production resulting from the need to produce large quantities of affordable food has quickly resulted in environmental degradation in large areas, notably in developed countries, where agricultural activities have been the most intense. The development and implementation of quality management systems in food production was a response of the consumer market to the market presence of products whose quality was not acceptable to quality consumers [15,19]. Despite numerous studies on irrigation and fertilization efficiency, the literature lacks data on an environmental assessment of the combined use of optimized irrigation and slow-release fertilizers. This study hypothesized that irrigation combined with slow-release fertilizers would reduce the carbon footprint of carrot production under Polish climatic conditions, where irrigation is not standard practice but rather an optional technological measure.
The objective of the study under discussion was to assess greenhouse gas emissions from carrot cultivation depending on the process variant and the irrigation system in use. Two experimental factors were used in the experiment. Those were the fertilization technology and the use of irrigation. A total of 1 tonne of commercial yield of carrot was selected as the functional unit.

2. Materials and Methods

The field experiment was conducted in 2022 in a commercial carrot plantation located in the Miechów-Charsznica region (50.396127 N, 19.955614 E), an area characterized by intensive carrot production, where more than 50% of farms do not apply irrigation. The experiment was established on 5 May and terminated with harvest on 17 October 2022. Meteorological conditions during the growing season, particularly total precipitation and temperature distribution, were consistent with long-term averages, indicating that the obtained results are representative for the study region. The experiment was arranged in plots measuring 10 × 10 m. Carrot seeds were sown in soil classified as heavy clay based on its granulometric composition. The experimental design included two factors: fertilization strategy and irrigation regime. Four levels of fertilization were tested under both irrigated and non-irrigated conditions. The experimental crop was carrot (Daucus carota L. ssp. sativus), cultivar “Elegance F1”, characterized by a 135-day growing period. The sowing density was 1.2 million plants per hectare, with an intra-row spacing of 2.5 cm. Plant protection treatments were applied in accordance with the integrated carrot production guidelines issued by the State Plant Health and Seed Inspection Service. The experiment was arranged in a randomized complete block design with four replications (Table 1).
Soil samples were collected prior to the establishment of the experiment to determine baseline physicochemical properties and assess site productivity. Soil pH was measured potentiometrically. Organic carbon (C_org) and total nitrogen (N_tot) contents were determined by dry combustion using a Vario Max Cube elemental analyzer (Elementar, Hamburg, Germany). Mineral nitrogen (N_min) was determined by distillation following extraction with 1 mol·dm−3 K2SO4 solution. Available phosphorus (P) and potassium (K) were determined using the Egner–Riehm method, whereas available calcium (Ca) and magnesium (Mg) were determined using the Schachtschabel method (Table 2).
The estimated production potential of the experimental field was 65 Mg·ha−1 of carrot roots. The experiment compared a multi-component, slow-release NPK fertilizer (19–5–20) containing Ca, Mg, and S (4–4–19.5) with a conventional fertilization regime, consisting of ammonium nitrate (32% N), potassium salt (60% K2O), and triple superphosphate (46% P2O5). Slow-release fertilizers were applied to the ridges during formation prior to sowing. In the conventional system, phosphorus and potassium were applied in full before sowing, while nitrogen was split into two doses. The preceding crop was red beet, fertilized according to its nutrient requirements. Data obtained from the experiment were subsequently used to estimate greenhouse gas emissions associated with the tested production systems.
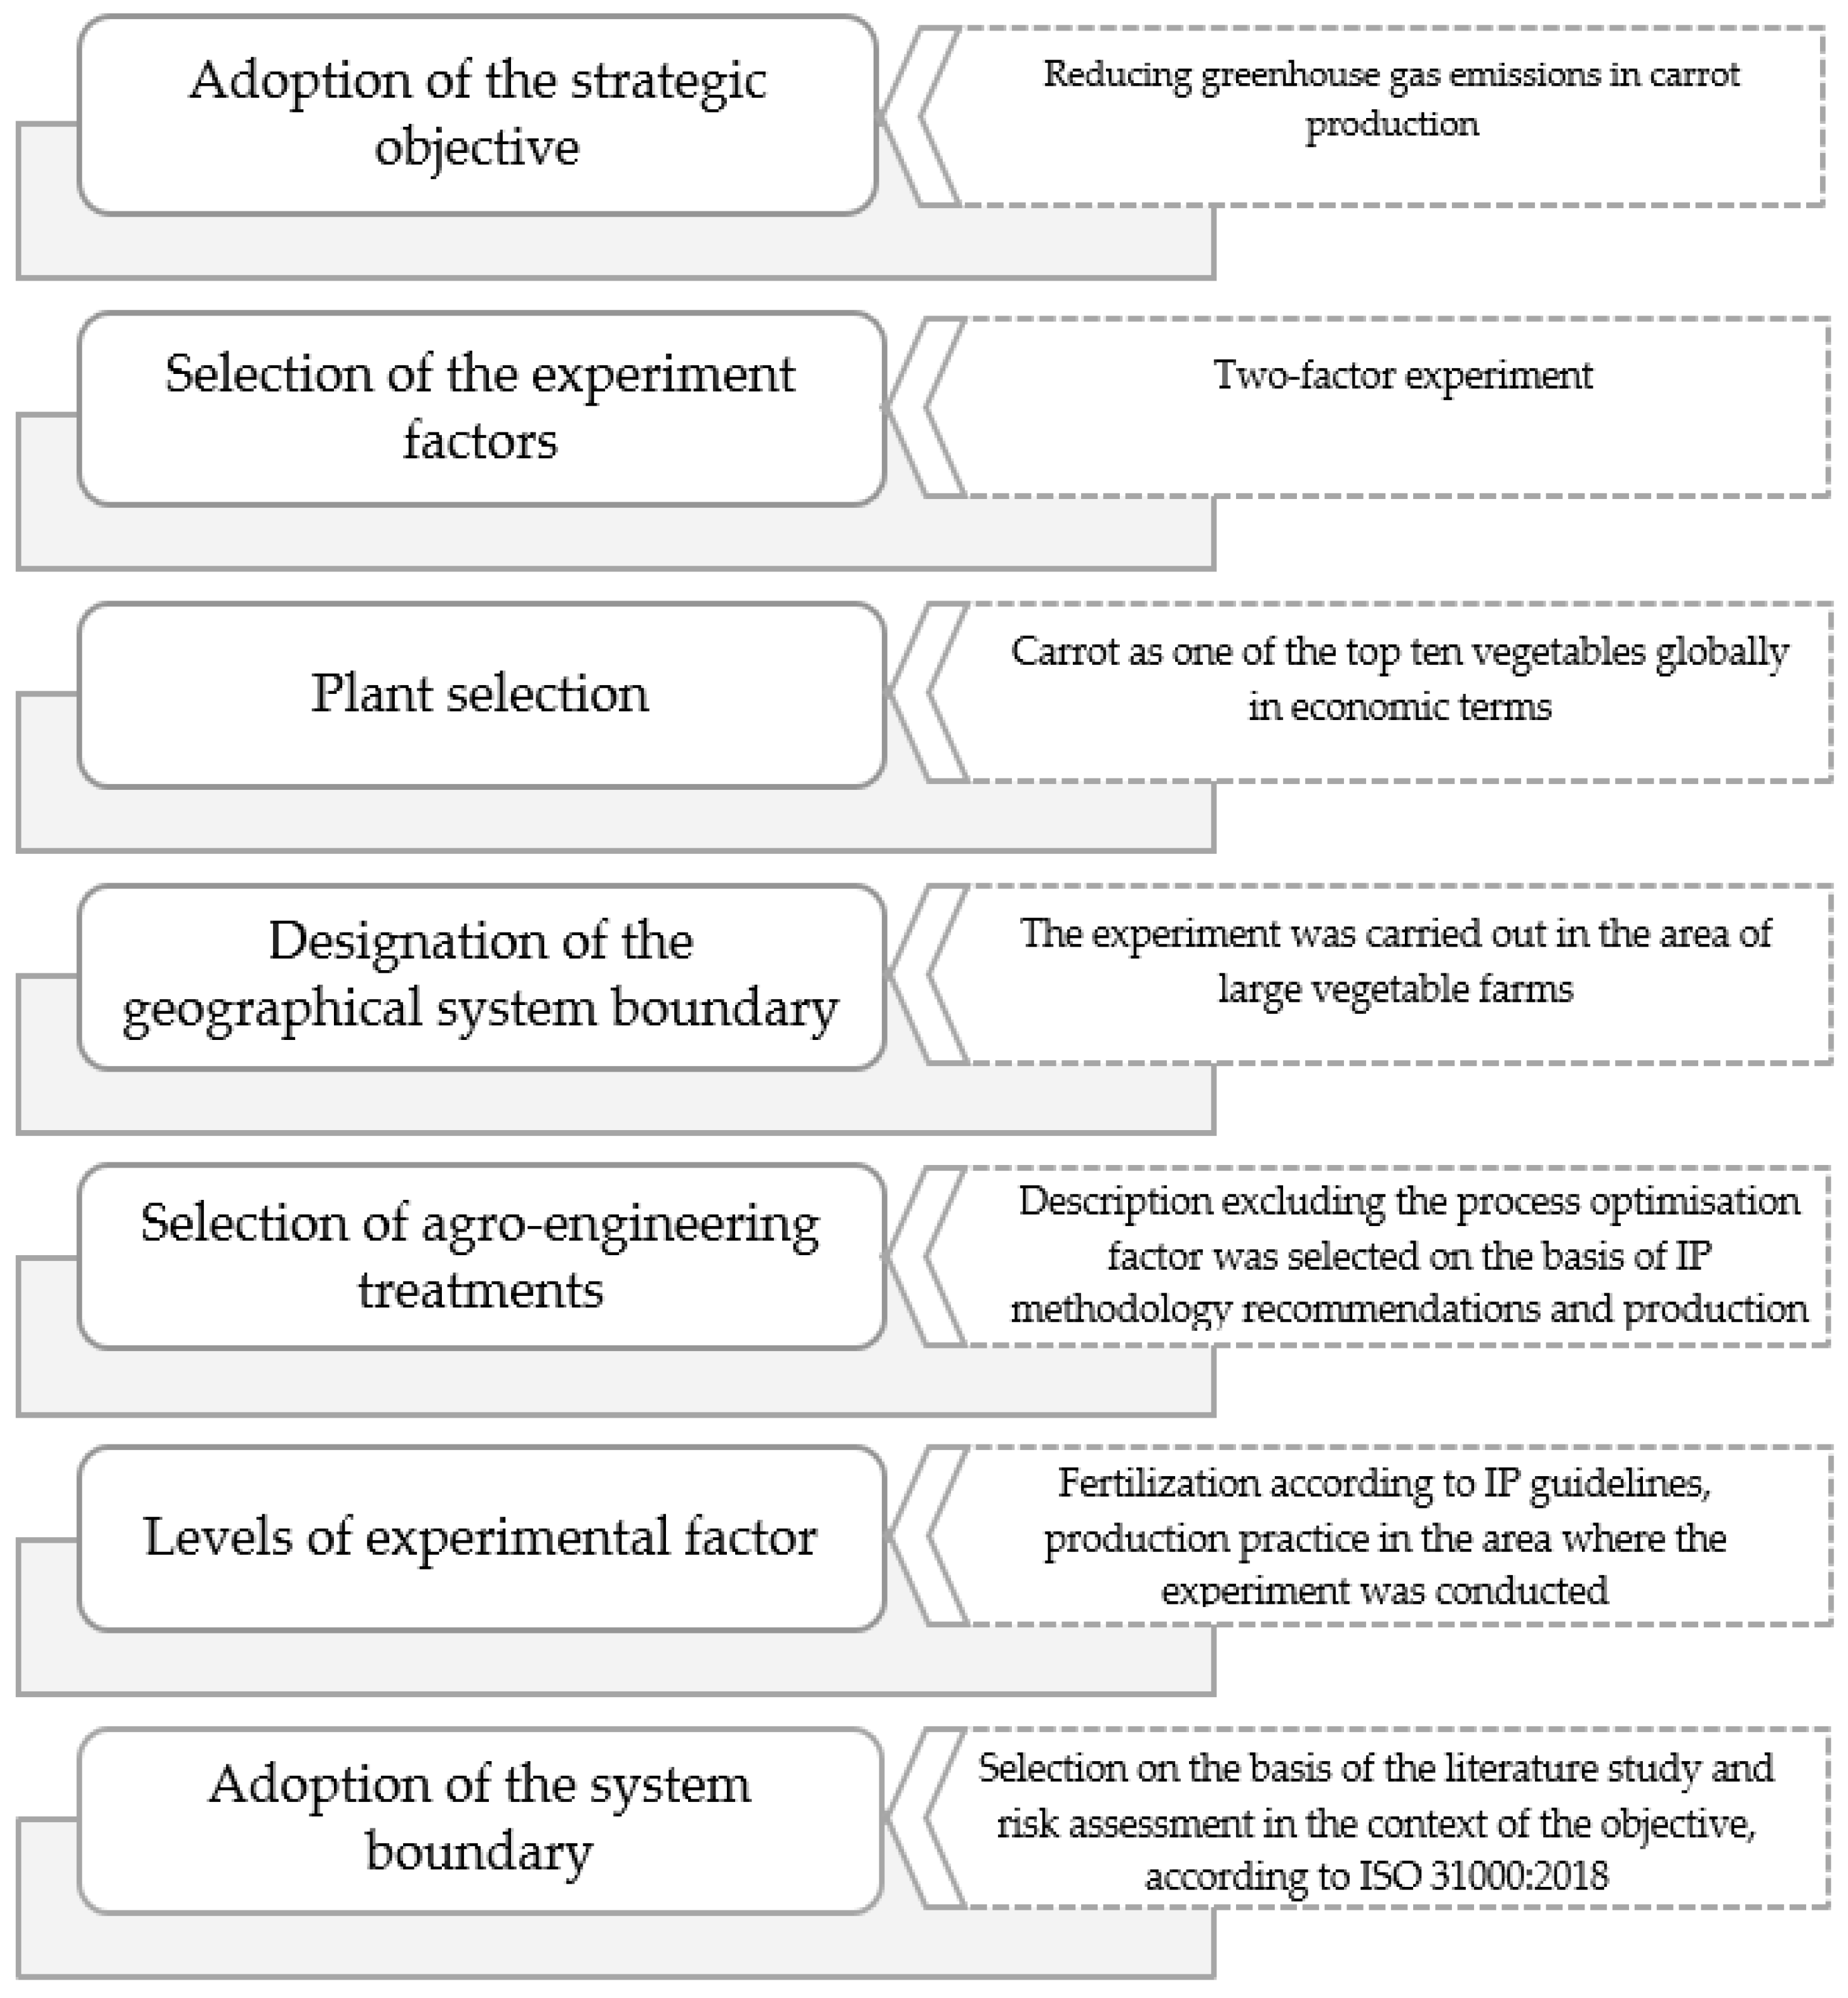
The experiment, in the context of the number of objects, the scope of tests, and the geographical location, was planned on the basis of the assumed quality and quantity objectives and technical capacity [20]. The selection of the test crop, the respective fertilization variants, the scope of agro-engineering treatments, the irrigation level and the time frame for the experiment were all determined on the basis of the risk assessment according to ISO 31000:2018 [21]. The defined risk was the impact of the risk factors mentioned above on the yield from the crop under specific natural and climate conditions. The scope of tests and selection of GHG emission sources were based on the literature on the topic (Figure 1).
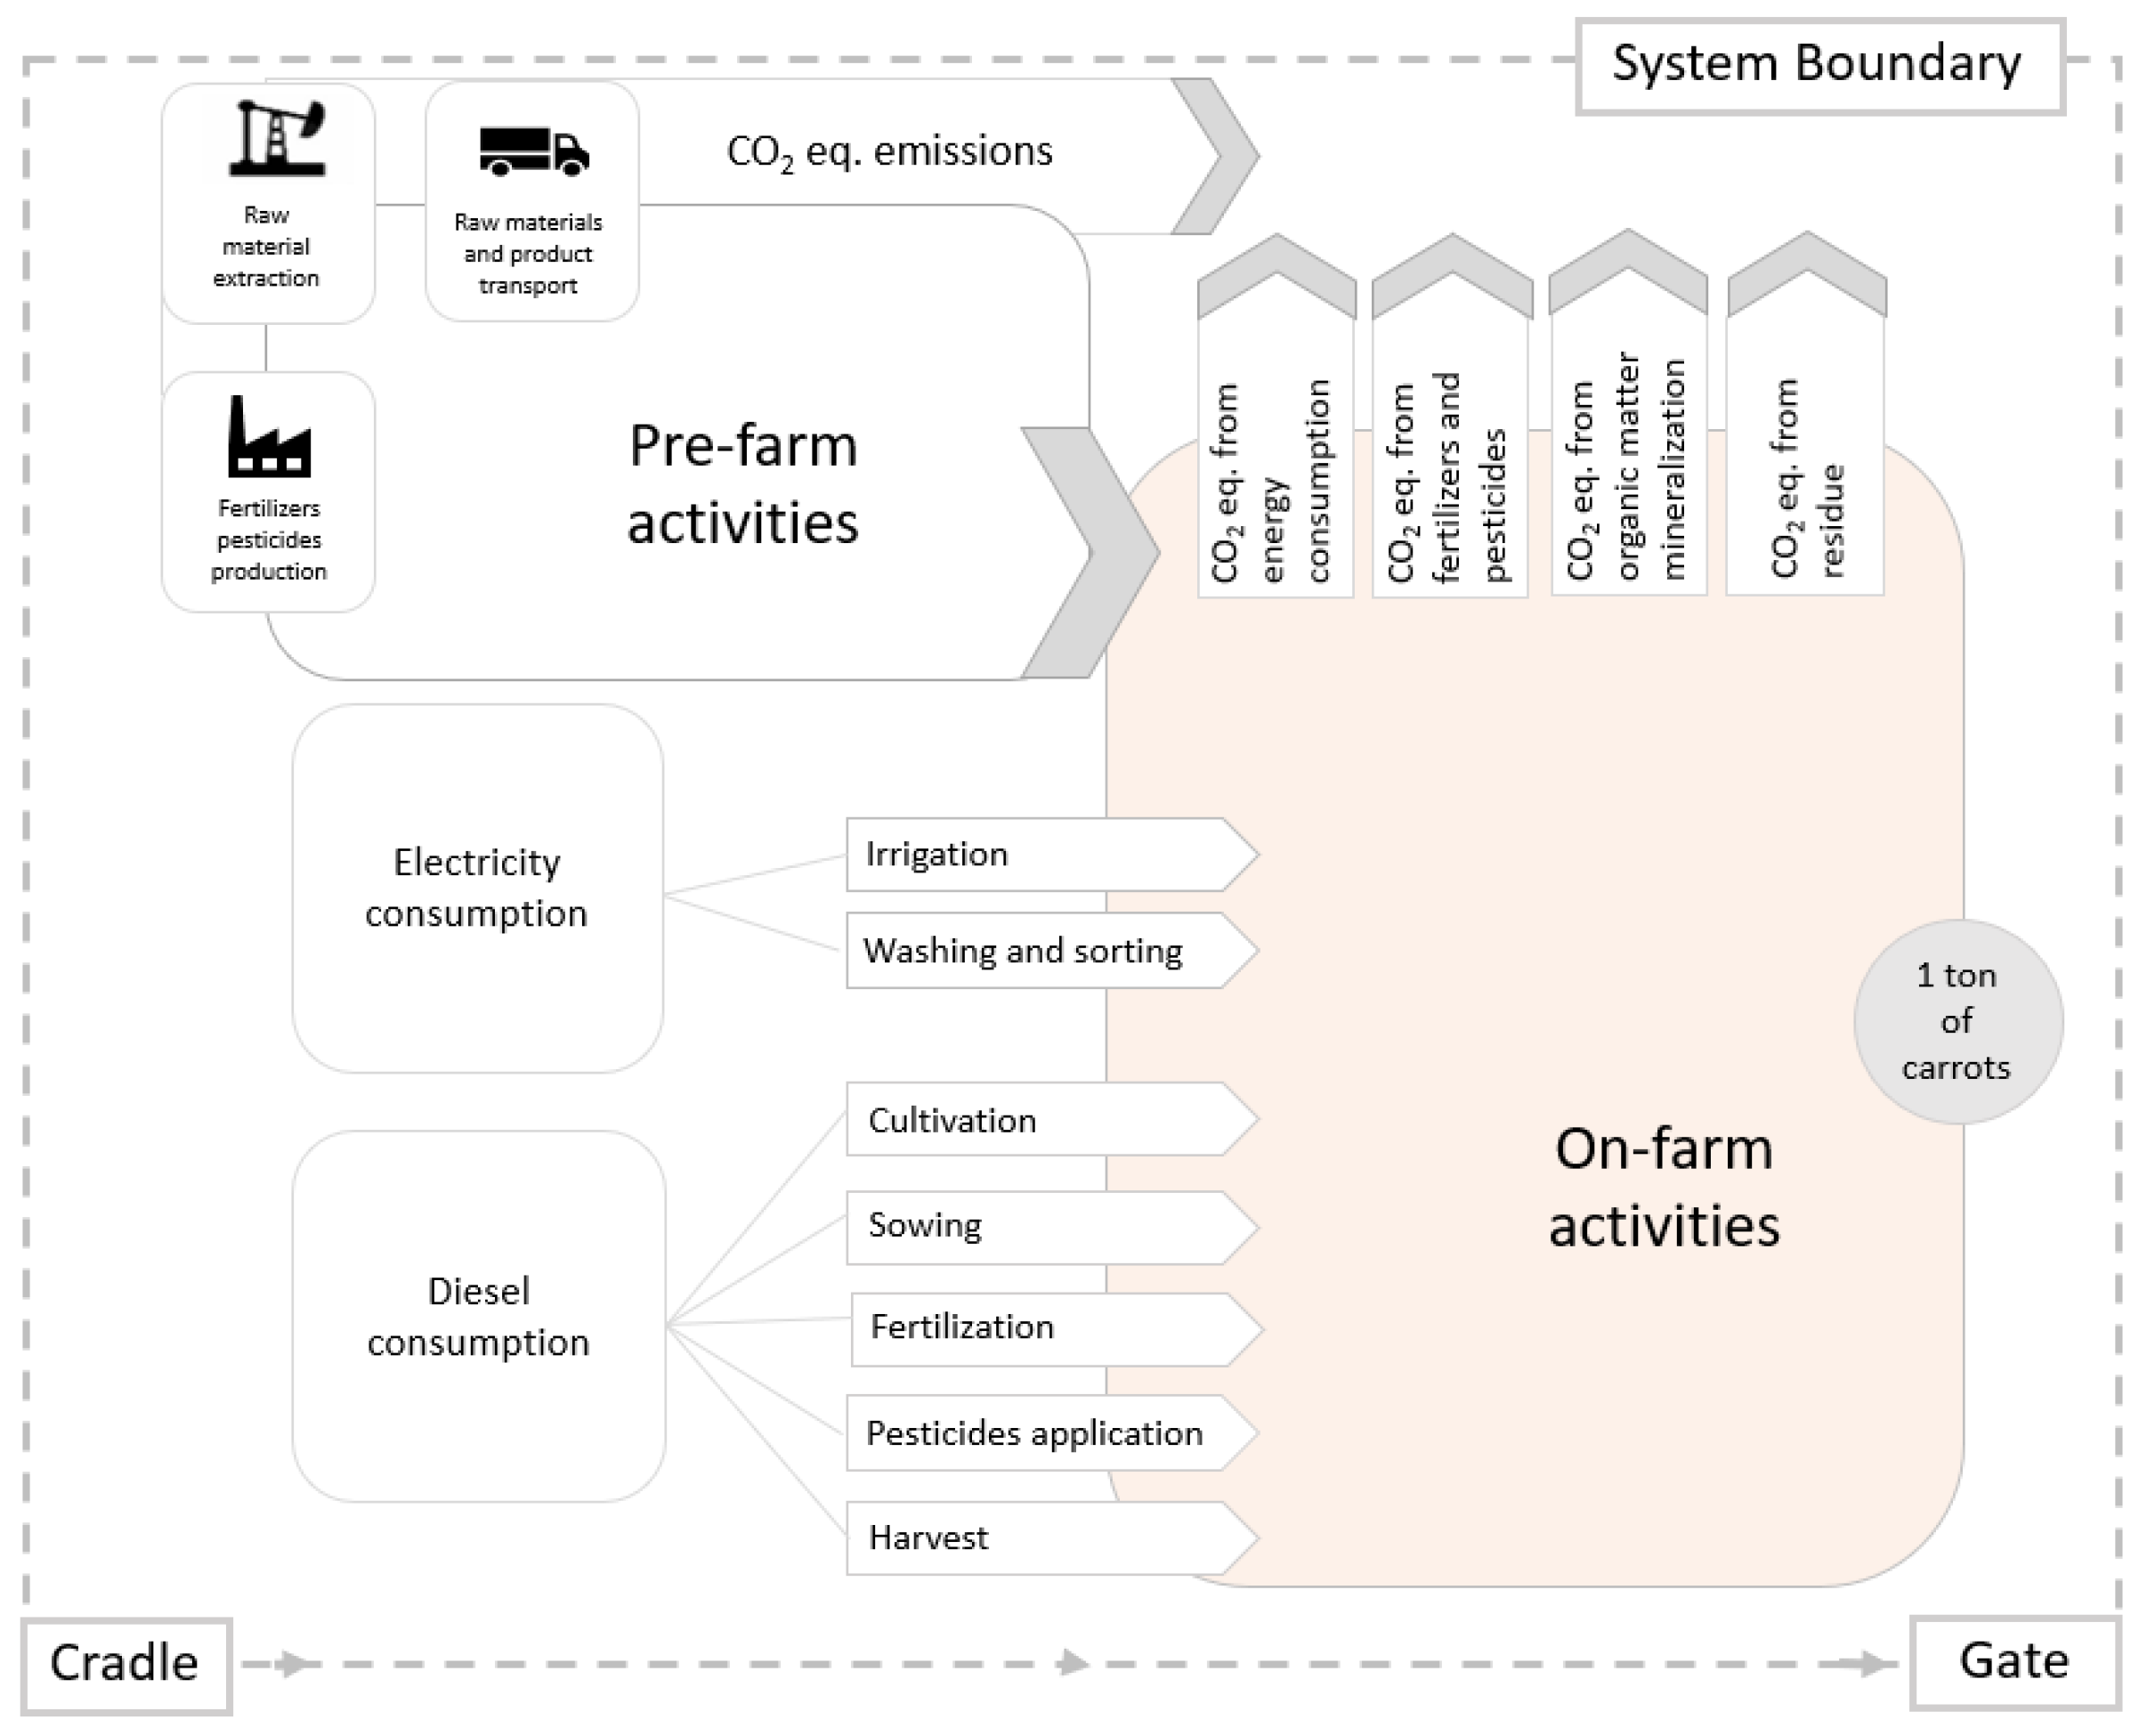
System boundaries (Figure 2) covered:
  • Production of fertilizers and agrochemicals used for crop cultivation, excluding their transport from the production site to the farm;
  • Consumption of energy for field work at the farm;
  • Emissions from the soil—direct and indirect caused by fertilizer use;
  • Emissions from the management of crop residue and emissions from soil mineralization of organic matter;
  • Energy consumption for irrigation.
Figure 1. Experiment design diagram.
Sustainability 18 03513 g001
Figure 2. Selection of system boundaries.
Sustainability 18 03513 g002
The crops were irrigated up to optimum moisture content to eliminate the impact of water stress on the results of the experiment. In the irrigated object, soil moisture was maintained at 65% of the soil’s maximum water-holding capacity. Irrigation was initiated when the moisture level dropped below 60% of the soil’s maximum water-holding capacity. Soil moisture levels were measured using a real-time dielectric method (FDR—frequency domain reflectometry) throughout the experiment. Before the experiment was established, physical–chemical and chemical properties of the soil were examined. The following were determined for the soil: pH, granulometric composition, organic matter content, mineral nitrogen and Kjeldahl nitrogen, and the content of available forms of P, K, Mg, Ca. Soil samples were taken from a depth of 0 to 30 cm
The agricultural system was optimized on the basis of a slow-release multi-ingredient fertilizer, with NPK content (%) 18–05–10 + 4 CaO + 2 Mg (with a two-month nitrogen release period, as specified by the manufacturer), ammonium nitrate, triple superphosphate and 60% potassium salt. The experiment covered 4 fertilization levels and a reference object. The slow-release fertilizer was applied individually under each plant during planting. The fertilizer was applied to a depth of 5–7 cm below the plant-sowing level. Phosphorus and potassium fertilizers were used in full before the sowing, whereas ammonium nitrate was split into two doses: 60% was applied before sowing and 40% after sowing. The timing of top-dressing fertilization was determined based on observations of weather conditions and monitoring of the crop condition. The experiment was conducted in four replications using a randomized block design method. Crop cultivation and protection were carried out on the basis of the integrated carrot production methodology (IP), approved under Article 5(3)(2) of the Act of 18 December 2002 on plant protection (consolidated text: Dz.U. of 2008, No. 133, item 849, as amended, by the chief plant protection and seed inspection inspector). The following agro-engineering treatments were applied: tilling, disk harrowing, ridge formation, sowing of crops, fertilizer use, fertilizer application (three times), application of plant-protection products (seven times), mechanical weed control (once), mechanical harvesting, transportation, sorting and washing of carrots, and irrigation from a 54 m deep well. The distance from the well to the water application point was 200 m. Pesticides were applied mechanically using the tractor sprayer TL 206P-100 manufactured by Traktomix, Kąkolewo, Poland. The experimental factors were the fertilization strategy and the use of irrigation. Weather conditions during the vegetation are given in Table 3. The analysis of greenhouse gas emissions from carrot cultivation was conducted over a single growing season, with precise reference to the prevailing climatic and soil conditions. Variable rainfall and temperature, which influence evaporation and evapotranspiration levels, will have a real impact on the obtained results. Therefore, the obtained results refer to specific climatic conditions, described in detail in the paper.
The following standards were used to determine the impact of carrot production on the environment under various technology conditions: ISO 14040: “Environmental Management—Life Cycle Assessment—Principles and Framework” [22] and ISO 14044: “Environmental Management—Life Cycle Assessment—Requirements” [23]. The analysis was conducted according to the recommendations of [24]. Product transport, packaging, use of agricultural tools and marketing were taken outside the system boundary. In total, 1 t of the commercial product was used as the functional unit. One year was adopted as the time frame. The greenhouse effect generation potential was estimated on the basis of greenhouse gas emissions converted into the carbon dioxide equivalent.
Input data for the calculation of GHG emissions came from 4 irrigated experimental objects and 4 non-irrigated experimental objects (Table 1). GHG emissions for nitrogen production in ammonia nitrate were adopted as 7.99 kg CO2 ∙ kg−1 N. The same was true for triple superphosphate was 0.36 kg CO2 ∙ kg−1 P2O5, whereas for potassium chloride, it was 0.56 kg CO2 ∙ kg−1 K2O [25]. Based on the composition data of the slow-release fertilizer, its total carbon footprint was calculated as 8.2 kg CO2 ∙ kg−1 N per fertilizer weight [25]. Ammonia emitted into the air was calculated based on guidelines given in [26]. Emission factors for crop residues were calculated based on the amount of by-product yield in carrot cultivation. Based on the results of the experiment, it was estimated that the ratio of commercial yield to by-products and crop residues in carrot cultivation were from 13 to 24%. The organic carbon content of the by-product was 50% and did not vary between the individual research objects. The crop residue decomposition rate was estimated at 25% [27]. Carbon emissions from crop residue and nitrogen oxides emitted from the soil were calculated according to the methodology of IPCC [27]. Nitrogen oxide emissions from crop residue were assumed at 1.25% [28]. N-N2O emissions were multiplied by 44/28 for conversion into N2O. N2O emissions were presented as the CO2 equivalent by multiplication of their quantity by a global warming factor of 292 [29]. A soil organic matter mineralization rate of 1.4% was used for the analysis. Nitrogen oxide emissions from nitrogen transformation in the soil were calculated according to the methodology of IPCC [27]. The life cycle assessment for a carrot considers greenhouse gas emissions from the combustion of fossil fuels used for agro-engineering activities. Fuel consumption by the respective agro-engineering activities is shown in Table 4.
Fuel consumption by the respective activities was calculated on the basis of data provided by [30]. As published by EPA [31], diesel fuel combustion emissions from agricultural tractors were equal to 3.864 kg CO2 ∙ dm−3 of fuel. As nitrogen oxide and methane emissions are small for diesel fuel combustion by agricultural tractors, that source of greenhouse gases is omitted [31]. Greenhouse gas emissions from the use of pesticides was estimated on the basis of Audsley et al. [32] (Table 5). The authors specify total greenhouse gas emissions per carbon dioxide equivalent to 25.5 kg CO2 per 1 kg of the pesticide’s active substance.
Pesticides were used in the carrot cultivation in the quantity of 5816 g ∙ ha−1 for all objects concerned. Energy consumption for carrot washing and sorting was calculated on the basis of Wójcicki et al. [30]. According to those authors, 0.75 kWh of electricity is used to wash 1 t of carrots and 0.235 kWh to sort them. Water from a deep well (54 m) was used for irrigation. The CO2 emission factor for irrigation was calculated based on guidelines from Wang et al. [33] (Table 6).
An electric pump with 36% pumping efficiency was used for water pumping. The assumed CO2 emissions to generate 1 kWh of electricity were 0.9245 kg [33]. According to the methodology given by FAO [4], air emissions of nitrogen from mineral fertilization are 1% for direct emissions and 0.27% for nitrogen dispersion. Nitrogen oxides from dispersed mineral fertilizers were estimated at 0.75% of total nitrogen not used by crops during the vegetation period [4] (Table 7 and Table 8).
The adopted conversion factor for N2O into CO2 in the greenhouse-effect context was 292 [29].
Statistical analysis.
An analysis of variance was performed on the results. The significance of the variation in mean values was determined using the Tukey test (α ≤ 0.05).
In addition, groups of “methods” having similar (homogenous) structures were identified. One taxonomic method was used for this purpose, based on the measure of diversity of structures formed by m components for any pair of “methods” and defined as [34]
v p q = j = 1 m α j p α j q 2
where α j p , α j q were, respectively, the share of j component of the structure of method p and q .
That metric takes the value from the range [0, 1], and the greater its value the greater the changes in the structure. The mean value of measure v p q was taken as the threshold value for structure variance, determined according to the following formula:
v ¯ = 2 p = 1 n q > p v p q n ( n 1 )
where v p q   w a s specified according to the Formula (1) and n means the number of methods. It was assumed that for a pair of similar methods v p q < v ¯ . In turn, where structures of the method differ, then v p q v ¯ .
Statistica 13 (TIBCO Software Inc.) was used for the statistical processing of the results. Crop yields and total GHG emissions were statistically analyzed based on the variability between individual replicates.

3. Results and Discussion

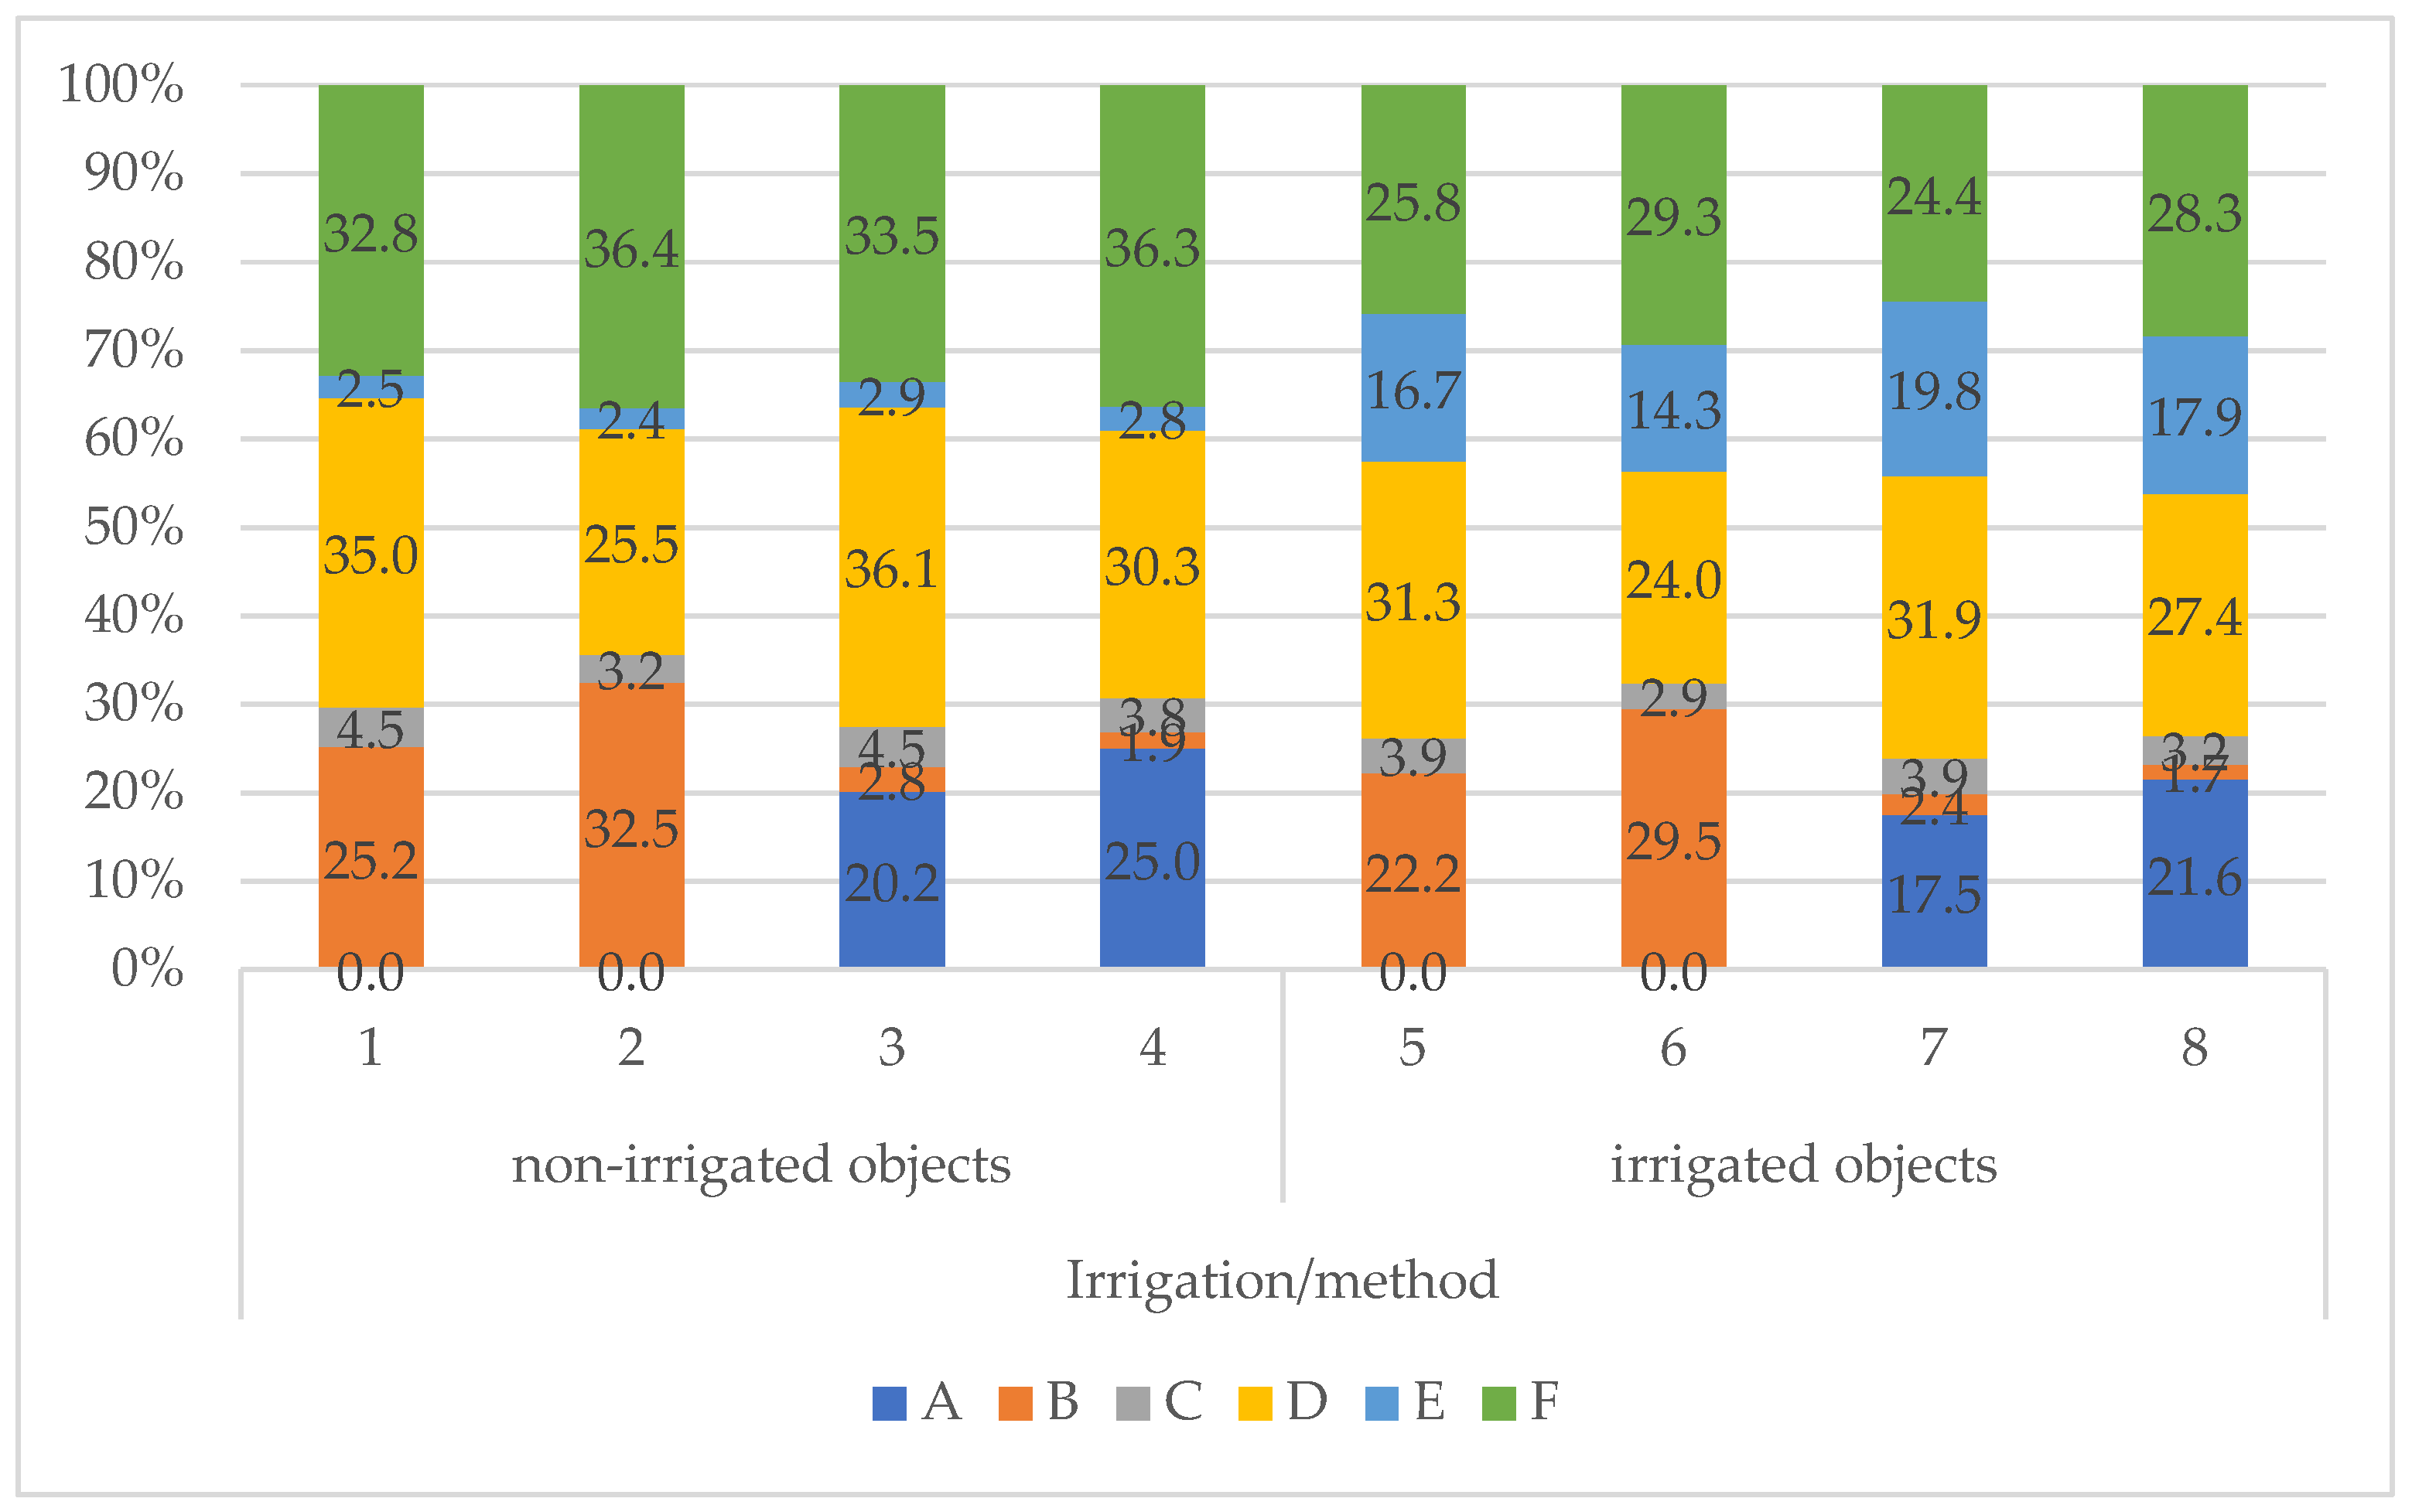
For all variants, the lowest share of CO2 equivalent came from electricity consumption (1.7–16.5%) and plant-protection products (2.2–3.8%) (Figure 3).
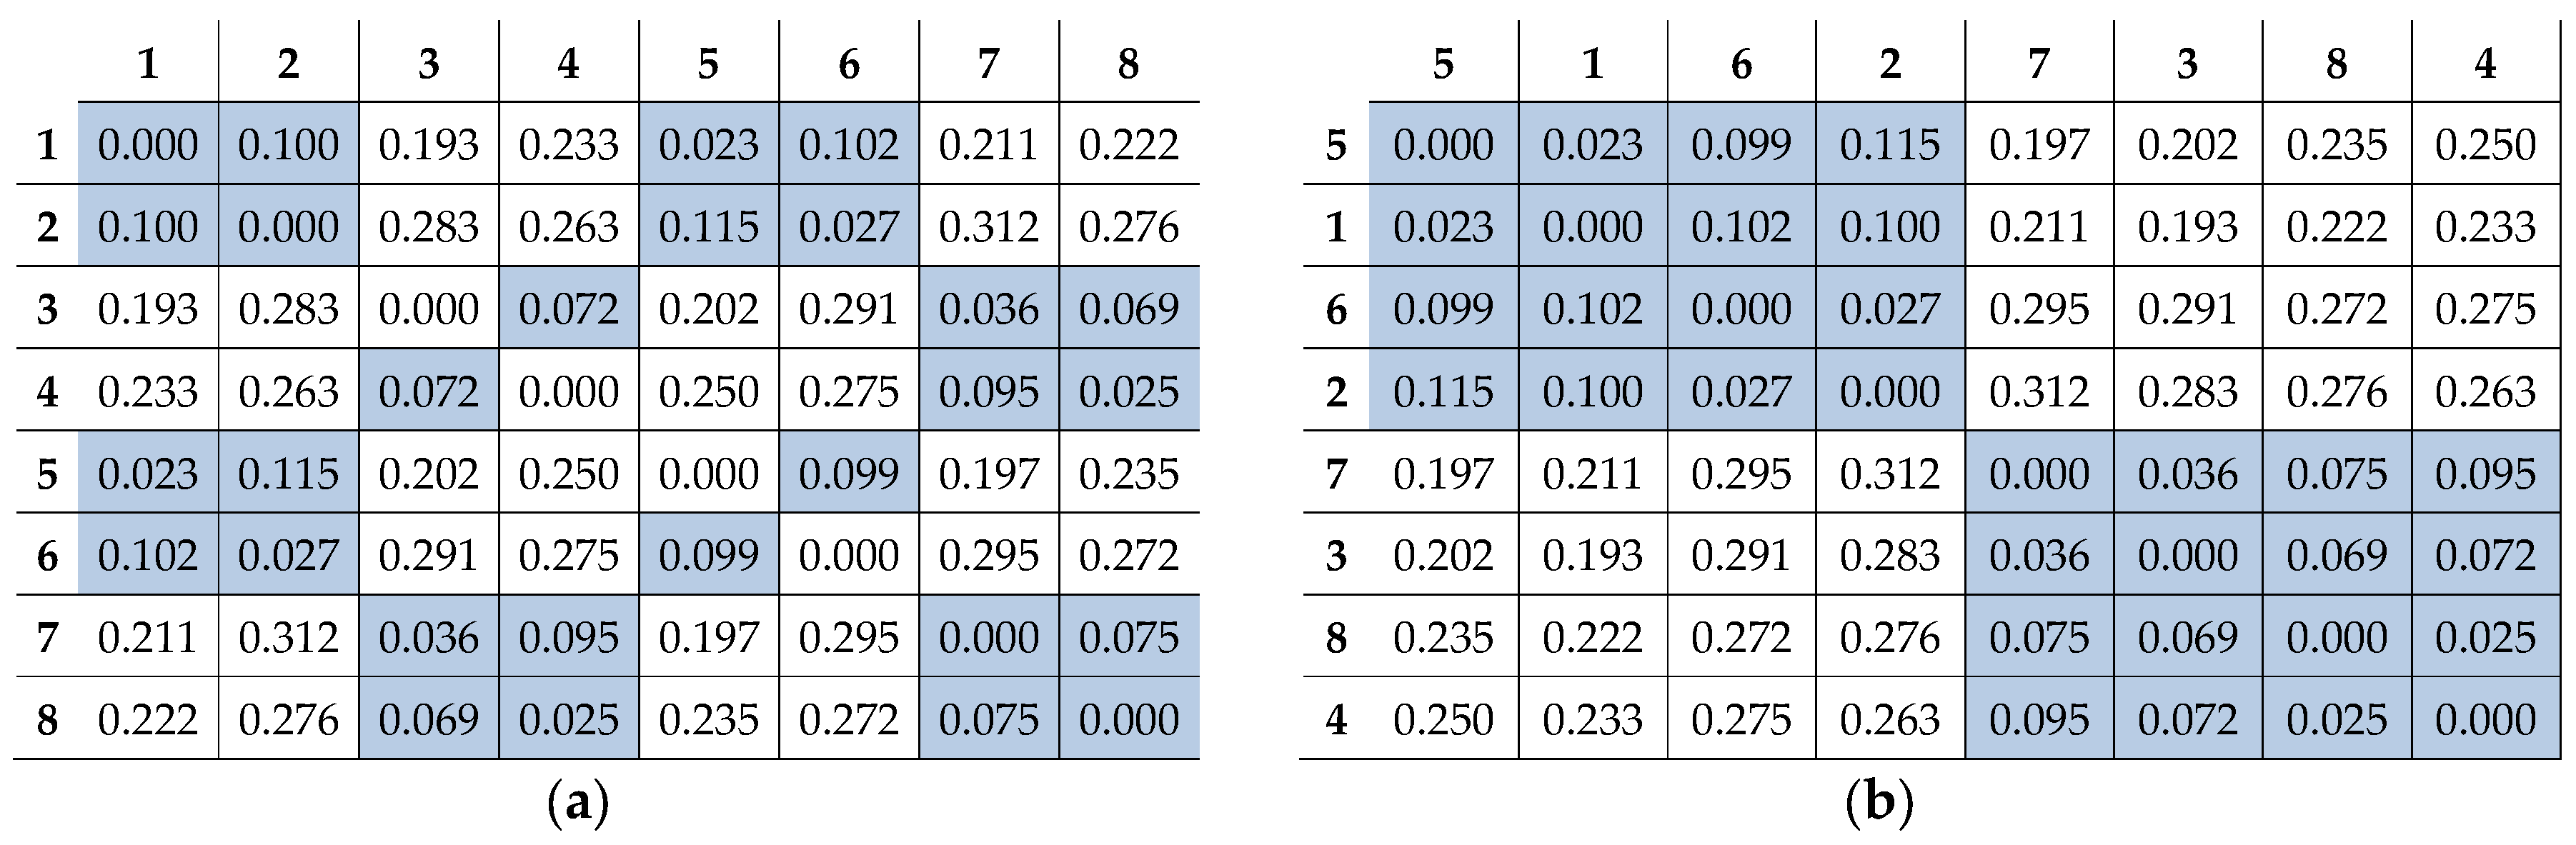
A very large variance depending on the object was demonstrated by the share of CO2 equivalent from slow-release fertilizers (0.0–20.1%) and conventional fertilizers (1.5–24.5%). A very small variance was shown by the share of CO2 equivalent from the soil and residue crop, and from organic matter mineralization (20.4–28.6%). Clusters differ by the share of CO2 equivalent from slow-release fertilizers and conventional fertilizers (Figure 4).
The first cluster is formed by experiment variants: 5, 1, 6 and 2. These are the variants in which the CO2 equivalent for slow-release fertilizers was at 0% and from 18.2% to 24.5% for conventional fertilizers. The second cluster is formed by experiment variants: 7, 3, 8, 4. In that group, the CO2 equivalent for slow-release fertilizers was at 14.6–20.1% and from 1.5% to 2.3% for conventional fertilizers.
Global greenhouse gas emissions from fossil fuels used for crop cultivation, irrigation and harvest are estimated at 0.4–0.6 Gt of CO2 equivalent per year, whereas the combined greenhouse gas emissions from agricultural production are ten times greater [35]. An important factor from the standpoint of greenhouse gas emissions is the emission of nitrogen oxides from land in agricultural use. Nitrogen entering the soil is transformed into an oxide form. Tubiello et al. [35] argue that the global quantity of nitrogen oxides emitted into the air in 2010 was nearly 0.7 Gt of CO2 equivalent. A survey of greenhouse gas emissions in the context of quality and of the actual impact on the global greenhouse effect is an important element in developing and evaluating good agricultural practice and rules for the various quality management systems [36,37]. Currently, the most reliable method for comprehensive assessment of the impact of agriculture on the environment is the life cycle of its products, accounting for energy use, production inputs as well as renewable and non-renewable environmental resources [38].
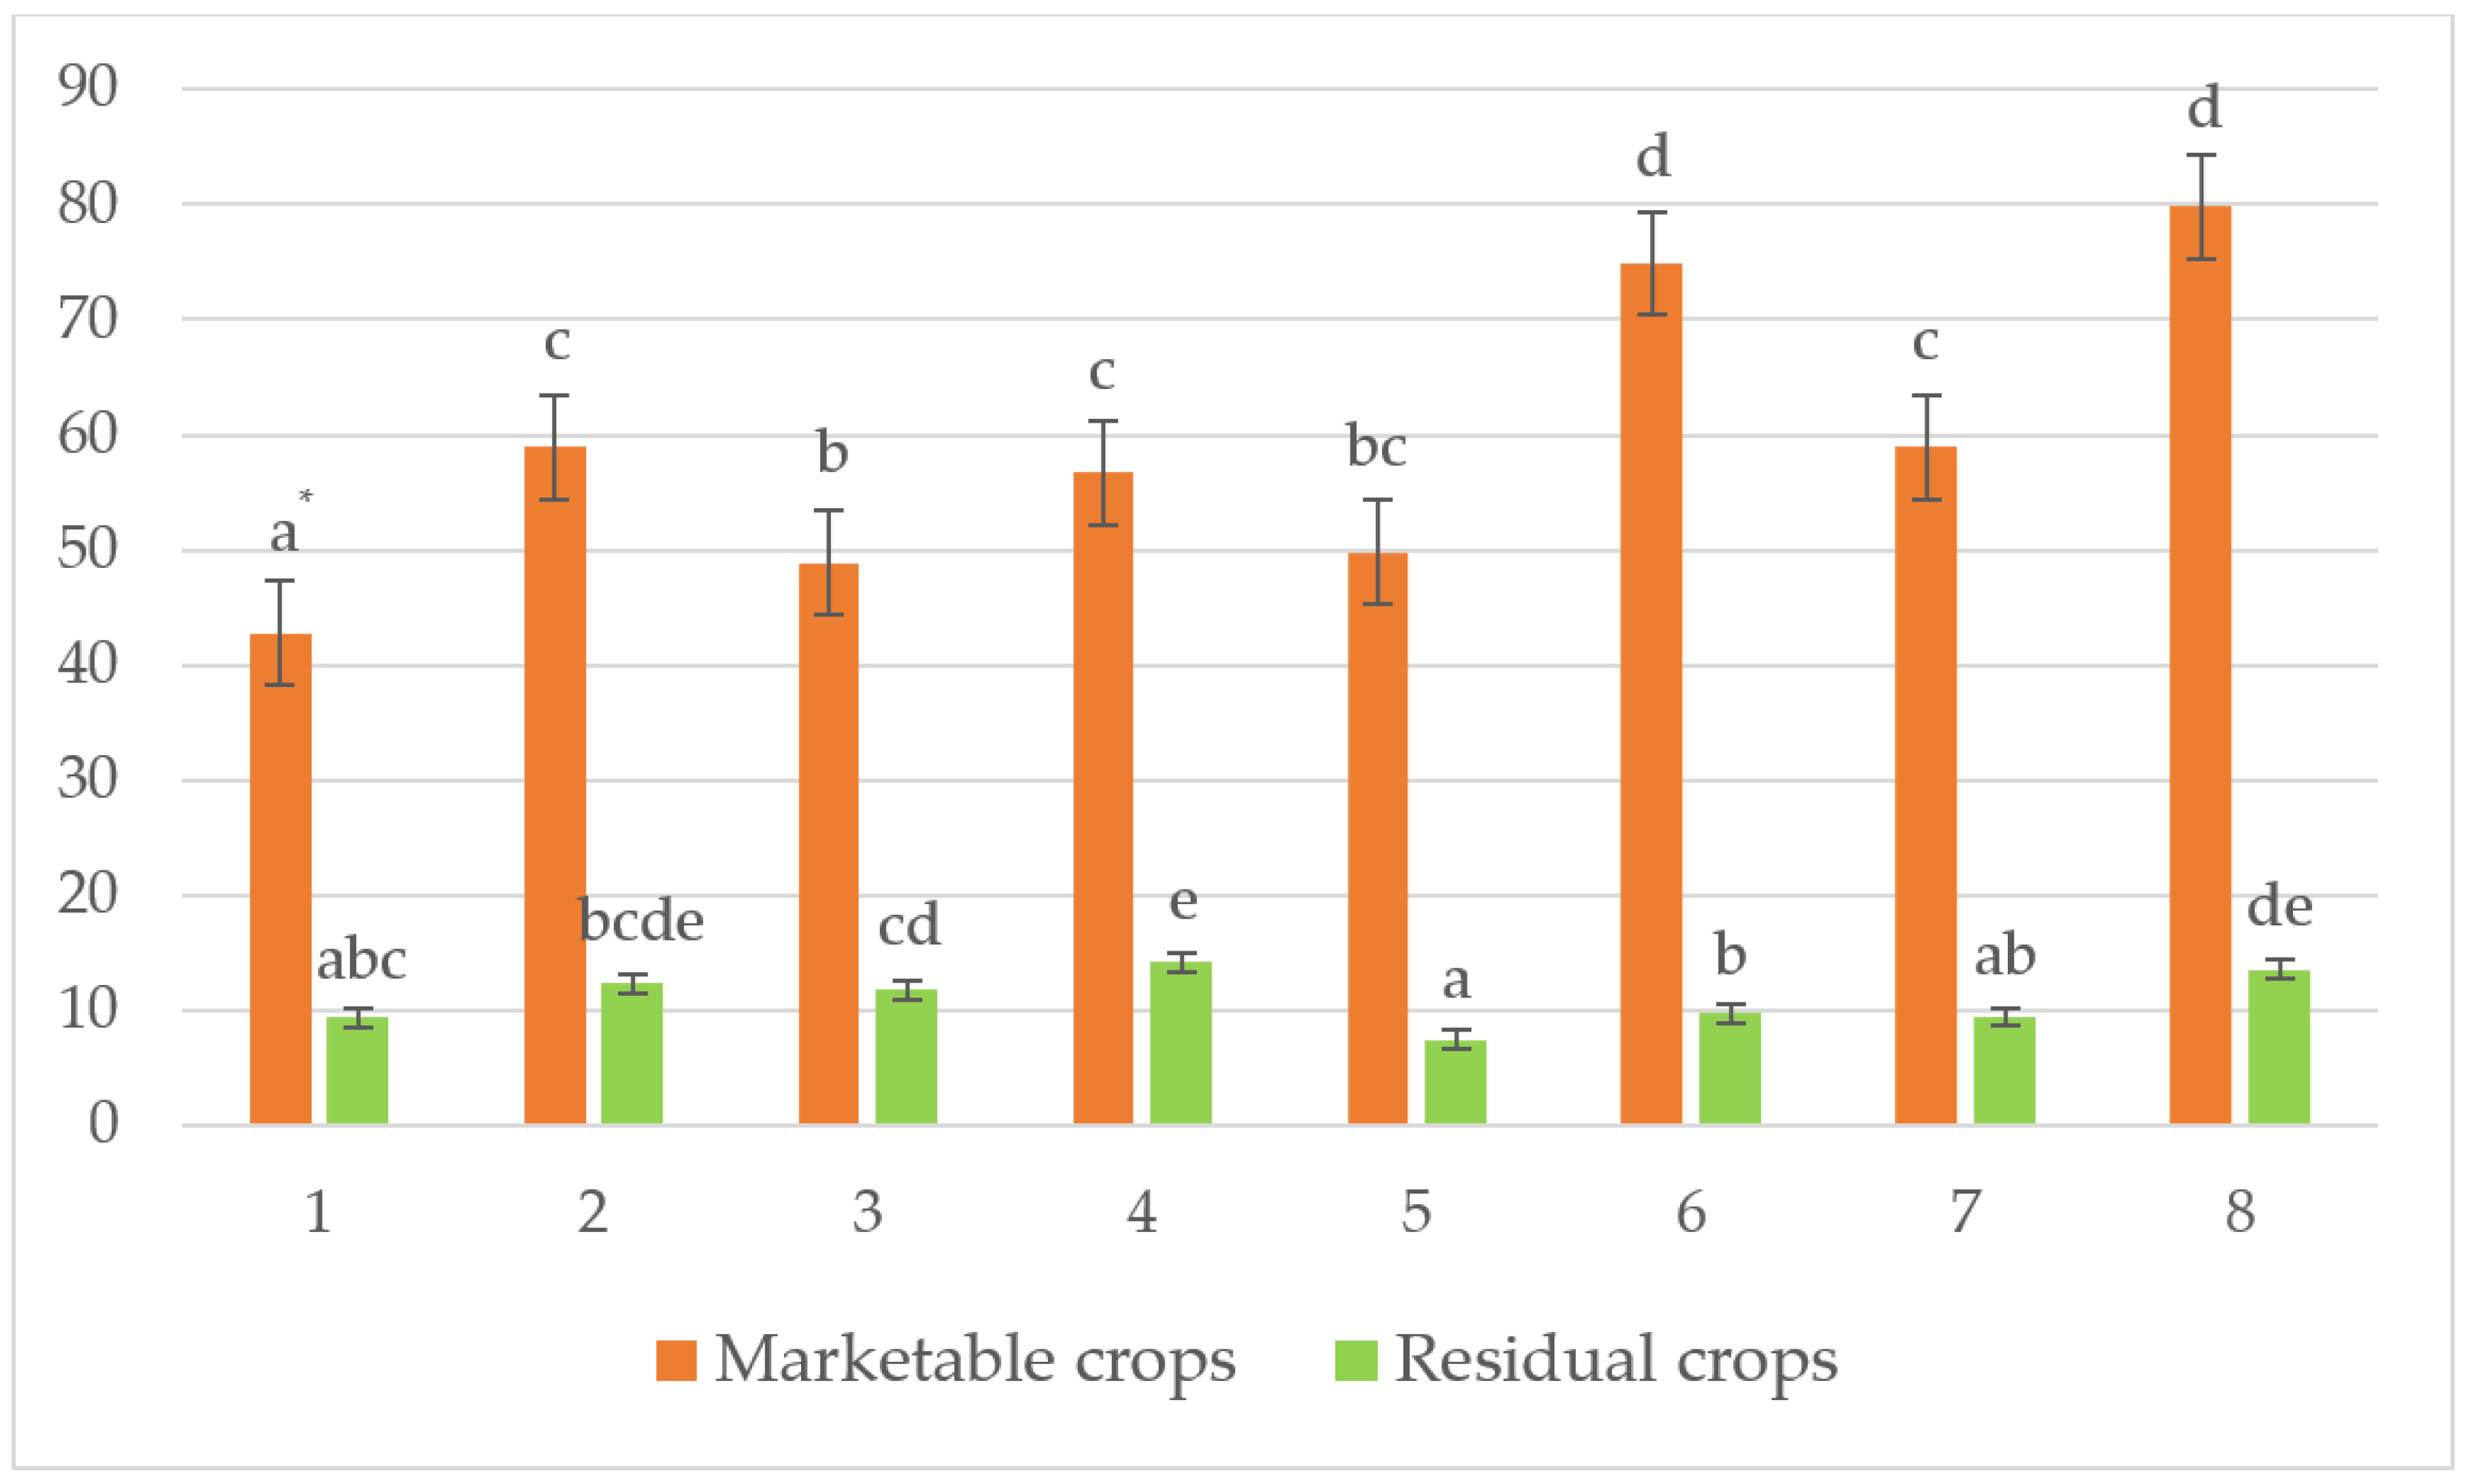
The study under discussion compares the total greenhouse gas emissions for the various fertilization and irrigation strategies. For boundaries of the assessment system adopted at the emission source survey stage, the calculation results show a significant variance in total greenhouse gas emissions per CO2 equivalent for the adopted system boundaries. A total of 1 t of the commercial product was used as the functional unit. The commercial yield from the object that was fertilized according to the rules of integrated crop production was 42.8 t per hectare (Figure 5).
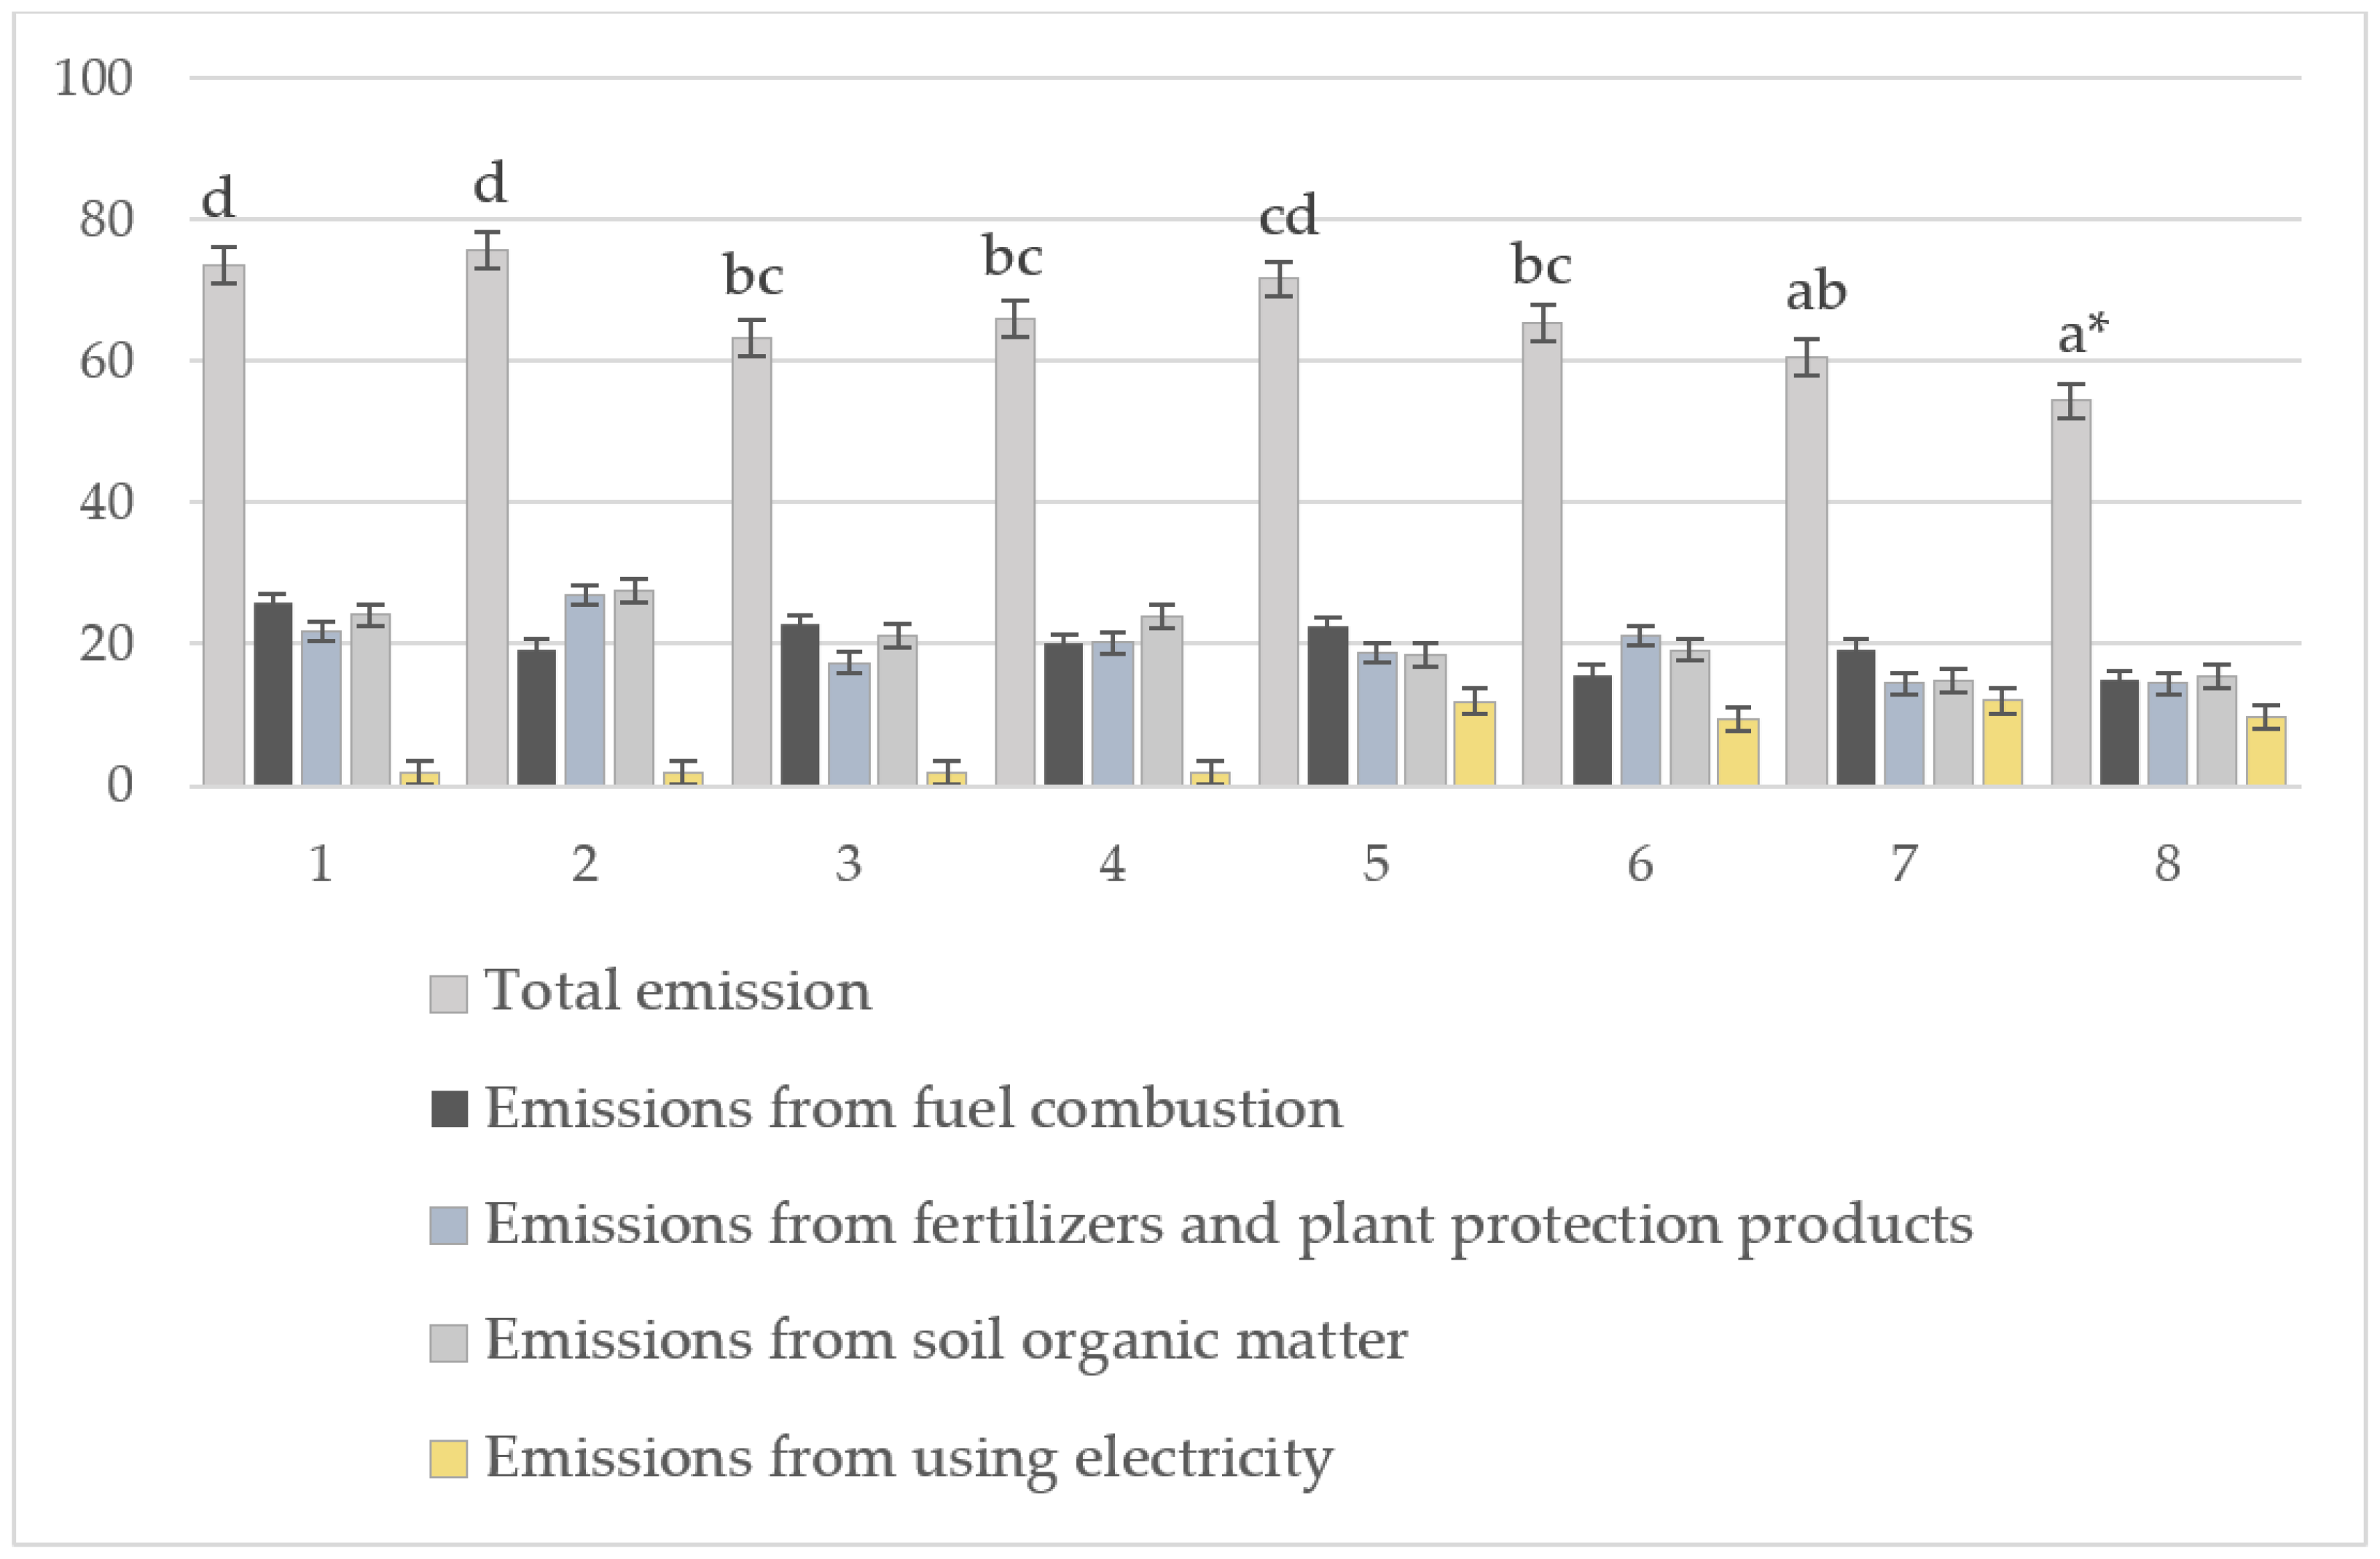
The yield from that object was markedly below the production potential of that habitat, estimated, according to integrated crop production methodology, at some 65 t ⸱ha−1. The effect of a lower yield was not only a drop in the economic efficiency of production but also biogenic dispersion in the environment, aggravating the greenhouse effect and water eutrophication [39]. The reason for the insufficient use of the production potential may have been water deficit, which disturbs physiological processes in the crops and results in unfavorable changes to the salinity profile of the soil solution. Another reason could have been incorrect fertilizer application. Lü et al. [40] and Emery et al. [41] emphasize that water availability is instrumental to increasing the uptake of fertilizers by crops, and therefore fertilization technology must take into account water availability during the vegetation season. During prolonged water stress for crops, the fertilization strategy should be adapted on an ongoing basis to reduce the loss of elements entering the soil together with fertilizers. The application of fertilizers according to the production practice at the experiment site increased the yield by some 18 tonnes. A significant increase in nitrogen fertilization of the vegetable crop largely translates into greater biomass production but is often accompanied by lower product quality, as noted by Raseduzzaman et al. [42] and Sikora et al. [12]. Crop irrigation improved the yield by some 20% for both objects fertilized with conventional fertilizers, that is, the object fertilized according to the rules of integrated crop production, and the object fertilized according to the production practice. An increase in the uptake of fertilizer elements and improved production efficiency was observed for those objects. Fertilization with slow-release fertilizers significantly increased the yield and uptake of fertilizer ingredients, both for the irrigated and non-irrigated object. With s nitrogen dose of 114 kg ∙ ha−1 in slow-release fertilizers, the yield was comparable to conventional fertilization, at 160 kg N ∙ ha−1. The maximum yield was achieved for the object using slow-release fertilizers in s quantity of 114 kg N, totaling 79.8 tonnes of commercial yield ∙ ha−1. Greater fertilization efficiency for slow-release fertilizers was also found by Sikora et al. [43] and Ganetri et al. [44]. In this study, nitrogen fertilization efficiency may also have increased. The results of the experiments indicate a significant impact of the proposed fertilization strategies on greenhouse gas emissions, both from direct and indirect sources. Total GHG emissions stated as the CO2 equivalent ranged from 54.46 to 75.9 kg CO2 ∙ t−1 of the fresh commercial product (Figure 6).
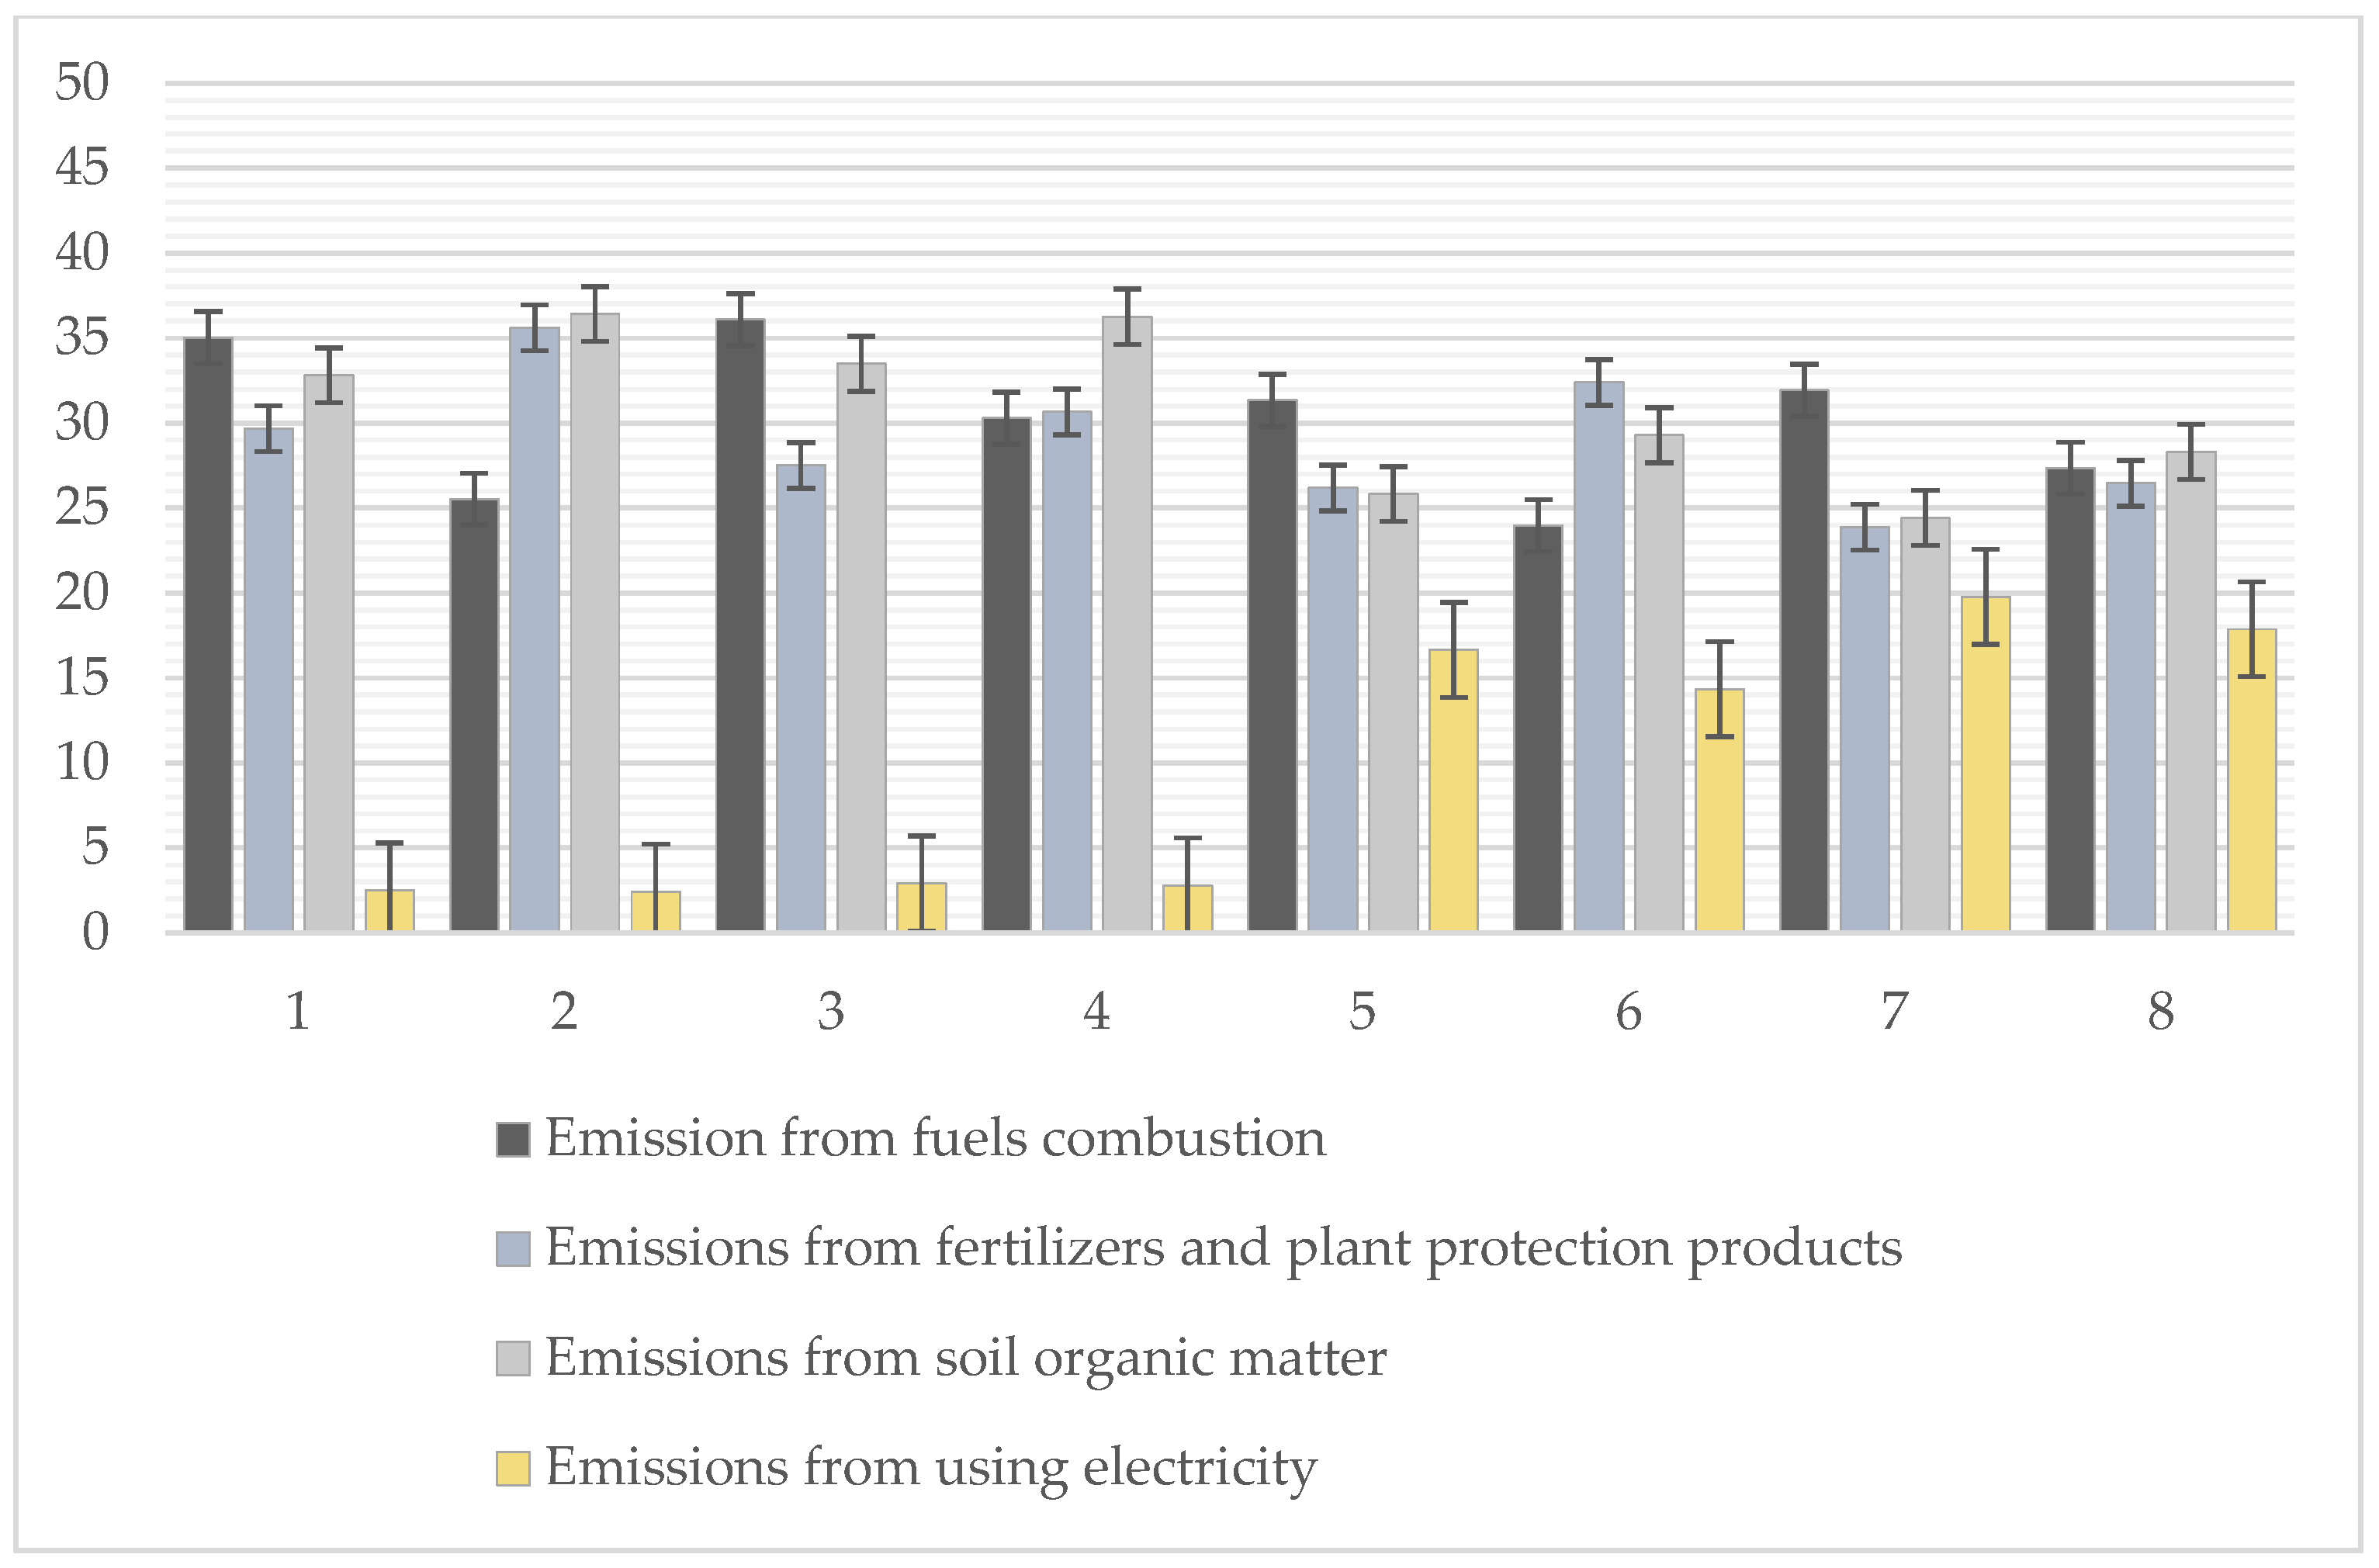
Results of the carbon footprint analysis for agricultural products depend primarily on the adopted system boundary, and its impact in the environmental context should always consider that system boundary. CO2 emissions for carrot cultivation were calculated as 111 kg CO2 ⸱ t−1 of the product, whereas the value for that product imported from the Netherlands was 230 kg and 330 kg CO2 ⸱ t−1 for carrots imported from Italy [45]. In turn, greenhouse gas emissions for carrots cultivated in Belgium equaled 600 kg CO2 ⸱ t−1 of the product for the adopted system boundary [46]. Those authors note, however, that haulage of the products accounts for a very large share of greenhouse gas emissions. Results that were slightly lower than for carrot cultivated in Sweden were obtained from the authors’ study as the haulage, logistics and machine use were taken outside the system boundary. Moudrý Jr et al. [47] specify the carbon footprint for carrot crops in the conventional system as 98 kg CO2 ⸱ t−1. The same authors report two-times lower greenhouse gas emissions for carrots cultivated in organic systems. Smith et al. [48] did not find any difference in GHG emissions between organic and conventional carrot cultivation. Their total value in the functional unit is comparable to results from the authors’ study. Jesus Pereira [49] argues that carbon dioxide emissions for cucumber crops are at 78 kg CO2 ∙ t−1 of fresh product. In this experiment, the smallest share of the carbon footprint was obtained for the irrigated object, fertilized with slow-release fertilizers in the quantity of 114 kg N ⸱ ha−1 (variant 8). In the irrigated objects, the greenhouse gas emission factor was significantly smaller than for the non-irrigated objects where the fertilization rate was the same. Even though energy was used for irrigation, a higher commercial product yield was obtained for those objects. As the precipitation level in the year of the experiment was high, water requirements of the crop were precisely measured, and drip irrigation was performed, high irrigation efficiency was obtained. Wang et al. [50] argue that micro-irrigation for crop production may improve water utilization efficiency several times. Similar conclusions are proposed by Peng et al. [51]. The irrigation level for the respective objects was from 1600 to 2000 m3 ⸱ ha−1, whereas calculated CO2 emissions from electricity consumption ranged from 502.4 to 690.8 kg ⸱ ha−1 (Table 6). The largest share of total emissions came from soil emissions and diesel combustion (Figure 3). For facilities where slow-release fertilizers were used in all cases, the share of fertilization in total GHG emissions was approximately 5% lower than when conventional fertilizers were used. For energy-irrigated facilities, electricity consumption accounted for just under 20% of total GHG emissions. De Jesus Pereira et al. [49] specify total carbon dioxide emissions for cucumber crop irrigation as 841 kg ⸱ ha−1. No significant changes in total GHG emissions per functional unit of the product were found between the respective doses of the same fertilizer. Using slow-release fertilizers reduced greenhouse gas emissions by some 13% for non-irrigated objects, and by 16% for irrigated objects (Figure 6). Assuming that the reference object was a non-irrigated object, fertilized according to production practice commonly applied in the area of the experiment, fertilization with slow-release fertilizers and efficient irrigation reduced total greenhouse gas emissions by 30% per functional unit of the product (Figure 6). The process optimization used for the experiment is significant from the standpoint of the impact on the agricultural production environment. In modern agricultural systems, efficiency improvement by a few percentage points may be difficult to achieve [3,52]. Fertilization is an important factor driving greenhouse gas emissions from agricultural production. In the experiment under discussion, the share of that source in total carbon dioxide emissions ranged from 23.86% to 35.61% (Figure 7).
That parameter reaches its peak for conventional fertilization with no irrigation. Reducing greenhouse gas emissions from fertilization is typical of highly advanced agricultural systems [53]. Very high values of that factor demonstrate low production potential utilization efficiency, whereas when the metric is in low regions, the reason is unreasonable fertilization. Greenhouse gas emissions from nitrogen fertilization are generated by fertilizer production, transport and from air emissions from nitrogen not used by crops. The results of the experiment under discussion demonstrate a significant impact of both the type of the fertilizer used and of crop irrigation. Both modifications resulted in improved utilization efficiency of fertilizer ingredients, both delivered with mineral fertilizers and those bound in the sorption complex. Optimized use of fertilizers, for example, by using slow-release fertilizers, is one of the most effective methods to reduce greenhouse gas emissions from agricultural production [14,15,19]. Xiao et al. [54] reported 25% less of greenhouse gas emissions for peach cultivation using slow-release fertilizers. The most important source of greenhouse gas emissions in the event of unreasonable fertilization is nitrogen oxides, which have a 300 times larger greenhouse effect potential than carbon dioxide. Zhang et al. [55] found that the use of slow-release fertilizers for bamboo production reduced nitrogen oxide emissions by as much as 80% compared to conventional fertilization methods. Using soil potential for crop nutrition is an important item of sustainable agricultural development [56,57]. Greenhouse gas emissions from fossil fuels ranged from 1101 to 1186 kg CO2 ⸱ ha−1 (Table 7). Total diesel fuel used for production was 260 dm3 ⸱ ha−1. The combustion of fossil fuels drives crop production costs and the carbon footprint. De Jesus Pereira [49] specified diesel fuel consumption for tomato cultivation as 160 dm3 ⸱ ha−1. An important factor that reduces agricultural pressure on the environment is the launch of simplifications in agro-engineering [58]. The share of diesel fuel consumption in total GHG emissions from carrot cultivation ranged from 27.35 to 35.01% (Figure 7). A slightly higher share of GHG emissions from diesel fuel consumption was reported by Sikora et al. [43]. A factor that impacted greenhouse gas emissions the most was unreasonable use of nitrogen from mineral fertilizers in objects fertilized by conventional fertilizers where there was a temporary water deficit. Full nitrogen uptake by the carrot crops was, for the object fertilized according to production practice, 50% for the non-irrigated object and 66% for the irrigated object of the nitrogen dose supplied with mineral fertilizers. In the case of objects fertilized according to the rules of integrated crop production, those values were 66% and 75%, respectively, for the supplied nitrogen. High nitrogen utilization rates resulted from high quantities of mineral forms of that element in the soil. Mineral nitrogen content in the soil before the experiment was estimated at some 160 kg. The key element reducing the carbon footprint for the adopted system boundary was the use of nitrogen from mineral fertilizers and from the soil. The object with the highest level of nitrogen fertilization was the reference object for the respective variants of the experiment. The share of greenhouses gas emissions from the soil organic matter and from the decomposition of harvest residue ranged from some 24% to over 36% of total GHG emissions (Figure 6). For the respective fertilization variants, that value was determined by the quantity of residue crop and nitrogen oxide emissions estimated on the basis of nitrogen fertilization levels and the quantity of nitrogen not used by the crops.

4. Conclusions

  • In conventional carrot fertilization, greenhouse gas emissions totaled 75.68 kg CO2 ⸱ t−1 of the commercial product. Optimization, involving precise irrigation and fertilization using slow-release fertilizers, reduced the carbon footprint to 54.33 kg CO2 ⸱ t−1 of the commercial product. Total GHG emissions were consequently reduced by 30% per functional unit of the product.
  • The application of slow-release fertilizers resulted in a reduction of total GHG emissions of 15% for non-irrigated crop and of 17% for irrigated objects.
  • Irrigation reduced total GHG emissions by 8% under conventional fertilization and by 11% with slow-release fertilizers per kilogram of marketable yield.
  • Higher yields were obtained in the irrigated experimental plots with the use of slow-release fertilizers, despite applying the same amount of nitrogen. This suggests that the tested technological modifications had a positive impact on nitrogen use efficiency.
  • The variant that offers the most from the environmental and production standpoint is the variant with irrigation and slow-release fertilization in a quantity of 114 kg N ∙ ha−1. Drip irrigation significantly increases the efficiency of fertilization with slow-release fertilizers.

Author Contributions

Conceptualization, B.F.-M., M.N. and M.K.; methodology, B.F.-M., M.N., R.G. and M.K.; software, B.F.-M., S.I., D.Z. and A.A. (Atilgan Atilgan); validation, M.N., S.I. and M.K.; formal analysis, B.F.-M., M.K. and M.N.; investigation, B.F.-M., M.N., A.A. (Atilgan Atilgan) and M.K.; resources, M.N. and R.G.; data curation, L.L., M.K. and D.Z.; writing—original draft preparation, B.F.-M., M.N. and M.K.; writing—review and editing, S.I., D.Z., R.G. and M.K.; visualization, D.Z., M.N., M.K., A.A. (Abduaziz Abduvasikov) and L.L.; supervision, D.Z., A.A. (Abduaziz Abduvasikov) and M.N.; project administration, B.F.-M.; funding acquisition, M.N. and B.F.-M. All authors have read and agreed to the published version of the manuscript.

Funding

This research received no external funding.

Institutional Review Board Statement

Not applicable.

Informed Consent Statement

Not applicable.

Data Availability Statement

The original contributions presented in this study are included in the article. Further inquiries can be directed to the corresponding author.

Conflicts of Interest

The authors declare no conflicts of interest.

References

  1. Gródek-Szostak, Z.; Szeląg-Sikora, A.; Sikora, J.; Korenko, M. Prerequisites for the cooperation between enterprises and business support institutions for technological development. In Proceedings of the 16th Conference on Business and Non-Profit Organizations Facing Increased Competition and Growing Customers’ Demands, Tomaszowice, Poland, 19–20 June 2017. [Google Scholar]
  2. Fitton, N.; Alexander, P.; Arnell, N.; Bajzelj, B.; Calvin, K.; Doelman, J.; Gerber, J.S.; Havlik, P.; Hasegawa, T.; Herrero, M.; et al. The vulnerabilities of agricultural land and food production to future water scarcity. Glob. Environ. Change 2019, 58, 101944. [Google Scholar] [CrossRef]
  3. Li, L.; Wu, W.; Giller, P.; O’Halloran, J.; Liang, L.; Peng, P.; Zhao, G. Life Cycle Assessment of a Highly Diverse Vegetable. Multi-Cropping System in Fengqiu County, China. Sustainability 2018, 10, 983. [Google Scholar] [CrossRef]
  4. FAO. Global Database of GHG Emissions Related to Feed Crops: Methodology, Version 1; Livestock Environmental Assessment and Performance Partnership; FAO: Rome, Italy, 2017. [Google Scholar]
  5. Virkkunen, H.; Riihimäki, J.; Salminen, J.; Savolainen, H. Framework for quantification of land use–based greenhouse gas emissions according to crop and farm type. J. Clean. Prod. 2025, 498, 145111. [Google Scholar] [CrossRef]
  6. Lopes, D.; Medeiros, L.; Kiperstok, A. Combining cleaner production and life cycle assessment for reducing the environmental impacts of irrigated carrot production in Brazilian semi-arid region. J. Clean. Prod. 2018, 170, 924–939. [Google Scholar] [CrossRef]
  7. FAO. Irrigation Water Management: Irrigation Scheduling; FAO: Rome, Italy, 1989. [Google Scholar]
  8. Oita, A.; Malik, A.; Kanemoto, K.; Geschke, A.; Nishijima, S.; Lenzen, M. Substantial nitrogen pollution embedded in international trade. Nat. Geosci. 2016, 9, 111–115. [Google Scholar] [CrossRef]
  9. Movedi, E.; Paleari, L.; Argenti, G.; Vesely, F.M.; Staglianò, N.; Parrini, S.; Confalonieri, R. The application of a plant community model to evaluate adaptation strategies for alleviating climate change impacts on grassland productivity, biodiversity and forage quality. Ecol. Model. 2024, 488, 110596. [Google Scholar] [CrossRef]
  10. Kapusta-Duch, J.; Szeląg-Sikora, A.; Sikora, J.; Niemiec, M.; Gródek-Szostak, Z.; Kuboń, M.; Leszczyńska, T.; Borczak, B. Health-Promoting Properties of Fresh and Processed Purple Cauliflower. Sustainability 2019, 11, 4008. [Google Scholar] [CrossRef]
  11. Abrha, H.; Dodiomon, S.; Ongoma, V.; Hagos, H.; Birhane, E.; Gebresamuel, G.; Manaye, A. Response of plant species to impact of climate change in Hugumbrda Grat-Kahsu forest, Tigray, Ethiopia: Implications for domestication and climate change mitigation. Trees For. People 2024, 15, 100487. [Google Scholar] [CrossRef]
  12. Sikora, J.; Niemiec, M.; Tabak, M.; Gródek-Szostak, Z.; Szeląg-Sikora, A.; Kuboń, M.; Komorowska, M. Assessment of the efficiency of nitrogen slow-release fertilizers in integrated production of carrot depending on fertilization strategy. Sustainability 2020, 12, 1982. [Google Scholar] [CrossRef]
  13. Li, M.; Zhang, P.; Yang, A.; Wang, X.; Sha, Y.; Fu, Q. Achieving sustainable goals in agroecosystems through the optimization of agricultural resources integrating the water-nitrogen-carbon nexus. iScience 2025, 28, 112101. [Google Scholar] [CrossRef]
  14. Corigliano, O.; Algieri, A. A comprehensive investigation on energy consumptions, impacts, and challenges of the food industry. Energy Convers. Manag. X 2024, 23, 100661. [Google Scholar] [CrossRef]
  15. Paramesha, V.; Kumar, P.; Prabhakar, M.; Gopinath, K.A.; Kumar, R.M.; Nath, A.J.; Jinger, D.; Bhattacharjee, S. Assessing the impact of nutrient management on productivity, economics, soil quality, energy efficiency, and life cycle assessment in rice-based farming systems. J. Agric. Food Res. 2025, 23, 102278. [Google Scholar] [CrossRef]
  16. Lübke Buss, G.; Wesz, J.; Scivittaro, W.B.; Carlos, F.S.; Bayer, G.; de Sousa, R. New irrigation management in paddy fields reduces methane emissions and increases water use efficiency. J. Environ. Manag. 2026, 397, 128273. [Google Scholar] [CrossRef]
  17. Samani, B.H.; Choobin, S.; Ghasemi-Varnamkhasti, M.; Abedi, A. Analysis of energy consumption and end-use application of rapeseed in an agricultural production system in Izeh-Khuzestan. Eng. Agric. Environ. Food 2018, 11, 101–108. [Google Scholar] [CrossRef]
  18. Komorowska, M.; Niemiec, M.; Sikora, J.; Suder, M.; Gródek-Szostak, Z.; Atilgan, A.; Ovcharuk, O.; Lach, Ł.; Kusa, R.; Duda, J. Strategies for managing corn residue crop in the context of greenhouse gas emissions. Environ. Sci. Pollut. Res. 2024, 31, 60189–60205. [Google Scholar] [CrossRef]
  19. Niemiec, M.; Komorowska, M.; Szeląg-Sikora, A.; Sikora, J.; Kuboń, M.; Gródek-Szostak, Z.; Kapusta-Duch, J. Risk Assessment for Social Practices in Small Vegetable farms in Poland as a Tool for the Optimization of Quality Management Systems. Sustainability 2019, 11, 3913. [Google Scholar] [CrossRef]
  20. Montgomery, D.C. Design and Analysis of Experiments; John Wiley & Sons, Inc.: New York, NY, USA, 2001. [Google Scholar]
  21. ISO 31000:2018; Risk Management—Guidelines. ISO: Geneva, Switzerland, 2018.
  22. ISO 14040; Environmental Management—Life Cycle Assessment—Principles and Framework. ISO: Geneva, Switzerland, 2006.
  23. ISO 14044; Environmental Management—Life Cycle Assessment—Requirements and Guidelines. ISO: Geneva, Switzerland, 2006.
  24. ILCD. General Guide for Life Cycle Assessment—Detailed Guidance; JRC European Commission: Brussels, Belgium, 2010; p. 394. [Google Scholar]
  25. Kool, A.; Marinussen, M.; Blonk, H. LCI Data for the Calculation Tool Feedprint for Greenhouse Gas Emissions of Feed Production and Utilization, GHG Emissions of N, P and K Fertilizer Production; Blonk Consultants: Gouda, The Netherlands, 2012. [Google Scholar]
  26. Nemecek, T.; Schnetzer, J. Agroscope Reckenholz-Tänikon. Methods of Assessment of Direct Field Emissions for LCIs of Agricultural Production Systems; Version 3.0; Research Station ART: Zurich, Switzerland, 2011. [Google Scholar]
  27. IPCC. 2006 IPCC Guidelines for National Greenhouse Gas Inventories, Volume 4: Agriculture, Forestry and Other Land Use; Intergovernmental Panel on Climate Change: Geneva, Switzerland, 2006. [Google Scholar]
  28. Novoa, R.; Tejeda, H. Evaluation of the N2O emissions from N in plant residues as affected by environmental and management factors. Nutr. Cycl. Agroecosyst. 2006, 75, 29–46. [Google Scholar] [CrossRef]
  29. Forster, P. Changes in Atmospheric Constituents and in Radiative Forcing. In AR4 Climate Change 2007: The Physical Science Basis, Contribution of Working Group I to the Fourth Assessment Report of the Intergovernmental Panel on Climate Change; Cambridge University Press: Cambridge, UK; New York, NY, USA, 2007; p. 212. [Google Scholar]
  30. Wójcicki, Z. Methodology of examining energy consumption of agricultural production. Probl. Inżynierii Rol. 2015, 23, 17–29. [Google Scholar]
  31. EPA United States Environmental Protection Agency. Greenhouse Gas Inventory Guidance Direct Emissions from Mobile Combustion Sources; EPA: Washington, DC, USA, 2016; p. 27.
  32. Audsley, E.; Stacey, K.; Parsons, D.J.; Williams, A.G. Estimation of the Greenhouse Gas Emissions from Agricultural Pesticide Manufacture and Use; Cranfield University: Bedford, UK, 2009. [Google Scholar] [CrossRef]
  33. Wang, J.; Rothausen, S.; Conway, D.; Zhang, L.; Xiong, W.; Holman, I.P.; Li, Y. China’s water–energy nexus: Greenhouse-gas emissions from ground water use for agriculture. Environ. Res. Lett. 2012, 7, 014035. [Google Scholar] [CrossRef]
  34. Kukuła, K. Review of the Selected Measures of Structure Consistence. Stat. Rev. 1986, 33, 385–401. [Google Scholar]
  35. Tubiello, F.N.; Salvatore, M.; Rossi, S.; Ferrara, A.; Fitton, N.; Smith, P. The FAOSTAT database of greenhouse gas emissions from agriculture. Environ. Res. Lett. 2013, 8, 015009. [Google Scholar] [CrossRef]
  36. Bacenetti, J.; Lovarelli, D.; Fiala, M. Mechanisation of organic fertilizer spreading, choice of fertilizer and residue crop management as solutions for maize environmental impact mitigation. Eur. J. Agron. 2016, 79, 107–118. [Google Scholar] [CrossRef]
  37. Liang, L.; Lal, R.; Ridoutt, B.G.; Du, Z.L.; Wang, D.P.; Wang, L.Y.; Wu, W.L.; Zhao, G.S. Life cycle assessment of China’s agroecosystems. Ecol. Indic. 2018, 88, 341–350. [Google Scholar] [CrossRef]
  38. Nemecek, T.; Bengoa, X.; Lansche, J.; Mouron, P.; Rossi, V.; Humbert, S. Methodological Guidelines for the Life Cycle Inventory of Agricultural Products; Version 2.0, World Food LCA Database (WFLDB); Quantis: Lausanne, Switzerland; Agroscope: Zurich, Switzerland, 2014. [Google Scholar]
  39. Zeng, J.; Wang, X.; Li, Y.; Xing, L.; Li, X.; Zhang, Q.; Liu, H.; Liu, Y.; Liu, W.; Feng, Y.; et al. Optimizing fertilization rate can maintain the greenhouse gas mitigation effect of no-tillage: A global-scale meta-analysis. Field. Crops Res. 2025, 322, 109720. [Google Scholar] [CrossRef]
  40. Lü, P.; Zheng, Y.; Chen, L.; Ji, N.N.; Yao, H.; Maitra, P.; Hu, H.W.; Li, X.C.; Guo, L.D. Irrigation and fertilization effects on arbuscular mycorrhizal fungi depend on growing season in a dryland maize agroecosystem. Pedobiologia 2020, 83, 150687. [Google Scholar] [CrossRef]
  41. Emery, S.M.; Stahlheber, K.A.; Grossb, K.L. Drought minimized nitrogen fertilization effects on bioenergy feedstock quality. Biomass Bioenergy 2019, 133, 105452. [Google Scholar] [CrossRef]
  42. Raseduzzaman, M.; Razzab Ali, M.; Dong, W.; Aluoch, S.; Li, X.; Gaudel, G.; Zhang, Y.; Hu, C. Soil greenhouse gas emissions, yield, and water-use efficiency affected by maize-soybean intercropping under long-term nitrogen fertilization. Field Crops Res. 2025, 326, 109861. [Google Scholar] [CrossRef]
  43. Sikora, J.; Niemiec, M.; Szeląg-Sikora, A.; Gródek-Szostak, Z.; Kuboń, M.; Komorowska, M. The Impact of a Controlled-Release Fertilizer on Greenhouse Gas Emissions and the Efficiency of the Production of Chinese Cabbage. Energies 2020, 13, 2063. [Google Scholar] [CrossRef]
  44. Ganetri, I.; Essamlali, Y.; Amadine, O.; Danoun, K.; Aboulhrouz, S.; Zahouily, M. Chapter 7—Controlling factors of slow or controlled-release fertilizers. In Controlled Release Fertilizers for Sustainable Agriculture; Elsevier: Amsterdam, The Netherlands, 2021; pp. 111–129. [Google Scholar] [CrossRef]
  45. Röös, E.; Karlsson, H. Effect of eating seasonal on the carbon footprint of Swedish vegetable consumption. J. Clean. Prod. 2013, 59, 63–72. [Google Scholar] [CrossRef]
  46. Agri-Footprint. Agri-Footprint 2.0, Part 2: Description of Data, 2nd ed.; Blonk Agri-Footprint BV: Gouda, The Netherlands, 2015. [Google Scholar]
  47. Moudrý, J., Jr.; Jelínková, Z.; Bernas, J.; Kopecký, M.; Konvalina, P.; Moudrý, J.; Mráčková, J. Greenhouse gases emissions from selected crops growing within organic farming. Acta Fytotech. Zootech. 2015, 18, 56–58. [Google Scholar] [CrossRef][Green Version]
  48. Smith, L.G.; Kirk, G.D.J.; Jones, P.J.; Williams, A.G. The greenhouse gas impacts of converting food production in England and Wales to organic methods. Nat. Commun. 2019, 10, 4641. [Google Scholar] [CrossRef] [PubMed]
  49. De Jesus Pereira, B.; Bernardes, A.; Filho, C.; La Scala, N., Jr. Greenhouse gas emissions and carbon footprint of cucumber, tomato and lettuce production using two cropping systems. J. Clean. Prod. 2020, 282, 124517. [Google Scholar] [CrossRef]
  50. Wang, W.; Zhuo, L.; Li, M.; Liu, Y.; Wu, P. The effect of development in water-saving irrigation techniques on spatial-temporal variations in crop water footprint and benchmarking. J. Hydrol. 2019, 577, 123916. [Google Scholar] [CrossRef]
  51. Peng, X.; Chen, D.; Zhen, J.; Wang, Y.; Hu, X. Greenhouse gas emissions and drivers of the global warming potential of vineyards under different irrigation and fertilizer management practices. Sci. Total Environ. 2024, 950, 175447. [Google Scholar] [CrossRef]
  52. Li, H.; Mei, X.; Wang, J.; Huang, F.; Hao, W.; Li, B. Drip fertigation significantly increased crop yield, water productivity and nitrogen use efficiency with respect to traditional irrigation and fertilization practices: A meta-analysis in China. Agric. Water Manag. 2021, 244, 106534. [Google Scholar] [CrossRef]
  53. Lan, K.; Yao, Y. Integrating Life Cycle Assessment and Agent-Based Modeling: A Dynamic Modeling Framework for Sustainable Agricultural Systems. J. Clean. Prod. 2019, 238, 117853. [Google Scholar] [CrossRef]
  54. Xiao, Y.; Peng, F.; Zhang, Y.; Wang, J.; Zhuge, Y.; Zhang, S.; Gao, H. Effect of bag-controlled release fertilizer on nitrogen loss, greenhouse gas emissions, and nitrogen applied amount in peach production. J. Clean. Prod. 2019, 234, 258–274. [Google Scholar] [CrossRef]
  55. Zhang, J.; Jiang, J.; Tian, G. The potential of fertilizer management for reducing nitrous oxide emissions in the cleaner production of bamboo in China. J. Clean. Prod. 2016, 112, 2536–2544. [Google Scholar] [CrossRef]
  56. Xiao, C.; Zhang, F.; Li, Y.; Fan, J.; Ji, Q.; Jiang, F.; He, Z. Optimizing drip irrigation and nitrogen fertilization regimes to reduce greenhouse gas emissions, increase net ecosystem carbon budget and reduce carbon footprint in saline cotton fields. Agric. Ecosyst. Environ. 2024, 366, 108912. [Google Scholar] [CrossRef]
  57. Sithole, N.; Pérez-Fernández, M.; Magadlela, A. Nutritional status of soils from KwaZulu-Natal modulate symbiotic interactions and plant performance in Vigna unguiculata L. (Walp). Appl. Soil. Ecol. 2019, 142, 1–7. [Google Scholar] [CrossRef]
  58. Pei, H.; Liu, M.; Shen, Y.; Xu, K.; Zhang, H.; Li, Y.; Luo, J. Quantifying impacts of climate dynamics and land-use changes on water yield service in the agro-pastoral ecotone of northern China. Sci. Total Environ. 2022, 809, 151153. [Google Scholar] [CrossRef]
Figure 3. Distribution of CO2 emissions depending on the variant of the experiment (on the basis of Table 7). A—CO2 equivalent from slow-release fertilizer, B—CO2 equivalent from conventional fertilizers, C—CO2 equivalent from plant-protection products, D—CO2 emissions from fuel combustion, E—CO2 emissions from electricity consumption F—CO2 emissions from the soil, residue crop, and organic matter mineralization.
Sustainability 18 03513 g003
Figure 4. CO2 emission distribution structure variance diagram depending on the variant of the experiment ( v ¯ = 0.173): (a) unstructured; (b) structured.
Sustainability 18 03513 g004
Figure 5. Size of marketable crop and residue crop [t ∙ ha−1]. * Different letters indicate statistically significant differences at the significance level p = 0.05.
Sustainability 18 03513 g005
Figure 6. GHG emission structure from the respective sources [kg CO2 ∙ t−1 of marketable crop]. * Different letters indicate statistically significant differences at the significance level p = 0.05.
Sustainability 18 03513 g006
Figure 7. GHG emission structure from the respective sources [%].
Sustainability 18 03513 g007
Table 1. Experiment sequence.
Object NumberTriple
Superphosphate
Slow-Release
Fertilizer
Ammonium NitratePotassium
Salt
NP2O5K2O
kg · ha−1
non-irrigated objects
1 *
2
3
4
--265928470160
200-50040016092240
113400-2007670160
91600-16711470160
irrigated objects
5 -265928470160
6200 50040016092240
7113400-2007670160
891600-16711470160
* 1, 5—fertilization according to an integrated production methodology; 2, 6—fertilization according to practice in the area where the experiment was conducted; 3, 7—fertilization with a slow-release fertilizer, 400 kg ∙ ha−1; 4, 8—fertilization with a slow-release fertilizer, 600 kg ∙ ha−1.
Table 2. Properties of the soil where the experiment was conducted.
pH in H2OpH in KClNtotalCorganicNmineralPKMgCa
[g · kg−1][mg · kg−1]
6.736.280.1061.12047.70188.0249.0519.01189
Table 3. Weather conditions during the experiment.
MonthAverage Monthly TemperaturePrecipitation
Volume
Evapotranspiration
Rate *
°Cmm ⸱ month−1
V21.53011.79
VI20.94012.35
VII21.86812.33
VIII20.27310.67
IX14.51517.830
X8.8325.430
Total 39360.4
* Crop evapotranspiration was calculated on the basis of: ETC = ETO · KC; ETC—evapotranspiration rate [mm ⸱ month−1], KC—crop coefficient (for carrot 1 assumed on average, ETO—reference evapotranspiration [mm ⸱ month−1]. Reference evapotranspiration calculated on the basis of the Blaney–Criddle equation: ETO = ((0.046 · T) + 8.13), where: T—average monthly temperature [7].
Table 4. Energy consumption and greenhouse gas emissions from agro-engineering treatments.
Type of TreatmentConsumption
of Diesel Engine
Energy
Consumption
CO2 Emissions
[dm3][MJ][kg]
Tillage57.002299220.2
3× mineral fertilizing15.30620.759.13
Disk harrow unit cultivation30.801241119.0
Carrot sowing25.30101997.59
11× application of plant-protection products68.202748264.0
2× mechanical weeding26.001048100.48
Mechanical harvest37.001497143.49
Haulage to the farm [1 t · km−1]0.59037.432.280
Washing and sorting [KWh · 1 t−1]0.985-0.910
Table 5. Plant-protection products used for carrot cultivation.
Plant Protection
Product
Active
Substance
DosageNo.
of Treatments
Active
Substance
CO2
Emissions
[L · ha−1 or kg· ha−1] [g· ha−1][kg· ha−1]
Bentazonmancozeb 750 g22300076.50
Propachizafopazoxystrobin 250 g/L0.8240010.20
Stallion 363 CSclomazone—30 g/L + pendimethalin—333 g/L1.52108927.80
Switch 62.5 WGcyprodinil—375 g/kg +
fludioxonil—250 g/kg
1.62128032.64
Deka 2.5 ECdeltamethrin—25 g/L0.62300.765
Matrix 2.5 ECdeltamethrin—25 g/L0.31150.383
Total -115814148.3
Table 6. Irrigation level in the respective experimental objects and CO2 emission resulting from the irrigation.
Experimental ObjectIrrigation RateCO2 Emission from
Irrigation
[mm *][kg]
5160502.4 a**
6180565.2 b
7190596.6 b
8200690.8 c
* The crop irrigation requirement was calculated using an observation method according to the methodology of [7]. ** Different letters indicate significant differences between means at the significance level α ≤ 0.05.
Table 7. CO2 emissions from fertilizers [CO2 equivalent ∙ ha−1].
Experimental ObjectA *BCDEFG
CO2 Equivalent [kg∙ ha−1]
1-793.2 b793.2 a140.5 a1101 a78.540 a1032 b**
2-1447 c1447 c140.5 a1138 a108.09 b1624 e
3623.2 a86.73 a709.9 a140.5 a1115 a89.740 a1035 b
4934.8 b71.84 a1007 b140.5 a1133 a104.05 b1356 d
5-793.2 b793.2 a140.5 a1117 a593.79 c921.0 a
6-1447 c1447 c140.5 a1175 a702.65 d1436 d
7623.2 a86.73 a709.9 a140.5 a1138 a704.69 d870.0 a
8934.8 b71.84 a1007 b140.5 a1186 a78.540 a1227 c
* A—CO2 equivalent from slow-release fertilizer [25], B—CO2 equivalent from conventional fertilizers [25], C—total CO2 equivalent from fertilizers, D—CO2 equivalent from plant-protection products [32], E—CO2 emissions from fuel combustion [33], F—CO2 emissions from electricity consumption [33] G—CO2 emissions from the soil, residue crop, and organic matter mineralization [27,28]. ** Different letters indicate significant differences between means at the significance level α ≤ 0.05.
Table 8. Greenhouse gas emissions from nitrogen oxide emissions.
Experimental ObjectH *IJKLM
N2O [kg ∙ ha−1]CO2 Equivalent [kg ∙ ha−1]
11.416 b**0.228 d1.301 b413.4 b66.63 d379.8 b
22.672 d0.590 g1.709 c780.1 d172.4 g498.9 c
31.194 a0.139 c1.621 c348.7 a40.50 c473.4 c
41.791 c0.304 e1.958 d523.1 c88.73 e571.7 d
51.416 b0.204 d1.032 a413.4 b59.68 d301.3 a
62.672 d0.398 f1.345 b780.1 d116.2 f392.7 b
71.194 a0.000 a1.302 b348.7 a0.000 a380.1 b
81.791 c0.036 b1.874 d523.1 c10.59 b547.2 d
* H—direct N2O emissions from mineral fertilization [4], I—indirect N2O emissions from mineral fertilization [4], J—N2O emissions from residue crop mineralization, K—CO2 equivalent from direct N2O emissions, L—CO2 equivalent for indirect N2O emissions [29], M—CO2 equivalent for N2O emissions from residue crop mineralization [27,28]. ** Different letters indicate significant differences between means at the significance level α ≤ 0.05.
Disclaimer/Publisher’s Note: The statements, opinions and data contained in all publications are solely those of the individual author(s) and contributor(s) and not of MDPI and/or the editor(s). MDPI and/or the editor(s) disclaim responsibility for any injury to people or property resulting from any ideas, methods, instructions or products referred to in the content.