1. Introduction
International trade in fisheries and aquaculture products has become a structural component of global food systems—not only because of its contribution to food security, but also due to its growing role in shaping cross-border value chains, sanitary standards, and competitive positioning strategies based on product presentation and preservation methods [
1]. In particular, segmentation by processing status (e.g., frozen vs. non-frozen products) directly affects market access, the structure of destination markets, dependence on logistics intermediation (cold chain), and the capacity to sustain export performance over time [
2]. This relevance is reinforced because, in global seafood trade, product form and preservation methods act as attributes that influence valuation and market organization, thereby shaping the relative performance of exporting countries across segments with distinct competitive dynamics [
3]. In parallel, the recent literature emphasizes that export stability in fisheries products depends on supply chain resilience and, critically, on cold-chain infrastructure and governance [
4,
5].
In this context, crab—being highly sensitive to preservation requirements and sanitary regulations [
6]—constitutes a particularly suitable case to study export sustainability, understood as structural stability (lower dependence on a few destination markets) and the ability to maintain competitive export performance over time. This becomes especially relevant when countries simultaneously export frozen and non-frozen crab, because each segment tends to interact with different logistics networks, demand patterns, and risk profiles, which can translate into different market structures (diversification) and relative performance (competitiveness) [
7].
At the global level, the international crustacean market is economically significant and strongly segmented by product form [
8]. Recent evidence reports that global crustacean exports reached approximately 3.6 million tons and USD 35 billion in 2022, with most of the value associated with frozen products and a substantial share linked to live/non-frozen products, reflecting competition across segments with different preservation and destination logics [
9]. This segmentation matters: the non-frozen segment typically requires stricter cold-chain conditions and shorter logistics lead times, and it may concentrate in geographically closer destinations or air routes, whereas the frozen segment tends to allow greater logistical flexibility and potentially broader market dispersion [
10].
Across major exporting and importing countries, policy decisions, reputational shocks, and regulatory changes can affect trade structures and quickly reshape market concentration [
11]. For example, China’s role as a major seafood demander and a determinant actor in Asian trade has been empirically examined through recent variations in imports and supplier substitution following regulatory events or perceived-risk episodes, showing changes in sourcing patterns [
12]. In Europe, official fish market reports highlight the sensitivity of trade to prices, logistics costs, and sanitary regulations, which influence flow stability and destination concentration [
13]. In the United States, Japan, and the Republic of Korea (major seafood importers), changes in food safety regulations and traceability requirements intensify pressure on exporters, making competitive advantage depend on logistics capabilities, compliance, and product adaptation [
5]; additionally, exporters must meet strict delivery schedules while maintaining quality standards [
14]. Complementary policy and trade studies show that global disruptions can reduce the number of markets served by an exporter even when volumes do not fall proportionally, directly affecting diversification and, therefore, export sustainability [
15].
The research problem is particularly pronounced in the Asia–Pacific due to China’s role as a demand hub for non-frozen/live seafood products and as a market that conditions export strategies of supplying countries [
16]. At the sector level, the cold chain has also been highlighted as a critical mechanism to ensure quality and food safety in marine products [
17]. Such infrastructure and temperature-control pressures often translate into more concentrated export structures when a country depends on a small set of destinations capable of absorbing non-frozen products under specific conditions, increasing vulnerability to demand shocks or sanitary restrictions [
18].
In Latin America, although crab does not always lead the regional export basket, recent evidence shows that the region participates in global fishery chains characterized by demand volatility, dependence on high-income markets, and sensitivity to logistical disruptions [
19,
20]. Moreover, the review literature on the fish trade emphasizes that sector sustainability requires modernization, regulation, and infrastructure improvements to reduce structural risks and excessive dependence [
21]. At the same time, China’s relevance as a market and de facto regulator in Asia has indirect effects on global flows, affecting prices, routes, and competition for markets, with implications for exporters across regions [
3].
Within the countries analyzed—Canada, Vietnam, and China—the problem materializes in the coexistence of two export segments (frozen and non-frozen) that are expected to show different patterns of destination structure and competitive performance, with direct implications for export sustainability. In Vietnam, for instance, the literature documents strong integration into regional seafood value chains and a dynamic in which frozen and non-frozen (particularly live) products may target markets with different import profiles, with a notable Asian weight in live/non-frozen products [
9]. In China, as a central actor in the regional aquatic-product trade, product and market diversification and the evolution of export structure—under blue-economy strategies and changing regional demand—suggest that competitiveness is not homogeneous across categories and may vary by product form [
22]. In Canada, the crab trade—especially of high-value species—operates within supply chains with strict sanitary and logistics requirements; thus, the frozen/non-frozen segmentation is strategically relevant for interpreting stability and exposure to market-concentration risks [
23]. In sum, for these three countries, the key issue is not “how much they export” in the abstract, but how structure (diversification) and relative performance (competitiveness) differ across segments within the same country, and what that implies for sustaining exports over time amid logistical, regulatory, or demand shocks.
The selection of Canada, China, and Vietnam was based on three explicit criteria: (i) their sustained relevance in crab exports during the study period; (ii) the simultaneous presence of both frozen (HS 030614) and non-frozen (HS 030633) export flows, which enables a within-country comparison by product form; and (iii) the existence of contrasting export architectures that improve analytical heterogeneity. Canada represents a corridor-dependent model with strong concentration in a dominant market, China represents a relatively more regionally diversified structure, and Vietnam represents a higher-volatility export pattern, particularly in the non-frozen segment. Although other major exporters such as Russia, the United States, and Indonesia are also relevant in the global crab trade, they were not selected because the aim of this study was not to exhaustively cover the largest exporters, but to compare three analytically contrasting cases that allow a consistent segment-level assessment of diversification and revealed competitiveness.
Accordingly, the research question is, To what extent do frozen and non-frozen crab exports differ, within each country (Canada, Vietnam, and China), in terms of destination-market diversification and trade competitiveness?
The study objective is to analyze the sustainability of crab exports at the country level by assessing diversification and competitiveness of the frozen and non-frozen segments in Canada, Vietnam, and China.
From a theoretical standpoint, the study lies at the intersection of the international-trade literature applied to fishery products and approaches to the economic sustainability of export performance, where structural stability is associated with lower destination concentration and the ability to sustain relative advantages. In this manuscript, the expression economic-trade sustainability is used in a bounded sense: it refers to the structural coherence between destination diversification, revealed competitiveness, and the trade conditions that support export continuity in perishable products, rather than to a full environmental or social sustainability assessment. This interpretation is consistent with the recent literature that frames sustainability as the alignment between competitiveness, diversification, and value chain capacity under changing market conditions [
24]. Segmentation by product form matters because preservation type and commercial form are dimensions that explain differences in value, consumer preferences, and international market organization, thereby influencing countries’ positions in marine-product trade. In addition, the logistics component—especially the cold chain—is recognized as a determinant of quality, safety, and flow continuity in perishable products, which directly connects to export sustainability by conditioning market access and exposure to disruptions [
25].
Conceptually, the manuscript links three dimensions within a single interpretive model. First, destination diversification, approximated through HHI, indicates how narrowly or broadly export exposure is distributed across partner markets. Second, destination-level SRCA captures whether the exporter holds favorable revealed positioning within those reachable markets. Third, cold-chain and perishability constraints condition the feasible set of destinations, because they shape lead-time tolerance, compliance intensity, and the operational continuity of non-frozen flows. Under this logic, export sustainability is interpreted as stronger when competitive positioning is sustained without excessive corridor dependence, and weaker when revealed advantages are confined to a narrow set of destinations under tight logistical constraints [
4,
7,
15].
From a practical standpoint, the contribution is useful for public and private decision-makers in the fisheries sector because it helps identify whether a country concentrates its non-frozen segment in a few destinations (increasing vulnerability) or whether the frozen segment exhibits broader dispersion and, thus, greater resilience. Likewise, it reveals whether relative competitiveness is sustained across both segments or concentrated in only one, with implications for export strategy, logistics investment, and risk management.
From a methodological standpoint, combining measures of destination-market concentration/diversification and revealed competitiveness provides a replicable and transparent way to assess export sustainability using international secondary data. Destination concentration has been widely operationalized through Herfindahl–Hirschman-type metrics, useful to approximate dependence and concentration risk [
26,
27,
28]. Trade competitiveness can be approximated with revealed comparative advantage indicators in normalized forms, discussed for their comparability and metric properties relative to traditional alternatives [
29]. Examining HHI alone identifies how concentrated an export architecture is, whereas SRCA alone identifies whether revealed positioning is favorable or unfavorable; their joint reading distinguishes analytically different cases such as competitive concentration, diversified but weak positioning, and concentrated disadvantage, which cannot be inferred with the same clarity from either indicator in isolation. Methodologically, the within-country approach (frozen vs. non-frozen within the same country) helps isolate structural interpretations of the export portfolio, avoiding the confounding of macro-scale differences across countries with segment-level differences in market organization.
Literature Review
The recent literature provides three relevant consensuses. First, there is agreement that perishable logistics—especially the cold chain—influences efficiency, losses, food safety, and supply chain sustainability, with a rapidly expanding body of work emphasizing traceability, digitalization, and risk management [
30,
31,
32]. Second, disruptions (sanitary or mobility shocks) can modify destination markets and trade patterns, implying that diversification is not static and should be assessed empirically over relevant time windows [
33,
34,
35]. Third, China plays a structuring role in the seafood trade; thus, changes in its policies, risk perceptions, or standards can alter regional sourcing networks, showing supplier substitution and flow reconfiguration [
12,
22].
However, specific gaps remain for crab and, even more, for interpreting export sustainability through a within-country segment comparison (frozen vs. non-frozen). Many studies analyze fishery trade at an aggregate or broad-basket level, highlighting opportunities and barriers without systematically disaggregating destination structure by product form [
21]. Conversely, supply chain preservation studies (chilled vs. frozen) often model logistics and contractual decisions but do not always connect these mechanisms to observable metrics of destination diversification and revealed competitiveness in international trade data by country and segment [
7,
36,
37]. Moreover, although sector studies discuss sustainability and crab’s international insertion (e.g., in Vietnam) with evidence of market differences and modalities, there is still room for an approach integrating: (i) explicit measurement of destination concentration/diversification, (ii) segment-level revealed competitiveness, and (iii) an export sustainability interpretation centered on the coexistence of both segments within the same country, without framing the analysis as a direct competition across countries [
9].
At the same time, the existing literature remains fragmented in ways that justify a more integrated approach. Trade studies frequently use concentration or comparative-advantage metrics separately, which clarifies one dimension of export structure but leaves unclear whether competitiveness is broad-based or confined to narrow corridors. Logistics-oriented studies, by contrast, often explain perishability, lead-time pressure, and cold-chain dependency at the operational level, yet they do not systematically connect those constraints to destination-level concentration outcomes in observed trade data. In addition, some studies implicitly treat concentration as efficiency or specialization, while others interpret it as exposure and vulnerability, showing that the same empirical pattern can sustain competing readings. The present study addresses that gap by explicitly combining diversification, revealed positioning, and preservation-related constraints within one bounded interpretive framework for crab exports [
7,
21,
36].
Therefore, this study contributes by addressing the gap in three dimensions: (a) it focuses on crab with disaggregation by preservation/commercial-form segment (frozen vs. non-frozen), (b) it operationalizes export sustainability as the joint reading of market structure (diversification) and relative performance (competitiveness), and (c) it uses a within-country comparison that enables interpretation of internal strategic trade-offs.
The study relies on international-trade and market organization foundations applied to observed export data. Regarding trade competitiveness, the conceptual starting point is revealed comparative advantage, originally linked to observed specialization in trade flows and later extended to formulations improving comparability and statistical properties. In this line, symmetric revealed comparative advantage (SRCA) is justified as a transformation that improves symmetry and comparability across countries, products, and time—particularly relevant when comparing related product segments within a country under distinct HS codes [
38]. The value of the revealed approach for fisheries products is that it captures effective competitiveness in international markets, where performance simultaneously reflects costs, quality, access, logistics, and regulation.
For export diversification, the analytical foundation comes from the notion of market concentration as a proxy for trade dependence and exposure to risk from shocks in dominant destinations [
39]. Herfindahl–Hirschman-type indices applied to the dispersion of export value across trading partners are used to infer destination-market structure and dependence, providing a structural reading of sustainability because high concentration is often associated with vulnerability to unilateral demand changes or barriers [
40]. This theoretical base aligns with the recent literature linking supply chain sustainability and resilience to adaptive capacity under logistics and market risks, particularly in perishables, where the cold chain conditions operational continuity.
Finally, the linkage between product form (frozen/non-frozen) and export sustainability is supported by evidence showing that preservation and product type affect market-valued attributes, logistics costs, and international trade patterns; thus, sustainability cannot be inferred without distinguishing segments facing different constraints and opportunities [
3,
7]. Accordingly, the proposed analysis is grounded in a coherent framework—market structure (diversification) + relative performance (revealed competitiveness) + logistical constraints of preservation—to interpret country-level export sustainability in frozen and non-frozen crab segments for Canada, Vietnam, and China.
2. Methodology
This study adopted a quantitative approach with a descriptive within-country (intra-country) design, based on secondary international trade data. The methodological purpose was to characterize, for each country (Canada, Vietnam, and China), how two product forms defined by the HS classification—frozen crab and non-frozen crab (including live/fresh/chilled)—differ in: (i) destination-market export diversification and (ii) trade competitiveness, in order to interpret export sustainability in an economic-trade dimension (structural stability and relative performance). Consistent with the descriptive design, the main comparison is within-country (frozen vs. non-frozen), and any cross-country contrast is limited to contextual description, without hypothesis testing between countries [
41]. The unit of analysis is the annual country–product–destination flow measured as export value (USD) for the period 2020–2024. The analytical population includes the universe of destination markets (trade partners) reported for each country and product in each observed year; therefore, no probabilistic sampling was applied, and a census of destinations with reported exports for the selected HS codes was used.
The 2020–2024 period should be interpreted with caution, as it encompasses the COVID-19 shock and its immediate aftermath, a context characterized by supply chain disruptions, border restrictions, logistical volatility, and abrupt shifts in destination-market demand. Accordingly, the observed patterns of concentration and competitiveness may reflect not only structural export dynamics, but also temporary distortions arising from an exceptional and atypical trade environment.
2.1. Data Source
Data were extracted from ITC Trade Map (International Trade Centre), which reports annual international trade statistics by country, HS product, and partner country and provides indicators useful for export performance diagnosis. Data extraction and consolidation were completed in January 2026 to ensure traceability and replicability, acknowledging that Trade Map may incorporate subsequent revisions as underlying sources are updated [
42]. For web sources cited in references, the reported access date was retained (3 February 2026).
Two six-digit HS products were defined: HS 030614 (frozen crab) and HS 030633 (non-frozen crab). This delimitation enables a consistent international separation of products whose logistics, delivery lead times, cold-chain requirements, and demand configuration may differ, which justifies analyzing them independently within each country.
A methodological caveat must be noted regarding HS 030633. This six-digit code aggregates live, fresh, and chilled crab into a single non-frozen category. Although this aggregation is acceptable for international comparability at the six-digit HS level, these subforms may differ in shelf-life constraints, logistics requirements, transport modes, destination structures, and buyer profiles. Consequently, the non-frozen segment should be interpreted as an aggregated commercial category, and the resulting HHI and destination-level SRCA values capture the structural behavior of the combined non-frozen flow rather than the isolated dynamics of live, fresh, or chilled subsegments.
2.2. Procedure: Collection, Cleaning, and Dataset Construction
In Trade Map, annual exports disaggregated by destination (value in USD) were retrieved for each country (Canada, Vietnam, and China) and each product (HS 030614 and HS 030633). Files were then consolidated into a single dataset using country–year–product–destination keys. When minor discrepancies arose due to rounding between the reported annual total and the sum across destinations, internal consistency was preserved for computing destination shares, noting that such differences reflect rounding in statistical reporting. All indicators in this study are computed in value terms. Consequently, variation in HHI, SRCA, and RSI may reflect not only changes in trade allocation but also price movements, exchange-rate effects, or compositional shifts in product quality and transaction mix. Quantity-based robustness checks and unit–value comparisons were not implemented because internationally reported quantity units are not consistently comparable across all destination–product flows in the selected dataset. For that reason, the empirical scope of the findings is limited to value-based trade structure and should not be interpreted as direct evidence of physical-volume reallocation.
2.3. Variables and Indicators: Operational Definitions
2.3.1. Export Diversification (Destination Structure)
Diversification was operationalized as the inverse of destination-market concentration, measured using the Herfindahl–Hirschman Index (HHI) computed by country, product, and year. Let denote the export value (USD) of country for product to destination in year .
Using these shares, the HHI on the 0–10,000 scale is computed as
Higher values indicate greater concentration (lower diversification) and, therefore, greater structural dependence of the product on a small number of destinations. For interpretive purposes, the study uses the conventional 0–10,000 HHI reference bands (below 1000, 1000–1800, above 1800) as heuristic anchors rather than as a claim of direct equivalence between export concentration and firm-level market concentration. These thresholds were originally developed in competition analysis, but they remain useful here as standardized reference points to distinguish relatively dispersed, intermediate, and highly concentrated destination structures on a common scale. In this manuscript, they are used to support comparative interpretation across country–product cases, not as formal trade-specific cutoffs with independent inferential status [
43,
44].
2.3.2. Trade Competitiveness (Symmetric Revealed Comparative Advantage, SRCA)
Competitiveness was approximated using Symmetric Revealed Comparative Advantage (SRCA), treating each HS code as a product. In this study, SRCA is applied in a destination-conditioned form in order to evaluate relative positioning across destination markets. For each country i, product p, destination d, and year t, the export share of a given crab product in that country’s exports to destination d is compared with the corresponding share of the same product in world exports to that same destination (all in value terms). Thus, both the country share and the world benchmark are conditioned on the same destination d, rather than on aggregate country–product exports. This destination-level adaptation is consistent with the objective of examining destination-market structure, but it should not be read as a conventional aggregate country–product RCA estimate.
First, the destination-conditioned Balassa RCA was computed as
where X
i,p,d,t denotes exports of country i in product p to destination d in year t; X
i,.
,d,t denotes country i’s total exports to destination d across all products in year t; X
w,p,d,t denotes world exports of product p to destination d in year t; and X
w,.
,d,t denotes total world exports to destination d across all products in year t.
Then, the symmetric transformation was applied to the destination-conditioned RCA to obtain SRCA:
SRCA takes values in the interval [−1, 1]. Values greater than 0 indicate revealed comparative advantage, values below 0 indicate disadvantage, and values close to 0 suggest a neutral position. In the present study, these values are interpreted as destination-specific revealed positioning indicators. Accordingly, they improve analytical fit with the study objective but limit direct comparability with conventional country–product SRCA values reported in the broader revealed comparative advantage literature.
This perspective is consistent with prior evidence showing that comparative advantages are not only descriptive indicators of trade patterns, but are also linked to export specialization. Konstantakopoulou and Tsionas [
45] provide empirical evidence that comparative advantages positively affect export specialization and report that, in most cases, the causal direction runs from comparative advantages to export specialization. Although the present study does not estimate causal relationships, this contribution is theoretically relevant because it supports the expectation that persistent revealed advantages are associated with more stable specialization patterns. In that sense, the use of SRCA in this study is framed as a structural competitiveness indicator rather than as a standalone descriptive ratio. However, in destination-level applications, short-term demand surges, temporary trade diversion, or episodic supplier substitution may also affect the magnitude of observed SRCA values. For this reason, persistent multi-year patterns are emphasized over isolated annual spikes, and SRCA is interpreted as a descriptive competitiveness signal rather than definitive proof of structural superiority.
2.4. Analytical Strategy and Interpretation of Export Sustainability
The analysis was conducted at two levels. First, for each country and product, annual series of destination concentration and destination-level revealed competitiveness were constructed by estimating HHI and SRCA for each observed year. Second, a within-country structural comparison was developed by jointly reading diversification, revealed positioning, and export scale. Because the design is descriptive, all comparisons are interpreted as structural patterns and associations rather than causal effects.
Because the dataset covers only five annual observations, the temporal dimension is treated descriptively rather than through formal trend estimation. Year-to-year changes are examined as short-run trajectory signals that help identify persistence, volatility, or temporary reversals, but the study does not estimate trend coefficients or dynamic resilience parameters. Accordingly, temporal patterns are interpreted as indicative rather than statistically robust long-run trends.
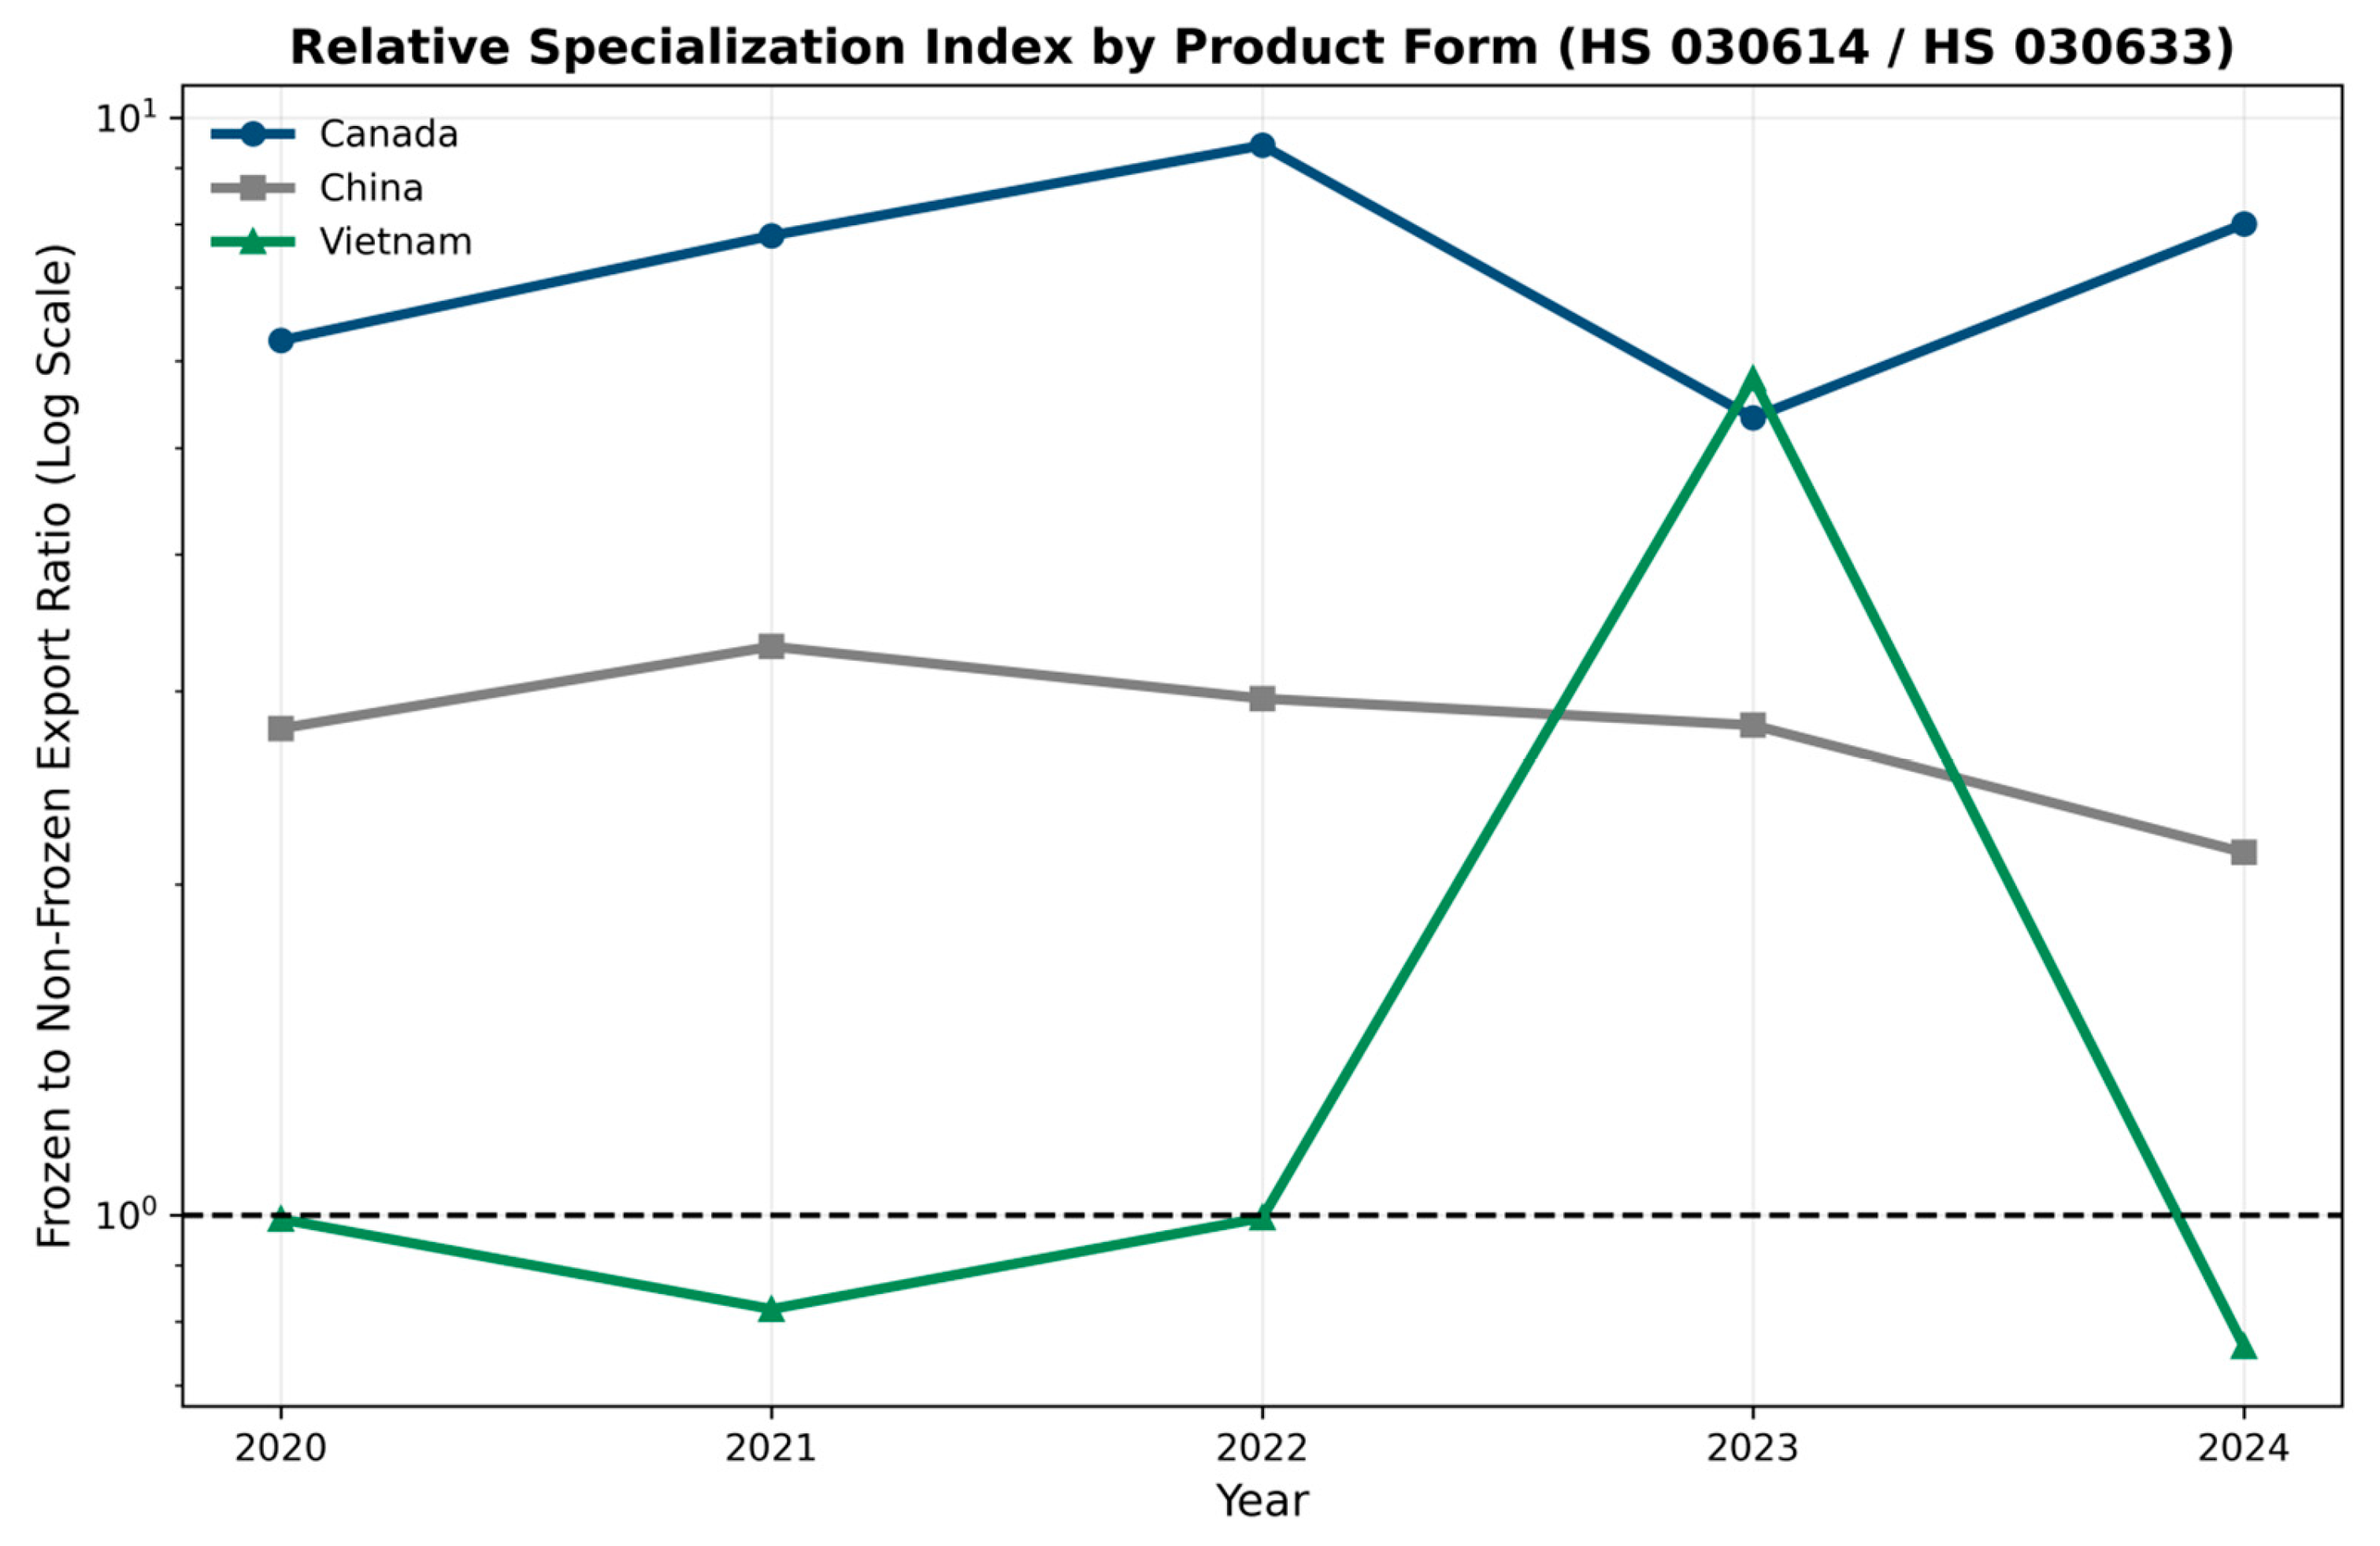
The Relative Specialization Index (RSI) was calculated to evaluate structural orientation toward product form in crab exports. The index is defined as the ratio between frozen crab exports (HS 030614) and non-frozen crab exports (HS 030633) for each country and year. Because RSI is a simple export value ratio, it is used here as a descriptive proportional indicator of product form orientation rather than as a formal comparative advantage index grounded in trade theory. It may also be sensitive to year-to-year fluctuations, especially in thin trade flows.
where
represents the export value of frozen crab for country
i in year
t, and
corresponds to non-frozen crab exports. Values above 1 indicate structural dominance of frozen exports, values below 1 reflect greater orientation toward non-frozen exports, and values equal to 1 denote structural parity. A logarithmic transformation was applied to the vertical axis in the graphical representation to enhance cross-country comparability and highlight structural asymmetries across different magnitude levels.
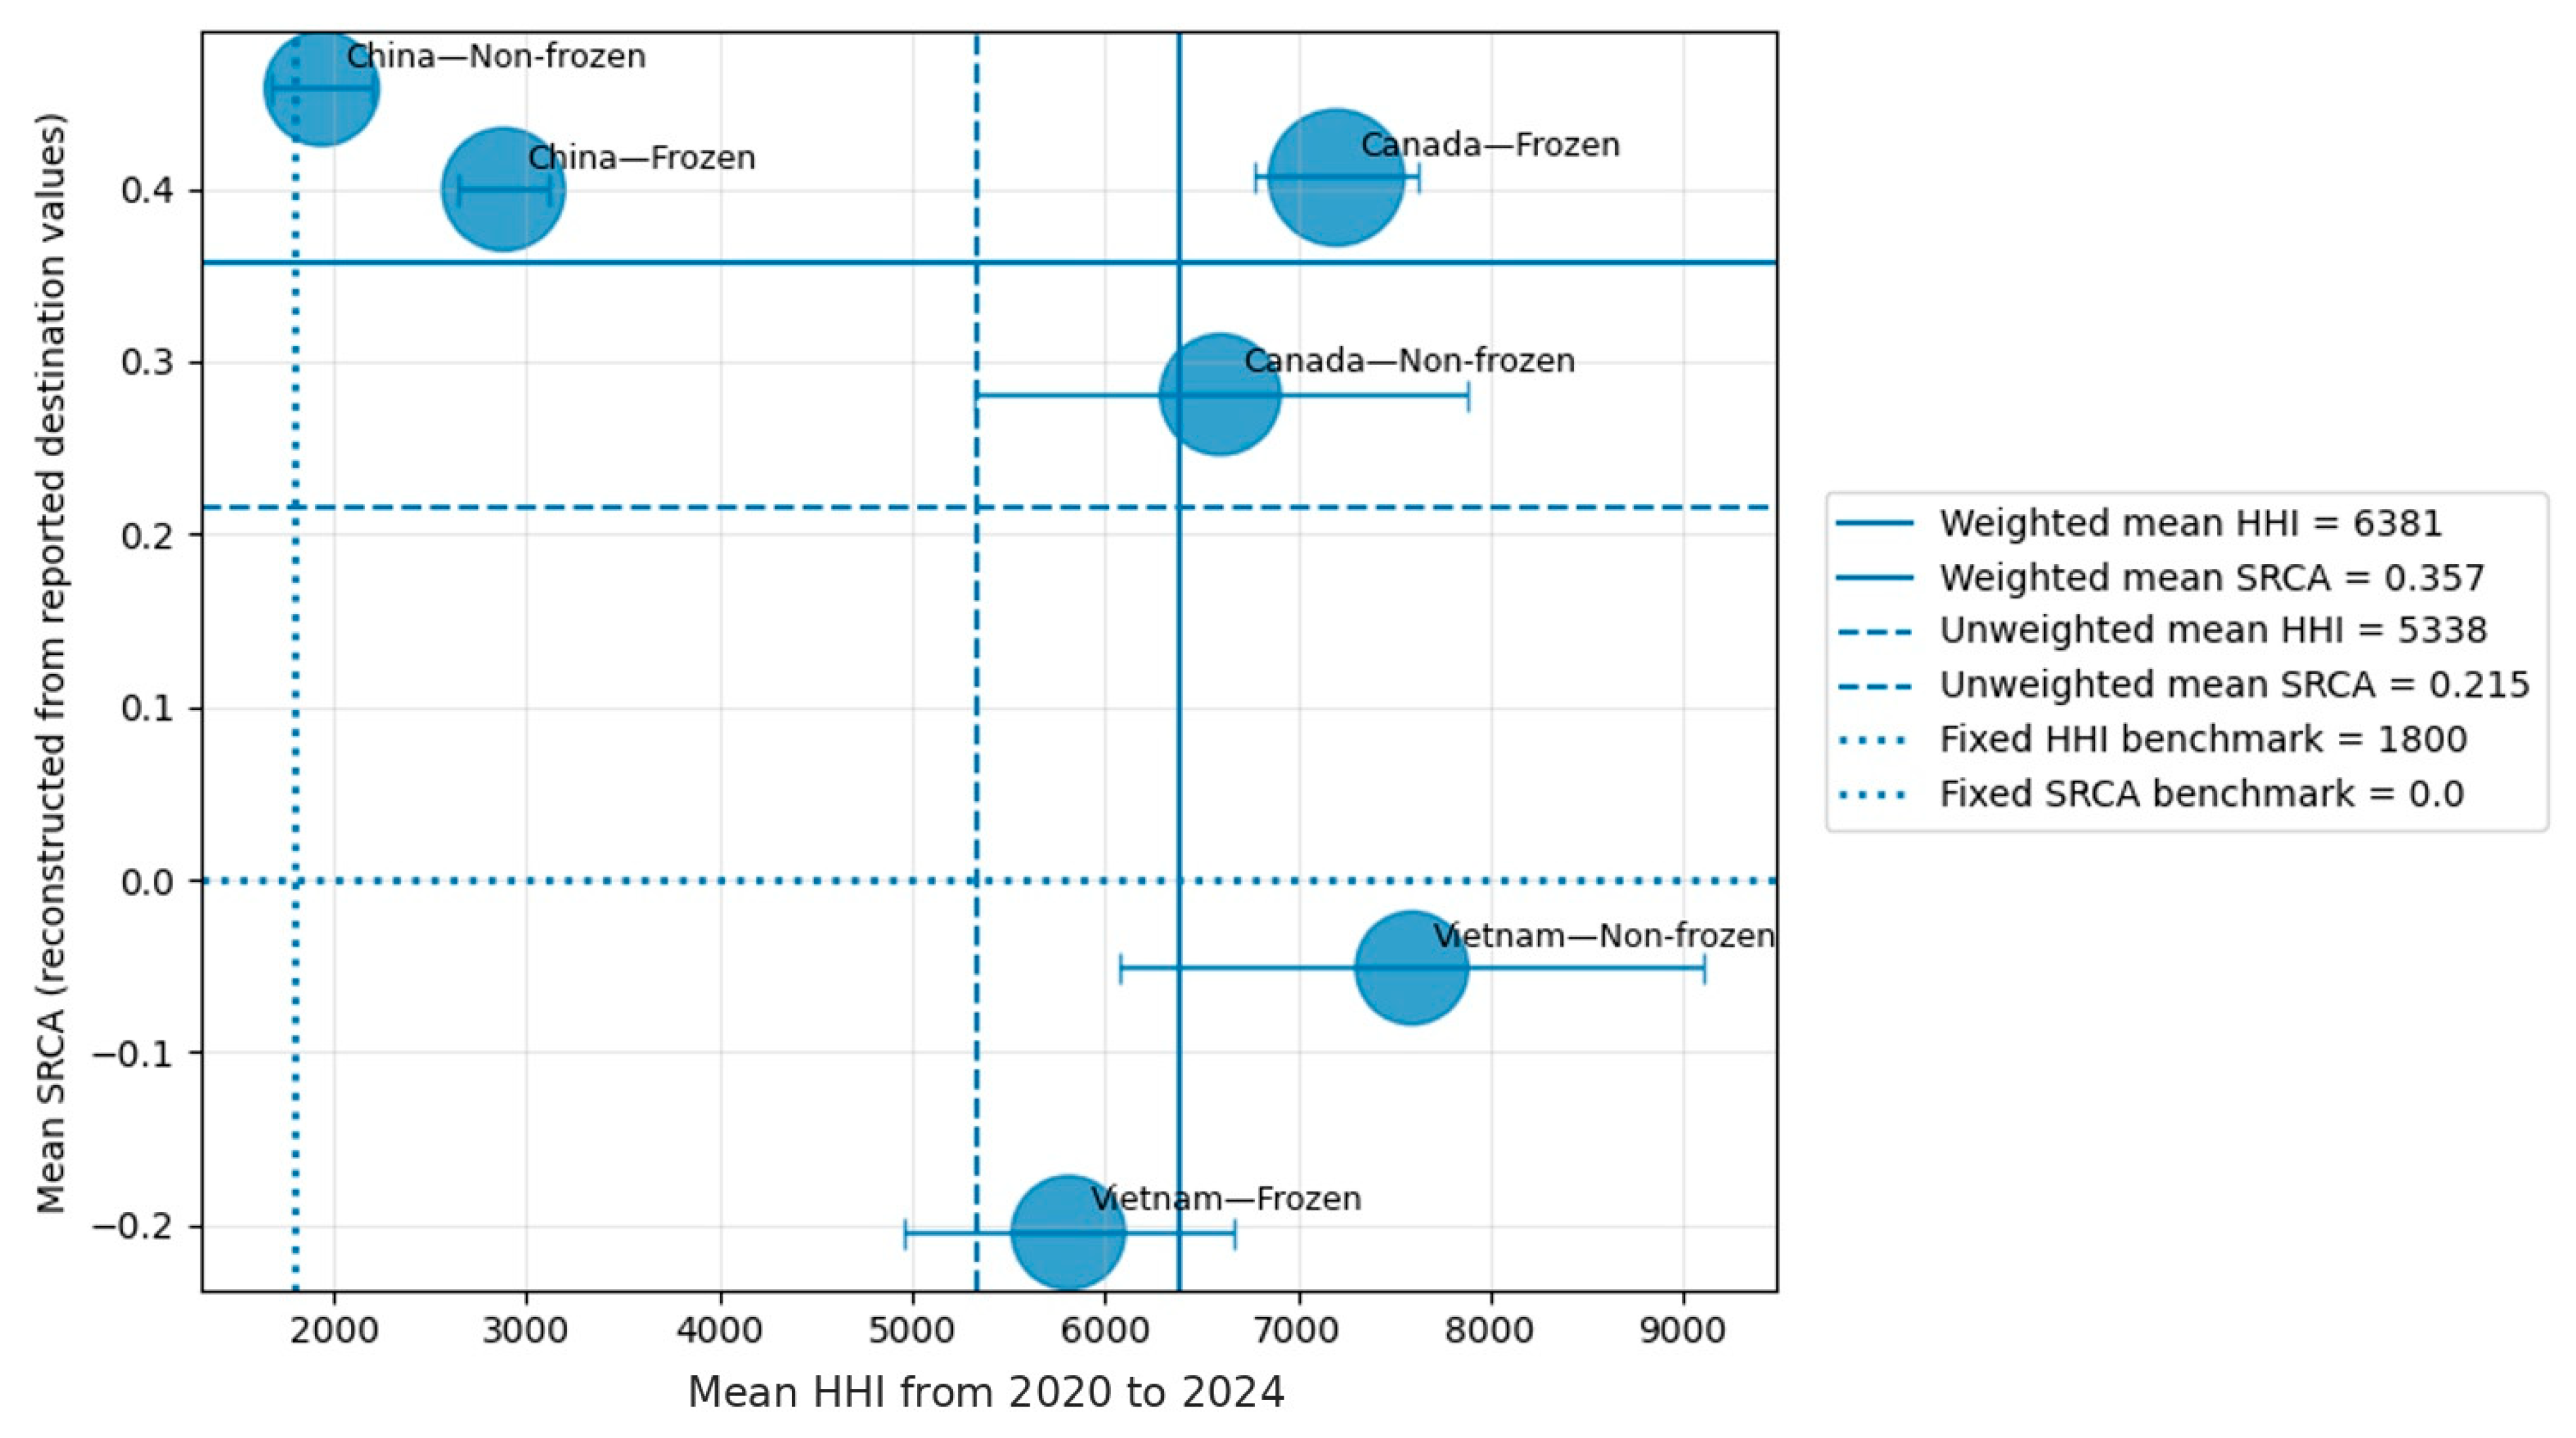
To jointly evaluate structural diversification and competitive positioning, a strategic positioning matrix was developed, integrating export market concentration and symmetric revealed comparative advantage. Export concentration was measured using the Herfindahl–Hirschman Index (HHI), calculated annually based on destination export shares for each country–product pair. The mean HHI over the study period was used to represent structural concentration intensity.
As an exploratory measure of temporal dispersion, 95% confidence intervals were computed for the mean HHI using
where x-bar denotes the sample mean, s represents the standard deviation, and
n corresponds to the number of annual observations. Given the limited time dimension (
n = 5), these intervals are interpreted cautiously and are not used as the primary basis for inferential comparison. Their role is descriptive, as a visual complement to the observed variation across years.
Competitive positioning was assessed using the symmetric revealed comparative advantage (SRCA) index. Period averages were calculated to reflect persistent competitive patterns rather than isolated annual fluctuations.
Quadrant delimitation within the matrix was initially determined using export-weighted means of both HHI and SRCA. Because the matrix is built on only six country–product observations, this weighted centering is used strictly as a visual reference rather than as a self-sufficient classification rule. To reduce sample dependence and circularity, substantive interpretation relies primarily on externally interpretable thresholds already reported for HHI (1000 and 1800) and on SRCA = 0 as the neutrality benchmark. Accordingly, quadrant location is treated as descriptive and comparative, not as a fixed typology generated solely by the sample.
Bubble size was scaled logarithmically based on average export value to avoid distortion arising from large inter-country differences in export scale. Furthermore, reference lines at HHI = 1000 and HHI = 1800 were incorporated to differentiate between low, moderate, and high levels of export concentration, consistent with established competition benchmarks.
This integrated methodological framework enables simultaneous assessment of diversification, competitive strength, structural dependency, and export scale. More specifically, it yields a joint diagnostic that is not obtainable from either indicator separately: HHI identifies the intensity of destination concentration, SRCA identifies the direction and persistence of revealed positioning, and their combination distinguishes whether an export segment is competitive but concentrated, diversified but weakly positioned, or simultaneously concentrated and weak. The framework is therefore used as an explicitly descriptive interpretive device rather than as a claim of causal inference.
2.5. Consistency Checks and Quality Control
For , it was verified that, for each country–product–year combination, destination shares summed to 1 (allowing for rounding tolerance), and the leading destination’s share was cross-checked as a plausibility test when was high. For SRCA, annual aggregates and the coherence of SRCA’s sign and trajectory over time were checked to avoid spurious results due to consolidation errors.
The study used exclusively aggregated secondary international trade data, without personal or sensitive information; therefore, it did not require informed consent or ethics review for human subjects. Scientific integrity was ensured through traceability (data source, HS codes, extraction date), replicability of calculations (explicit formulas), and interpretive caution, avoiding causal inferences not supported by the descriptive design.
4. Discussion
The evidence indicates that segmentation by product form structures distinct market and risk architectures rather than merely reflecting commercial differentiation. This finding is consistent with the view that processing status conditions market access, destination-market organization, and logistics intermediation [
2]. More broadly, the manuscript interprets economic-trade sustainability as the structural coherence between destination diversification, revealed competitiveness, and the trade conditions that support export continuity in perishable products, rather than as a claim about environmental or social sustainability in a wider sense. Within that bounded framework, export sustainability cannot be inferred from scale alone but from the joint configuration of destination structure and revealed positioning across frozen and non-frozen segments.
In Canada, destination concentration remains structurally high in both segments, with frozen crab embedded in a dominant corridor and non-frozen crab intensifying dependence toward the end of the period. This structural narrowness is consistent with limited buffering capacity against regulatory tightening, sanitary measures, or demand contractions in key destinations [
15]. At the same time, high concentration does not by itself prove fragility: part of the observed pattern may also reflect deliberate corridor specialization, proximity advantages, product characteristics, or the institutional setting in which the trade operates. The non-frozen segment nonetheless appears more exposed to operational disruption because border delays, sanitary controls, and continuous temperature-management requirements are especially relevant for highly perishable products [
6]. In this context, the coexistence of concentrated advantage in one destination and weaker positioning elsewhere suggests a form of competitiveness that is commercially viable but not easily transferable across partners [
10,
12].
By contrast, China exhibits a comparatively more regionally distributed export configuration, with moderate concentration levels across both segments. This diversified structure is consistent with greater dispersion of market exposure because reallocation within proximate Asian markets appears more feasible when one destination weakens [
4]. Sustained positive revealed positioning across several regional partners suggests anchoring in established intra-Asian trade networks and logistics compatibility, whereas disadvantage in certain Western markets reflects selective rather than universal competitiveness [
22]. Even so, diversification should not be equated with immunity: supplier substitution, regulatory changes, and perceived-risk episodes can still reconfigure routes and alter relative positioning over time [
12].
Vietnam combines very high concentration, especially in the non-frozen segment, with abrupt shifts in destination orientation, indicating a more reactive allocation pattern relative to the other cases [
35]. Competitive positioning remains concentrated in narrow corridors and does not appear broadly replicable across destinations, while the frozen segment, although comparatively more stable, still exhibits elevated concentration [
13]. Overall, the combined reading of HHI and SRCA supports a structural interpretation of export sustainability that differs from using either indicator alone: HHI reveals how narrow or dispersed the destination architecture is, while SRCA shows whether revealed positioning is favorable or unfavorable within that architecture. At the same time, the discussion must remain open to alternative interpretations. High concentration may reflect strategic specialization, biological stock availability, quota systems, or fishery management regimes, not only trade fragility; likewise, high SRCA may reflect temporary demand surges, trade diversion, or short-term supplier substitution rather than durable structural superiority. Accordingly, the results are interpreted as descriptive structural associations, not as direct proof of shock transmission, resilience, or causal vulnerability.
5. Conclusions
The findings indicate that product form segmentation meaningfully differentiates export sustainability profiles because destination-market structure and revealed competitiveness evolve under distinct preservation and compliance constraints. Canada and Vietnam exhibit structurally high concentration, particularly in non-frozen exports, implying elevated dependence on narrow corridors and limited shock-absorption capacity when dominant markets face sanitary tightening, reputational events, or demand contractions. At the same time, competitive positioning is destination-specific rather than uniformly distributed, which supports the interpretation that sustainability cannot be inferred from performance alone but from the joint configuration of concentration risk and sustained relative advantage.
From a policy and managerial standpoint, the required actions differ across countries. In Canada, the immediate priority is to reduce corridor dependence by lowering excessive reliance on the United States in frozen exports and on China in non-frozen exports through buyer diversification, alternative routing, and contingency logistics planning. In practical terms, this may include developing secondary buyer portfolios in Asia and premium North American niches, securing backup cold-storage and port-handling arrangements, and widening customs-clearance and transport options for time-sensitive shipments. In China, the key priority is to preserve its relatively diversified regional structure by strengthening traceability, sanitary compliance, and redundancy across East and Southeast Asian trade corridors. This also implies maintaining active market intelligence, preserving a broad regional buyer base, and using rapid reallocation protocols when policy or demand conditions shift. In Vietnam, the priority is more urgent in the non-frozen segment, where extreme destination dependence calls for deliberate market diversification, stronger cold-chain governance, and exporter upgrading in handling, certification, and market access. Concrete measures include expanding approved buyers beyond the dominant corridor, improving pre-export temperature monitoring and handling, strengthening certification readiness, and using trade-promotion or bilateral access initiatives to stabilize alternative outlets. Accordingly, fisheries authorities, trade-promotion agencies, sanitary and customs authorities, and logistics operators play differentiated but complementary roles in improving export continuity.
Several limitations should be noted. First, the study is descriptive and uses secondary trade data, so it supports structural interpretation rather than causal claims, and database figures may be updated retrospectively. Second, HS 030633 aggregates live, fresh, and chilled crab in a single non-frozen category, so the reported non-frozen patterns describe the combined flow rather than each subsegment separately. Third, the 2020–2024 window captures a period shaped by COVID-19 and post-pandemic adjustment, which may confound observed concentration patterns and, therefore, should be interpreted as short-run evidence rather than a full long-term characterization of export sustainability. Fourth, SRCA is adapted here at the destination level to fit the study objective, which improves analytical relevance but limits direct comparability with conventional country–product RCA studies. Fifth, RSI is an author-constructed descriptive ratio and may be sensitive to short-term fluctuations in thin trade flows. Sixth, all indicators are measured in value terms, so price changes, exchange-rate movements, or compositional shifts may influence the observed patterns; accordingly, the findings should be interpreted as value-based trade structure evidence rather than as direct evidence of quantity reallocation. Seventh, part of the observed concentration may also reflect biological stock availability, seasonality, quota systems, or fishery management regimes, which are not modeled separately here. Eighth, destination-level SRCA may be affected by short-term demand surges, trade diversion, or temporary supplier substitution, so isolated spikes should not be read as definitive structural advantages. In addition, although annual changes are reported and compared, the study does not estimate formal time-series or panel trend models; therefore, resilience is inferred from short-run trajectory patterns rather than from statistically validated dynamic parameters. Finally, the 95% confidence intervals for HHI are based on only five annual observations and are therefore treated as exploratory visual complements rather than as strong inferential statistics. Future research could extend this framework by incorporating quantity-based or price-based competitiveness measures, firm-level exporter data, cold-chain performance indicators, and dynamic panel or time-series approaches to test whether the same structural patterns persist under richer operational evidence.




 ,
,