Article

Effects of Biogas Slurry Application on Vegetation Community Restoration in Degraded Grassland

1
Key Laboratory of Grassland Resources, Ministry of Education, College of Grassland Science, Inner Mongolia Agricultural University, Hohhot 010011, China
2
Values for Development Limited, 107 Green End Road, Cambridge CB4 1RS, UK
*
Author to whom correspondence should be addressed.
Sustainability 2026, 18(5), 2605; https://doi.org/10.3390/su18052605
Submission received: 20 January 2026 / Revised: 10 February 2026 / Accepted: 5 March 2026 / Published: 6 March 2026

Abstract

Biogas slurry is rich in nitrogen, phosphorus and bioactive substances, making it an effective material for restoring degraded grasslands. Against this background, we conducted a field experiment in Zhenglan Banner, Xilingol League, Inner Mongolia Autonomous Region, China, from 2024 to 2025, to study the short-term effects of biogas slurry fertilizer on vegetation characteristics and above- and belowground plant traits. The experiment comprised three treatments: a water control (CK), 50% diluted biogas slurry (BS50%), and full-strength biogas slurry (BS100%). All treatments were applied at a rate of 300 m3·ha−1, with CK receiving an equivalent volume of water. The biogas slurry contained 0.11% nitrogen (N), 0.07% phosphorus (P2O5), and 0.09% potassium (K2O). Results showed that, compared with the control, biogas slurry application increased plant height, coverage, and biomass by 8.04–54.00%, 5.48–17.76%, and 18.40–96.01% in the first year, respectively. Plant crude protein and crude fat also increased by 7.33–31.17% and 21.54–30.00%. In the second year, the increases were 26.41–50.22%, 6.16–20.55%, and 13.91–52.42% for plant height, coverage, and biomass and 4.46–28.27% and 14.24–19.89% for crude protein and crude fat, respectively. The carbon, nitrogen and isotope indices of leaves and roots also increased simultaneously. Biogas slurry application altered plant community composition, BS50% transiently increased plant family richness, BS100% exerted persistent inhibitory effects, and species diversity across all fertilization treatments showed a recovery trend in the second year. Principal component analysis and redundancy analysis showed that treatment groups were clearly separated in 2024 but overlapped substantially in 2025. Root δ13C and root δ15N were key indicators distinguishing vegetation community characteristics. The results of this study confirmed that the application of biogas slurry fertilizer could actively improve the vegetation recovery of degraded grasslands. It provided reference support for the resource utilization of biogas slurry fertilizer and the sustainable management of grassland ecosystems.

1. Introduction

Grasslands, as one of the most widespread natural vegetation types on Earth, play a vital role in maintaining ecosystem functions, controlling wind erosion, conserving water resources, and supporting livestock farming [1]. At present, under the combined influence of climate change and human activities, grassland degradation has emerged as a critical environmental issue that requires urgent solutions. This degradation manifests as diminished biodiversity and impaired ecological functions, alongside significant declines in forage yield and quality and an expansion of bare ground areas [2,3]. Severe degradation threatens ecological security and hinders regional sustainable development. Consequently, formulating scientifically sound and effective grassland restoration strategies to mitigate degradation and promote sustainable development is imperative.
In grassland ecosystems, when biological activity and litter decomposition fail to meet the nutrient and elemental requirements for normal plant growth, intervention through artificial fertilization is often necessary. Conventional fertilization schemes predominantly employ nitrogen fertilizers and nitrogen-dominant compound fertilizers supplementing plant nutrition through nutrient inputs to restore vegetation communities [4]. Such approaches suffer from issues including low nutrient utilization rates and uneven absorption by vegetation [5]. Biogas slurry is rich in multiple nutrients such as carbon and nitrogen, along with bioactive substances, making it readily absorbable by plants [6]. It can enhance the stability and productivity of plant communities by regulating nutrient uptake efficiency and optimizing the composition of community matter [7]. Although some studies have reported potential heavy metal risks with long-term or excessive biogas slurry application [8], the present study mainly focused on its effects on soil nutrient availability, plant community characteristics, and ecological restoration of degraded grasslands.
Extensive research has confirmed the positive impact of biogas slurry on enhancing vegetation communities. Numerous scholars have indicated that biogas slurry promotes plant growth, root development, and nitrogen uptake [9,10]. Conversely, other investigations into biogas slurry application have reported that it increases leaf carbon content while reducing leaf nitrogen content [11]. Biogas slurry increases crude protein levels in foliage and decreases quality indicators such as cellulose content [12,13]. These studies demonstrate that the gradual release of nutrients from biogas slurry fertilizer ensures a stable supply throughout the growing season. It prevents nutrient loss and increases yields by improving nutrient availability, absorption, and utilization efficiency [14].
Research on the effects of additional application of biogas slurry fertilizer on vegetation communities has predominantly focused on agricultural ecosystems. Tang [15] found that after increasing the application of biogas slurry fertilizer, the grain yields of rice and wheat were 8.9% and 15.7% higher than those with traditional fertilization, respectively. Xu Peizhi [16] showed that biogas slurry can significantly increase the yield of Chinese cabbage while improving the nitrogen content and the nutrient accumulation of nitrogen, phosphorus and potassium. Ferdous [17] found that the combined application of biogas slurry fertilizer and chemical fertilizer increased the yield of maize by 20–24% and had more economic and ecological advantages than the single application of a chemical fertilizer or traditional farmyard manure.
Existing studies are largely confined to the growth effects of individual herb species in agricultural ecosystems, while research on grassland ecosystems remains relatively scarce. To address this issue, this study was conducted on a degraded typical steppe in Heichengzi, Inner Mongolia. This study selected four indicators: vegetation structure, leaf nutrient content, and carbon and nitrogen contents in leaves and roots. Vegetation structure reflects the recovery degree of grassland communities, leaf nutrients indicate the nutritional and growth status of plants, and the carbon and nitrogen composition in leaves and roots helps to understand the ways in which plants respond to changes after fertilization. Isotopic indicators can reflect plant carbon and nitrogen characteristics and adaptive strategies to biogas slurry addition. These indicators were used to comprehensively explore the improvement effect and mechanism of additional application of anaerobic manure on moderately degraded grassland vegetation communities, providing a theoretical basis for research on grassland ecological restoration technologies.

2. Materials and Methods

2.1. Study Area Overview

The experimental area is situated in the Heichengzi Demonstration Zone, Zhenglan Banner, Xilingol League, Inner Mongolia Autonomous Region (42°01′29″ N, 115°50′48″ E), at an average elevation of 1327 m. The climate is characterized as a temperate continental monsoon climate, featuring large temperature differences, long sunshine durations, and a distinct rainy season. The grassland type at this site is typical natural steppe, with dominant species including Leymus chinensis and Stipa krylovii. In addition to these dominant species, the study plots also contain other Poaceae, Fabaceae, and forbs, such as Agropyron michnoi, Medicago sativa, Astragalus adscendens, and Potentilla tanacetifolia [18]. The soil indicators in the test area are as follows: pH is 7.8, total carbon content is 16.90 g·kg−1, and total nitrogen content is 1.18 g·kg−1.

2.2. Experimental Design

This experiment was conducted from 2024 to 2025 in a moderately degraded typical steppe. The trial employed a randomized block design with three treatments: a water control (CK), 50% diluted biogas slurry fertilizer (BS50%), and full-strength biogas slurry fertilizer (BS100%). Each treatment comprised 9 replicates, totaling 27 plots. Each plot measured 25 m2 (5 m × 5 m), with 2 m isolation strips between adjacent plots. Fertilization occurred during the pasture regreening period in April 2024, with an application rate of 300 m3·ha−1. The application rate of 300 m3 ha−1 was chosen according to local practical fertilization regimes for biogas slurry and previous relevant studies [19,20,21], aiming to provide adequate nutrient supply for the degraded grassland while avoiding excessive nutrient input and associated environmental risks. Application was conducted via mechanical spraying. The 50% diluted biogas slurry fertilizer was prepared at a 1:1 volume ratio. To distinguish the effects of nutrient input from those of water input, the water control treatment received an equal volume of water as the biogas slurry treatment, ensuring that all treatments experienced the same hydrological input. The biogas slurry fertilizer used in the trial was sourced from Modern Dairy (Zhangjiakou, China) Co., Ltd. It was produced via anaerobic digestion of cattle manure. The basic physicochemical properties of the test biogas slurry are presented in Table 1.

2.3. Determination Items and Methods

Sample collection took place in August 2024 and August 2025. Plant samples were collected using a random sampling method, with one standard quadrat selected per plot. Within each quadrat, plant community height (VAH) and cover (VC) were measured. Subsequently, the aboveground plant parts were cut flush with the ground, brought back to the laboratory, and blanched at 105 °C for 30 min and dried at 65 °C to constant weight before determining aboveground biomass (AB). After sampling plant leaf specimens, they were placed in an insulated box and transported immediately to the laboratory. They were washed with ultrapure water, blotted dry with filter paper, and blanched at 105 °C for 30 min. Subsequently, they were dried at 65 °C until constant weight was achieved. The material was ground and sieved. It was then analyzed using a handheld laser near-infrared spectrometer to determine parameters including plant crude protein (CP), plant ether extract (EE), plant acid detergent fibers (ADFs), and plant neutral detergent fibers (NDFs) [22]. Concurrently, fresh leaves from dominant plant species within the quadrat were collected to determine plant leaf total carbon (LTC), plant leaf total nitrogen (LTN), and carbon–nitrogen stable isotopes (Lδ13C and Lδ15N). These were analyzed using an Isoprime100 stable isotope mass spectrometer coupled with a Vario Isotope Select elemental analyser (Elementar, Langenselbold, Germany) [23]. Using a soil corer, plant roots were collected from 0 to 15 cm below ground level. Surface soil and impurities adhering to the root surfaces were removed. Following washing and drying, the total root carbon (RTC), total root nitrogen (RTN), and stable carbon and nitrogen isotopes (Rδ13C and Rδ15N) in the plant roots were determined. The analytical methods employed are identical to those used for leaf samples.

2.4. Data Analysis

The collation and preliminary calculation of raw data were conducted using Microsoft Office Excel 2023. Statistical analyses were performed via SPSS 27.0 (IBM Corp., Armonk, NY, USA), which included computing the maximum, minimum, mean, and standard error for each indicator. One-way analysis of variance (ANOVA) and two-way analysis of variance, followed by Duncan’s multiple range test, were applied to assess the significance of differences in all measured indicators between individual treatment groups and the control group. Pearson correlation analysis was used to explore linear correlations among all measured indicators. Principal component analysis (PCA) and redundancy analysis (RDA) were implemented on z-standardized indicator data to identify key influencing factors. All figures and tables were generated with Origin 2022b (Origin Lab Corp., Northampton, MA, USA) and Canoco 5 (Microcomputer Power, Ithaca, NY, USA).

3. Results

3.1. Effects of Biogas Slurry Fertilizer on Various Indicators of Degraded Grassland Vegetation Communities

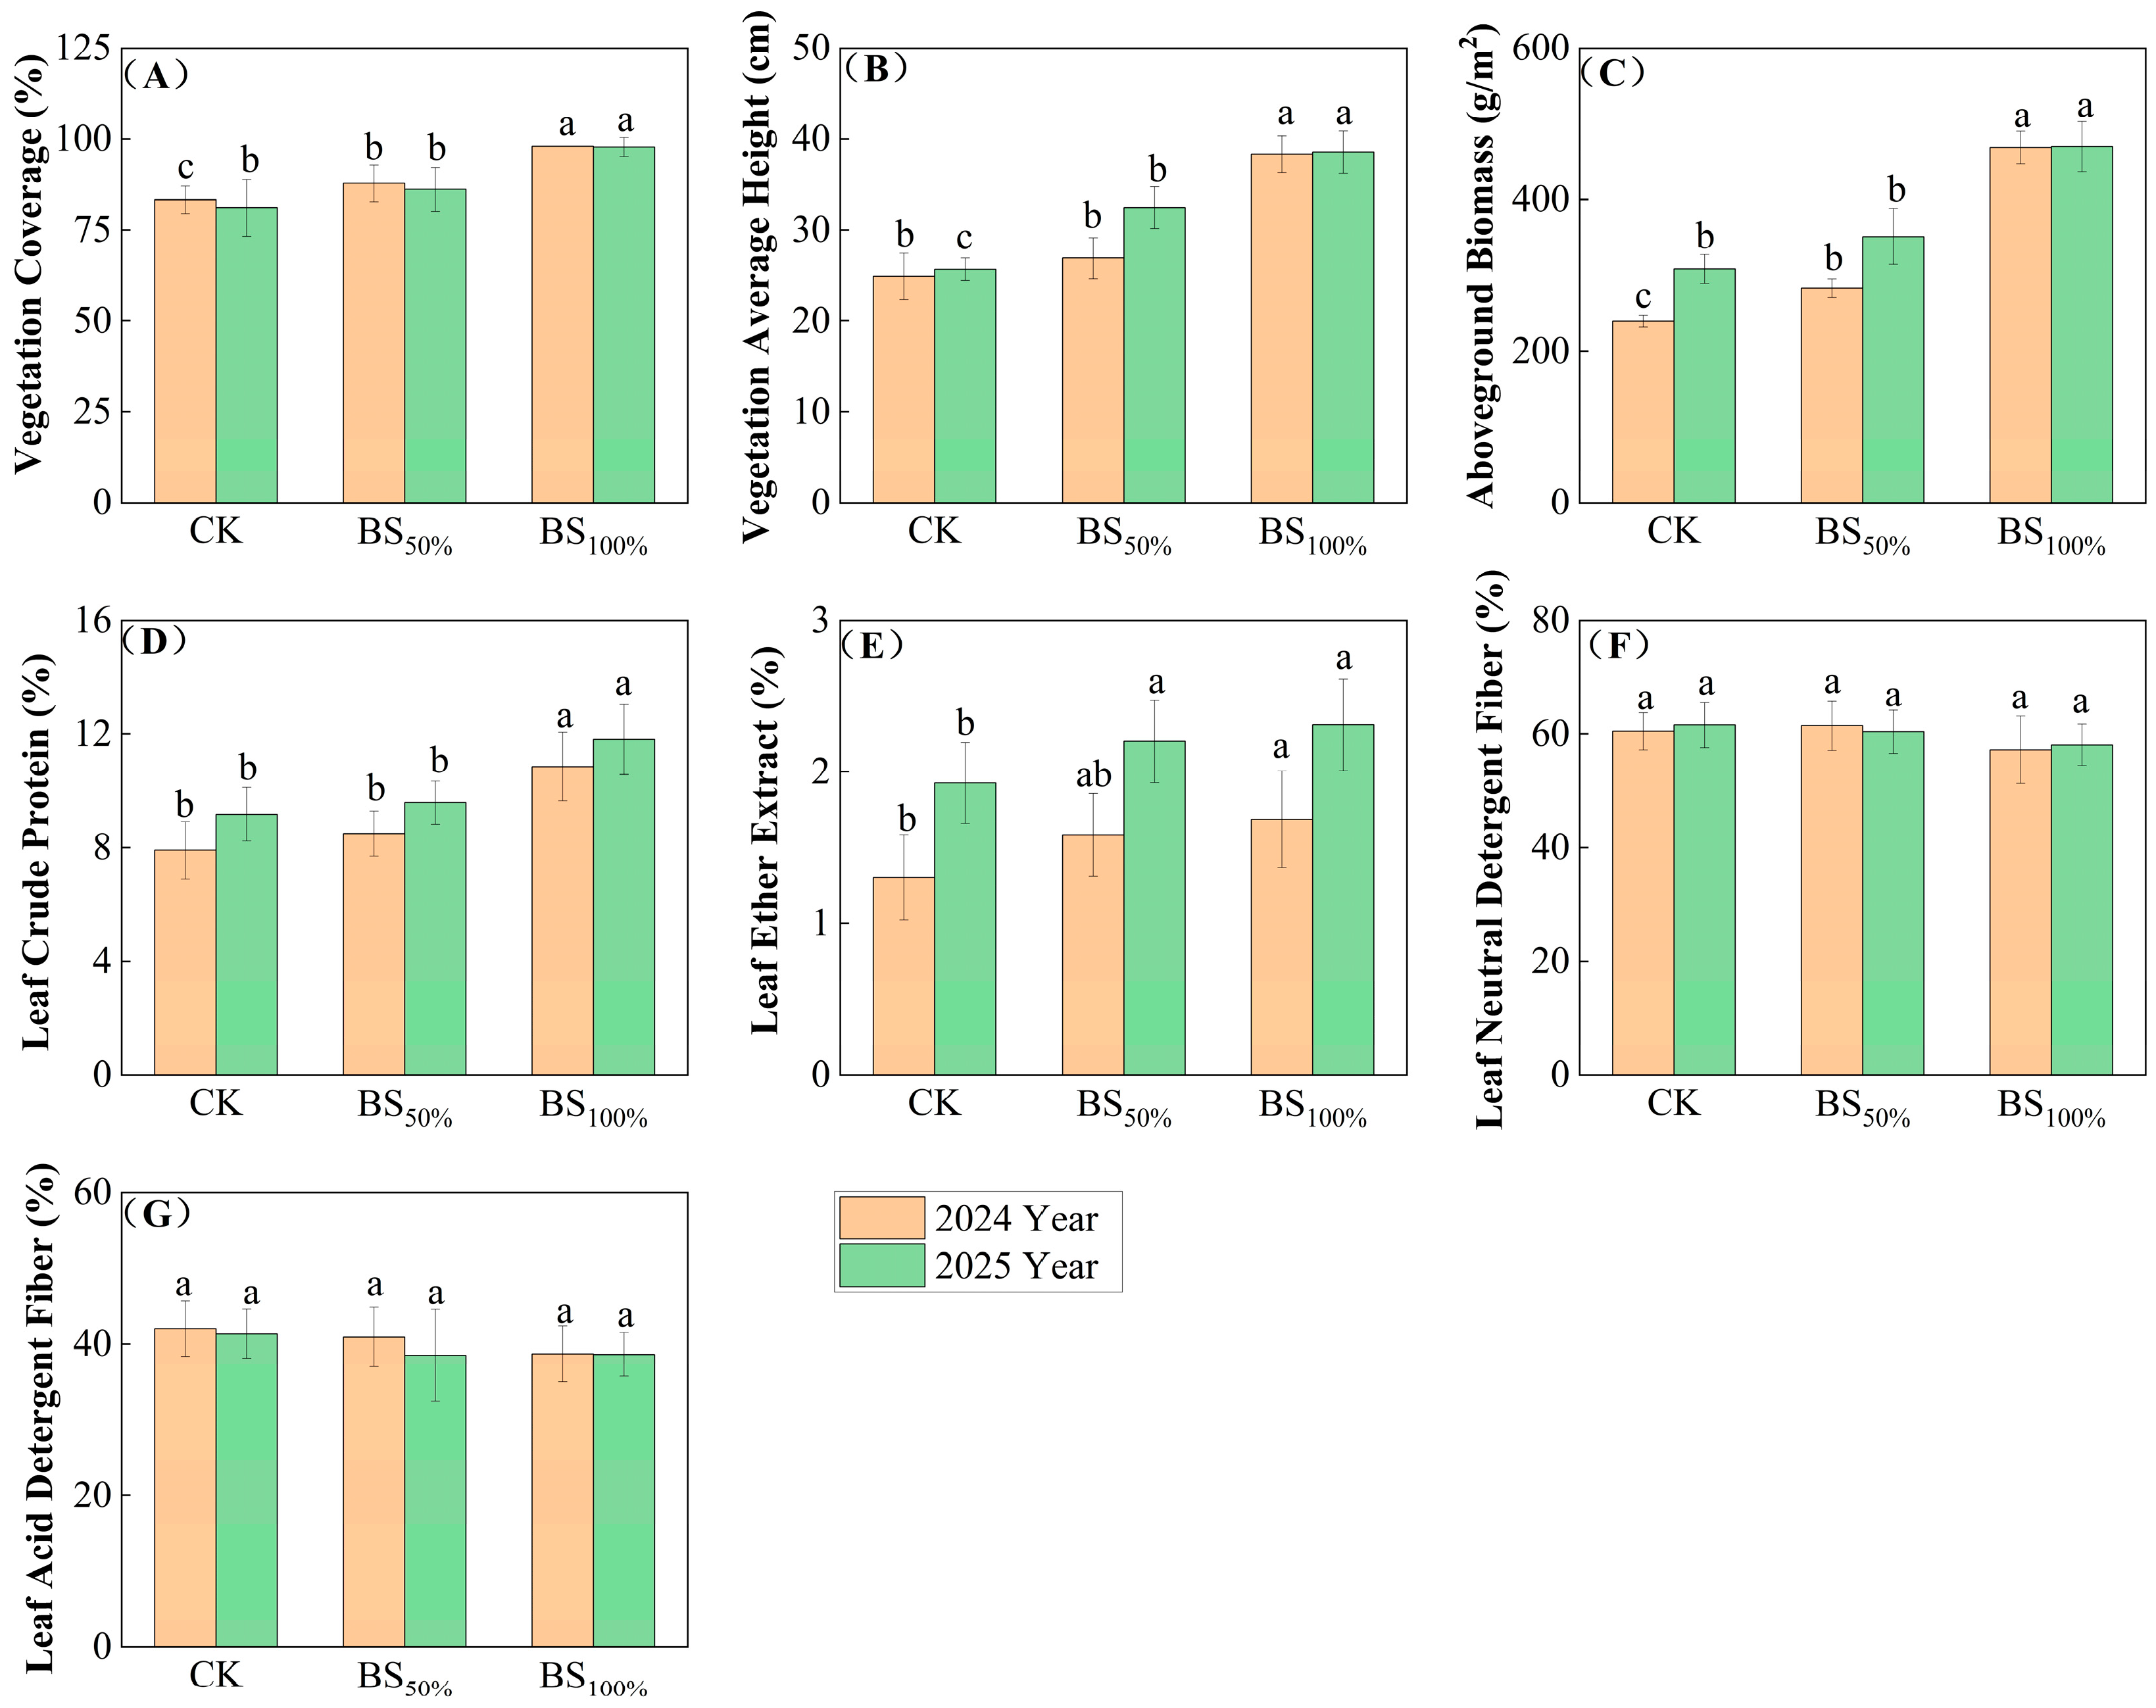
Both applications of biogas slurry (BS50% and BS100%) exerted significant effects on all measured vegetation community indicators (Figure 1). Following increased digested slurry application, VAH, VC and AB all showed significant increases (p < 0.01). In the first year, BS50% increased by 8.04%, 5.47%, and 18.40%, respectively, compared with CK, and BS100% increased by 54.02%, 17.76%, and 96.00%, respectively, compared to CK. In the second year, BS50% increased by 26.41%, 6.16%, and 13.91%, respectively, compared with CK, and BS100% increased by 50.22%, 20.55%, and 52.42%, respectively, compared to CK. Leaf nutrient responses exhibited similar trends, with both CP and EE significantly enhanced under BS100% (p < 0.01), increasing by 37.22% and 29.41%, respectively, in the first year and by 28.72% and 19.90%, respectively, in the second year. The BS50% treatment also increased CP and EE but to a lesser, non-significant extent.
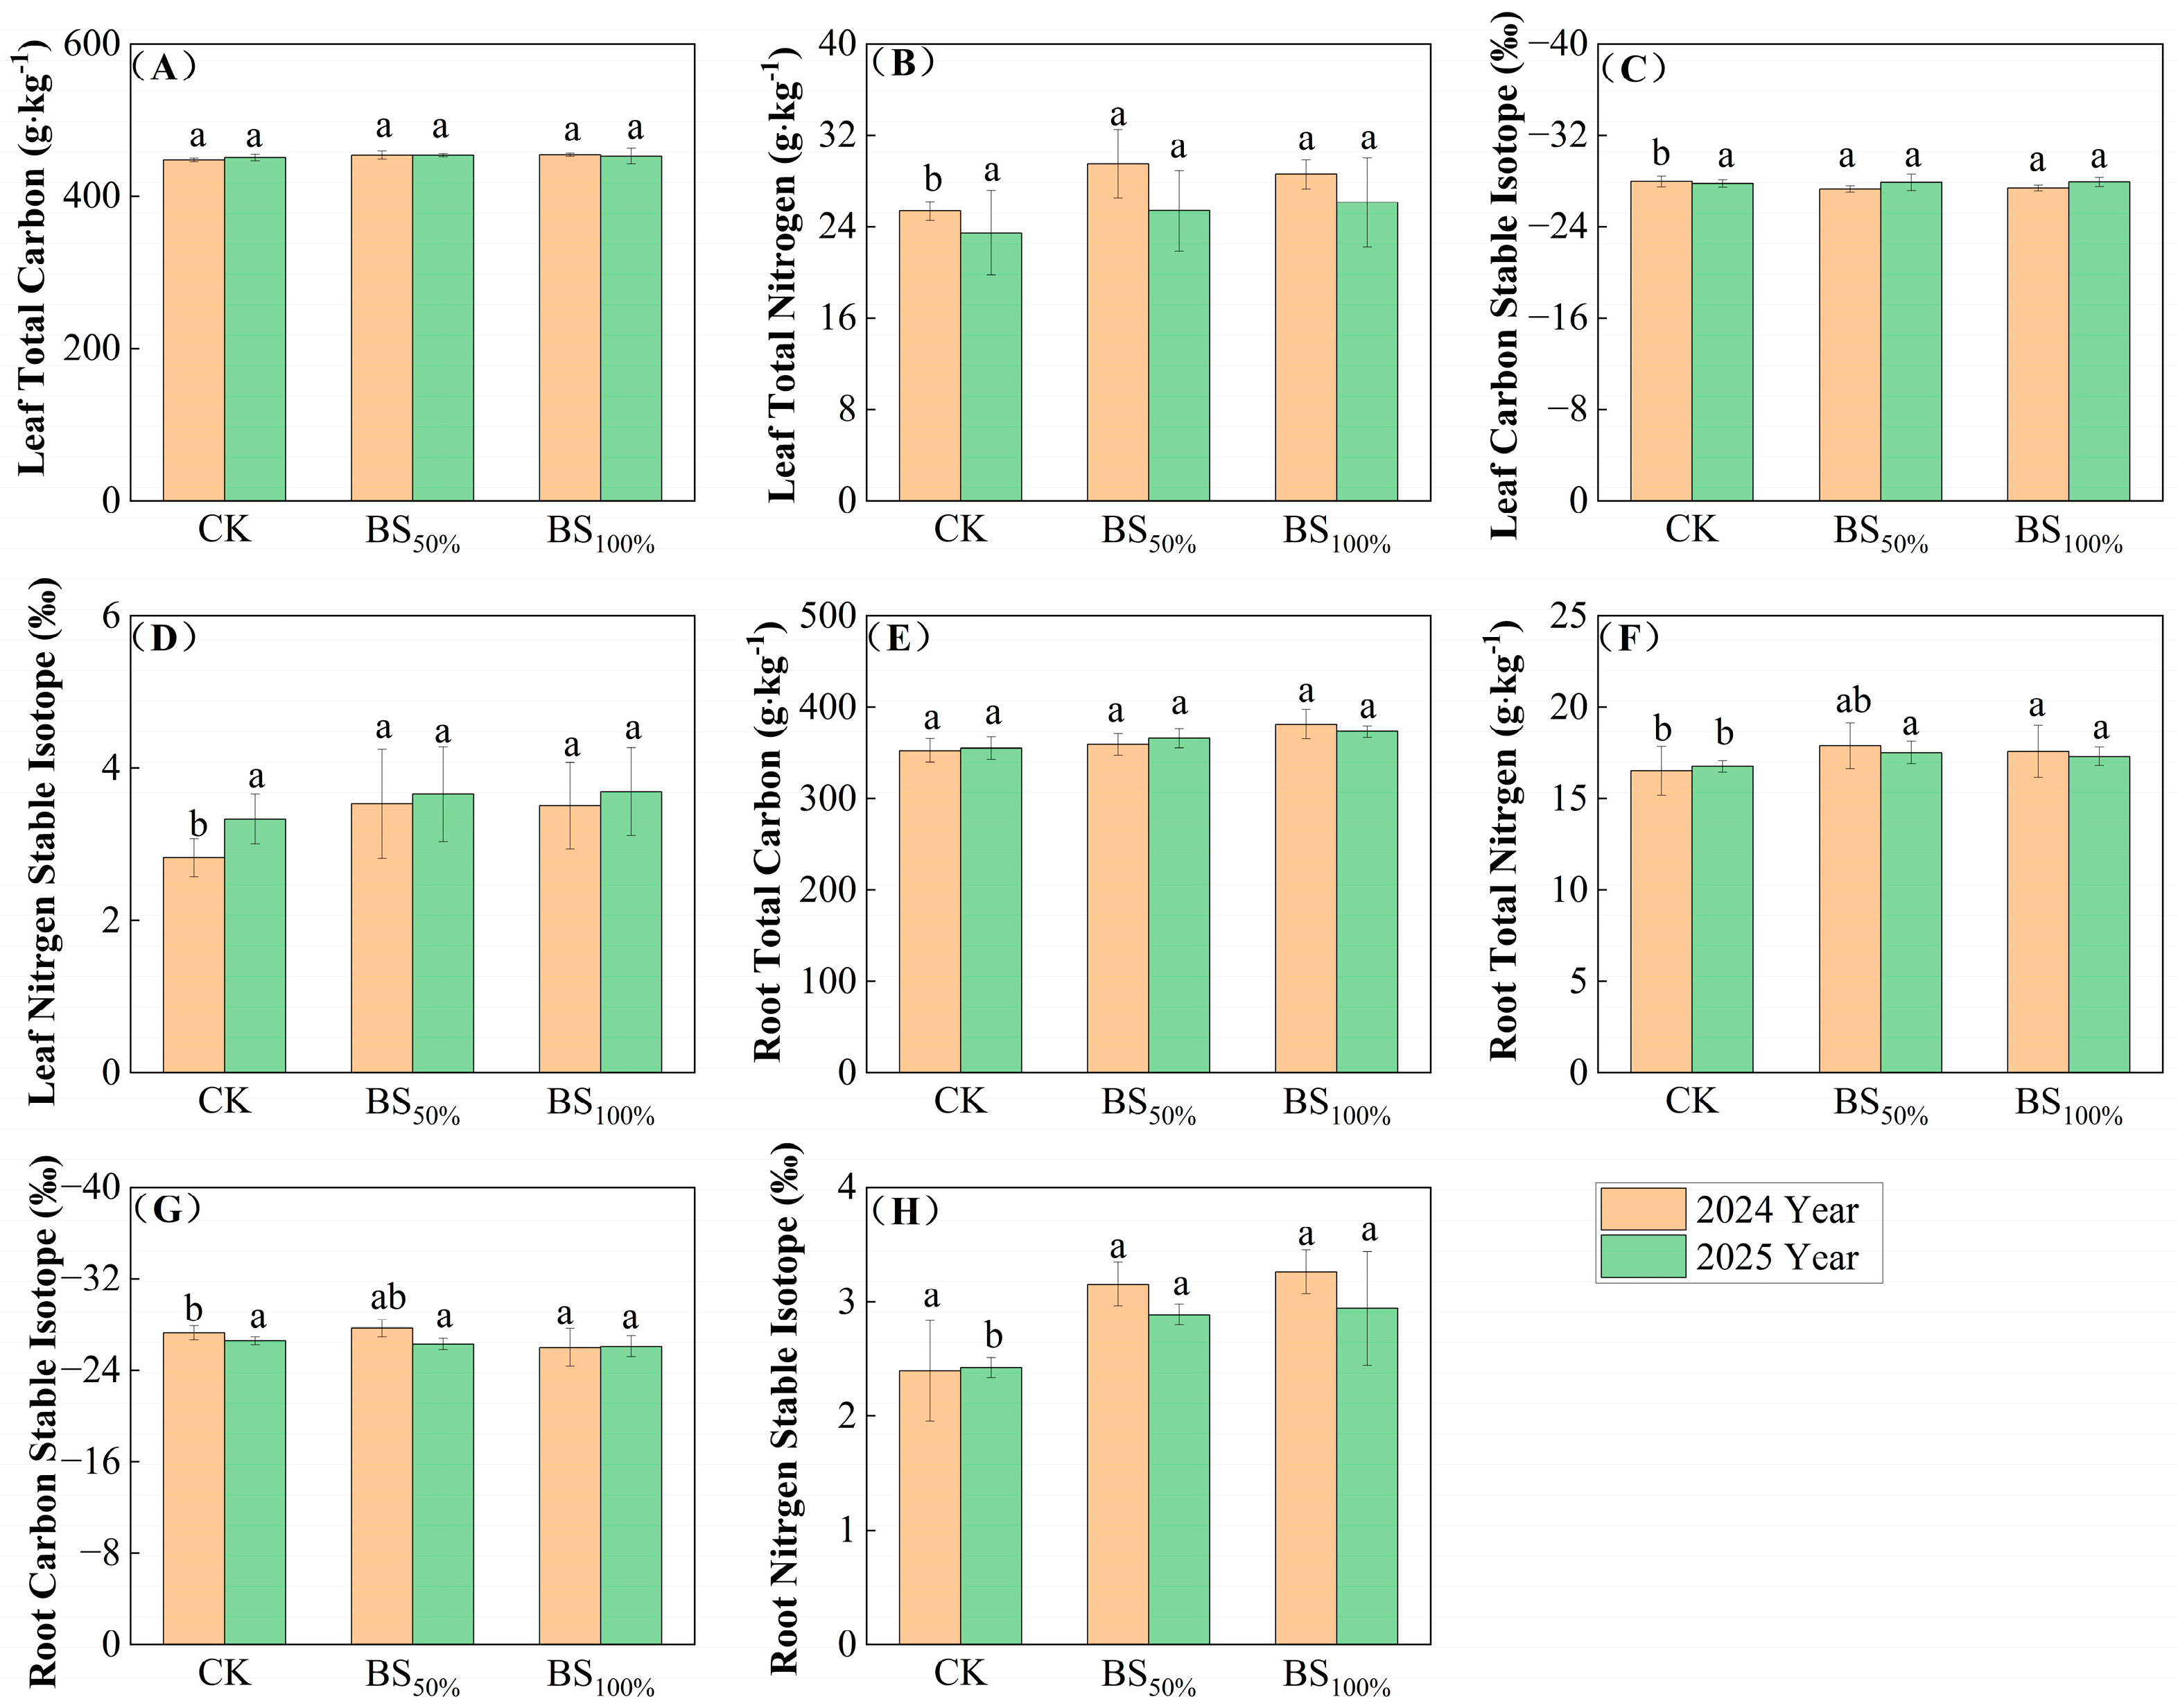
Both applications of biogas slurry significantly affected all plant biochemical indicators (Figure 2). After two years of application, LTN and Lδ15N under BS50% and BS100% were significantly higher than CK (p < 0.05). In the first year, BS50% increased by 16.29% and 25.17%, respectively, compared with CK; BS100% increased by 12.61% and 24.26%, respectively. In the second year, BS50% increased by 8.19% and 9.75%, respectively, while BS100% increased by 11.31% and 10.76%, respectively. RTC under BS50% and BS100% was also significantly higher than CK (p < 0.05). In the first year, BS50% increased by 1.90% relative to CK and BS100% by 8.19%. In the second year, BS50% increased by 3.07% and BS100% by 5.07% relative to CK. RTN, Rδ13C, and Rδ15N also increased simultaneously.
Two-way ANOVA further revealed the differential effects of biogas slurry addition (BS), sampling year (Y), and their interaction (BS*Y) on these indicators (Table A1): For VAH, the significance order was BS > Y > BS*Y (all p < 0.01), with both factors driving significant increase. For CP, the significance order was BS > Y > BS*Y (BS and Y, p < 0.001), where both factors promoted CP accumulation without a significant interaction. For EE, the significance order was Y > BS > BS*Y (Y, p < 0.001; BS, p = 0.001), indicating that time was the primary determinant of the increase in EE. For LTN, the significance order was Y > BS > BS*Y (Y, p = 0.001; BS, p = 0.005), with both factors contributing to higher leaf nitrogen content. For Lδ15N, only biogas slurry addition had a significant increasing effect (BS, p < 0.01), resulting in the BS > (Y = BS*Y). For RTN, only biogas slurry addition had a significant increasing effect (BS, p < 0.01), resulting in the BS > (BS*Y = Y)

3.2. Effects of Biogas Slurry Fertilizer on the Weighted Proportion of Plant Families and the Number of Plant Families, Genera, and Species

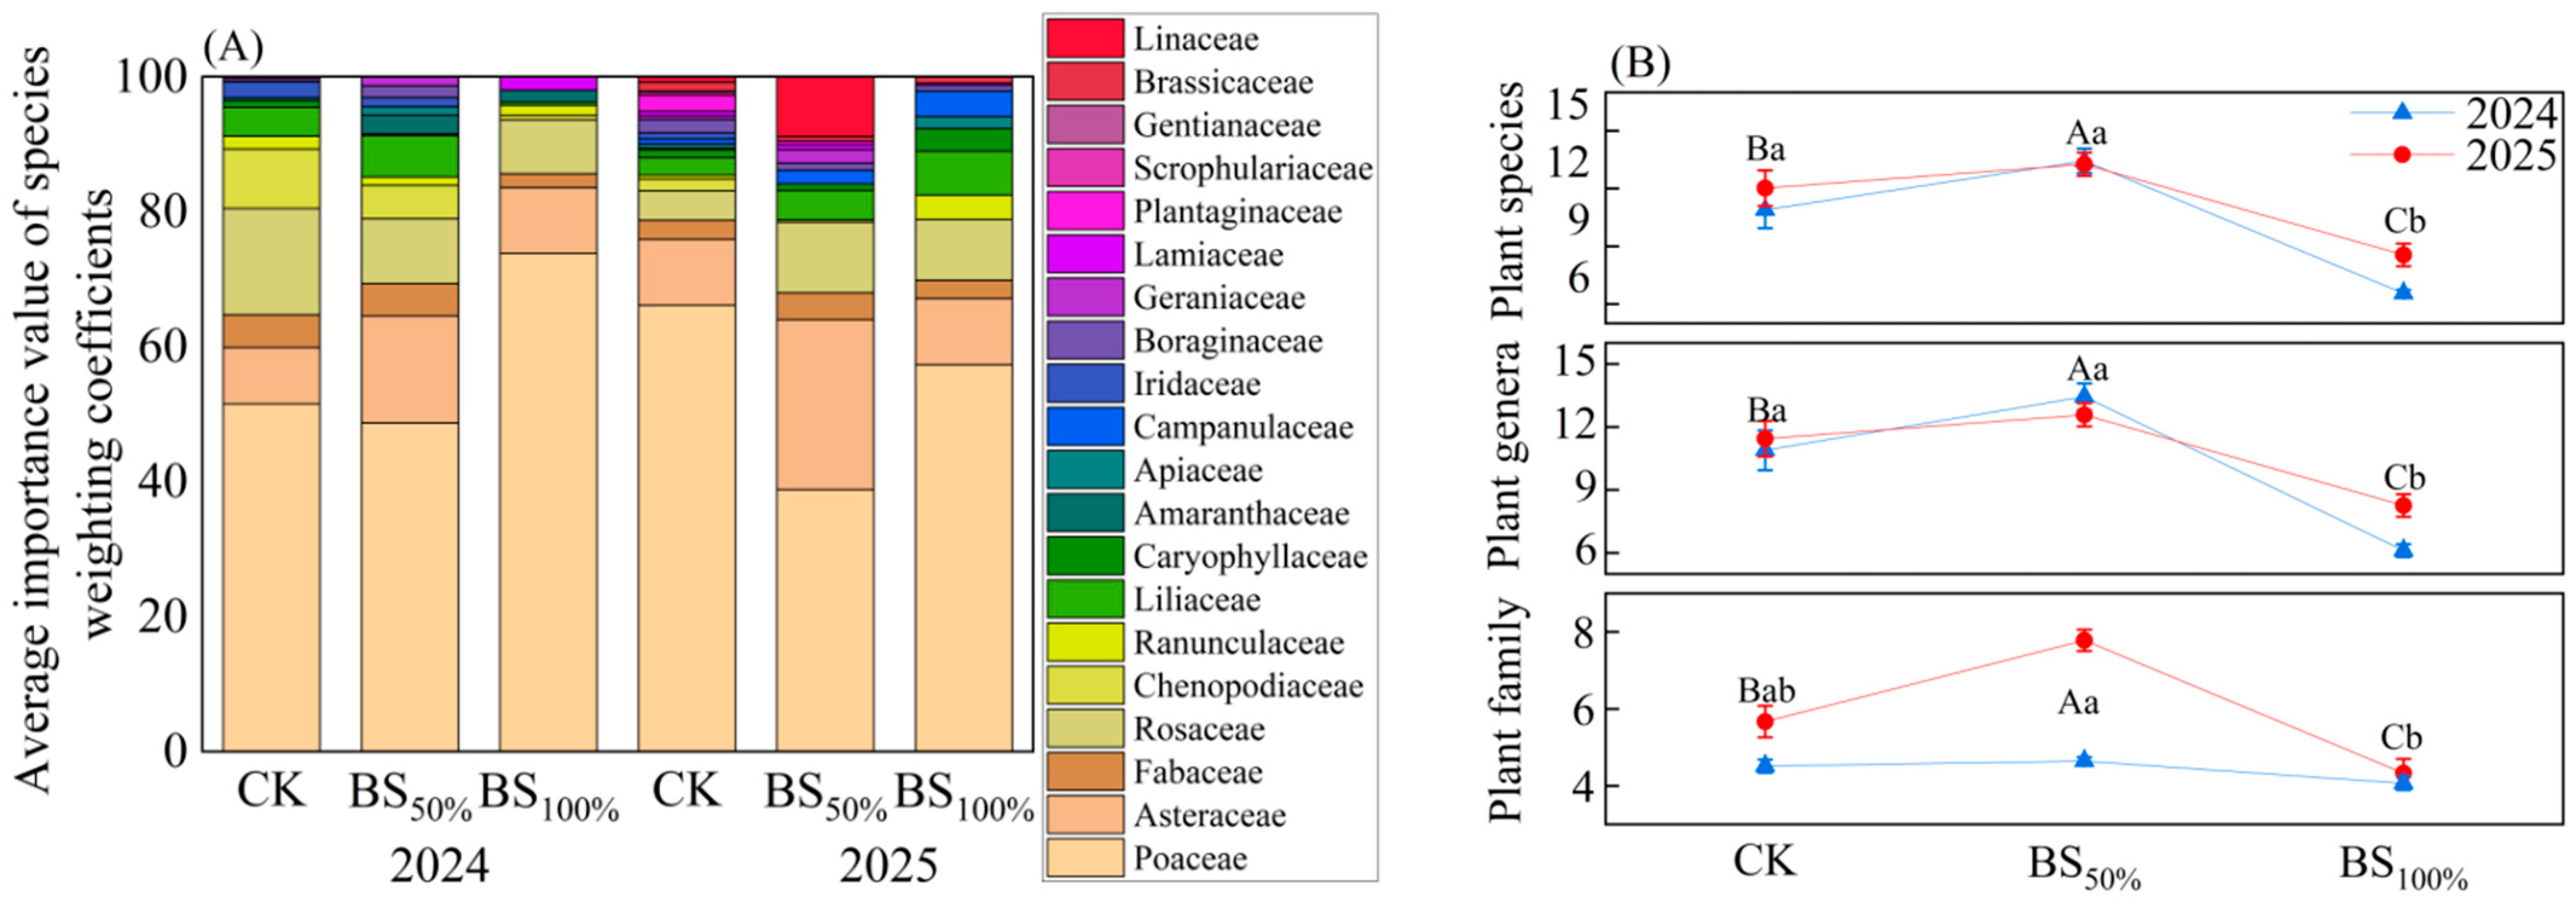
The application of additional biogas slurry fertilizer influenced plant community composition and the number of plant families, genera, and species (Figure 3). Following increased biogas slurry application, the proportion of dominant herbaceous plants increased significantly in the first year, while the proportion of associated plants correspondingly decreased. In the second year, the difference in dominant herbaceous plant proportions diminished, yet six additional plant families were recorded: Campanulaceae, Plantaginaceae, Scrophulariaceae, Gentianaceae, Brassicaceae, and Linaceae. In the first year after the additional application of biogas slurry fertilizer, the number of plant families, genera, and species increased significantly under the BS50% treatment (p < 0.05) and decreased significantly under the BS100% treatment (p < 0.05). In the second year, the number of plant genera and species showed no significant change under the BS50% treatment but still decreased significantly under the BS100% treatment (p < 0.05). Compared with 2024, overall BS50% and BS100% treatments showed an increase in plant species diversity in 2025, whereas diversity in the CK treatment decreased. As shown in Table A2, additional biogas slurry application and its interaction with time exerted a highly significant effect on Leymus chinensis (p < 0.01).

3.3. Principal Component Analysis of Biogas Slurry Fertilizer on Various Indicators of Degraded Grassland Vegetation Communities

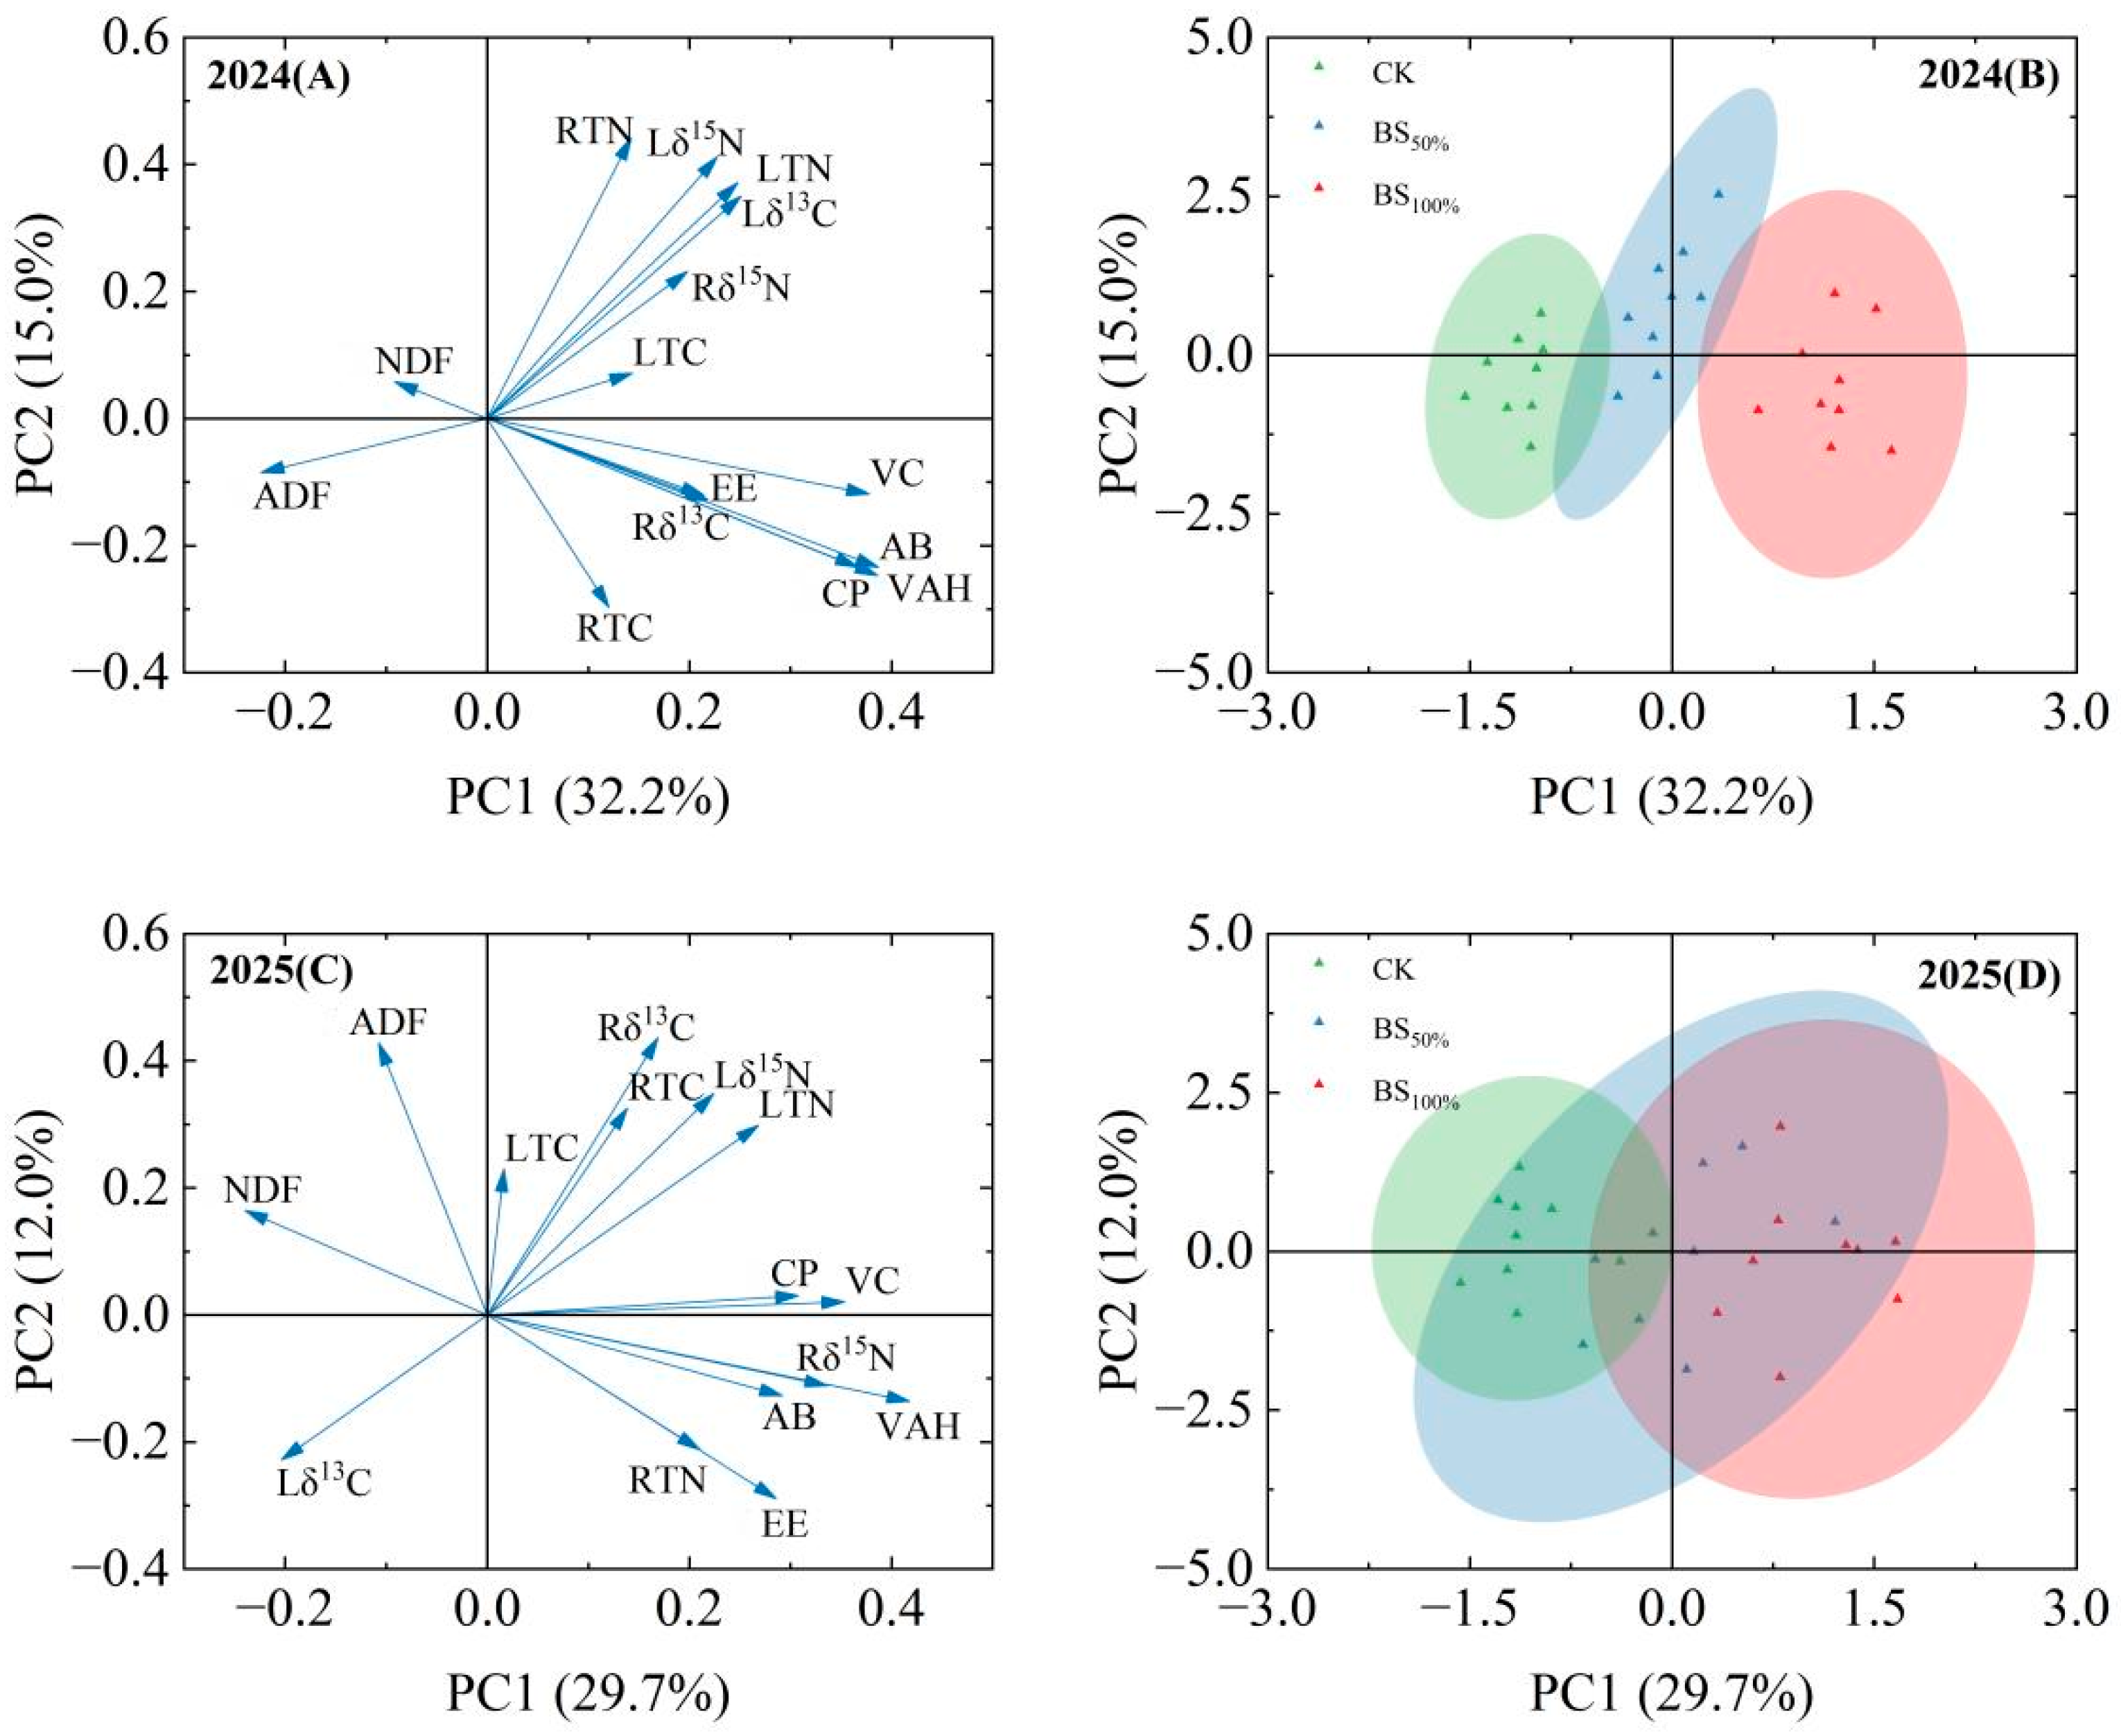
PCA was performed on the 2024 and 2025 datasets separately to clarify the response characteristics of grassland vegetation to the three treatments. The first two principal components in 2024 (PC1: 32.2%, PC2: 15.0%) collectively explained 47.2% of total variance (Figure 4A). In 2025, the cumulative contribution of the first two principal components (PC1: 20.7%, PC2: 12.0%) was 32.7% (Figure 4C). In 2024, the three treatments exhibited distinct separation along the PC1 axis: BS100% clustered on the right side of the axis, CK on the left, and BS50% positioned between them (Figure 4B). By 2025, the separation between CK and BS100% remained pronounced, yet the overlap between BS50% and CK increased (Figure 4D). This pattern indicates that in 2024, biogas slurry treatments drove clear differentiation in grassland traits, with treatment effects slightly converging in 2025. Nevertheless, the difference between BS100% and CK remained significant across both years. Core indicators such as VAH, VC, and CP exhibited strong positive loadings on the first principal component in both years, while NDF and ADF showed negative loadings. The distribution patterns of treatments and indicators remained consistent across the two years.

3.4. Redundancy Analysis of Biogas Slurry Fertilizer on Various Indicators of Degraded Grassland Vegetation Communities

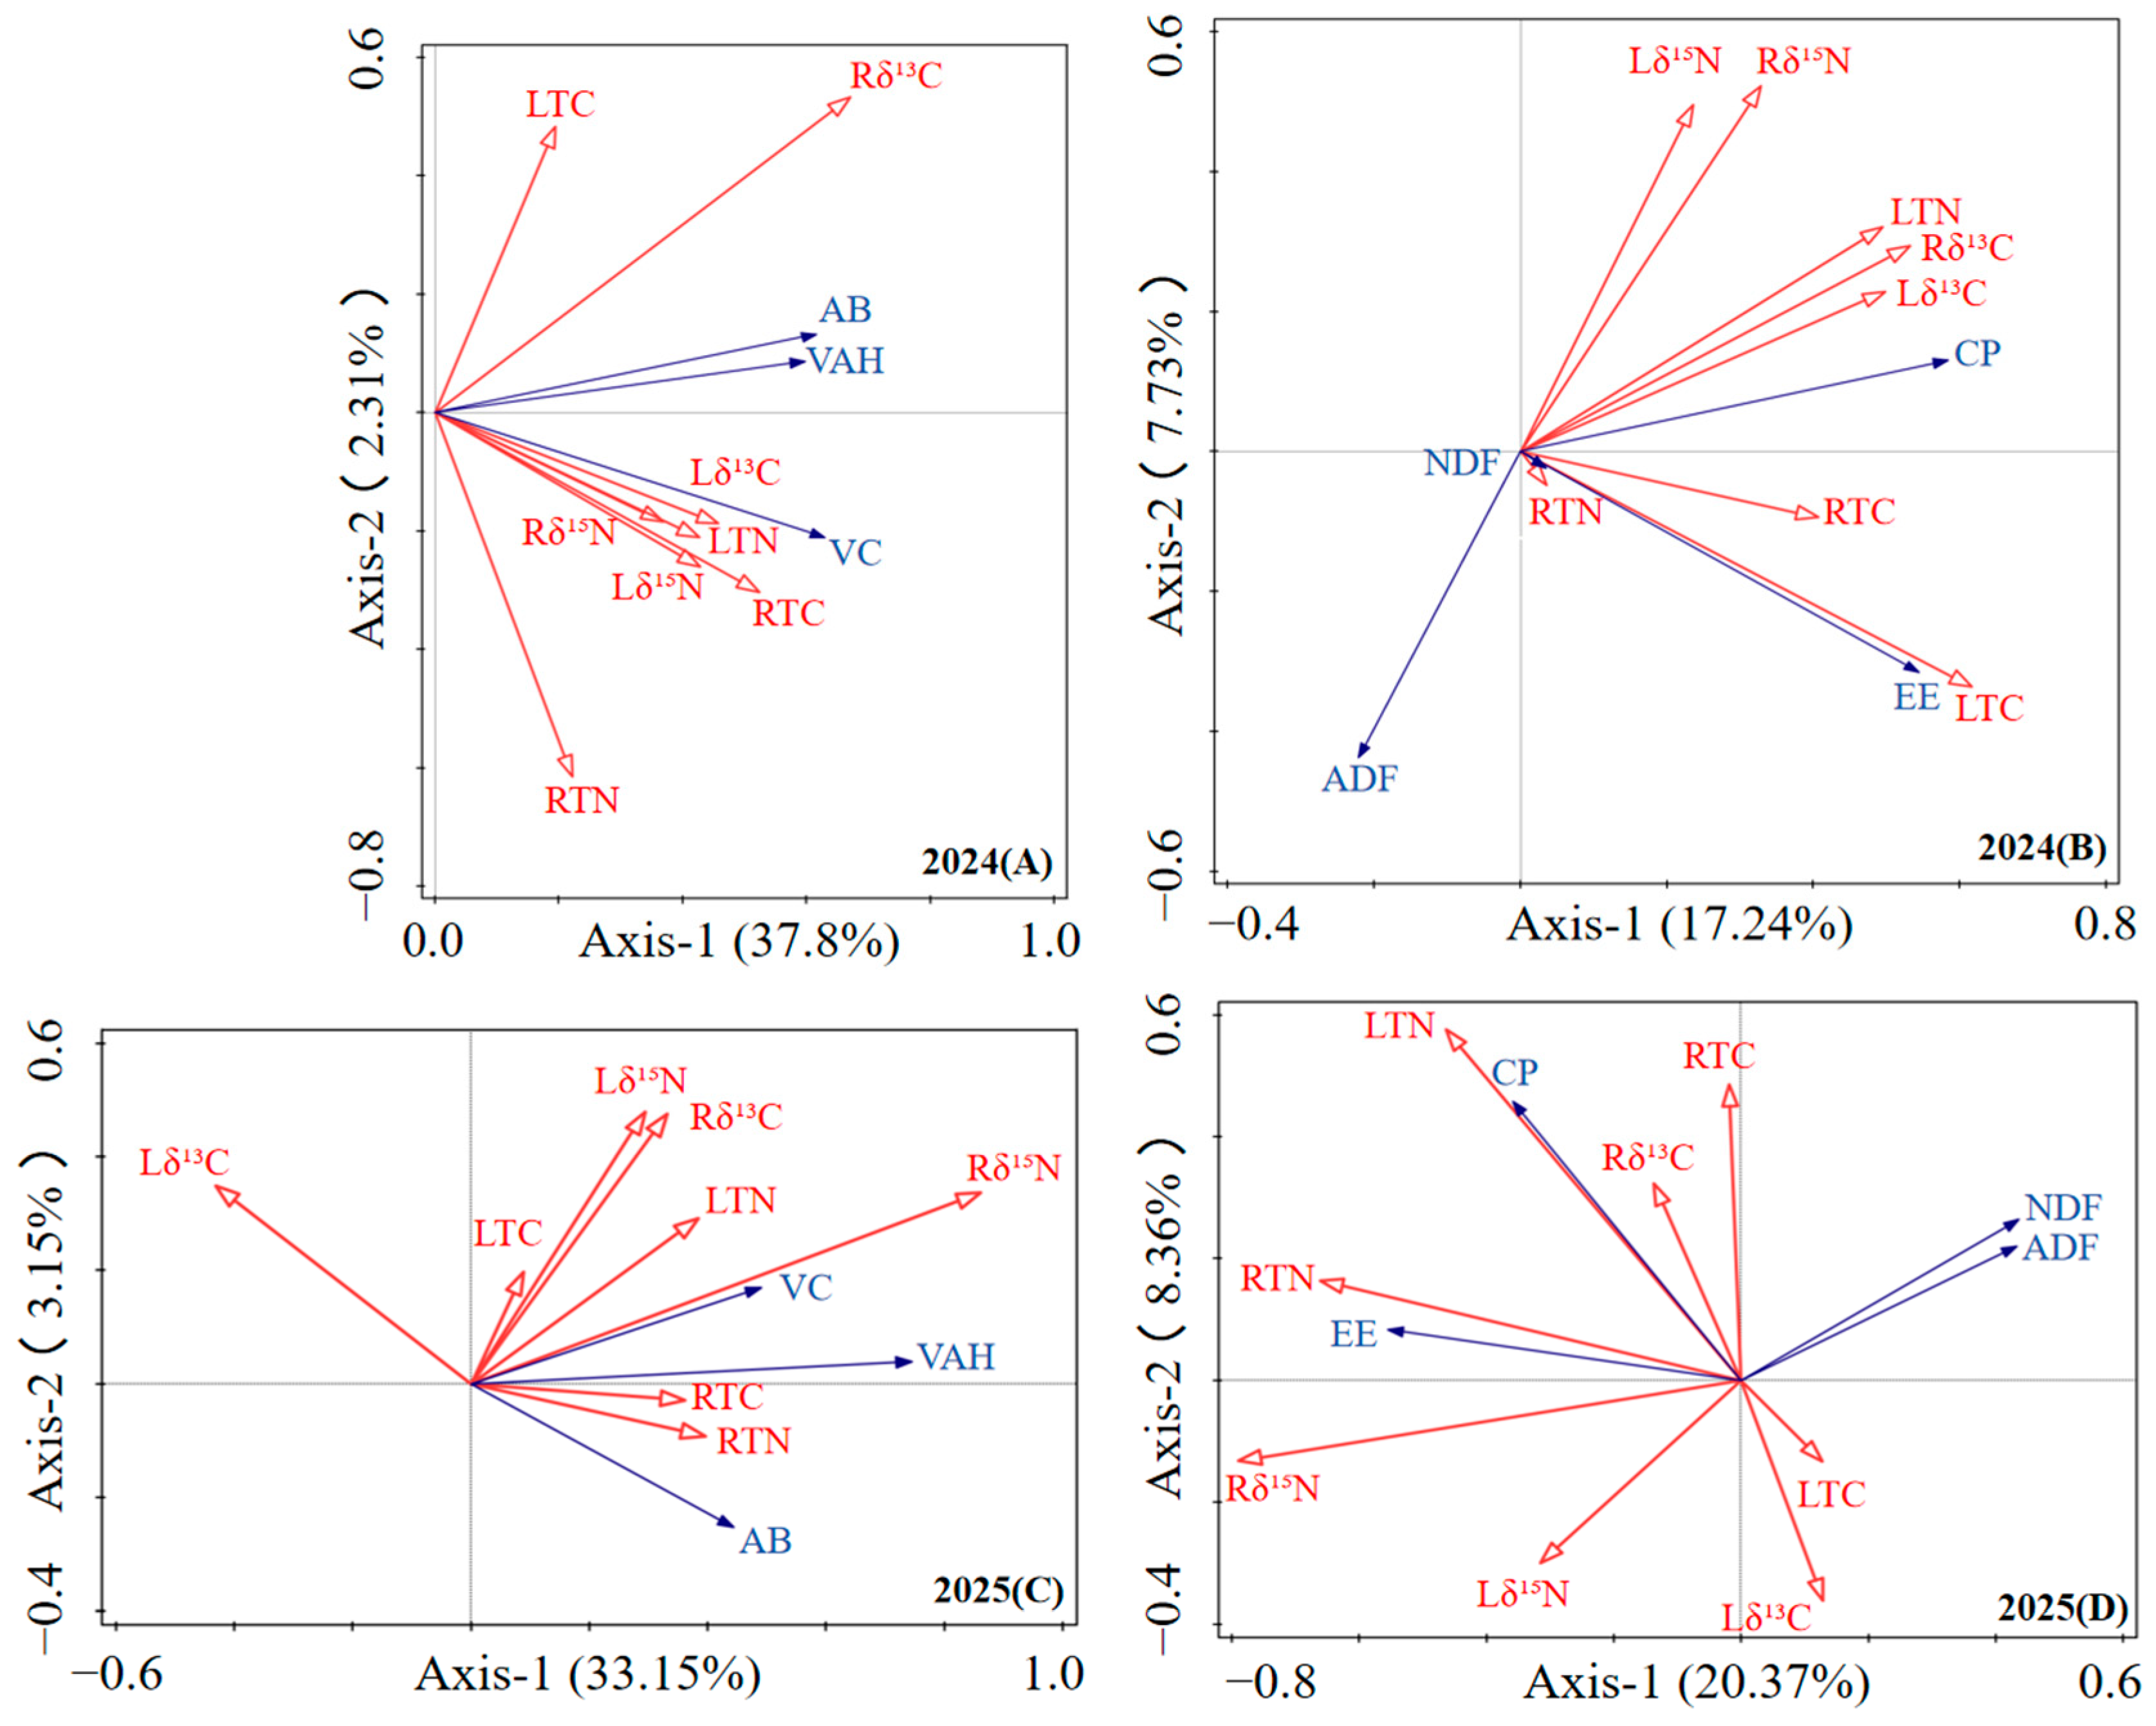
In the 2024 RDA with vegetation structure as the response variable (Figure 5A), all indicators showed positive correlations with VAH, VC, and AB. Among these, Rδ13C exerted a significant influence on vegetation structure (explained variance: 17.6%; contribution rate: 43.8%; p < 0.05). In the 2024 RDA with plant nutrition as the response variable (Figure 5B), LTC and Lδ13C showed positive correlations with CP and EE, while exhibiting negative correlations with ADF. No indicator significantly influenced plant nutrition. In the 2025 RDA with vegetation structure as the response variable (Figure 5C), all indicators except Lδ13C showed positive correlations with VAH, VC, and AB. Notably, Rδ13N exerted a significant influence on vegetation structure (explanatory power 25%, contribution rate 66.8%, p < 0.01). In the 2025 RDA with plant nutrition as the response variable (Figure 5D), LTC and Lδ13C were positively correlated with NDF and ADF, while other indicators were positively correlated with CP and EE. Notably, Rδ13N significantly influenced plant nutrition (explanatory power 13%, contribution rate 37.2%, p < 0.01).

4. Discussion

Effects of Biogas Slurry Fertilizer on Degraded Grassland Vegetation Communities and Nutritional Quality

This study confirms two years of field trials showing that biogas slurry fertilizer can improve moderately degraded grassland vegetation communities. The restoration effect followed an integrated pattern of synergistic growth in both vegetation structure and nutritional function, with Rδ13C and Rδ15N serving as key indicator factors. This aligns with research demonstrating biogas slurry fertilizer’s enhancement of grassland multifunctionality [24]. The most immediate response to increased biogas slurry application was observed in vegetation structure, with significant increases in plant VAH, VC, and AB. Species richness also increased in the second year, supporting the notion that moderate nutrient supplementation promotes productivity [25]. CP content significantly increased following biogas slurry application, while NDF and ADF showed a declining trend over the two-year period. The rise in CP aligns with findings from studies on biogas slurry fertilizer improving forage quality [21].
The results showed no significant differences in ADF, total carbon and nitrogen contents in leaves and roots, and Lδ13C between the CK group and the BS50% and BS100% treatment groups. Among these, the conclusion that there were no significant differences in carbon- and nitrogen-related indicators is consistent with the research viewpoint of Lu [26], mainly because this gradient of biogas slurry fertilizer did not exert a significant regulatory effect on the carbon and nitrogen metabolism processes of plants. Additionally, the acid detergent fiber content was not affected by the biogas slurry application, which is consistent with the research results of Yang [27]. This is because the synthesis and accumulation of plant ADF are mainly determined by genetic characteristics [28], and such structural substances have an inherently weak response to biogas slurry fertilizer.
The synergistic improvement in vegetation structure and leaf nutritional quality indicates a shift in the restoration effect from mere biomass accumulation toward systemic functional optimization [29]. This synergy arises because the input of digestate fertilizer alleviates dual constraints on water and nutrients, a process closely linked to carbon and nitrogen cycling [30]. Increased application of biogas slurry fertilizer alters plant family composition, elevating the proportion of Poaceae [31]. Species abundance showed a decline after increased application of biogas slurry fertilizer. This is consistent with the view that global change factors promote plant biomass while often reducing plant species diversity [32]. Alterations in resource availability reshape interspecific competitive dynamics, driving changes in community composition and microenvironments [33]. This establishes both the material and structural foundations for the recovery of grassland ecosystems.
PCA revealed a distinct and temporally stable pattern in grassland responses to biogas slurry application. Over the two-year study period, all three treatments exhibited separation along PC1: BS100% and CK formed distinct clusters at opposite ends, while BS50% occupied an intermediate position. This aligns with the notion that biogas slurry promotes vegetation recovery [34]. Although partial convergence occurred in the second year, the fundamental separation between the highest treatment and the control remained highly significant [7]. This separation was consistently driven by similar indicator combinations: VAH, VC, and CP were positively correlated with the BS100% treatment, while NDF and ADF were negatively correlated. This response pattern showed remarkable consistency throughout the two-year study, confirming that liquid fertilizer application induces stable and directional shifts in grassland conditions [35]. It promotes the development of traits related to productivity and forage quality without showing signs of diminishing returns [36]. This pattern indicates that biogas slurry application provides a stable and persistent stimulus for degraded grassland restoration, with its beneficial effect remaining consistent over time [37].
In grassland nutrient regulation studies, RDA is commonly used to identify key chemical indicators associated with community dynamics [38]. Over the two-year study period, Rδ13C and Rδ15N served as key diagnostic tracers, effectively differentiating vegetation community characteristics. Our RDA results showed that the overall response pattern of grassland to biogas slurry fertilizer remained relatively consistent over time, while also revealing subtle temporal variations in treatment effects. For foliar nutrients, RTC was the most strongly associated indicator in 2024, whereas Rδ15N became more influential in 2025. Treatment groups showed clearer separation along these axes in 2024 than in 2025, suggesting that ecosystem responses may gradually converge over time, although the treatment gradient remained clearly discernible [39].
This study confirms that biogas slurry application effectively alleviates nutrient deficiency in degraded grasslands, optimizes the vegetation community structure, and enhances productivity [40,41]. Although plant diversity decreased in the short term, the high productivity and greater ground coverage induced by biogas slurry improved the resistance and resilience of the vegetation community. This indicates that in severely degraded areas, prioritizing the restoration of vegetation productivity may be more critical than merely conserving diversity [42]. This intervention model centered on productivity restoration can rapidly reverse the degradation trend of degraded grasslands and lay a foundation for the subsequent positive succession of the community. The short-term reduction in diversity represents a transitional process of community structure reshaping rather than an indication of ecosystem function degradation.

5. Conclusions

Comparisons based on a two-year field experiment revealed that vegetation height, coverage, and aboveground biomass under biogas slurry application were significantly higher than those of the control group, and species richness also increased in the second year. Biogas slurry application significantly increased leaf crude fat content while significantly reducing fiber content. Biogas slurry promotes vegetation restoration by synergistically optimizing the core plant physiological processes related to carbon assimilation and nitrogen metabolism. Applying biogas slurry is an effective measure for restoring moderately degraded grasslands; its effectiveness is reflected not only in the rapid biomass increase but also in the simultaneous improvements to community structure and forage quality, thereby achieving synergistic recovery of ecosystem functions.
However, several limitations should be considered when interpreting these conclusions. A critical limitation of this study is the potential risk of plant community composition shift driven by the high nitrogen input of the single high-dose biogas slurry application. While the short-term restoration effect on vegetation biomass and coverage was significant, the high nitrogen load may favor the colonization and expansion of nitrophilous weeds in the long term, which could hinder the recovery of the native climax community and even transform the steppe into a grassland dominated by forage or weedy species rather than a naturally restored ecosystem. This limitation reflects the trade-off between rapid short-term vegetation restoration via intensive organic amendment and the long-term ecological goal of restoring native steppe community structure, and it also points out the key ecological constraint for the application of high-dose nitrogen-rich organic fertilizers in degraded grassland restoration. The two-year dataset only clearly demonstrates the short-term effects of biogas slurry addition but is insufficient to assess its long-term impacts. Whether the synergistic enhancement of vegetation can persist or whether the community structure can reach a stable state remains unclear.
Future research can progress in the following directions: (1) long-term field observation to verify restoration stability, monitor community succession, and assess risks from nitrophilous species for native steppe recovery; (2) incorporating soil properties and microbial indicators to analyze the impact of biogas slurry on soil environments; (3) monitoring heavy metal accumulation and migration in soil under long-term biogas slurry application to assess potential environmental risks; (4) testing this method across different types of degraded grasslands to improve the applicability of the technology.

Author Contributions

Y.L., formal analysis, investigation, data curation, writing—original draft, and visualization; Y.M., investigation; Q.Y., investigation and data curation; A.W., conceptualization and formal analysis; C.Z., investigation; C.W., supervision, project administration, and funding acquisition. All authors have read and agreed to the published version of the manuscript.

Funding

This work was financially supported by Inner Mongolia Agricultural University’s first-class discipline construction project (YLXKZX-NND-029) and the Sino-Germany Cooperation Project for Revitalization Inner Mongolia through Science and Technology (2021CG0020).

Institutional Review Board Statement

Not applicable.

Informed Consent Statement

Not applicable.

Data Availability Statement

The data presented in this study are available from the first author upon request.

Acknowledgments

Sincere gratitude is extended to Chengjie Wang for his comprehensive guidance and support and to Andreas Wilkes, Yueqi Ma, Qunjia Yu, and Chunlei Zhu for their assistance. All individuals acknowledged herein have consented to their inclusion. During the preparation of this manuscript, the authors used DeepL.com (free version) for translation and DeepSeek (https://chat.deepseek.com/) for text polishing. The authors have reviewed and edited the output and take full responsibility for the content of this publication.

Conflicts of Interest

Author Andreas Wilkes was employed by the company Values for Development Limited. The remaining authors declare that the research was conducted in the absence of any commercial or financial relationships that could be construed as a potential conflict of interest.

Abbreviations

The following abbreviations are used in this manuscript:
CKControl
BD50%50% diluted biogas slurry fertilizer
BS100%Full-strength biogas slurry fertilizer
VAHVegetation average height
VCVegetation coverage
ABAboveground biomass
CPCrude protein
EEEther extract
NDFNeutral detergent fiber
ADFAcid detergent fiber
LTCLeaf total carbon
LTNLeaf total nitrogen
13CLeaf carbon stable isotope
15NLeaf nitrogen stable isotope
RTCRoot total carbon
RTNRoot total nitrogen
13CRoot carbon stable isotope
15NRoot nitrogen stable isotope

Appendix A

Table A1. Effects of additional application of biogas slurry fertilizer, timing, and their interaction on various vegetation indicators.
(a)
ItemsdfVAHVCABCPEENDFADF
F-Valuep-ValueF-Valuep-ValueF-Valuep-ValueF-Valuep-ValueF-Valuep-ValueF-Valuep-ValueF-Valuep-Value
BS2176.335<0.00148.621<0.00136.477<0.00139.122<0.0018.5940.0013.6860.0322.5890.086
Y114.050<0.0010.9980.3235.5510.02316.195<0.00163.417<0.0010.0680.7950.9190.343
BS*Y28.4320.0010.1820.8341.3070.2800.1060.9000.0010.9990.3610.6990.4080.667
R2 0.8770.6380.5900.6280.5880.0560.035
(b)
ItemsdfLTCLTN13C15NRTCRTN13C15N
F-Valuep-ValueF-Valuep-ValueF-Valuep-ValueF-Valuep-ValueF-Valuep-ValueF-Valuep-ValueF-Valuep-ValueF-Valuep-Value
BS21.6270.2076.0510.0051.9820.1495.6080.0061.9310.1565.4120.0084.2040.0216.0040.005
Y10.0380.84614.1860.0016.8570.0123.5530.0660.0020.9620.2360.6291.7190.1961.0800.304
BS*Y20.3910.6780.6790.5124.1480.0220.6790.5120.2080.8130.4920.6140.8060.4530.3720.691
R2 0.0180.2800.2100.1740.0140.1170.1130.143
Table A2. Effects of additional application of biogas slurry fertilizer, timing, and their interaction on species mean importance values.
ItemsdfLeymus chinensisStipa kryloviiArtemisia frigidaPotentilla tanacetifoliaPotentilla bifurca var. majorMelilotoides ruthenicaAllium mongolicum
F-Valuep-ValueF-Valuep-ValueF-Valuep-ValueF-Valuep-ValueF-Valuep-ValueF-Valuep-ValueF-Valuep-Value
BS221.680 <0.0011.9550.1631.2450.3121.5230.2341.1180.3470.7870.4661.090 0.349
Y16.4670.0165.4540.0280.6520.430 1.4920.2319.9720.0052.7270.1110.3530.557
BS*Y29.2840.0010.1290.880 0.5160.6051.1130.3415.1960.0151.7770.190 1.1960.316
R2 0.6810.1570.1450.0490.4910.1920.067
Note: BS, different treatments; Y, year; BS*Y, interaction between different treatments and year; R2, linear mixed model index; VAH, vegetation average height; VC, vegetation coverage; AB, aboveground biomass; CP, crude protein; EE, ether extract; NDF, neutral detergent fiber; ADF, acid detergent fiber; LTC, leaf total carbon; LTN, leaf total nitrogen; Lδ13C, leaf carbon stable isotope; Lδ15N, leaf nitrogen stable isotope; RTC, root total carbon; RTN, root total nitrogen; Rδ13C, root carbon stable isotope; Rδ15N, root nitrogen stable isotope. The same below.
Table A3. Eigenvalues and variance explained in principal component analysis of plant chemical properties in 2024.
Principal Component NumberEigenvaluePercentage of Variance/%Cumulative Percentage of Variance/%
14.82932.19132.191
22.25415.02447.215
31.59210.61057.825
41.4149.42867.253
51.2008.00275.256
60.9206.13481.390
70.8205.46586.855
80.5753.83190.686
90.3642.42693.112
100.3272.17795.289
110.2461.63996.928
120.1721.14898.077
130.1410.94399.020
140.1010.67599.695
150.0460.305100.000
Table A4. Eigenvalues and variance explained in principal component analysis of plant chemical properties in 2025.
Principal Component NumberEigenvaluePercentage of Variance/%Cumulative Percentage of Variance/%
14.45829.72029.720
21.79711.98341.703
31.58010.53252.235
41.50510.03262.267
51.2388.25170.519
60.9156.09976.617
70.7515.00881.625
80.7134.75286.377
90.5143.42689.804
100.4633.08492.888
110.3612.40995.297
120.2931.95497.251
130.2261.50598.757
140.1531.01799.774
150.0340.226100.000
Table A5. Contribution of various plant chemical indicators to vegetation characteristics in 2024.
Factors13CRTC15NLTNRTN15NLTC13C
Explains (%)17.612.66.41.70.90.70.3<0.1
Contribution (%)43.831.215.84.32.21.80.90.2
F-value5.44.32.30.60.30.20.1<0.1
p-value0.0100.0360.1340.4840.7300.7920.9280.988
Table A6. Contribution of various plant chemical indicators to leaf nutrients in 2024.
FactorsLTC13CRTC13C15NRTNLTN15N
Explains (%)7.66.353.93.632.21.1
Contribution (%)23.319.415.31210.99.26.73.3
F-value2.11.81.41.110.90.60.3
p-value0.0780.1340.2200.3760.3620.4740.5780.876
Table A7. Contribution of various plant chemical indicators to vegetation characteristics in 2025.
Factors15NRTC13C15NLTNRTN13CLTC
Explains (%)253.43.52.51.20.90.60.4
Contribution (%)66.89.19.36.63.22.51.61
F-value8.31.11.20.80.40.30.20.1
p-value0.0040.2900.2660.4580.7060.7420.8980.952
Table A8. Contribution of various plant chemical indicators to leaf nutrients in 2025.
Factors15NRTNLTN15N13C13CRTCLTC
Explains (%)136.253.332.21.80.5
Contribution (%)37.217.614.29.68.56.45.11.5
F-value3.71.81.510.90.70.50.1
p-value0.0080.1320.230.4040.4660.6440.7520.960

References

  1. Bardgett, R.D.; Bullock, J.M.; Lavorel, S.; Manning, P.; Schaffner, U.; Ostle, N.; Chomel, M.; Durigan, G.; Fry, E.L.; Johnson, D.; et al. Combatting global grassland degradation. Nat. Rev. Earth Environ. 2021, 2, 720–735. [Google Scholar] [CrossRef] [Scilit]
  2. Jian, X.Y.; Li, L.; Wang, Z.X.; Ai, L.H.; Cheng, W.R.; Li, X. Effects of landscape edge heterogeneity on biodiversity in grassland restoration context. J. Environ. Manag. 2025, 376, 124508. [Google Scholar] [CrossRef] [Scilit]
  3. Carrascosa, A.; Moreno, G.; Rodrigo, S.; Rolo, V. Unravelling the contribution of soil, climate and management to the productivity of ecologically intensified Mediterranean wood pastures. Sci. Total Environ. 2024, 957, 177575. [Google Scholar] [CrossRef] [Scilit]
  4. Villa-Galaviz, E.; Smart, S.M.; Ward, S.E.; Fraser, M.D.; Memmott, J. Fertilization using manure minimizes the trade-offs between biodiversity and forage production in agri-environment scheme grasslands. PLoS ONE 2023, 18, e0290843. [Google Scholar] [CrossRef] [Scilit]
  5. Anas, M.; Liao, F.; Verma, K.K.; Sarwar, M.A.; Mahmood, A.; Chen, Z.L.; Li, Q.; Zeng, X.P.; Liu, Y.; Li, Y.R. Fate of nitrogen in agriculture and environment: Agronomic, eco-physiological and molecular approaches to improve nitrogen use efficiency. Biol. Res. 2020, 53, 47. [Google Scholar] [CrossRef] [Scilit] [PubMed]
  6. Mukhtiar, A.; Mahmood, A.; Zia, M.A.; Ameen, M.; Dong, R.; Shoujun, Y.; Javaid, M.M.; Khan, B.A.; Nadeem, M.A. Role of biogas slurry to reclaim soil properties providing an eco-friendly approach for crop productivity. Bioresour. Technol. Rep. 2024, 25, 101716. [Google Scholar] [CrossRef] [Scilit]
  7. Ren, T.T.; Yu, X.Y.; Liao, J.H.; Du, Y.N.; Zhu, Y.J.; Jin, L.; Wang, B.T.; Xu, H.M.; Xiao, W.Y.; Chen, H.Y.H.; et al. Application of biogas slurry rather than biochar increases soil microbial functional gene signal intensity and diversity in a poplar plantation. Soil Biol. Biochem. 2020, 146, 107825. [Google Scholar] [CrossRef] [Scilit]
  8. Liu, B.Y.; Wang, Y.P.; Yao, Z.F.; Yang, G.R.; Xu, X.N.; Deng, Y.S.; Huang, Y.H. Risk assessment and safe consumption analysis of heavy metals under different planting patterns of biogas slurry. Ecol. Environ. Sci. 2023, 32, 1507–1515. [Google Scholar]
  9. Javeed, H.M.R.; Ali, M.; Ahmed, I.; Wang, X.K.; Al-Ashkar, I.; Qamar, R.; Ibrahim, A.; Habib-Ur-Rahman, M.; Ditta, A.; El Sabagh, A. Biochar enriched with buffalo slurry improved soil nitrogen and carbon dynamics, nutrient uptake and growth attributes of wheat by reducing leaching losses of nutrients. Land 2021, 10, 1392. [Google Scholar] [CrossRef] [Scilit]
  10. Eickenscheidt, T.; Freibauer, A.; Heinichen, J.; Augustin, J.; Drösler, M. Short-term effects of biogas digestate and cattle slurry application on greenhouse gas emissions affected by N availability from grasslands on drained fen peatlands and associated organic soils. Biogeosciences 2014, 11, 6187–6207. [Google Scholar] [CrossRef] [Scilit]
  11. Sorecha, E.M.; Ruan, R.J.; Yuan, Y.; Wang, Y.S. Substitution of Biogas Slurry for Chemical Fertilizer Improves Nitrogen Use Efficiency of Wheat by Decreasing Leaf Nitrogen Concentration and Increasing Leaf C/N Stoichiometry. J. Soil Sci. Plant Nutr. 2025, 25, 4767–4779. [Google Scholar] [CrossRef] [Scilit]
  12. Gong, X.L.; Li, J.Y.; Li, J.Z.; Ran, C.; Zhou, L.L.; Zhou, T.; Su, H.H.; Lu, T.T.; Zhang, S.L. Post-transcriptional regulation dominates protein biosynthesis in Landoltia punctata under biogas slurry stress. Front. Plant Sci. 2025, 16, 1694864. [Google Scholar] [CrossRef] [Scilit]
  13. Liu, C.T.; Nie, X.Y.; Wang, Z.K.; Yang, H.; Wang, J.; Zhang, H.S.; Fan, Y.Z.; He, L.L.; El-Badri, A.M.; Batool, M.; et al. Biogas slurry: A potential substance that synergistically enhances rapeseed yield and lodging resistance. Ind. Crops Prod. 2024, 222, 119643. [Google Scholar] [CrossRef] [Scilit]
  14. Tang, Y.F.; Luo, L.M.; Carswell, A.; Misselbrook, T.; Shen, J.H.; Han, J.G. Changes in soil organic carbon status and microbial community structure following biogas slurry application in a wheat-rice rotation. Sci. Total Environ. 2021, 757, 143786. [Google Scholar] [CrossRef] [Scilit]
  15. Tang, Y.F.; Wen, G.L.; Li, P.P.; Dai, C.; Han, J.G. Effects of biogas slurry application on crop production and soil properties in a rice–wheat rotation on coastal reclaimed farmland. Water Air Soil Pollut. 2019, 230, 51. [Google Scholar] [CrossRef] [Scilit]
  16. Xu, P.Z.; Huang, J.C.; Peng, Z.P.; Yu, J.H.; Lin, Z.J.; Yang, L.X.; Wu, X.N. Effects of slurry on yield, quality and nutrition absorption of Chinese cabbage. Guangdong Agric. Sci. 2014, 41, 71–73. [Google Scholar]
  17. Ferdous, Z.; Ullah, H.; Datta, A.; Attia, A.; Rakshit, A.; Molla, S.H. Application of biogas slurry in combination with chemical fertilizer enhances grain yield and profitability of maize (Zea Mays L.). Commun. Soil Sci. Plant Anal. 2020, 51, 2501–2510. [Google Scholar] [CrossRef] [Scilit]
  18. Li, Y.H.; Yu, Q.J.; Zhu, C.L.; Ma, Y.Q.; Zheng, B.F.; Zhang, L.; Wang, C.J. Short-Term Effects of Additional Application of Biogas Slurry Fertilizer on the Physicochemical Properties of Moderately Degraded Grassland Soils. Acta Agrestia Sin. 2026; in press.
  19. Fan, Y.; Xu, Y.D.; He, W.; Zhang, J. Effect of different forms of n fertilization on productive performance of mixture pasture. Caoye Yu Xumu 2012, 12–15. [Google Scholar]
  20. Zhong, Z.M.; Song, Y.N.; Huang, X.S.; You, X.F.; Weng, B.Q.; Huang, Q.L.; Chen, Z.D.; Feng, D.Q. Effects of biogas slurry application on the soil microorganisms of P. americanum × P. purpureum grassland. Acta Agrestia Sinca 2016, 24, 54–60. [Google Scholar]
  21. Yang, Z.Q.; Ding, H.R.; Chen, Y.J.; Jin, C.F.; Shi, K.; Hou, F.Y.; Feng, G.N.; Huang, Q.Q. Effects of Different application amount of biogas-slurry on barley agronomic traits & feeding quality. Acta Ecol. Anim. Domastici 2019, 40, 59–65. [Google Scholar]
  22. He, M.T.; Lyu, G.Y.; Cai, J.; Wang, C.J. Near-infrared reflectance spectroscopy analysis of forage nutrition indexes of temperate desert steppe in Inner Mongolia. Heilongjiang Anim. Sci. Vet. Med. 2024, 1, 90–95. [Google Scholar]
  23. Li, H.Y.; Gao, C.P.; Lyu, G.Y. Effects of Grazing and Nitrogen Addition on Desert Grassland Plants and Soil Carbon and Nitrogen. Acta Agrestia Sin. 2024, 32, 239–247. [Google Scholar]
  24. Hensgen, F.; Bühle, L.; Wachendorf, M. The effect of harvest, mulching and low-dose fertilization of liquid digestate on above ground biomass yield and diversity of lower mountain semi-natural grasslands. Agric. Ecosyst. Environ. 2016, 216, 283–292. [Google Scholar] [CrossRef] [Scilit]
  25. Coelho, J.J.; Hennessy, A.; Casey, I.; Woodcock, T.; Kennedy, N. Biofertilisation with anaerobic digestates: Effects on the productive traits of ryegrass and soil nutrients. J. Soil Sci. Plant Nutr. 2020, 20, 1665–1678. [Google Scholar] [CrossRef] [Scilit]
  26. Lu, J.L.; Wang, Y.; Li, D.; Yang, Q.; Jiang, Y.; Wang, P.; Su, T.Y.; Li, G.M.; Shi, Q.; Yang, H.; et al. Increased organic fertilizer significantly increases leaf nitrogen and phosphorus but not carbon content in a tropical tea plantation. Sci. Rep. 2025, 15, 26249. [Google Scholar] [CrossRef] [Scilit]
  27. Yang, Y.; Gong, S.S.; Jin, H.M.; Yu, X. Effects of biogas slurry derived from cow dung on the yield and quality of wheat and silage maize. J. Ecol. Rural Environ. 2023, 39, 264–272. [Google Scholar]
  28. Lu, Y.Q.; Cui, S.N.; Zhang, H.W.; Zheng, J.; Pan, J.B.; Zhang, Q.Z. The genetic basis of acid detergent fiber content in maize was analyzed using hybrid populations. Mol. Plant Breed. 2026; in press.
  29. Lü, Y.X.; An, B.G.; Pan, Q.M.; Liu, W.; Sun, J.M.; Wang, J.; Qi, Z.Y.; Li, C.; Dou, S.D.; Han, X.G. Nutrient amendment promotes vegetation restoration and improves ecosystem carbon uptake capacity in a degraded grassland. Agric. Ecosyst. Environ. 2025, 388, 109666. [Google Scholar] [CrossRef] [Scilit]
  30. Zhou, C.L.; Li, Y.K.; Cao, G.M.; Peng, C.J.; Song, M.H.; Xu, X.L.; Zhou, H.K.; Lin, L. Carbon and nitrogen stable isotopes technology in the researches on alpine meadow ecosystem in Qinghai-Tibet Plateau: Progress and prospect. Chin. J. Appl. Ecol. 2020, 31, 3568–3578. [Google Scholar]
  31. Huang, K.L.; De Long, J.R.; Yan, X.B.; Wang, X.Y.; Wang, C.L.; Zhang, Y.W.; Zhang, Y.Y.; Wang, P.; Du, G.Z.; van Kleunen, M.; et al. Why are graminoid species more dominant? Trait-mediated plant–soil feedbacks shape community composition. Ecology 2024, 105, e4295. [Google Scholar] [CrossRef] [Scilit]
  32. Yu, Q.S.; He, C.Q.; Anthony, M.A.; Schmid, B.; Gessler, A.; Yang, C.; Zhang, D.H.; Ni, X.F.; Feng, Y.H.; Zhu, J.L.; et al. Decoupled responses of plants and soil biota to global change across the world’s land ecosystems. Nat. Commun. 2024, 15, 10369. [Google Scholar] [CrossRef] [Scilit]
  33. Luo, J.F.; Ma, L.; Li, G.J.; Deng, D.Z.; Chen, D.C.; Zhang, L.; Zhu, X.W.; Zhou, J.X. The effects of land degradation on plant community assembly: Implications for the restoration of the Tibetan Plateau. Land Degrad. Dev. 2020, 31, 2819–2829. [Google Scholar] [CrossRef] [Scilit]
  34. Kumar, A.; Verma, L.M.; Sharma, S.; Singh, N. Overview on agricultural potentials of biogas slurry (BGS): Applications, challenges, and solutions. Biomass Convers. Biorefinery 2023, 13, 13729–13769. [Google Scholar] [CrossRef] [Scilit]
  35. Nicholson, F.; Bhogal, A.; Taylor, M.; McGrath, S.; Withers, P. Long-term effects of biosolids on soil quality and fertility. Soil Sci. 2018, 183, 89–98. [Google Scholar] [CrossRef] [Scilit]
  36. Lin, H.L.; Han, J.C.; Jiang, H.Q.; Zhang, H.L.; Jia, R.M.; Wang, C.; Zhou, H.L.; Jiang, Y.; Li, H.L.; Chen, Y.H.; et al. Effect of biogas slurry on the growth performance and quality of king grass in the overwintering period. Pratacultural Sci. 2019, 36, 1861–1868. [Google Scholar]
  37. Holatko, J.; Hammerschmiedt, T.; Kucerik, J.; Kintl, A.; Baltazar, T.; Malicek, O.; Latal, O.; Brtnicky, M. Fertilisation of permanent grasslands with digestate and its effect on soil properties and sustainable biomass production. Eur. J. Agron. 2023, 149, 12691. [Google Scholar] [CrossRef] [Scilit]
  38. Ma, T.S.; Deng, X.W.; Chen, L.; Xiang, W.H. The soil properties and their effects on plant diversity in different degrees of rocky desertification. Sci. Total Environ. 2020, 736, 139667. [Google Scholar] [CrossRef] [Scilit]
  39. Winsa, M.; Bommarco, R.; Lindborg, R.; Marini, L.; Öckinger, E. Recovery of plant diversity in restored semi-natural pastures depends on adjacent land use. Appl. Veg. Sci. 2015, 18, 413–422. [Google Scholar] [CrossRef] [Scilit]
  40. Šařec, P.; Novák, V.; Látal, O.; Dědina, M.; Korba, J. Digestate Application on Grassland: Effects of Application Method and Rate on GHG Emissions and Forage Performance. Agronomy 2025, 15, 1243. [Google Scholar] [CrossRef] [Scilit]
  41. Wang, Z.; Sanusi, I.A.; Wang, J.; Ye, X.; Kana, E.G.; Olaniran, A.O. Biogas slurry significantly improved degraded farmland soil quality and promoted Capsicum spp. production. Plants 2024, 13, 265. [Google Scholar] [CrossRef] [Scilit] [PubMed]
  42. An, Y.; Zhang, Y.; Liu, J.; Wang, Z.; Gao, Y.; Ma, H.; Tong, S. Functional trait outperforms plant diversity in governing biomass production and allocation in semiarid grasslands undergoing grazing exclusion. Agric. Ecosyst. Environ. 2025, 393, 109847. [Google Scholar] [CrossRef] [Scilit]
Figure 1. Changes in vegetation community indicators under biogas slurry fertilization from 2024 to 2025. (A) Vegetation coverage; (B) vegetation average height; (C) aboveground biomass; (D) crude protein; (E) ether extract; (F) neutral detergent fiber; (G) acid detergent fiber. Note: CK, water control; BS50%, 50% biogas slurry; BS100%, full-strength biogas slurry. Different lowercase letters indicate that the differences between different treatments reach a significant level (p < 0.05). The same below.
Sustainability 18 02605 g001
Figure 2. Changes in plant physiological indicators following additional application of biogas slurry fertilizer from 2024 to 2025. (A) Leaf total carbon; (B) leaf total nitrogen; (C) leaf carbon stable isotope; (D) leaf nitrogen stable isotope; (E) root total carbon; (F) root total nitrogen; (G) root carbon stable isotope; (H) root nitrogen stable isotope. Note: CK, water control; BS50%, 50% biogas slurry; BS100%, full-strength biogas slurry. Different lowercase letters indicate that the differences between different treatments reach a significant level (p < 0.05). The same below.
Sustainability 18 02605 g002
Figure 3. Changes in the weighted proportion of plant families and the number of plant families, genera, and species following increased application of biogas slurry fertilizer from 2024 to 2025. (A) Weighted proportion of plant families; (B) mean number of plant families, genera, and species per quadrat under different treatments (values are means ± SD). Note: Different uppercase letters indicate significant differences among treatments in 2024, while different lowercase letters indicate significant differences in 2025 (p < 0.05).
Sustainability 18 02605 g003
Figure 4. Principal component analysis of changes in various indicators following the application of additional slurry fertilizer from 2024 to 2025: (A) 2024: load plot; (B) 2024: score plot; (C) 2025: load plot; (D) 2025: scoreplot. Note: VAH, vegetation average height; VC, vegetation coverage; AB, aboveground biomass; CP, crude protein; EE, ether extract; NDF, neutral detergent fiber; ADF, acid detergent fiber; LTC, leaf total carbon; LTN, leaf total nitrogen; Lδ13C, leaf carbon stable isotope; Lδ15N, leaf nitrogen stable isotope; RTC, root total carbon; RTN, root total nitrogen; Rδ13C, root carbon stable isotope; Rδ15N, root nitrogen stable isotope. The same below.
Sustainability 18 02605 g004
Figure 5. Redundancy analysis of changes in various indicators following the application of additional biogas slurry fertilizer from 2024 to 2025: (A) 2024: vegetation characteristics (response variable) vs. chemical indicators (explanatory variables); (B) 2024: leaf nutrients (response variable) vs. chemical indicators (explanatory variables); (C) 2025: vegetation characteristics (response variable) vs. chemical indicators (explanatory variables); (D) 2025: leaf nutrient content (response variable) vs. chemical indicators (explanatory variables).
Sustainability 18 02605 g005
Table 1. Basic physicochemical properties of biogas slurry.
pHTotal Nitrogen (%)Total Phosphorus (%)Total Potassium (%)Organic Matter (%)
7.110.110.070.0914.5
Note: Total phosphorus is measured by P2O5 and total potassium by K2O.
Disclaimer/Publisher’s Note: The statements, opinions and data contained in all publications are solely those of the individual author(s) and contributor(s) and not of MDPI and/or the editor(s). MDPI and/or the editor(s) disclaim responsibility for any injury to people or property resulting from any ideas, methods, instructions or products referred to in the content.