Article

Exploring the Ecological Security Network in the Gansu Section of the Yellow River Basin in China


1
College of Forestry, Gansu Agricultural University, Lanzhou 730070, China
2
College of Grassland Agricultural Science and Technology, Lanzhou University, Lanzhou 730070, China
*
Author to whom correspondence should be addressed.
Sustainability 2026, 18(4), 2115; https://doi.org/10.3390/su18042115
Submission received: 26 December 2025 / Revised: 28 January 2026 / Accepted: 3 February 2026 / Published: 20 February 2026

Abstract

Rapid urbanization has led to severe landscape fragmentation and ecosystem degradation in the Gansu Section of the Yellow River Basin (GSYRB). Focusing on this region, this study identified the spatial distribution of key ecological elements; consequently, an integrated “source–corridor–pinch point” ecological network was constructed. The findings aim to optimize the regional ecological security pattern. Ultimately, this study provides a scientific basis for the sustainable development of the study area and similar regions. This study revealed ecological trends based on four periods of land use data (1993–2023). We identified ecological source areas through MSPA and ecosystem service evaluations, and constructed resistance surfaces using spatial PCA. By applying circuit theory, we extracted ecological corridors—incorporating width attributes—and identified pinch points, thereby establishing a comprehensive ecological network. The results show that: (1) Over the past 30 years, construction land area expanded significantly, while cultivated land and water body areas contracted, and grassland and forest areas increased slowly. (2) Both the landscape fragmentation index and connectivity index exhibited a downward trend, while the landscape diversity index decreased first and then increased, indicating a systemic transformation in the landscape pattern. (3) A total of 260 ecological source areas, 694 ecological corridors (linear pathways connecting ecological source areas), and 371 ecological pinch points (critical bottleneck sections within corridors where connectivity is most vulnerable to disruption) were identified, forming an overall network structure with uneven spatial distribution. The ecological network spatial pattern constructed in this study based on ecosystem service assessment and circuit theory can effectively identify key ecological elements and their spatial heterogeneity characteristics, providing scientific reference for optimizing regional ecological security patterns and biodiversity conservation.

1. Introduction

As the Mother River of the Chinese nation, the Yellow River flows across three major geographical terraces—the Qinghai-Tibet Plateau, the Loess Plateau, and the North China Plain—serving as a crucial ecological security barrier and an economic development belt in China [1]. Located in the upper reaches, the study area is a vital water resource recharge area and ecological function zone, holding an irreplaceable strategic position for maintaining water resource security and ecological security throughout the entire basin [2,3]. The Gansu section of the Yellow River Basin is situated at the junction of three major plateaus. This region exhibits extremely complex landscape types, encompassing diverse landforms ranging from alpine mountains and semi-arid grasslands to arid deserts. Such geographical heterogeneity makes it a typical “natural laboratory” for studying ecological evolution in arid and semi-arid regions. Furthermore, as a historical corridor of the Silk Road and a national industrial base, this area has long faced intense conflicts between industrial urbanization and a fragile ecological environment [4]. Dramatic changes in land use patterns have led to profound transformations in landscape structure; the disorderly expansion of construction land has encroached upon substantial high-quality ecological space, ecosystem service functions have shown degradation trends, landscape fragmentation has continuously intensified [5]. Indeed, landscape fragmentation and the decline of ecosystem services have become global challenges. This issue is not limited to Asia; Europe, North America, and Africa similarly face pressure on biodiversity hotspots due to urban sprawl.
Ecosystem degradation resulting from urbanization is a globally pervasive issue, not an isolated phenomenon. Research across continents highlights this universal challenge: In Europe, Kukkala and Moilanen (2013) emphasize the urgent need for transboundary ecological frameworks to integrate fragmented natural territories, driven by high landscape fragmentation [6]. In North America, Theobald (2013) utilized landscape connectivity models to study human activity pressure across the entire United States [7], indicating that urban expansion significantly weakens connectivity between biogeographical regions. In rapidly urbanizing regions like Africa and South America, scholars such as Cumming (2020) [8] point out that social-ecological system disconnection has become a major obstacle to achieving sustainable land-use transformations. Collectively, these studies demonstrate a global consensus [8]: building robust ecological networks is a crucial strategic approach to mitigate land-use conflicts and maintain landscape functional connectivity worldwide.
As a spatial carrier connecting ecological source areas and maintaining the integrity of ecological processes, ecological networks represent a key strategy for coordinating the contradiction between regional development and ecological protection and for constructing regional ecological security patterns [9]. By systematically identifying ecological source areas and ecological corridors to construct continuous and complete network structures, ecological networks can effectively integrate fragmented landscape units and enhance ecosystem stability and resilience [10]. Among these, ecological source areas, as core patches that continuously provide ecosystem services and support regional ecological security, form the foundation of ecological network construction [11]. Identification methods mainly include ecological sensitivity analysis, ecosystem service importance assessment, and landscape connectivity analysis [12]. Internationally, research on ecological networks has shifted from early “landscape design for conservation biology” toward comprehensive evaluations based on “ecosystem service trade-offs” and “social-ecological system coupling” [13]. In recent years, researchers have begun to utilize big data and machine learning algorithms to optimize resistance surface assignment. By integrating models such as InVEST and SolVES to characterize the functional attributes of ecological networks across multiple dimensions, these studies emphasize a transition from static structures toward dynamic flows [14,15].
Currently, the paradigm of “ecological source areas identification-ecological resistance surface construction-ecological corridor extraction” has become the mainstream approach for ecological security pattern construction [16]. Regarding source identification, Morphological Spatial Pattern Analysis (MSPA) has been widely applied due to its ability to precisely identify core areas, corridors, and other components from the perspective of landscape morphology [17]. For corridor extraction, circuit theory, by simulating the random-walk dispersal processes of species, is capable of identifying ecological corridors with width information. This effectively addresses the limitations of the traditional Minimum Cumulative Resistance (MCR) model, which only identifies single linear paths and overlooks the potential for multi-path dispersal [18]. However, existing research on the ecological networks of the Yellow River Basin predominantly focuses on the middle and lower reaches’ plains or the entire basin scale [19]. For the Gansu section, a region spanning strong climatic gradients with extremely complex geomorphic units, there remains a lack of comprehensive investigation that integrates “structural connectivity” and “functional connectivity” within a long-term temporal context [20,21].
Although ecological network construction research has achieved fruitful results, its application still has the following deficiencies: existing research mostly uses single-period data for static analysis, lacking systematic exploration of the spatiotemporal evolution process of ecological patterns driven by land use change; ecological source areas identification methods are relatively singular, failing to fully integrate the technical advantages of ecosystem service assessment and landscape spatial structure analysis; ecological corridor extraction mostly adopts minimum resistance models, making it difficult to accurately characterize the multi-path characteristics of species dispersal and bottleneck areas of ecological flow. Therefore, enhancing the accuracy of ecological network construction—including the evaluation of patch selection rationality, corridor development, and network optimization—remains in need of further refinement [22,23].
In view of this, the innovations of this research are primarily reflected in the following three aspects: (1) Innovative Coupling Model: This study establishes a coupled framework integrating “MSPA–Ecosystem Service Evaluation–Circuit Theory.” By scientifically identifying ecological sources from the dual dimensions of “landscape morphology” and “ecological function,” the model ensures both the structural stability and functional support capacity of these sources. (2) Long-term Dynamic Evolutionary Perspective: Utilizing a 30-year long-term series of data, the study analyzes the spatiotemporal evolution of the ecological network during periods of intensive land-use change. This approach overcomes the limitations inherent in traditional static pattern research. (3) Precise Identification of Restoration Nodes: Circuit theory is applied to pinpoint ecological “pinch points” and “barriers.” This allows macro-level network optimization to be implemented through micro-level spatial governance, providing robust decision support for regional high-quality development and the delineation of ecological protection redlines [24].

2. Materials and Methods

2.1. Study Area

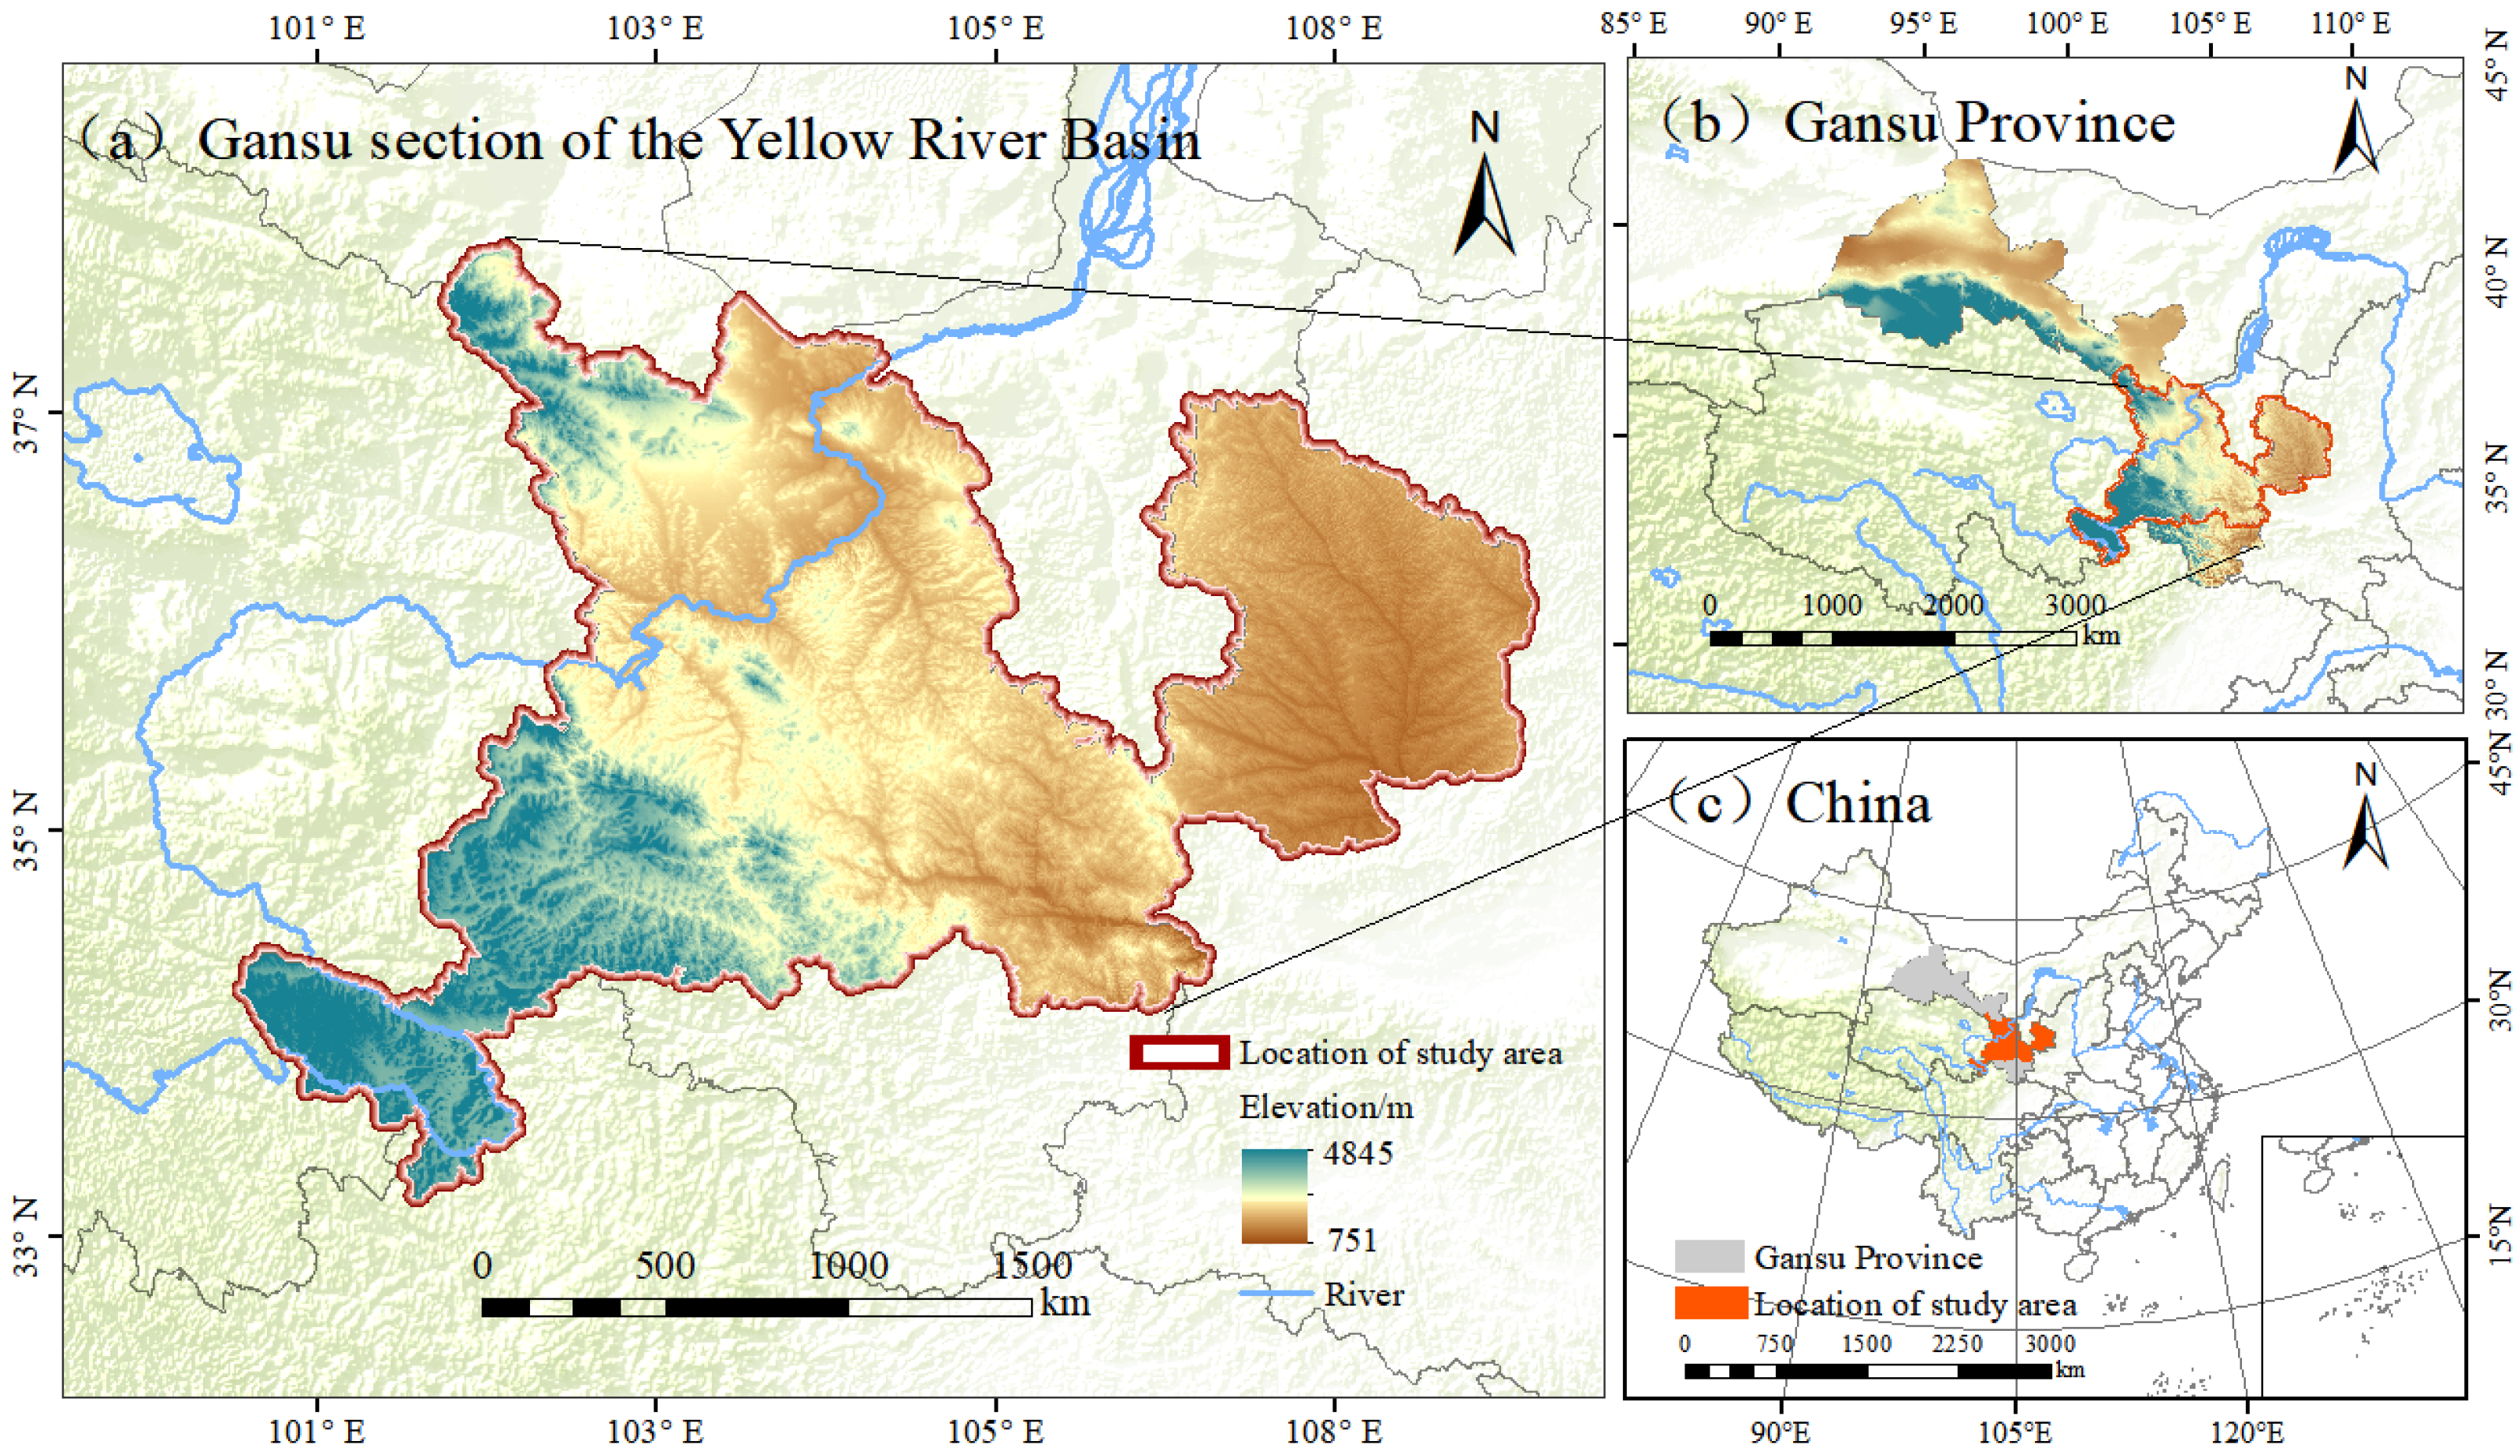
This study was conducted in the Yellow River Basin, with its Gansu section selected as the research area (32°31′–38°20′ N, 102°40′–104°20′ E), with a mainstream length of approximately 913 km and a basin area of 145,000 km2 (Figure 1) [25,26]. This section flows through important prefectures and cities including Gannan Tibetan Autonomous Prefecture, Linxia Hui Autonomous Prefecture, Lanzhou City, and Baiyin City, serving as a key water resource recharge area for the Yellow River [27].
The region is characterized by highly fragmented terrain, generally low vegetation coverage, and prominent soil erosion risks [27]. The climate transition, falling between a plateau continental climate and a temperate continental climate. Consequently, precipitation exhibits a significant decreasing trend from the southeast to the northwest [28]. Influenced by these terrain and precipitation patterns, vegetation displays clear spatial differentiation [29,30], The landscape transitions sequentially from forest to grassland and then to desert across the region. This results in a relatively simple community structure and highlights obvious ecosystem fragility and transitional characteristics.

2.2. Data Sources and Processing

2.2.1. Data Sources

The land-use classification in this study follows the system of the China Land Use Dataset from the Chinese Academy of Sciences. The study area is categorized into six primary types: cropland, forest, grassland, water bodies, construction land, and unutilized land. Five ecosystem services were selected for assessment: water yield, soil retention, habitat quality, carbon storage, and cultural recreation services. All datasets were resampled and projected using ArcGIS 10.8.1 software.
Based on their applications, the data were categorized into two groups: those required for analyzing landscape patterns and those used for ecological network construction (Table 1). Specifically, land cover data were used to analyze landscape types and their changes. For the ecological network, soil properties, the Normalized Difference Vegetation Index (NDVI), temperature, and precipitation were utilized. Additionally, Digital Elevation Model (DEM) data, transportation networks, rainfall erosivity, and scenic Point of Interest (POI) data supported the ecosystem service assessment, which served as the basis for identifying ecological source areas. Finally, DEM and transportation network data were also integrated to construct the ecological resistance surface.

2.2.2. Data Processing

(1)
Boundary Generation for the Study Area
The primary data for this study were sourced from the National Science and Technology Resource Sharing Platform. These datasets and boundaries are standard in basin research. Focusing on the study area, terrain analysis was conducted using ArcGIS hydrological analysis tools, and the study area extent was obtained by determining ridges and watershed divides, as well as terrain slope and aspect information.
(2)
Data downscaling processing
Temperature and precipitation data were obtained from the Climatic Research Unit dataset. This study employed the Delta downscaling method to process precipitation data, obtaining precipitation data at 1 km × 1 km resolution. On this basis, GIS spatial interpolation was used to obtain precipitation data at 30 m × 30 m resolution. The interpolated data were overlaid with baseline temperature data to obtain temperature data at 1 km × 1 km resolution. Finally, temperature lapse rate correction was applied to the downscaled temperature data to obtain temperature data at 30 m × 30 m resolution.
(3)
Unified coordinate system and resolution
The geographic coordinate systems of all data were unified (WGS_1984_World_Mercator), and the resolution of main data was unified to 30 m × 30 m.

2.3. Research Framework

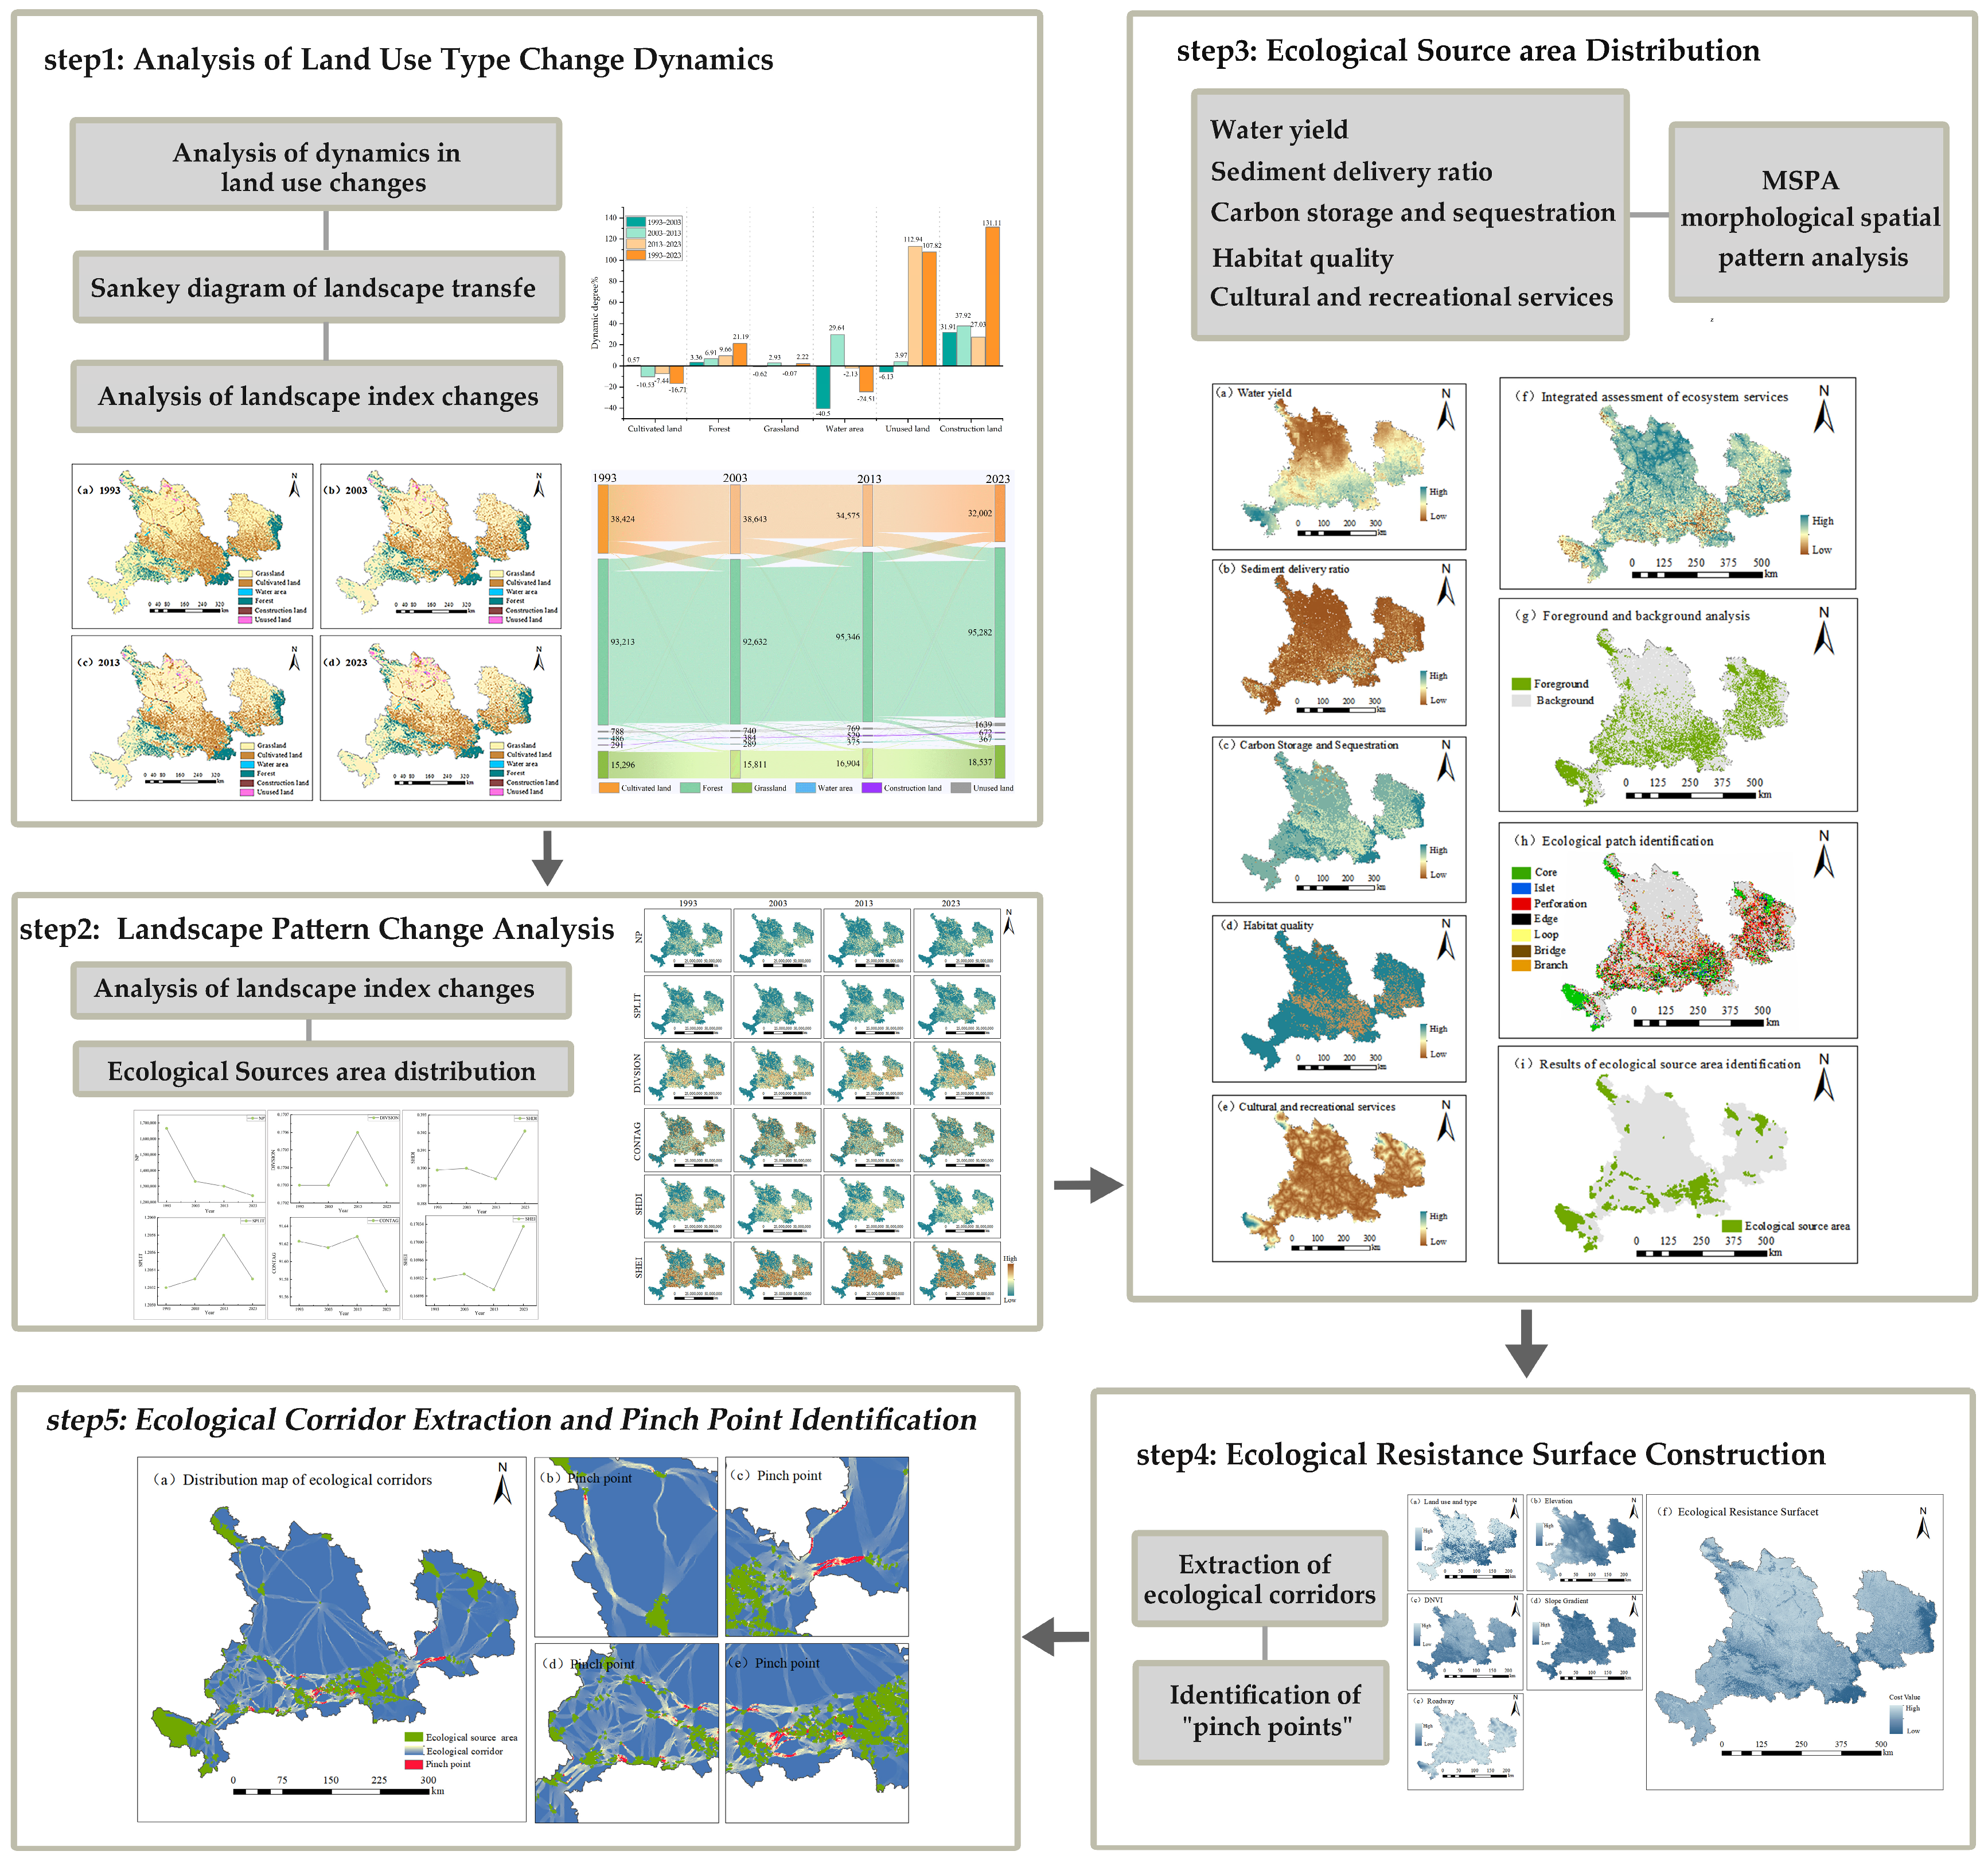
As illustrated in Figure 2, this study encompasses the evolution of landscape patterns, the integrated assessment of ecosystem services, and the identification of ecological corridors and pinch points within the study area.

2.3.1. Land Use Dynamics Analysis

Dynamic degree analysis of a single land use type can reflect the degree and rate of change of a certain land type within a unit period [31]. The calculation formula is as follows:
K C i = A ai − A bi A i × 100 %
where K C i quantifies the overall dynamic change degree of a landscape type, with A ai and A bi denoting the areal extent of a specific land class at the start and end of the study period, respectively.

2.3.2. Land Use Transfer Matrix

The land use transfer matrix represents the conversion types and areas between different land classes during the same time period [32]. The calculation formula is as follows:
S ij = S 11 S 12 … S 1 n S 21 S 22 … S 2 n … … … … S n 1 S n 2 … S nn
where S represents the study area, S ij represents the land use type transition area, and n represents the number of land use types.

2.3.3. Landscape Pattern Analysis

Landscape patterns reflect the spatial structure and distribution of patches; moreover, changes in these patterns are closely linked to ecological processes. Based on ArcGIS and Fragstats 4.2 software, this study selected six landscape-level indices: landscape fragmentation (NP, SPLIT), landscape connectivity (DIVISION, CONTAG), and landscape diversity (SHDI, SHEI).

2.3.4. Ecosystem Service Assessment

(1)
Water yield service assessment
This study used the “Water Yield” module in the InVEST 3.16.1 model to assess water yield, calculating water yield data for each grid based on land use type, actual evapotranspiration, precipitation data, Zhang Coefficient, plant root depth, basin data, and plant available water content. The calculation formula is as follows [33]:
Y α j = 1 − AET α j P α × P α
where Y α j denotes the annual water yield of pixel α under land use type α ; where Y α j denotes the annual water yield of pixel α under land use type α ; and P α is the annual precipitation of pixel α . All variables are expressed in millimeters (mm).
(2)
Soil retention service assessment
This study used the “Sediment Delivery Ratio” module in the InVEST 3.16.1 model to calculate the difference between actual soil erosion and potential soil erosion [31]. The calculation formula is as follows:
Q q = R a ⋅ K a ⋅ L S a ⋅ C a ⋅ P a
Q p = R α ⋅ K α ⋅ LS α
∆ Q = R α ⋅ K α ⋅ LS α ⋅ ( 1 − C a P a )
where Q q represents the actual soil loss; Q p denotes the potential soil loss; and ∆ Q is the annual soil retention, all expressed in tons ( ton · ( hm 2 · a ) − 1 ) . C is the cover-management factor; P represents the support practice factor; K and R are the soil erodibility factor ( ton ⋅ ha ⋅ hr ( MJ ⋅ ha ⋅ mm ) − 1 ) and the rainfall erosivity factor ( MJ ⋅ mm ⋅ ( ha ⋅ ma ) − 1 ) ; and LS α is the slope length-steepness factor.
(3)
Carbon storage service assessment
Carbon storage service assessment utilized land and raster data along with terrestrial ecosystem carbon density (aboveground biomass, belowground biomass, soil organic matter, and dead organic matter) [32]. The calculation formula is as follows:
C a = C a − above + C a − below + C a − soil + C a − dead
C total = ∑ α = 1 n C a × S a
In the formula, C a represents the land use type on pixel α(t), representing total ecosystem carbon. C a − above represents aboveground biomass carbon density; C a − below represents belowground biomass carbon density (t/hm2); C a − soil represents soil carbon density (t/hm2); C a − dead represents dead organic matter carbon density (t/hm2); N represents the number of land use types; S a represents the area of land use type α (hm2).
(4)
Habitat quality service assessment
Using the “Habitat Quality” module in InVEST 3.16.1 software, with values ranging from [0–1], dimensionless. The calculation formula is as follows [34,35]:
Q α j = H j ( 1 − ( D α j 2 D α j 2 + k 2 ) )
where Q α j is the habitat quality of pixel α under land use type j ; H j denotes the habitat suitability score of land use type j ; k is the half-saturation constant, typically set to 0.5; and D aj represents the total threat level experienced by pixel α in land use type j .
The threat factors and the corresponding sensitivity coefficients of land cover types were determined for the habitat quality calculation. These parameters were set according to the InVEST 3.16.1 User‘s Guide. The specific values are provided in Table 2 and Table 3.
(5)
Cultural recreation service assessment
Accessibility calculation used the shortest path algorithm for spatial overlay analysis, generating a spatial distribution surface of the minimum travel time to reach POIs [31]. The calculation formula is as follows:
A i = ∑ j = 1 d T ij d
where A i represents the accessibility of node T ij denotes the shortest travel time from node i to destination j via the transportation network; and d is the total number of destination points j within the study area.

2.3.5. MSPA-Based Source Identification

(1)
Morphological Spatial Pattern Analysis (MSPA)
In the initial configuration of the MSPA (Morphological Spatial Pattern Analysis) model, the definition of foreground and background directly determines the recognition accuracy of spatial patterns. Traditional studies typically designate forest land, grassland, and water bodies as the foreground based on land-use types, while treating other categories as the background.
In contrast, this study aims to emphasize the comprehensive ecological functions of the identified ecological source areas. We first conducted a comprehensive assessment of five ecosystem service indicators and reclassified the evaluation results using the Natural Breaks method. On this basis, areas with high comprehensive ecosystem service values were designated as the foreground, while the remaining areas served as the background. Subsequently, the MSPA model was employed to identify and extract core areas at the raster level. These areas, defined as natural habitats located within ecological patches far from edges and with minimal external interference, served as the ecological foundation. Finally, by overlaying the “important ecosystem service areas” with the “MSPA core areas,” and filtering out fragmented small patches, we selected high-quality ecological patches with an area exceeding 5 km2 as the definitive ecological source areas.
(2)
Ecological Corridor Extraction and Pinch Point Identification Based on Circuit Theory
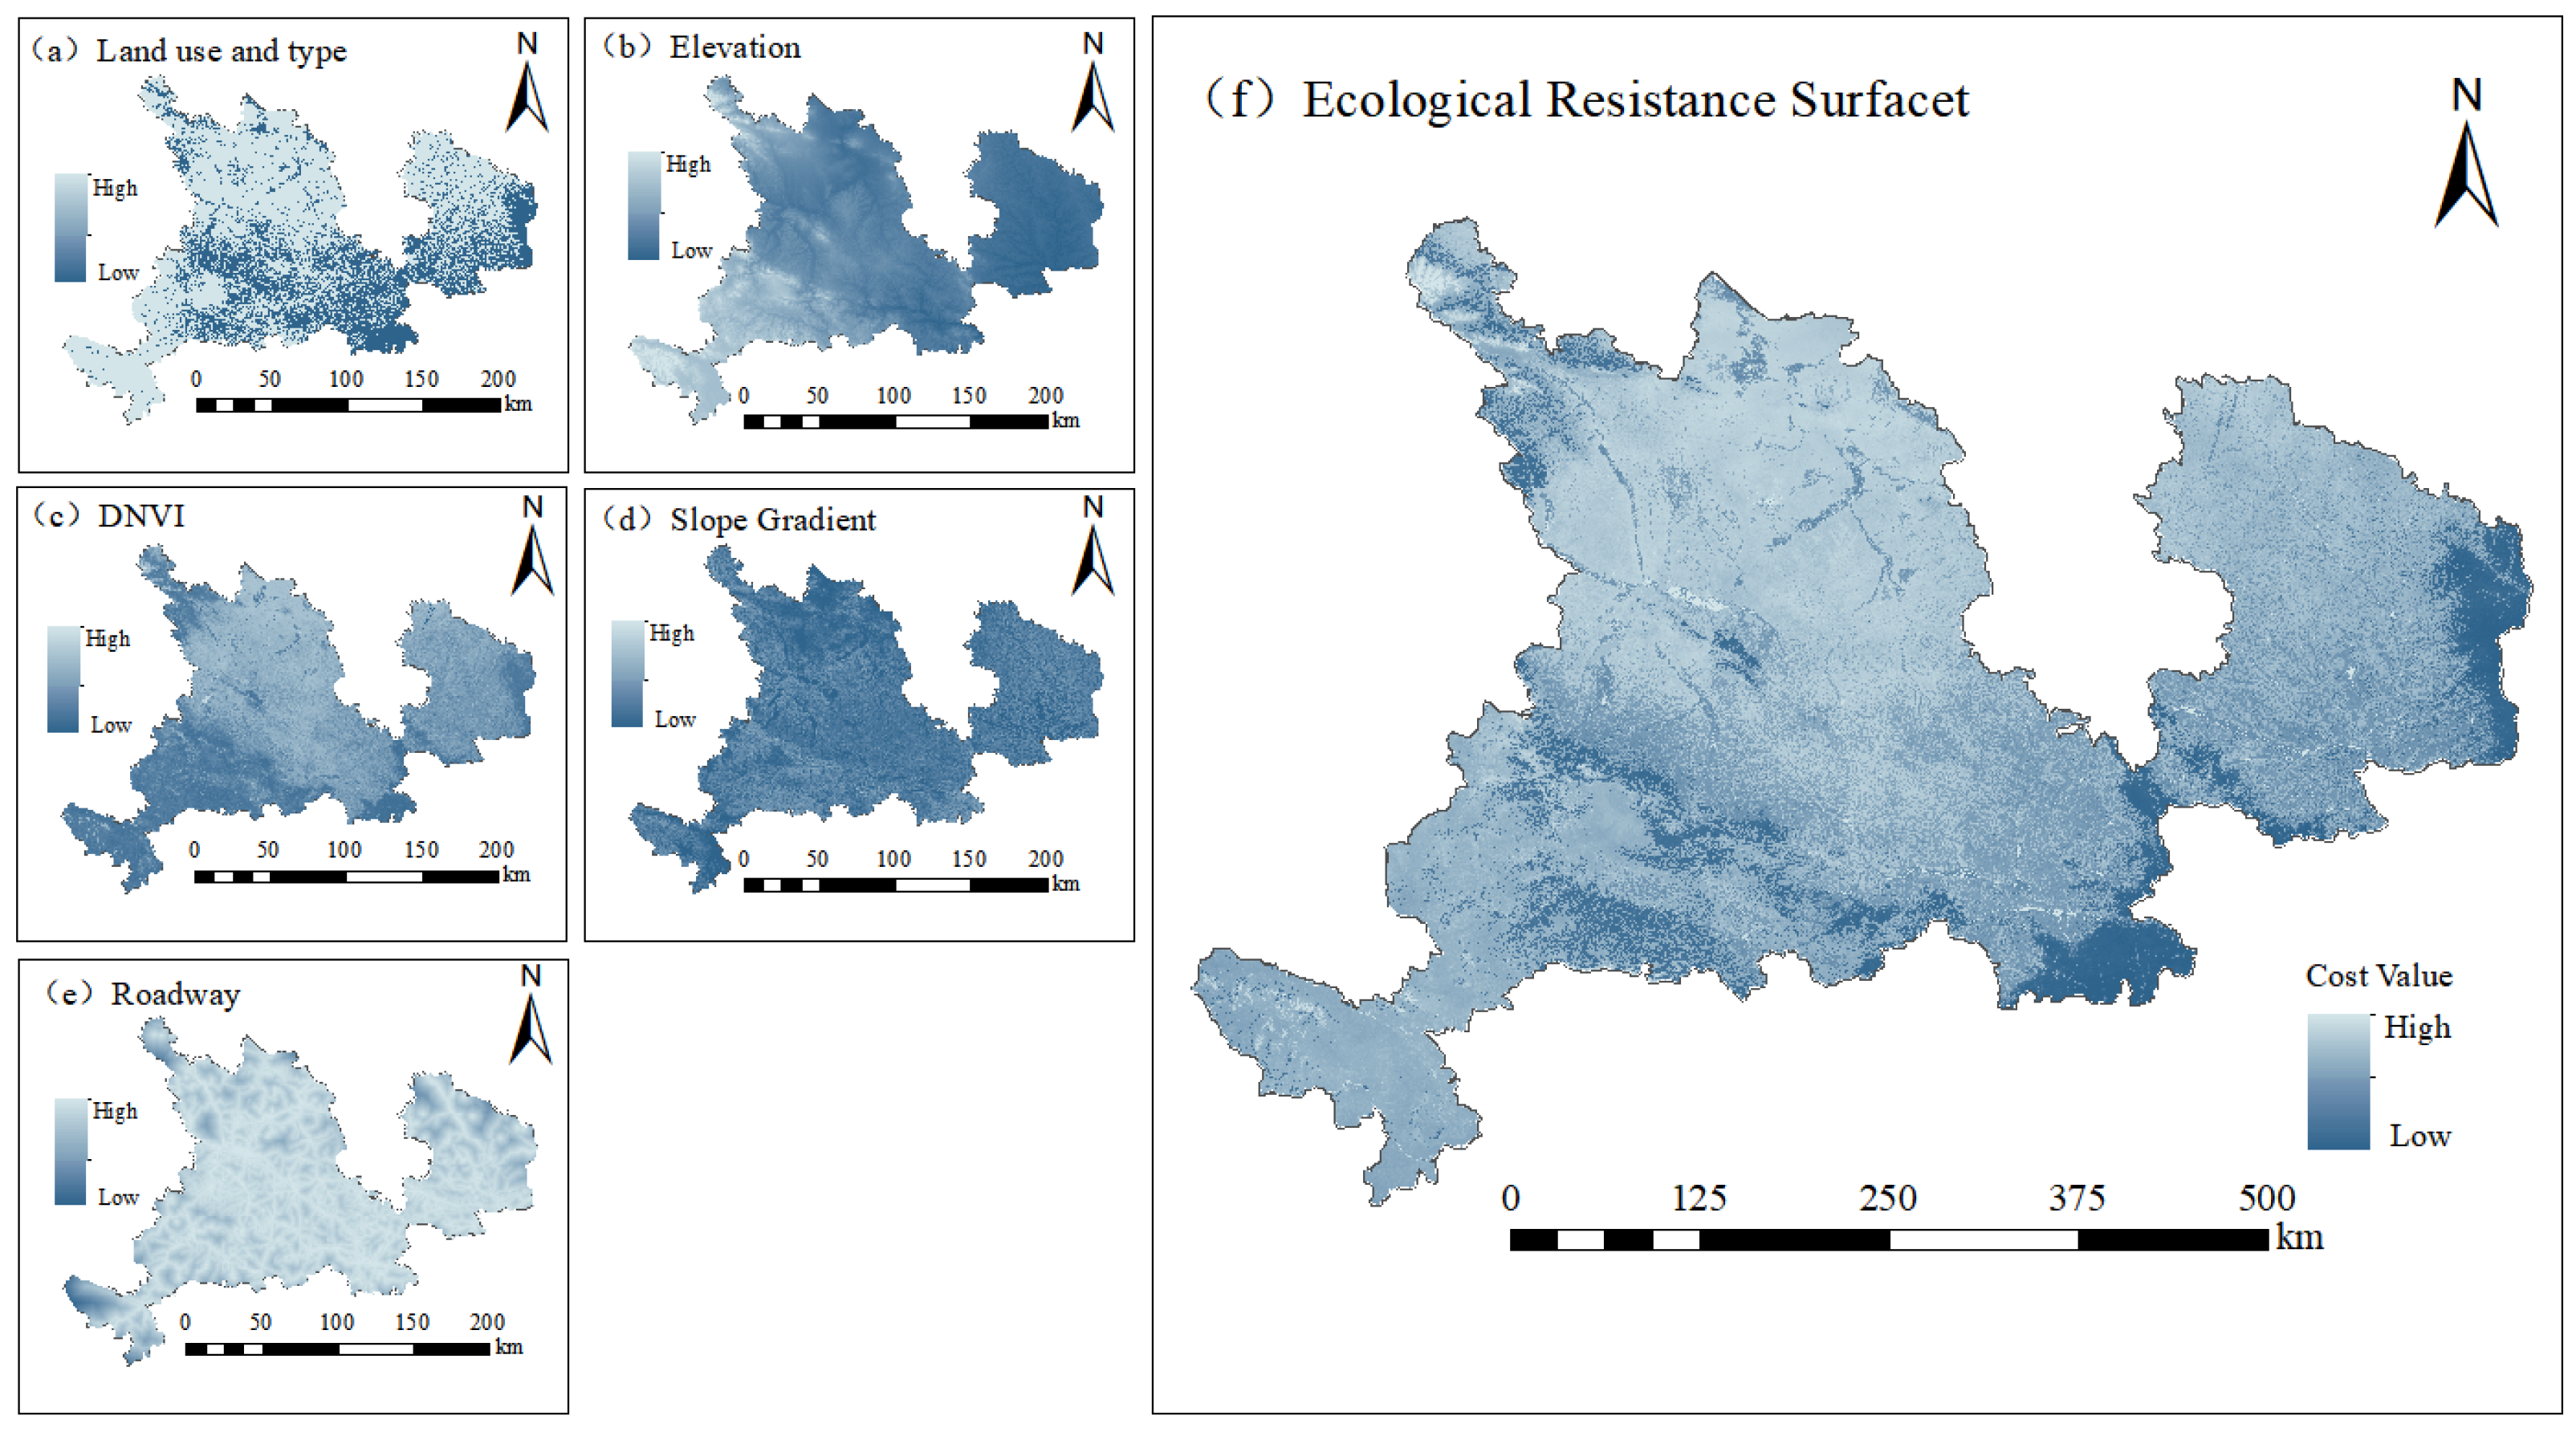
The resistance surface was constructed via Spatial Principal Component Analysis (SPCA). Subsequently, based on circuit theory, ecological corridors with specific width information were extracted. Ecological pinch points—defined as regions with high ecological flow probability and biodiversity—were identified using the Pinchpoint Mapper module to capture areas of high current density. These components collectively formed the final ecological network [36,37]. The governing equation is expressed as follows:
I = V / R eff
where I is the current intensity, V is the voltage between source areas, and R eff denotes the resistance representing dispersal barriers. A higher value of I indicates a greater probability of species movement along a specific path.

3. Results

3.1. Spatiotemporal Changes in Land Use Types Across Different Periods

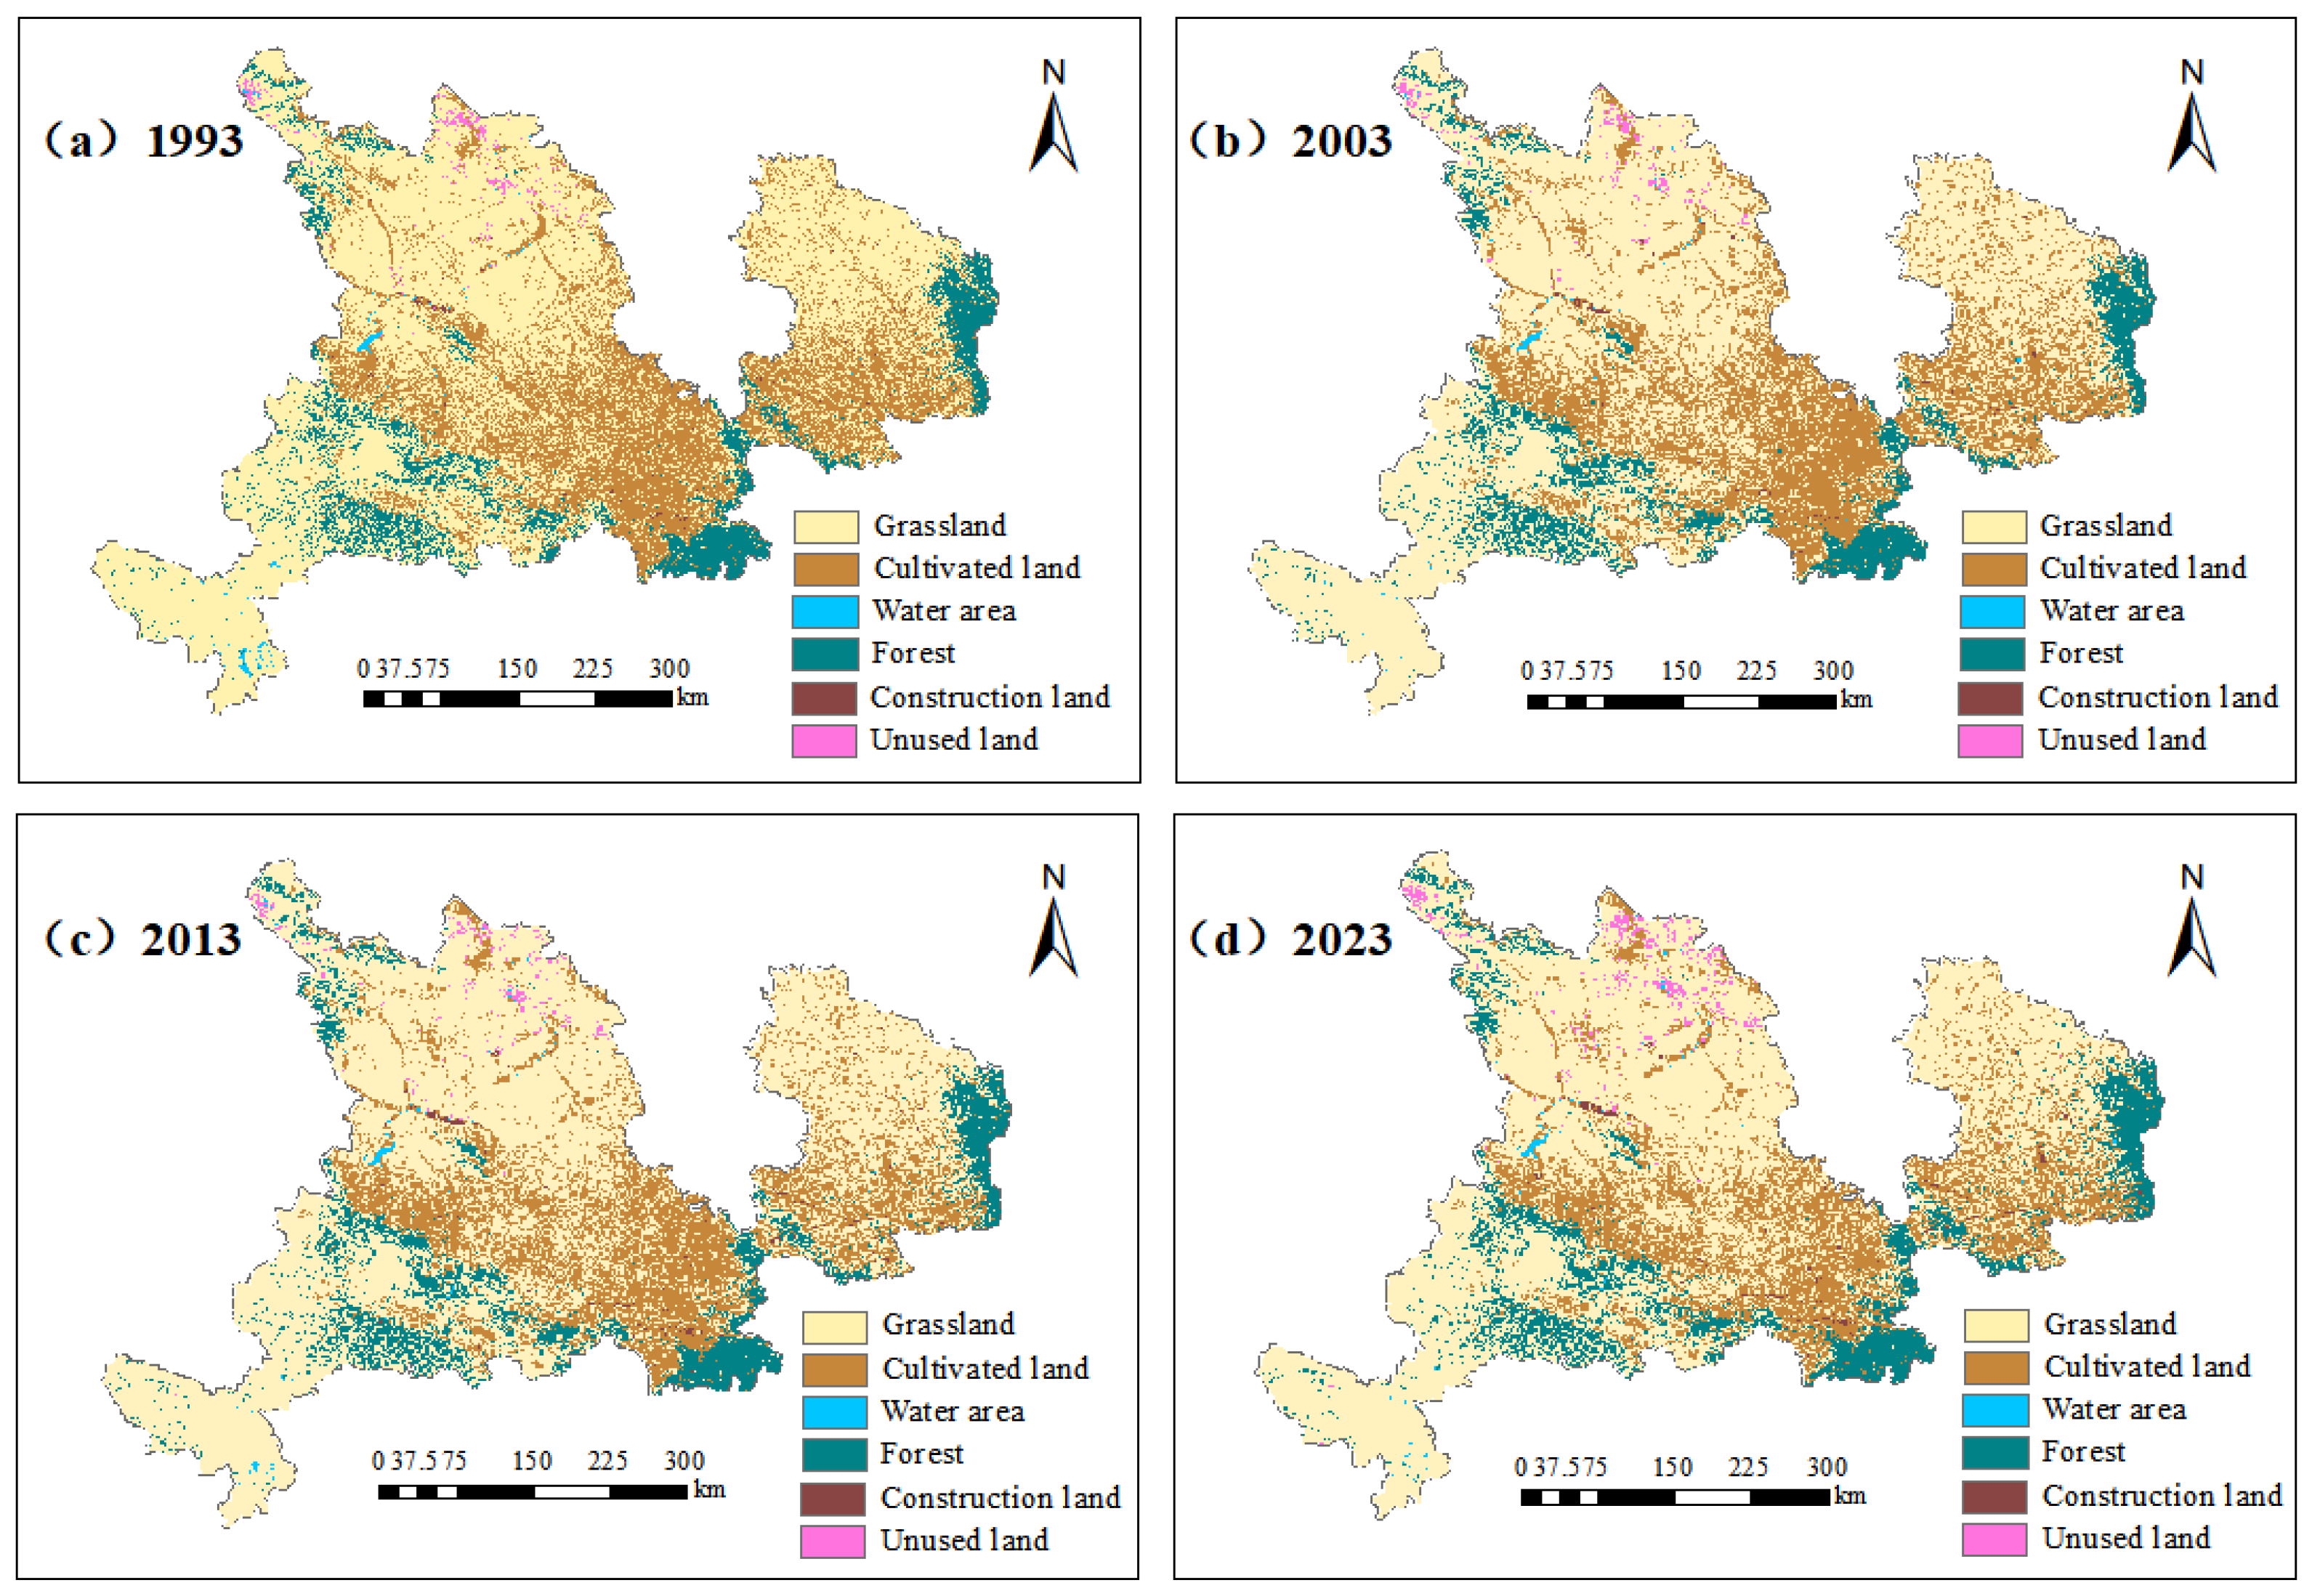
According to ArcGIS software analysis results, the land use structure in this region underwent systematic evolution from 1993 to 2023, showing overall characteristics of continuous decrease in cultivated land area, steady growth in forest area, significant expansion of construction land, and stable maintenance of grassland as the dominant land type (Figure 3). In 2023, the land use proportions were as follows (Table 4): grassland (64.16%), cultivated land (21.55%), forest (12.48%), unused land (1.1%), construction land (0.45%), and water bodies (0.25%).
Grassland and cultivated land are the primary land types, collectively accounting for over 85% of the total area across all four years. Grassland is distributed throughout the study area, maintaining an average coverage of 62.88%; cultivated land is distributed in the Longzhong Loess Plateau region in the south, with proportions ranging from 21% to 26%. In contrast, Construction land and water bodies occupy relatively small proportions, at 0.2–0.45% and 0.19–0.33%, respectively.
Over the past 30 years, cultivated land experienced the greatest change, decreasing by 6421.99 km2. Forest area change ranked second, showing a continuous upward trend with a cumulative increase of 541.58 km2. Construction land also continuously expanded by 92.8 km2 [38]. These change patterns are primarily attributed to the continued implementation of national ecological restoration projects, specifically the “Grain for Green” program, coupled with rapid regional urbanization, infrastructure construction, agricultural structural adjustments, and ecological protection policies. The reduction in cultivated land and subsequent increase in forest and grassland have positively enhanced regional water conservation capacity, improved soil retention functions, and maintained ecological security in the upper reaches of the Yellow River Basin. However, the continued expansion of construction land has also simultaneously intensified pressure on ecological space encroachment. Furthermore, fluctuations in water body area and increases in unused land indicate persistent risks associated with water resource security and localized land degradation, respectively (Figure 3).

3.2. Analysis of Land Use Type Change Dynamics

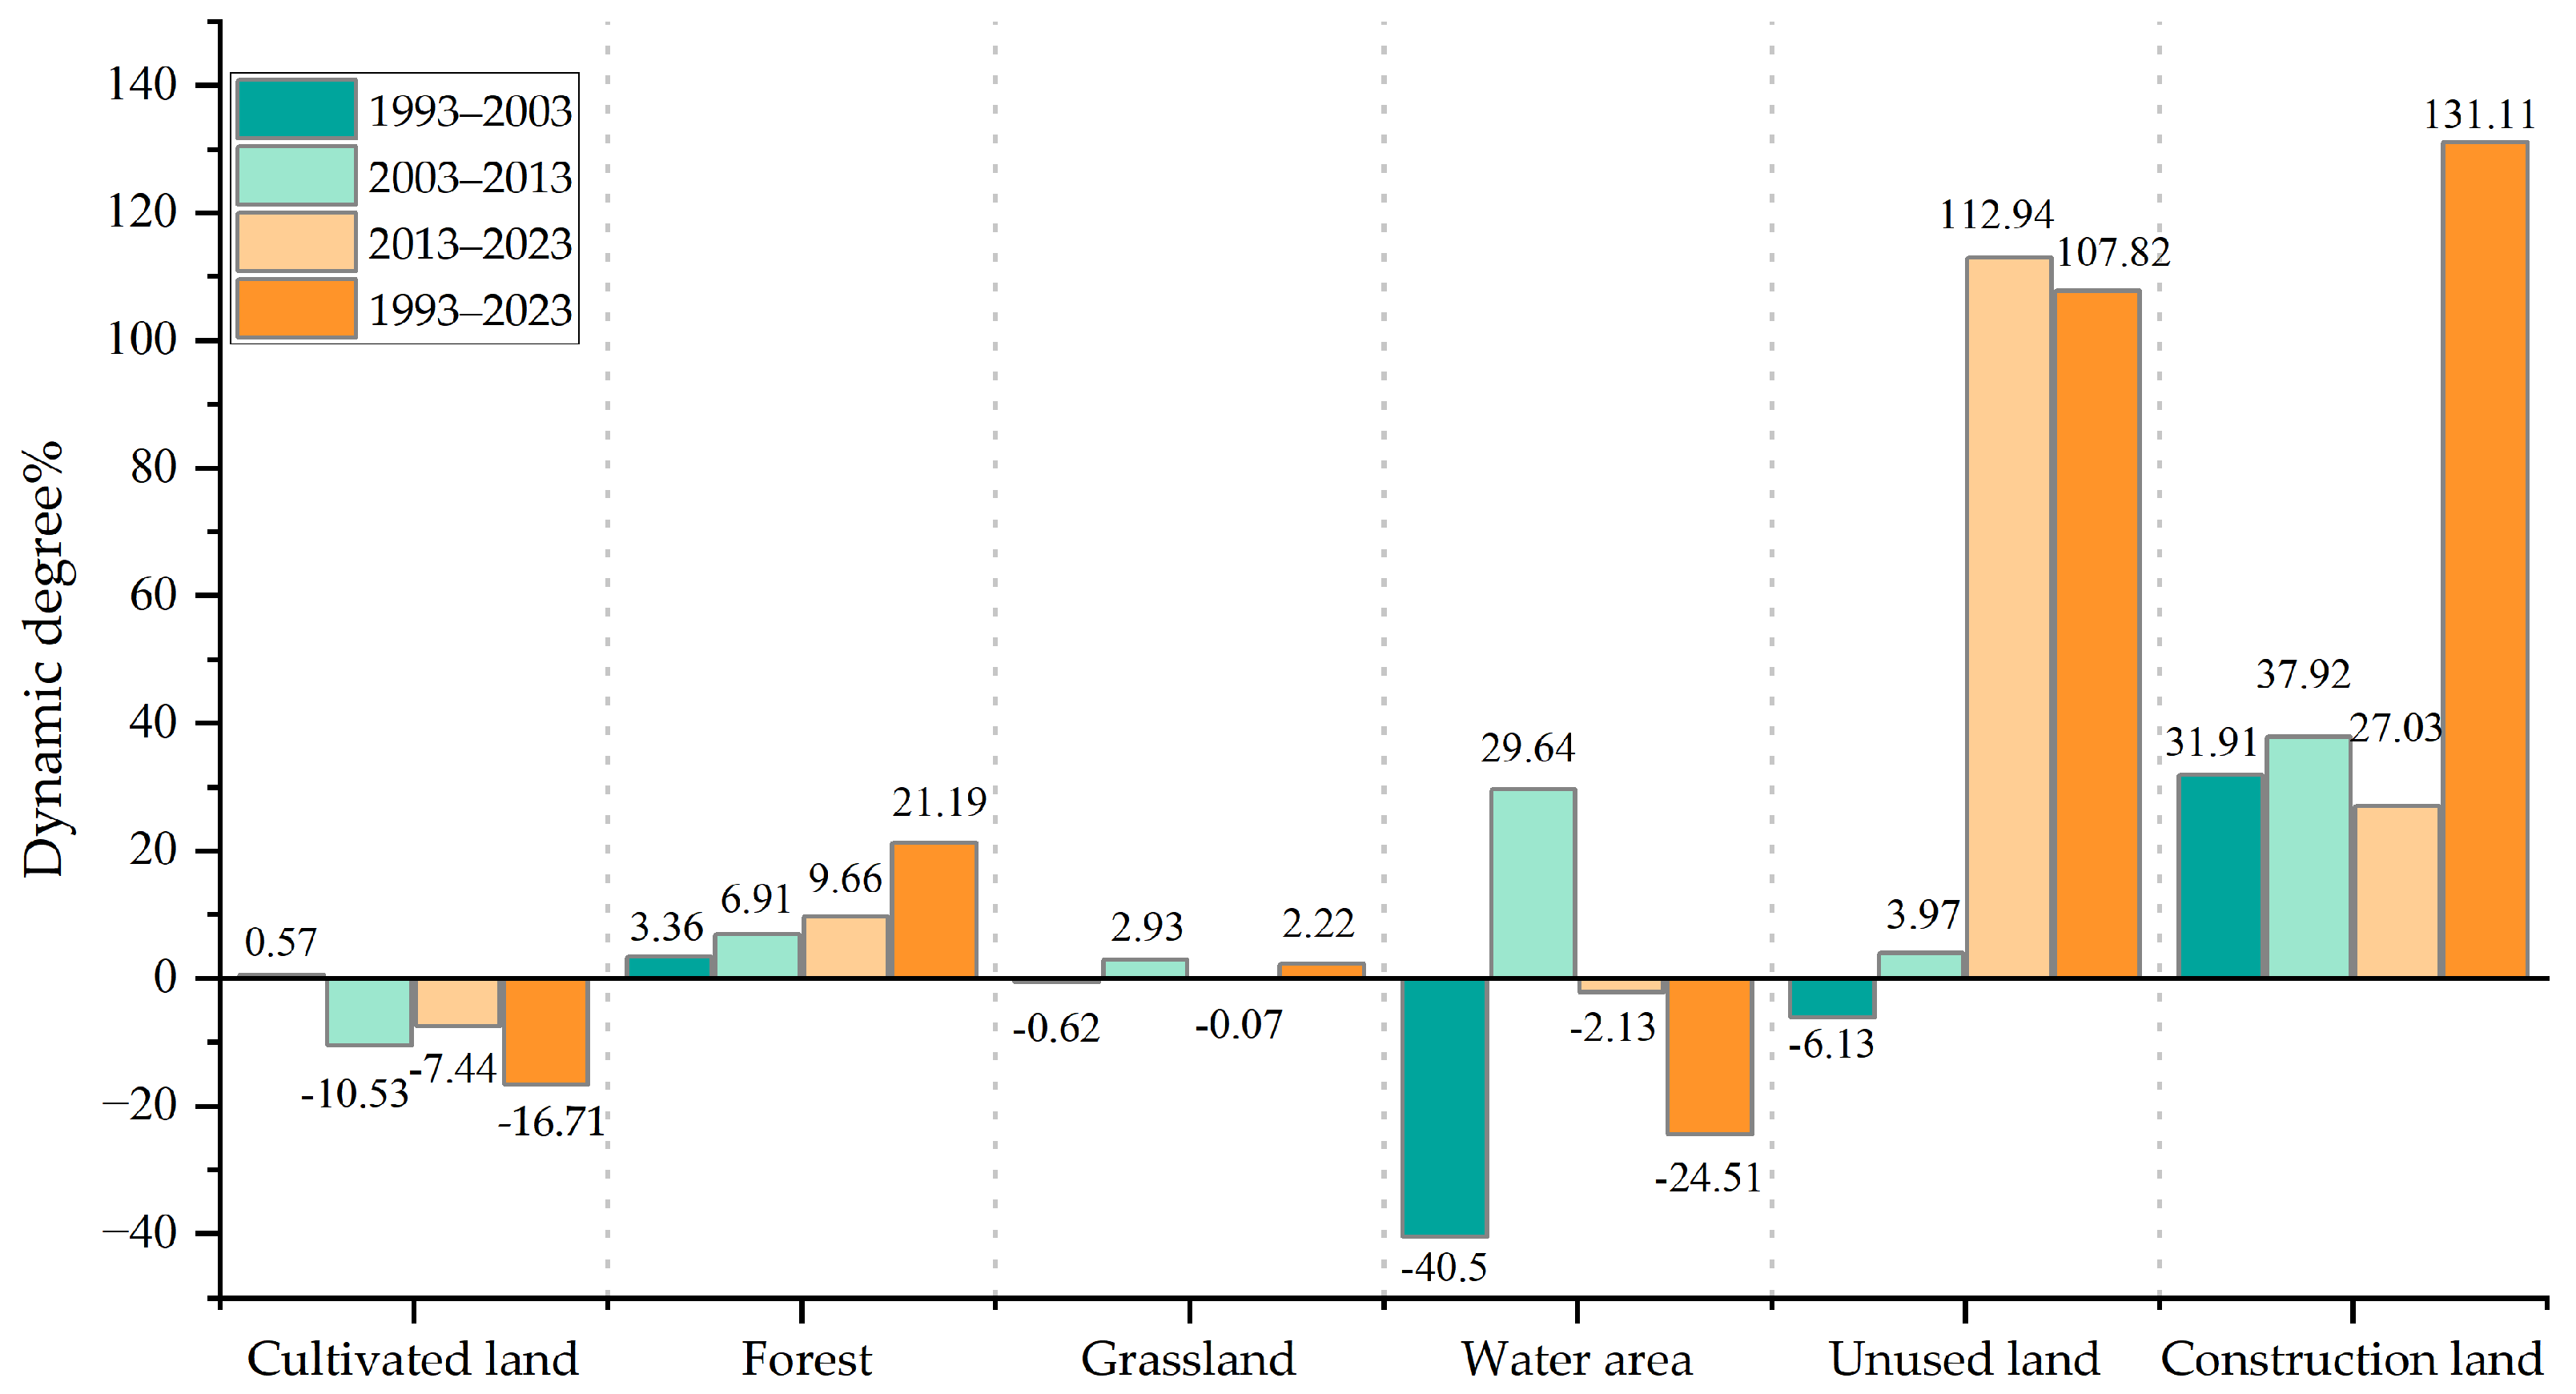
Dynamic degree analysis (Figure 4) reveals that land use in the study area underwent significant phased transformations between 1993 and 2023. Construction land showed the most significant dynamic change, increasing by 131.11% over the past 30 years. The main driving factors for this change were land demand growth during regional urbanization and industrialization processes; followed by unused land and water bodies, with unused land increasing by 107.82% over the past 30 years and water bodies decreasing sharply by 40.5%. Due to the effective implementation of ecological initiatives, such as the “Grain for Green” program [39], cultivated land initially increased by 0.57% (1993–2003), but subsequently declined by 10.53% and 7.44% in the following two decades. Concurrently, forest land expanded by 21.19% over the 30 years period, tending toward stabilization or localized recovery [40]. Furthermore, these land use transitions have had profound impacts on basin scale ecological development. On one hand, forest and grassland restoration facilitates the enhancement of key ecosystem services, such as water conservation and soil retention. On the other hand, the disorderly sprawl of construction land and competing water resources demands exert potential pressures on ecological security patterns.

3.3. Analysis of Land Use Type Conversion Trends and Transfer Areas

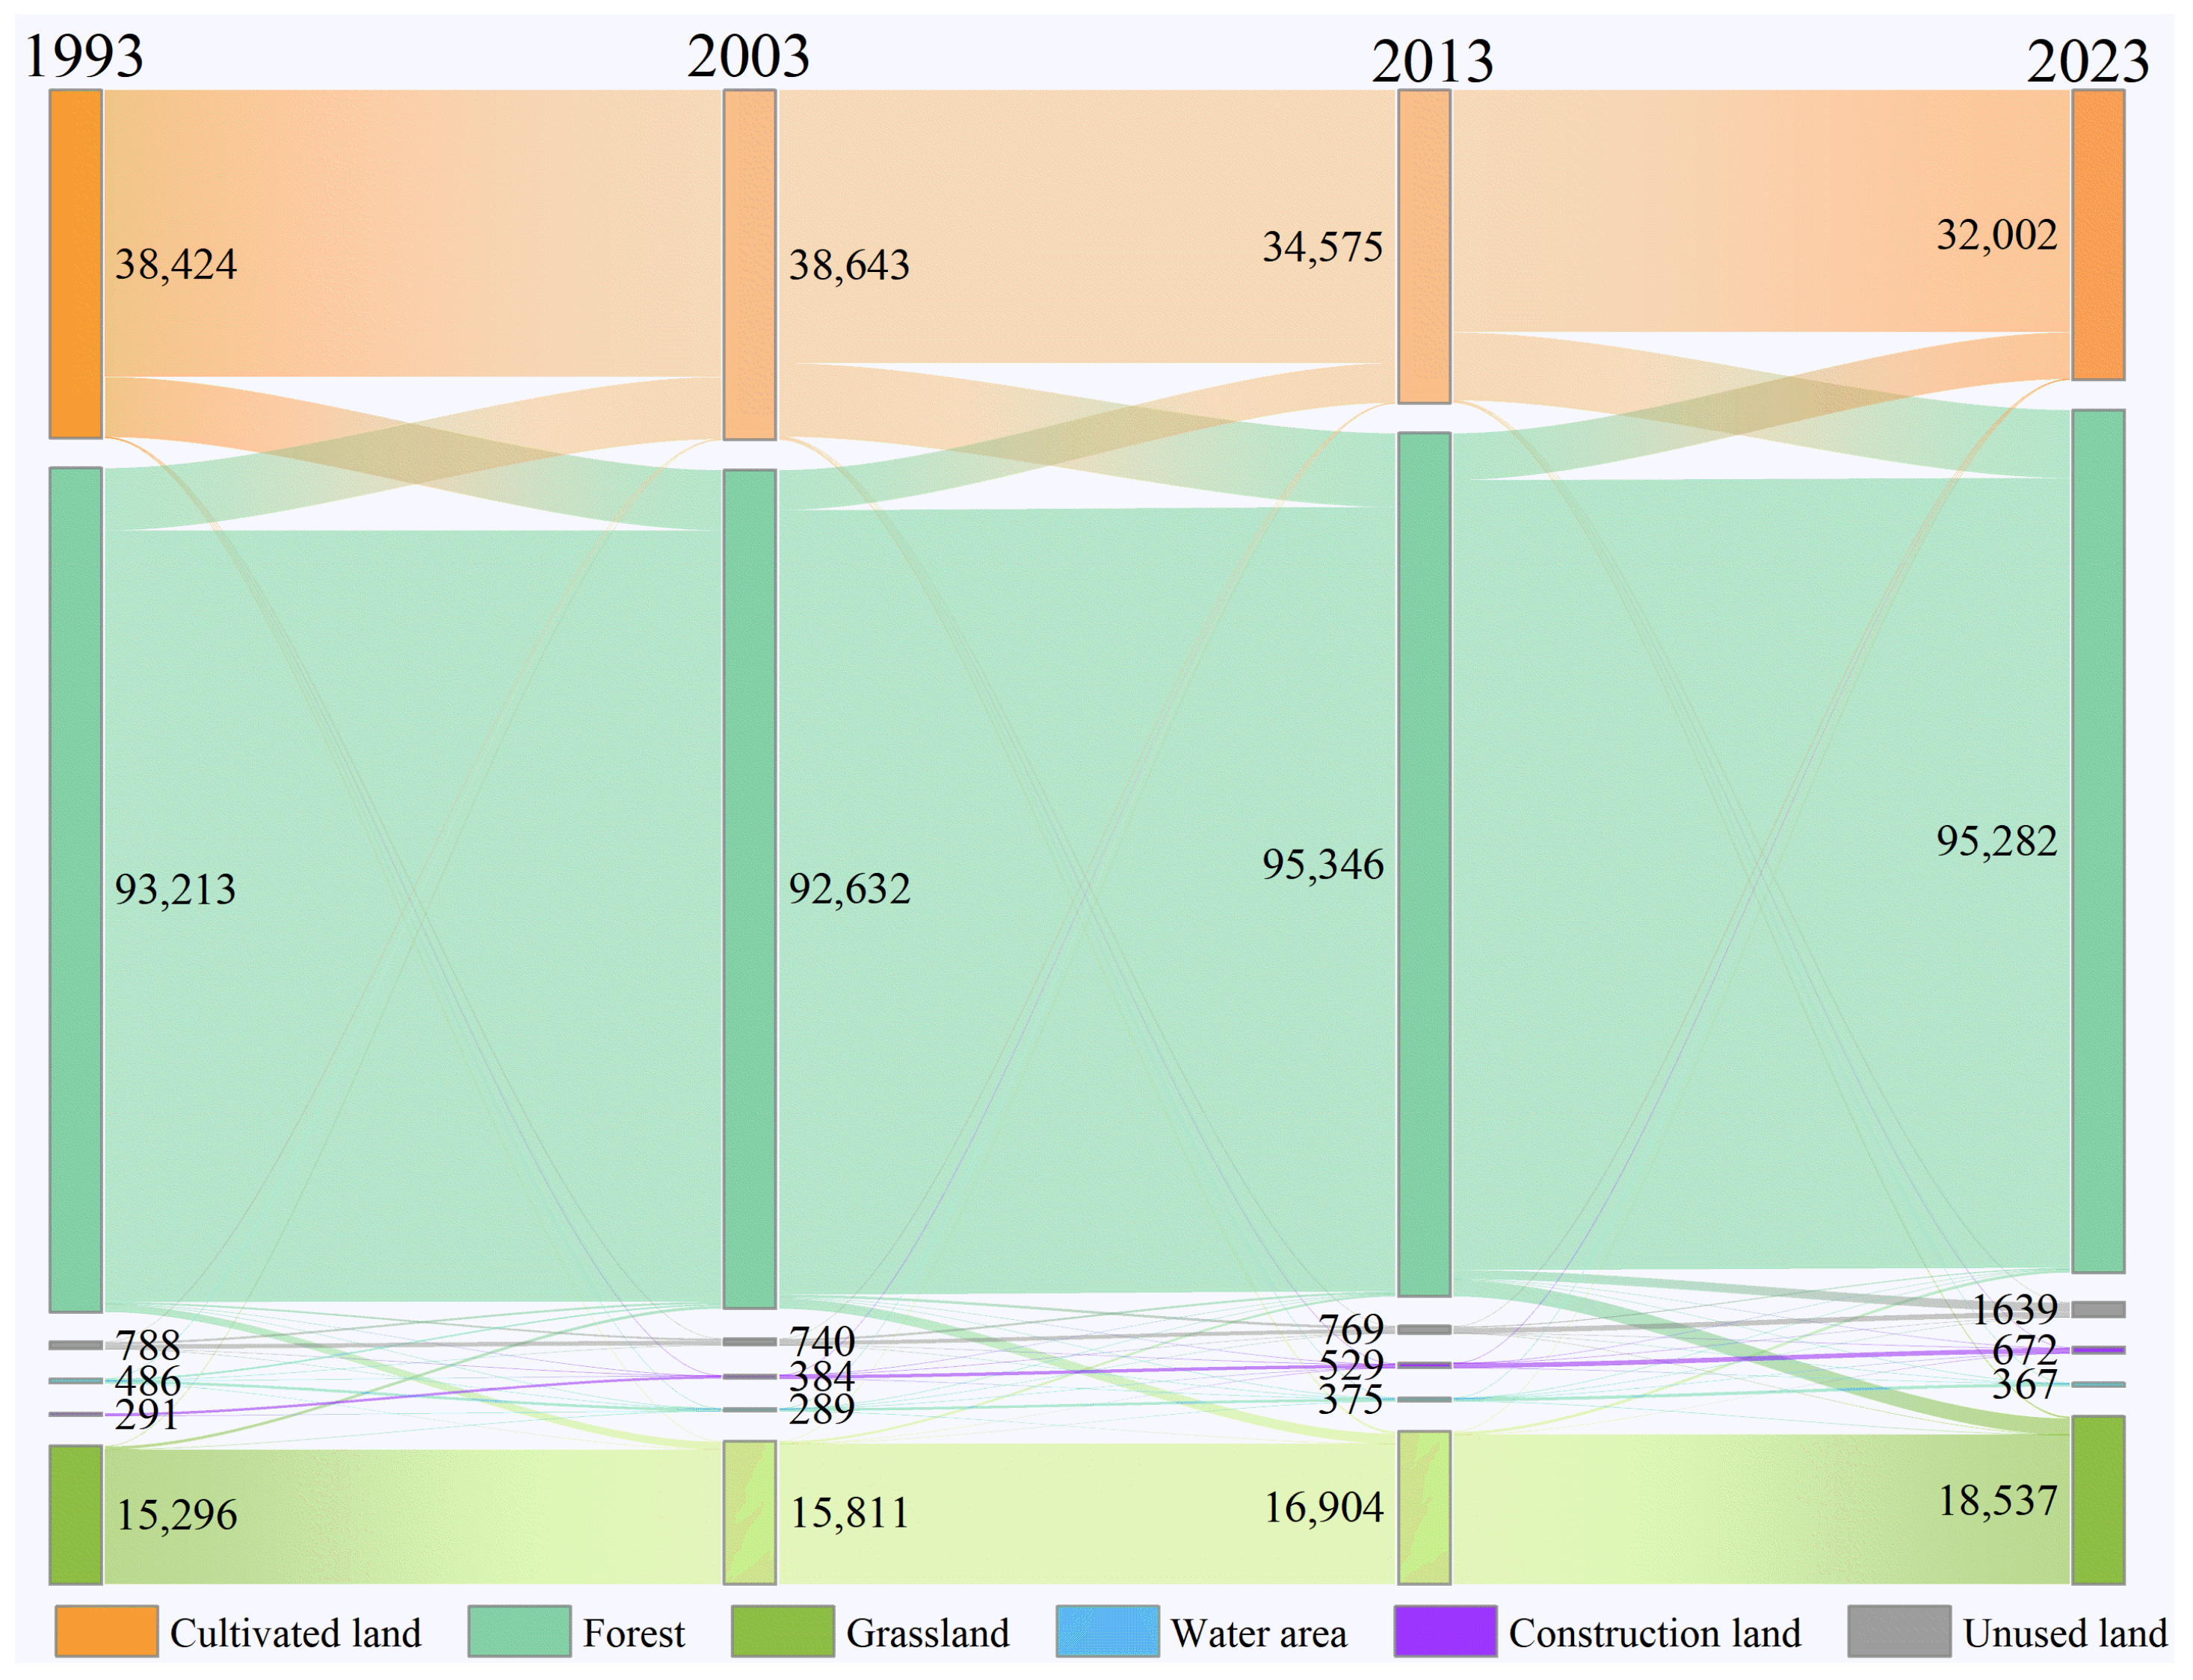
During the observation period, significant transitions occurred among various land use types in the Yellow River Basin (Figure 5). In terms of overall structural changes, there was a distinct restructuring of cultivated land, forest, grassland, water bodies, construction land, and unused land. The expansion of construction land primarily originated from the conversion of cultivated land and select unused land. Simultaneously, the conversion of cultivated land to forest and grassland reflected evolving land use patterns driven by the combined effects of urbanization and ecological restoration projects. The causes of the above changes mainly include two aspects. On one hand, the continued advancement of urbanization and infrastructure construction resulted in increased demand for construction land. This led to the occupation of large amounts of cultivated land. while unused land, serving as reserve land resources, was also partially developed. On the other hand, national ecological protection policies such as the Grain for Green Program [41,42,43] encouraged the conversion of some sloping farmland and cultivated land in ecologically fragile areas to forest and grassland. This enhanced regional soil and water conservation functions and ecosystem stability. Furthermore, climate change and water resource reallocation have also had impacts on the dynamic changes in water body area.
A significant bidirectional conversion exists between cultivated land and grassland, with a predominant trend of grassland encroaching upon cultivated land. Between 2013 and 2023, the conversion flow from cultivated land to grassland increased substantially, driven primarily by the intensified implementation of ‘Grain for Green’ policies. While forest area remained relatively stable (15,296.4–18,537.43 km2), its growth accelerated after 2013, highlighting the efficacy of ecological restoration projects. Conversely, construction land expanded by 107.8% (from 788.43 km2 to 1638.51 km2), fueled largely by the loss of cultivated land and grassland. Changes in water bodies and unused land were minimal, although a slight increase in the latter may indicate localized land degradation.”

3.4. Landscape Pattern Change Analysis

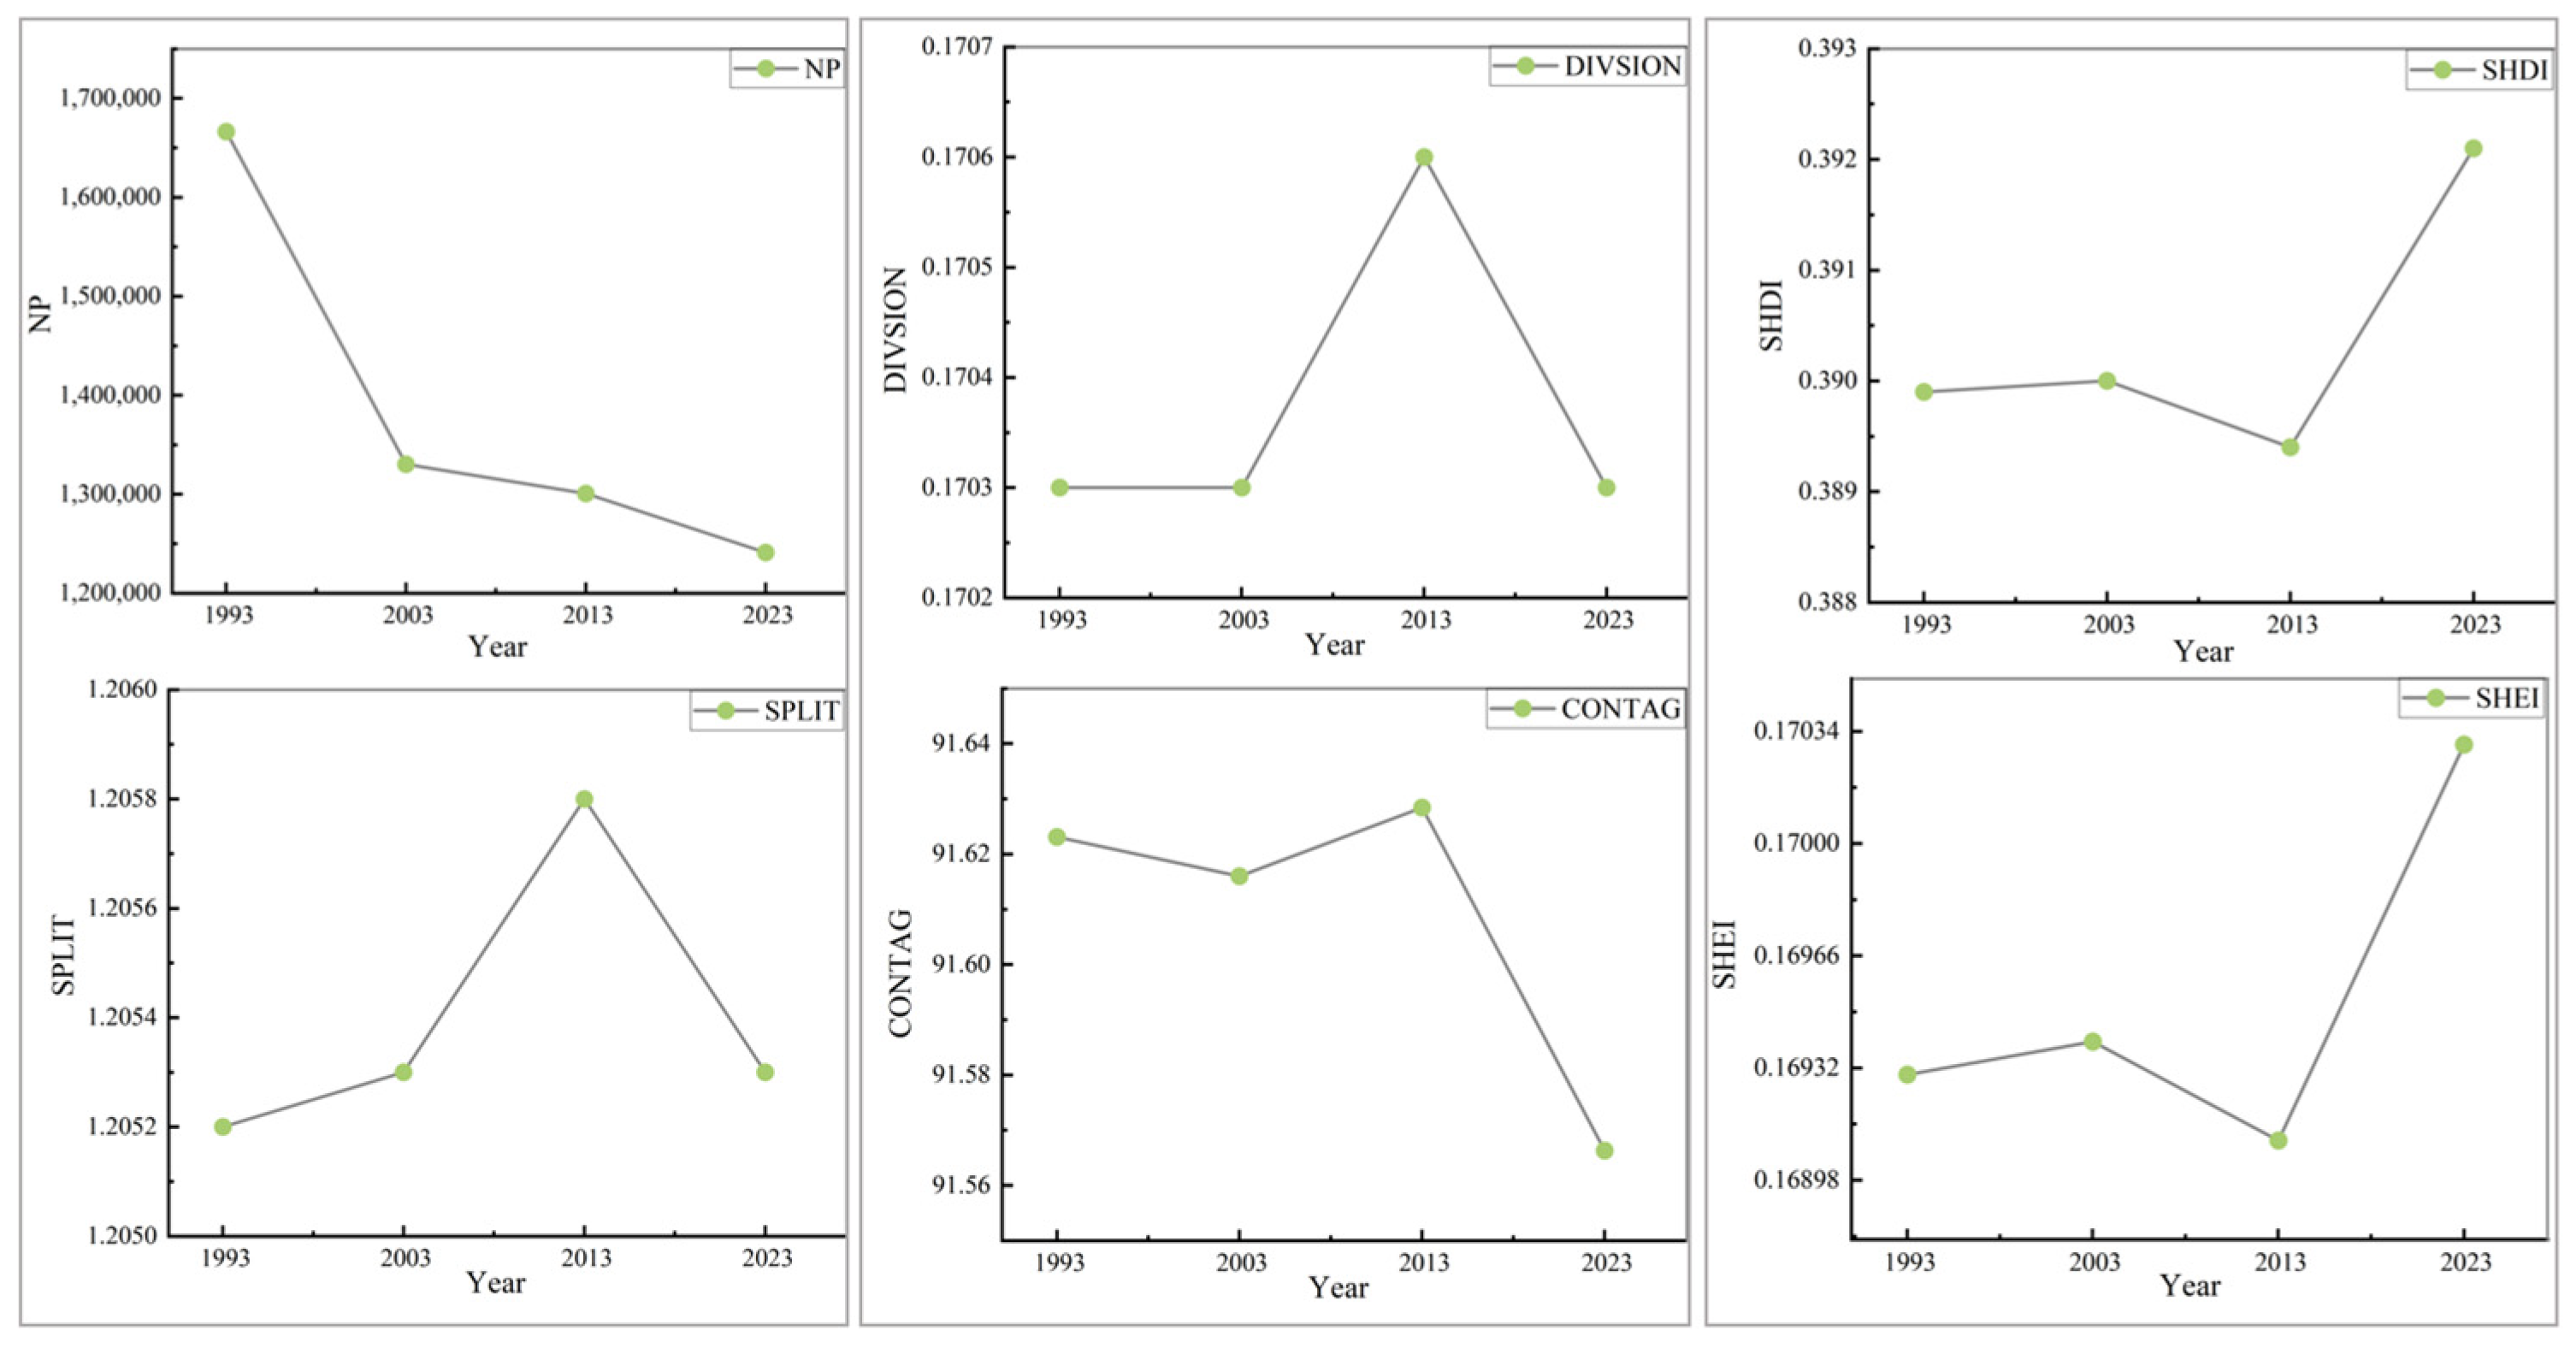
The study area’s landscape pattern exhibited distinct phased evolutionary characteristics over the past 30 years (Figure 6). Landscape fragmentation first increased and then decreased overall. This was manifested by a reduction in the number of patches and an increase in average patch area. Specifically, the DIVISION index showed a fluctuating trend; it rose from 2003, peaked in 2013, and subsequently receded by 2023. This pattern suggests that the degree of fragmentation was mitigated to some extent under recent policy drivers. The underlying reason for this landscape element integration is likely the dual influences of climate change and anthropogenic disturbances. Conversely, the CONTAG index showed a continuous decline from 1993 to 2023. Although the decrease was slight, the trend was clear: it reveals a growing tendency toward landscape spatial dispersion. In terms of landscape diversity, both the Shannon’s diversity index and the Shannon’s evenness index displayed a U-shaped pattern. They rose slowly between 1993 and 2003, reached a trough in 2013, and then rebounded significantly to high levels. This enhancement in landscape heterogeneity suggests positive effects on overall ecosystem stability and key ecological processes.

Spatial Analysis of Landscape Pattern Indices

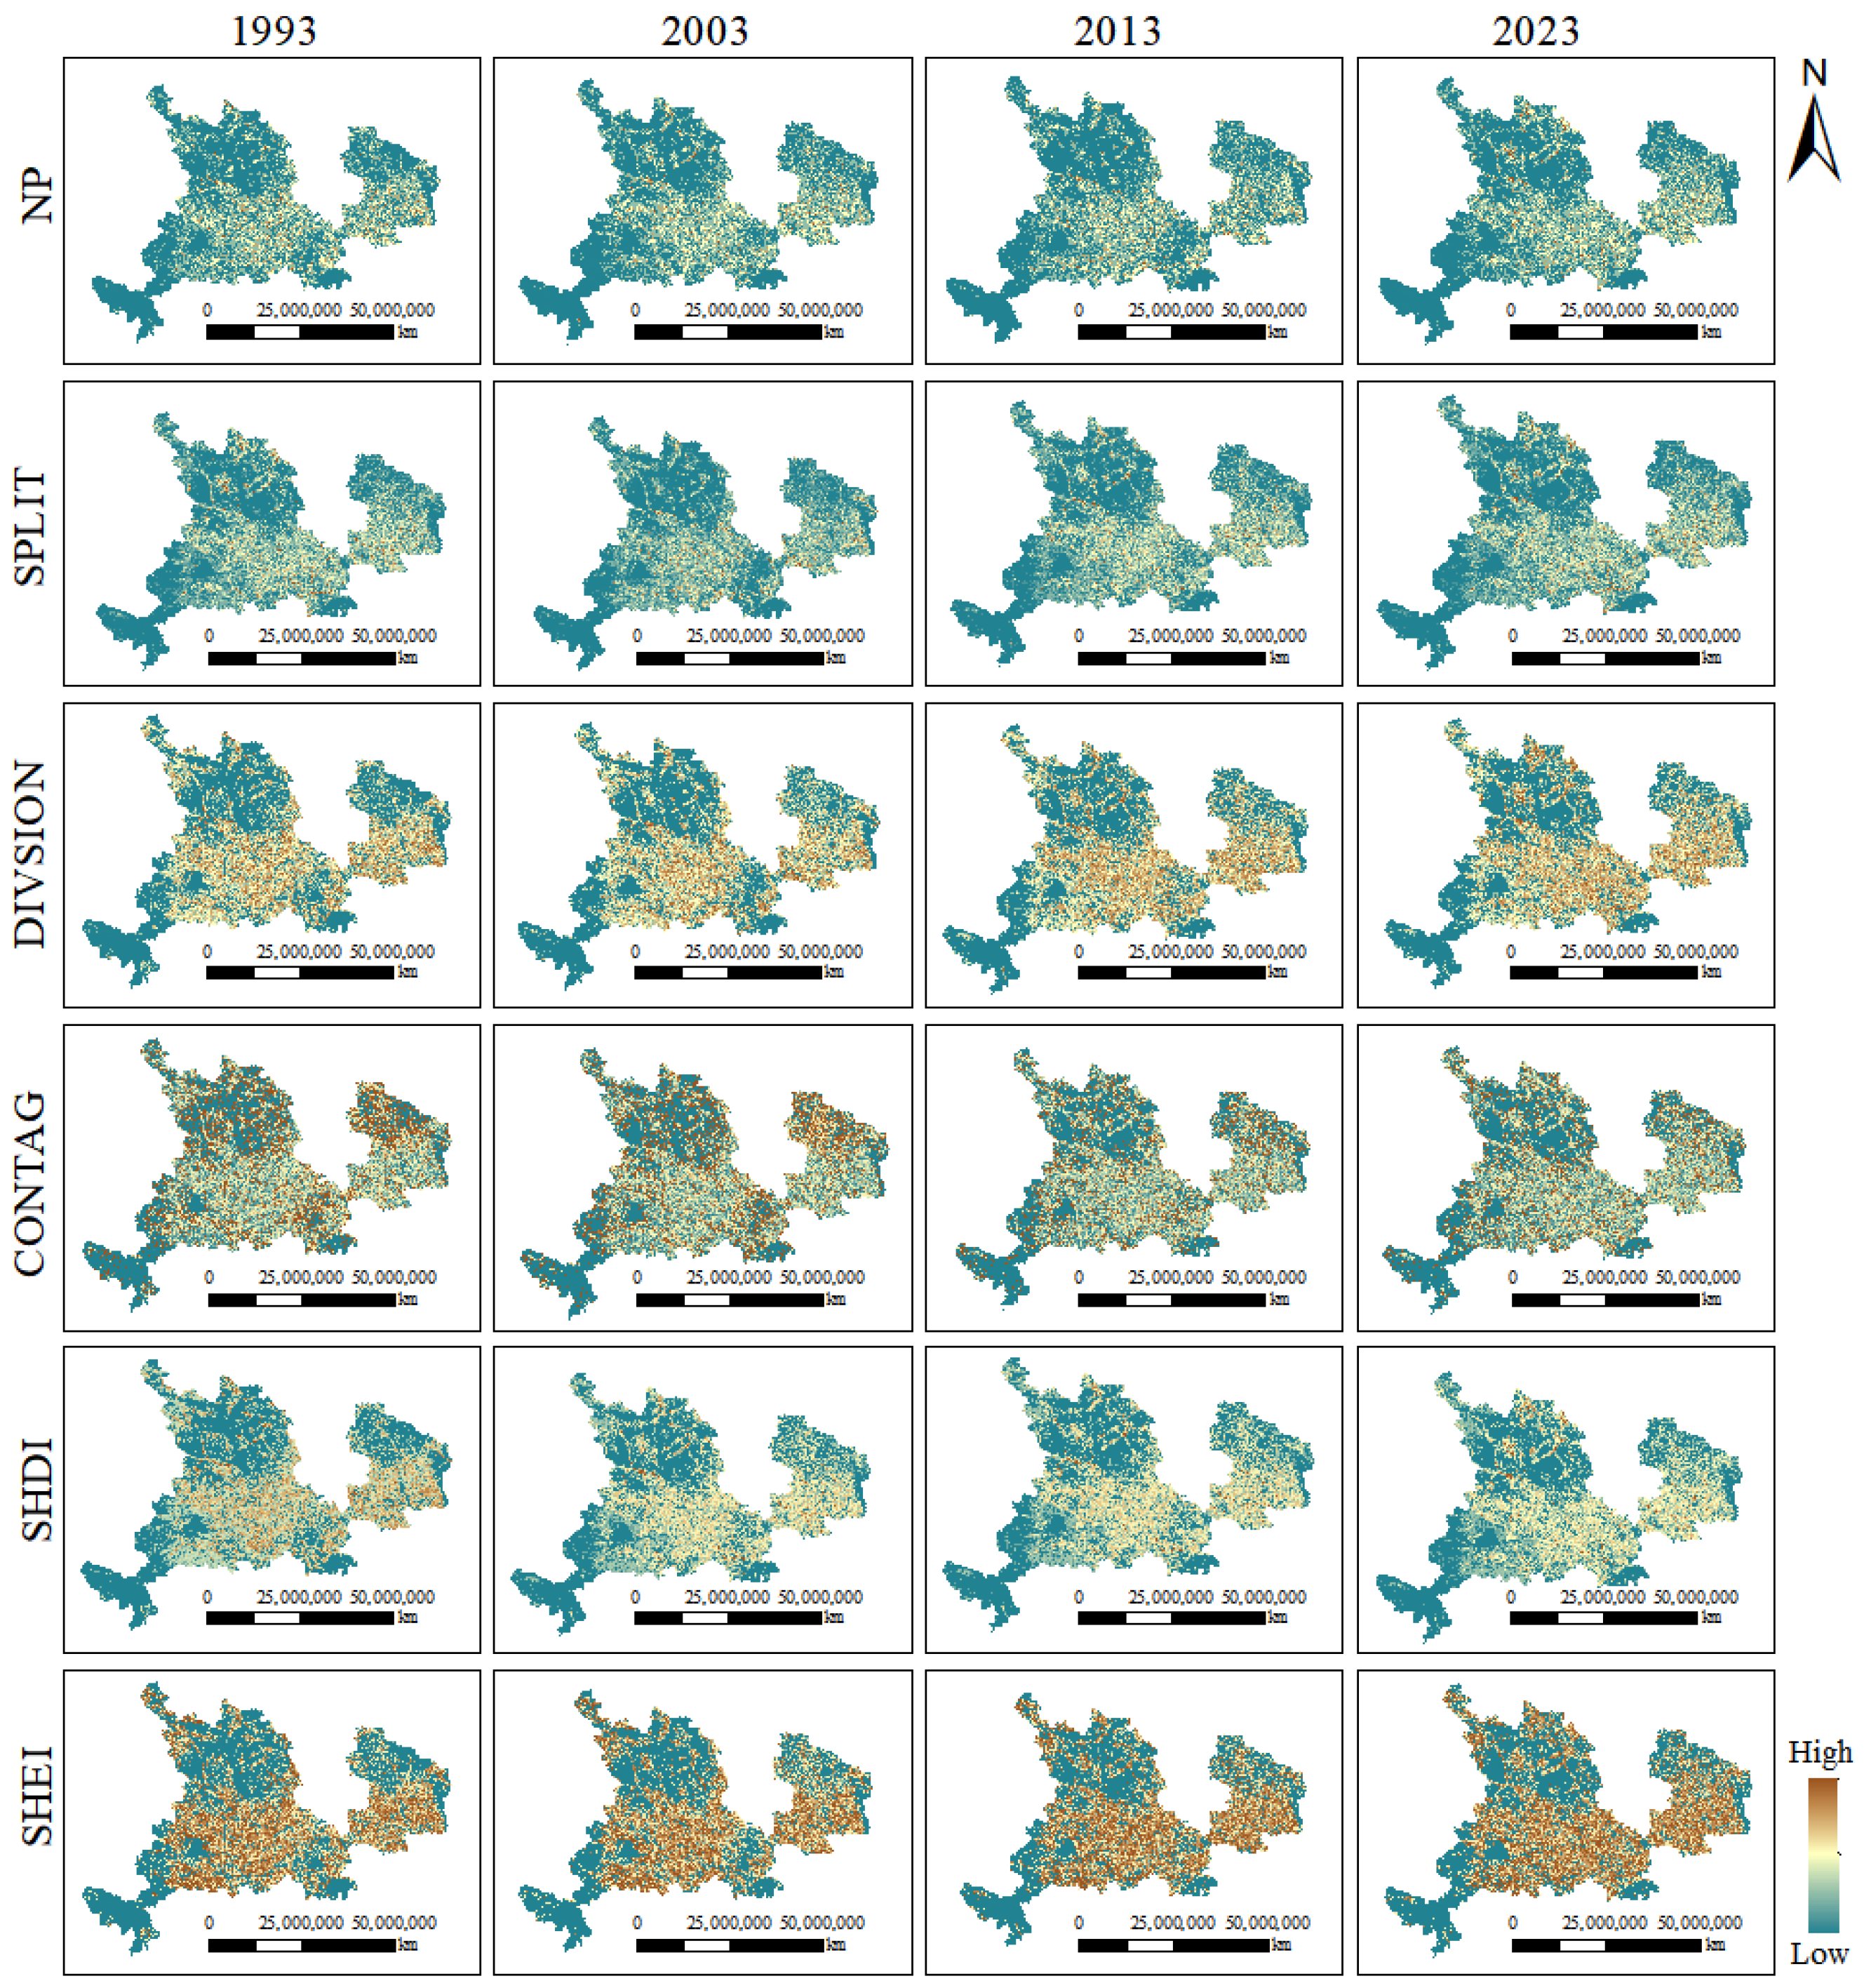
Visualization of landscape pattern indices (Figure 7) revealed that the NP index transitioned from highly dense to sparse. In contrast, the SPLIT index exhibited a spatial distribution inverse to the NP index, fluctuating from sparse to dense before thinning again. The impact of anthropogenic pressures has become increasingly prominent. Urban expansion, agricultural development, and infrastructure construction have triggered natural habitat fragmentation, while shifting land use patterns have directly altered landscape composition and spatial configuration. DIVISION index high-value areas covered a relatively wide area, mainly distributed in the southeast, with high-value areas increasing in 2013; CONTAG index fluctuated moderately in the first 30 years and declined in 2013. Landscape fragmentation and reduced connectivity may weaken ecosystem stability and service functions, affecting biodiversity maintenance and soil and water conservation capacity. The implementation of ecological protection and restoration projects has also had positive regulatory effects on landscape patterns in some areas, partially mitigating the negative impacts of anthropogenic disturbance. SHDI index high-value areas were widely distributed and have increased in the past decade, mainly distributed in Tianshui, Dingxi, and Gannan in the southeast. SHDI index and SHEI index showed similar spatial distributions, with SHEI index high-value areas being more concentrated. The increase in diversity reflects, to some extent, the richness of habitat types; however, concurrent fragmentation and loss of natural patches may trigger risks of ecosystem degradation. Therefore, a scientific assessment of landscape pattern evolution, coupled with the implementation of sound ecological spatial management, is of great significance for promoting ecological protection and high-quality development in the Yellow River Basin.

3.5. Ecological Source Areas Distribution

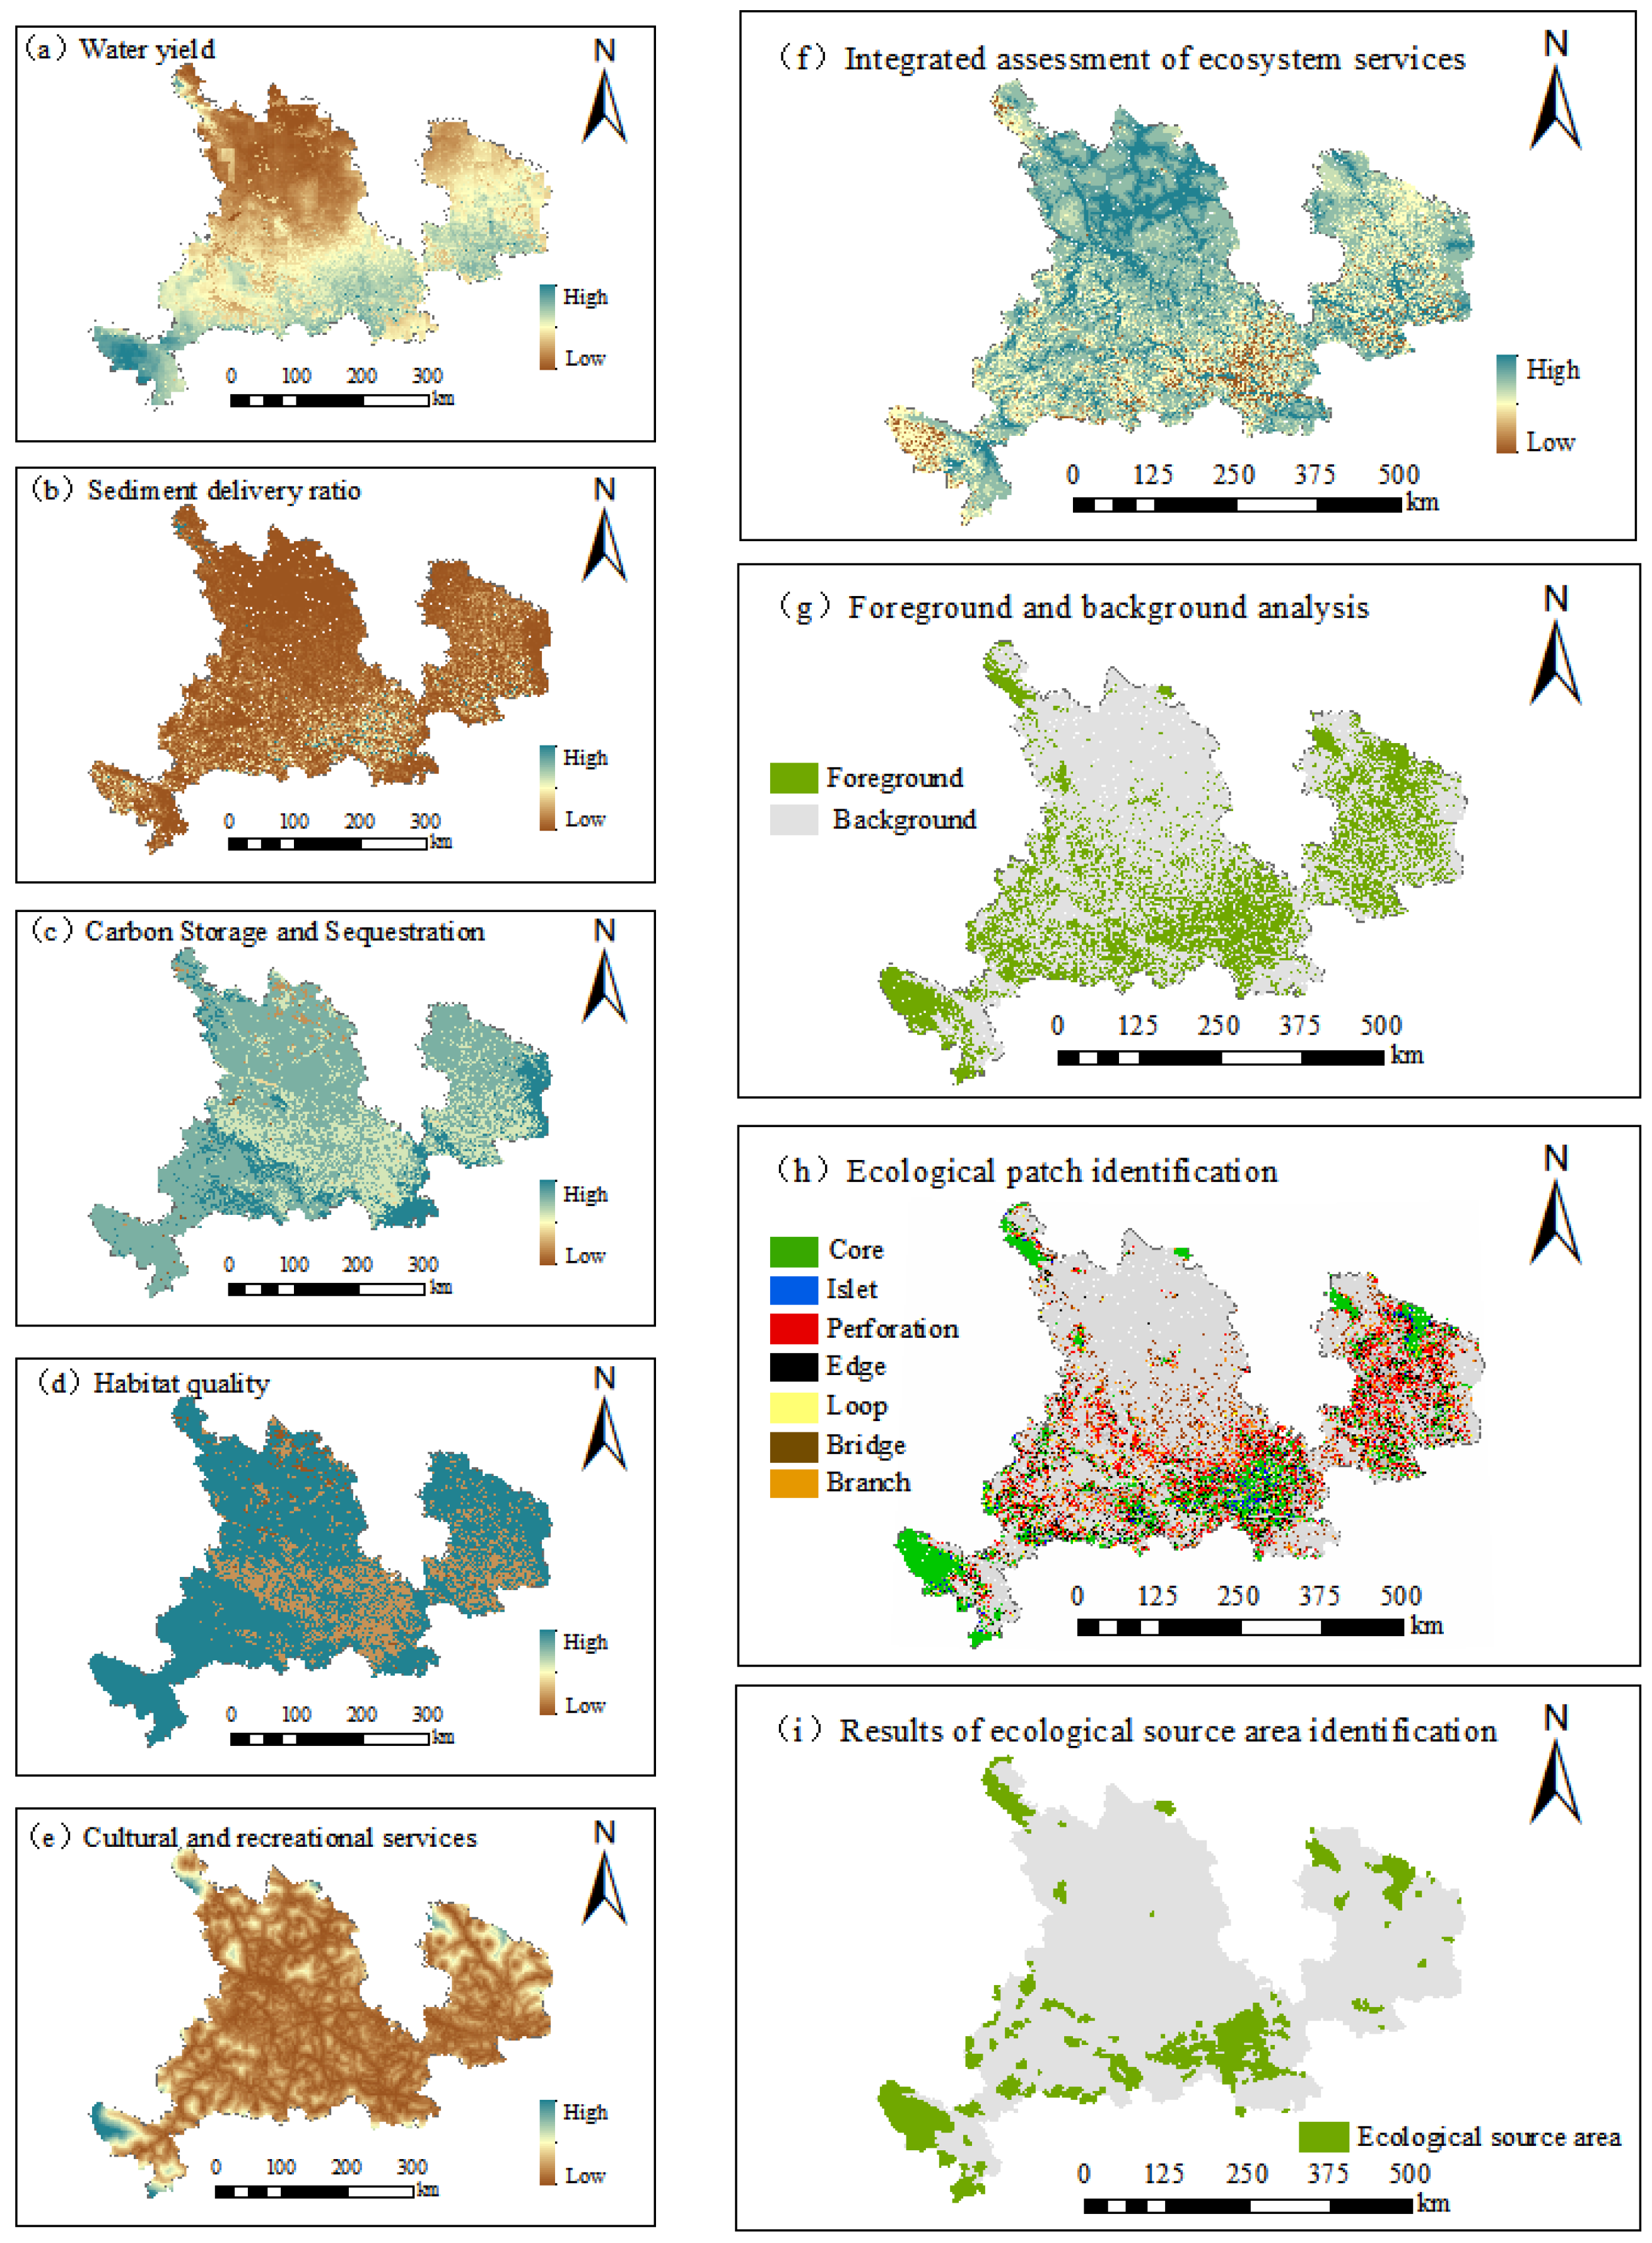
Ecosystem services were normalized and overlaid with equal weights to generate a comprehensive assessment map (Figure 8f). Subsequently, Morphological Spatial Pattern Analysis (MSPA) was employed to extract core areas, from which patches with an area exceeding 5 km2 were identified and selected as ecological source areas. Analysis of ecological source areas identification results (Figure 8i) identified a total of 260 ecological source areas, with a total area of 15,854.63 km2, accounting for approximately 10.64% of the total area of the study area. From the perspective of spatial distribution, ecological source areas in the Gansu section are mainly distributed in the southern and southeastern regions of the Yellow River, such as the Gannan Plateau, the southeastern part of the Longzhong Loess Plateau, and the Ziwuling area in Longdong. On one hand, these areas have large terrain relief and abundant precipitation, which is conducive to vegetation growth and water conservation; on the other hand, the south is influenced by the southeast monsoon, suitable for forest and alpine meadow development, and ecological source areas are less disturbed by infrastructure development, thus forming a virtuous cycle [40].
In contrast, ecological source areas are sparsely distributed in the north and northwest, such as Baiyin and Jingtai, where ecosystems are relatively fragile. These are arid desert and loess hilly areas with intense evaporation [44], scarce water sources, and limited ecological functions. Vegetation is dominated by desert steppe with low ecological carrying capacity. Natural vegetation in the northern and central regions has been damaged due to agricultural reclamation, urban construction, and mining development, leading to declining ecological functions. Consequently, landscape fragmentation is significant, making it difficult to form large-scale ecological patches.
Ecological source areas also show characteristics of distribution along water bodies, mainly distributed along the Yellow River mainstream and its tributaries (such as the Tao River, Daxia River, and Huangshui), as well as in areas including the eastern section of the Qilian Mountains and the southern margin of the Longzhong Loess Plateau. The spatial distribution is uneven, showing a pattern of more in the south and less in the north, sparse in the west and dense in the east. These areas have high vegetation coverage and complete ecosystems, serving as core areas for water conservation and biodiversity maintenance. ecological source areas are mostly concentrated in mountainous and hilly areas with higher elevations and greater terrain relief, such as the Qilian Mountains and Ziwuling, while fewer ecological source areas are distributed in river valley plains and low-elevation areas with high-density anthropogenic disturbances.

3.6. Ecological Resistance Surface Construction

Analysis of the ecological resistance surface (Figure 9) reveals an overall spatial gradient, increasing from the southeast to the northwest. High resistance areas are primarily concentrated along the northern foothills of the Qilian Mountains and the northwestern margin of the Longzhong Loess Plateau. These areas are characterized by desert steppe and barren land with sparse vegetation, which weakens ecosystem self-maintenance and limits species dispersal; terrain is rugged with higher elevations, limiting the continuity of ecological processes and energy flow. Road network density in this area is relatively low, with human disturbance types mainly including mineral exploitation and overgrazing, which have exacerbated habitat degradation and landscape fragmentation, resulting in higher ecological resistance in the study area.
Low resistance areas are mainly distributed in the southern Longdong Loess Plateau, Gannan Plateau, and river valley areas along the Yellow River mainstream. These areas have better vegetation conditions, with forests, shrubs, and high-coverage grassland as the main land cover types, with NDVI values mostly above 0.5, providing good habitat quality and ecological connectivity. Terrain is relatively gentle, especially in river valley areas, where dense water system networks form natural ecological corridors, effectively promoting material flow and species migration. Although roads and residential areas are relatively concentrated, agricultural and urban land is mostly distributed in clusters, without forming large-scale, continuous barrier effects.

3.7. Ecological Corridor Extraction and Pinch Point Identification

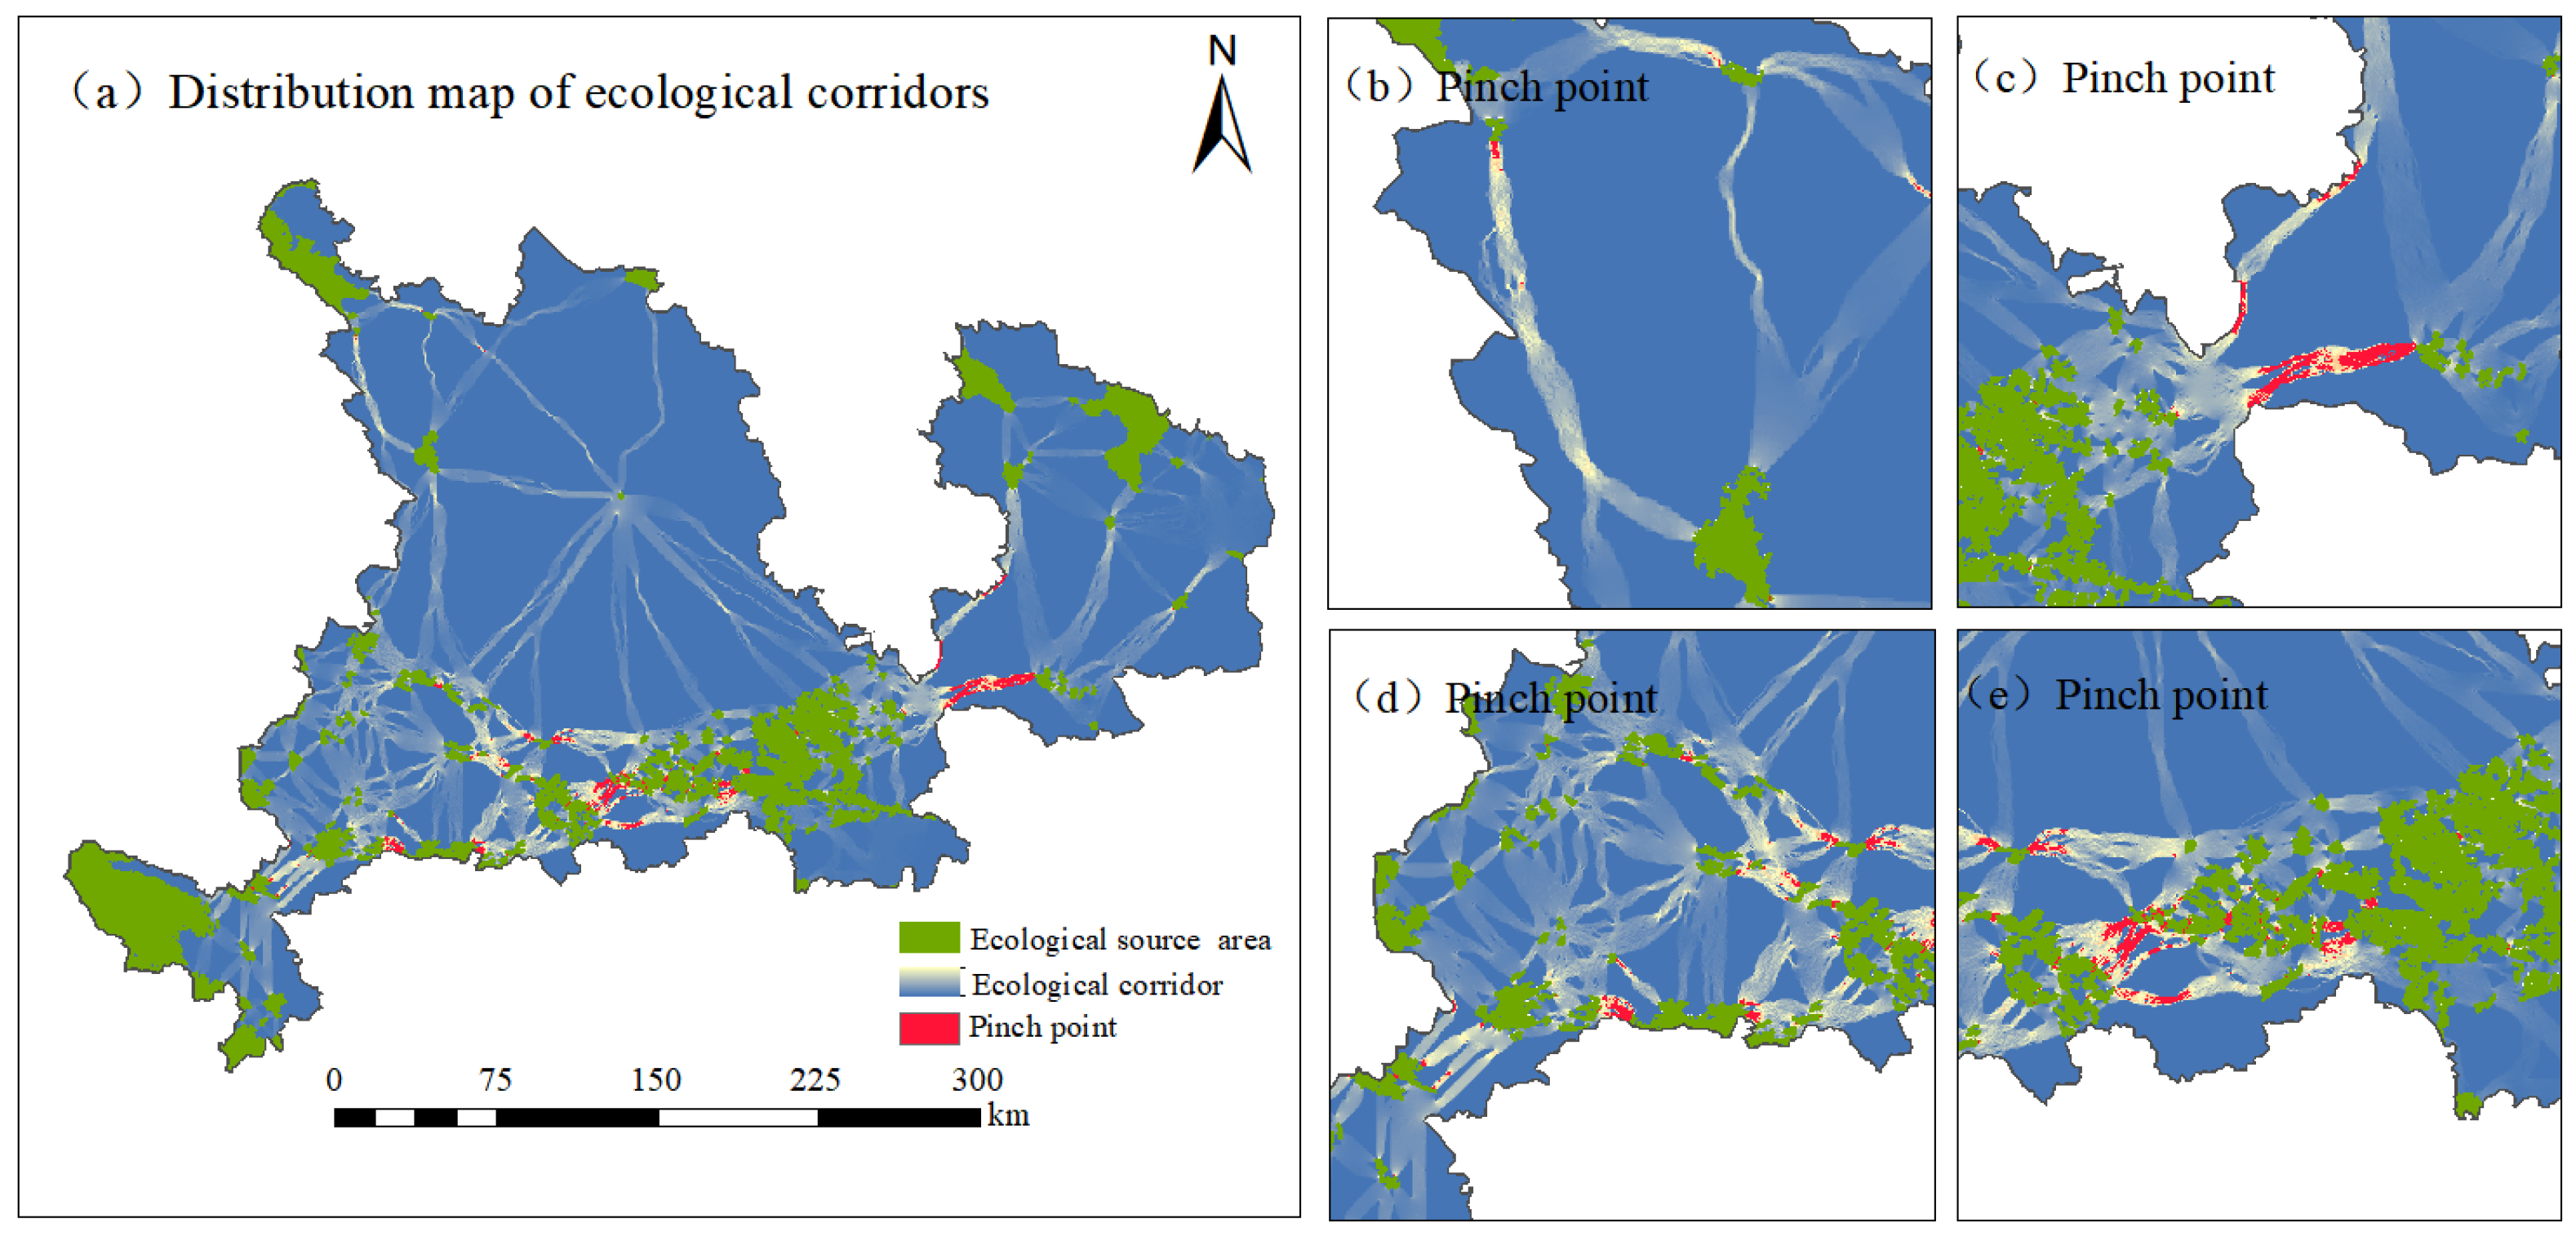
Ecological corridors in the study area exhibit distinct spatial clustering (Figure 10). They primarily extend in a belt pattern along the Yellow River mainstream and its major tributaries, forming a longitudinal connectivity network anchored by the river system. In densely urbanized areas like Lanzhou and Baiyin, while ecological corridor density is high, connectivity is significantly hindered by human disturbance, leading to fragmentation and segmentation. Conversely, in ecological function zones such as the Gannan Plateau and the eastern Qilian Mountains, ecological corridors are continuous and intact. These ecological corridors form horizontal links between high-elevation meadows, forests, and wetlands, effectively sustaining water conservation and biological migration functions.
From a structural perspective, the ecological corridor system in this area has a three-level spatial architecture of “core nodes-radiating ecological corridors-infiltrating patches.” Core ecological source areas are mostly distributed in nature reserves and water source protection areas, ecological corridor width and direction are jointly constrained by terrain relief and land use types, among which north-south ecological corridors play a key role in alleviating habitat isolation effects. Ecological corridors in the central arid area are sparse and show prominent vulnerability.
A comprehensive analysis identified 371 ecological pinch points, totaling 1141.75 km2, accounting for 0.78% of the total study area. Pinch points exhibit “local clustering, overall dispersion” characteristics in space. Approximately 67% of pinch point patches have an area less than 1 km2, indicating that ecological connectivity bottlenecks are mostly localized fragmented nodes; a few large pinch points are located at key ecological corridor junctions and play an irreplaceable role in maintaining overall network connectivity. An overlay analysis with land use data revealed that approximately 23% of pinch points overlap with cultivated land and construction land, exposing them to risks of anthropogenic interference.

4. Discussion

This study systematically elucidates the evolution of land use and landscape ecological patterns in the study area between 1993 and 2023. The results indicate that driven by national ecological engineering, regional urbanization, and climate change, the study area underwent a land use transformation characterized by “cropland reduction, forest and grassland restoration, and construction land expansion.” This process triggered landscape patterns responses and a profound restructuring of ecological networks [44].

4.1. Temporal Characteristics and Driving Mechanisms of Land Use Change

Land use changes in the study area exhibit distinct temporal characteristics that align closely with major national strategic initiatives [45]. During the period of 1993–2003, cropland area experienced a slight, temporary increase, driven by food security policies and agricultural technological advancements. After 2003, cropland entered a phase of rapid decline phase, decreasing by 17.2% by 2023. This shift synchronized with the comprehensive implementation of the Grain for Green Program [46,47,48]. This “policy-driven” transformation constitutes the fundamental logic of change in the study area over the past three decades. Concurrently, construction land surged by 131.11%, marking the most dramatic expansion among all land categories. This expansion primarily originated from cropland and grassland, reflecting the strong demand for land resources stemming from regional urbanization and industrialization.
This coexisting pattern of “ecological restoration” and “urban expansion” stems from the combined effects of multi-scale and multi-stakeholder driving factors. From the macroscopic policy perspective, national strategies such as the Western Development Strategy and the ecological protection and high-quality development of the Yellow River Basin constitute the top-level design, directly guiding land use directions through policy instruments including ecological compensation and cropland protection red lines. Transfer matrix analysis reveals that the primary outflow directions of cropland are forestland and grassland. This trend was particularly notable during 2013–2023, when the transfer flow from cropland to grassland increased significantly. This increase is closely related to the later-stage emphasis on “returning grassland” and grass-livestock balance. These changes are highly consistent with the “coordination dilemma between ecological protection and urbanization development” theory proposed by Bai, Y et al. (2018) [49]. This interaction can be examined across three key dimensions: asymmetric spatial competition, policy-driven trade-offs, and the fragile balance of ecosystems. First, urbanization drives population outflow and labor structure transformation. This provides the necessary socio-economic opportunities for large-scale regional ecological restoration. Second, this coexisting pattern of ‘protection and expansion’ maintains a ‘tight balance’. This dynamic reflects the in-depth restructuring and self-adjustment of the land use structure under the requirements of high-quality development. Rapid urbanization constitutes another core driving force; infrastructure construction, mining development, and residential land demand in the Lanzhou-Baiyin metropolitan area have directly led to construction land expansion, which is spatially concentrated in river valley plains and along transportation ecological corridors, exacerbating the loss of high-quality farmland and fragmentation of ecological space. Furthermore, agricultural internal structural adjustments and climate change constitute fundamental background factors; abandonment of marginal cropland and land degradation influenced by precipitation fluctuations explain the anomalous increase in unused land area in the later period.

4.2. Ecological Effects and Risk Identification of Land Use Transformation

The dramatic transformation of land use has triggered cascading reactions in ecosystem structure and function. From the perspective of landscape pattern evolution, the study area presents a complex situation characterized by “coexistence of overall integration and local fragmentation, and intertwining of increased diversity and decreased connectivity”. On one hand, large-scale ecological restoration projects promote the aggregation of existing patches. This process effectively reduces habitat edge effects. The splitting index experienced an initial increase followed by a decline, indicating that landscape elements tend toward aggregation at the macroscopic scale, which is conducive to reducing habitat edge effects and enhancing ecosystem stability. The recovery of Shannon Diversity Index (SHDI) and Shannon Evenness Index (SHEI) reflects enhanced landscape heterogeneity, which has potential positive implications for maintaining higher biodiversity. On the other hand, the risks of landscape fragmentation and ecological connectivity degradation caused by anthropogenic disturbance cannot be ignored. In the southeastern region, where human activities are intensive, the decrease in the Contagion Index (CONTAG) reveals a deterioration in spatial configuration. Compared with existing literature, this study elucidates the unique characteristics of ecological evolution in arid and semi-arid regions. Our findings diverge from the classic fragmentation model proposed by Saunders et al. (1991) [50]. At the macro scale, the study area exhibits an “ecological restoration” trend driven by policy interventions, such as the Grain for Green Program. Conversely, at the micro scale, connectivity degradation remains severe due to urban expansion. Furthermore, we identified 371 ecological “pinch points” using circuit theory, 23% of which overlap with construction land. This finding offers higher regional specificity than the generalized research of McRae et al. (2008) [51], precisely locating the critical nodes where ecological flows are obstructed in the upper reaches of the Yellow River. The comprehensive assessment suggests that while land-use changes over the past three decades have significantly enhanced ecological services, the risks remain. The disorderly sprawl of construction land and the resulting functional fragmentation pose a long-term threat to regional ecological security.

4.3. Optimization of Ecological Security Pattern Based on Source-Corridor Identification

Facing the complex ecological issues triggered by land use changes, traditional single and isolated ecological element protection approaches are no longer adequate. Through the chain of ‘ecological source areas identification–resistance surface construction–ecological corridor and pinch point extraction,’ A spatial base map for the regional ecological security pattern was established, providing a scientific framework for implementing precise spatial governance transitioning from “passive protection” to “active construction”.
First, this study identified the key areas for ecological protection. The distribution of ecological source areas clarifies the core and priority areas for protection. The identified ecological source areas are mainly concentrated in the Gannan Plateau, the southeastern part of the Longzhong Loess Plateau, and the Ziwuling area, where vegetation coverage is good, ecosystem service value is high, and human disturbance is relatively low. Future protection policies must safeguard these ‘ecological highlands’ by incorporating them into ecological protection red lines for the strictest management and control, prohibiting any form of development activity. The northern part of the study area is characterized by arid deserts with sparse ecological source areas [52]. This degradation primarily stems from the combined effects of natural climatic constraints and human disturbances, such as overgrazing and the irrational exploitation of water resources [53]. In response, we proposed an ecological restoration strategy oriented toward wind prevention and sand fixation. This approach aims to enhance the regional ecological carrying capacity.
Secondly, this study strategically mapped the “arterial flow” of the regional ecosystem. Our findings reveal that the ecological corridor network, structured around the main stream and primary tributaries of the Yellow River, serves as a vital ecological lifeline connecting northern and southern ecoregions. This network is also instrumental in mitigating landscape fragmentation [46]. To optimize this structure, we proposed a dual-pathway strategy consisting of “pinch-point restoration” and “differentiated construction.” For pinch points under pressure from urban expansion, we introduced innovative “hard restoration” measures. These include engineering interventions such as ecological bridges and land-swap schemes to ensure functional connectivity.
Finally, this study provides an actionable governance framework that diverges from “one-size-fits-all” conservation policies. For regions with critical ecological functions, such as the Gannan area, a “conservation-first” strategy should be prioritized to strictly limit development. In contrast, for urbanized hubs like the Lanzhou-Baiyin metropolitan area, it is essential to establish urban growth boundaries (UGBs). This differentiated approach ensures that urban expansion is constrained within ecologically sustainable limits. Through strict regulations such as “equivalent exchange of ecological land” and the “patch integration” principle, fragmented and occupied ecological lands are consolidated near ecological source areas or ecological corridors to reduce landscape fragmentation and facilitate species migration while maintaining ecological space and preserving key ecosystem functions, including biodiversity conservation, water regulation, and soil retention [54].

5. Conclusions

(1)
During 1993–2023, significant changes occurred in the land use structure of the Gansu section of the Yellow River Basin: construction land expanded by 131.11%, cropland area decreased by 16.71%, and forestland area increased by 21.19%. Land use changes exhibited a pattern of coexisting ecological restoration and urban-rural construction, resulting from the combined driving effects of economic development, policy guidance, and natural factors. Landscape fragmentation indices and connectivity indices showed declining trends over the recent decade, while landscape diversity indices exhibited a pattern of initial decline followed by increase, with high-value areas concentrated in the southeastern part of the study area.
(2)
Based on comprehensive ecosystem service assessment and the MSPA model, a total of 260 ecological source areas were identified, with a total area of 15,854.63 km2, accounting for 10.64% of the study area. ecological source areas exhibit a spatial distribution pattern of ‘more in the south than north, sparse in the west and dense in the east,’ primarily distributed in a belt-like pattern along the Yellow River main stream and its primary tributaries, forming clustered areas in mountain systems including the eastern section of the Qilian Mountains, Maxian Mountain, and Xinglong Mountain.
(3)
Based on circuit theory, 694 ecological corridors were identified with a total length of 15,311.49 km; 371 pinch points were identified with a total area of 1141.75 km2. Pinch points exhibit characteristics of “local clustering and overall dispersion”, with approximately 67% having areas less than 1 km2 and approximately 23% overlapping with human activity areas, facing degradation risks. It is recommended that critical pinch points be incorporated into the ecological protection framework, with implementation of priority restoration and management measures to enhance regional ecological connectivity and system resilience.

Author Contributions

Conceptualization, Data curation, writing—original draft preparation, software, visualization, X.Y.; methodology, X.Y. and H.T.; validation, C.Y.; formal analysis, H.T.; writing—review and editing, H.T., C.Y. and L.H.; supervision, H.T.; project administration, H.T.; funding acquisition, C.Y. All authors have read and agreed to the published version of the manuscript.

Funding

This work was supported by the Fundamental Research Funds for the Central Universities (grant number lzujbky-2022-it28); the Central Guidance on Local Science and Technology Development Fund of Gansu Province (grant number 22ZY2QG001); the Gansu Province Science and Technology Major Project (grant number 22ZD6FA042); and the Science and Technology Innovation Program of Gansu Provincial Department of Natural Resources, China (grant numbers 202205, 202235, (22)0271, (22)0193).

Institutional Review Board Statement

Not applicable.

Informed Consent Statement

Not applicable.

Data Availability Statement

The original contributions presented in this study are included in the article. Further inquiries can be directed to the corresponding author.

Conflicts of Interest

The authors declare no conflicts of interest.

References

  1. Zhang, Y.; Zhao, W.; Fu, L.; Wang, S.; Wang, X. Grain-for-Green Program enhanced the sustainability of the Yellow River Basin, China: Evidence from ecosystem services and economic development. Geogr. Sustain. 2022, 3, 5940. [Google Scholar]
  2. Li, C.; Wang, Z.; Sun, W.; Chen, J.; Yuan, Y.; Li, Y. Evaluation of the ecological security of the Yellow River Basin based on the ecological footprint approach. Ecol. Indic. 2021, 125, 107475. [Google Scholar]
  3. Wei, W.; Wang, M.; Wei, X.; Yang, S.; Xie, B.; Ma, Z.; Yu, L.; Zhou, J.; Liu, T.; Lu, D. The coordination evaluation of ecological environment-economic development-carbon emission and spatiotemporal evolution in the important ecological functional area —A case study in the Yellow River Basin. Environ. Dev. Sustain. 2025, 27, 1–26. [Google Scholar] [CrossRef] [Scilit]
  4. Gao, Y.; Ma, L.; Liu, J.; Zhuang, Z.; Huang, Q.; Li, M. Assessing the impacts of urbanization on ecosystem services in the ecologically fragile region of the upper Yellow River: A case study of Lanzhou-Xining urban agglomeration. Ecol. Indic. 2022, 138, 108829. [Google Scholar]
  5. Chen, S.; Wang, Y.; Li, Z.; Feng, X.; Liu, G. Spatiotemporal evolution and driving forces of ecological vulnerability in the Gansu section of the Yellow River Basin under the background of urban development. Sci. Total Environ. 2023, 856, 158979. [Google Scholar]
  6. Kukkala, A.; Moilanen, A. Core concepts of spatial conservation prioritization. Biol. Rev. 2013, 88, 443–464. [Google Scholar] [CrossRef] [Scilit]
  7. Theobald, D.M. A general model to quantify ecological resistance for landscape connectivity planning. Landsc. Ecol. 2013, 28, 1859–1872. [Google Scholar] [CrossRef] [Scilit]
  8. Cumming, G.S.; Allen, C.R.; Ban, N.C.; Biggs, D.; Biggs, R.; Cumming, D.H.; de Vos, A.; Epstein, G.; Etienne, M.; Fazey, I.; et al. Understanding complexity in multi-level shared-resource systems. Ecol. Soc. 2020, 25, 8. [Google Scholar]
  9. Wang, H.; Liu, G.; Li, T.; Fu, B.; Yan, R.; Zhang, H. Ecological security assessment and pattern construction in the Yellow River Basin, China. J. Environ. Manag. 2023, 331, 117272. [Google Scholar]
  10. Xu, X.; Zhang, L.; Li, S.; He, C.; Huang, Q. Unraveling the coupling relationship between urbanization and eco-environmental quality in the Yellow River Basin: Evidence from a multi-scale perspective. J. Clean. Prod. 2022, 365, 132737. [Google Scholar]
  11. Yang, R.; Ma, S.; Zhou, Y.; Feng, Z.; Yuan, J. Coordinating socioeconomic development and ecological conservation in the upper Yellow River: A conflict-identification and zoning approach. Environ. Sci. Policy 2023, 140, 14–25. [Google Scholar]
  12. Feng, Y.; Liu, M.; Chen, L.; Bai, Y. Identifying ecological corridors and networks for conservation planning in rapidly urbanizing regions: A graph theory and circuit theory approach. Landsc. Urban Plan. 2021, 214, 104165. [Google Scholar]
  13. Peng, J.; Yang, Y.; Zhang, Z.; Liu, Y.; Xu, Z.; Xia, Q. Integrating ecosystem services and landscape connectivity to construct ecological security patterns: A case study in the Pearl River Delta, China. Sci. Total Environ. 2022, 852, 158480. [Google Scholar]
  14. Wei, W.; Zhang, Y.; Wei, X.; Xie, B.; Ma, Z.; Liu, C.; Yu, L.; Zhou, J.; Shi, W.; Liu, T.; et al. Construction and optimization of ecological security patterns based on ecosystem service function and ecosystem sensitivity in the important ecological functional area—A case study in the Yellow River Basin. Ecol. Eng. 2025, 215, 107609. [Google Scholar] [CrossRef] [Scilit]
  15. Chen, X.; Wei, W.; Wei, X.; Xie, B.; Pei, Y.; Zhou, J.; Sherif, M.; Wang, X.; Dewan, A. Spatio-Temporal Changes of Land Use Carbon Emission/Absorption and Its Future Trend in Important Ecological Functional Areas—A Case Study in the Yellow River Basin. Land Degrad. Dev. 2025, 36, 1–18. [Google Scholar] [CrossRef] [Scilit]
  16. Huang, C.; Huang, X.; Peng, C.; Zhou, Z.; Wang, J.; Liu, L. Linking ecosystem service flows to ecological security patterns: A new approach for landscape sustainability assessment. Landsc. Ecol. 2019, 34, 2435–2448. [Google Scholar]
  17. Shi, F.; Liu, S.; An, Y.; Sun, Y.; Zhao, S. Ecological network construction and optimization in an agricultural landscape based on ecosystem service supply and demand: A case study in central China. J. Environ. Manag. 2023, 347, 119137. [Google Scholar]
  18. Ma, L.; Bo, J.; Li, X.; Fang, F.; Cheng, W. Identifying key areas of ecosystem services for conservation and restoration based on circuit theory and MSPA: A case study in the Beijing-Tianjin-Hebei region. Ecol. Indic. 2022, 137, 108755. [Google Scholar]
  19. Kong, L.; Xu, W.; Xiao, Y.; Zhang, L.; Ouyang, Z. Integrating ecosystem services and landscape connectivity to construct ecological security pattern in Wuhan, China. Ecol. Indic. 2023, 146, 109864. [Google Scholar]
  20. Hou, Q.; Zhang, H.; Pei, L.; Chen, X.; Hu, X. The ecological security pattern and its constraint on urban expansion in a black soil farming area: A case study of Changchun City. Land 2022, 11, 1493. [Google Scholar]
  21. Liu, X.; Wang, Z.; Li, J.; Zhao, G.; Wang, C. Assessment and prediction of ecological security in the Yellow River Basin based on DPSIR model. Environ. Sci. Pollut. Res. 2022, 29, 66468–66481. [Google Scholar]
  22. Zhang, T.; Wang, C.; Li, X.; Zhang, Q. Assessing ecological security and its drivers in the Yellow River Basin based on the pressure-state-response framework. Ecol. Indic. 2023, 154, 110590. [Google Scholar] [CrossRef] [Scilit]
  23. Wu, X.; Wang, S.; Fu, B.; Liu, Y.; Zhu, Y. Land use optimization based on ecosystem service assessment: A case study in the Yellow River Basin, China. Ecol. Indic. 2022, 138, 108818. [Google Scholar]
  24. Wang, L.; Wang, H.; Wang, Y.; Li, Z.; Wang, C. Spatiotemporal evolution and prediction of ecosystem service value in the Yellow River Basin based on CA-Markov and InVEST models. Ecol. Indic. 2023, 154, 110702. [Google Scholar]
  25. An, Y.; Liu, S.; Sun, Y.; Shi, F.; Beazley, R. Construction and optimization of ecological security pattern in Ebinur Lake Basin based on MSPA–MCR models. Ecol. Indic. 2021, 129, 108009. [Google Scholar]
  26. Ma, S.; Wang, L.J.; Jiang, J.; Zhao, Y.G.; Zhang, J.B.; Li, X.C. Spatiotemporal evolution and driving forces of vegetation coverage in the Yellow River Basin from 2000 to 2020. Ecol. Indic. 2023, 148, 110137. [Google Scholar]
  27. Zhou, D.; Wang, X.; Shi, M. Human-driven spatiotemporal changes of the wetland landscape in the Yellow River Delta from 1976 to 2020. Ecol. Indic. 2022, 142, 109255. [Google Scholar]
  28. Li, B.; Zhang, W.; Xie, G.D.; Wang, S. Spatiotemporal evolution of water conservation service and its driving factors in the Yellow River Basin. Geogr. Sustain. 2022, 3, 358–369. [Google Scholar]
  29. Wang, J.; Li, Y.; Wang, Q.; Cheong, K.C. Urbanization-induced spatiotemporal variation of water resources utilization in northwestern China: A spatial panel model based approach. J. Environ. Manag. 2022, 301, 113907. [Google Scholar]
  30. Zhang, X.; Song, W.; Lang, Y.; Feng, X.; Yuan, Q.; Wang, J. Land use change and its effects on water retention service in the Yellow River Basin. J. Clean. Prod. 2022, 379, 134769. [Google Scholar]
  31. Liu, J.; Zhang, Z.; Xu, X.; Kuang, W.; Zhou, W.; Zhang, S.; Li, R.; Yan, C.; Yu, D.; Wu, S.; et al. Spatial patterns and driving forces of land use change in China during the early 21st century. J. Geogr. Sci. 2010, 20, 483–494. [Google Scholar] [CrossRef] [Scilit]
  32. Zhang, L.; Xu, Y.; Wang, Z.; Chen, Y. Has the ecological protection and high-quality development strategy improved the total factor productivity in the Yellow River Basin? Evidence from a quasi-natural experiment. J. Clean. Prod. 2023, 428, 139347. [Google Scholar]
  33. Sharp, R.; Tallis, H.T.; Ricketts, T.; Guerry, A.D.; Wood, S.A.; Chaplin-Kramer, R.; Nelson, E.; Ennaanay, D.; Wolny, S.; Olwero, N.; et al. InVEST 3.8.0 User’s Guide; The Natural Capital Project: Stanford, CA, USA, 2020; Available online: https://naturalcapitalproject.stanford.edu/software/invest (accessed on 10 October 2025).
  34. Jiang, C.; Li, D.; Wang, D.; Zhang, L. Quantification and assessment of changes in ecosystem service in the Three-River Headwaters Region, China as a result of climate variability and land cover change. Ecol. Indic. 2016, 66, 199–211. [Google Scholar] [CrossRef] [Scilit]
  35. Pan, Z.; Wang, J. Assessment of ecological vulnerability and multi-scenario simulation in the loess hilly region: A case study of Lanzhou City, China. Land 2021, 10, 785. [Google Scholar]
  36. cBorrelli, P.; Robinson, D.A.; Panagos, P.; Lugato, E.; Yang, J.E.; Alewell, C.; Wuepper, D.; Montanarella, L.; Ballabio, C. Land use and climate change impacts on global soil erosion by water (2015–2070). Proc. Natl. Acad. Sci. USA 2020, 117, 21994–22001. [Google Scholar] [CrossRef] [Scilit] [PubMed]
  37. IPCC 2019 Refinement to the 2006 IPCC Guidelines for National Greenhouse Gas Inventories; Intergovernmental Panel on Climate Change: Geneva, Switzerland, 2019.
  38. Li, Y.; Li, X.; Wang, L.; Wu, J. Divergent impacts of land use/cover change and climate change on vegetation dynamics in the Yangtze River Basin during 1982–2015. J. Hydrol. 2021, 603, 127087. [Google Scholar]
  39. Hu, S.; Zhang, L.; Liu, Y.; Sun, F.; Chen, T. Identifying priority areas for ecological conservation and restoration based on the coupling of ecosystem services and environmental risks: A case study of the Loess Plateau, China. J. Clean. Prod. 2020, 275, 122967. [Google Scholar]
  40. Feng, X.; Fu, B.; Piao, S.; Wang, S.; Ciais, P.; Zeng, Z.; Lü, Y.; Zeng, Y.; Li, Y.; Jiang, X.; et al. Revegetation in China’s Loess Plateau is approaching sustainable water resource limits. Nat. Clim. Change 2016, 6, 1019–1022. [Google Scholar] [CrossRef] [Scilit]
  41. Tong, X.; Brandt, M.; Yue, Y.; Ciais, P.; Jepsen, M.R.; Penuelas, J.; Wigneron, J.-P.; Xiao, X.; Song, X.-P.; Horion, S.; et al. Drivers of greening in China’s Grain for Green Program: A national-scale analysis using satellite data. Sci. Total Environ. 2020, 726, 138534. [Google Scholar]
  42. Bryan, B.A.; Gao, L.; Ye, Y.Q.; Sun, X.F.; Connor, J.D.; Crossman, N.D.; Stafford-Smith, M.; Wu, J.G.; He, C.Y.; Yu, D.Y.; et al. China’s response to a national land-system sustainability emergency. Nature 2018, 559, 193–204. [Google Scholar] [CrossRef] [Scilit]
  43. Peng, J.; Pan, Y.; Liu, Y.; Zhao, H.; Wang, Y. Linking ecological degradation risk to identify ecological security patterns in a rapidly urbanizing landscape. Habitat Int. 2018, 71, 110–124. [Google Scholar] [CrossRef] [Scilit]
  44. Gao, J.; Wang, H.; Niu, X. Evaluation of ecological protection and high-quality development in the Yellow River Basin based on multi-source data. Ecol. Indic. 2022, 143, 109327. [Google Scholar]
  45. Chen, W.; Chi, G. Urbanization and ecosystem services: The multi-scale spatial spillover effects and spatial variations. Land Use Policy 2022, 114, 105964. [Google Scholar] [CrossRef] [Scilit]
  46. Jiang, H.; Xu, X.; Guan, M.; Wang, L.; Huang, Y.; Jiang, Y. Determining the impacts of climate change and urban expansion on terrestrial net primary production in China. J. Environ. Manag. 2020, 258, 110042. [Google Scholar]
  47. Shen, J.; Li, S.; Liang, Z.; Liu, L.; Li, D.; Wu, S. Exploring the impacts of climate change and human activities on vegetation dynamics in the Yangtze River Basin, China. Ecol. Indic. 2020, 108, 105724. [Google Scholar]
  48. Kang, P.; Chen, W.; Hou, Y.; Li, M. Linking ecosystem services and ecological sensitivity to identify spatial priorities for ecosystem management in the Loess Plateau, China. Land Degrad. Dev. 2021, 32, 1362–1374. [Google Scholar]
  49. Bai, Y.; Wong, C.P.; Jiang, B.; Hughes, A.C.; Wang, M.; Wang, Q. Developing China’s Ecological Redline Policy using ecosystem services assessments for land use planning. Nat. Commun. 2018, 9, 3034. [Google Scholar] [CrossRef] [Scilit]
  50. Saunders, D.A.; Hobbs, R.J.; Margules, C.R. Biological Consequences of Ecosystem Fragmentation: A Review. Conserv. Biol. 1991, 5, 18–32. [Google Scholar] [CrossRef] [Scilit]
  51. McRae, B.H.; Dickson, B.G.; Keitt, T.H.; Shah, V.B. Using circuit theory to model connectivity in ecology, evolution, and conservation. Ecology 2008, 89, 2712–2724. [Google Scholar] [CrossRef] [Scilit]
  52. Wang, X.; Zhang, Y.; Hu, W.; Zhao, J. Spatiotemporal Change and Drivers Analysis of Desertification in Northern China. Environ. Sci. Ecotechnol. 2024, 21, 100412. [Google Scholar]
  53. Li, J.; Yan, H.; Wu, B.; Wang, J. Effectiveness of Sand-Fixing Measures on Desert Land Restoration in Northern China. J. Arid Environ. 2025, 218, 105156. [Google Scholar]
  54. Li, G.; Sun, S.; Han, J.; Yan, J.; Liu, W.; Wei, Y.; Lu, N.; Sun, Y. Impacts of urbanization on net primary productivity in the middle reaches of the Yangtze River urban agglomerations, China. Remote Sens. 2019, 11, 1456. [Google Scholar]
Figure 1. Overview of the research area.
Sustainability 18 02115 g001
Figure 2. Technical route of the study.
Sustainability 18 02115 g002
Figure 3. Analysis of Land Use Types in the Gansu section of the Yellow River Basin for Different Periods from 1993 to 2023.
Sustainability 18 02115 g003
Figure 4. Analysis of dynamics in Land use changes in the Gansu section of the Yellow River Basin from 1993 to 2023.
Sustainability 18 02115 g004
Figure 5. Sankey diagram of landscape transfer.
Sustainability 18 02115 g005
Figure 6. Analysis of landscape index changes.
Sustainability 18 02115 g006
Figure 7. Spatial distribution of landscape pattern index values from 1993 to 2023.
Sustainability 18 02115 g007
Figure 8. Assessment results of the importance of ecosystem services and results of ecological source areas area identification.
Sustainability 18 02115 g008
Figure 9. Ecological resistance surface.
Sustainability 18 02115 g009
Figure 10. Identification results of ecological nodes.
Sustainability 18 02115 g010
Table 1. List of data sources.
Data NameData AccuracyTimeData Sources
Land cover30 m1993–2023Environmental science data center, Chinese academy of Sciences (http://www.resdc.cn)
The boundary of the Gansu section, Yellow River Basin.Vector2023National science & technology resource sharing service Platform (http://www.ncdc.ac.cn/portal/metadata (accessed on 1 July 2025).)
Soil dataVector2023National science & technology resource sharing service platform (http://data.tpdc.ac.cn)
Temperature, precipitation30 m2023CRU dataset (https://crudata.uea.ac.uk/cru/data/hrg/ (accessed on 1 July 2025))
Rainfall Erosivity30 m2023Monthly average precipitation
Biophysical table, threat factors——The InVEST user guide
DEM data30 m2023Geospatial data cloud (http://www.gscloud.cn)
Road networkVector2023Acquired from open street map
Scenic spot POI dataVector2023Acquired from open street map
NDVI30 m2023China meteorological science data center (http://data.cma.cn)
Table 2. Threat factors.
Land Use TypeMaximum Impact DistanceWeightDecay Type
Cultivated land10.2Linear Decay
Construction land50.6Exponential Decay
Unused land101Exponential Decay
Table 3. Sensitivity of Various Land Cover Types to Threat Factors.
Land Use TypeHabitat
Suitability
Cultivated LandUnused LandConstruction Land
Cultivated land0.30.10.30.6
Forest10.40.50.7
Grassland0.70.20.40.6
Water area0.90.20.40.7
Construction land0.20.30.10.6
Unused land0.10.10.20.1
Table 4. Spatial distribution map of land use in the Gansu section of the Yellow River Basin from 1993 to 2023.
Land Use Type1993200320132023
Area/km2Ratio (%)Area/km2Ratio (%)Area/km2Ratio (%)Area/km2Ratio (%)
Cultivated land38,423.6225.8738,642.7726.0234,575.0823.2832,001.6321.55
Forest15,296.4610.315,811.0410.6516,904.2811.3818,537.4412.48
Grassland93,213.0462.7792,631.6962.3895,345.664.2195,281.8364.16
Water area4860.33289.150.19374.860.25366.890.25
Construction land290.790.2383.590.26529.050.36672.050.45
Unused land788.430.53740.110.5769.480.521638.511.1
The values in parentheses represent the percentage of area (%).
Disclaimer/Publisher’s Note: The statements, opinions and data contained in all publications are solely those of the individual author(s) and contributor(s) and not of MDPI and/or the editor(s). MDPI and/or the editor(s) disclaim responsibility for any injury to people or property resulting from any ideas, methods, instructions or products referred to in the content.