Article

Rethinking Cost–Benefit Analysis for Infrastructure Projects: Insights from Japan’s Official Development Assistance Loan Projects

1
JICA Ogata Sadako Research Institute for Peace and Development, 10-5 Ichigaya Honmuracho, Shinjuku-ku, Tokyo 162-8433, Japan
2
Japan International Cooperation Agency, Nibancho Center Building, 5-25 Niban-cho, Chiyoda-ku, Tokyo 102-8012, Japan
*
Author to whom correspondence should be addressed.
Sustainability 2026, 18(4), 1888; https://doi.org/10.3390/su18041888
Submission received: 24 December 2025 / Revised: 4 February 2026 / Accepted: 5 February 2026 / Published: 12 February 2026
(This article belongs to the Special Issue Construction Management and Sustainable Development)

Abstract

Cost–benefit analysis (CBA), particularly the economic internal rate of return (EIRR), continues to play an important role in infrastructure project appraisal. Using EIRR data from 387 infrastructure projects financed under Japan’s ODA loans (Japanese fiscal years 2001–2020), this study identifies clear sectoral trends: economic infrastructure and brownfield projects generally exhibit higher EIRRs, while no significant differences are observed between tied projects (i.e., projects whose contracts are primarily tied to Japanese firms) and untied projects. A comparison of ex ante and ex post EIRRs for 84 projects shows that estimates may vary due to factors such as changes in demand, project costs, and implementation periods, indicating the practical challenges involved in estimating EIRRs. Qualitative analysis further suggests that non-economic considerations—such as humanitarian needs, national development priorities, and diplomatic interests—may also influence financing decisions. Overall, while CBA remains a valuable and widely used tool, the findings highlight the importance of complementing it with broader sustainability-oriented appraisal approaches that capture the multidimensional value of infrastructure projects.

1. Introduction

Project appraisal plays a critical role in determining whether an infrastructure project should be implemented. In recent years, the international community has placed stronger emphasis on economic, environmental, and social sustainability, making it increasingly necessary to conduct more rigorous assessments to verify whether projects meet these principles [1,2,3]. As a result, practitioners have called for evaluation and reporting methods that reflect sustainability principles. However, research on such methods remains limited (e.g., [4]), and their application to real infrastructure projects has not yet been fully realized. In practice, traditional cost–benefit analysis (CBA) continues to be the predominant appraisal tool.
CBA is widely used because it provides a systematic, transparent, and objective approach for evaluating the impacts of a policy or project by comparing its benefits and costs [5]. Its typical steps include: (1) defining the scope of the analysis; (2) estimating costs and benefits in monetary terms over the project life; (3) calculating indicators such as net present value (NPV), internal rate of return (IRR), and the benefit–cost ratio; and (4) conducting sensitivity analysis [6,7]. However, despite these advantages, CBA faces well-known limitations in comprehensively assessing sustainability, largely because environmental and social impacts are difficult to monetize [6,8,9]. As sustainability becomes increasingly important, these limitations have become more consequential.
Despite these shortcomings, CBA continues to play a central role in practice, raising an important question: how should it be positioned and used when evaluating the sustainability aspects of infrastructure projects? Developing new appraisal methods is time-consuming, and although research in this direction is progressing [10,11,12,13], widespread adoption in practice will likely require additional time. Therefore, a necessary first step is to clarify how CBA is currently applied and what insights can be obtained from existing cases.
Given the limited empirical research on CBA results across different types of projects, the first objective of this study is to investigate which types of infrastructure projects tend to yield higher or lower CBA outcomes. The second objective is to examine the extent to which CBA results can be relied upon for decision-making in infrastructure development. The third objective is to explore how CBA can be used for project appraisal and decision-making, particularly when sustainability considerations are important. To address these objectives, this study analyzes CBA data from past infrastructure projects financed through Japan’s Official Development Assistance (ODA) loan program, offering evidence from real-world cases that can benefit both scholars and practitioners.

2. Literature Review

2.1. Overview of Cost–Benefit Analysis (CBA)

CBA has a long history and has been used worldwide to evaluate projects, programs, and policies [6,14,15,16]. CBA was broadly adopted in the United States following the U.S. Flood Control Act of 1936 [5,17,18]. Full-fledged application of CBA in the U.S. was the result of President Ronald Reagan’s Executive Order 12291, issued in 1981 [5]. Following the U.S., Europe started utilizing CBA, although it remains less established than in the U.S. [5]. The UK first applied CBA to the transport sector in the early 1960s [19], and it became standard practice from the early 1990s when CBA guidelines were published [20]. The European Union (EU) started to utilize CBA in the early 1990s, but it was not often conducted before the early 2000s [20,21,22]. According to Andersson [5], in recent decades, the EU and European countries have promoted CBA through the publication of manuals and guidelines.
Despite the worldwide application of CBA for project evaluation, there have also been critiques of its use. Major criticisms stem from both technical and philosophical viewpoints: it is challenging to monetize environmental and social impacts in evaluations [6,8,9]. It should also be noted that records of past infrastructure projects often reveal non-negligible inaccuracies in cost–benefit estimation at the time of appraisal, due to cost and benefit overruns in the projects [23]. It is also difficult to make accurate demand forecasts for infrastructure projects for various reasons, such as behavioral biases and political motivations [23,24].
Another key criticism is that CBA only provides partial information for decision-making, as it does not assess incremental, economy-wide impacts such as local employment and regional development [6,7,9,25]. In addition, Joseph et al. [6] highlight conflicts with the precautionary principle as a potential limitation. In other words, positive CBA results in only green-light projects; the results do not provide warnings.
To address these drawbacks, the U.S. and some European countries have considered and utilized other analysis methodologies—e.g., economic impact analysis, which measures gross economic impacts such as GDP benefits, employment, and government benefits [6,26]; social cost–benefit analysis (SCBA), wherein project selection is based on the maximization of social welfare [10,11]; and multi-criteria decision analysis (MCDA), wherein project selection is based on multiple criteria defined by sectoral or national infrastructure development policies [11,12,13]. However, CBA is still widely utilized in the U.S., EU, and other countries, since it is easy for decision-makers to intuitively compare and rank alternatives based on a single indicator [5,11,27].

2.2. Application of CBA in Development Financial Institutions

CBA has been used not only by countries but also by development financial institutions (DFIs), such as the World Bank (WB) and the Asian Development Bank (ADB). The WB has utilized CBA, focusing on financial analysis, since the 1950s, with economic CBA starting in the 1970s [28]. According to OPSPQ [29], the WB’s economic analysis guidance, at the project appraisal stage, recommends conducting either economic CBA or cost-effectiveness analysis for WB projects. Financial analysis (calculating the financial internal rate of return) is also conducted, if relevant. For economic CBA, economic internal rate of return (EIRR), or economic net present value (ENPV), is utilized to determine the WB’s acceptance of a project. OPSPQ [29] explains that a project is generally accepted if the EIRR is higher than the discount rate, which is equivalent to positive ENPV. However, the WB stresses that the emphasis on a single number, such as EIRR or ENPV, should not be the sole criterion for project acceptance. Instead, the focus should be on using analysis to make choices in project selection and design [30]. In addition, in determining project selection, the WB emphasizes the importance of public involvement and the added value of WB involvement [30]. Recently, the WB proposed the Infrastructure Prioritization Framework (IPF), an MCDA tool that considers project outcomes along social–environmental and financial–economic dimensions, especially for the selection of numerous small-to-medium-sized projects [11]. However, traditional CBA remains a major economic analysis tool, since the IPF is still in its pilot application stage in some countries, such as Vietnam and Panama [31,32].
The ADB also utilizes CBA in its project selection process. It recognizes economic analysis as a key tool to ensure broad objectives, such as inclusive economic growth and regional integration. It established guidelines for economic project analysis in 1997 and revised them in 2017 [33]. The guidelines state that the ADB conducts CBA alongside other analyses, such as country context, sector, and sustainability analyses, as part of its project economic analysis. The ADB’s approach to CBA is very similar to that of the WB: it conducts both economic and financial CBA (calculating EIRR, ENPV, FIRR if relevant, and FNPV if relevant). However, the ADB’s guidelines set an explicit hurdle rate for EIRR. The ADB [33] explains that the minimum required EIRR for an economic infrastructure project (e.g., transport, energy, urban development, and agriculture projects) is 9%, which can be lowered to 6% for social infrastructure projects (e.g., rural roads and rural electrification projects) and projects that primarily generate environmental benefits (e.g., pollution control, ecosystem protection, flood control, deforestation control, and disaster risk management). Like the WB, the ADB also uses other economic analysis tools, namely cost-effectiveness analysis and MCDA. However, CBA is still a major economic analysis tool, as these other methods are applied only to social and environmental projects, whose benefits cannot otherwise be adequately valued [33].
CBA is widely utilized as an economic analysis tool for projects at other international organizations and DFIs besides the WB and the ADB—e.g., the EU and the European Bank for Reconstruction and Development (EBRD) [34]. Overall, CBA remains the most popular tool for practical assessment of a project’s economic impact, although there have been criticisms and proposals for the development of alternative approaches.

2.3. Previous Research on CBA

Significant research has already been conducted on the widespread application of CBA. However, earlier research has tended to focus on use of CBA for particular projects or programs (e.g., [35,36,37]), theoretical improvements for evaluating benefits (e.g., [38,39,40]), and reviews of CBA use in particular countries and sectors (e.g., [19,41,42]). Research has largely neglected to review the results of CBAs across multiple projects, although such information is vital for both scholars and practitioners, especially in the infrastructure development field. The reason for this limited review of CBA results is unclear, but one possible reason may be the limited availability of datasets, as governments and DFIs disclose incomplete and unorganized data on CBA results. Based on these research trends, this study aims to analyze the types of projects that have yielded positive and negative results in CBA.
Some extant research provides interesting findings on comparisons of CBA results. Florio, Morretta, and Willak [43] offer the most recent relevant research, to the best of our knowledge, analyzing which factors positively and negatively affect EIRR by using available datasets from an ex ante appraisal of 762 projects under the European Regional Development Fund (ERDF) and the Cohesion Fund (CF) between 2007 and 2013. According to this research, road, information and communication technology (ICT), and productive investment sector projects have higher EIRRs than projects in other sectors. In addition, investment cost has a negative correlation with EIRR: larger projects in terms of investment cost may be less efficient. Del Bo and Florio [34] suggest that there is variation in EIRRs among sectors, and trends in high- and low-EIRR sectors differ across institutions. Based on these results, Del Bo and Florio [34] suggest that it can be difficult to compare EIRRs of projects across different institutions, since calculation methods are heterogeneous among institutions, while the method for calculating FIRR is relatively standardized. Their research found that the EIRRs of road and railway projects under the WB are relatively high, while those under the EBRD are relatively low. Therefore, using previous research to determine which sectors have relatively high or low EIRRs can prove challenging. However, it might be said that there are some differences in EIRR results between sectors, as other research and guidelines also suggest (e.g., [33,44]).
Additionally, when discussing CBAs, research on the accuracy (or inaccuracy) of CBAs should be taken into account. One of the most frequently cited studies is by Flyvbjerg and colleagues. According to Flyvbjerg and Bester [23], who analyzed long-term trends in CBAs for 2062 infrastructure projects conducted between 1927 and 2013 in 104 countries, CBA forecasts were found to be highly inaccurate and biased, even though policy-makers and scholars often assume the cost–benefit forecasts are reasonably reliable. On average, CBA estimates overvalued the project outcomes by 50–200 percent, due to substantial cost underestimates and significant benefit overestimates. Flyvbjerg and Bester concluded that this “CBA fallacy” should be acknowledged and corrected through improvements in estimation methodology and appraisal procedures; otherwise, the usefulness of CBA itself could be undermined [23].
The underlying issue in the CBA fallacy is not only simple errors of uncertainty but also intentional and unintentional manipulation of the analysis due to behavioral biases and political motivations [23,24]. In particular, previous research empirically suggests that demand for rail projects tends to be significantly overestimated largely due to political causes [45]. Many practitioners believe that the accuracy of the demand forecasts increases over time; however, this had still not occurred by the late 1990s [45]. More recent research also suggests that the situation has not changed substantially: the accuracy of demand forecasts and the reliability of the CBA method have not significantly improved since the 2000s [46,47]. Research remains limited on the accuracy of the current demand forecasting method and how to effectively utilize CBA—despite its risk of fallacy—for appropriate decision-making regarding infrastructure projects. Moreover, ex post CBAs are often not conducted due to data unavailability for public works projects, including those financed by the international development finance institutions such as the WB [28,46,47].

3. Research Objectives

Considering that research on CBA results among projects remains limited—despite CBA being a major tool for evaluating project impacts—the first objective of this research is to investigate which types of projects yield higher or lower CBA results. To achieve this goal, this study utilizes CBA data from past infrastructure projects under Japan’s Official Development Assistance (ODA) loans, providing insights from real projects to benefit both scholars and practitioners. This research uses the projects’ EIRRs as its primary dataset, as explained below. The decision to focus on EIRRs is intended to achieve a significant impact, in that the results can inform future project appraisals by DFIs. In addition, this research offers new and supporting insights for scholars by connecting to current ongoing discussions on EIRRs.
The second research objective is to consider the extent to which CBAs can be relied on for decision-making in infrastructure project development. The intention is to examine the findings of previous research that has identified trends of inaccuracies in CBAs and demand forecasts. To do so, this research analyzes the differences between ex post EIRRs and the original or ex ante rates in the projects, and also examines the reasons for these discrepancies. This research is significant because only a limited number of studies have comprehensively assessed the accuracy of CBAs.
The third research objective is to consider how to best use the CBA—despite its potential uncertainty—for appraisal and decision-making in infrastructure projects, particularly when sustainability perspectives are involved. As a first step in this inquiry, the research investigates what additional information should be taken into account in decision-making alongside the CBA results. It explores why the projects with low EIRRs at the ex ante appraisal stage were implemented despite their low expected economic impact. The findings offer insights into how economic perspectives, in the form of CBA results, can be combined with environmental and social perspectives to support holistic infrastructure project evaluations.

3.1. Research Questions and Hypotheses

Based on the above research objectives, the research questions (RQs) of this research are as follows: (RQ1) What types of projects have achieved higher or lower results of CBAs among past infrastructure projects under Japan’s ODA loans? (RQ2) To what extent can CBA results be relied on for decision-making in infrastructure project development? (RQ3) What factors can support decision-making in sustainable infrastructure development beyond CBAs?
Drawing on the reviewed literature, the following hypotheses are formulated for each research question. For RQ1, although a wide range of projects exhibit high and low EIRRs, economic infrastructure projects are expected to yield higher EIRRs than social infrastructure projects, to some extent. However, the magnitude of these differences—as well as the additional factors influencing EIRRs—remains uncertain prior to the analysis.
For RQ2, consistent with the findings of previous studies, it is considered likely that unavoidable forecasting errors lead to discrepancies between ex ante and ex post EIRRs. Nevertheless, such errors are expected to occur in both upward and downward directions without systematic bias, because EIRRs serve only as reference information in Japan’s ODA loan appraisal process, and there is no incentive to inflate EIRR values.
For RQ3, it is hypothesized that certain factors not captured through CBA also play important roles in holistic project evaluation, including environmental and social dimensions. This expectation is consistent with the fact that, within Japan’s ODA loan framework, EIRRs are treated as referential information rather than the sole basis for decision-making. However, the specific factors that influence such holistic judgments cannot be predicted prior to the analysis.

3.2. Data and Research Methods

3.2.1. Data

For this analysis, the study utilizes available CBA data, including ex ante EIRR information, for 387 infrastructure projects that proceeded to implementation under Japan’s ODA loan scheme (Japanese fiscal years 2001–2020). The original EIRR data and the project information used in this study are reported in the ex ante evaluation reports and the project data list. These reports and the list are publicly available on the JICA website (Search Page for Evaluation Reports and ODA Loan Project Data).
This research focuses on the projects’ EIRRs, as FIRRs are calculated only for profitable projects, which account for approximately half of the total [28], and such an incomplete dataset is therefore not appropriate for analysis. While FIRR analysis may provide interesting results, EIRR analysis is far more relevant for development projects, since ODA loans are typically used to fund infrastructure projects that the private sector cannot finance, with the aim of promoting economic development. Indeed, the WB’s Independent Evaluation Group [47] also focuses on EIRRs rather than FIRRs in its review of CBAs.
For the first research question, the study utilizes the EIRR data from the ex ante appraisal for its analysis, as ex post rates remain only partially available [24]. For the second research question, the study uses available data on both ex ante and ex post EIRRs for 84 projects to compare differences between the two, although the available data remains limited. The ex post EIRRs are reported in the ex post evaluation reports, which are publicly available from the JICA website (Search Page for Evaluation Reports). For the third research question, the ex ante EIRR data—the same dataset used for the first research question—is employed to identify projects with low EIRRs.

3.2.2. Research Methods

For the first research question, to understand which factors have positive and negative effects on the EIRRs of infrastructure projects under Japan’s ODA loan scheme, this study analyzes ex ante EIRRs for 387 infrastructure projects by using analyses of variance (ANOVA) for factors with more than two levels, or t-tests for factors with two levels. First, the ANOVA/t-test is conducted to determine whether there are significant differences in EIRR levels for each qualitative independent variable. This study utilizes four qualitative/categorical independent variables, listed in Table 1. These independent variables are selected based on existing research and practitioner input, with the expectation that they might impact the EIRRs and/or determine the number of project beneficiaries—a factor that may also affect EIRRs. Multiple comparison tests (MCTs) are also conducted, where applicable, to identify differences in EIRR levels.
As for the second research question, based on the differences between the ex ante and ex post EIRRs, the study first classifies the projects into four groups: (1) downward deviation (error of 20% or more); (2) downward deviation (error of less than 20%); (3) upward deviation (error of less than 20%); and (4) upward deviation (error of 20% or more). Here, the deviation is defined as the relative percentage difference of the ex post EIRR with respect to the ex ante EIRR. The 20% threshold is adopted from the minimum threshold used in the similar analysis by Flyvbjerg et al. (2005) [45]. The study then analyzes the trends within these classifications and applies statistical tests of distributional features—including skewness, kurtosis, the Jarque–Bera test, the Shapiro–Wilk test, and t-test—to examine whether the differences between ex ante and ex post EIRRs exhibit any systematic bias. The study also investigates the potential reasons for observed deviations by reviewing the projects’ ex post reports. This enables us to assess the extent to which we can rely on the CBA results and how estimation deviations should be managed.
For the third research question, the research first identifies projects with low EIRRs at the ex ante stage. Projects with EIRRs less than or equal to 9% for economic infrastructure and less than or equal to 6% for social infrastructure projects are classified as having low EIRRs, according to criteria adopted by the ADB [33]. The study then qualitatively analyzes the most plausible background factors explaining why these projects were financed despite their low expected economic impact, by reviewing their ex ante and post-evaluation reports.

4. Results

4.1. Analysis of EIRRs at the Ex Ante Appraisal

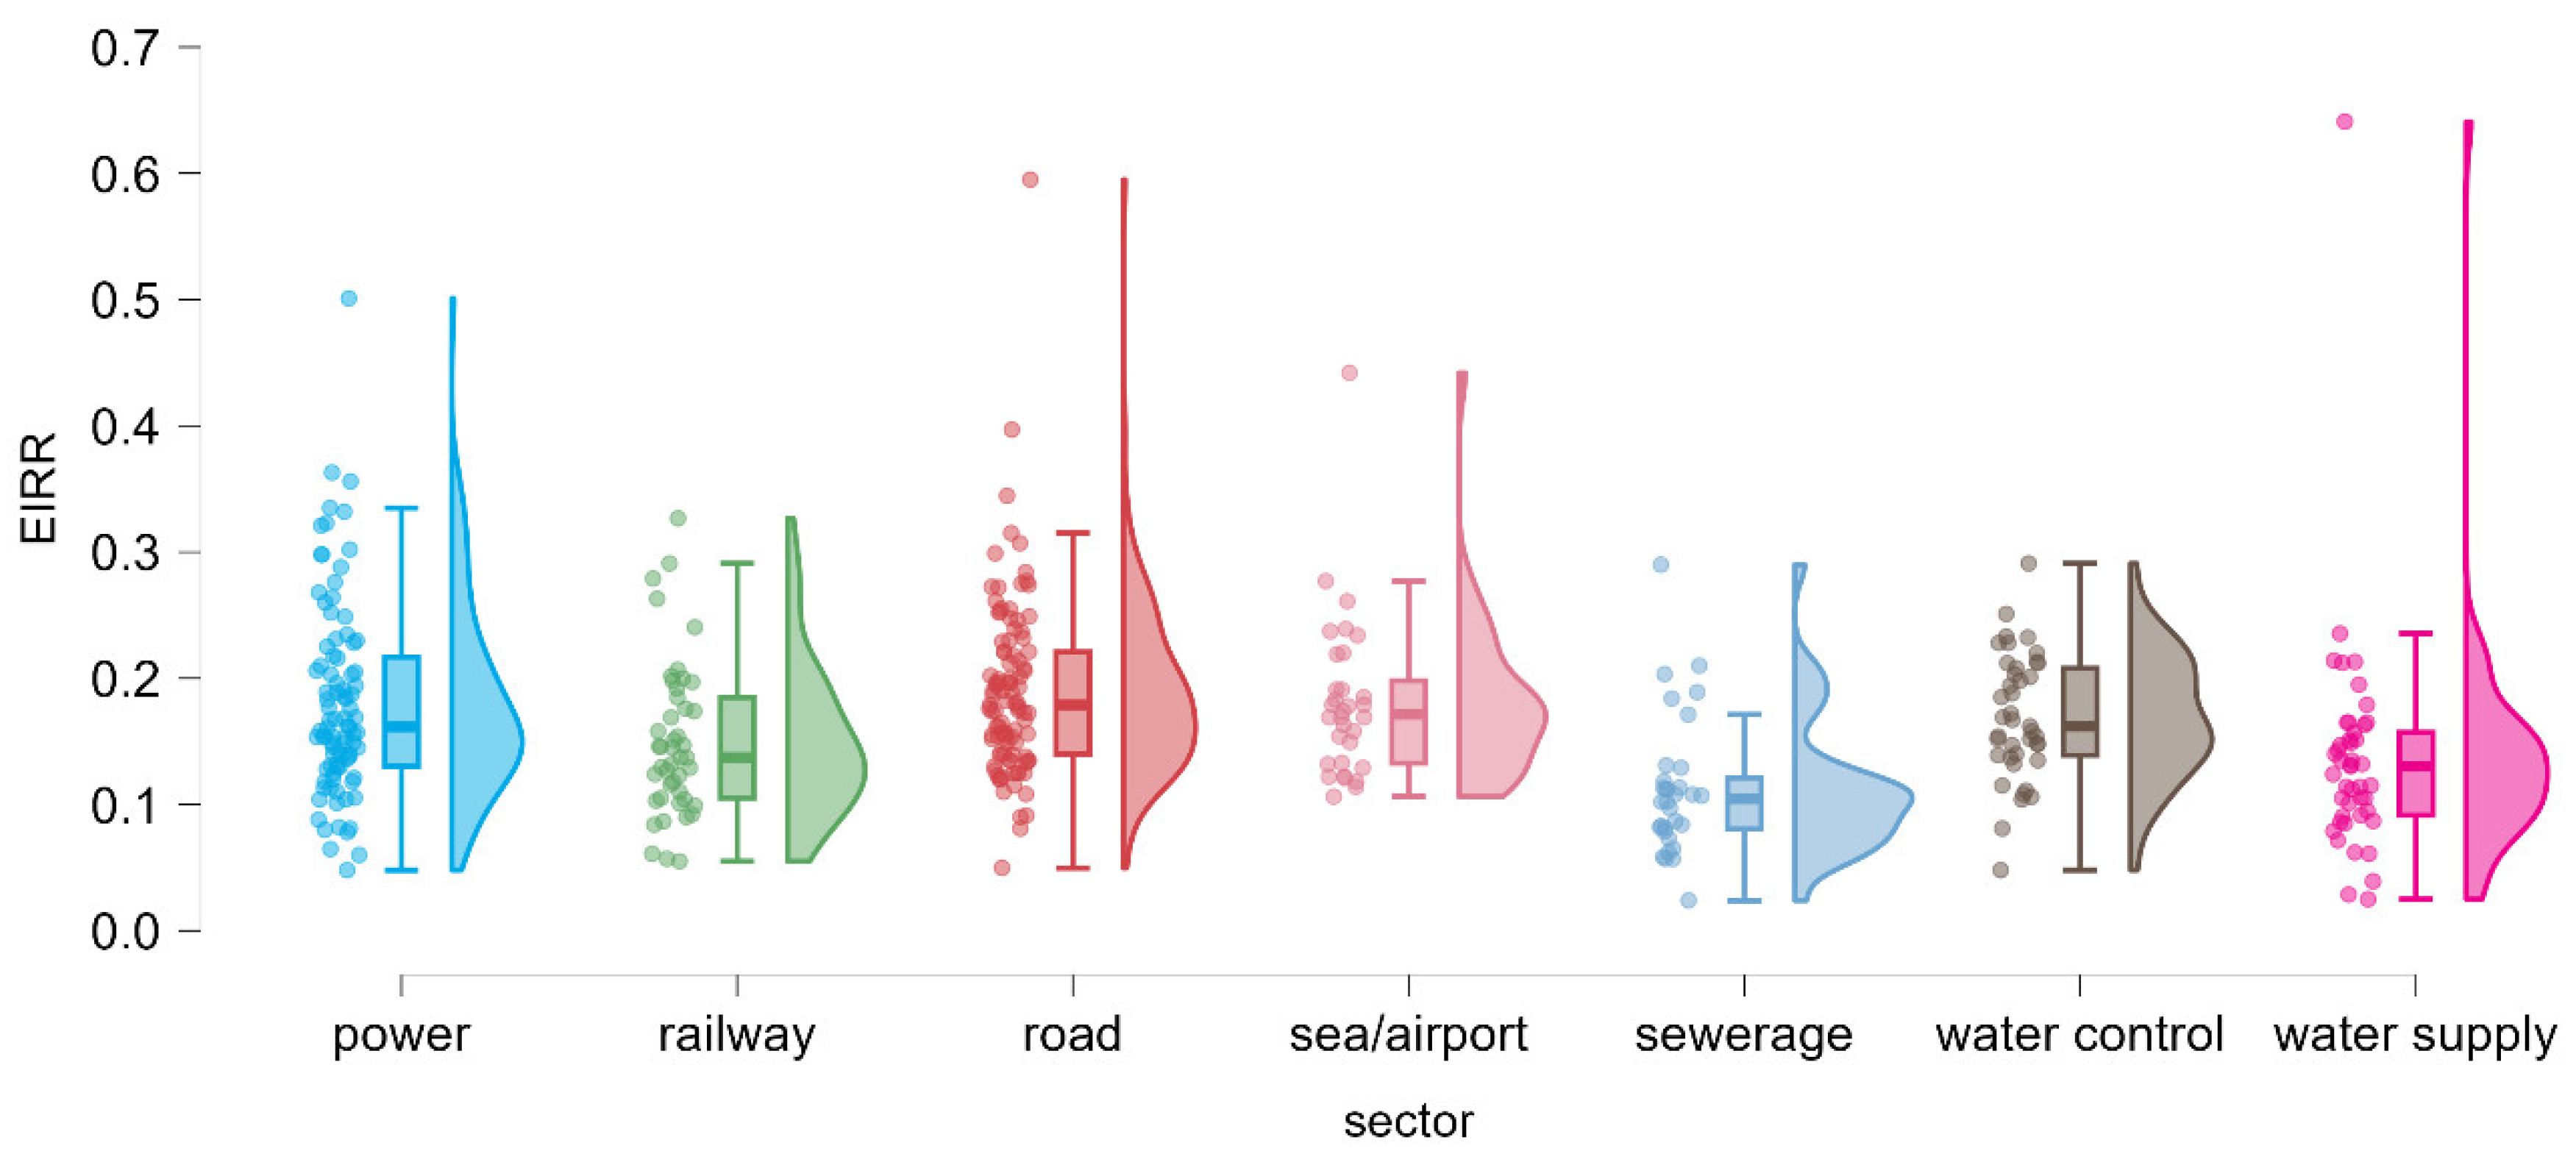
Results of ANOVA or t-test averages for three qualitative/categorical independent variables (project sector, type, and tying status) are summarized in Table 2. For the project sector variable, ANOVA results show statistically significant differences in averages of EIRRs among the seven sectors (p < 0.001), consistent with existing research and reports, suggesting that different sectors have different EIRR trends (e.g., [33,47]). For reference, ANOVA conducted using the dataset including outliers also indicates statistically significant differences in EIRRs among the seven sectors (p < 0.001). A visualized graph of EIRRs’ plots by sector is presented in Figure 1.
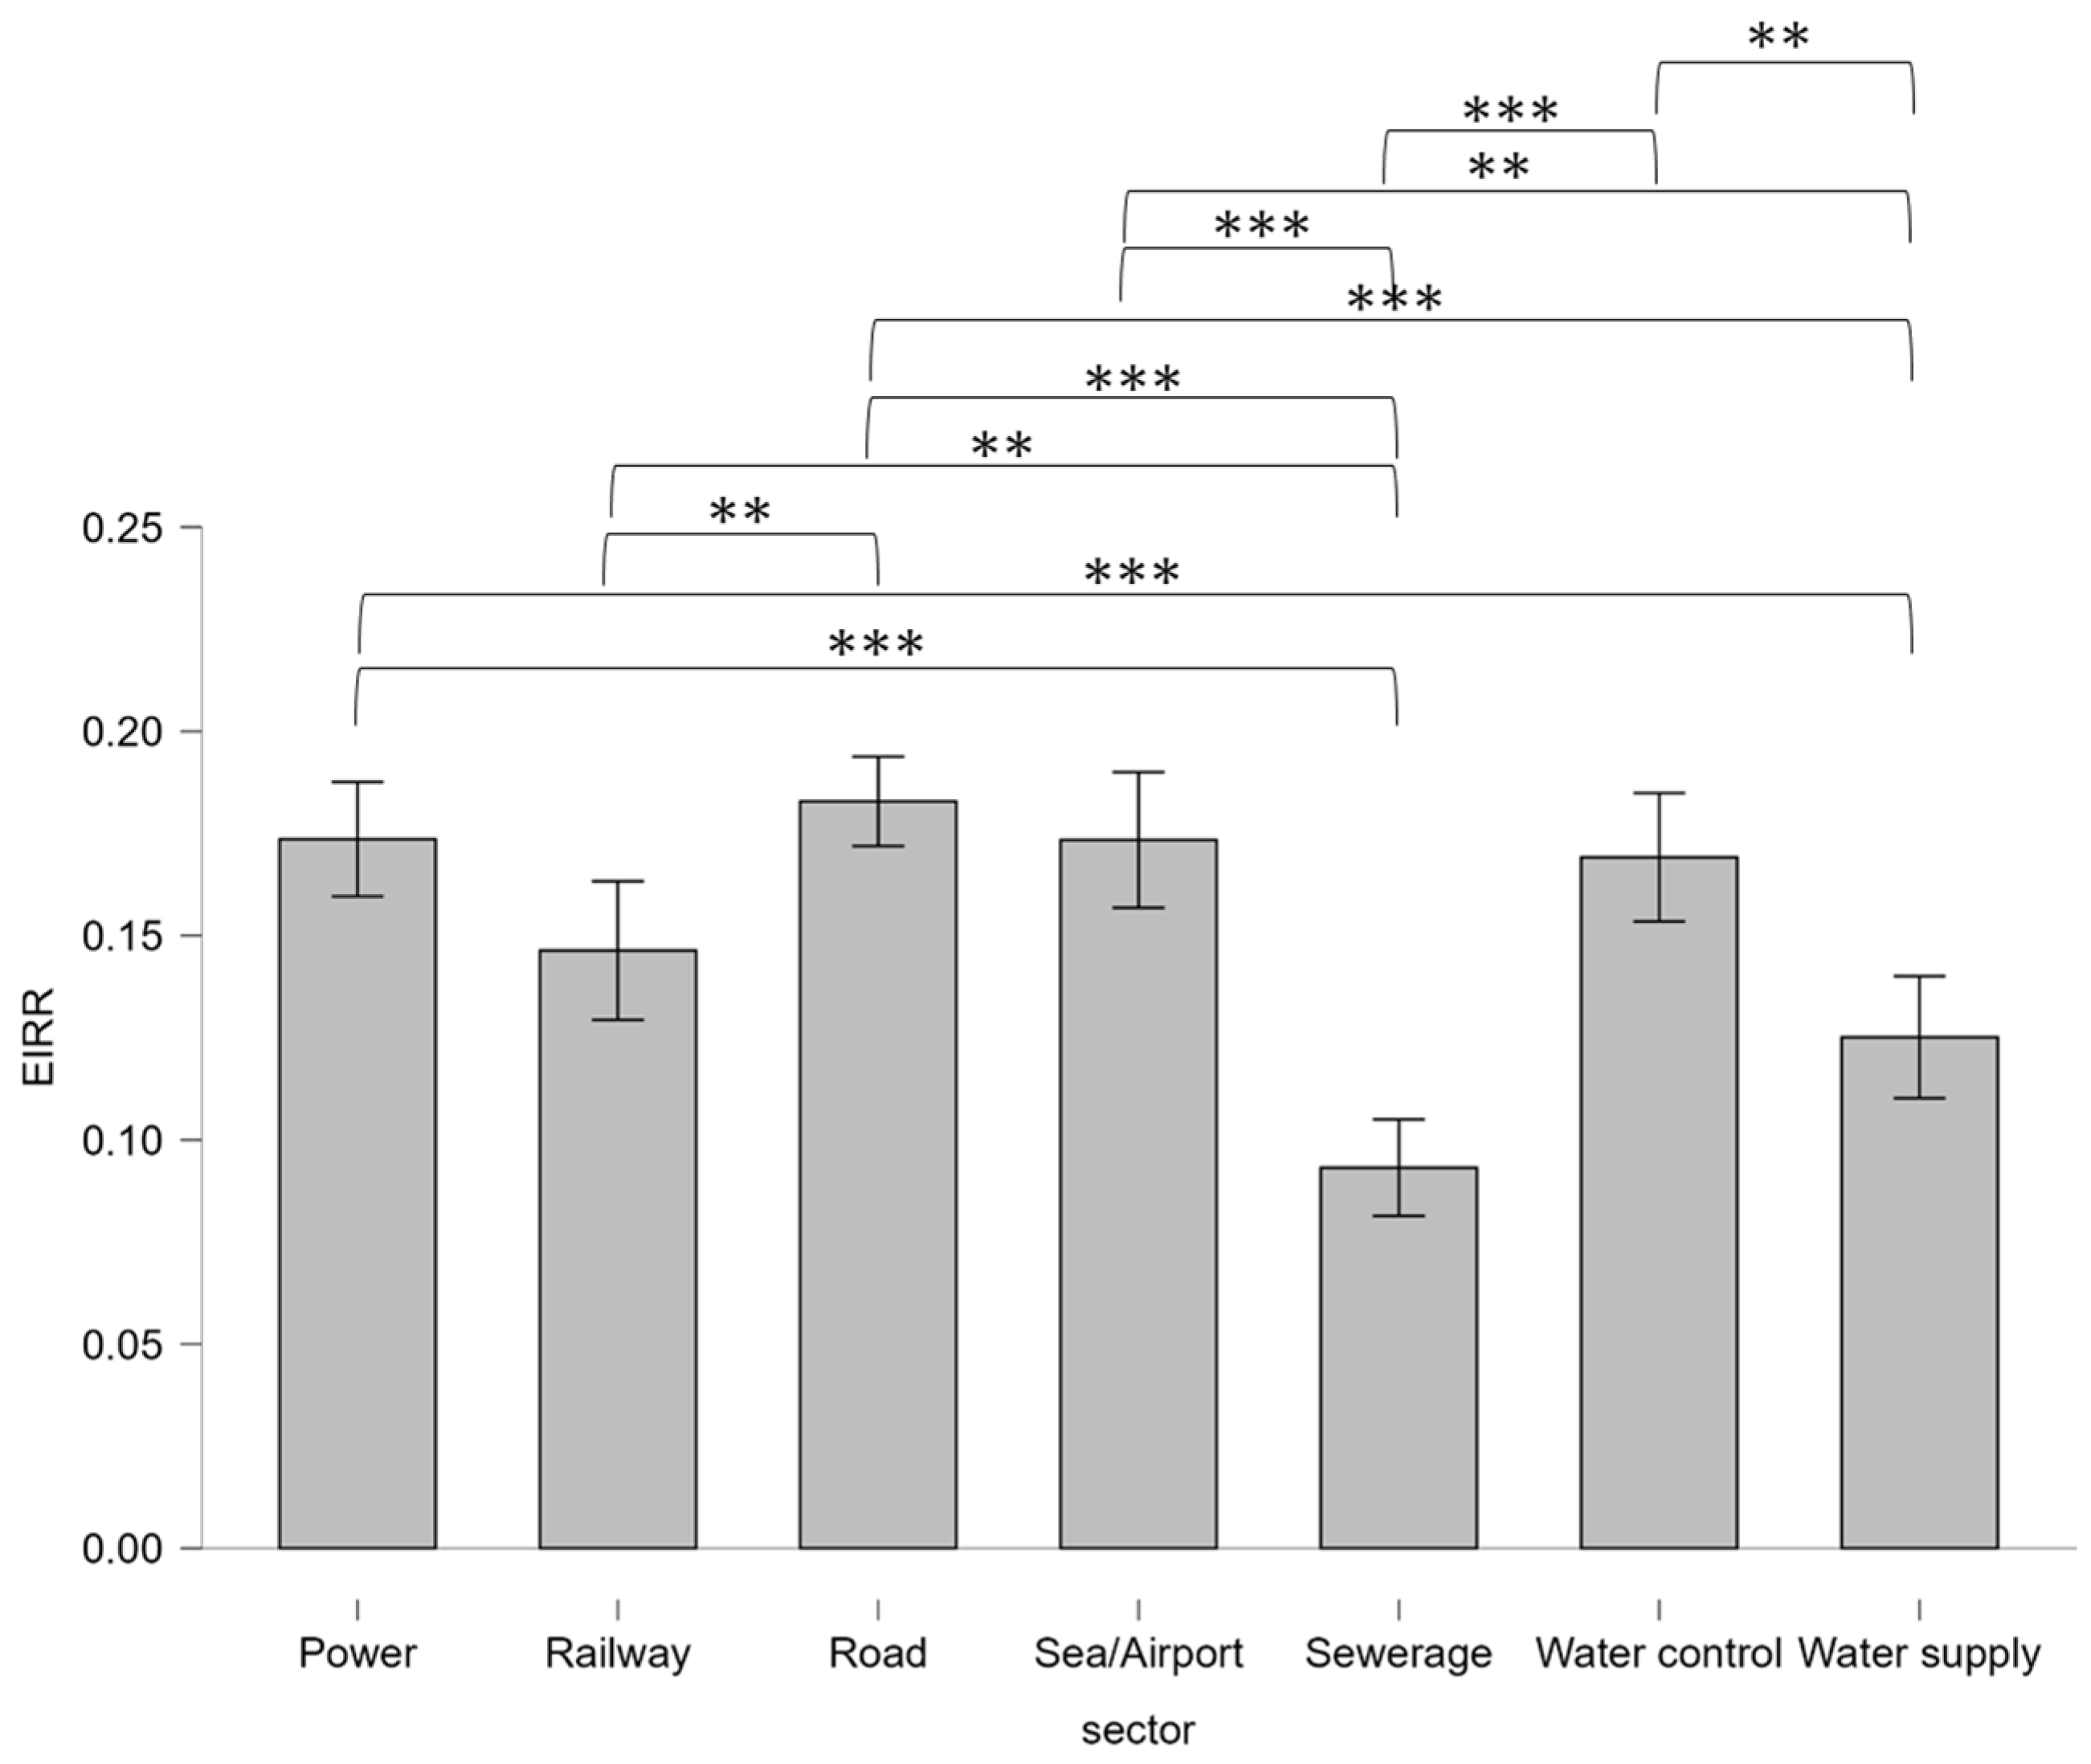
Based on the following MCTs, economic infrastructure sectors generally have statistically higher EIRRs than the water supply and sewerage sectors (p < 0.001 or p < 0.01) (see Figure 2). This implies that the former sectors generate a greater economic impact on investment costs due to the relatively higher shadow prices used for project benefit estimation. Notably, the sewerage sector has the lowest EIRRs of all the sectors, and its EIRRs are statistically lower than those of all other sectors except the water supply sector. Another finding from the MCTs is that road sector EIRRs are statistically higher than those of the railway sector (p < 0.01). It should also be noted that, in contrast to the ADB [33], which considers water control sector projects (e.g., flood control and disaster risk management projects) to have lower EIRRs, the EIRRs of water control sector projects show no significant differences from those of economic infrastructure projects. This may reflect that only projects with high economic impact have been selected in the water control sector under Japan’s ODA, whether by design or by coincidence, or that calculation conditions and methods for determining project benefits differ between institutions. For reference, MCTs conducted using the dataset including outliers also indicate that the power, road, sea/airport sectors generally have statistically higher EIRRs than the water supply and sewerage sectors (p < 0.001, p < 0.01, or p < 0.1).
Results of the t-test for averages of project type factors suggest that brownfield (rehabilitation and/or upgrade) projects have higher EIRRs than greenfield (new construction) projects, with strong statistical significance (p < 0.001). This may be because infrastructure in developing countries tends to be old and poorly maintained, making brownfield projects in those regions more cost-effective. As for tied project status, there is no statistically significant difference in EIRRs between tied projects (i.e., projects whose contracts are primarily tied to Japanese firms) and untied projects. The OECD previously reported that tied projects could be more expensive than untied projects by between 15% and 30% [48]. If this is the case, the finding that EIRRs of tied projects are comparable with those of untied projects suggests that the absolute value of the economic impact of tied projects tends to be greater than that of untied projects (i.e., tied projects tend to have greater economic impacts sufficient to compensate for their higher costs). For reference, t-tests conducted using the dataset including outliers yield consistent results.
Overall, the results of the statistical analysis indicate clear differences in EIRRs across sectors, consistent with findings from previous research. Economic infrastructure projects—particularly those in the power, road, and port/airport sectors—tend to exhibit higher EIRRs than social infrastructure projects, especially sewerage and water supply projects, which supports our hypothesis. Project type also emerges as an important factor influencing EIRRs, with brownfield projects exhibiting higher EIRRs than greenfield projects, consistent with practitioners’ reported experience. Meanwhile, no significant difference in EIRRs is observed between tied and untied projects.

4.2. Analysis of Differences Between the Ex Ante and Ex Post EIRRs

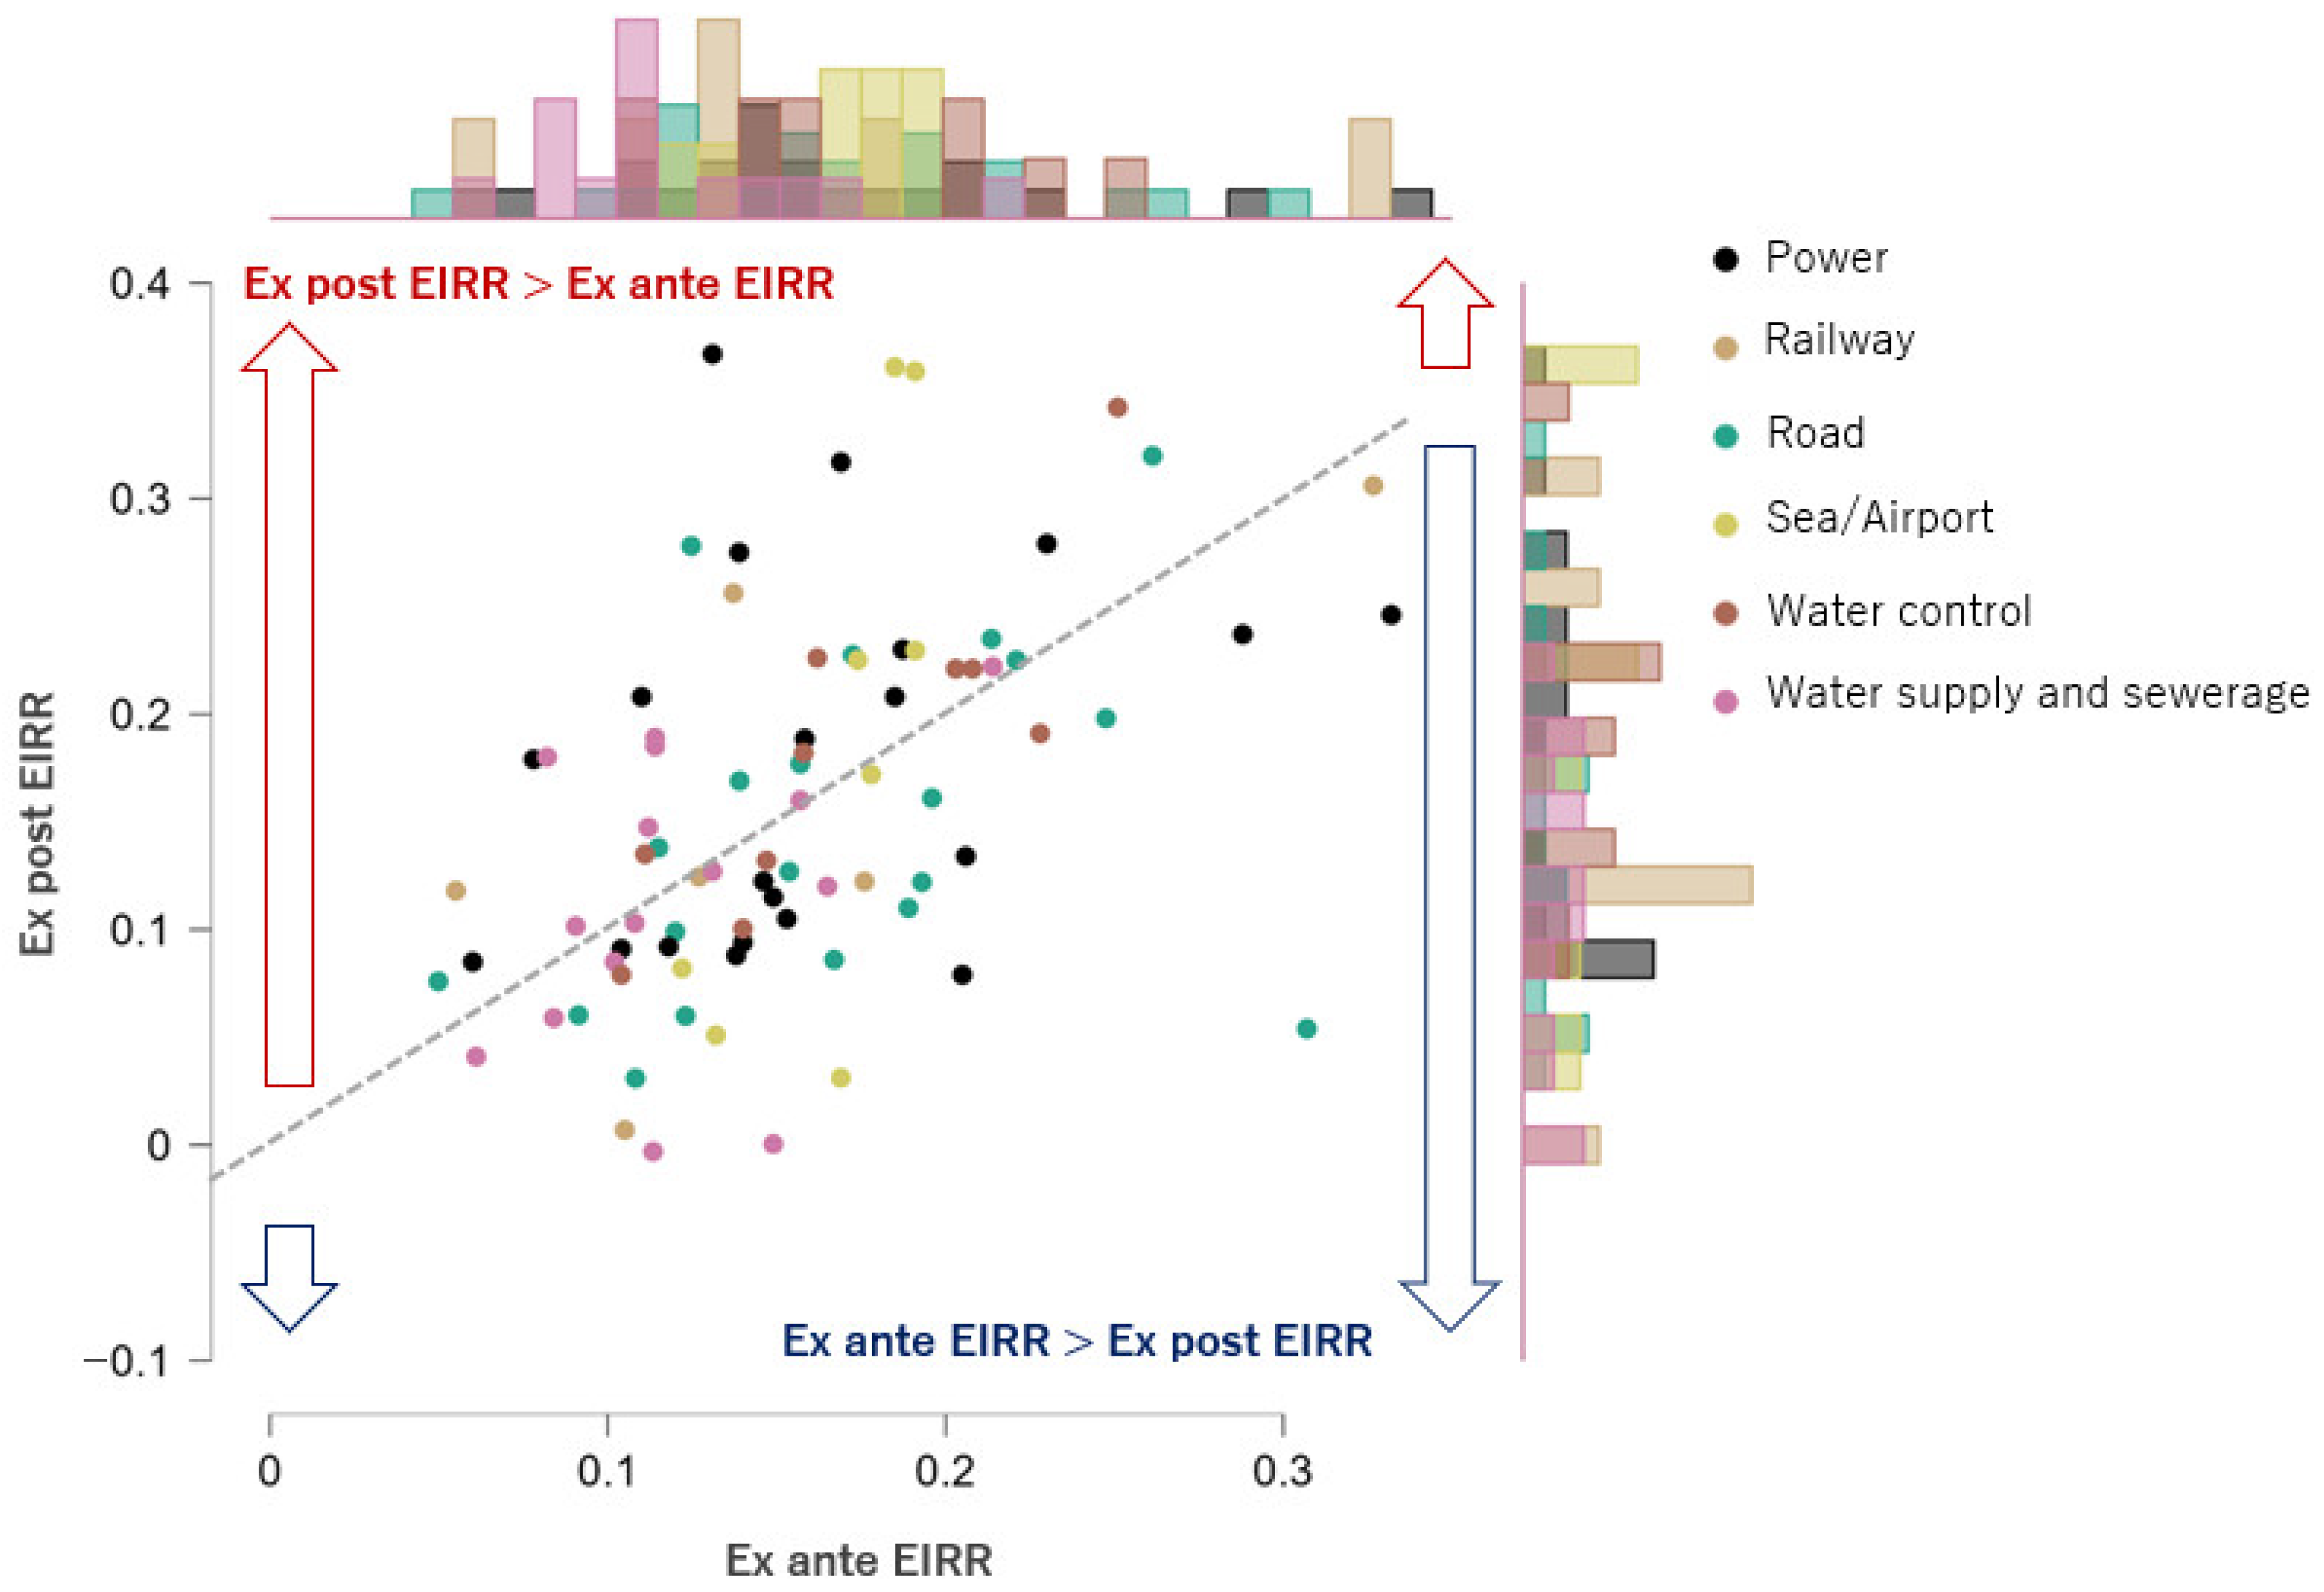
Following the analysis of EIRRs at the ex ante appraisal, we examined the differences between the ex ante and ex post EIRRs using actual data from 84 projects, for which EIRRs were recalculated after the construction work was completed. The results are shown in Figure 3. It is noticeable that there are both projects with higher and lower ex ante EIRRs compared to ex post EIRRs, regardless of the project sector. The figure also shows that some projects have almost identical values between the ex ante and ex post EIRRs, although such projects are relatively few.
Classification of the projects by the differences provides interesting implications (see Table 3). First, all sectors show variations in the deviation—namely, downward deviations of 20% or more, downward deviations of less than 20%, upward deviations of less than 20%, and upward deviations of 20% or more. All sectors have projects exhibiting both downward and upward deviations. It is noticeable that 65% of the projects (55 out of 84 projects) exhibit upward or downward deviations of 20% or more in the EIRRs, implying that the accuracy of EIRR calculations at the time of project appraisal was not very high. This result is consistent with the findings of previous studies, which suggest difficulties in calculating accurate EIRRs (i.e., [23,24]), and it also supports our initial hypothesis.
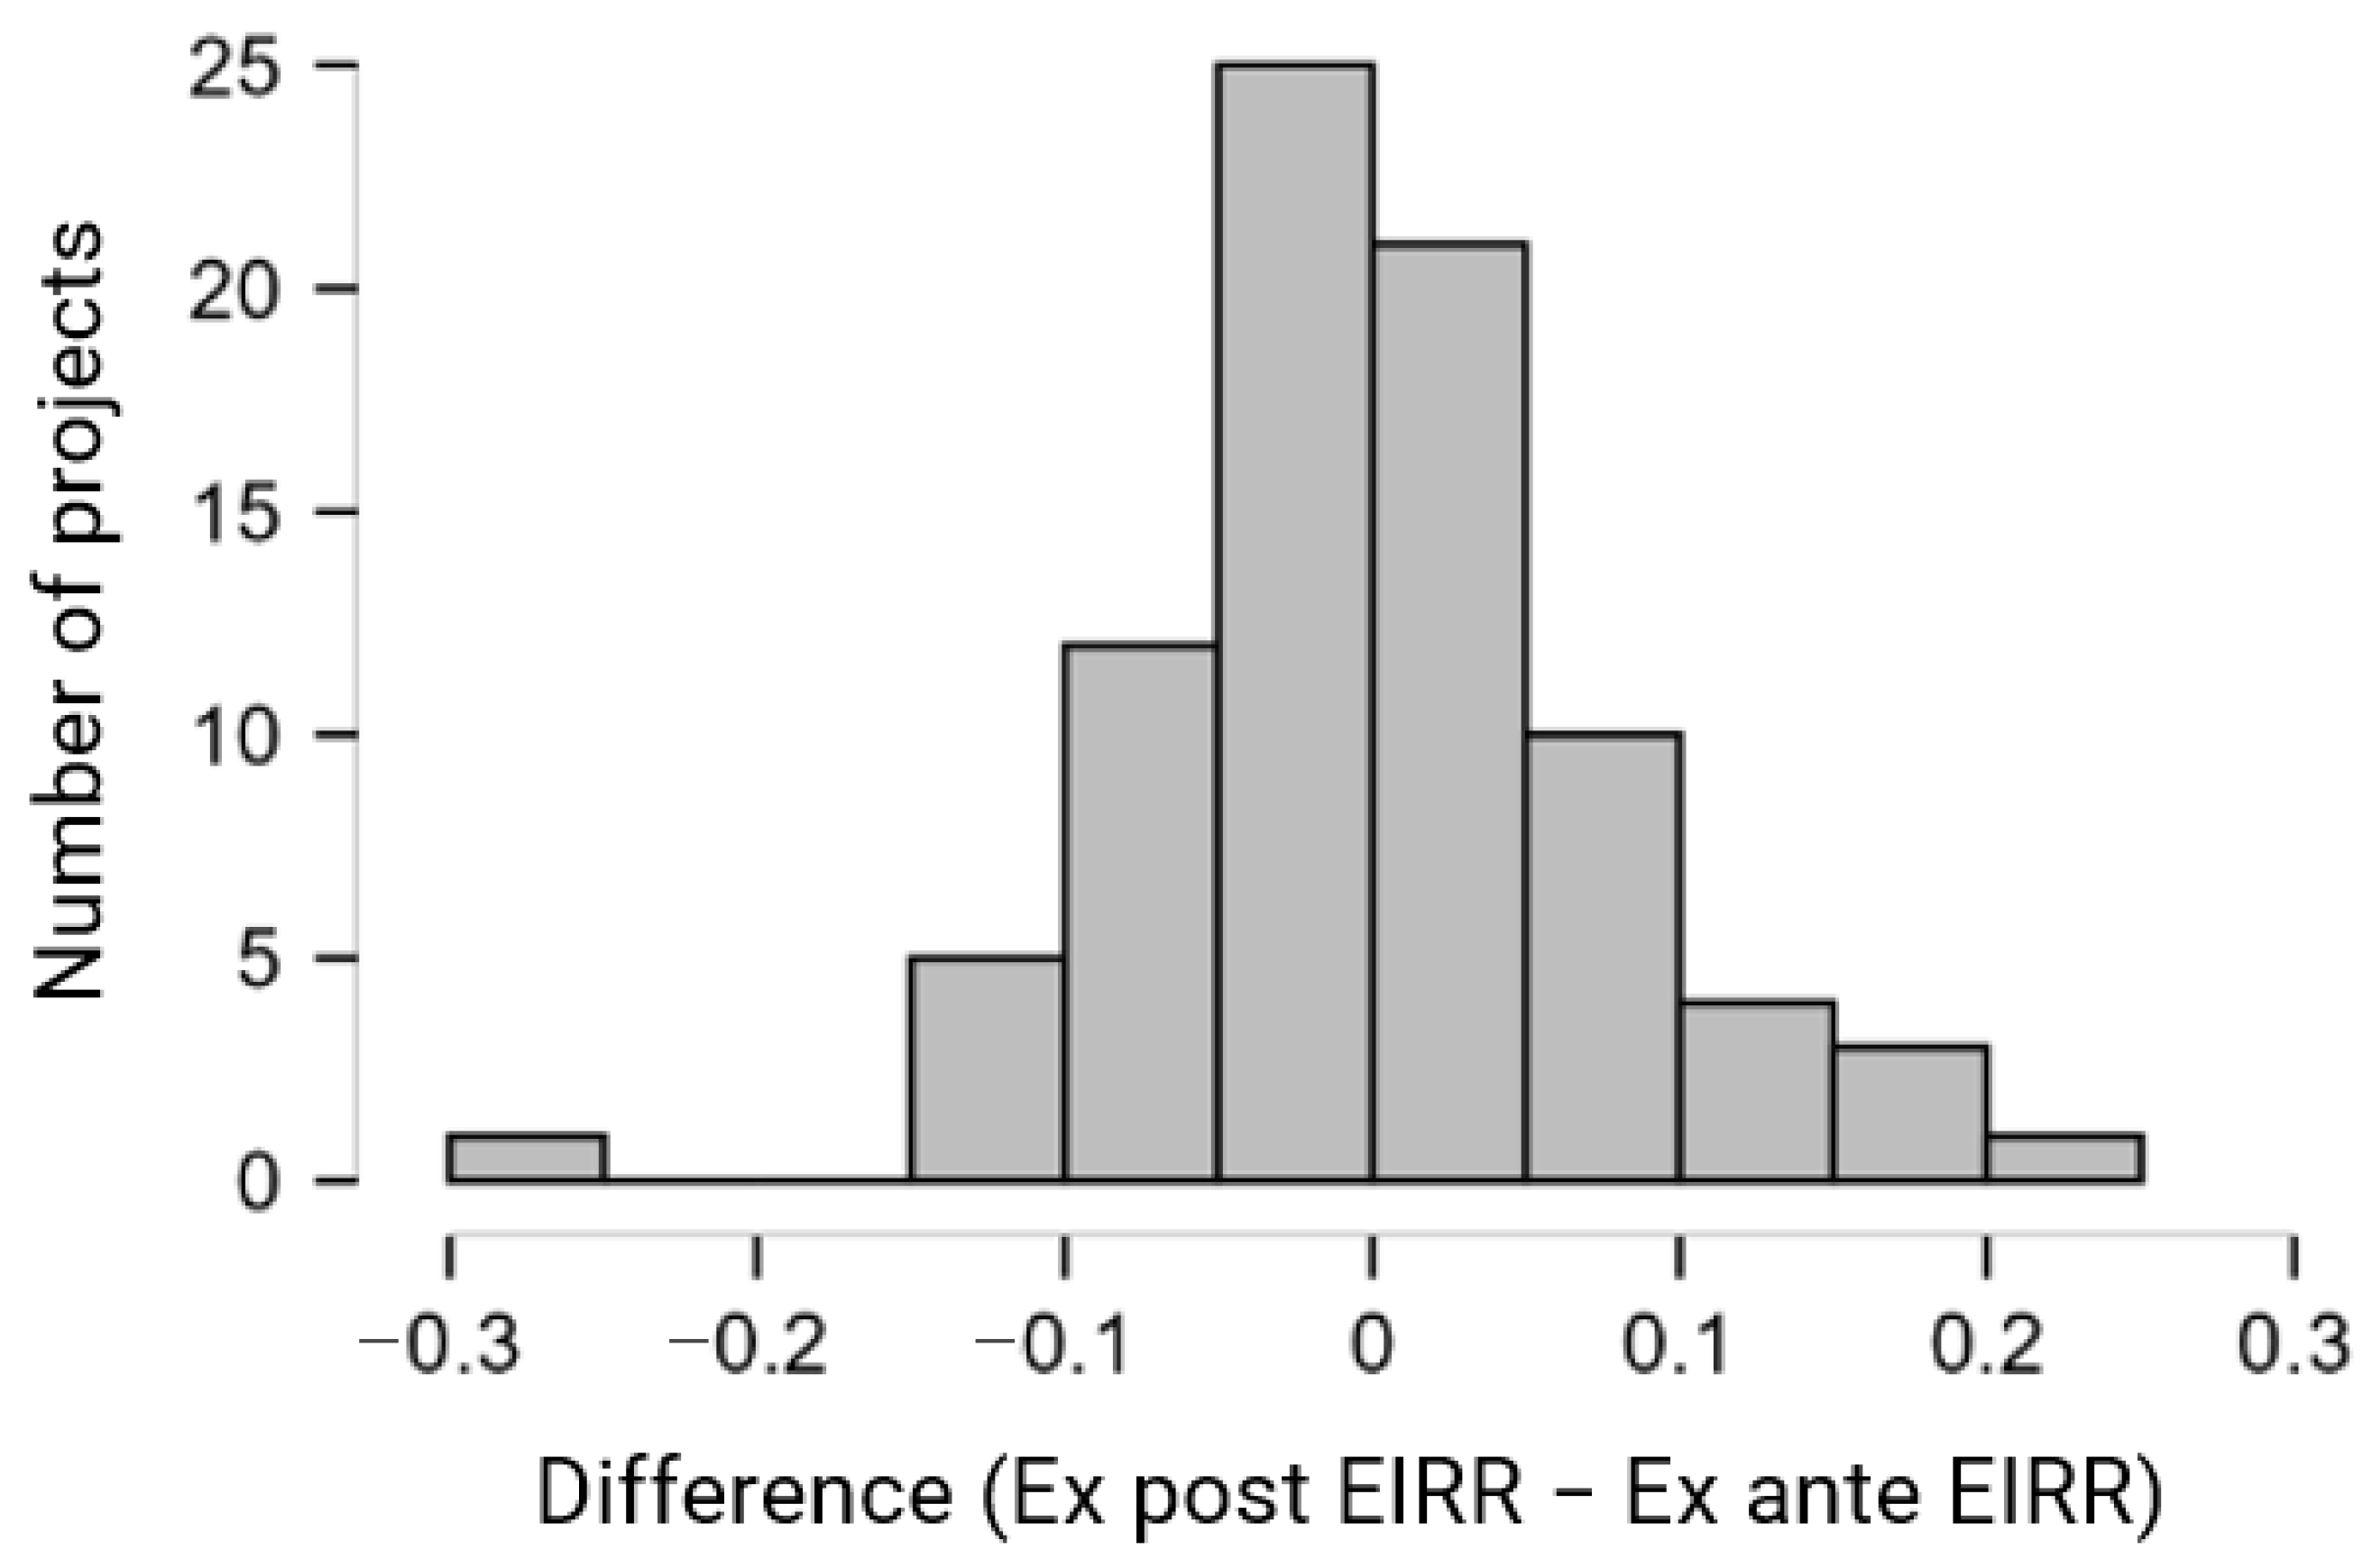
Another important finding is that the distribution of the deviations is almost symmetrical in the upward and downward directions. Specifically, in 46% of the projects (39 out of 84), the ex ante EIRRs were estimated to be lower than the actual values, while in the remaining 54% (45 out of 84), they were estimated to be higher. The distribution of differences between ex ante and ex post EIRRs based on the 82 valid data points (see Figure 4), after excluding two records that lacked numerical values, showed low skewness (0.17) and moderate kurtosis (1.26). The Jarque–Bera test does not reject the null hypothesis of normality at the 5% significance level (p = 0.054), and the Shapiro–Wilk test likewise does not reject the null hypothesis of normality (p = 0.21). Consistent with the apparent symmetry of the distribution, a t-test indicates that the mean difference between ex ante and ex post EIRRs does not differ significantly from zero, t(81) = 0.049, p = 0.961. The effect size is negligible (Cohen’s d = 0.005). Taken together, these results suggest that the observed differences are unlikely to reflect systematic bias in ex ante EIRR estimation and are instead attributable to natural random variation.
This result differs from previous studies, which suggest that the ex ante EIRRs tend to be larger than ex post EIRRs mainly due to behavioral biases and political motivations (e.g., [23,24,47]); nevertheless, it supports our initial hypothesis.
This poses the question of why differences arise between the ex ante and ex post EIRRs. Table 4 summarizes the potential reasons for the differences, which are drawn from the post-evaluation reports that include assessment of how ex ante and ex post EIRR values differ and provide explanations for those differences. To create the table, the reasons provided in each report were coded. Specifically, each stated reason was extracted and categorized into analytically consistent groups. For instance, the report for the El Jem–Sfax Motorway project states: “The FIRR and EIRR are lower than those estimated at the appraisal stage. Main reasons considered are: (i) the actual traffic volume is lower than the projected volume by about 20%; and (ii) the period when investment costs have incurred is longer than planned since the commencement of the project was delayed by about 2 years and thus it resulted in delay of occurrence of benefits as well.” Based on this, the reasons for the differences are classified into “Change in demand” and “Change in project period.” This coding method was applied across all the projects and used to compile Table 4.
It is noticeable that a change in demand is the biggest reason for the difference, regardless of sectors. A change in project cost is the second biggest reason, and this is critical, especially for road, power, and sea/airport sector projects. These two factors are regarded as critical factors causing the difference between the ex ante and ex post EIRRs, consistent with the findings of previous research (e.g., [23,24]). On the other hand, this research implies that other factors related to the calculation of the benefits and changes in the project period can also cause a deviation from the original estimation. In particular, when it comes to downward deviations, changes in the project period seem to have a stronger influence.
Overall, even for projects under Japan’s ODA loan, it is difficult to estimate EIRRs without errors due to various inevitable and avoidable factors, such as changes in demand, project cost, and project duration. This result is consistent with the extant research and supports our hypothesis. On the other hand, there appears to be no systematic bias toward inflating the EIRR estimates for projects under Japan’s ODA loan.

4.3. Reasons Why Some Projects Were Financed Despite Having Low Ex Ante EIRRs

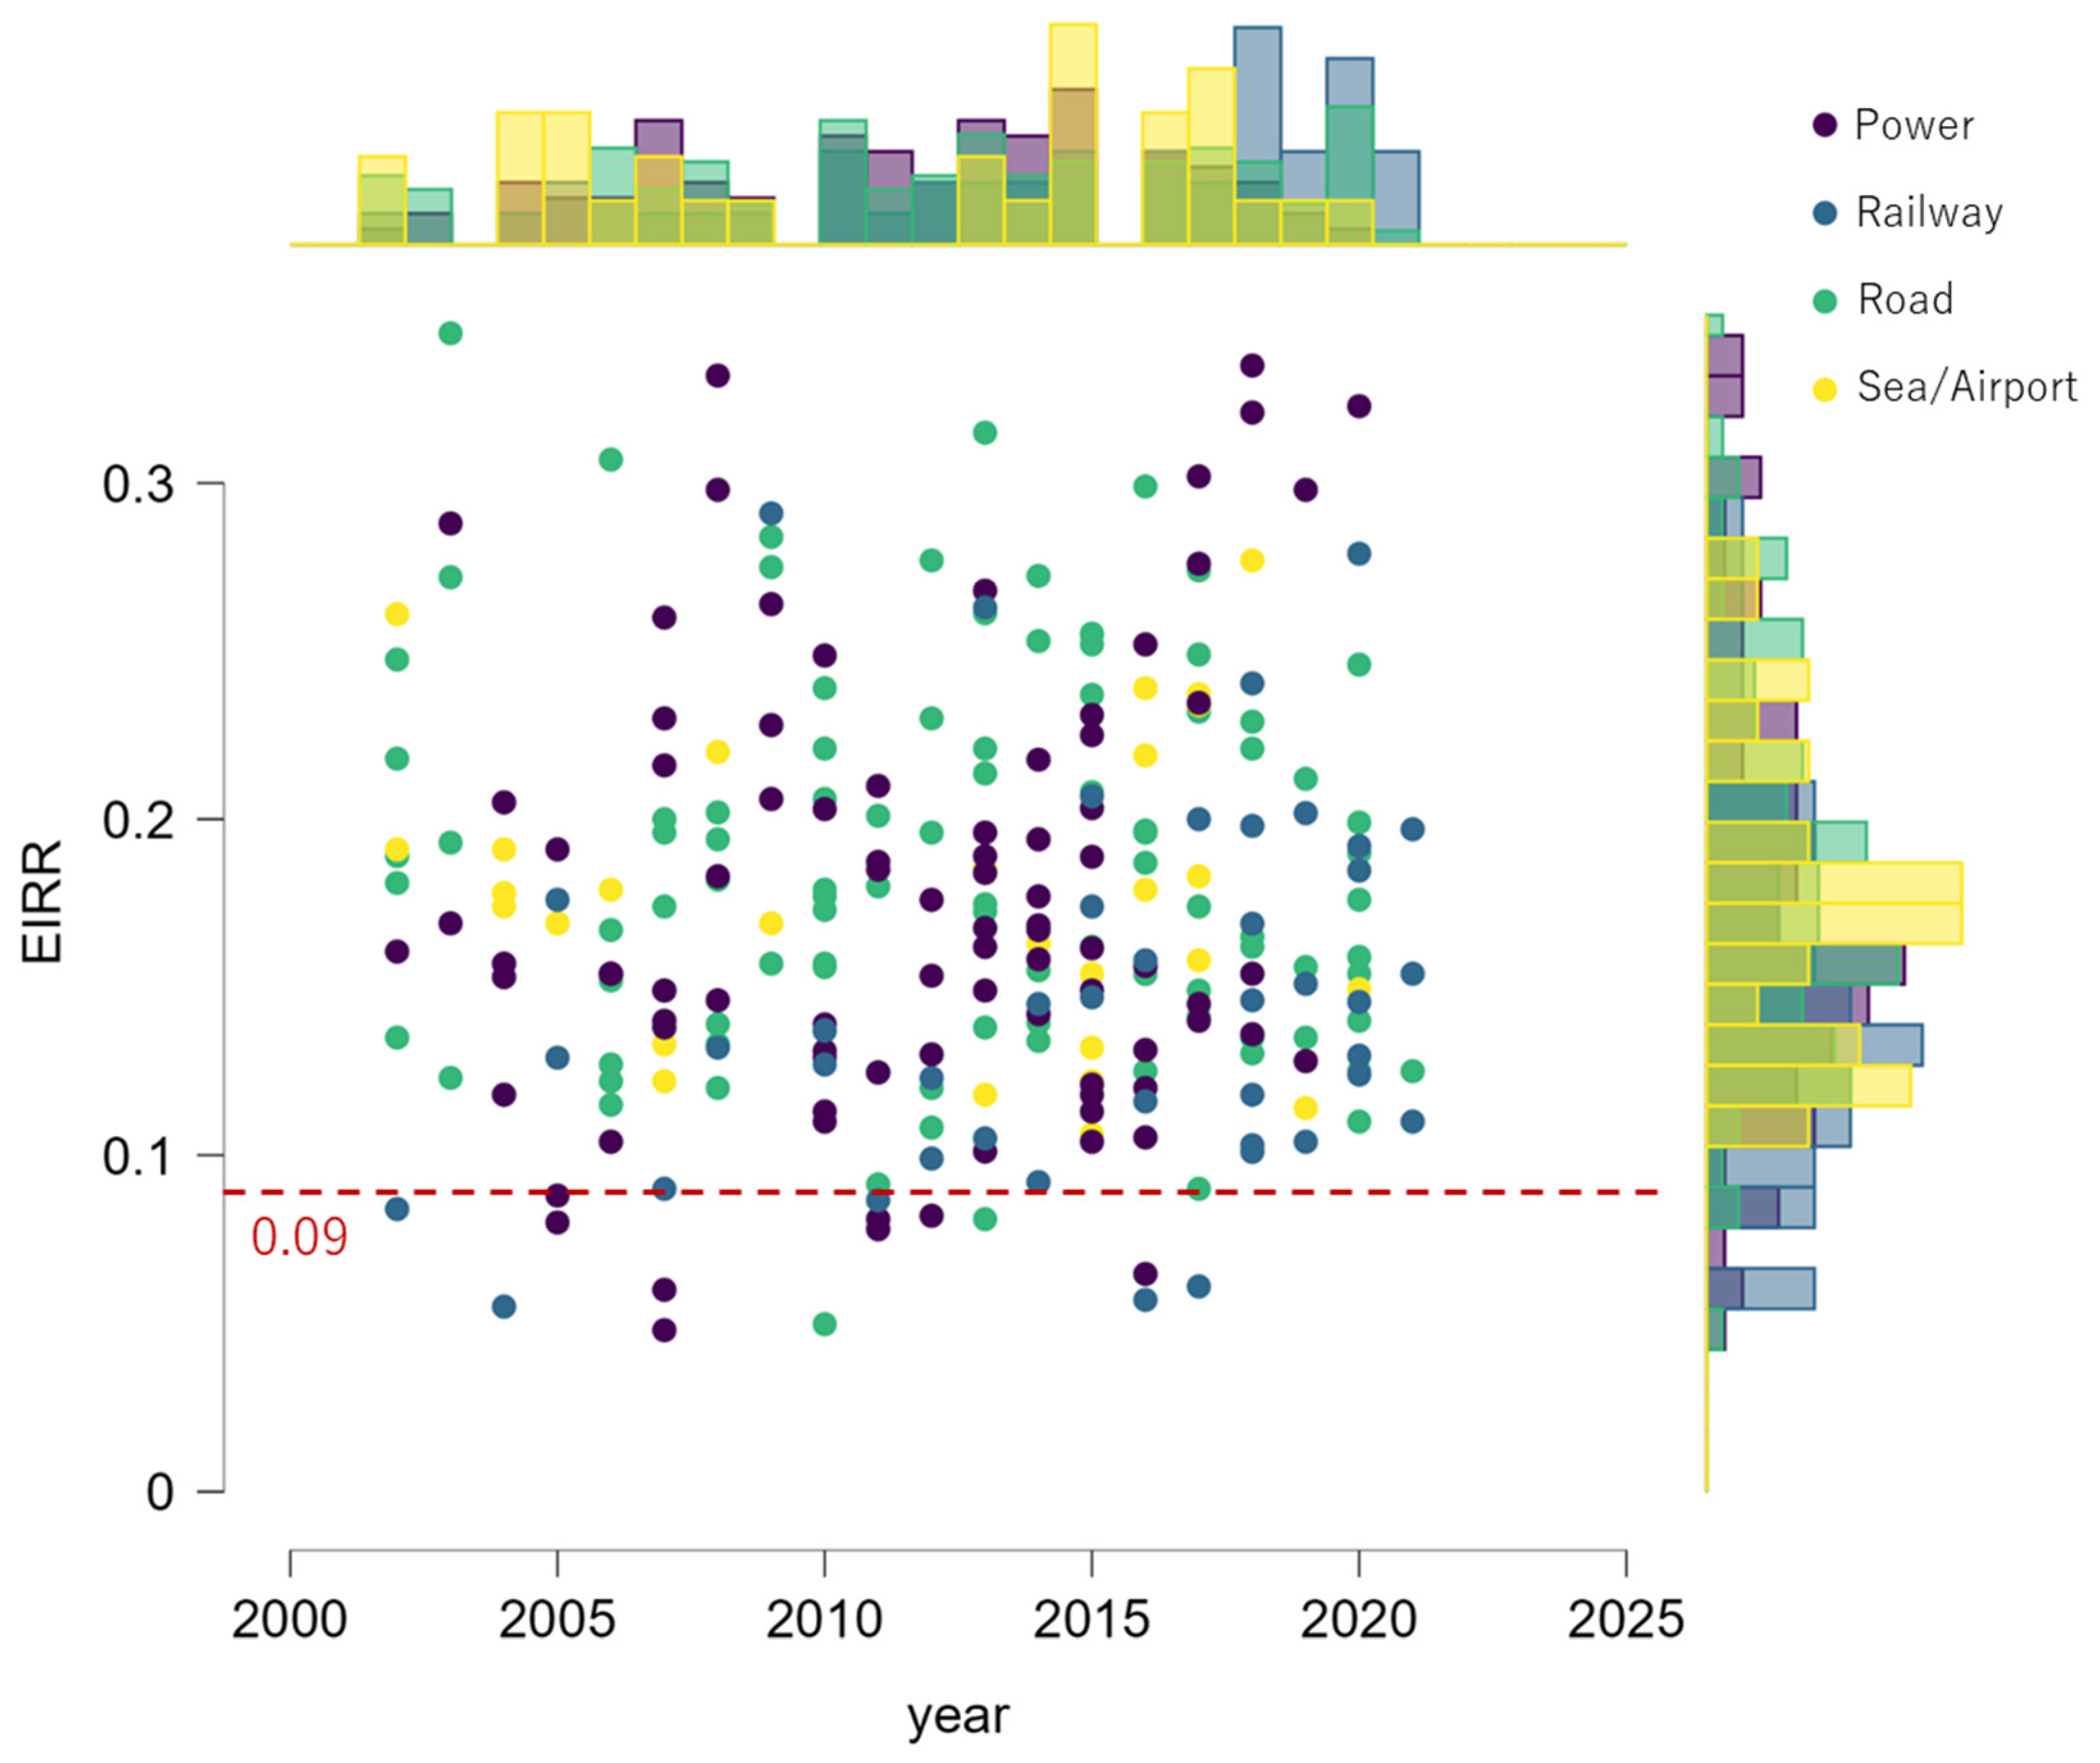
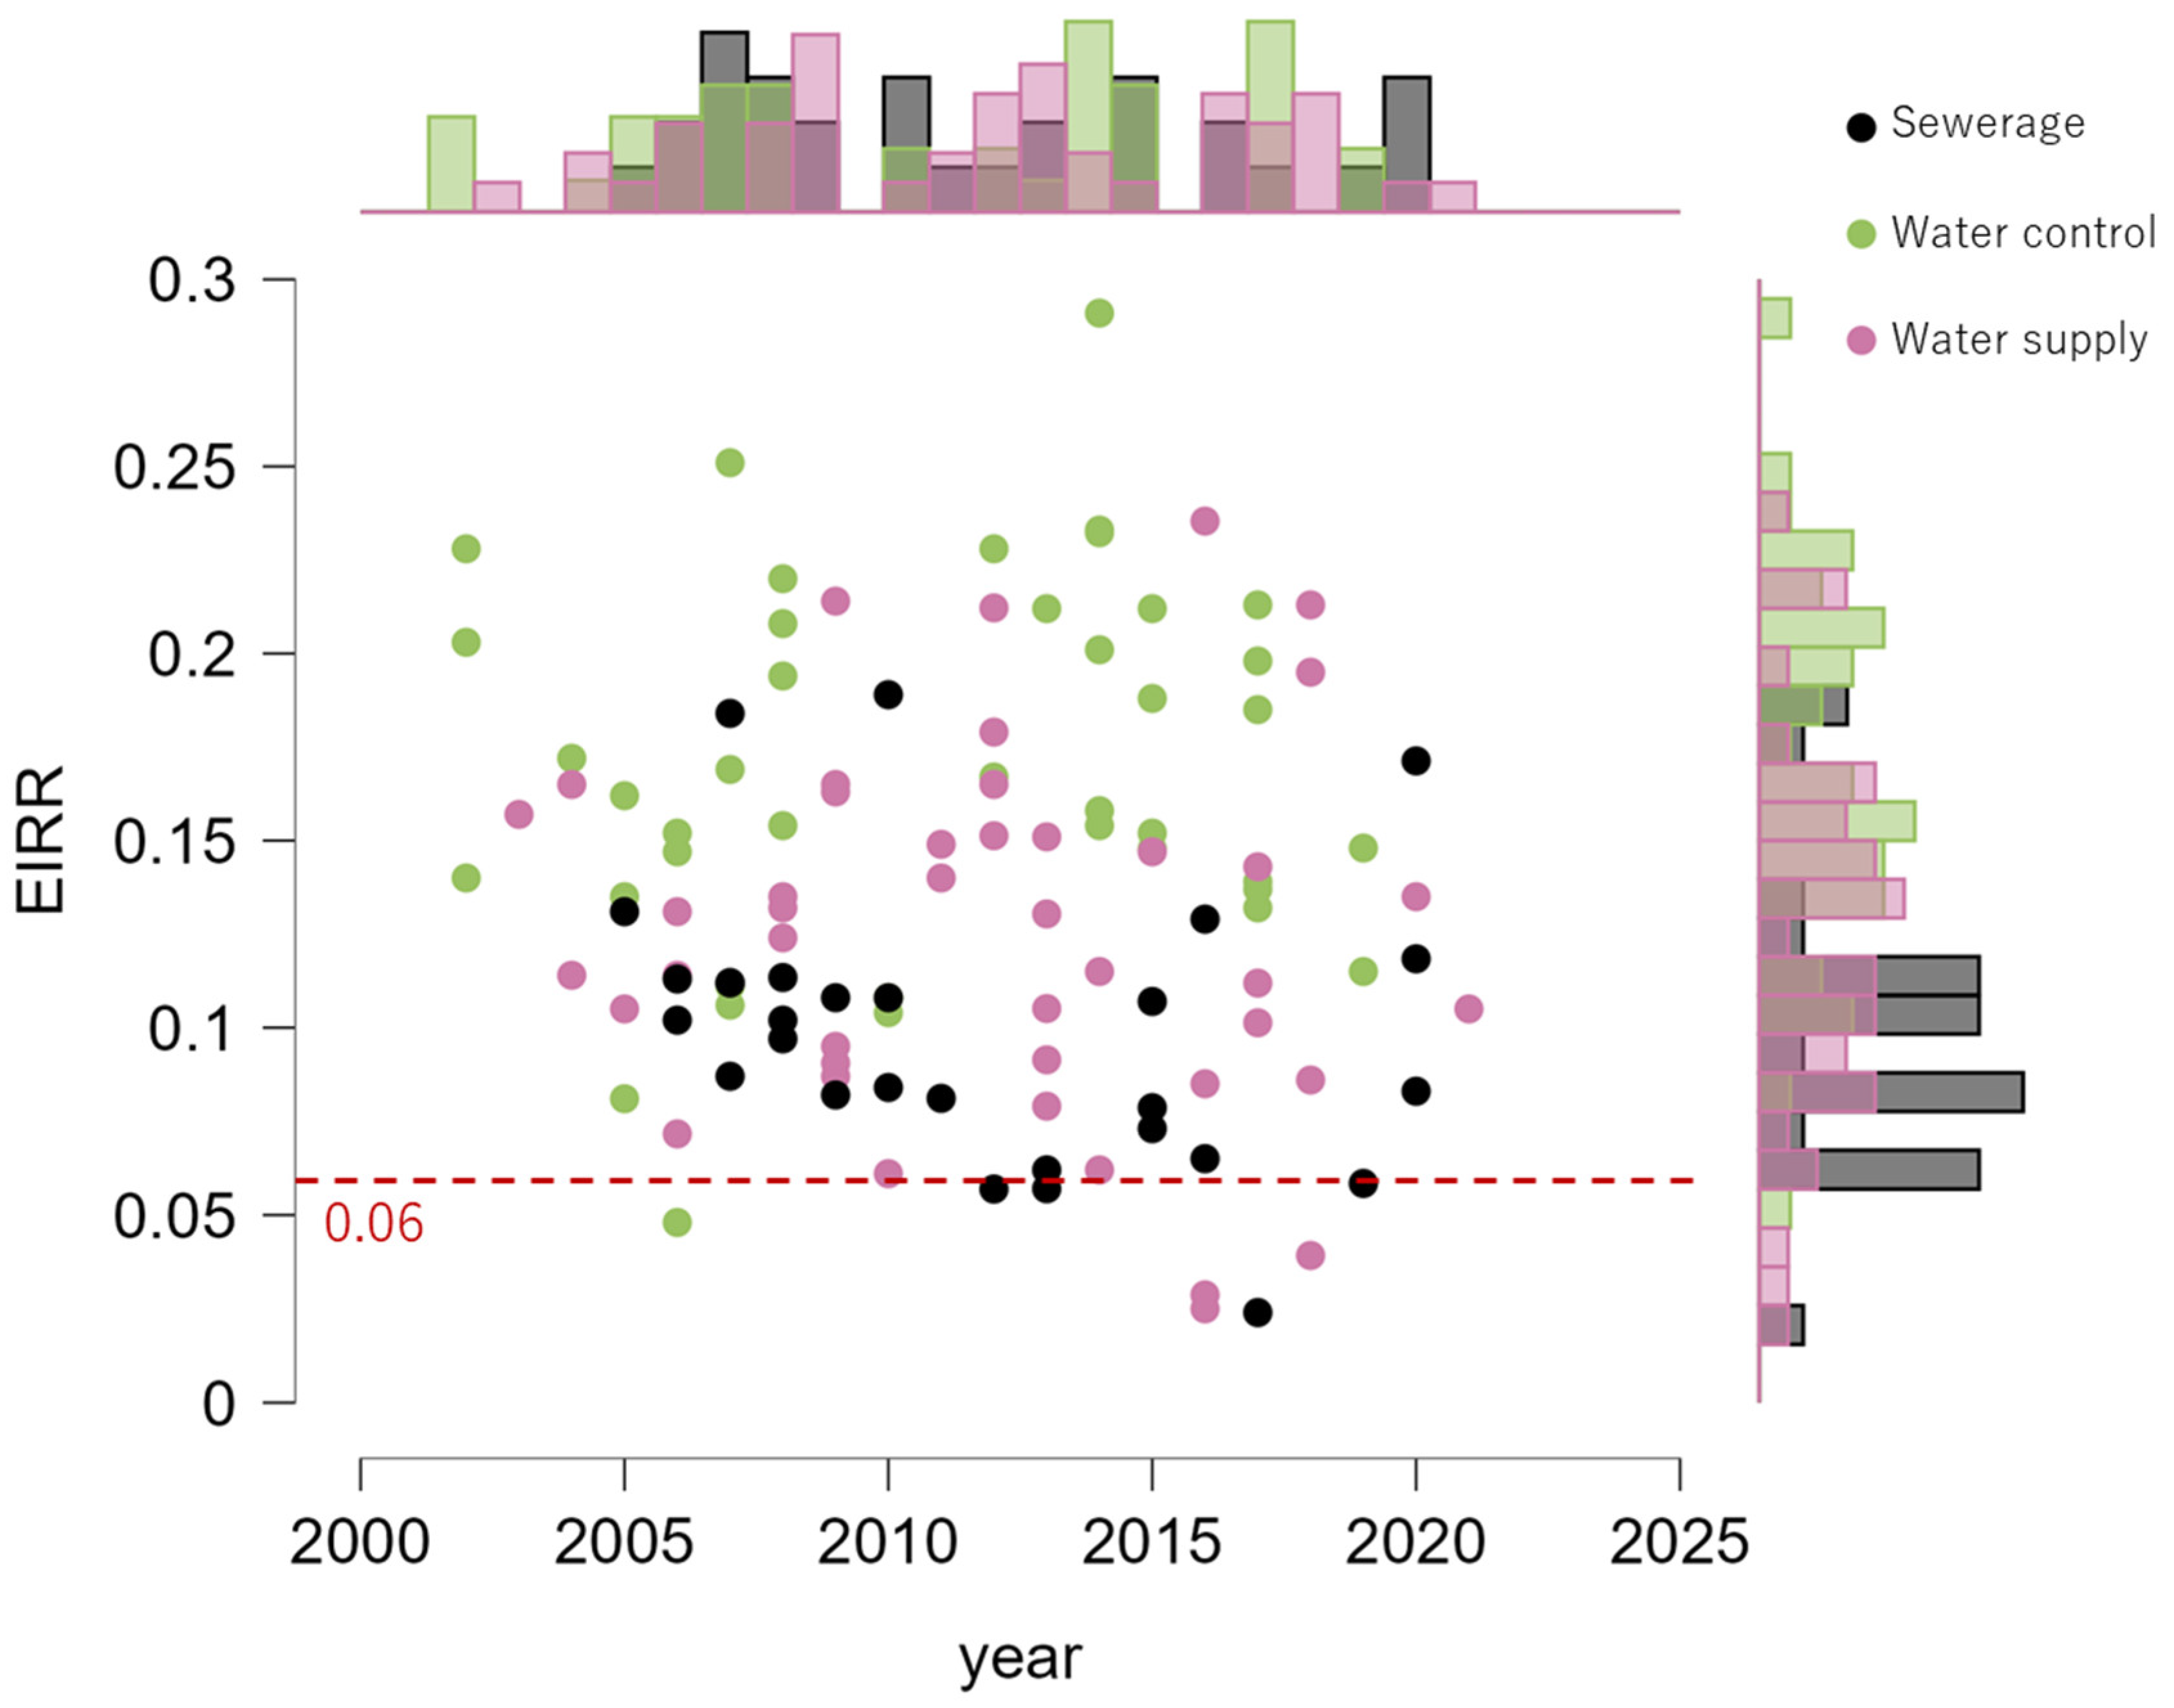
To consider what information should be taken into account in decision-making—alongside the results of the CBA—we analyzed reasons why some projects were financed despite low ex ante EIRRs. To do so, we first identified projects with low ex ante EIRRs, defined as those with EIRRs less than or equal to 9% for economic infrastructure projects and less than or equal to 6% for social infrastructure projects. Figure 5 and Figure 6 plot time-series data on ex ante EIRR data for economic and social infrastructure projects, respectively. Most of the projects have higher ex ante EIRRs than the thresholds over time. However, it should be noted that 17 economic infrastructure projects and 9 social infrastructure projects have ex ante EIRRs at or below the respective thresholds.
Regarding the reasons why these projects were financed despite their low expected economic impact, it was difficult to rigorously analyze them based solely on the ex ante and post-evaluation reports. While the reports do explain the importance of the projects and provide justifications for Japan’s ODA financing, they generally do not clearly articulate which factors outweighed the low EIRRs in the decision-making process. Therefore, we sought to obtain more nuanced and plausible explanations by qualitatively analyzing the reports, focusing on several case projects in each sector.
In the road sector, for instance, the Landslide Disaster Protection Project (LDPP) of the National Road Network in Sri Lanka recorded an EIRR of 8.1 percent at the time of the ex ante evaluation (Ex ante evaluation report for the Landslide Disaster Protection Project of the National Road Network). Evaluating the EIRR of this project is challenging, as it is closely tied to external factors such as the severity of the disaster and the extent of damage to the surrounding area. Some of the indicators—such as reduced disaster recovery costs, reduced road repair costs, and reduced emotional stress—are considered in the calculation, but the degree of these indicators depends on the intensity of disasters. For such projects, greater significance and priority appear to have been given to other elements than EIRR, which may eventually result in a lower EIRR. In the case of the LDPP, the primary significance and purpose of the project was disaster mitigation in line with the national plan, known as the “Mahinda Chintana” (Ibid.).
Similar cases can be found in the railway sector. For instance, the Tashguzar–Kumkurgan New Railway Construction Project in Uzbekistan appears to have prioritized alignment with national plans and security considerations, rather than the EIRR. The project enabled the national railway network to pass through southern regions while bypassing Turkmenistan, thereby ensuring domestic transport corridors were available across the southern region, enhancing border security for southern Uzbekistan (Ex ante evaluation report for the Tashguzar–Kumkurgan New Railway Construction Project). Moreover, there may have been commercial considerations for Japan, as the project was a tied loan for which contracts were primarily awarded to Japanese firms.
For the railway sector, projects tend to apply time-sliced loans—that is, a subsequent time-sliced loan is likely to have a lower EIRR due to the increase in project costs compared to the initial loan. In the Bangalore Metro Rail Project, while the EIRR for the first loan was 25.9% (Ex ante evaluation report for the Bangalore Metro Rail Project), that of the second loan was just 8.7 percent at the time of ex ante evaluation (Ex ante evaluation report for the Bangalore Metro Rail Project (II)). This is largely attributed to the increase in the total project cost. At the time of the first loan, the total project cost was estimated at approximately JPY 133 billion, which increased to around JPY 307 billion. Naturally, the doubled total project cost significantly affected the “costs” for the EIRR calculation. This tendency has also been observed in other metro projects in India, such as the Chennai Metro Project (V) (Ex ante evaluation report for the Chennai Metro Project (V)). The reason these projects were implemented despite their low EIRRs—aside from the fact that they were follow-on projects under time-sliced loans—can be attributed to the priority given to continuity of contract management for the construction supervision consultants, construction companies, and other parties that have multi-year contracts financed by the loan.
As for the power sector, some projects have low EIRRs. The reasons for this appear complex; however, one reason could be that the cost of generating electricity using fossil fuels—calculated as the cost of alternative power sources in the “without case” for the EIRR calculation—is not relatively high under such projects, compared to the cost of generating electricity by facilities built in the project. For power sector projects, humanitarian considerations and diplomatic relations between Japan and the recipient country, based on national interests, may explain why such projects were financed despite the low EIRRs.
In terms of demonstrating how humanitarian considerations can be applied, the Vavuniya–Kilinochchi Transmission Line Project (II) in Sri Lanka is a good example. In this project, the transmission lines and substations destroyed during the conflict were reconstructed, contributing to an improvement in the lives of residents in the project area, who experience a higher rate of poverty compared to other regions of the country (Ex ante evaluation report for the Vavuniya–Kilinochchi Transmission Line Project (II)). Another example is the Rural Electrification Project (Phase 2) in Bhutan. This project aimed to improve access to electricity for households in rural areas of Bhutan that were previously unelectrified. The ex ante evaluation report emphasized that the project would contribute to the promotion of poverty reduction as follows: “The rural villages are heavily inhabited by the poor (40%) in comparison with the national average (23%) poverty ratio. Among these rural villages, the target areas of this project are the most remote areas among rural villages in particular.” (Ex ante evaluation report for the Rural Electrification Project (Phase 2)). For diplomatic relations between Japan and the recipient country based on national interest, the Hurghada Photovoltaic Power Plant Project in Egypt is a good example. In this project, the first solar power plant with storage batteries was installed in the country to promote the renewable energy development policy. Considering the high expectations of the Egyptian government, the project was deemed essential from the perspective of deepening bilateral relations between Japan and Egypt. In addition, the ex ante evaluation report implies that the project aimed to promote Japanese companies’ business in Egypt, especially in the power sector (Ex ante evaluation report for the Hurghada Photovoltaic Power Plant Project).
Regarding social infrastructure projects, the Anuradhapura North Water Supply Project (Phase 2) was financed in the northern part of Anuradhapura District in Sri Lanka, although the EIRR was just 2.5 percent. The EIRR calculation for the project also considered the following benefits: (1) “reductions in costs for using alternative water sources to water supply systems” and (2) “benefits from water consumption amount increased after the project implementation.” (Ex ante evaluation report for the Anuradhapura North Water Supply Project (Phase 2)). On the other hand, improvement in public health—which is generally considered an important factor in calculating EIRR for water supply projects—was not included in the calculation. This could be one of the reasons for the low EIRR.
Based on these factors, it was decided that the project in Anuradhapura should be financed, despite its low EIRR. The most plausible reason given at the time was the growing seriousness of public health problems and the high policy necessity. The ex ante evaluation report for the project indicates that the northern part of Anuradhapura District relied primarily on well water as its local water source; the water supply coverage rate was only 26.9 percent, which was lower than the national average (45.0 percent in 2015) (Ibid.). In addition, the water quality of some (test) locations in the project area showed that fluoride concentrations in the groundwater (i.e., the source of drinking water) exceeded Sri Lankan water quality standards. This caused severe negative health impacts in the district, with the prevalence and severity of dental fluorosis—resulting from high concentrations of fluoride—ranked highest in the country based on the community fluorosis index (CFI). Furthermore, pesticide and other groundwater contamination were considered to contribute to the high incidence of chronic kidney disease (CKD) in North Central Province (Ibid.). On the other hand, improvements in public health resulting from the project were not included in the EIRR calculations. This was likely due to difficulties in identifying the causal relationship between the project implementation and its impact on mitigating health issues.
Another example of a social infrastructure project was the Hanoi City Yen Xa Sewerage System Project (I), which involved the construction of the largest sewage treatment plant in Hanoi. According to the ex ante evaluation of the project, EIRR was calculated at 5.7 percent and was based on several projected benefits: increased land prices, willingness to pay, medical cost reduction, and tourism revenue (Ex ante evaluation report for the Hanoi City Yen Xa Sewerage System Project (I)). One possible reason for the low EIRR was the method used for calculating the EIRR. Before the project, sewage was generally treated using septic tanks in Hanoi, and the low cost of this treatment was used to calculate the benefits of the project, likely leading to the underestimation of the EIRR. Another plausible reason is that the reduction in environmental pollutants could not be fully included in the benefit calculation due to technical limitations, similar to the water supply project described above.
Nevertheless, the necessity and importance of implementing the project were considered high, likely due to its strong alignment with national policy priorities for sewerage development in the capital city and for mobilizing private funds. Rivers, water canals, and groundwater flowing through urban areas in Vietnam were subject to significant pollution loads from untreated household wastewater. Even in major rivers, the water quality did not meet national standards, and this has been an ongoing development issue (Ibid.). To address this critical environmental issue, in 2009, the Vietnamese government approved the “Orientation for sewerage and drainage development in urban areas and industrial zones to 2025 and vision to 2050” (Ibid.). The project was expected to be a “model” project contributing to this vision, as it aimed to develop the largest sewage treatment plant in the entire city through a public–private partnership (PPP) scheme (Preparatory study on construction project for Yen Xa wastewater treatment plant (PPP infrastructure project study)).
Overall, there may be diverse reasons why projects with low EIRRs were nevertheless approved for financing. Potential explanations include humanitarian needs, alignment with national development strategies, diplomatic and commercial considerations, and the need for continuity in contract management. However, these reasons remain hypothetical and are not substantiated by systematic empirical evidence. Ultimately, it appears that greater emphasis was placed on other significant factors in certain cases, reflecting a more holistic assessment of the projects’ overall contributions. This outcome supports our hypothesis to some extent. Nevertheless, due to the limited availability of convincing and objective information, it remains difficult to determine what specific factors were critical and how they were weighed relative to the low estimated economic impact.

5. Discussion

5.1. How Should We Utilize the CBA in the Future?

Based on the above results, the answers to the research questions are summarized as follows.
RQ1: What types of projects have achieved higher or lower results of CBAs among past infrastructure projects under Japan’s ODA loans?
Economic infrastructure projects tend to exhibit higher EIRRs than social infrastructure projects, and brownfield projects generally outperform greenfield projects.
RQ2: To what extent can CBA results be relied on for decision-making in infrastructure project development?
EIRR estimates are subject to substantial uncertainty—primarily driven by changes in demand, project costs, and implementation periods—which calls for cautious interpretation of CBA results, even though their importance is well recognized.
RQ3: What factors can support decision-making in sustainable infrastructure development beyond CBAs?
Various non-economic factors—such as humanitarian needs, alignment with national development strategies, diplomatic and commercial considerations, and the need for continuity in contract management—may also play an important role in financing decisions in addition to the CBA.
The above results provide important implications for how we should approach and utilize the CBA in the future. First, development practitioners working on infrastructure projects—especially in developing countries—could use the EIRRs of previous projects presented in this research as references for their own project appraisals. The research showed clear differences in EIRRs among sectors. This result reinforces the “rule of thumb” of the EIRR (e.g., the economic infrastructure sector may have higher EIRRs than the social infrastructure sector) (e.g., [33,34,43,44]). Moreover, the research offers new insights into the possible trends in EIRRs observed through practitioners’ experiences: brownfield projects tend to have higher EIRRs than greenfield projects. In contrast, the findings indicate no clear difference in EIRRs between tied and untied projects.
Based on these results, development practitioners can compare their projects with these benchmarks, analyze the reasons for differences or similarities, and consider whether or not to finance their project. However, such comparisons should be made with caution, as calculation methods vary across institutions and each follows its own methodological approach [34].
At the same time, potential inaccuracies in EIRR estimation must be acknowledged. The present study indicates that EIRR values are ultimately “estimates,” which may deviate either upward or downward depending on various conditions. This highlights the limitations in CBA and the use of EIRRs in project decision-making, as numerous prior studies have cautioned (e.g., [23,24]). The study also provides an interesting finding specific to Japan’s ODA loan projects: the distribution of deviations is nearly symmetrical in both upward and downward directions. This contrasts with earlier research suggesting that ex ante EIRRs tend to exceed ex post EIRRs, largely due to behavioral biases and political motivations (e.g., [23,24,47]). The nearly symmetrical deviation pattern observed here may indicate the absence of systematic bias in EIRR estimates under Japan’s ODA loans and instead underscores the inherent difficulty of accurate estimation.
How, then, can the gap between estimated and actual EIRRs be minimized? A useful hint emerges when examining the reasons for downward deviations. Changes in the project period appear to have a particularly strong influence on downward deviations relative to upward deviations (Table 4). This suggests that improving project timeliness may help bring EIRRs closer to their estimates, although delays are common in infrastructure development. By contrast, factors related to benefit calculation (i.e., changes in unit prices, project scope, or calculation methods) seem difficult to avoid. For these cases, DFIs would need to carefully analyze why the estimation method changed at the time of post-evaluation and clarify how much the EIRR was affected as a result. At the same time, DFIs should continue to develop realistic project plans (e.g., cost and schedule) and adhere to them, as this is the most effective way to minimize the gap between the ex ante and ex post EIRRs.
Ultimately, accurate estimation of EIRRs is subject to inevitable limitations. Therefore, development practitioners should not rely solely on EIRRs when making financing decisions for infrastructure projects. Instead, after first acknowledging that EIRR values are not always comprehensive, they should consider other essential factors, such as humanitarian perspectives and the relevance to national policy. Incorporating these broader factors also aligns with the recent emphasis on sustainability in infrastructure development, which encompasses environmental, social, and economic dimensions [1,2,3]. To support development practitioners in adopting more comprehensive decision-making methods for sustainable infrastructure—such as multi-criteria decision analysis (MCDA) [11,12,13]—the reasons why certain projects were financed despite their low ex ante EIRRs under Japan’s ODA loan scheme, as presented in this research, are expected to serve as useful references.

5.2. Limitations of the Research and Direction for Future Studies

This research provides important insights for both scholars and practitioners; however, several limitations should be acknowledged.
First, with respect to the analysis of EIRR values, this study does not conduct detailed sector-specific statistical analyses due to the limited availability of sample data. Previous studies suggest that multiple factors—such as project size, the GDP per capita of the project country, and time horizon—may influence EIRRs [43,47]. In addition, project location (urban, rural, or multi-regional) could also affect EIRRs, given variations in investment size and demand conditions. To deepen the understanding of EIRR trends in infrastructure projects, future research should conduct more rigorous analyses using larger and more comprehensive datasets, although data availability may remain a challenge.
Second, consistent with prior studies, this research reconfirms the difficulties associated with estimating EIRRs, although the available dataset is limited. This finding suggests that practitioners may need to develop complementary approaches to project appraisal. Nonetheless, improving EIRR calculation methods and enhancing their accuracy remains essential, as cost–benefit analysis using EIRR continues to be a major decision-making tool due to its simplicity and long-standing use. Therefore, further research is needed to examine the differences between ex ante and ex post EIRRs and to identify the factors that cause these discrepancies. However, DFIs often do not recalculate ex post values, or the necessary data are unavailable [28,34,47]. Thus, DFIs should calculate both ex ante and ex post EIRRs in future projects to help build more analyzable datasets.
Third, although this study proposes several potential explanations for why projects with low EIRRs were approved for financing, these remain hypothetical due to the lack of convincing and objective information. Future research should investigate which factors are considered more important than economic indicators—particularly from the perspective of inclusive sustainability—by conducting in-depth interviews with development practitioners on specific projects. Additionally, scholars and practitioners should continue to develop assessment frameworks for sustainable infrastructure development, following recent trends in the field [3,4].
Finally, this study has a limitation in that it relies exclusively on data from Japanese ODA loan projects. As a result, there is a possibility that the methodology used to calculate EIRR has institution-specific characteristics. In Japanese ODA loan projects, EIRR is considered primarily a reference indicator rather than a decisive evaluation criterion, and therefore no intentional bias in its calculation is presumed. The results of this study are also consistent with this assumption. Nevertheless, as pointed out in previous studies, the calculation method itself may embody certain inherent characteristics [34]. Accordingly, caution should be exercised when applying the findings of this study directly to infrastructure projects implemented by other institutions. At the same time, it is important to deepen the analysis by using a more comprehensive dataset that includes infrastructure projects undertaken by multiple institutions, thereby enabling an examination of inter-institutional differences.

6. Conclusions

This study sought to deepen empirical understanding of CBA practices by examining EIRR trends across 387 infrastructure projects financed under Japan’s ODA loan scheme and by comparing ex ante and ex post outcomes for 84 projects. Three research questions guided the analysis: (1) what types of projects have achieved higher or lower CBA results among past infrastructure projects under Japan’s ODA loans, (2) to what extent CBA results can be relied on for decision-making in infrastructure project development, and (3) what factors can support decision-making in sustainable infrastructure development beyond CBAs. First, the results reaffirm that economic infrastructure projects tend to exhibit higher EIRRs than social infrastructure projects, and that brownfield projects outperform greenfield projects. These findings align with practitioners’ long-standing intuition as well as previous academic studies. Importantly, the study finds no significant difference in EIRRs between tied projects (i.e., projects whose contracts are primarily tied to Japanese firms) and untied projects.
Second, the comparison between ex ante and ex post EIRRs confirms that estimates are subject to substantial uncertainty, driven primarily by changes in demand, project costs, and implementation periods. Deviations occur relatively symmetrically in both upward and downward directions, indicating no systematic bias toward overestimation. This reinforces the need for practitioners to interpret EIRRs with caution and to acknowledge the potential for estimation errors during project preparation.
Third, qualitative analysis of low-EIRR projects suggests that various non-economic factors may also play an important role in financing decisions. For instance, humanitarian needs, alignment with national development strategies, diplomatic and commercial considerations, and the need for continuity in contract management can outweigh purely economic efficiency criteria. These findings suggest that, while valuable, EIRR-based CBA does not fully capture the multidimensional value of infrastructure projects, especially when sustainability perspectives are prioritized.
Taken together, the results demonstrate that CBA remains a useful tool for infrastructure project appraisal but still has room for improvement. As sustainability becomes a central principle in international development, decision-making frameworks must evolve to incorporate environmental and social dimensions that CBA alone cannot quantify. Hence, future research should support the development of appraisal frameworks that assess all sustainability dimensions and move beyond conventional CBA.

Author Contributions

Conceptualization, K.E. and Y.T.; methodology, K.E. and Y.T.; software, K.E.; formal analysis, K.E., Y.H., Y.M. and A.T.; investigation, K.E., Y.H., Y.M., A.T. and Y.T.; data curation, K.E., Y.H., Y.M. and A.T.; writing—original draft, K.E., Y.H., Y.M. and A.T.; writing—review and editing, K.E., Y.H., Y.M., A.T. and Y.T. All authors have read and agreed to the published version of the manuscript.

Funding

This research received no external funding.

Institutional Review Board Statement

Not applicable.

Informed Consent Statement

Not applicable.

Data Availability Statement

The data presented in this study are available on the JICA website, including project data lists together with ex ante and ex post evaluation reports: https://www2.jica.go.jp/en/evaluation/index.php (accessed on 4 February 2026); https://www2.jica.go.jp/en/yen_loan/index.php (accessed on 4 February 2026). The compiled dataset may be made available by the corresponding author upon reasonable request.

Acknowledgments

The authors thank anonymous reviewers for their constructive comments, which helped improve the manuscript. During the preparation of this manuscript, the authors used Microsoft 365 Copilot for English editing of some portions. The use of the tool was limited to language editing and did not involve content generation. The authors have reviewed all edits and take full responsibility for them. The views expressed in this paper are those of the authors and do not necessarily represent the official positions of either JICA or the JICA Ogata Research Institute.

Conflicts of Interest

The authors declare no conflicts of interest.

References

  1. Endo, K.; Edelenbos, J.; Gianoli, A. Sustainable Infrastructure: A Systematic Literature Review on Finance Arrangements and Governance Modes. Public Work. Manag. Policy 2023, 284, 443–475. [Google Scholar] [CrossRef]
  2. Inter-American Development Bank (IDB). What Is Sustainable Infrastructure? A Framework to Guide Sustainability Across the Project Cycle. 2018. Available online: https://publications.iadb.org/en/what-sustainable-infrastructure-framework-guide-sustainability-across-project-cycle (accessed on 4 February 2026).
  3. Kustova, I.; Hudenko, J.; Lace, N. A Systematic Review of Sustainability Criteria in Infrastructure Development. Sustainability 2024, 16, 4564. [Google Scholar] [CrossRef]
  4. Srivastava, S.; Iyer-Raniga, U.; Misra, S. Integrated approach for sustainability assessment and reporting for civil infrastructures projects: Delivering the UN SDGs. J. Clean. Prod. 2024, 459, 142400. [Google Scholar] [CrossRef]
  5. Andersson, H. Application of BCA in Europe: Experiences and Challenges. J. Benefit-Cost Anal. 2018, 9, 84–96. [Google Scholar] [CrossRef]
  6. Joseph, C.; Gunton, T.; Knowler, D.; Broadbent, S. The Role of Cost-Benefit Analysis and Economic Impact Analysis in Environmental Assessment: The Case for Reform. Impact Assess. Proj. Apprais. 2020, 38, 491–501. [Google Scholar] [CrossRef]
  7. Boardman, A.; Greenberg, D.; Vining, A.; Weimer, D. Cost-Benefit Analysis: Concepts and Practice; Cambridge University Press: Cambridge, UK, 2018. [Google Scholar]
  8. Vatn, A.; Bromley, D.W. Choices Without Prices Without Apologies. J. Environ. Econ. Manag. 1994, 26, 129–148. [Google Scholar] [CrossRef]
  9. Atkinson, G.; Mourato, S. Environmental Cost-Benefit Analysis. Annu. Rev. Environ. Resour. 2008, 33, 317–344. [Google Scholar] [CrossRef]
  10. Layard, R.; Glaister, S. Cost-Benefit Analysis; Cambridge University Press: Cambridge, UK, 1994. [Google Scholar]
  11. Marcelo, D.; Mandri-Perrott, C.; House, S.; Schwartz, J. An Alternative Approach to Project Selection: The Infrastructure Prioritization Framework. World Bank Working Paper. 2016. Available online: https://thedocs.worldbank.org/en/doc/844631461874662700-0100022016/original/160423InfrastructurePrioritizationFrameworkFinalVersion.pdf (accessed on 4 February 2026).
  12. De Montis, A.; De Toro, P.; Droste-Franke, B.; Omann, I.; Stagl, S. Assessing the Quality of Different MCDA Methods. In Alternatives for Environmental Valuation; Routledge: London, UK, 2004; pp. 99–184. [Google Scholar] [CrossRef]
  13. Tsamboulas, D. A Tool for Prioritizing Multinational Transport Infrastructure Investments. Transp. Policy 2007, 14, 11–26. [Google Scholar] [CrossRef]
  14. Hanley, N. Cost-benefit Analysis and Environmental Policymaking. Environ. Plan. C Gov. Policy 2001, 19, 103–118. [Google Scholar] [CrossRef]
  15. Browne, D.; Ryan, L. Comparative Analysis of Evaluation Techniques for Transport Policies. Environ. Impact Assess. Rev. 2011, 31, 226–233. [Google Scholar] [CrossRef]
  16. White, D.; VanLandingham, G. Benefit-Cost Analysis in the States: Status, Impact, and Challenges. J. Benefit-Cost Anal. 2015, 6, 369–399. [Google Scholar] [CrossRef]
  17. David, P.; Atkinson, G.; Mourato, S. Cost-Benefit Analysis and the Environment: Recent Developments; OECD Publishing: Paris, France, 2006. [Google Scholar]
  18. Anthony, B.; Greenberg, D.; Vining, A.; Weimer, D. Cost-Benefit Analysis; Pearson: London, UK, 2013. [Google Scholar]
  19. Peter, M. Cost-Benefit Analysis in Transport: A U.K. Perspective. In OECD; International Transport Forum (ITF): Paris, France, 2010. [Google Scholar]
  20. Turner, R.K. Limits to CBA in U.K. and European Environmental Policy: Retrospects and Future Prospects. Environ. Resour. Econ. 2007, 37, 253–269. [Google Scholar] [CrossRef]
  21. Pearce, D.W. Environmental Appraisal and Environmental Policy in the European Union. Environ. Resour. Econ. 1998, 11, 489–501. [Google Scholar] [CrossRef]
  22. Pearce, D.W. Does European Union Environmental Policy Pass a Cost-Benefit Test? World Econ. 2004, 5, 115–137. [Google Scholar]
  23. Flyvbjerg, B.; Bester, D.W. The Cost-benefit Fallacy: Why Cost-benefit Analysis is Broken and How to Fix It. J. Benefit-Cost Anal. 2021, 12, 395–419. [Google Scholar] [CrossRef]
  24. Flyvbjerg, B. Top Ten Behavioral Biases in Project Management: An Overview. Proj. Manag. J. 2021, 52, 531–546. [Google Scholar] [CrossRef]
  25. Nelson, R.H. Valuing Nature. Am. J. Econ. Sociol. 2006, 65, 525–557. [Google Scholar] [CrossRef]
  26. Gunton, T.I. Megaprojects and Regional Development: Pathologies in Project Planning. Reg. Stud. 2003, 37, 505–519. [Google Scholar] [CrossRef]
  27. Thomopoulos, N.; Grant-Muller, S.; Tight, M. Incorporating Equity Considerations in Transport Infrastructure Evaluation: Current Practice and a Proposed Methodology. Eval. Program Plan. 2009, 32, 351–359. [Google Scholar] [CrossRef]
  28. Iwasaki, Y.; Ejiri, R. Current Situation and Issues on Assessing Infrastructure Investments in Developing Countries: Research Perspective. Glob. Bus. J. 2020, 6, 43–54. [Google Scholar] [CrossRef]
  29. World Bank. Operations Policy and Country Services (OPCS). In Investment Project Financing Economic Analysis Guidance Note; World Bank: Washington, DC, USA, 2013. [Google Scholar]
  30. World Bank. Operations Policy and Country Services (OPCS). In Investment Lending Reform: Modernizing and Consolidating Operational Policies and Procedures; World Bank: Washington, DC, USA, 2012. [Google Scholar]
  31. Mandri-Perrott, C.; Marcelo, D.; Haddon, J. A Methodology to Prioritize and Select Infrastructure Investments. In Report to the Vietnam Ministry of Planning and Investment; World Bank: Washington, DC, USA, 2014. [Google Scholar]
  32. Marcelo, D.; Mandri-Perrott, C.; House, S. Prioritizing Infrastructure Investments in Panama: Pilot Application of the World Bank Infrastructure Prioritization Framework. In Report to the Panama Ministry of Economy and Finance; World Bank: Washington, DC, USA, 2015. [Google Scholar]
  33. Asian Development Bank (ADB). Guidelines for the Economic Analysis of Projects. 2017. Available online: https://www.adb.org/documents/guidelines-economic-analysis-projects (accessed on 4 February 2026).
  34. Del Bo, C.; Florio, M. Cost–Benefit Analysis and the Rates of Return of Infrastructure Projects: Evidence from International Organizations. Transit. Stud. Rev. 2010, 17, 587–610. [Google Scholar] [CrossRef]
  35. Tol, R.S. A Cost–benefit Analysis of the EU 20/20/2020 package. Energy Policy 2012, 49, 288–295. [Google Scholar] [CrossRef]
  36. Kennedy, D. New Nuclear Power Generation in the UK: Cost Benefit Analysis. Energy Policy 2007, 35, 3701–3716. [Google Scholar] [CrossRef]
  37. Liu, Y.; Guo, X.; Hu, F. Cost-Benefit Analysis on Green Building Energy Efficiency Technology Application: A Case in China. Energy Build. 2014, 82, 37–46. [Google Scholar] [CrossRef]
  38. Ackerman, F.; Heinzerling, L. Pricing the Priceless: Cost-Benefit Analysis of Environmental Protection. Univ. Pa. Law Rev. 2001, 150, 1553. [Google Scholar] [CrossRef]
  39. Kuosmanen, T.; Kortelainen, M. Valuing Environmental Factors in Cost–Benefit Analysis Using Data Envelopment Analysis. Ecol. Econ. 2007, 62, 56–65. [Google Scholar] [CrossRef]
  40. Azar, C. Weight Factors in Cost-benefit Analysis of Climate Change. Environ. Resour. Econ. 1999, 13, 249–268. [Google Scholar] [CrossRef]
  41. Hahn, R.W.; Dudley, P.M. How Well Does the Government Do Cost-Benefit Analysis? SSRN. 2004. Available online: https://papers.ssrn.com/sol3/papers.cfm?abstract_id=495462 (accessed on 4 February 2026).
  42. Mouter, N.; Annema, J.A.; van Wee, B. Attitudes Towards the Role of Cost–Benefit Analysis in the Decision-making Process for Spatial-Infrastructure Projects: A Dutch Case Study. Transp. Res. Part A Policy Pract. 2013, 58, 1–14. [Google Scholar] [CrossRef]
  43. Florio, M.; Morretta, V.; Willak, W. Cost-benefit Analysis and European Union Cohesion Policy: Economic Versus Financial Returns in Investment Project Appraisal. J. Benefit-Cost Anal. 2018, 9, 147–180. [Google Scholar] [CrossRef]
  44. Del Bo, C.; Florio, M. Infrastructure and Growth in a Spatial Framework: Evidence from the EU Regions. Eur. Plan. Stud. 2012, 20, 1393–1414. [Google Scholar] [CrossRef]
  45. Flyvbjerg, B.; Holm, M.K.S.; Buhl, S.L. How (In)accurate Are Demand Forecasts in Public Works Projects? The Case of Transportation. J. Am. Plan. Assoc. 2005, 71, 131–146. [Google Scholar] [CrossRef]
  46. Nicolaisen, M.S.; Driscoll, P.A. Ex-post Evaluations of Demand Forecast Accuracy: A Literature Review. Transp. Rev. 2014, 34, 540–557. [Google Scholar] [CrossRef]
  47. Independent Evaluation Group. Cost-Benefit Analysis in World Bank Projects; World Bank: Washington, DC, USA, 2010. [Google Scholar]
  48. OECD. Untying Aid to the Least Developed Countries; OECD Policy Brief: Paris, France, 2001. [Google Scholar]
Figure 1. Distribution of EIRRs by sector. Note: Outliers were included in this graph, while they are removed for the statistical analysis. Source: Authors.
Sustainability 18 01888 g001
Figure 2. Result of multiple comparison tests on EIRRs by sector. Note: The Holm–Bonferroni test was conducted for the MCTs. *** and ** mean the p-value is less than 0.001 and 0.01, respectively. Source: Authors.
Sustainability 18 01888 g002
Figure 3. Differences between the ex ante and ex post EIRRs. Note: The dashed line represents a hypothetical line where ex ante EIRR equals ex post EIRR. Source: Authors.
Sustainability 18 01888 g003
Figure 4. Distribution of differences between ex ante and ex post EIRRs. Source: Authors.
Sustainability 18 01888 g004
Figure 5. Ex ante EIRRs for economic infrastructure projects. Source: Authors.
Sustainability 18 01888 g005
Figure 6. Ex ante EIRRs for social infrastructure projects. Source: Authors.
Sustainability 18 01888 g006
Table 1. Independent variables for analysis.
Qualitative Independent Variables
FactorLevelExplanation
Project sector(1) Power sector
(2) Railway sector
(3) Road sector
(4) Sea/airport sector
(5) Sewerage sector
(6) Water supply sector
(7) Water control sector
According to Del Bo and Florio [34,44] and the ADB [33], project sector is one of the most influential factors for EIRRs. This research divides the projects into seven sectors. The sectors with only a few projects (e.g., education and ICT projects) are excluded from the dataset.
Project type(1) Greenfield project
(2) Brownfield project
EIRRs differ between “greenfield” projects involving land acquisition and full construction and “brownfield” projects involving only rehabilitation or upgrade works. The former needs more investment cost but may have bigger impact than the latter.
Tying status of the projects(1) Tied project; project of which contracts are primarily tied to Japanese firms
(2) Untied project
EIRRs may differ between tied projects and untied projects, since it is reported that tied aid raises the cost of many goods and services by 15–30% [48].
Source: Authors.
Table 2. Result of ANOVA/t-test for averages of EIRRs.
Welch ANOVA with project sector as the factor
SectorNMeanSDPartial η2Fp
Power880.1740.0660.19227.625<0.001
Railway440.1460.056
Road980.1830.055
Sea/Airport310.1730.045
Sewerage270.0930.030
Water control410.1690.050
Water supply440.1250.049
Welch t-test with project type as the factor
TypeNMeanSDdftp
Greenfield2870.1540.058135.9384.254<0.001
Brownfield860.1850.060
Welch t-test with the tied status of the projects as the factor
Tying statusNMeanSDdftp
Tied590.1670.06280.0080.8330.407
Untied3140.1600.060
Note: Outliers were excluded from the analysis. Outlier identification was conducted using the interquartile range (IQR) method based on boxplot diagnostics. A total of 14 outliers were identified and excluded: 3 in the power sector, 1 in the railway sector, 3 in the road sector, 1 in the sea/airport sector, 5 in the sewerage sector, and 1 in the water supply sector. Degrees of freedom for the Welch ANOVA: df1 = 6, df2 = 130.63. Source: Authors.
Table 3. Classification of projects by differences between the ex ante and ex post EIRRs.
PowerRailwayRoadSea/AirportWater ControlWater Supply and SewerageTotal
Downward deviation (20% or more)92832529
Downward deviation (less than 20%)32512316
Upward deviation (less than 20%)20503313
Upward deviation (20% or more)82543426
Source: Authors.
Table 4. Reasons for differences between ex ante and ex post EIRRs.
Changes in BenefitChange in Project CostChange in Project Period
Change in DemandChange in Unit Price for Benefit CalculationChange in Project ScopeChange in Benefit Calculation Method
Power672264
(4)(4)(0)(1)(4)(4)
Railway420113
(3)(1)(0)(0)(1)(2)
Road1513283
(10)(1)(3)(0)(6)(3)
Sea/Airport800132
(4)(0)(0)(1)(3)(2)
Water control521010
(3)(0)(0)(0)(1)(0)
Water supply and sewerage522112
(1)(0)(2)(0)(1)(2)
Total4314872014
(25)(6)(5)(2)(16)(13)
Note: The numbers in parentheses at the bottom indicate projects with a downward estimate deviation. Some projects have multiple reasons for the differences. Source: Authors.
Disclaimer/Publisher’s Note: The statements, opinions and data contained in all publications are solely those of the individual author(s) and contributor(s) and not of MDPI and/or the editor(s). MDPI and/or the editor(s) disclaim responsibility for any injury to people or property resulting from any ideas, methods, instructions or products referred to in the content.