Article

Impact of Extraction Methods of Wine Lees β-Glucan on the Rheological Properties of Low-Fat Yogurt


1
Department of Food and Nutrition, Faculty of Food Technology, Technical University of Moldova, MD-2004 Chisinau, Moldova
2
Faculty of Food Engineering, Stefan cel Mare University of Suceava, 720229 Suceava, Romania
*
Author to whom correspondence should be addressed.
Sustainability 2026, 18(2), 989; https://doi.org/10.3390/su18020989
Submission received: 6 November 2025 / Revised: 24 December 2025 / Accepted: 14 January 2026 / Published: 18 January 2026
(This article belongs to the Section Sustainable Food)

Abstract

Wine lees, a byproduct of winemaking, represent an underutilized source of β-glucans with potential functional applications in food. This study aimed to extract β-glucans using two methods—acid–alkaline treatment and autolysis assisted by ultrasound—and evaluate their effects when incorporated into low-fat stirred yogurt. The extracted β-glucans were added at a concentration of 0.3% (w/w), and rheological measurements were conducted over 20 days of storage. All yogurt samples showed shear-thinning behavior, with apparent viscosity decreasing from 105 mPa·s at low shear rates (0.1 s−1) to 103 mPa·s at 100 s−1. Yogurt with β-glucans from autolysis retained higher viscosity and viscoelastic moduli (G′ and G″), indicating better structural integrity. Time-dependent tests showed up to 45% decrease in shear stress over 10 min of continuous shearing in the sample with chemically extracted β-glucans, compared to only 28% for autolysis-derived ones. Oscillatory tests confirmed that all samples behaved as weak gels (G′ > G″). These findings suggest that β-glucans obtained via autolysis can improve the textural stability of yogurt, offering potential for functional dairy development and valorization of wine industry byproducts.

1. Introduction

In recent years, the food industry has experienced a notable increase in the development of functional food products, driven by growing consumer awareness regarding the relationship between diet and health outcomes [1,2]. Functional ingredients are broadly defined as bioactive components that exert beneficial physiological effects beyond basic nutrition, such as improving metabolic health or reducing disease risk [3]. As a result, there is a substantial shift in consumer preferences toward food products enriched with functional compounds, including dietary fibers, probiotics, and plant-derived bioactives [4]. This evolving consumer behavior highlights the need for innovation in functional dairy products, particularly those formulated with natural, sustainable ingredients that contribute to both product quality and health promotion.
β-Glucans are non-digestible polysaccharides classified as soluble dietary fibers, widely recognized for their multifunctional bioactivities. These include immunomodulatory effects, antioxidant capacity, anti-inflammatory properties, and the ability to reduce serum cholesterol and regulate glycemic response [5,6]. Numerous studies have demonstrated their potential in preventing metabolic disorders and enhancing host defense mechanisms through modulation of gut microbiota and immune system pathways [7,8]. Due to their structural diversity and functional versatility, β-glucans are increasingly incorporated into functional food formulations and nutraceuticals.
Most of the current research on β-glucans focuses on those derived from cereals, such as oats and barley, due to their well-documented health benefits and functional properties [9]. In addition, fungal sources, particularly Saccharomyces cerevisiae from bakery or brewery yeast, have been extensively studied for their β-glucan content and bioactivity [10]. However, studies investigating β-glucans extracted from wine yeast lees, especially from autochthonous grape varieties, remain scarce and underexplored [11]. This research gap highlights the need to explore wine lees as an innovative and sustainable source of β-glucans for functional food applications.
The yield and structural characteristics of β-glucans are significantly influenced and affected by the extraction method, including the type of fermentation system employed (submerged or solid-state), the technological parameters of the process (temperature, pH, aeration, cultivation time), and the composition of the nutrient medium, all of which de-termine both the synthesis efficiency and the degree of branching and molecular weight of the resulting polysaccharides [12,13,14].
The extraction method plays a crucial role in determining the structural, functional, and technological properties of β-glucans intended for food applications. Techniques such as acid–alkaline extraction and autolysis are widely employed to recover β-glucans from yeast-based by-products, with each method imparting distinct effects on the molecular weight, solubility, and viscosity of the resulting polysaccharides, as reported by Santipanichwong and Suphantharika [15]. Variations in extraction conditions may significantly influence the rheological behavior and stabilizing capacity of β-glucans when incorporated into dairy matrices, ultimately affecting the texture, syneresis, and sensory quality of yogurt products [16]. Despite the importance of extraction methods, limited research has systematically evaluated how these processes impact the functionality of wine yeast-derived β-glucans in low-fat yoghurt formulations.
The increasing consumer demand for low-fat dairy products has been primarily driven by heightened health awareness regarding the risks associated with excessive dietary fat intake, such as obesity, cardiovascular diseases, and metabolic disorders [17,18]. However, reducing fat content often leads to undesirable changes in the sensory and textural attributes of dairy products, including poor creaminess, increased syneresis, and diminished mouthfeel [19]. Therefore, there is a significant interest in identifying fat replacers and functional ingredients capable of improving the structural and sensory properties of low-fat dairy products while maintaining their nutritional benefits [20,21]. Polysaccharides such as β-glucans have emerged as promising candidates for this purpose, owing to their ability to mimic the rheological behavior of fat and enhance product stability.
The incorporation of β-glucans in low-fat dairy products, particularly yogurts, has been extensively explored as a strategy to improve texture, mouthfeel, and overall sensory acceptance while reducing fat content [22]. β-Glucans derived from cereals, yeast, or microbial sources act as hydrocolloids, enhancing viscosity, water-holding capacity, and gel firmness, thereby mitigating the negative sensory impacts typically associated with fat reduction [16]. Studies have demonstrated that the addition of β-glucan not only improves the creaminess and reduces syneresis in low-fat yoghurt but also contributes to its prebiotic and health-promoting properties [23]. Furthermore, β-glucans have shown synergistic effects when combined with probiotic cultures, supporting both structural enhancement and functional food development within the dairy industry [24].
Previous studies have explored a wide range of β-glucan concentrations for yogurt fortification, typically varying between 0.1% and 2.5% (w/w), depending on the targeted functionality and source of β-glucan. Several researchers have reported that lower concentrations, such as 0.5% β-glucan, are effective in improving serum retention and maintaining desirable textural properties without compromising sensory acceptability [25]. However, higher inclusion levels, particularly above 0.5%, have been associated with adverse sensory effects, including a pronounced cereal-like taste and increased phase separation, leading to lower consumer acceptance [26]. Furthermore, it has been noted that concentrations exceeding specific thresholds—such as 0.24% or 0.25%—may contribute to undesirable structural instability in yoghurt matrices [27]. These findings collectively suggest that optimal β-glucan levels in yoghurt formulations must balance functional benefits with acceptable sensory and textural quality, typically remaining below 0.5% [18].
Although numerous studies have investigated the incorporation of β-glucans into yogurt formulations, most of the existing research focuses on β-glucans derived from cereals, such as oats and barley, or from fungal sources [28]. However, there is a notable gap in the scientific literature concerning the use of β-glucans extracted specifically from wine yeast lees in low-fat yogurt production [12]. Despite the known polysaccharide richness of wine lees and their potential as functional ingredients, their effects on the sensory, rheological, and physicochemical properties of low-fat yogurt remain largely unexplored [29]. Addressing this gap is essential, as β-glucans derived from wine yeast lees not only offer functional and technological benefits for the formulation of novel low-fat dairy products, but also contribute to environmental sustainability by valorizing winery by-products and reducing agro-industrial waste.
In the context of sustainable food production, the valorization of agro-industrial by-products has become a cornerstone of the circular economy model. Modern research emphasizes that transitioning from a linear “take–make–dispose” model to a circular bioeconomy requires converting food processing residues into valuable resources for functional and nutritionally enriched products [30]. Winery by-products, including grape pomace and wine lees, are particularly promising due to their richness in bioactive compounds such as polyphenols, polysaccharides, and dietary fibers, which possess high antioxidant and functional potential [31]. The integration of such materials into dairy systems not only enhances the functional quality of the final product but also contributes to waste minimization and resource efficiency, aligning with the United Nations Sustainable Development Goals (SDGs 12 and 13) related to responsible consumption and climate action [32,33]. At the same time, protein–polysaccharide mixtures can naturally form complexes and aggregates, including gels, due to electrostatic interactions that occur between oppositely charged macromolecules. By adjusting the pH and environmental conditions, the electric charge of proteins and polysaccharides can be controlled, facilitating their self-association into a stable three-dimensional network. Gels formed through such electrostatic interactions exhibit functional properties superior to those formed from proteins or polysaccharides alone: increased water-holding capacity, improved stability, and a uniform microstructure capable of resisting syneresis and mechanical deformation [34,35].
These hybrid structures offer significant advantages in food systems, as they enable the formation of a robust, adaptable gel network that effectively restores texture, especi-ally in low-fat products where proteins require additional support to form firm and sta-ble gels [36].
Furthermore, the development of value-added dairy products fortified with bioactive fractions obtained from industrial side streams exemplifies the synergy between technological innovation and environmental stewardship. This approach supports the sustainable transformation of the food industry, reduces the ecological footprint of production, and advances the concept of circularity by reintegrating by-products into the food value chain [37].
In light of these considerations, the present study aimed to investigate the potential of β-glucans extracted from wine yeast lees using two different extraction methods—acid–alkaline treatment and autolysis—as texturizing agents in low-fat stirred yogurt. The research focused on evaluating the impact of these β-glucans on the sensory, rheological, and physicochemical properties of low-fat stirred yogurt during refrigerated storage, with the objective of identifying their functional effectiveness and technological applicability in dairy product formulations.

2. Materials and Methods

2.1. Materials

In this study, low-fat milk (0.1% fat) was used for the β-glucan-enriched samples in order to minimize the influence of the lipid phase and better highlight the interactions between β-glucan and milk proteins, including protein aggregation; and whole milk (3.5% fat) for the control samples, to reflect the typical composition of drinking milk and serve as a technologically relevant reference. This approach allows us to highlight the specific effect of β-glucan while maintaining a meaningful control system. β-glucan used for enrichment was extracted from wine lees derived from the indigenous red wine variety Syra, harvest 2023, Winery Purcari. The extraction was carried out using two different methods: an acid–alkaline protocol (SVRS03AA), and an autolysis-based technique (SVRS01A).
A commercial freeze-dried VIVO yogurt starter culture (Zakvaski VIVO, Kyiv, Ukraine) was used for all yogurt batches. According to the manufacturer, this starter contains a symbiotic consortium of lactic acid bacteria: Streptococcus thermophilus, Lactobacillus delbrueckii subsp. bulgaricus, Lactobacillus acidophilus, and Bifidobacterium lactis. The culture is supplied at a concentration of ≥108 CFU/g, ensuring robust fermentation and probiotic efficacy. The lyophilized culture was stored at 2–6 °C and was reactivated by inoculating into pre-heated milk (40 °C) before yogurt production, following the supplier’s protocol.
For yogurt production, cow’s milk was heated to 60–75 °C, followed by homogenization at 10,000 rpm for 15 s to ensure uniform dispersion of the added β-glucans. The milk was subsequently cooled to 44 °C. After cooling, the milk was inoculated with a commercial freeze-dried yogurt starter culture and mixed. The inoculated milk was then distributed into pre-sterilized glass containers and incubated at 42 °C until the pH reached 4.50. After fermentation, the yogurt samples were rapidly cooled to 4 °C and stored in a refrigerator for up to 20 days. Physicochemical and rheological analyses were performed at storage intervals of 1, 7, 14 and 20 days. All yogurt tests were performed in duplicate.

2.2. Methods

2.2.1. Determination of pH

The pH of yogurt samples was measured using a digital pH meter (METTLER TOLEDO SevenExcellence pH meter S400, Mettler-Toledo GmbH, Greifensee, Switzerland), calibrated with standard buffer solutions at pH 4.0 and 7.0 prior to each measurement session. All measurements were performed in triplicate, and the average values were reported.

2.2.2. Determination of Total Titratable Acidity

Total titratable acidity (TTA) was determined according to standard AOAC methods and expressed as a percentage of lactic acid. Approximately 10 g of yogurt sample was mixed with 20 mL of distilled water and homogenized. The mixture was titrated with 0.1 N sodium hydroxide (NaOH) solution using phenolphthalein as an indicator. The endpoint of titration was identified by the appearance of a persistent light pink color lasting for at least 30 s. The volume of NaOH consumed was recorded and used to calculate the titratable acidity, using the formula:
TA   ( %   as   Lactic   acid )   =     V N a O H × 0.1 × 0.09008 × 100 V s a m p l e  
where 90.08 g/mol is the molar mass of lactic acid.
All determinations were performed in triplicate, and mean values were reported.

2.2.3. Determination of Syneresis

Syneresis was assessed using a centrifugation-based method. A volume of 5 mL of each yogurt sample was accurately weighed and transferred into centrifuge tubes. The samples were centrifuged at 640× g for 20 min at 4 ± 1 °C using a Spin MPW-223 centrifuge (MPW Med. Instruments, Warsaw, Poland). After centrifugation, the supernatant (separated whey) was carefully decanted and weighed. Syneresis was calculated as the percentage of the supernatant mass relative to the initial mass of the yogurt sample, using the formula:
Syneresis   ( % )   =     mass of supernatant initial mass of yoghurt × 100
All measurements were performed in triplicate and mean values were recorded.

2.2.4. Determination of Whey Retention Capacity

In addition to syneresis, the whey retention capacity (WRC) of the yogurt samples was assessed based on the same centrifugation procedure described previously. After centrifugation, the mass of the supernatant was measured.
WHC   ( % ) =   ( 1 W s / W i ) × 100
where
  • Ws—weight of the separated whey (g) after centrifugation;
  • Wi—initial weight of the yogurt sample (g).
Measurements were conducted in triplicate, and average values were used for analysis. This parameter provides insight into the structural integrity and water-binding properties of the yogurt matrix.

2.2.5. Color Assessment

The impact of grape skin powder incorporation on yogurt color parameters was evaluated according to the CIE Lab* color system, as described by Macdougall (2010) and applied in the study by Covaliov et al. (2024) [38,39]. Measurements were performed using a Konica Minolta CR-400 colorimeter (Osaka, Japan). The chromatic components L* (lightness), a* (redness), and b* (yellowness) were recorded for each yogurt sample. The total color difference (∆E) was calculated according to Equation (4), while the whiteness index (WI) was determined as proposed by Vásquez-Mazo et al. (2019), using Equation (5) [40].
E = ( L s a m p l e L 0 ) 2 + ( a s a m p l e a 0 ) 2 + ( b s a m p l e b 0 ) 2
W I = 100 ( 100 L ) 2 + a 2 + b 2

2.2.6. Rheological Analysis

Rheological tests were performed with a Modular Advanced Rheometer System (Thermo Fisher Scientific, Karlsruhe, Germany). All measurements were carried out in triplicate at 4 °C. Temperature was controlled via the rheometer’s Peltier plate, ensuring isothermal conditions throughout each test [41].

2.2.7. Flow Curve Measurements

Flow curves were recorded over a shear rate range of 0–100 s−1 using three sequential ramps (upward, constant, and downward), each lasting 120 s, to assess thixotropy. The downward flow data were fitted to the Ostwald–de Waele model (Equation (6)) to determine the consistency index (K) and flow behavior index (n).
τ = K · γ n
Apparent viscosity was taken as the average at 100 s−1 during the constant ramp. Thixotropic behavior was quantified by calculating the hysteresis loop area (S) between the upward and downward curves.

2.2.8. Yield Stress Determination

Stress-controlled (CS) measurements were performed using a parallel plate sensor system (PP60) with a 60 mm diameter and a 1 mm gap to determine the yield stress of the yogurt samples. A logarithmic CS ramp was applied, ranging from 0.1 to 200 Pa over 180 s. The yield stress was defined as the intersection point of two linear regions in the log–log plot of strain versus stress, indicating the transition from elastic deformation to flow.

2.2.9. Dynamic Oscillatory Measurements

Dynamic oscillatory measurements were conducted using a parallel plate sensor system (PP35) with a 1 mm gap. Mechanical spectra (frequency sweeps) were obtained over a frequency range of 0.1–10 Hz at a constant stress of 0.1 Pa, which was within the linear viscoelastic region as previously determined by a stress sweep test at 1 Hz.

2.2.10. FTIR Spectroscopy

The analysis was performed on the raw, undried samples of β-glucans. The determinations were performed using a Nicolet iS10 spectrometer from Thermo Scientific (Karlsruhe, Dieselstraβe, Germany), equipped with a diamond crystal. Measurements were performed in reflective absorbance mode (ATR-FTIR), at 4 cm−1 resolutions in the range of a mid-infrared region of 650–4000 cm−1, with 32 scans in transmission mode at a resolution of 4 cm−1 [11].

2.2.11. Statistical Analysis

All data were expressed as mean ± standard deviation (SD). Statistical significance was determined using a two-way analysis of variance (ANOVA) followed by an NIR Fisher test. The values were considered significantly different when p < 0.05. All analyses were performed with Statistica version 12.0 (StatSoft Inc., Tulsa, OK, USA).

3. Results

3.1. Characteristic of Beta-Glucans from Wine Lees of Red Wines

3.1.1. Yield of β-Glucan Compounds

Table 1 presents the results regarding the yield of β-glucans obtained using two different extraction methods. In both procedures, ultrasound treatment was applied in order to evaluate its influence on the efficiency of the extraction process. The results presented in Table 1 show significant differences between the yields of β-glucans obtained using the two extraction methods. The ultrasound-assisted autolysis method (25 kHz) resulted in a considerably higher yield (26.59 ± 0.06%) compared to the acid–base ultrasound-assisted method using 2 mol/L NaOH (10.64 ± 0.37%).
These differences can be explained by the distinct nature of the processes involved. In the acid–base method, chemical treatments may cause partial degradation of polysaccharides, leading to a lower final yield of β-glucans. In contrast, during autolysis, the endogenous enzymatic activity of yeast, combined with the mechanical effect of ultrasound, promotes the disintegration of the cell wall and the release of a larger amount of β-glucans with less degradation.
Therefore, the results suggest that the ultrasound-assisted autolysis method is more efficient for extracting β-glucans from yeast compared to the acid-base method under the tested conditions.

3.1.2. FTIR Spectroscopy

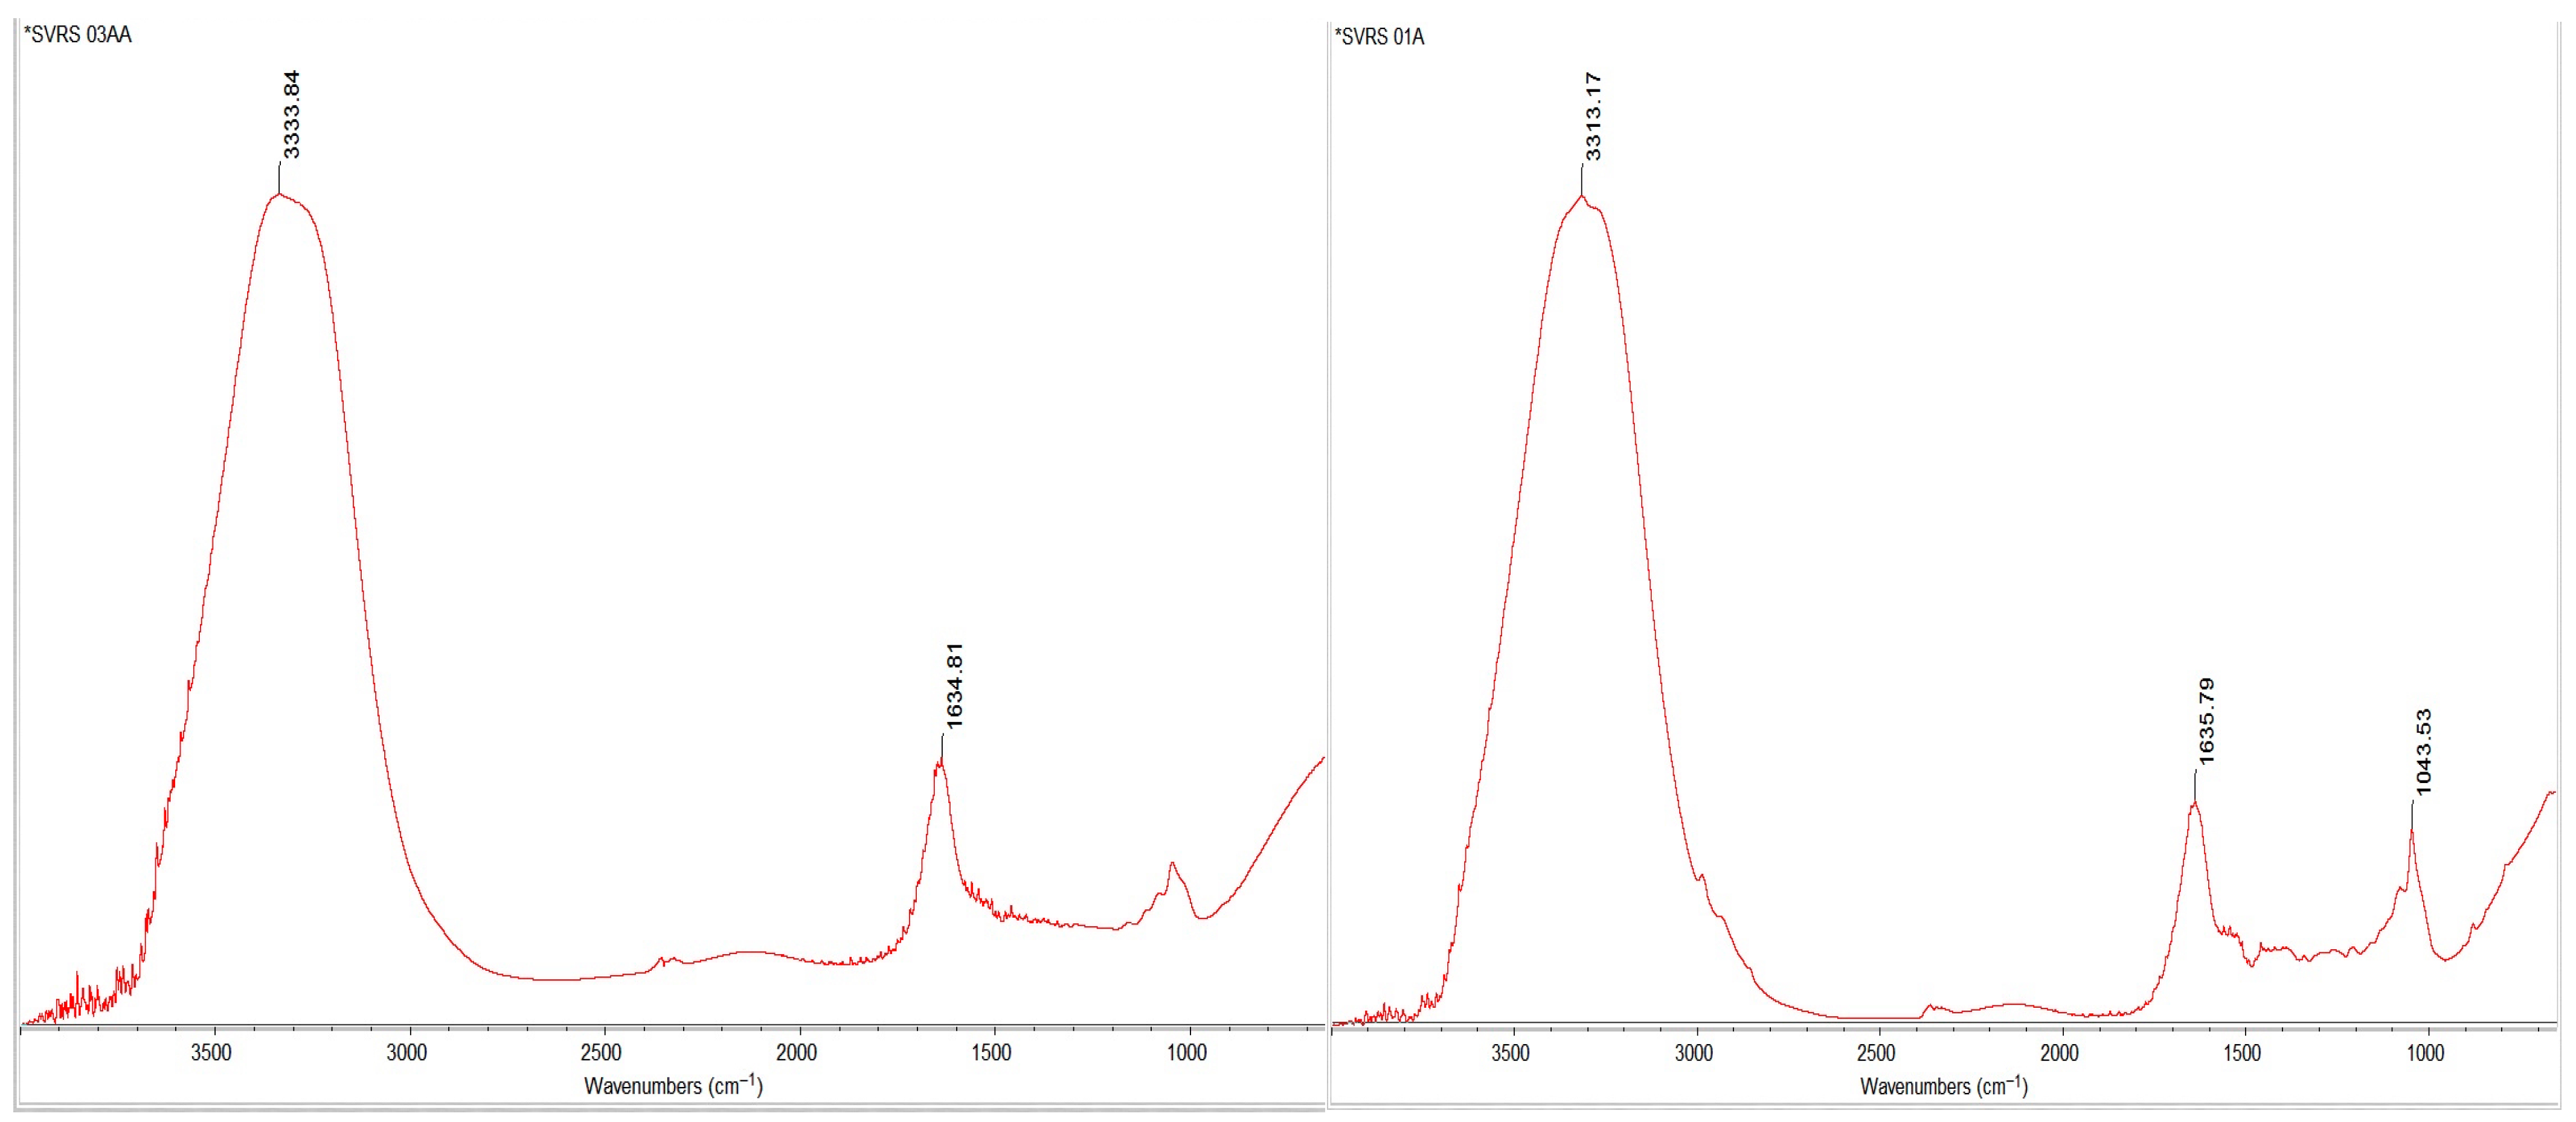
The FTIR spectra recorded for the two β-glucan samples extracted by different methods from the yeast sediment of Syra red wine are presented in Figure 1. The two samples exhibit similar spectra, showing several common absorption bands, particularly in the range of 1040–1030 cm−1 [42]. The presence of absorption bands in the 900–1200 cm−1 region indicates C–C and C–O stretching vibrations, confirming that polysaccharides represent a major component of the samples [43].
The presence of β-1,3-glucan in both samples is supported by the bands observed at 1043 and 1041 cm−1 [44]. The bands around 1634 and 1635 cm−1 are mainly associated with C=O stretching vibrations, characteristic of the amide I band, typical of proteins. Another distinct band, observed in the 2950–2850 cm−1 region, corresponds to C–H groups commonly found in polysaccharides [45].
In addition, a strong and broad band in the 3600–3000 cm−1 region is attributed to the stretching vibrations of hydroxyl (–OH) groups, characteristic of polysaccharides, cofirming their abundant presence in the β-glucan structure [46].
The segment between 3000 and 2500 cm−1 in the FT-IR spectra of polysaccharides often exhibits skeletal C–H vibrations, which, together with the stretching signals of –OH groups, provide essential evidence of the carbohydrate nature of the sample [43].
The molecular fingerprints of the different types of glucans and polysaccharides identified in both samples, highlighted by the specific spectral peaks, provided detailed information on their structural diversity and molecular composition. For instance, the bands assigned to β-1,4-, β-1,3-, and β-1,6-glucans (1000–1150 cm−1) reflected the variety of glucan linkages, while the C=O stretching vibration observed 1634 and 1635 cm−1 indicated the presence of protein–polysaccharide interactions. These spectral features confirm the polysaccharide- and protein-rich nature of the samples and underscore the complexity of their molecular composition.

3.2. pH

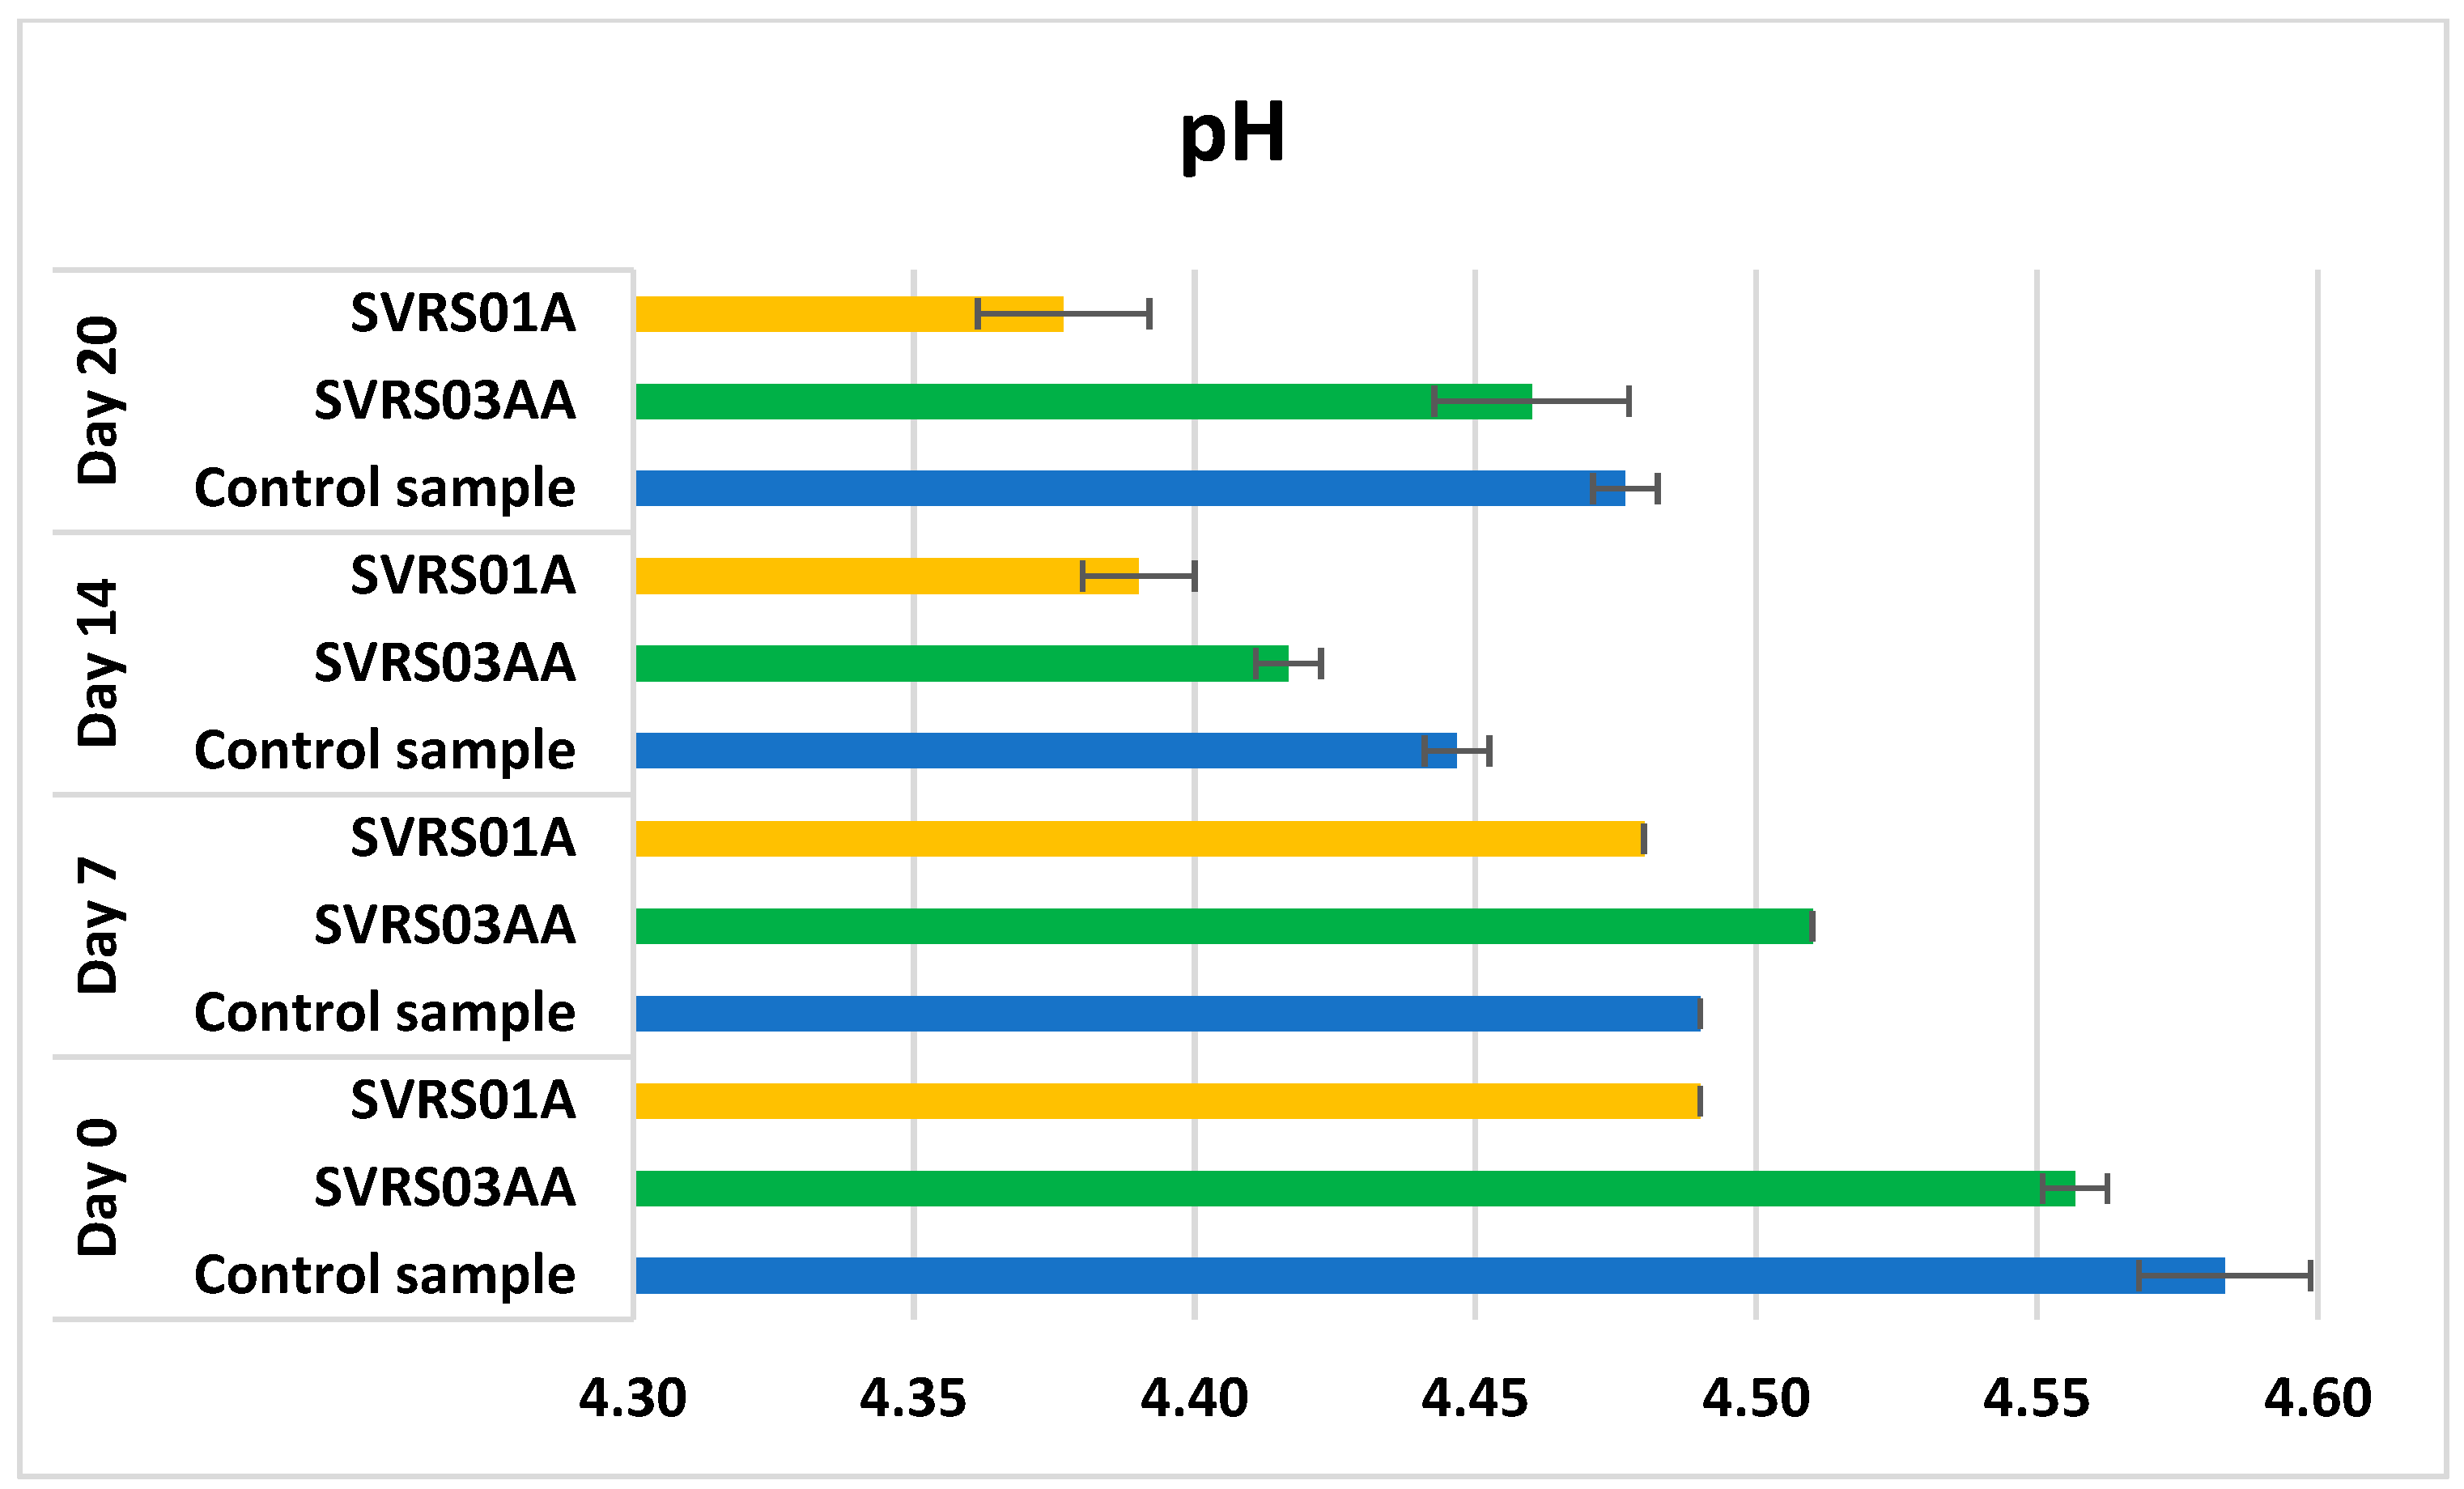
Figure 2 illustrates the pH evolution of low-fat yogurt samples enriched with β-glucan extracted from wine yeast lees using two different methods in comparison with the control sample. Throughout the storage period, all samples exhibited a gradual decline in pH. However, the control sample consistently maintained a slightly higher pH compared to the β-glucan-enriched samples, particularly after 14 and 20 days of storage, indicating a possible influence of β-glucan on acidification during cold storage.
The gradual decline in pH observed in our low-fat stirred yogurt samples during storage is consistent with established trends in β-glucan-enriched dairy matrices. For instance, studies by Anliet al. (2023) reported no significant difference in pH and titratable acidity when 0.25% oat β-glucan was incorporated into non-fat yogurt, with pH values falling within the typical 4.2–4.3 range over 21 days [14]. Similarly, Dello Staffolo et al. (2004) and Kaur & Riar (2019) noted that yogurt samples enriched with cereal β-glucans exhibited pH and acidity changes during cold storage that paralleled those of control samples [18,47]. Moreover, a study on probiotic low-fat yogurt supplemented with barley β-glucan showed comparable fermentation kinetics and pH profiles to control yogurts, with no adverse effects on acidification [48]. Interestingly, in our study, the yogurt sample, enriched with β-glucan extracted via the autolysis-based technique (SVRS01A), exhibited a consistently lower initial pH compared to the sample obtained using the acid–alkaline extraction method (SVRS03AA). This difference may be attributed to variations in the chemical composition and residual compounds resulting from the distinct extraction processes, which could influence the yoghurt matrix and fermentation dynamics from the onset.

3.3. Total Titratable Acidity

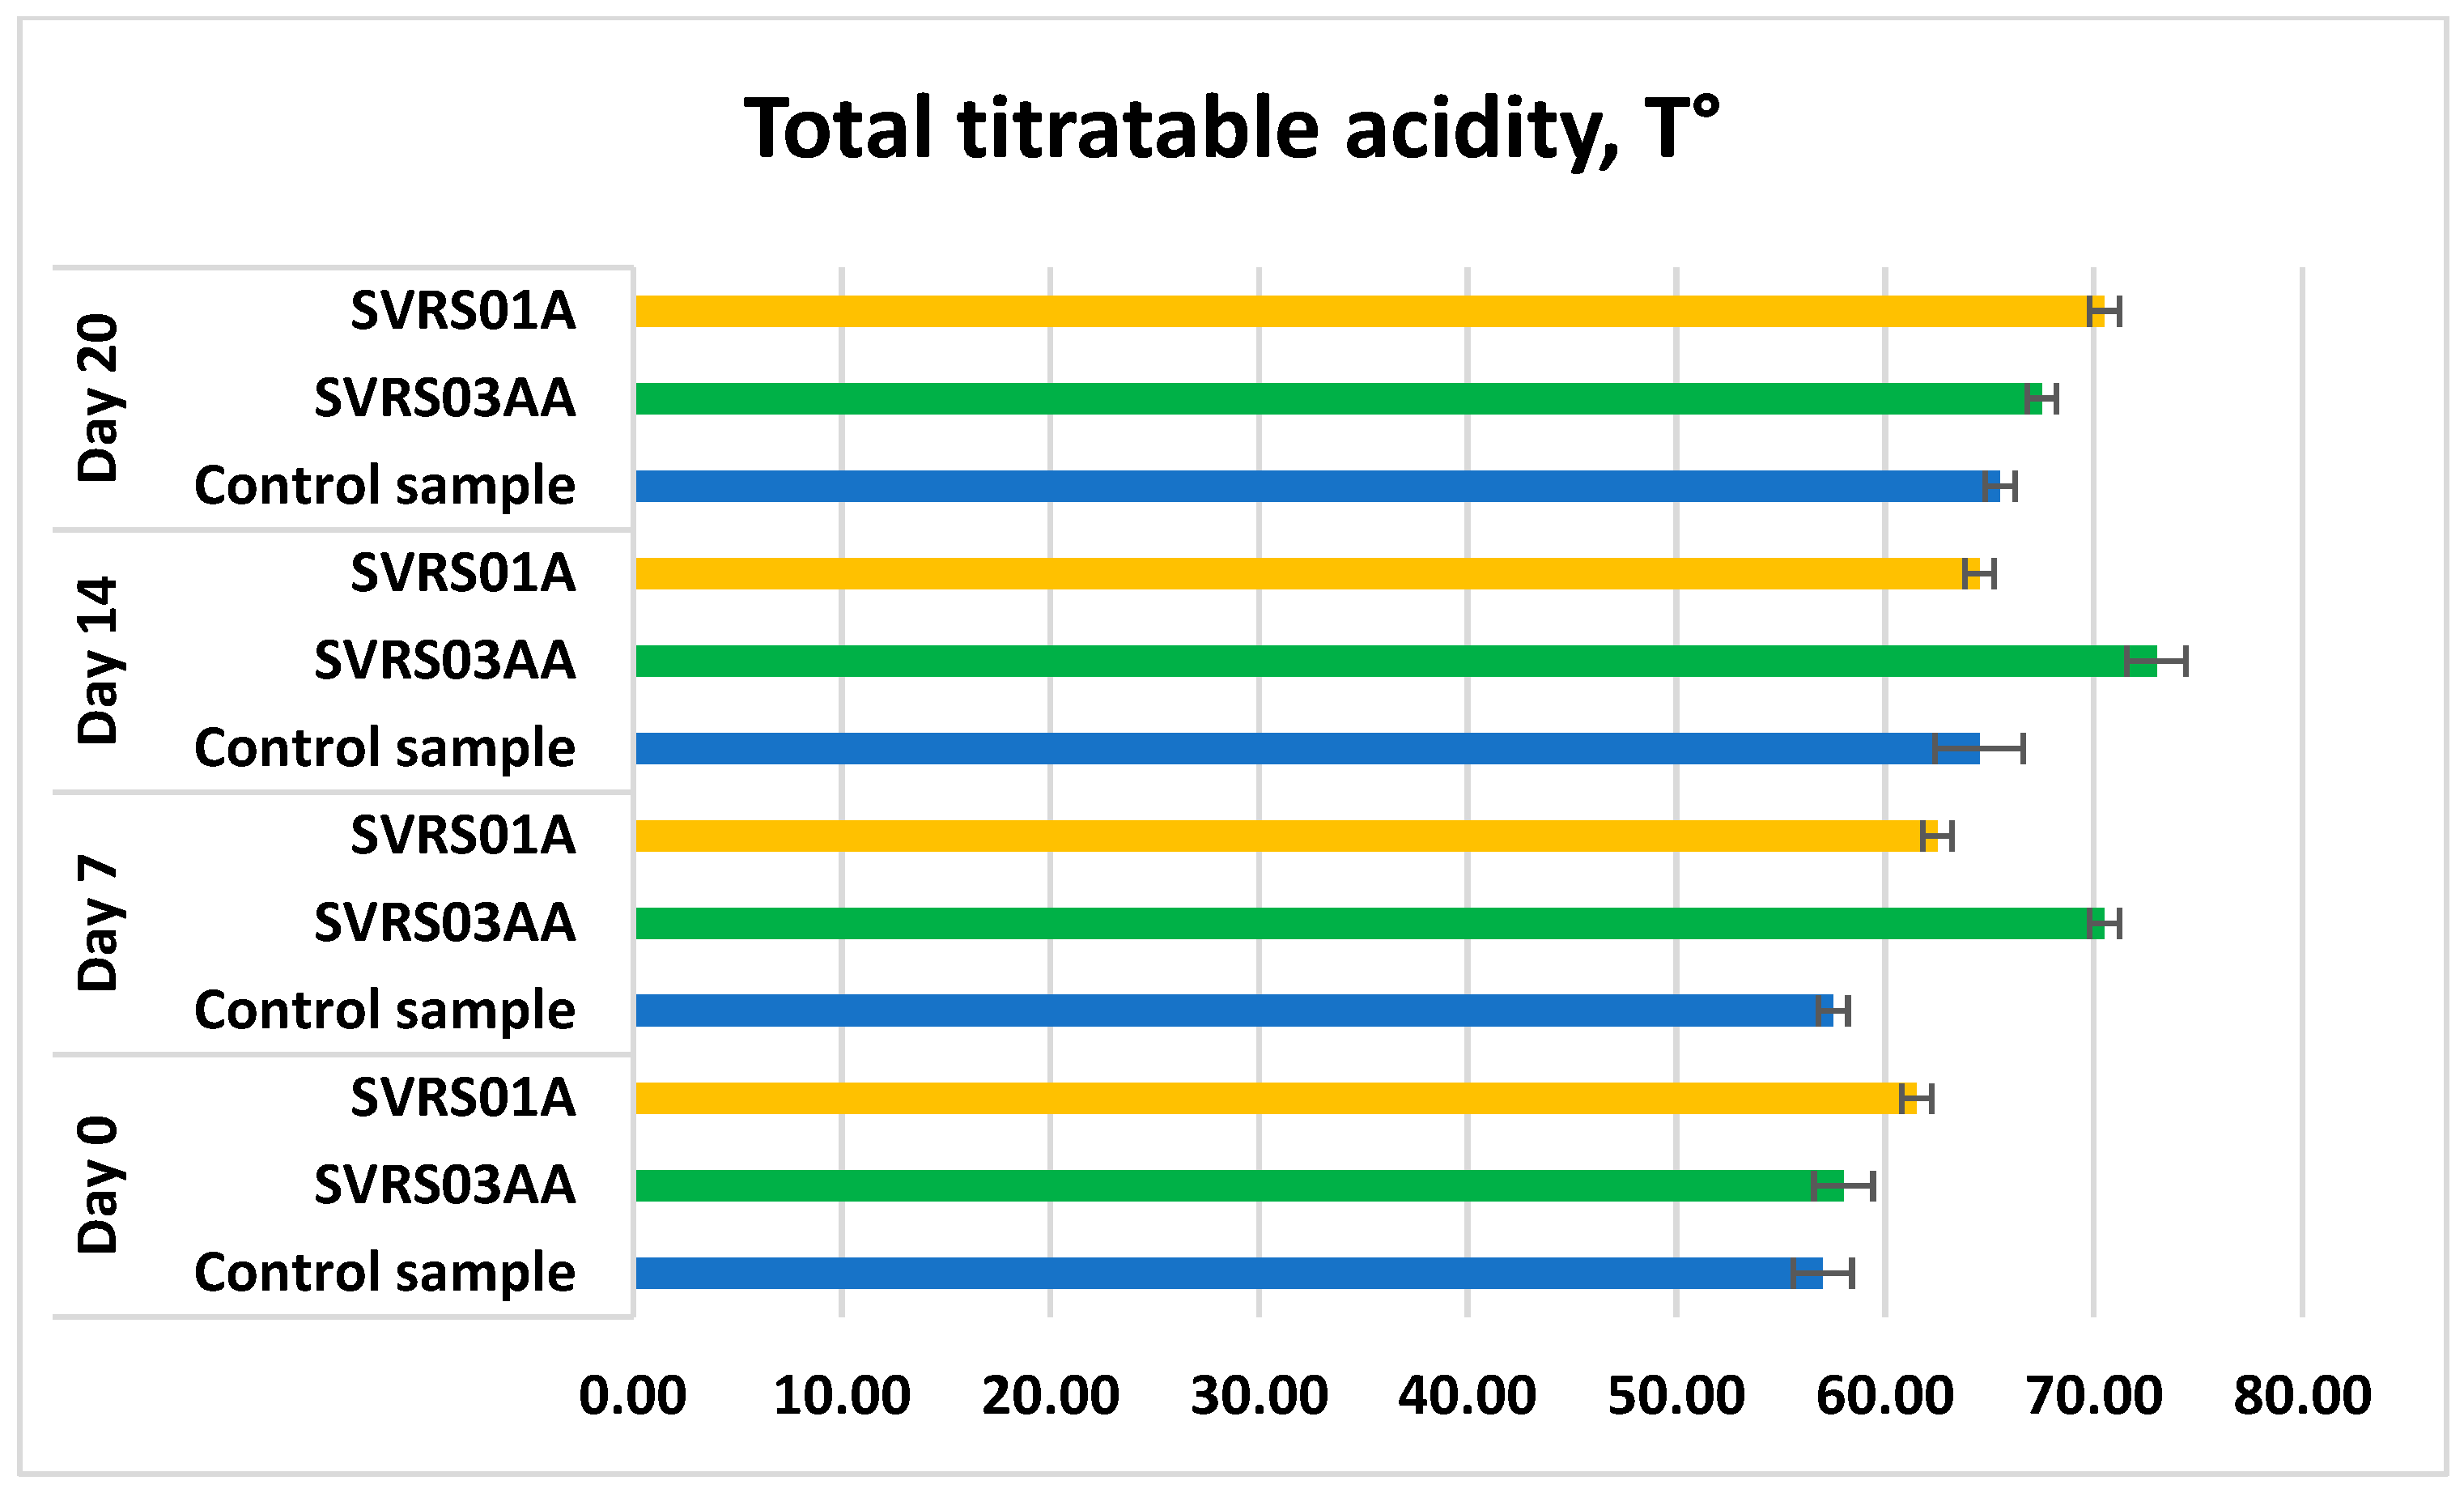
Figure 3 shows the evolution of titratable acidity in low-fat yogurt samples enriched with β-glucan extracted from wine yeast lees using two different methods (SVRS01A—autolysis-based extraction and SVRS03AA—acid–alkaline extraction), compared with the control sample. Throughout the storage period, all samples exhibited a gradual increase in titratable acidity, as expected due to ongoing post-acidification during cold storage. Notably, both β-glucan-enriched samples showed slightly higher acidity levels compared to the control sample, particularly after 14 and 20 days of storage, with SVRS03AA demonstrating the highest values among all samples.
The increase in titratable acidity observed across all yogurt samples throughout the 20-day refrigerated storage aligns with typical patterns of post-acidification in fermented dairy products, as previously documented [47,49]. Our data indicate that both β-glucan-enriched samples (SVRS01A and SVRS03AA) developed slightly higher acidity than the control, particularly after 14 and 20 days, suggesting that wine lees-derived β-glucan may influence acid production or buffer capacity within the yoghurt matrix. Similar behavior was reported by Dello Staffolo et al. (2004), who found that cereal β-glucan incorporation did not significantly alter early acidity but led to marginally higher titratable acidity during extended storage periods [18]. Meanwhile, Santipanichwong and Suphantharika (2009) observed no significant change in initial acidity between control and β-glucan-fortified yoghurt, though they noted a gradual increase in T° during storage [15]. Furthermore, research integrating yeast-sourced β-glucan has demonstrated similar trends, with added β-glucan slightly accelerating acidification without affecting microbial viability. Overall, our findings support the consensus that β-glucan supplementation may influence post-acidification kinetics, particularly during later storage stages, while maintaining acidity within the acceptable range for set yogurt.

3.4. Syneresis and Whey Retention Capacity (WRC)

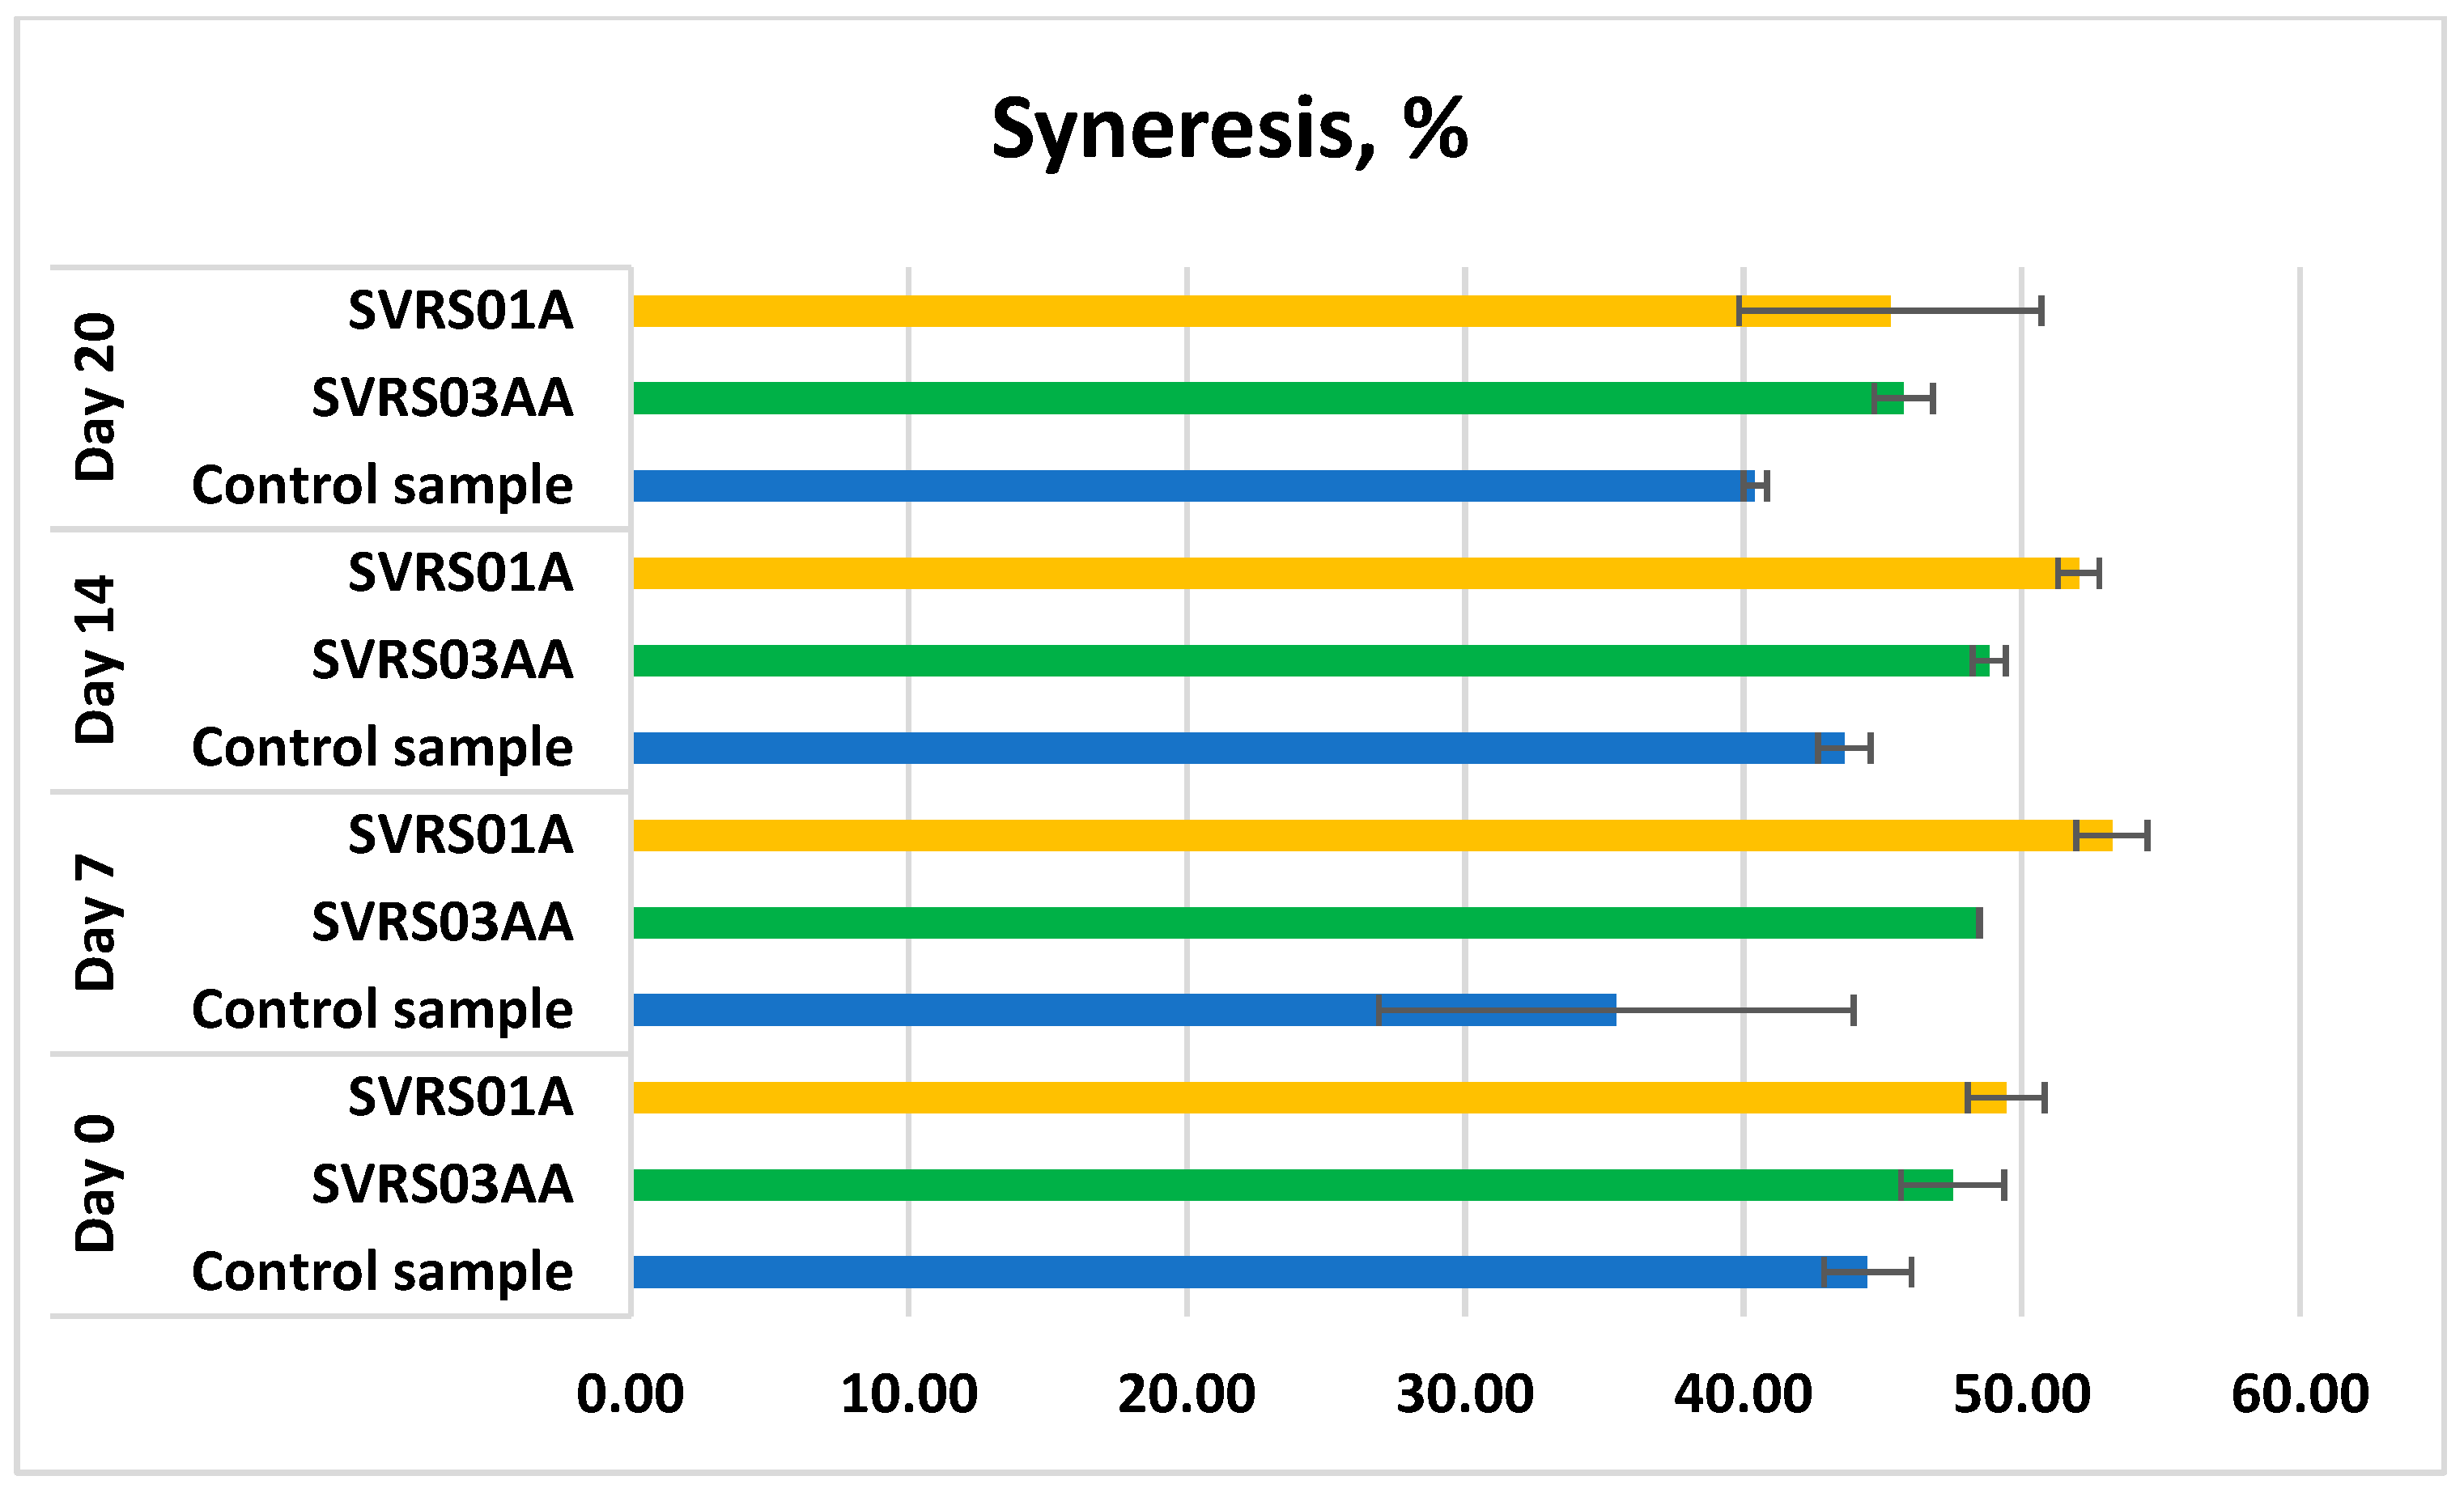
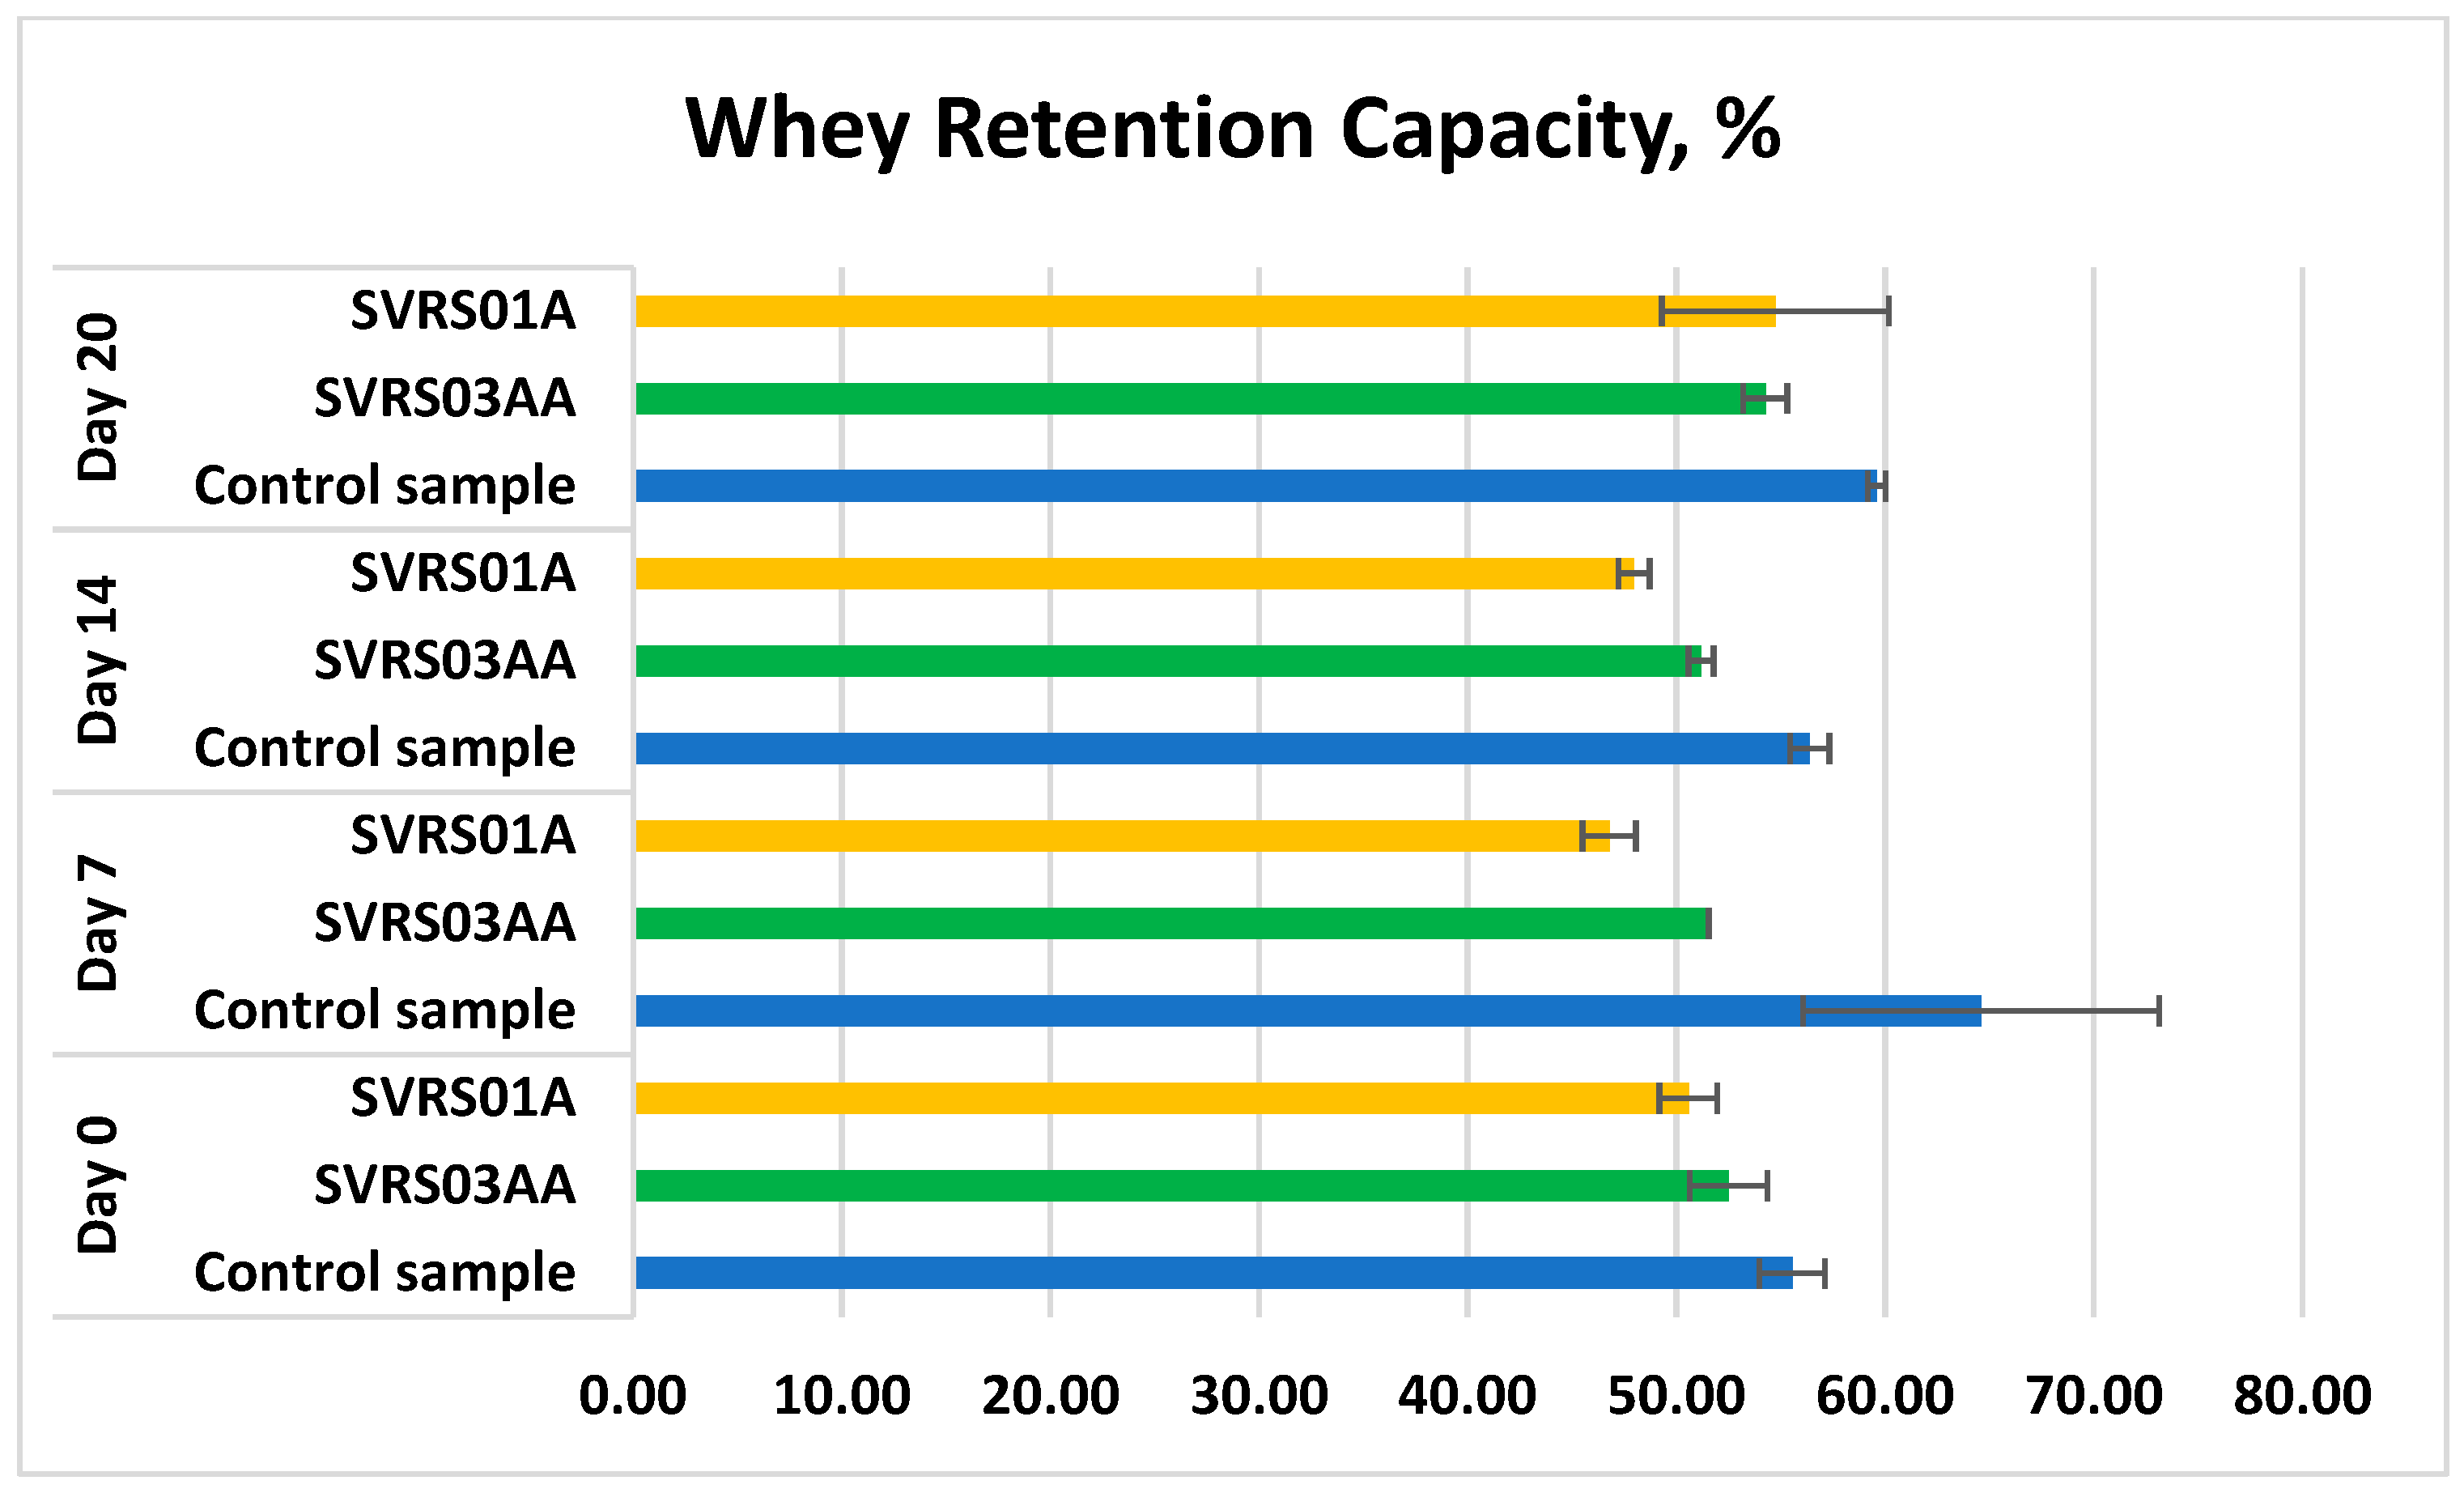
Figure 4 and Figure 5 present the evolution of syneresis and whey retention capacity (WRC) in low-fat stirred yogurt samples enriched with β-glucan extracted from wine yeast lees using two different methods (SVRS01A—autolysis-based extraction and SVRS03AA—acid–alkaline extraction), compared with the control sample. Throughout the storage period, the control sample consistently exhibited the highest syneresis values, particularly during the first 7 days. In contrast, β-glucan-enriched samples, especially SVRS01A, demonstrated significantly lower syneresis, indicating improved water-holding capacity and structural stability, which were maintained throughout the storage period.
The syneresis results revealed that both β-glucan-enriched yogurt samples (SVRS01A and SVRS03AA) demonstrated significantly lower whey separation compared to the control throughout the 20-day storage period. Notably, the sample containing β-glucan extracted via the autolysis-based method (SVRS01A) consistently exhibited the lowest syneresis values among all samples. This enhanced water-holding capacity may be attributed to the differences in the molecular characteristics of β-glucans resulting from the extraction method. It is well established that autolysis can partially hydrolyze β-glucans, producing lower-molecular-weight fractions that possess higher solubility and superior colloidal stability in aqueous systems [7]. Such smaller β-glucan molecules may interact more effectively with the yoghurt matrix, leading to improved gel integrity and reduced phase separation. In contrast, β-glucans obtained through acid–alkaline extraction (SVRS03AA) generally retain higher molecular weight and lower solubility, which could limit their effectiveness in enhancing the colloidal stability of yogurt. These findings are consistent with previous reports indicating that molecular weight and solubility of β-glucans are critical factors influencing their water-holding and stabilizing properties in dairy systems [16]. Therefore, the superior performance of SVRS01A highlights the potential of autolysis as an effective extraction technique for producing functional β-glucans with enhanced texturizing and stabilizing capabilities in low-fat stirred yogurt.
Throughout the storage period, β-glucan-enriched samples exhibited improved whey retention compared to the control sample, particularly during the first 14 days of storage. Among the enriched samples, SVRS01A showed slightly higher whey retention capacity, suggesting that the autolysis-derived β-glucan enhanced the structural integrity and water-binding ability of the yogurt matrix.
The whey retention capacity (WRC) data reveal that yogurt samples enriched with both SVRS01A and SVRS03AA β-glucans retained significantly more whey than the control during 20 days of refrigerated storage. Notably, the autolysis-derived β-glucan (SVRS01A) exhibited slightly superior WRC, especially during the first 14 days—corroborating the trend observed in syneresis results. This improved water-holding ability is consistent with prior research, where β-glucan-enriched yogurts demonstrated enhanced gel structure and matrix cohesion, leading to higher whey retention compared to control samples [16]. A similar study reported that yogurt fortified with yeast-sourced β-glucan maintained greater water retention over extended storage due to stronger colloid-polysaccharide interactions [24]. Conversely, Raikos et al. (2018) observed that certain β-glucan types had limited effects on water retention in low-fat yogurts, likely due to differences in molecular weight and solubility of the polysaccharides [26]. These comparisons highlight the importance of extraction method: SVRS01A’s enhanced WRC likely stems from its lower molecular-weight fractions, which interact more efficiently with the protein network, reinforcing gel structure and reducing whey expulsion. This provides strong evidence for the technological advantage of autolysis-derived β-glucans in improving the structural quality of low-fat stirred yogurts during storage.

3.5. Color Assessment

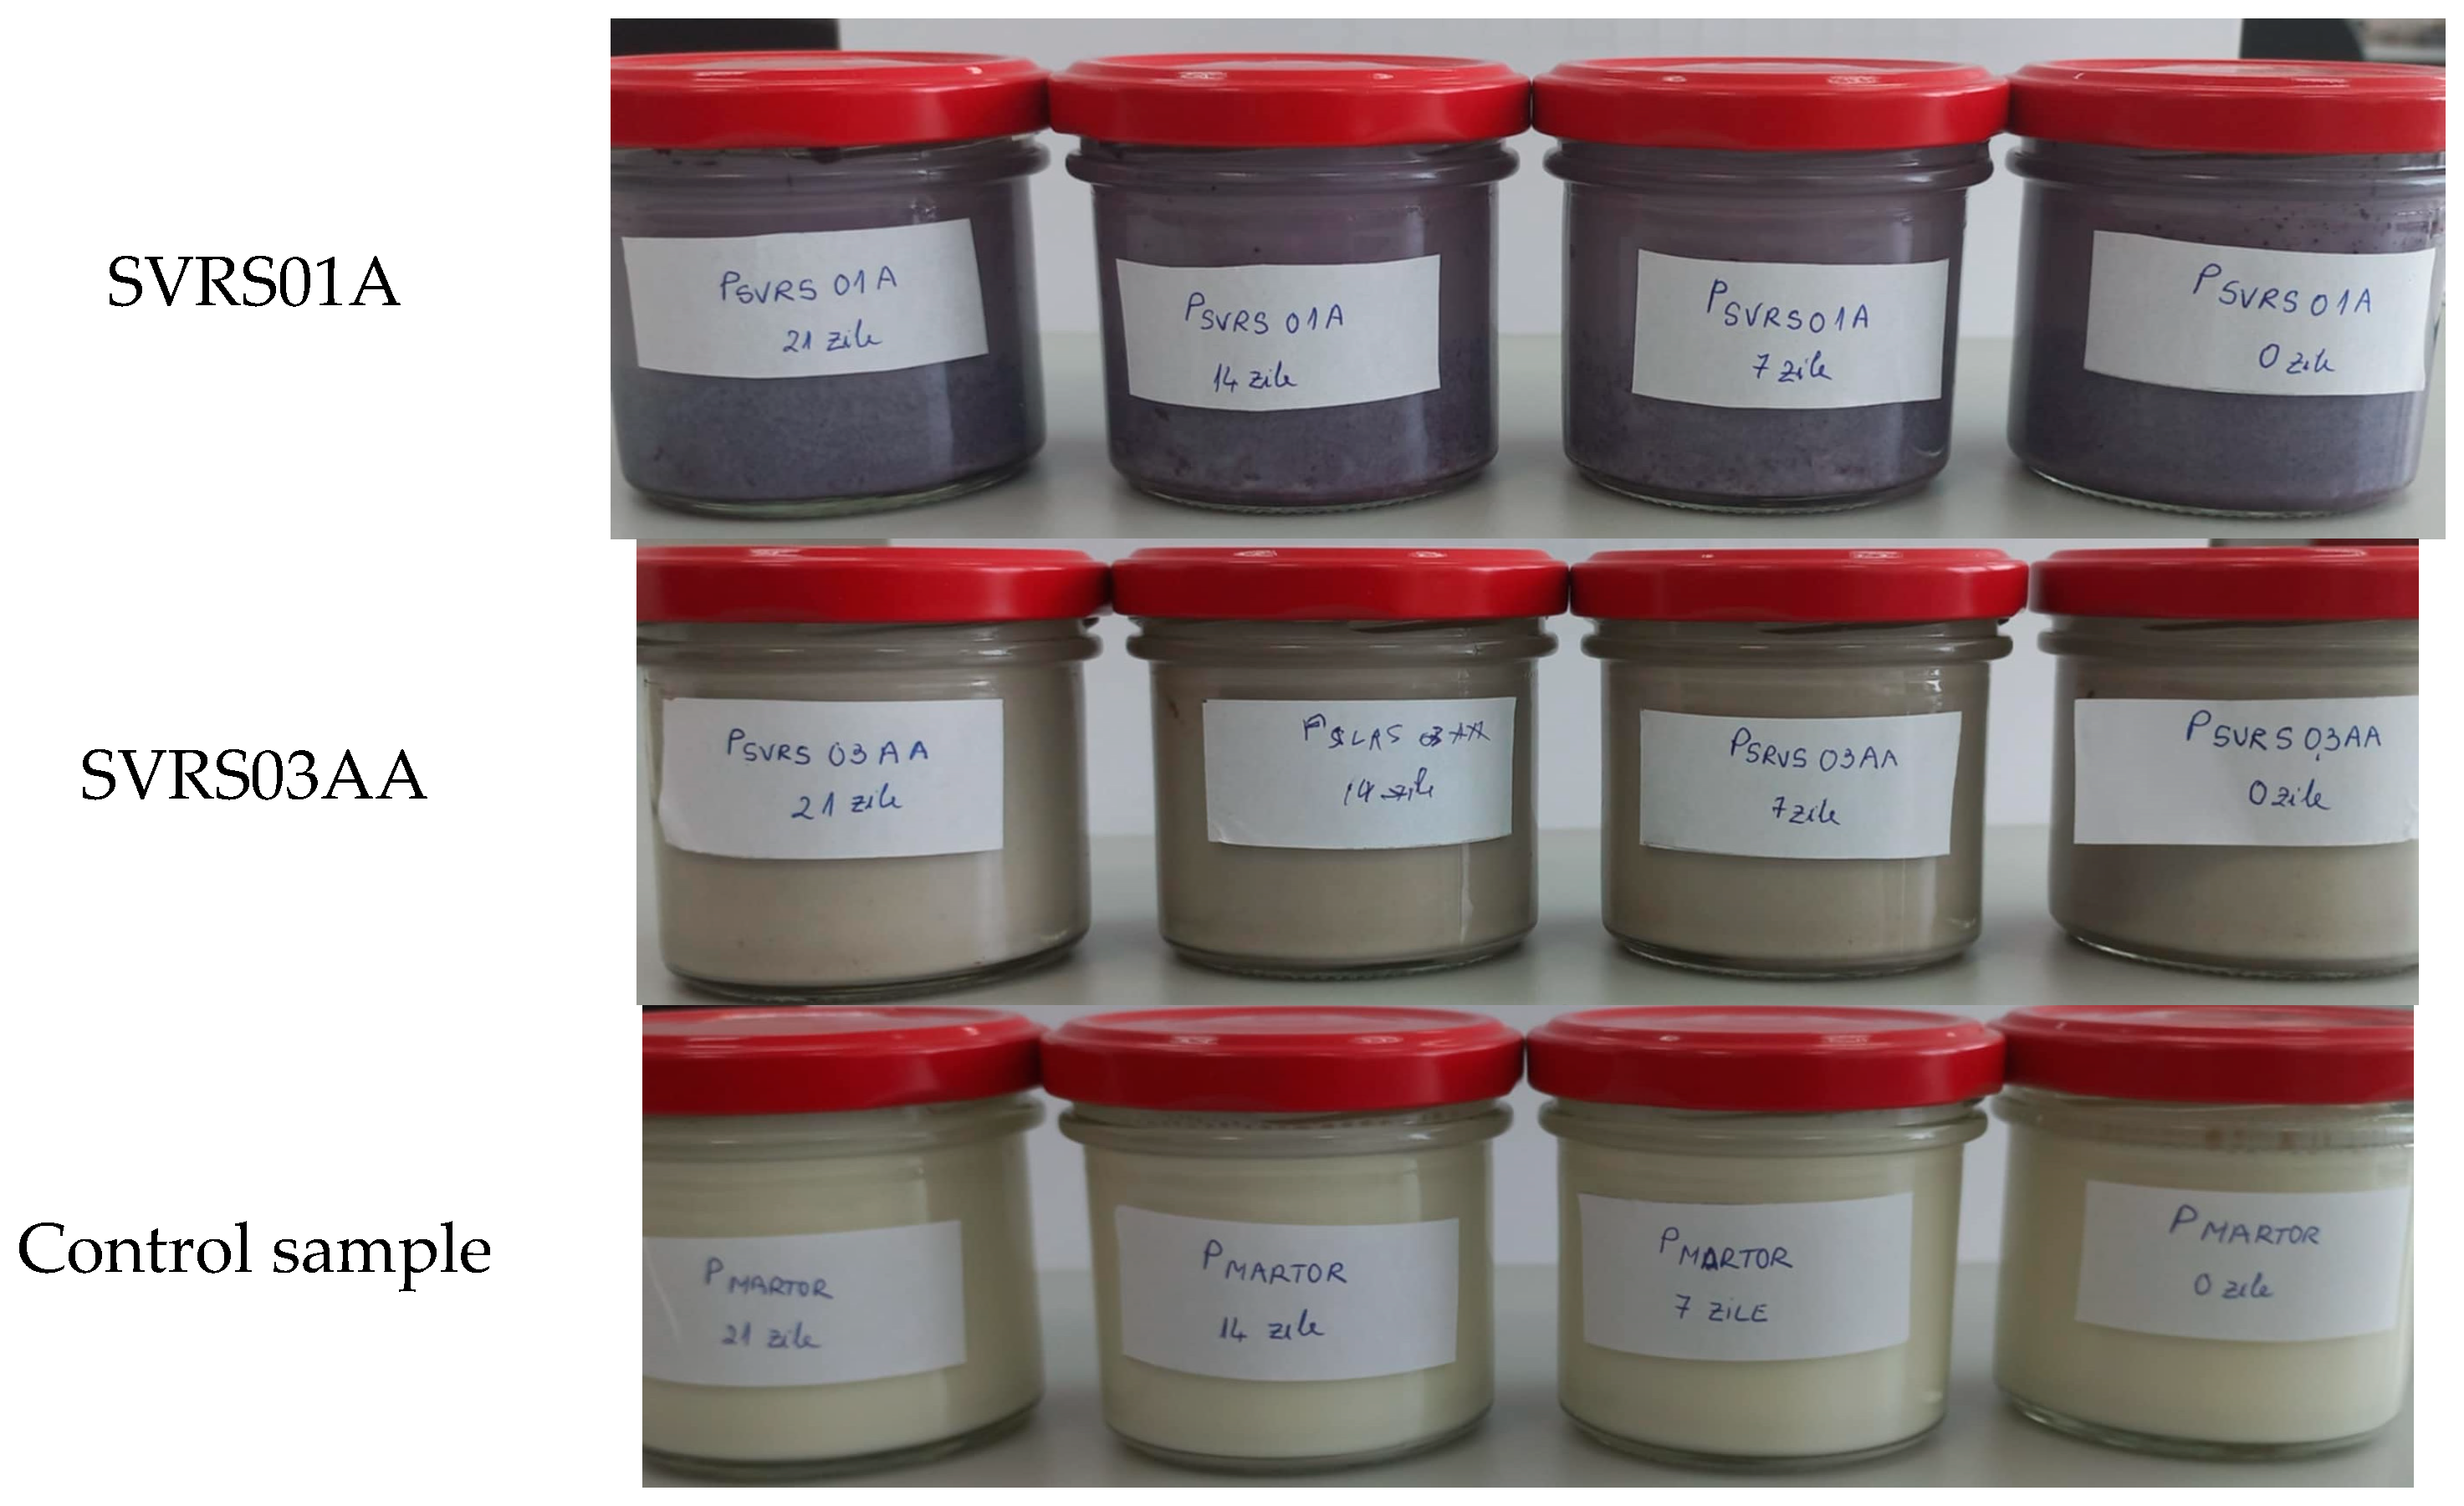
Table 2 presents the CIELab color parameters (L*, a*, b*), chroma (C*), hue angle (h), and total color difference (ΔE) of the yogurt samples during 20 days of refrigerated storage. Color evaluation was conducted to assess the impact of β-glucan addition and extraction method on the visual properties of low-fat yogurt. The control sample, as expected, exhibited a higher lightness (L*) compared to the β-glucan-enriched samples, while significant differences were also observed in chroma and hue values. The total colour difference (ΔE) between the control and the β-glucan-enriched samples was particularly notable, indicating marked visual changes resulting from β-glucan incorporation and storage duration.
The color analysis of the stirred yogurt samples over the 20-day storage period revealed substantial differences between the control and β-glucan-enriched samples, particularly in lightness (L*) and total color difference (ΔE). Initially, the control sample exhibited the highest L* value (85.78), indicating a much lighter appearance compared to the β-glucan-enriched samples SVRS03AA (72.07) and SVRS01A (41.78). This trend persisted throughout storage, with L* values decreasing in all samples, but the β-glucan-enriched samples consistently showed darker tones, particularly SVRS01A, which maintained the lowest lightness values.
The parameter ΔE confirmed noticeable color changes during storage. The autolysis-derived β-glucan sample (SVRS01A) exhibited the most significant color difference from the control, with ΔE values reaching 48.31 at day 0 and increasing up to 29.34 by day 20. In contrast, the acid–alkaline-extracted β-glucan sample (SVRS03AA) showed moderate colour differences, with ΔE ranging from 15.14 at day 0 to 19.40 at day 20. These differences may be attributed to the intrinsic colour of the extracted β-glucans, which likely affected the yogurt matrix, and to the possible formation of Maillard reaction products or pigment degradation during storage.
Furthermore, hue angle (h) and chroma (C*) varied among the samples, reflecting differences in color intensity and saturation. SVRS01A consistently exhibited higher chroma and distinct hue values, suggesting that its pigment composition or interaction with the yogurt matrix differs significantly from the other samples. These results are consistent with findings from other studies where β-glucan addition influenced the visual properties of dairy products, particularly in low-fat formulations (Soukoulis et al., 2009) [24].
Overall, these findings indicate that the method of β-glucan extraction significantly impacts the visual appearance and color stability of low-fat yogurt during storage (Figure 6).

3.6. Rheological Evaluation

3.6.1. Rheological Properties of the Control Yogurt Sample

The rheological behavior of the control yogurt sample was evaluated using flow, time-dependent, and dynamic frequency tests performed with the Modular Advanced Rheometer System (Thermo Fisher Scientific, Karlsruhe, Germany). The analyses were conducted at 4 °C, and the obtained results are presented in Figure 7, Figure 8, Figure 9 and Figure 10.
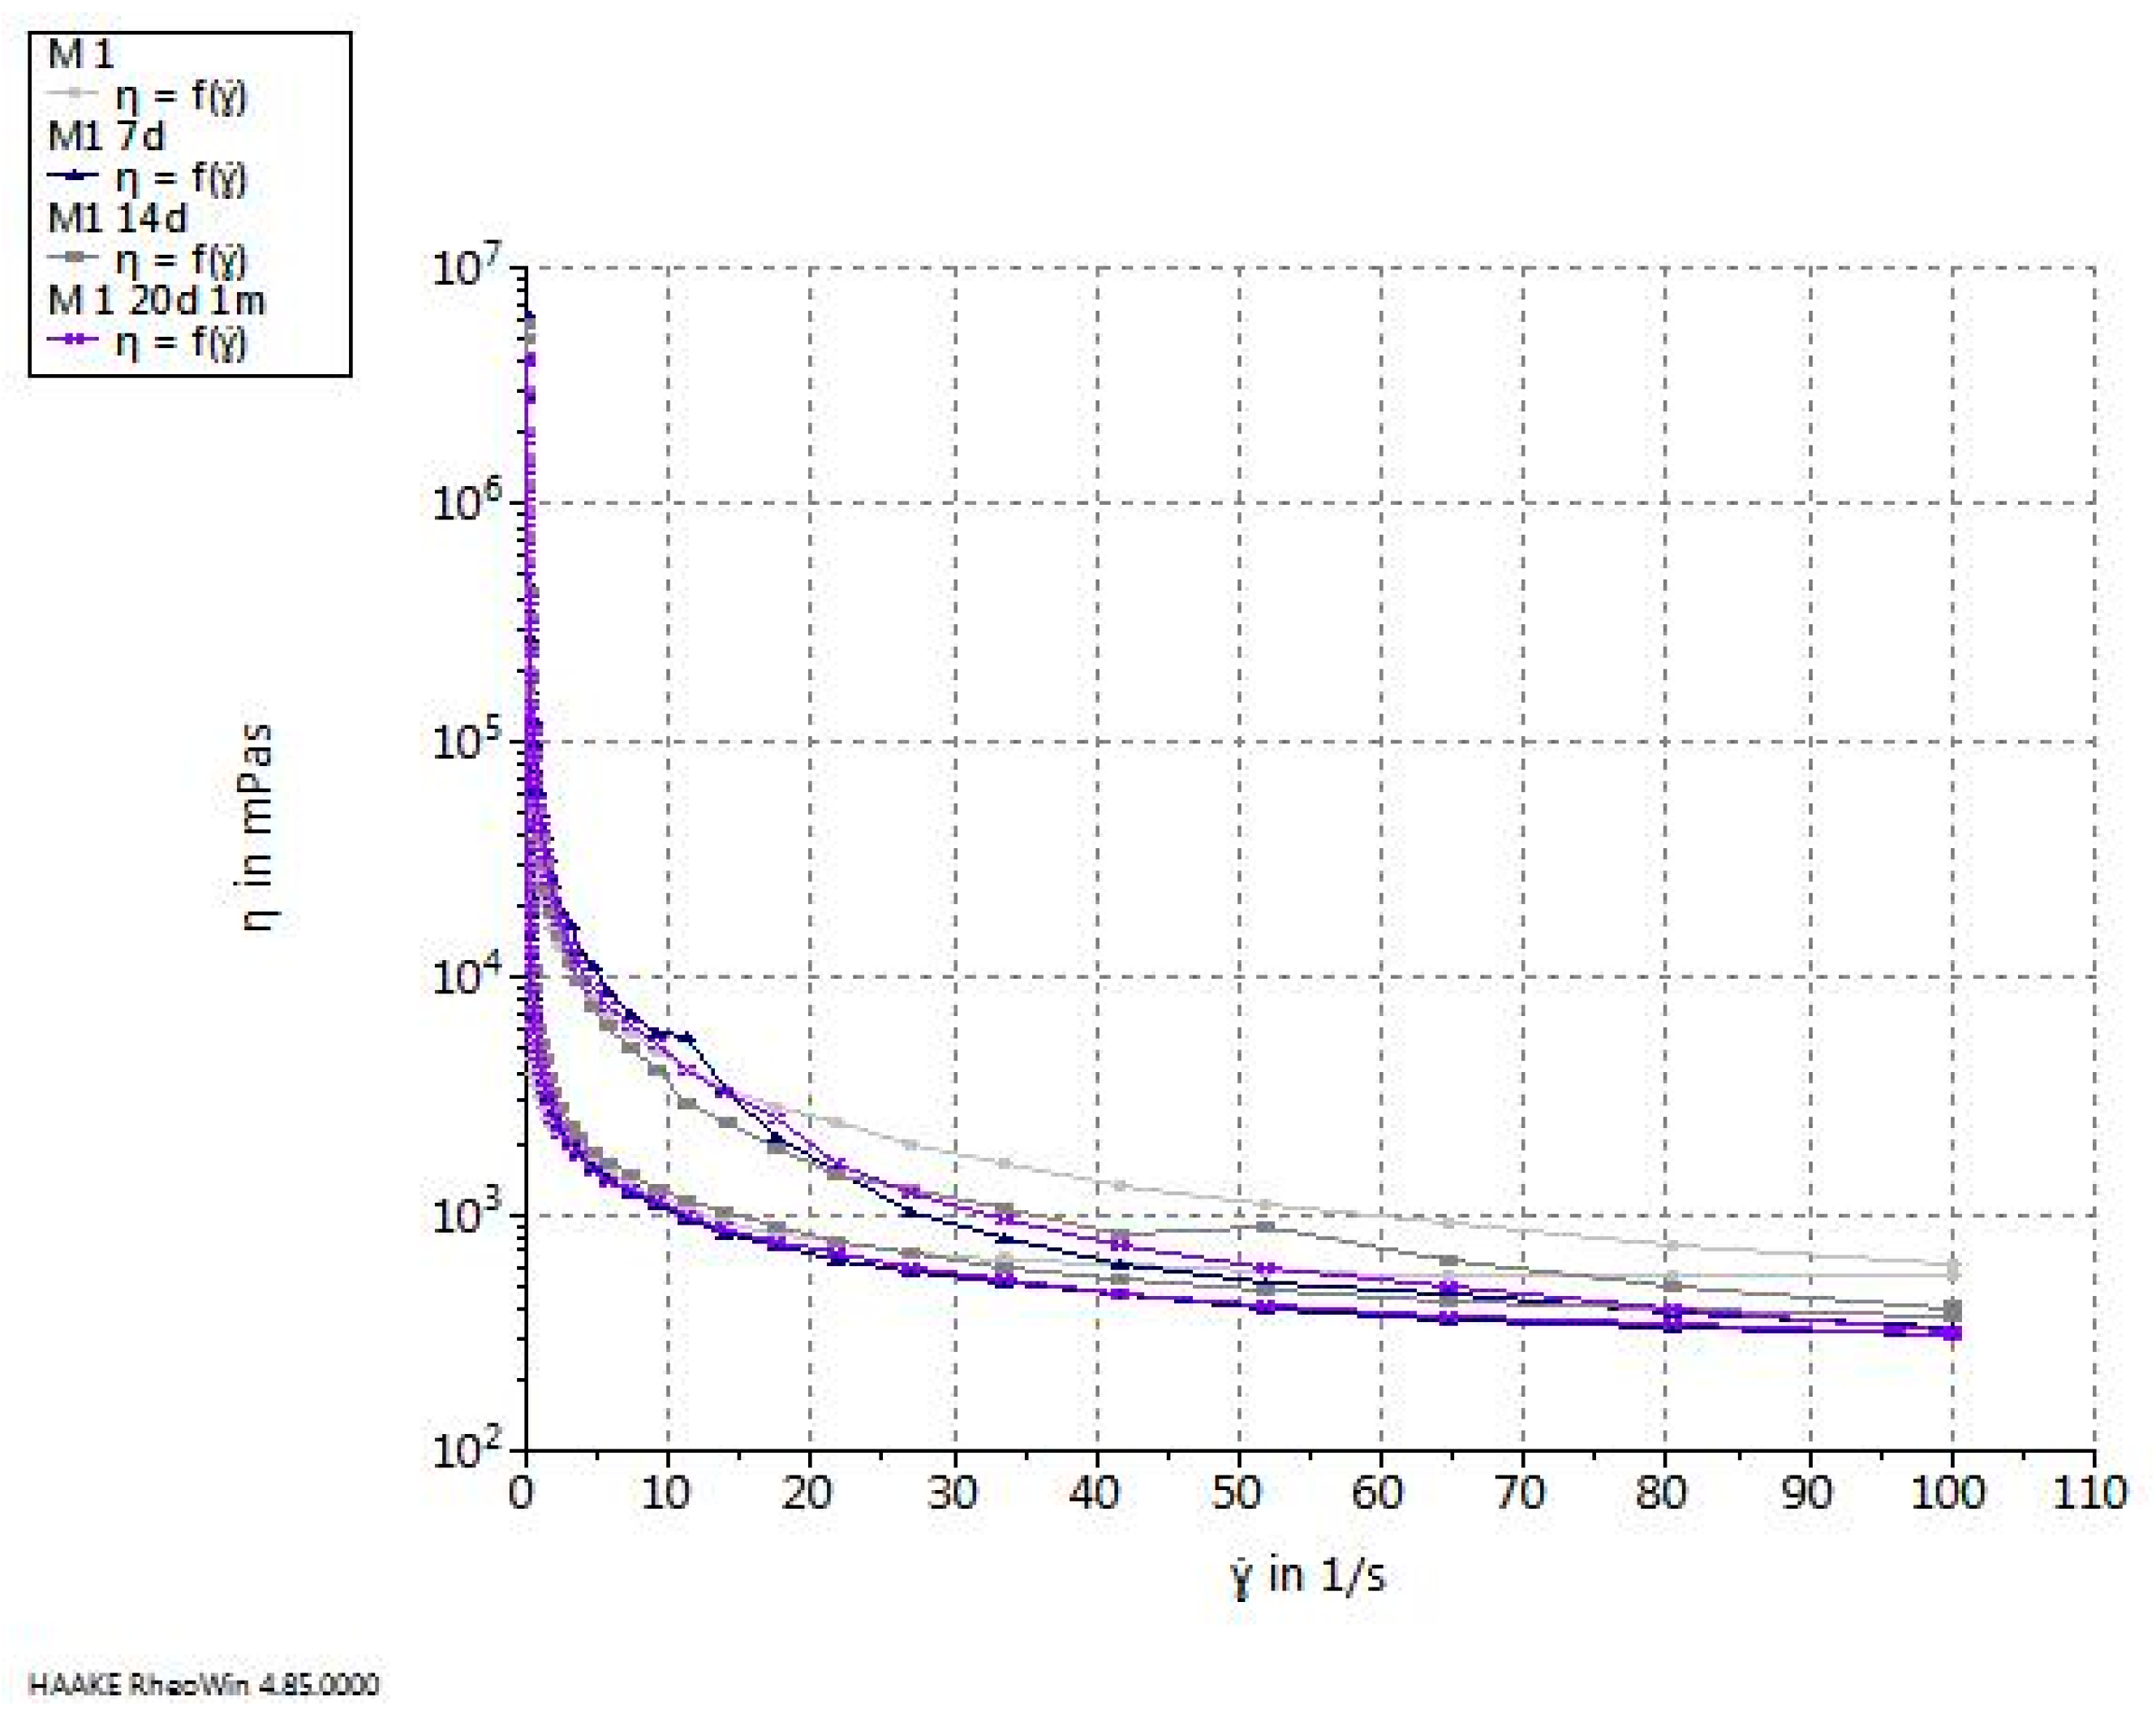
The flow curves (Figure 7) describing the dependence of viscosity (η) on shear rate ( γ ˙ ) revealed a typical non-Newtonian, shear-thinning behavior, characterized by a sharp decrease in viscosity as the shear rate increased from 0.1 to 100 s−1. This behavior is common for fermented dairy gels, where the protein network breaks down progressively under shear stress. At low shear rates, viscosity values were very high (105–106 mPa·s), indicating a highly structured gel network, whereas at high shear rates (>50 s−1), viscosity stabilized around 103 mPa·s, suggesting complete structural breakdown and flow stabilization. The evolution of the flow curves during storage (0, 7, 14, and 20 days) showed a gradual decrease in viscosity over time, reflecting a weakening of the gel matrix. This reduction is likely associated with syneresis and rearrangement of casein micelles, processes that commonly occur in yogurt during cold storage.
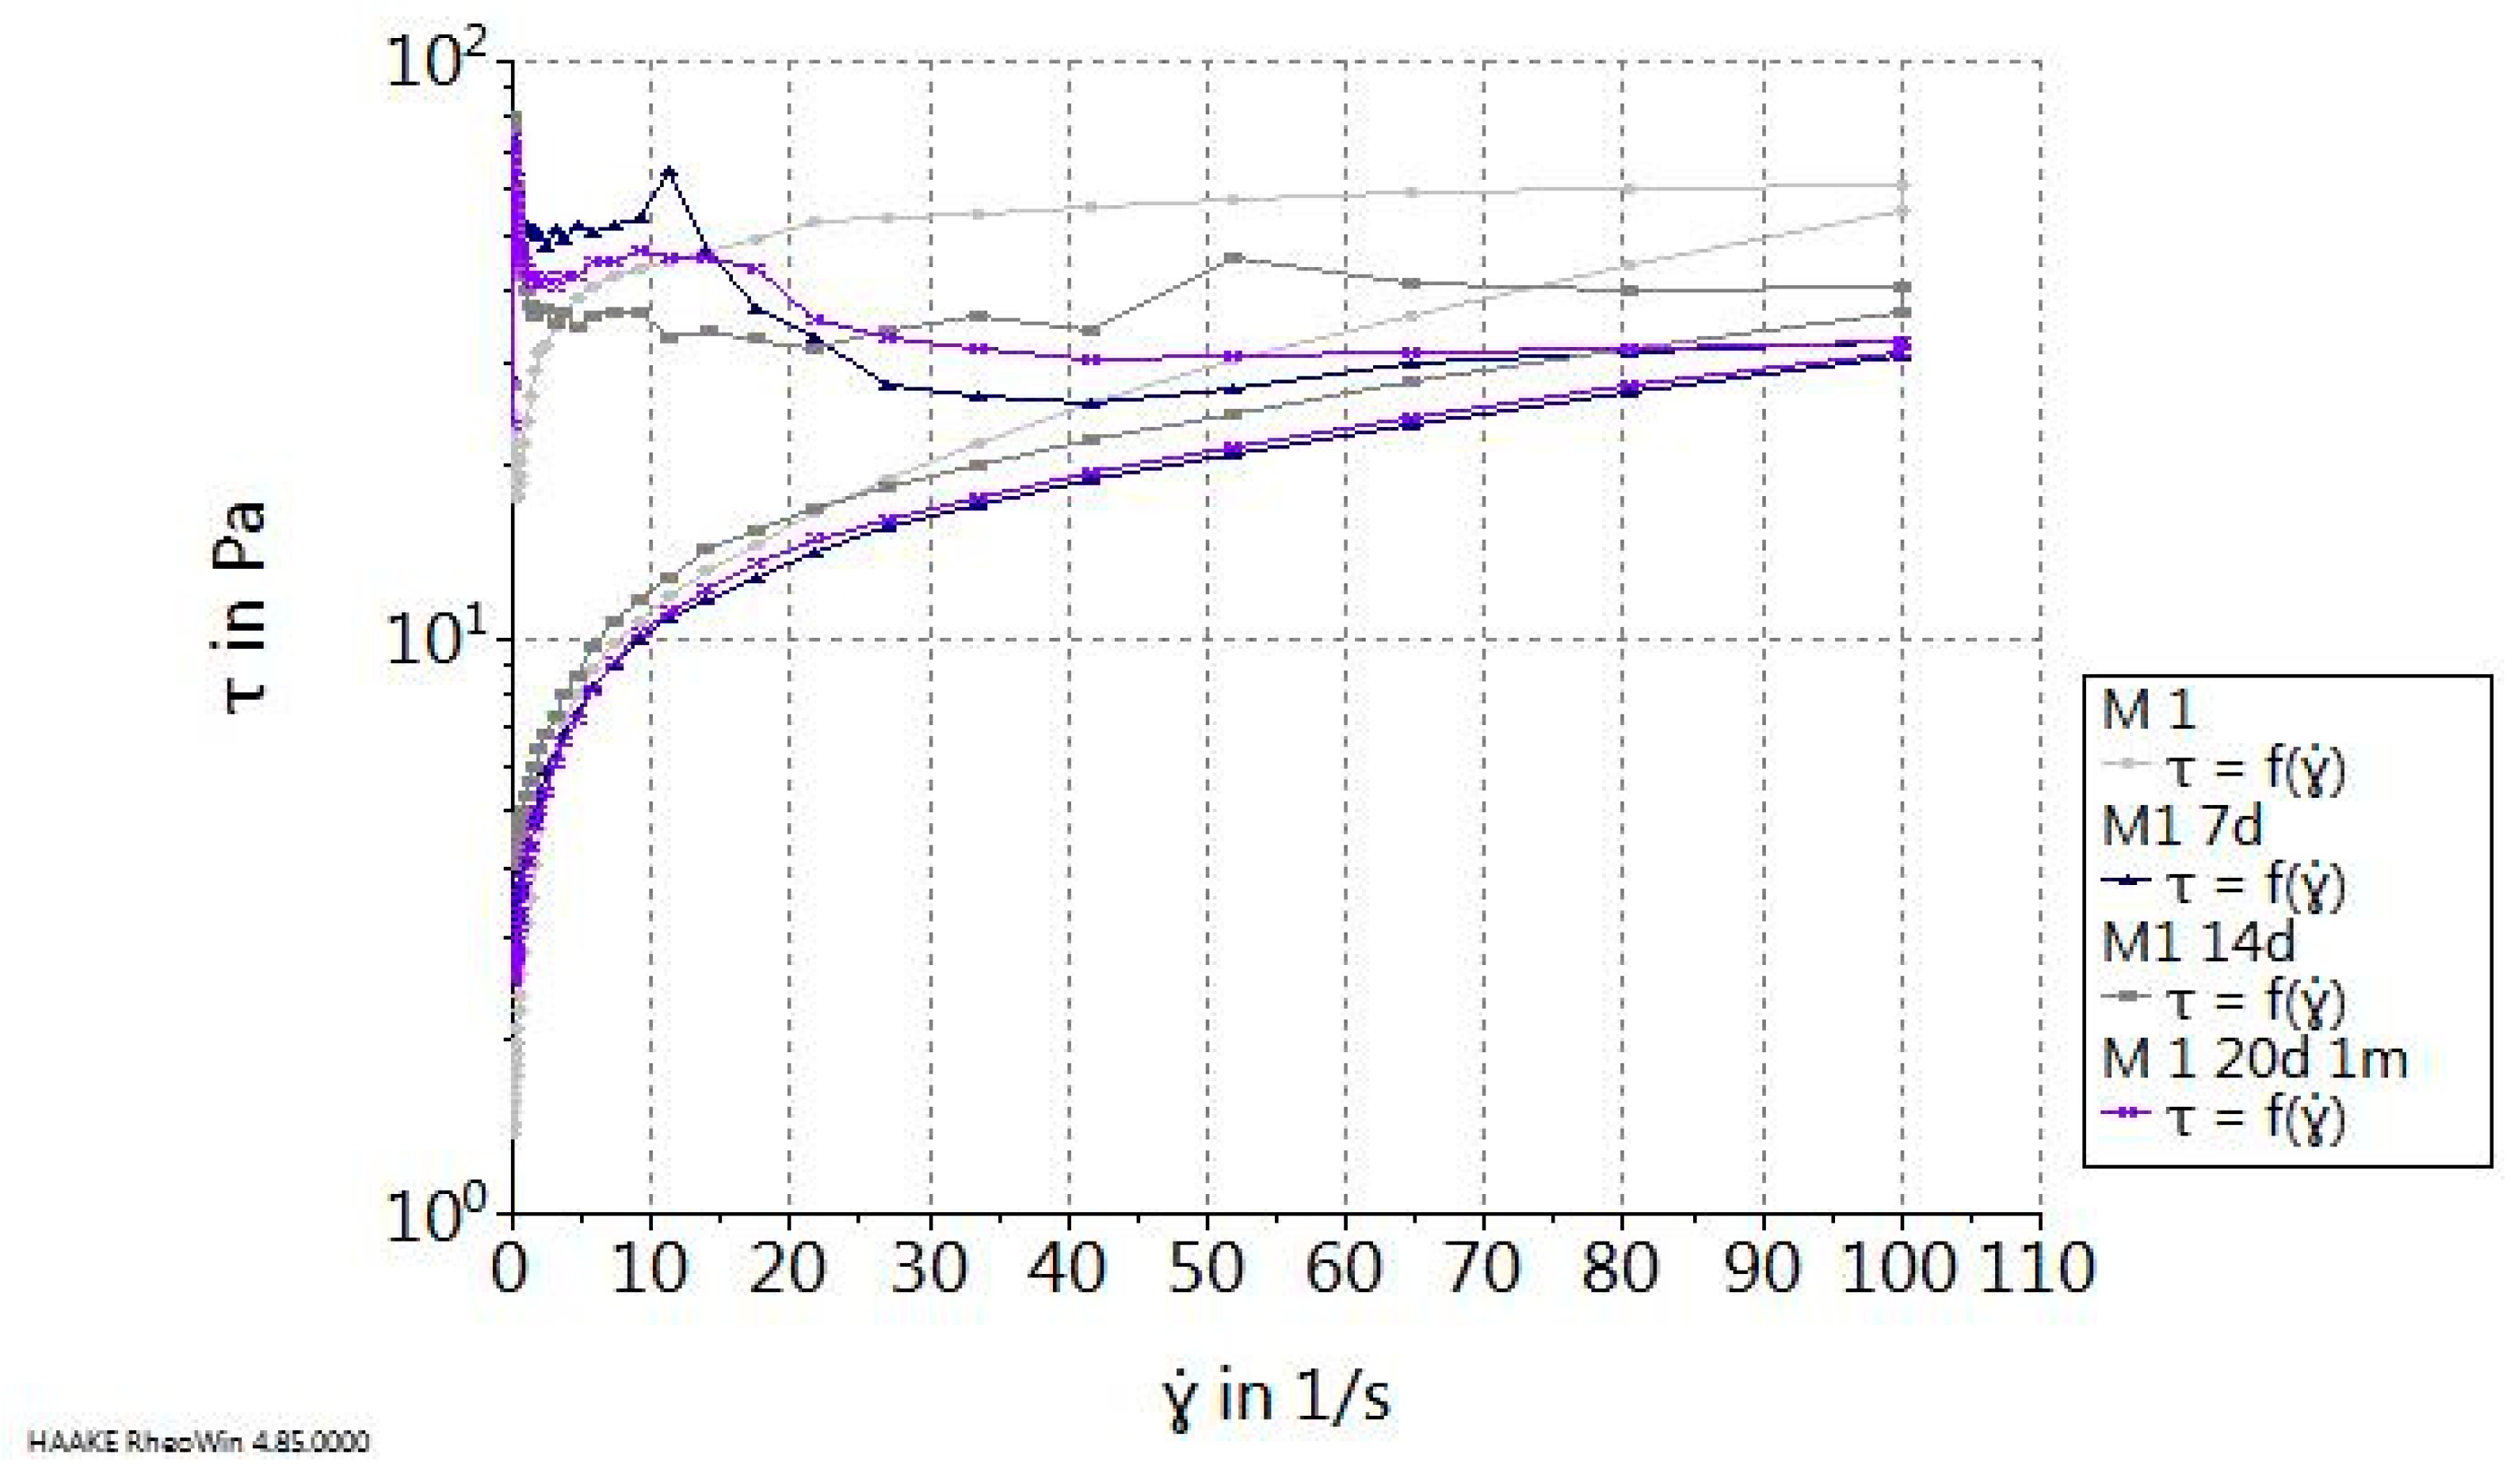
The variation in shear stress (τ) as a function of shear rate (Figure 8) further confirmed the pseudoplastic character of the yogurt. The curves were nonlinear and exhibited a distinct yield stress, indicating that a minimum shear force was required to initiate flow. As storage progressed, the values of τ decreased slightly, suggesting a progressive softening of the internal structure. The sample at day 0 presented the highest resistance to deformation, while by day 20, the stress required to induce flow had decreased, in line with the observed drop in viscosity.
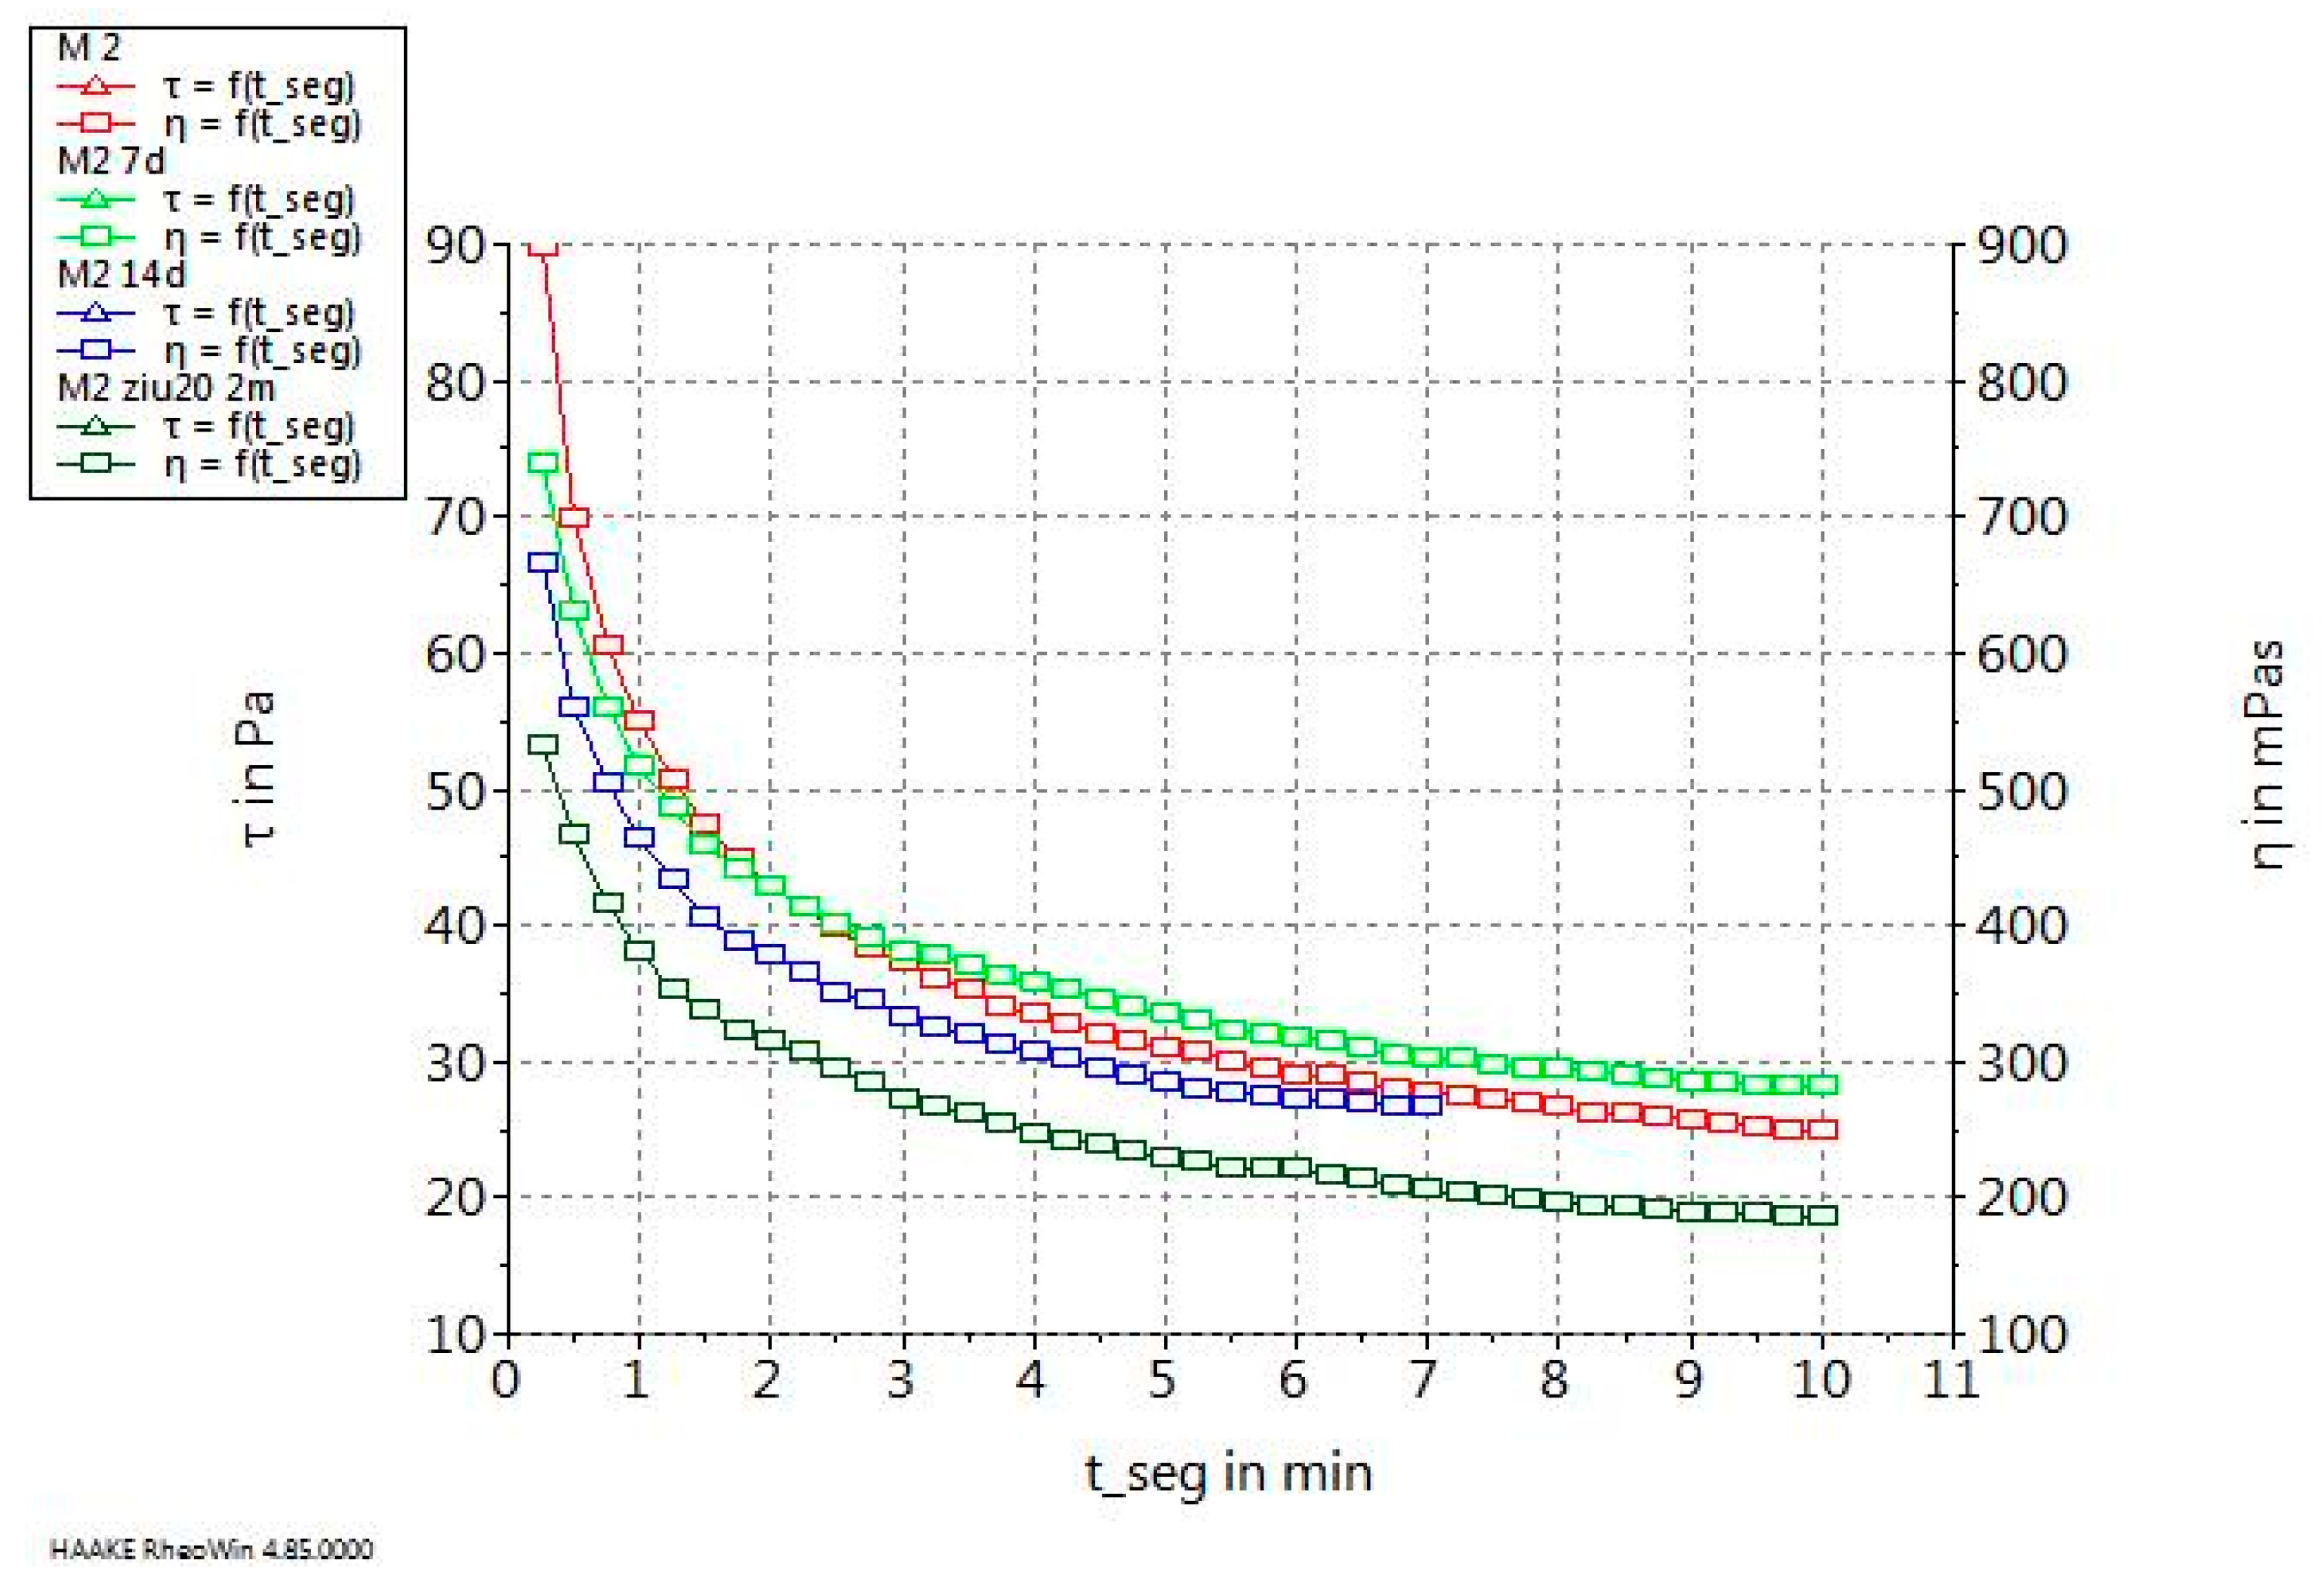
The time sweep test (Figure 9), performed at a constant shear rate (100 s−1) over 10 min, showed a rapid decrease in both shear stress and viscosity during the first minutes of shearing, followed by stabilization. This indicates a thixotropic behavior, where the structure gradually breaks down under continuous shear. The rate of viscosity loss increased with storage time, confirming that the gel network of the control yogurt became more fragile and less resistant to mechanical deformation as storage progressed.
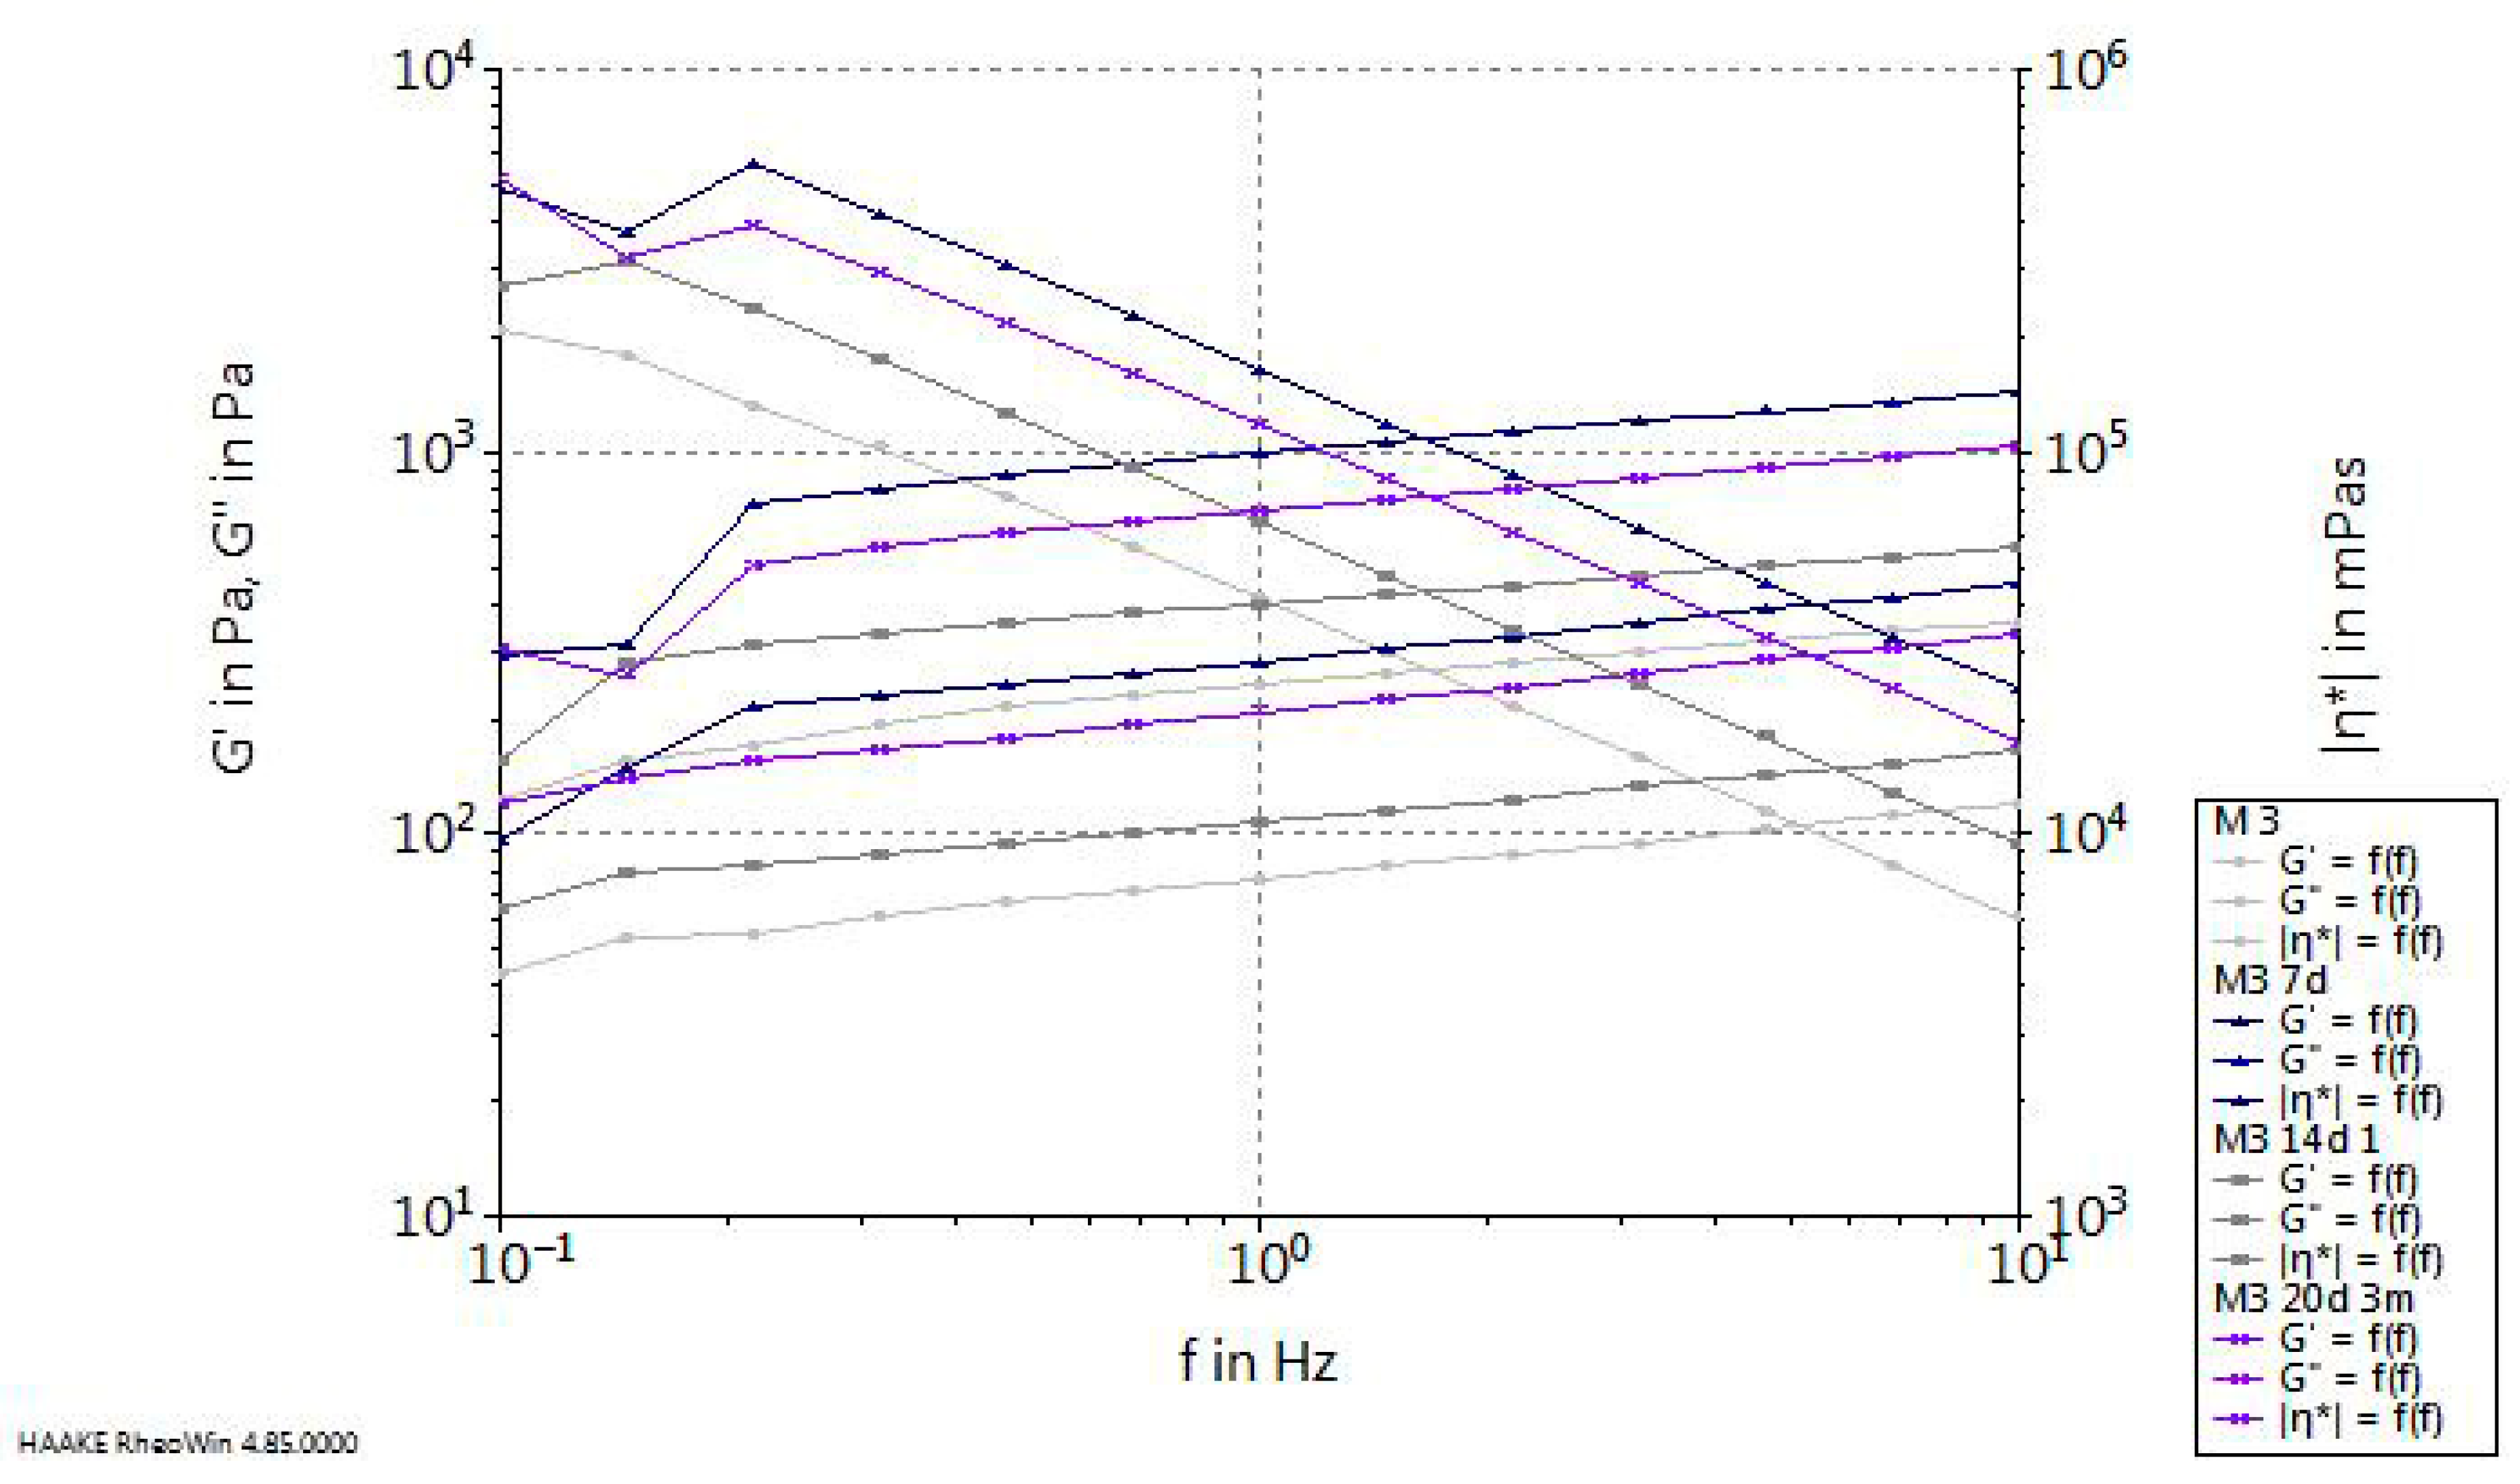
The frequency sweep test (Figure 10) provided insight into the viscoelastic characteristics of the control sample. Across the entire frequency range (0.1–10 Hz), the storage modulus (G′) was higher than the loss modulus (G″), confirming that the yogurt exhibited dominant elastic behavior typical of weak gels. However, both G′ and G″ decreased over time, particularly after 14 days, indicating structural relaxation and partial collapse of the gel network. The complex viscosity (|η*|) followed a decreasing trend with frequency, which is consistent with the shear-thinning behavior observed in the flow tests.

3.6.2. Rheological Properties of the Sample SVRS01A

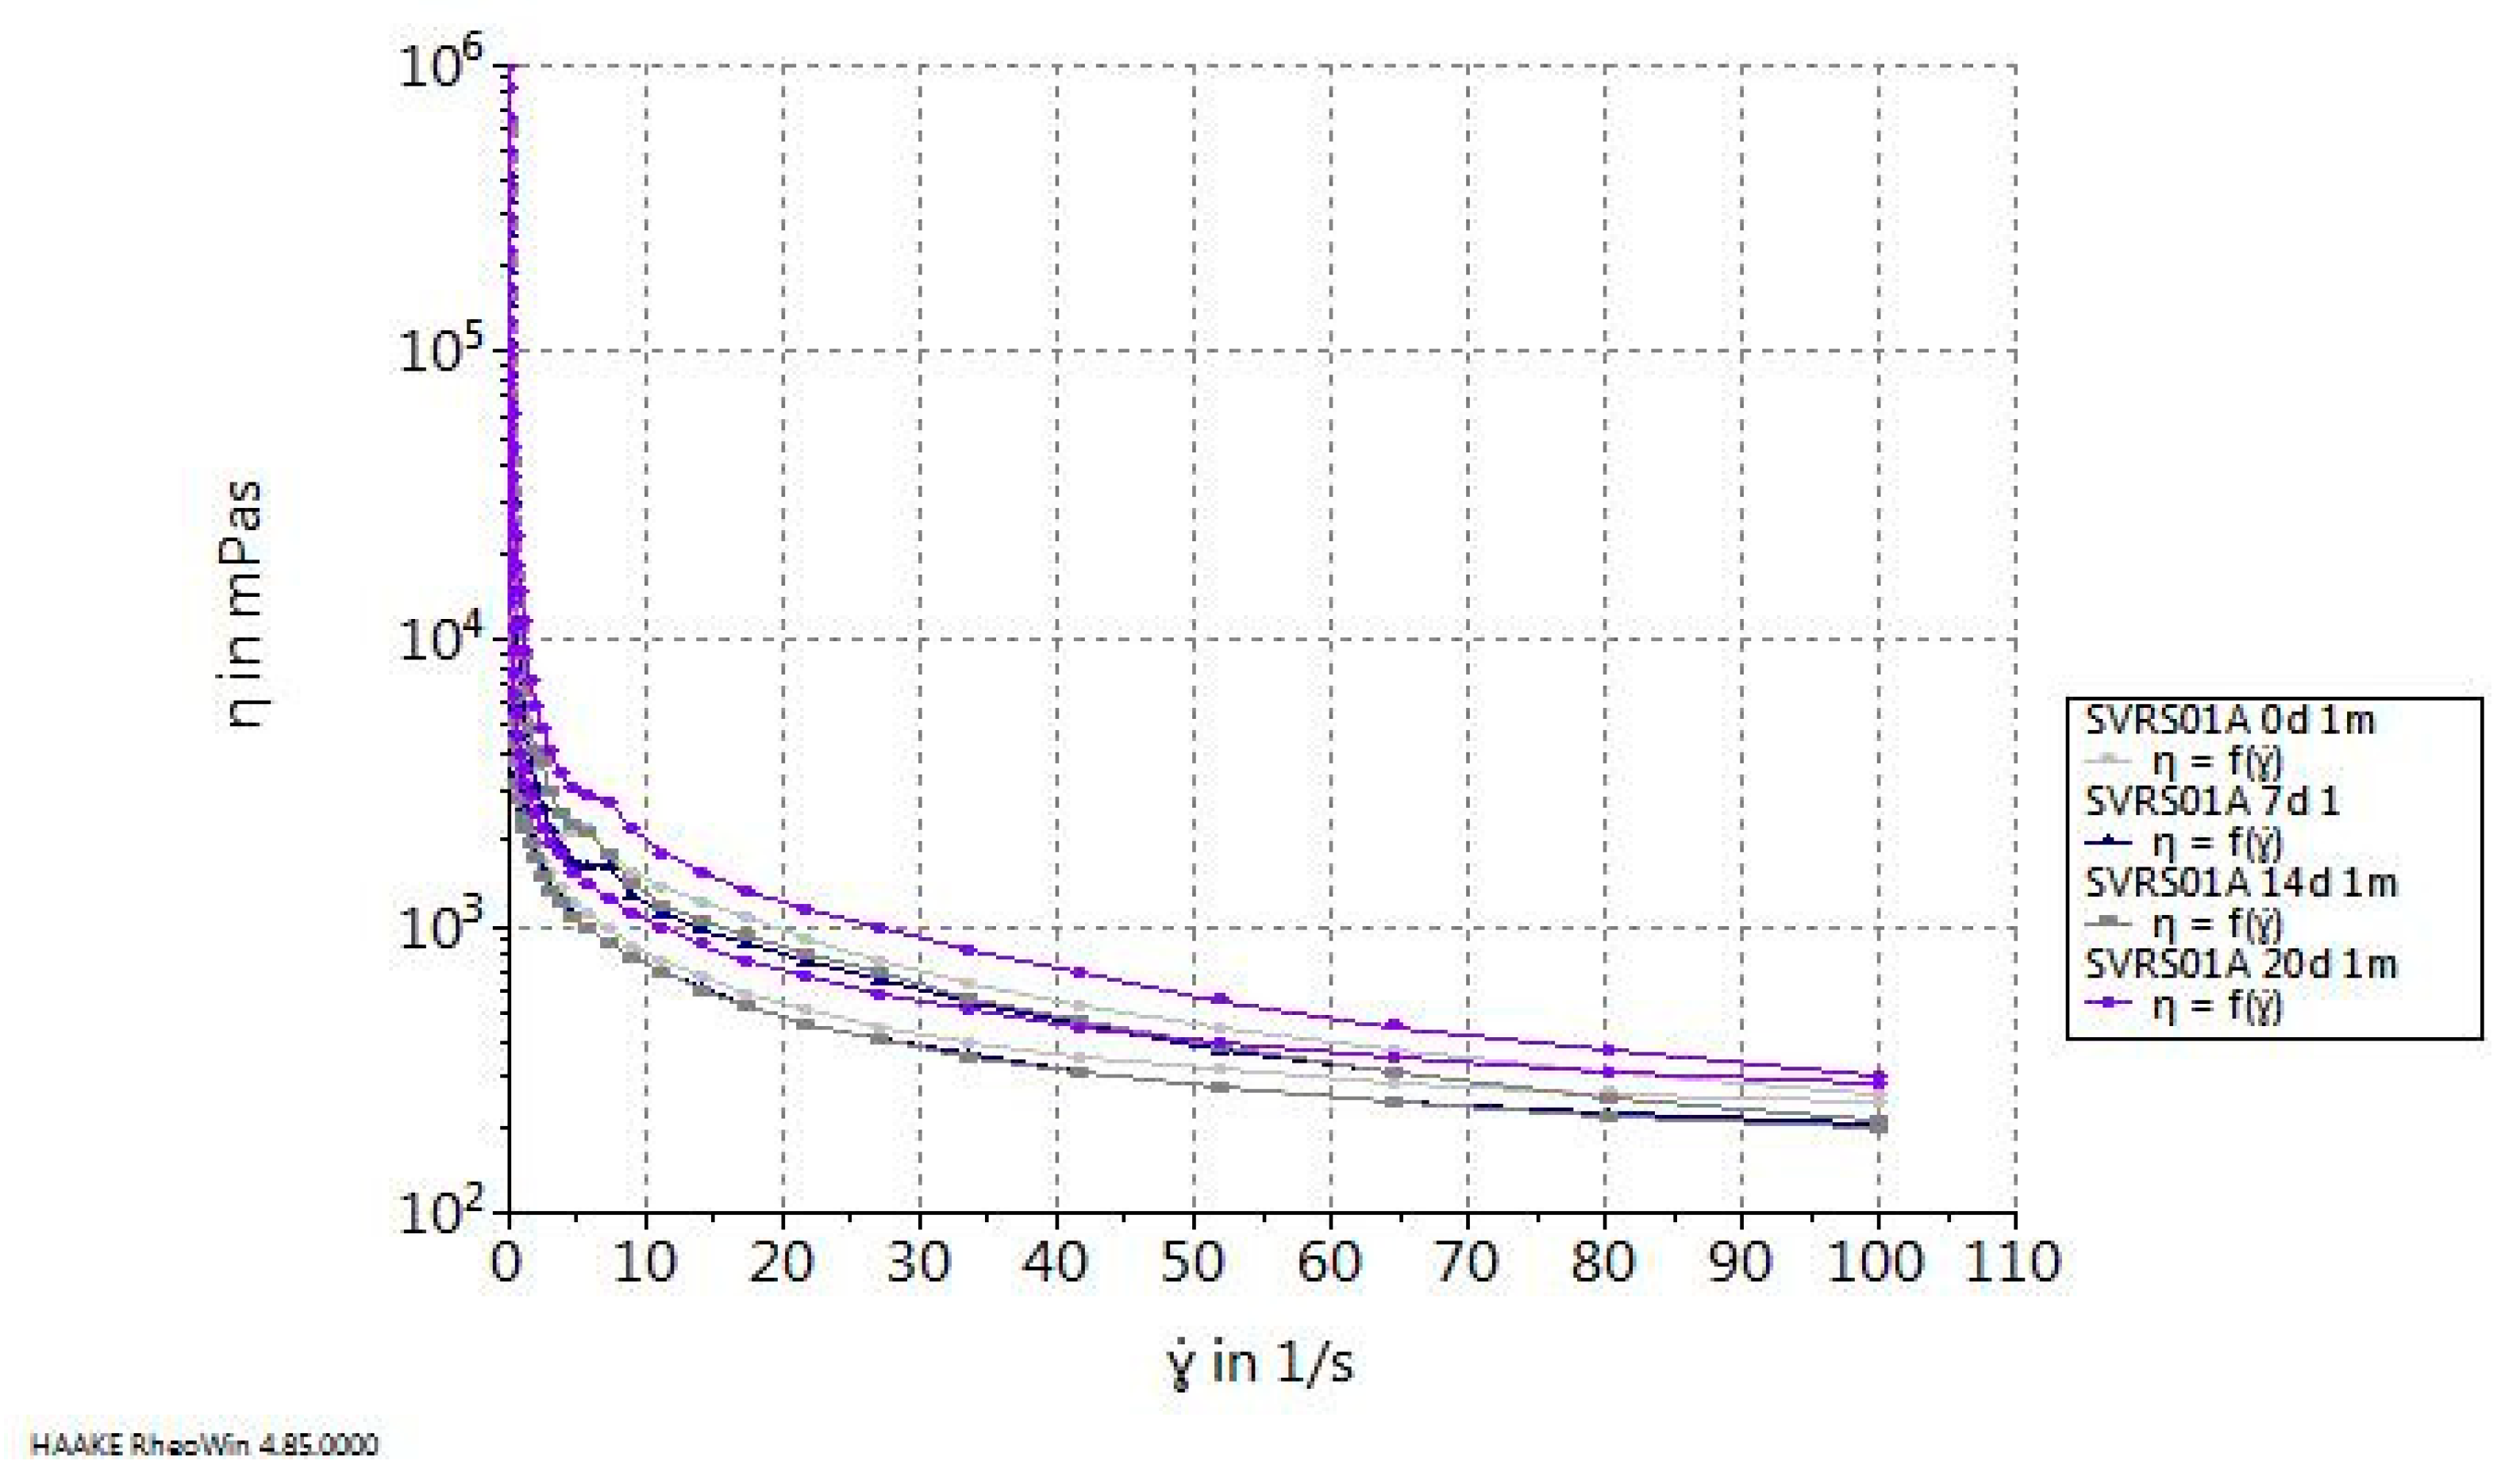
For sample SVRS01A, three types of rheological tests were performed to evaluate the flow behavior and viscoelastic properties as a function of maturation time (0, 7, 14, and 20 days). The results are shown in Figure 11, Figure 12, Figure 13 and Figure 14.
The flow curves (Figure 11), showing the relationship between apparent viscosity (η) and shear rate ( γ ˙ ), confirm a typical non-Newtonian, shear-thinning behavior in the yogurt samples. Over the storage period (0, 7, 14, and 20 days), a progressive decline in viscosity was observed across all shear rates. The sample stored for 0 days showed the highest viscosity throughout the shear range, while the 20-day sample exhibited the lowest values, especially at low shear rates. This trend reflects a gradual weakening of the protein network, likely due to ongoing syneresis, rearrangement of casein micelles, and structural relaxation processes typical of fermented dairy products during cold storage.
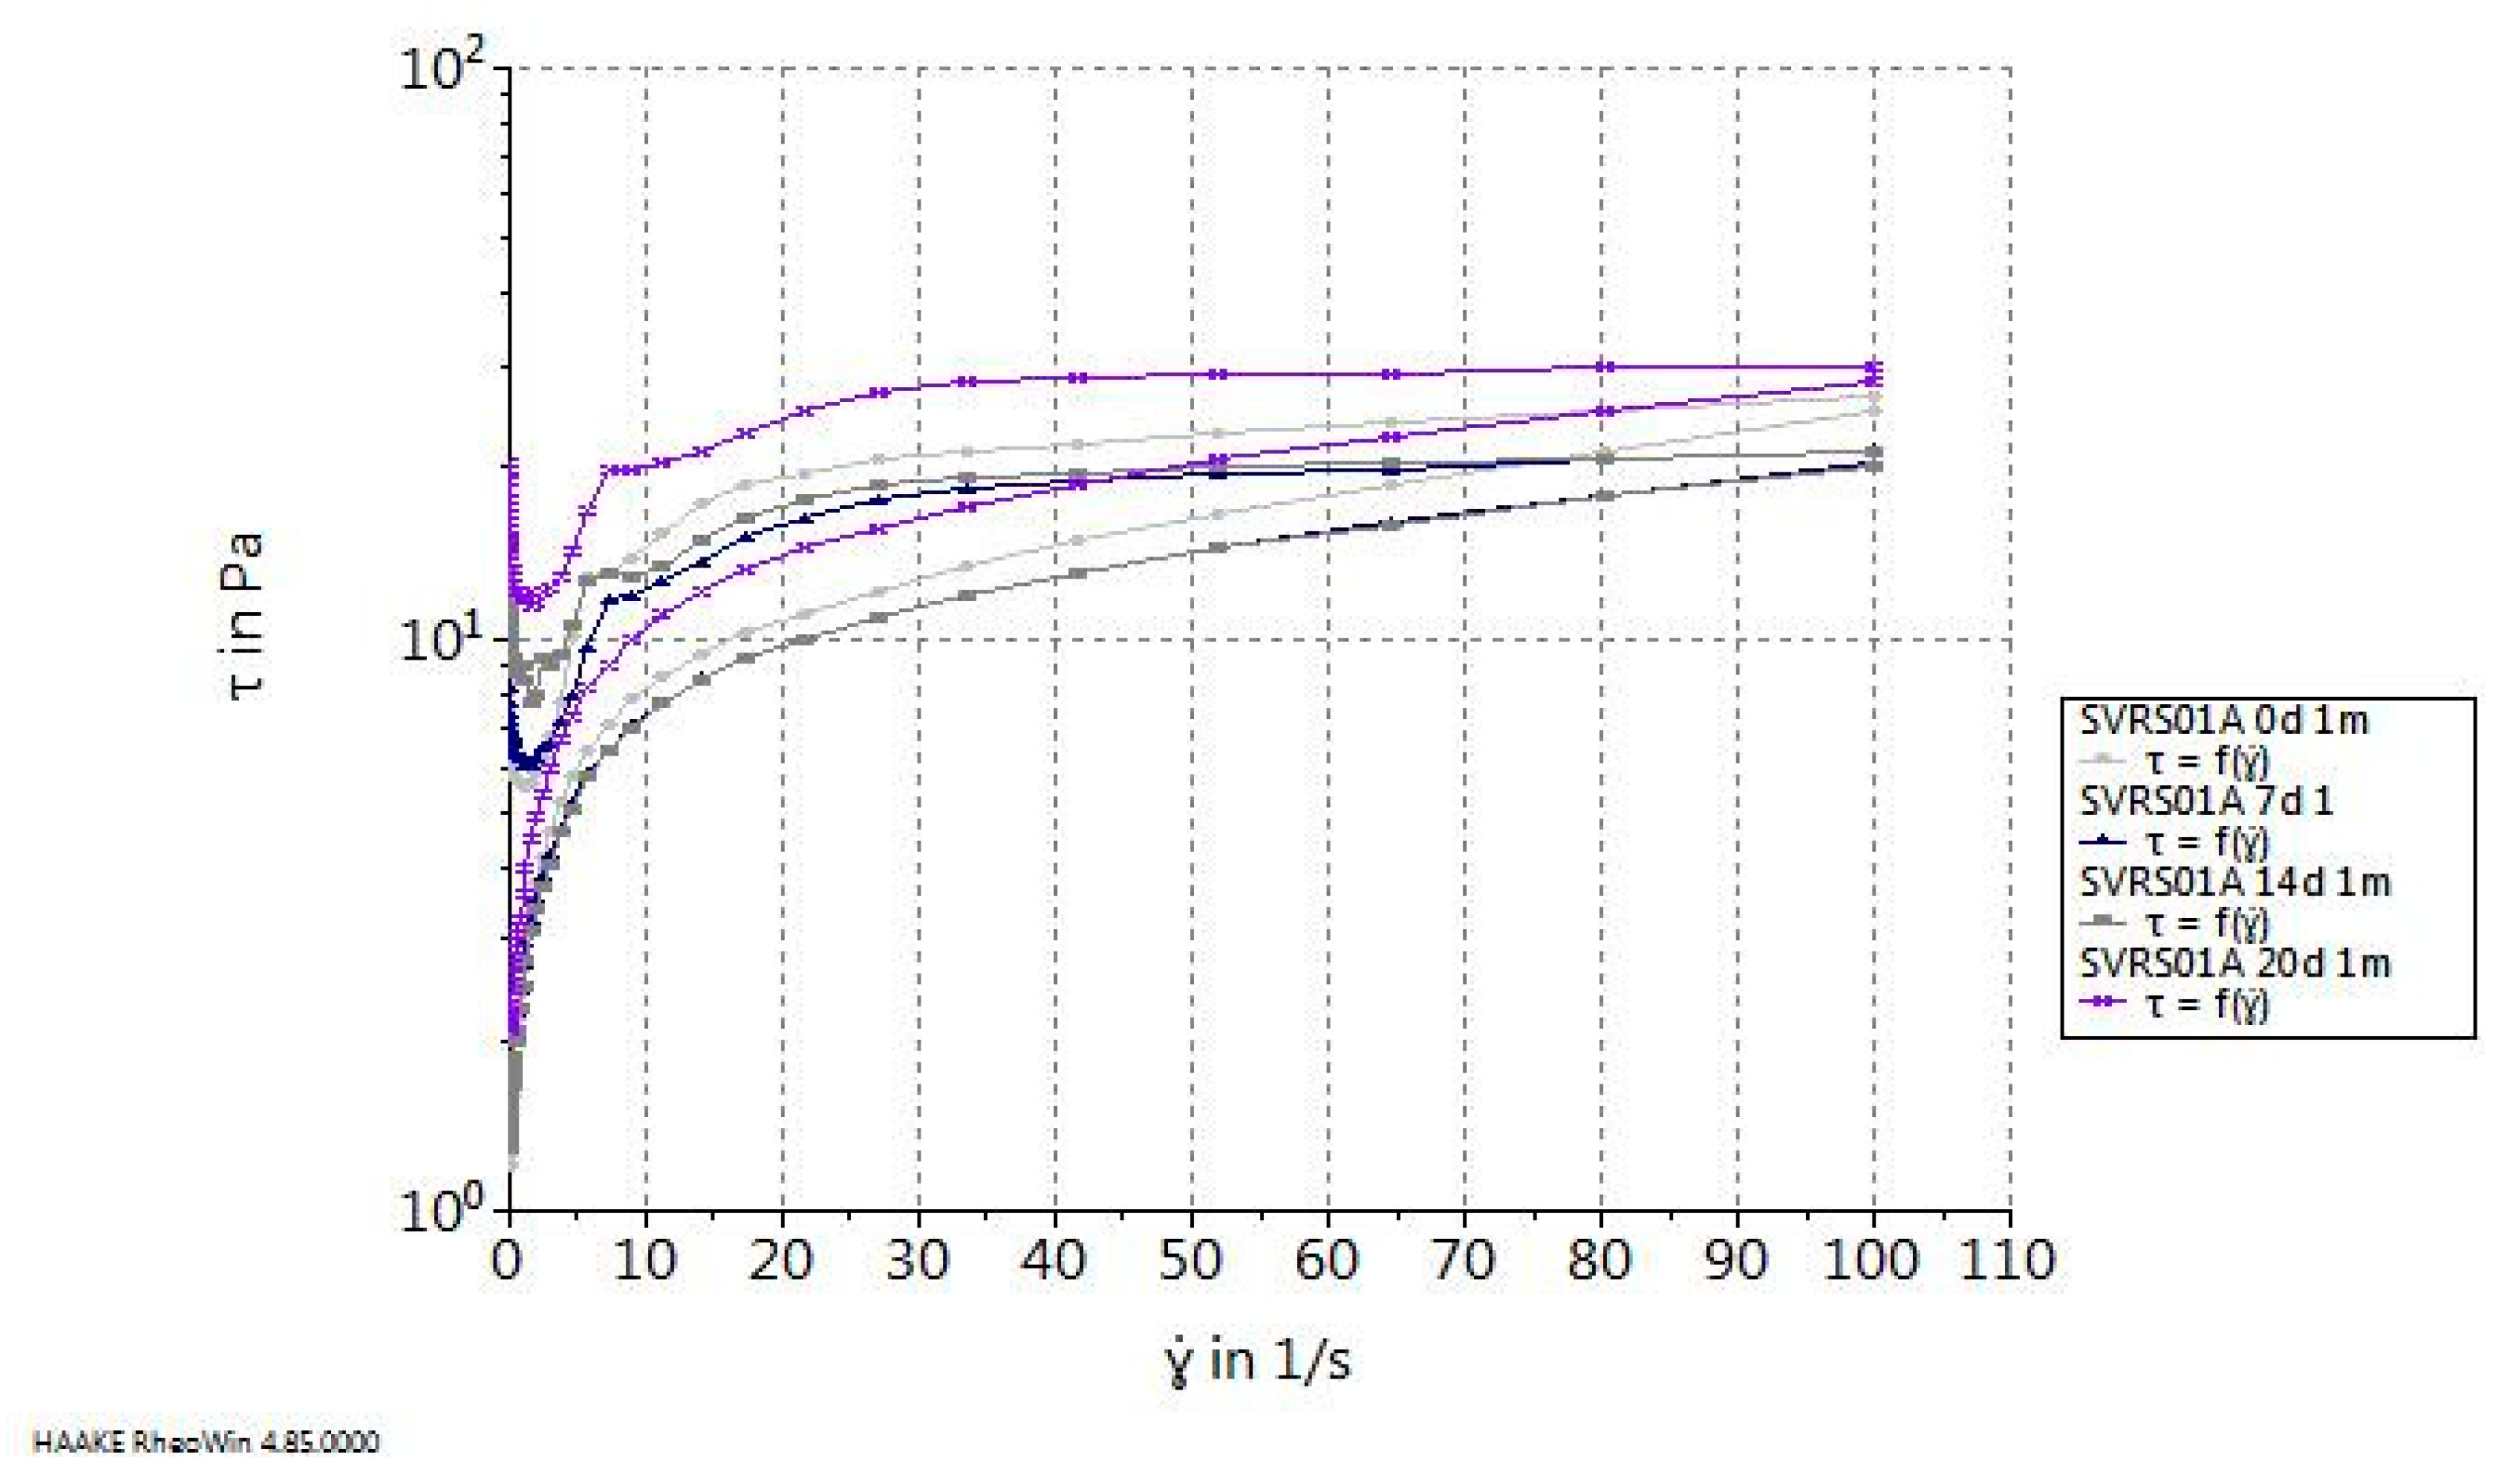
The flow curves illustrating the relationship between shear stress (τ) and shear rate ( γ ˙ ) (Figure 12) confirmed the pseudoplastic nature of the yogurt sample SVRS01A. The yogurt sample analyzed immediately after production (day 0) showed the highest τ values across the entire shear rate range, suggesting a strong and cohesive gel network. During storage (days 7, 14, and 20), a gradual decline in shear stress was observed, particularly at lower shear rates. The most pronounced decrease was noted in the sample stored for 20 days, indicating a progressive softening of the internal structure. This reduction is likely associated with time-dependent structural relaxation phenomena, including syneresis and reorganization of casein micelles.
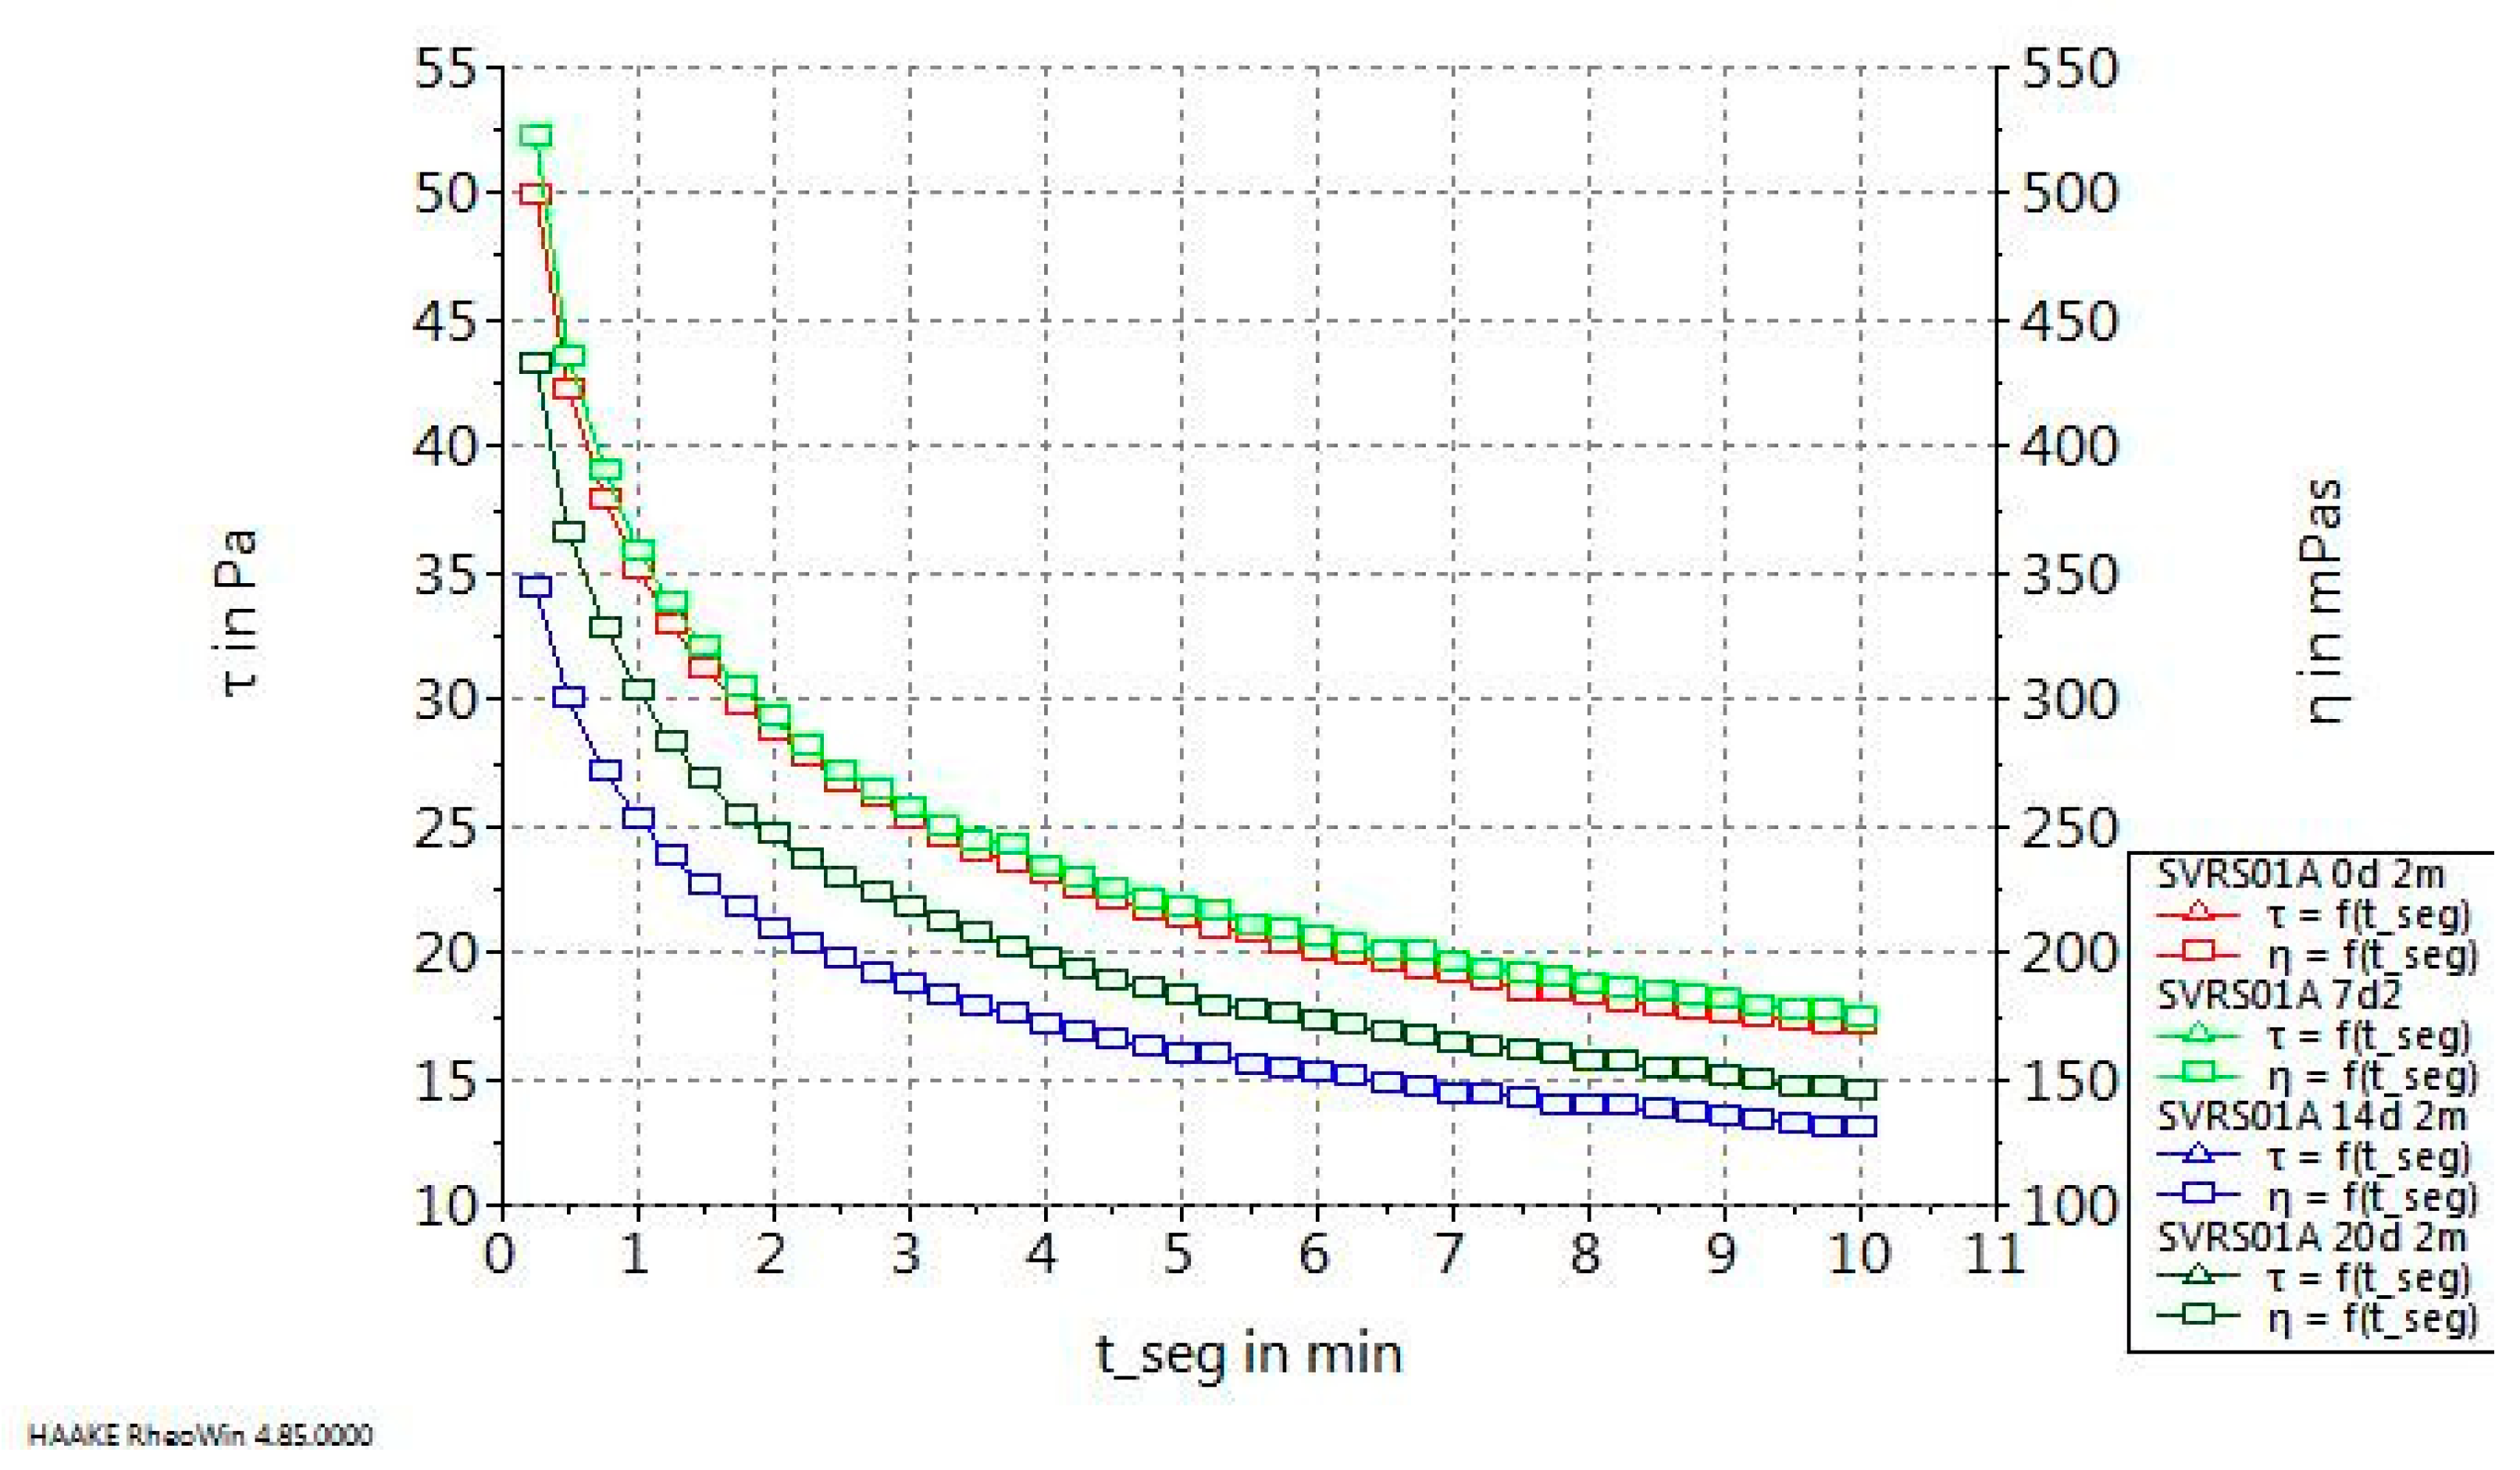
The τ = f(t) and η = f(t) curves (Figure 13) show a sharp decrease in stress and viscosity values during the first few minutes, followed by stabilization after approximately 8–10 min. This trend is typical of thixotropic systems, which lose structure under shear and partially rebuild it during rest. Higher initial stress values at day 0 indicate a more stable network, whereas the progressive decrease observed at 14 and 20 days suggests a lower degree of structural organization and reduced resistance to relaxation.
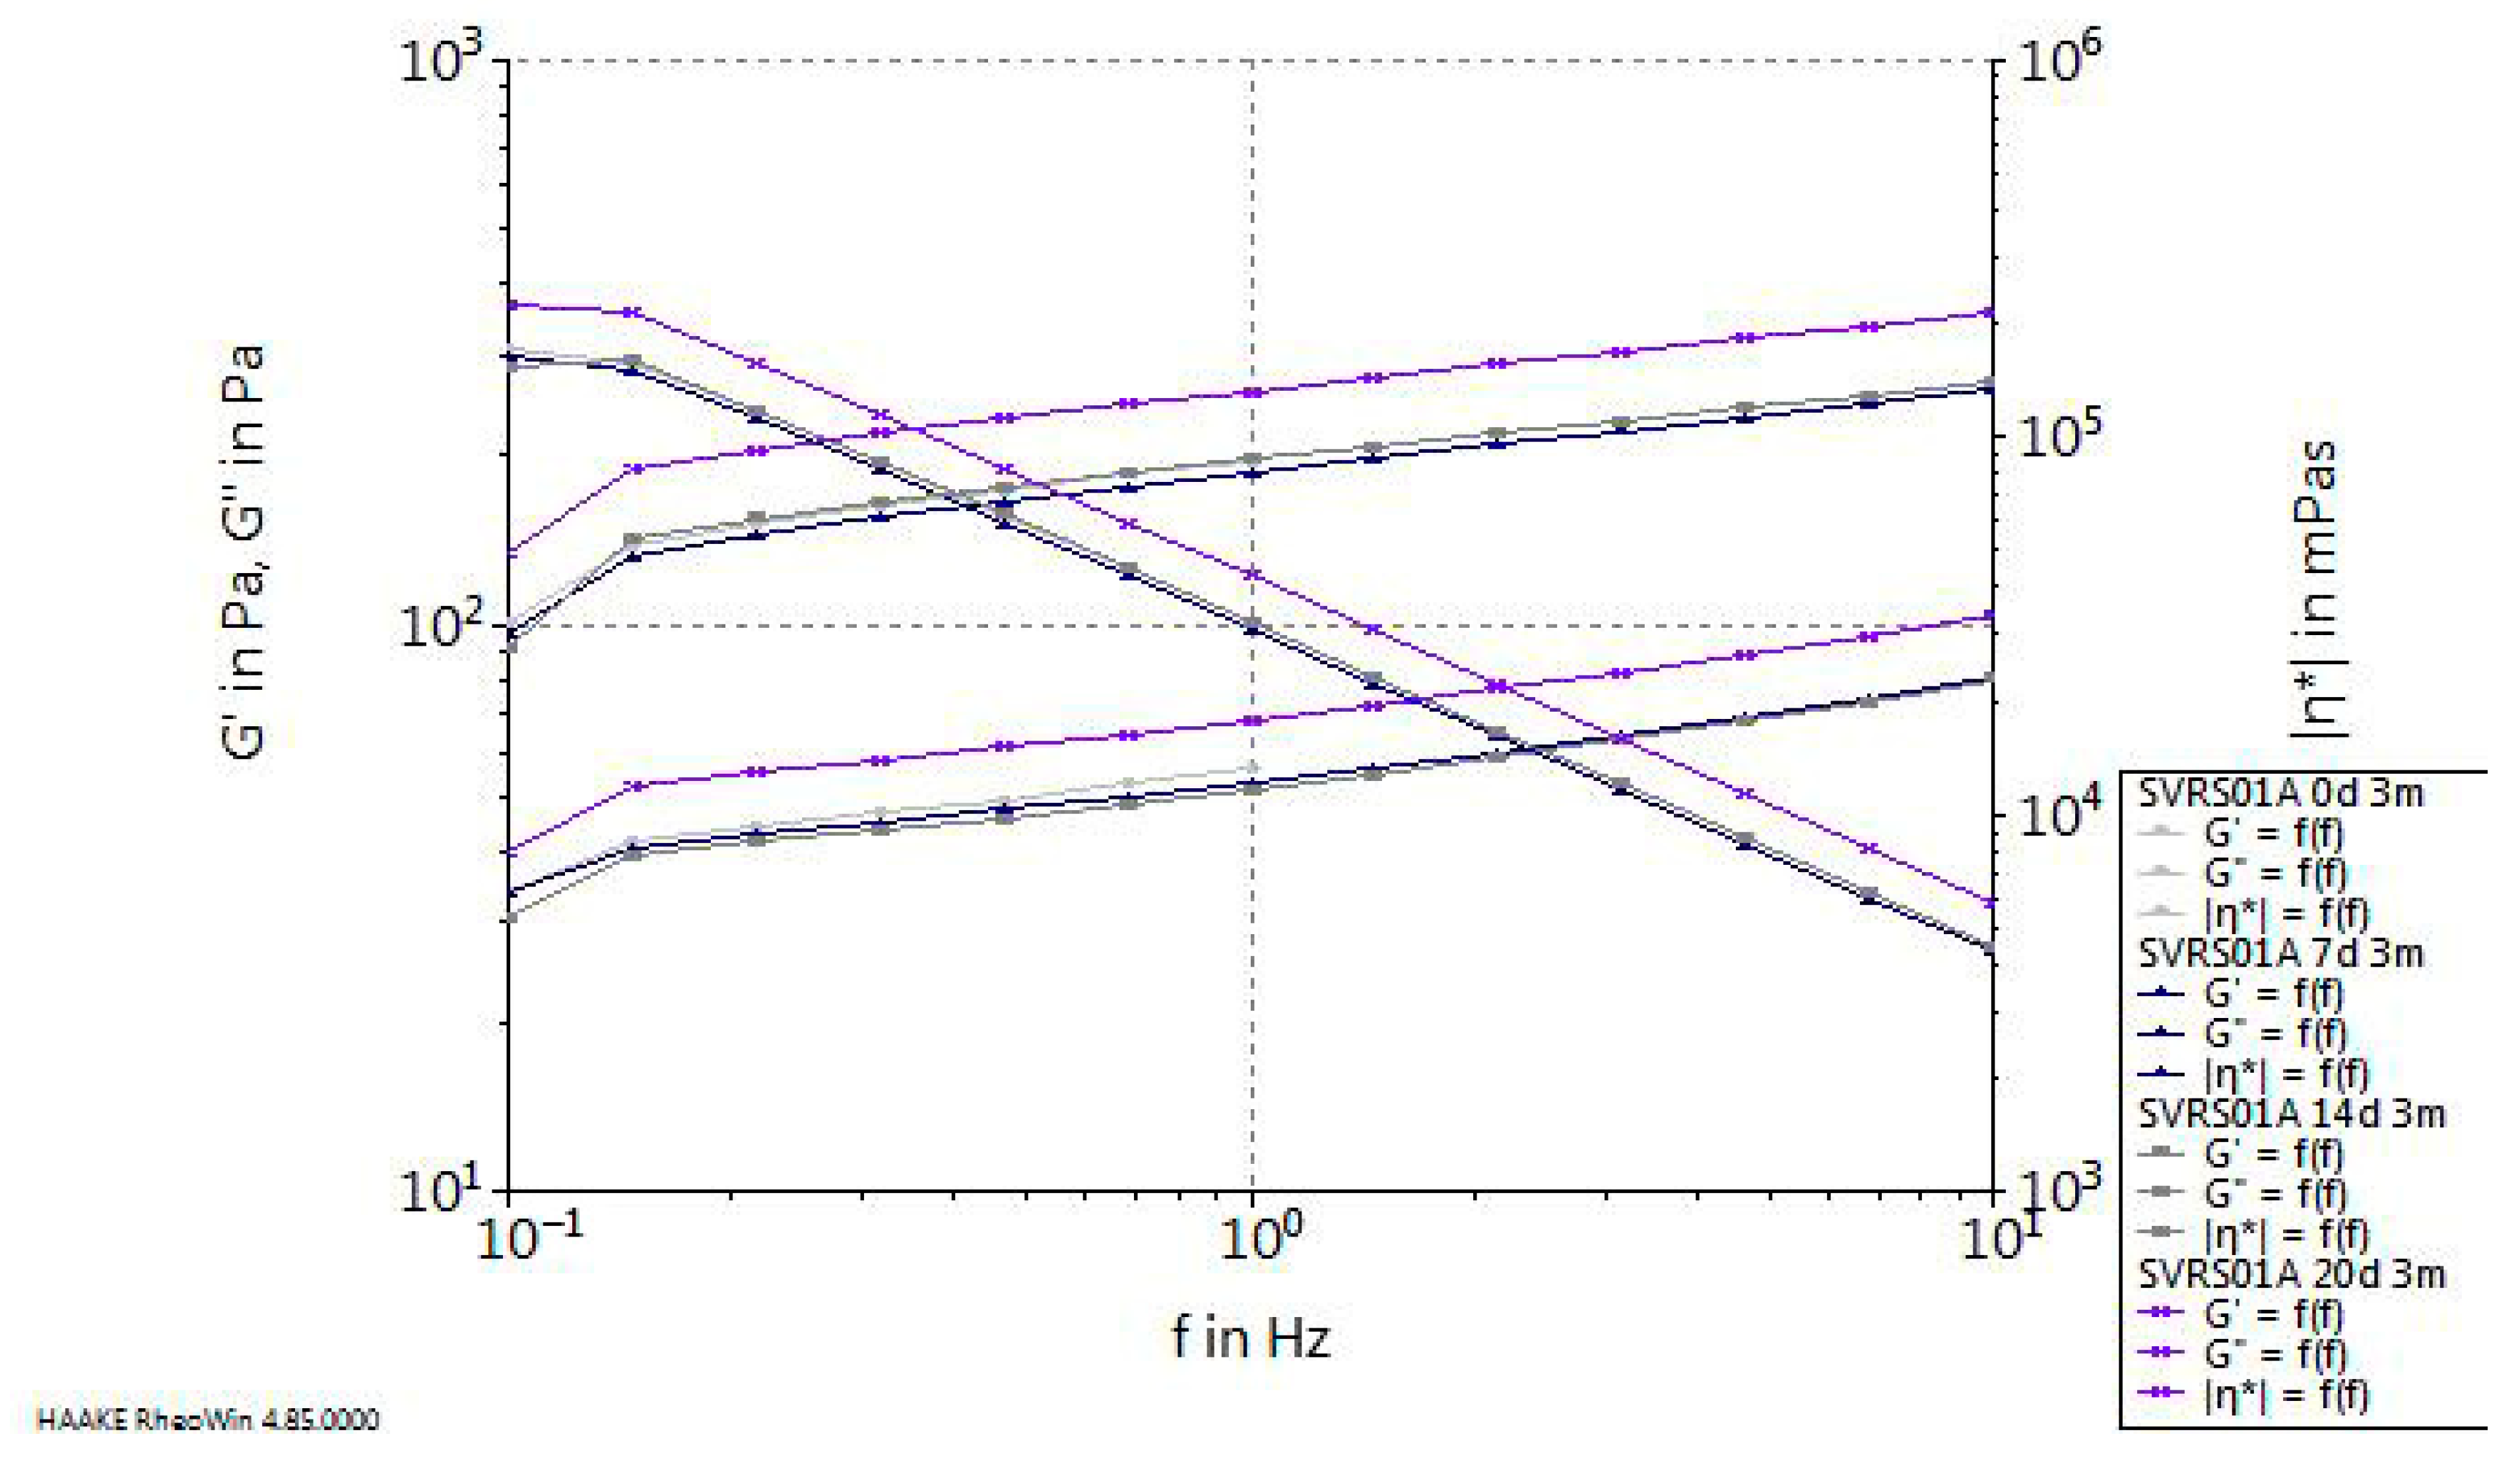
The oscillatory data (G′, G″, and |η*| as a function of frequency) provide insight into the linear viscoelastic behavior of the sample (Figure 14). At day 0, the viscous modulus G″ slightly exceeds the elastic modulus G′, indicating a predominantly viscous behavior. With increasing maturation time, G′ rises more significantly, pointing to a strengthening of the internal network and a gradual transition toward a more elastic character. Meanwhile, the slight decrease in complex viscosity |η*| confirms partial structural relaxation and reduced cohesion of the continuous phase.

3.6.3. Rheological Properties of the Sample SVRS03AA

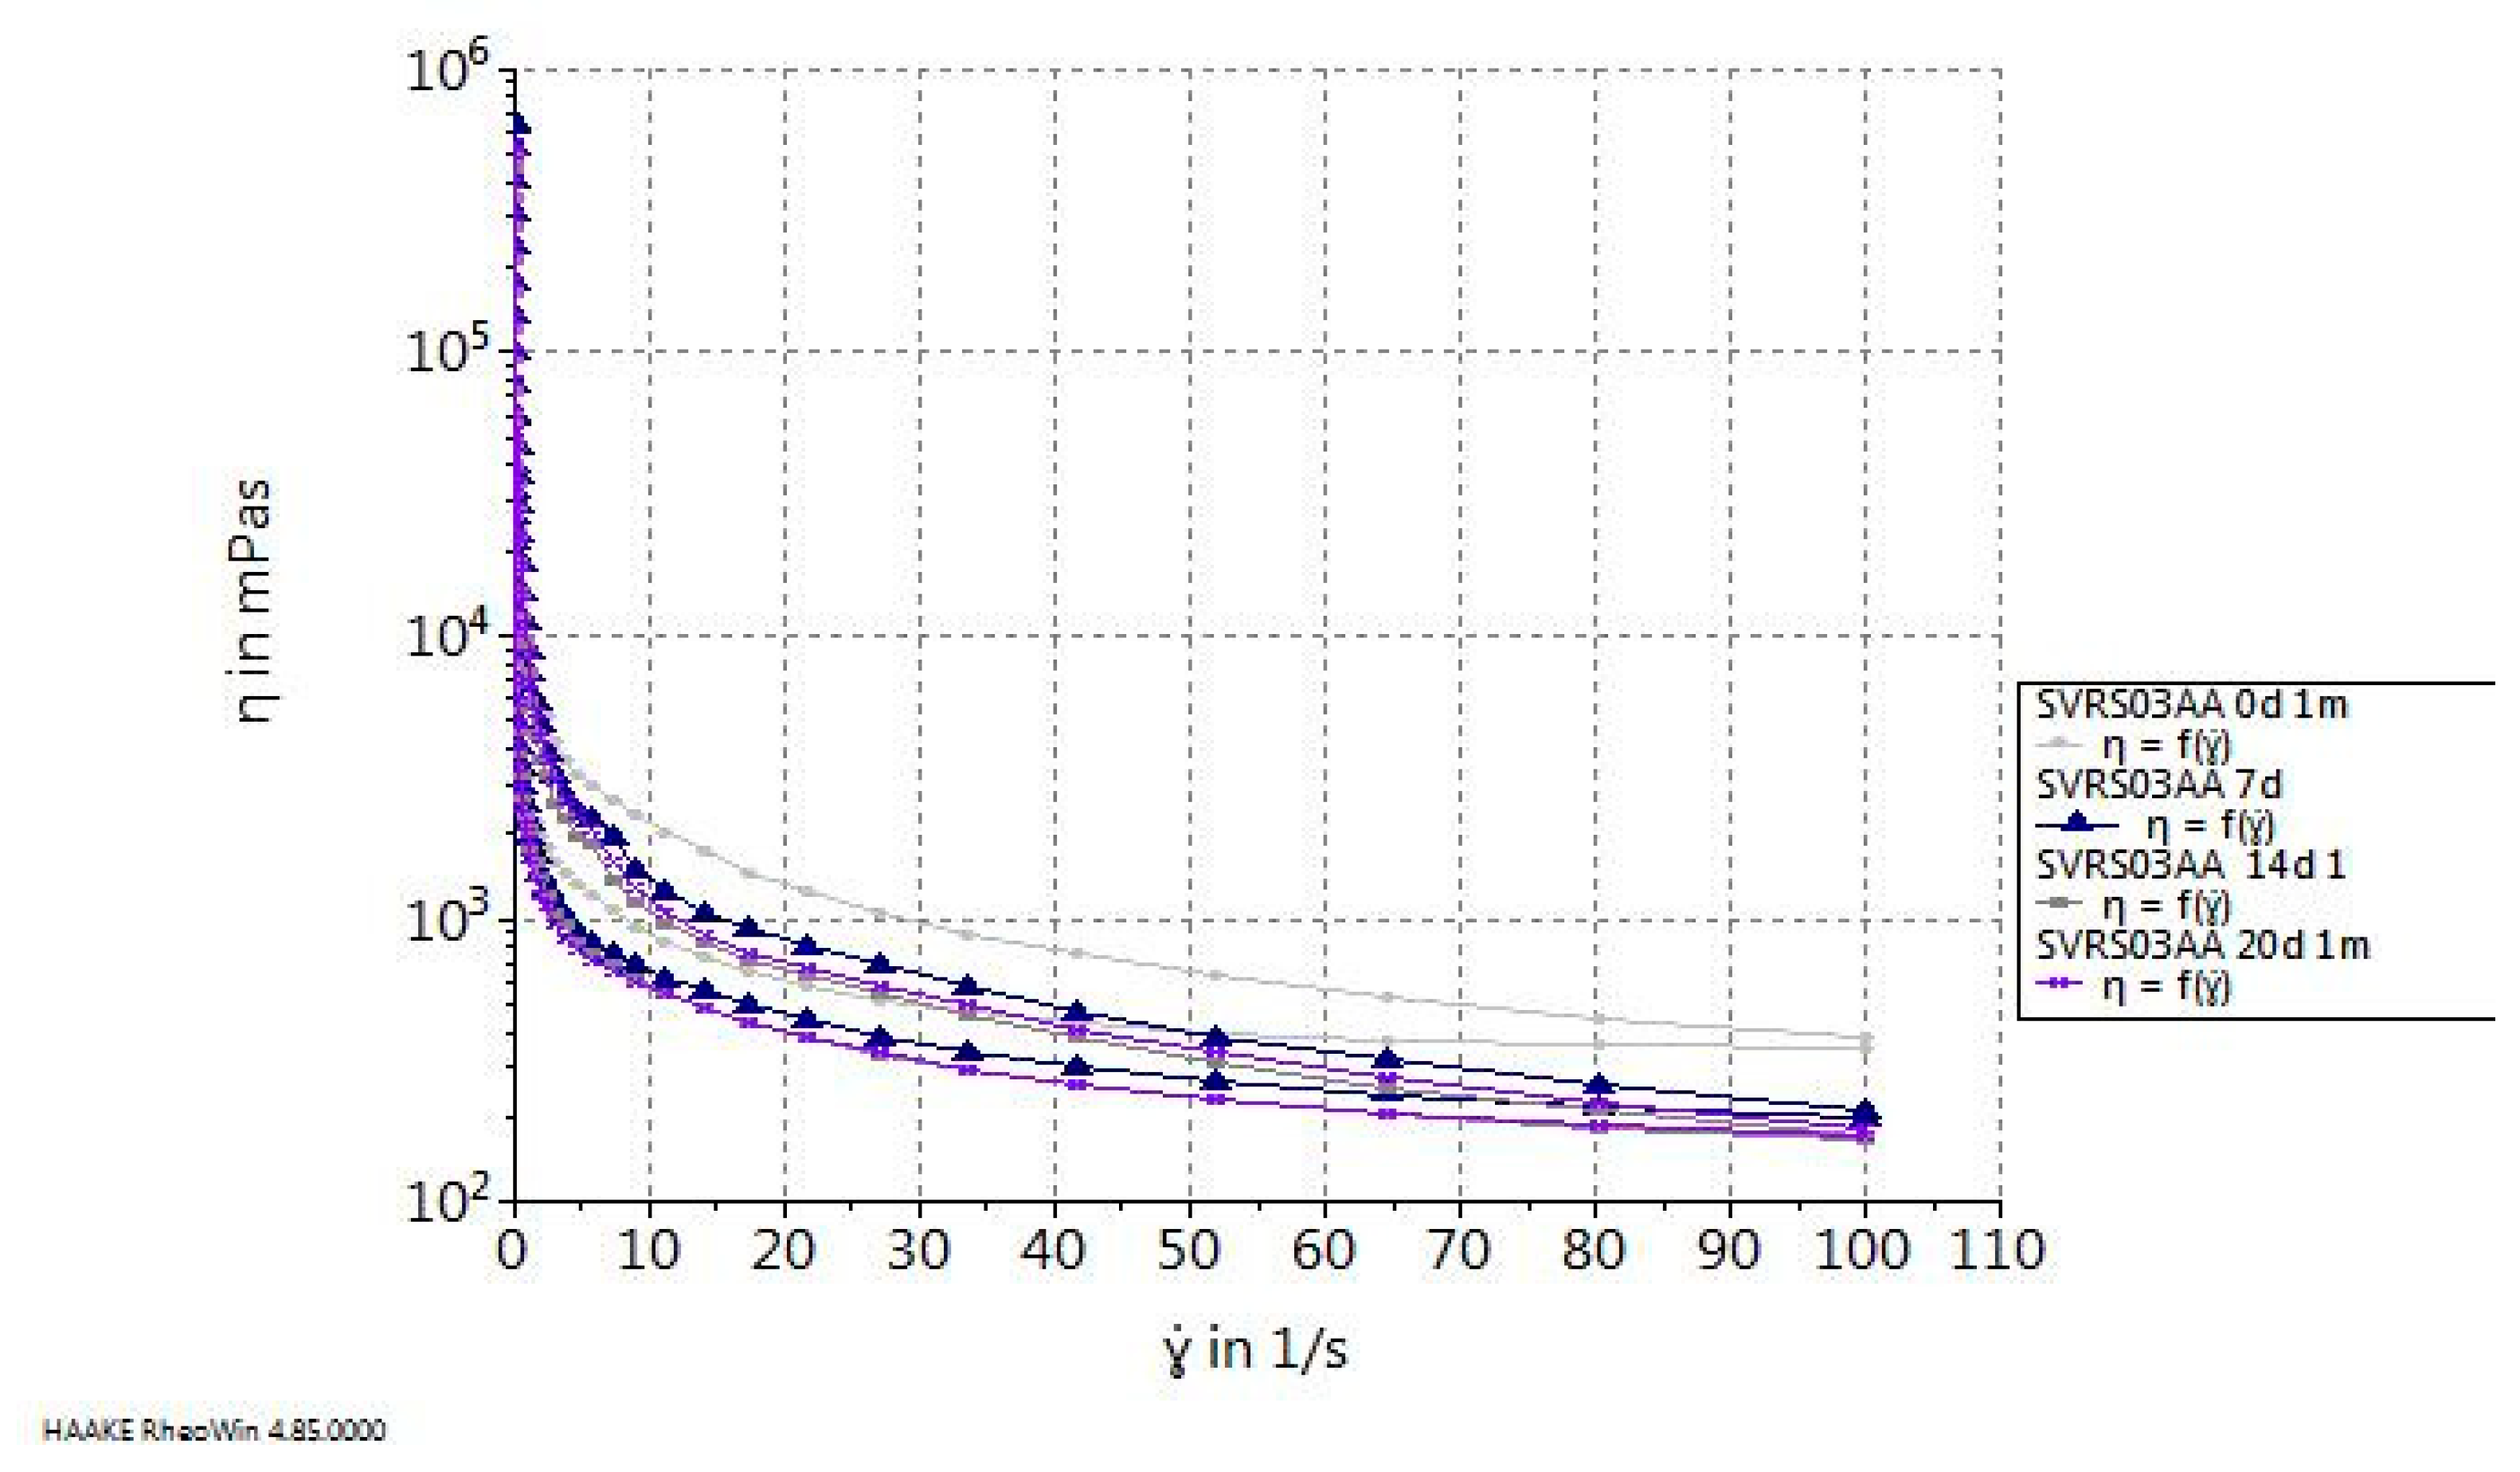
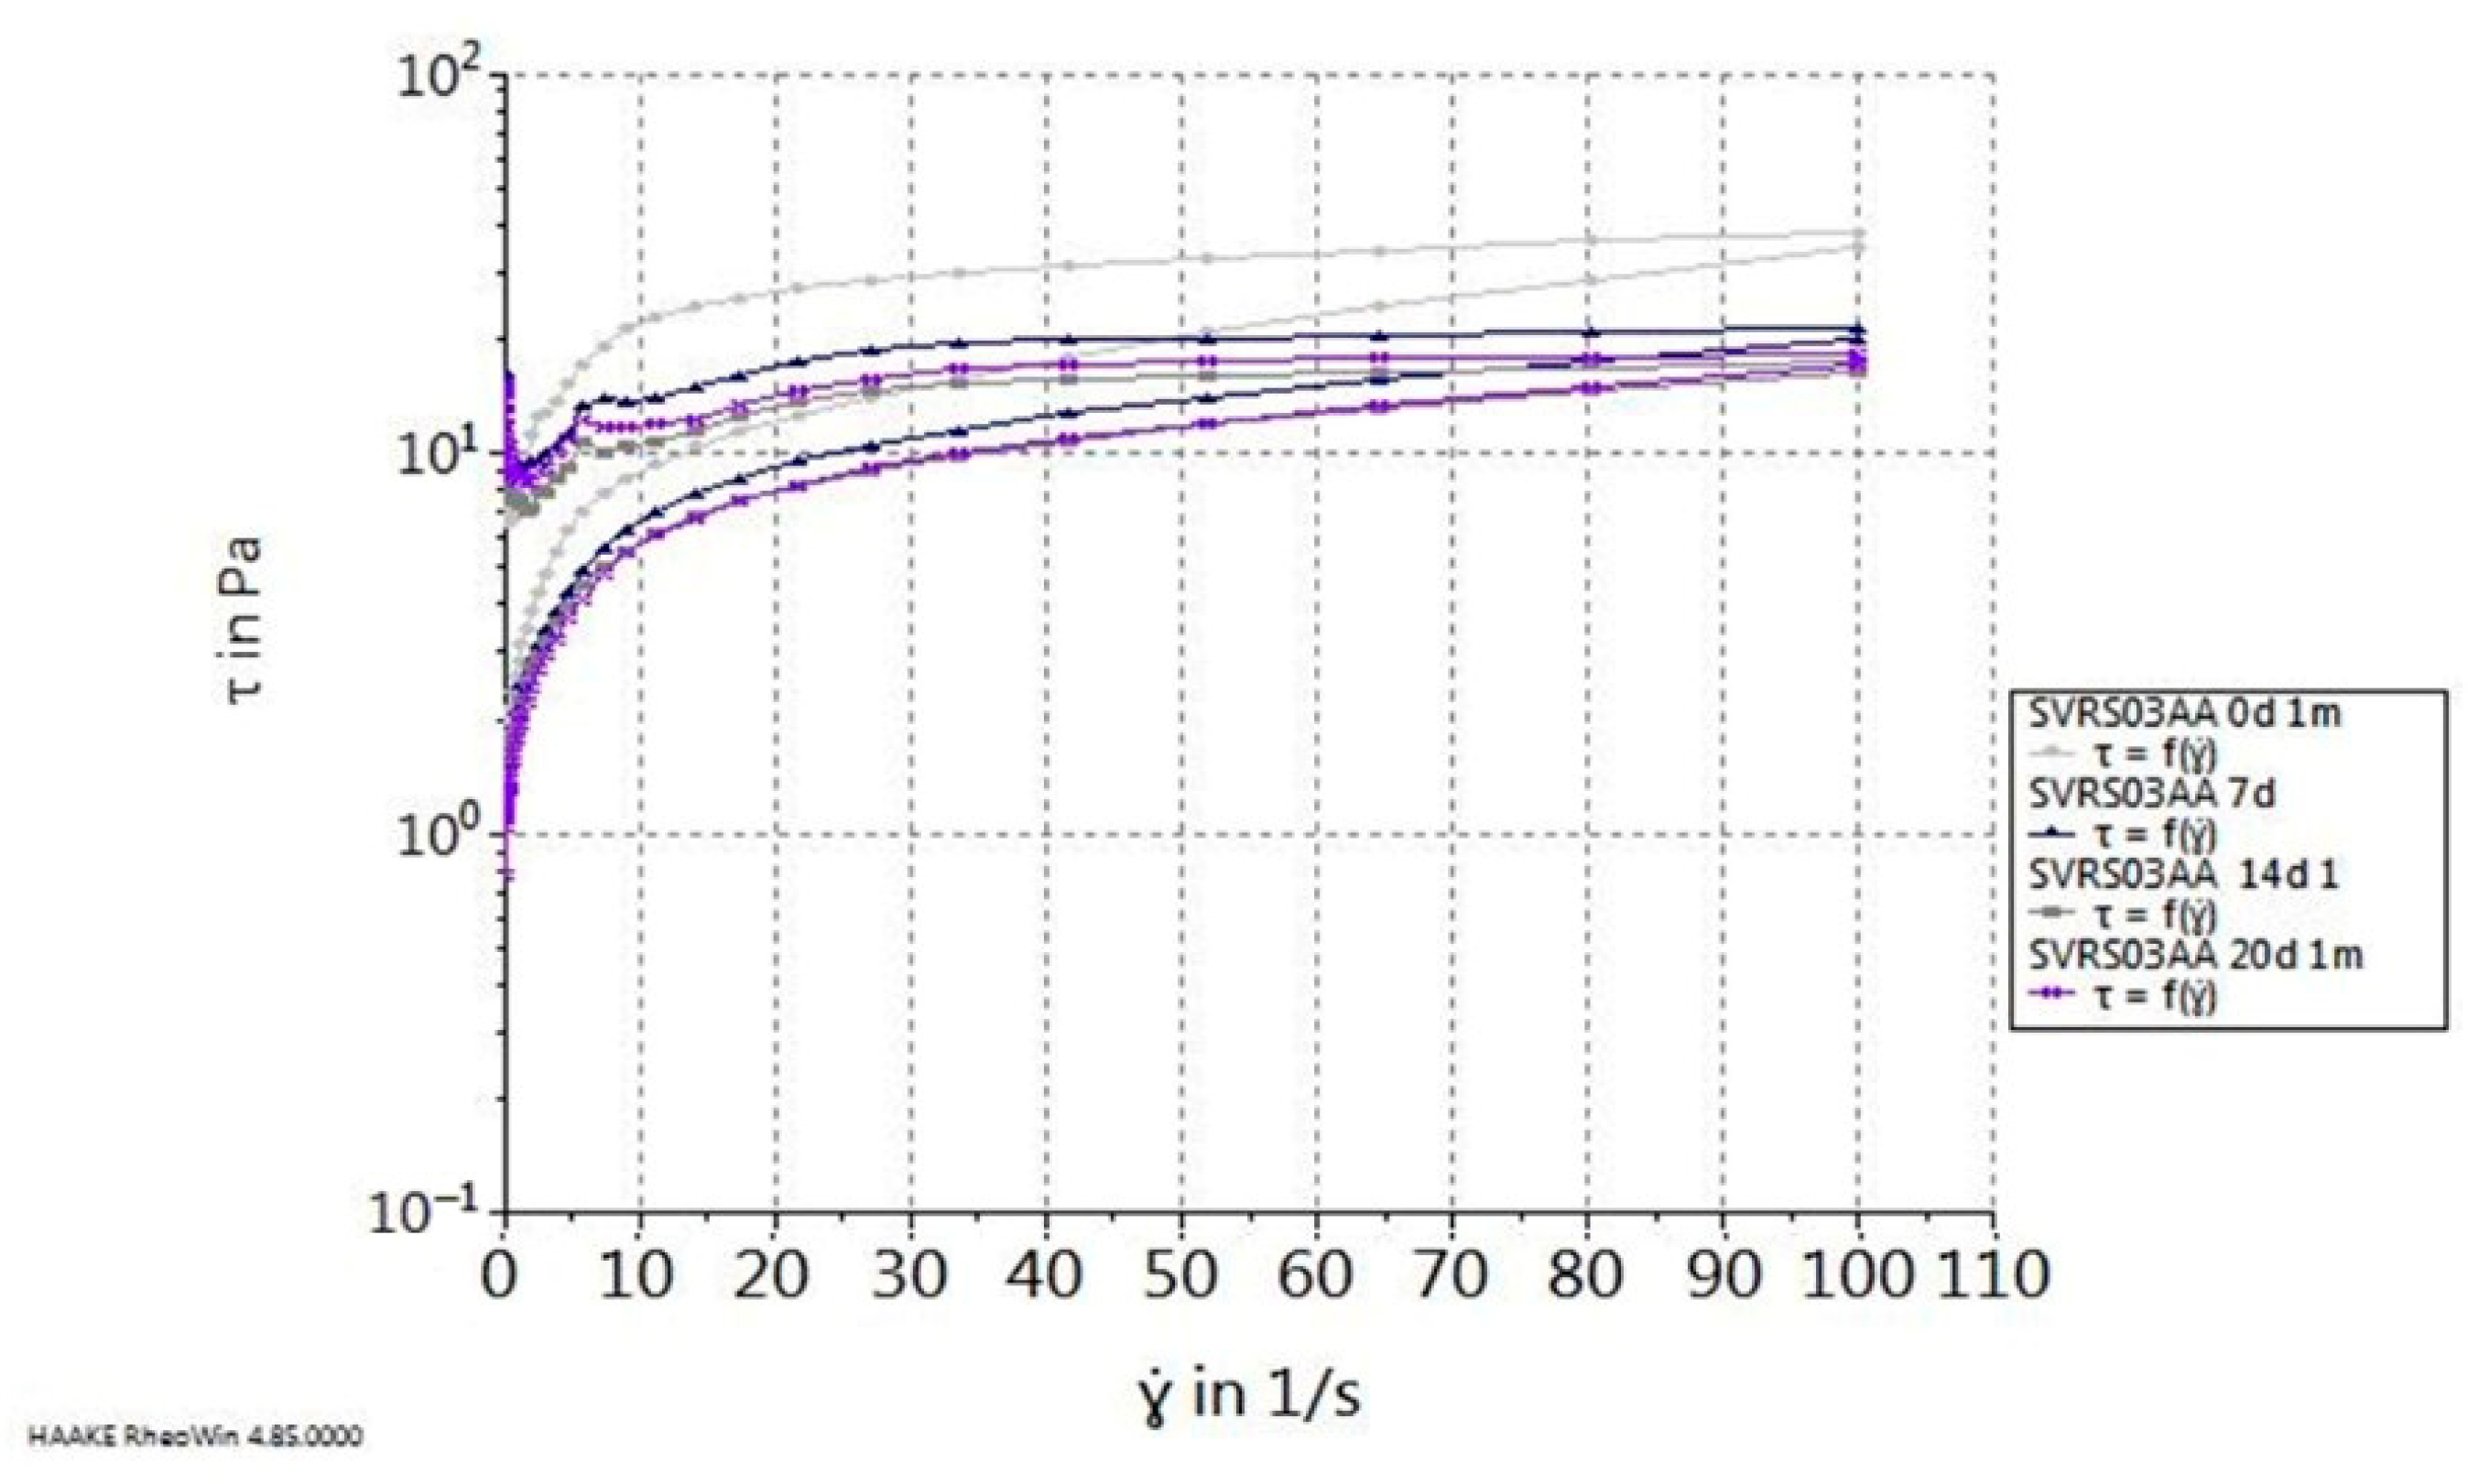
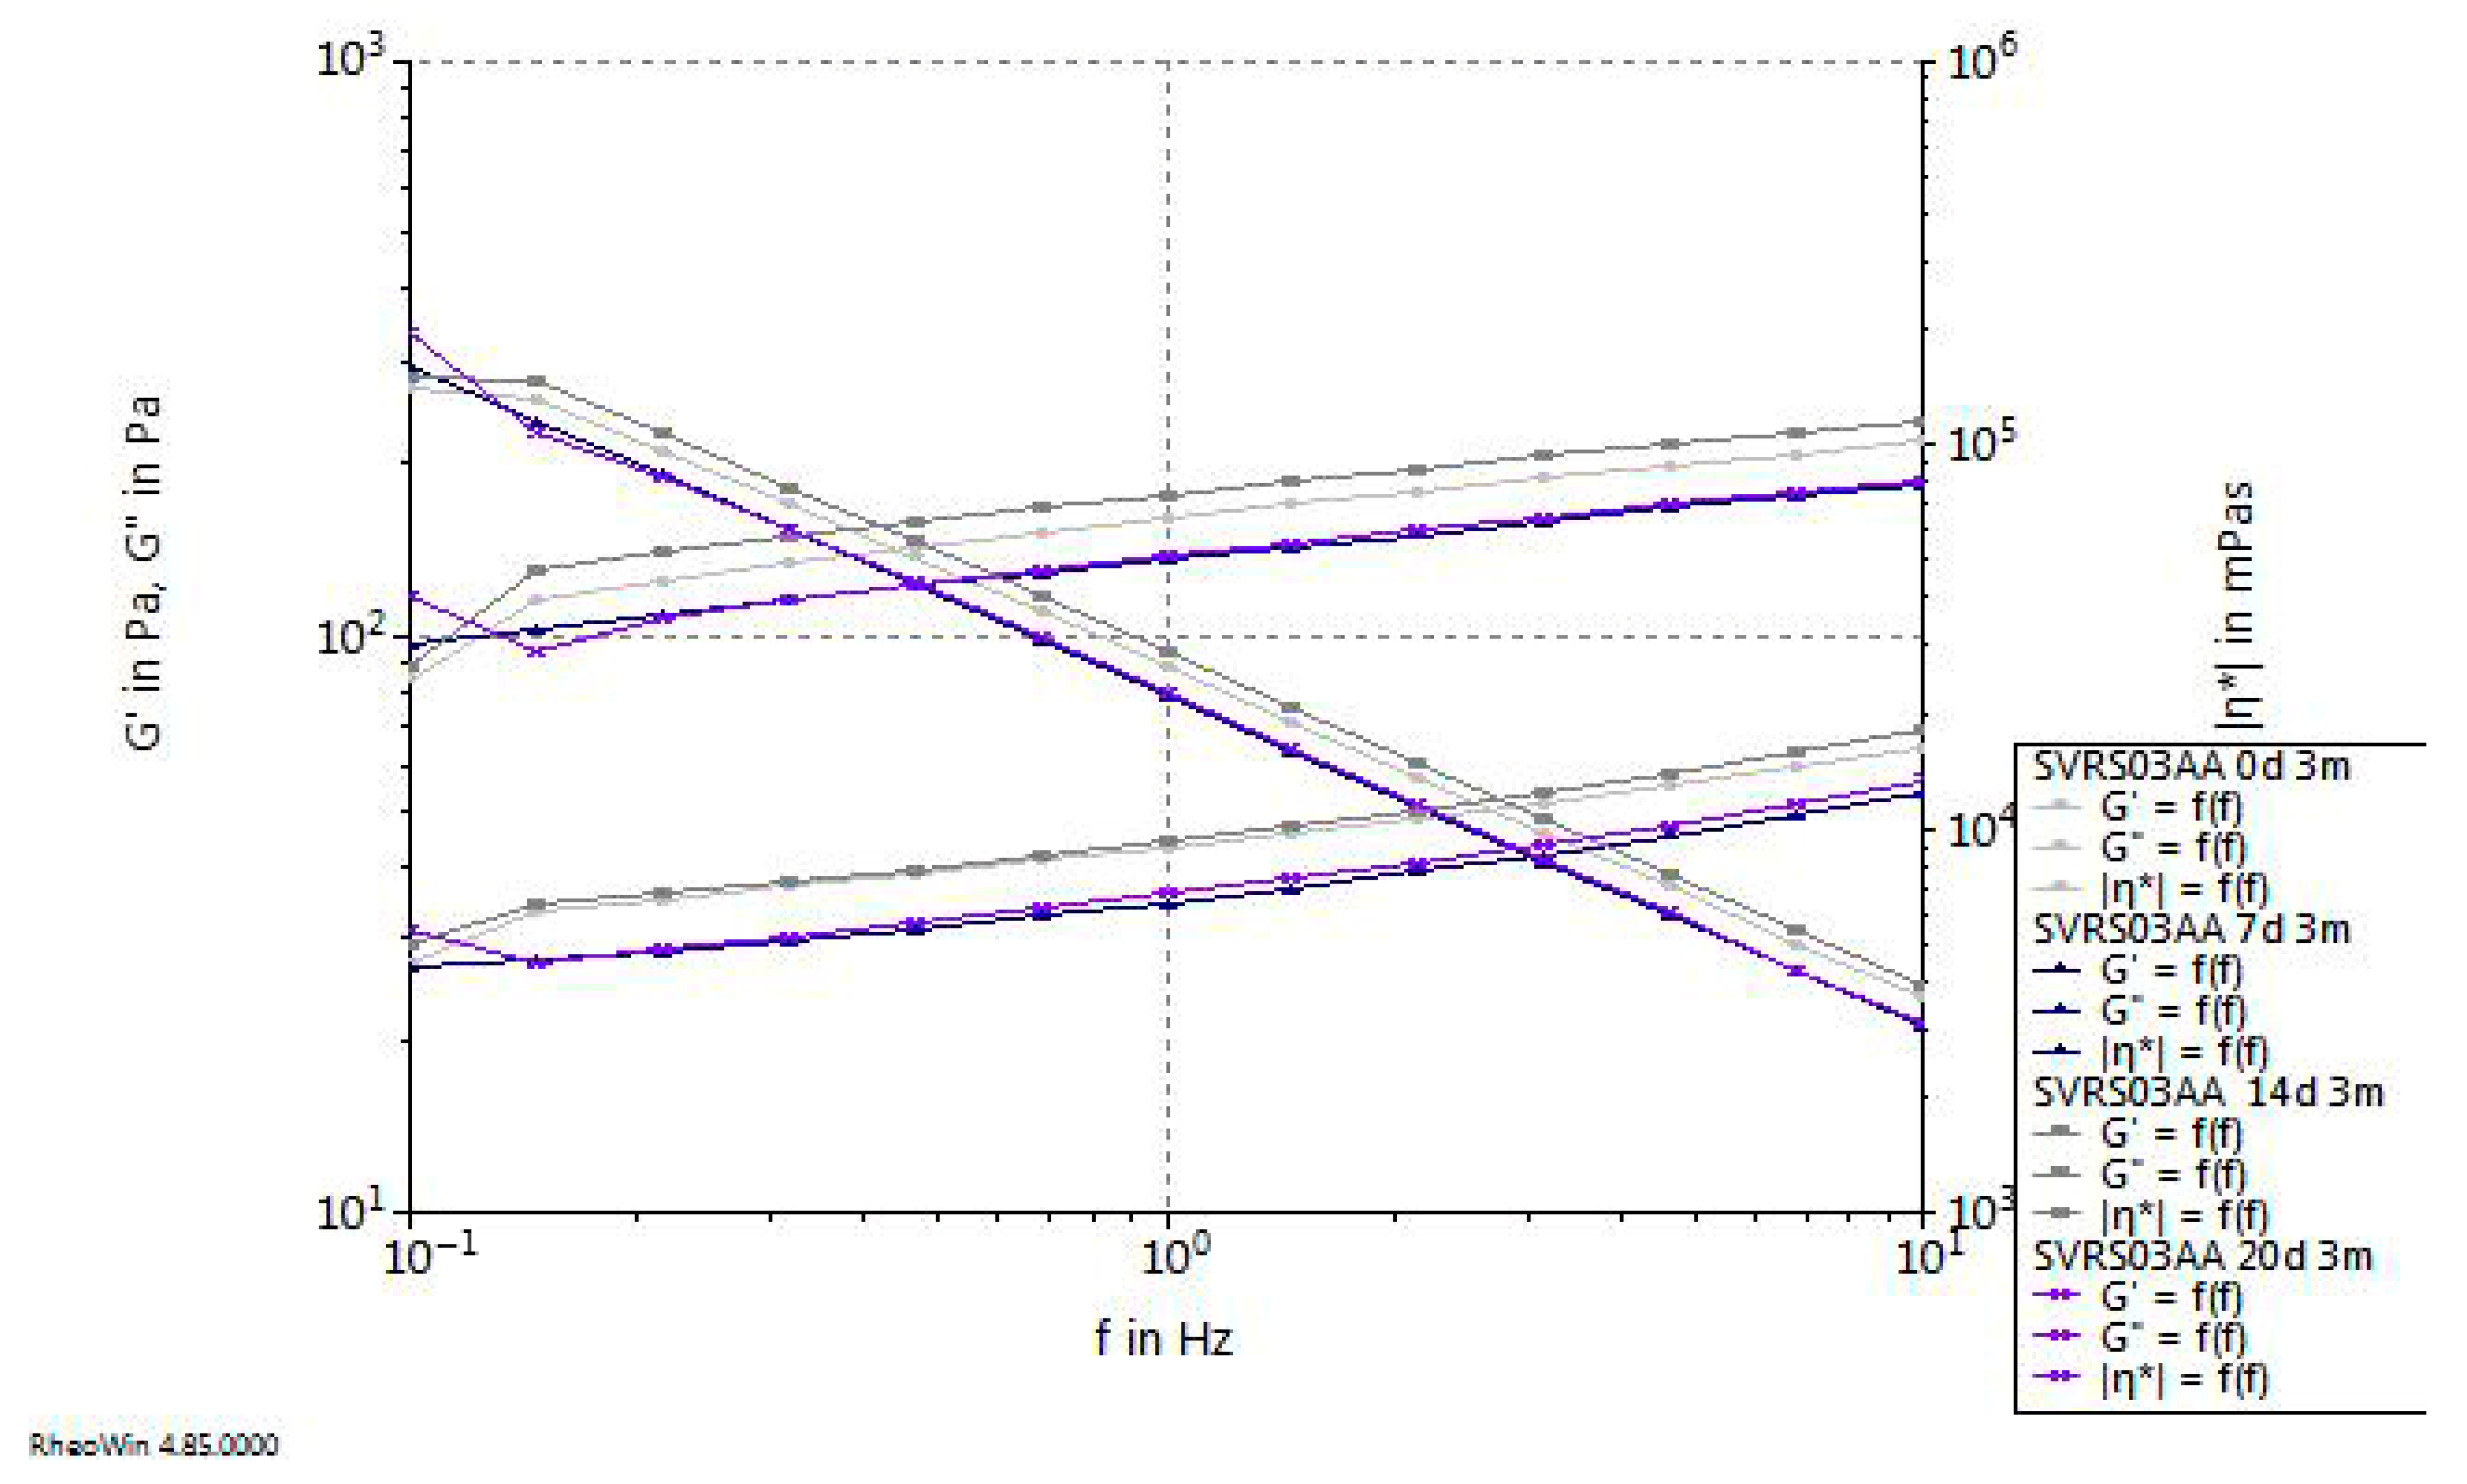
The rheological characterization of sample SVRS03AA was carried out through steady shear, flow, and oscillatory tests over a 20-day storage period. The results are shown in Figure 15, Figure 16, Figure 17 and Figure 18.
Figure 15 shows the variation in apparent viscosity (η) as a function of shear rate ( γ ˙ ). The results demonstrate a typical shear-thinning (pseudoplastic) behavior, where viscosity decreases with increasing shear rate for all samples. Over storage time, a gradual decrease in viscosity was observed, suggesting a structural weakening of the system, possibly due to progressive destabilization or rearrangement of macromolecular components.
Figure 16 presents the corresponding flow curves (shear stress τ vs. shear rate γ ˙ ). All samples display non-Newtonian behavior, with curves deviating from linearity. The samples measured after 14 and 20 days exhibit lower stress values at comparable shear rates, confirming the decline in internal structural resistance during storage.
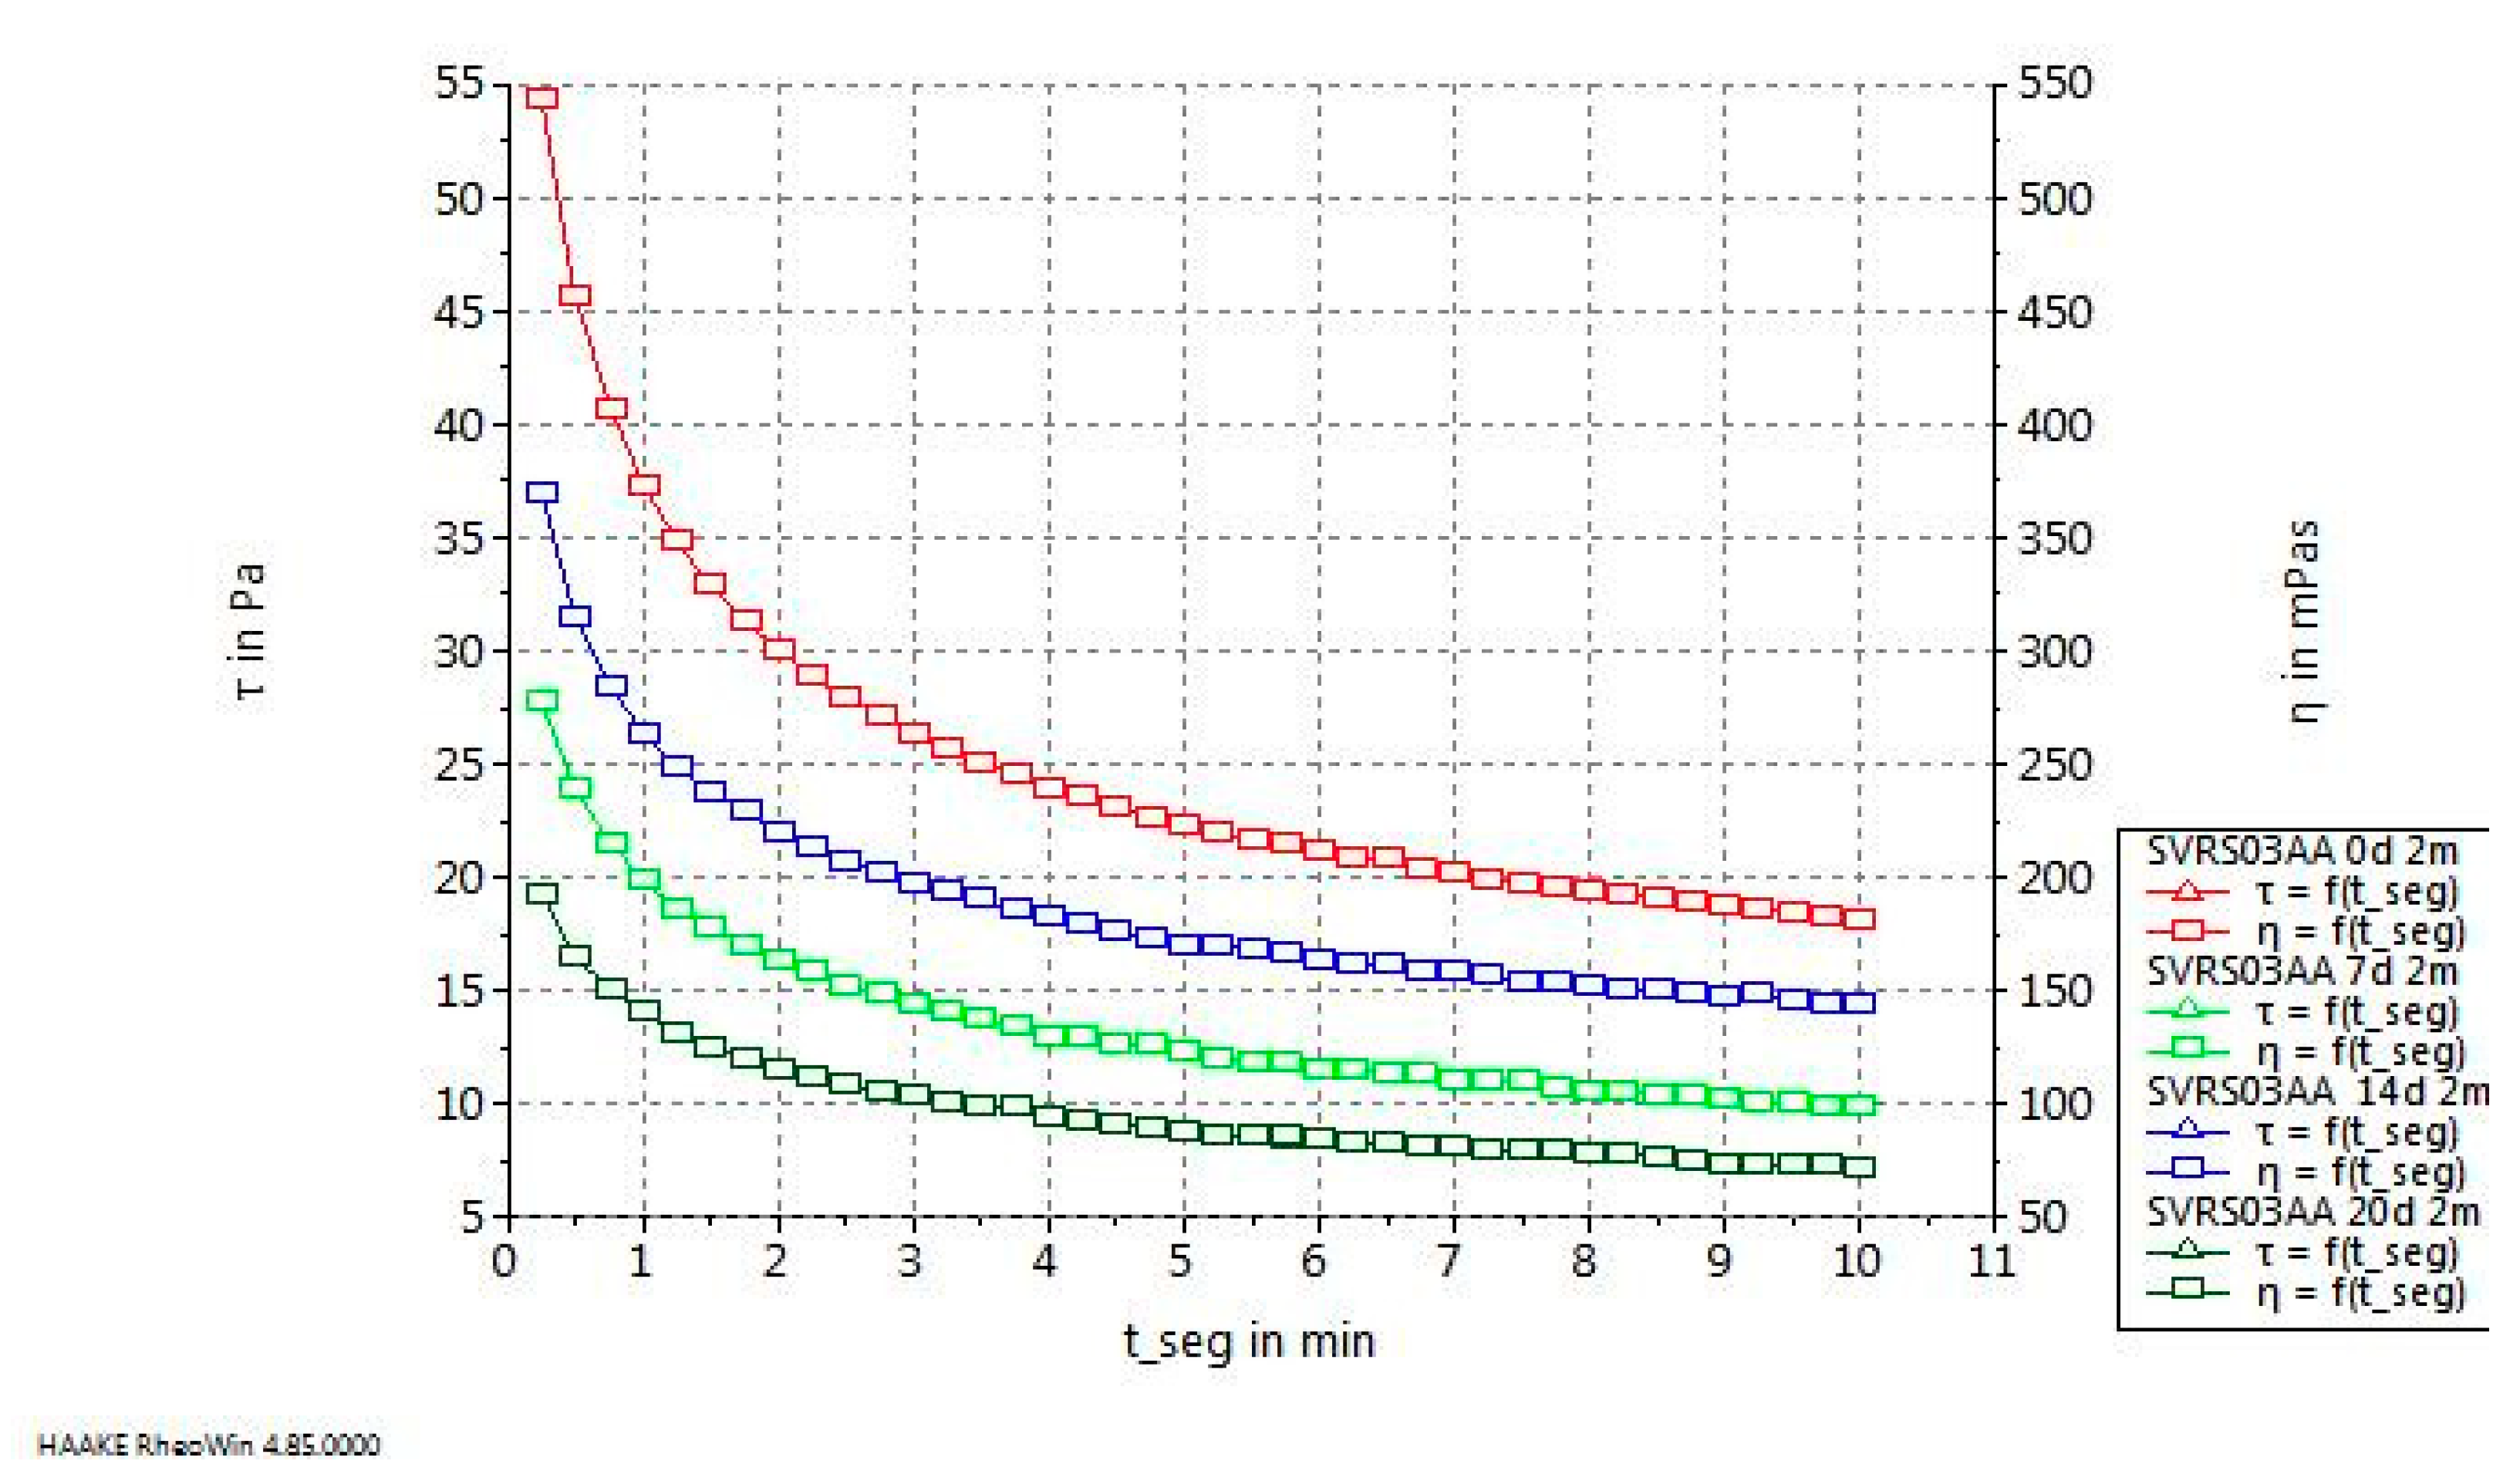
Figure 17 depicts the time-dependent measurements of shear stress and viscosity (τ, η) as a function of time at constant shear rate. The decreasing trend in both parameters indicates thixotropic behavior, characterized by a reversible structural breakdown under shear. As the storage time increased, the system’s thixotropy diminished, suggesting reduced structural recovery capacity.
Figure 18 illustrates the frequency sweep results, showing the variation in storage modulus (G′), loss modulus (G″), and complex viscosity (|η*|) as a function of oscillation frequency. Initially, G″ > G′, indicating a predominantly viscous behavior; however, after 20 days, both moduli slightly increase, reflecting partial structuring of the system. Nevertheless, |η*| decreases with time, consistent with the results from steady-state measurements.
In summary, the rheological evolution of SVRS03AA over 20 days reveals a general decrease in viscosity and shear stress, along with diminished thixotropy and minor modifications in viscoelastic moduli. These changes suggest a progressive loss of network integrity and internal cohesiveness during storage.

4. Discussion

Regarding the color development of stirred yogurt fortified with β-glucans, a substantial change was observed, particularly in brightness (L*). This pronounced alteration during the 20-day storage period can be attributed to the continued residual metabolic activity of lactic acid bacteria, which leads to gradual acidification, bacterial cell lysis, and the release of oxidative enzymes, such as peroxidases. These biochemical processes exert multiple effects on the product. First, slow Maillard reactions between milk proteins and residual sugars may result in the formation of melanoidins [50]. Second, the oxidation and subsequent polymerization of casein molecules can occur, contributing to product darkening [51]. Third, lipid oxidation may take place, further modifying the light-reflective properties of the yogurt matrix [52]. Consequently, protein oxidation and pigment polymerization lead to a marked reduction in product brightness, thereby adversely affecting its visual appearance.
The rheological analysis of the three samples—control sample (M), SVRS01A, and SVRS03AA—revealed clear differences in viscosity, time-dependent behavior, and viscoelastic characteristics, reflecting the structural modifications induced by compositional and processing variations. In the steady-state flow curves (designated as M–1m, SVRS01A–1m, SVRS03AA–1m), all samples exhibited non-Newtonian, shear-thinning behavior, characterized by a decrease in apparent viscosity (η) with increasing shear rate. The control sample (M) demonstrated the highest viscosity values, suggesting a dense, well-organized internal structure. The SVRS01A sample showed intermediate viscosity, while SVRS03AA exhibited the lowest η values, indicating that the structural network was progressively weakened with formulation changes. Similar observations were reported by Hassan et al. (2003), who demonstrated that compositional modifications in yogurt formulations significantly influence gel strength and flow resistance [53].
The time-dependent (thixotropy) tests (designated as M–2m, SVRS01A–2m, SVRS03AA–2m) revealed that all systems presented a gradual decrease in shear stress (τ) and viscosity over time. The control sample maintained the highest τ and η throughout the test, confirming superior structural stability and resistance to shear. In contrast, SVRS03AA showed the most pronounced structural breakdown and fastest relaxation, while SVRS01A behaved as an intermediate system with moderate time-dependent degradation. These findings align with the work of Ragab et al. (2023), who demonstrated that the thixotropic decay in yogurt is closely linked to the breakdown and partial recovery of casein micelle junction zones under mechanical deformation [54].
The oscillatory frequency sweep results (designated as M–3m, SVRS01A–3m, SVRS03AA–3m) confirmed that all samples behaved as weak gels (G′ > G″). The control sample exhibited the highest storage (G′) and loss (G″) moduli, demonstrating the strongest viscoelastic structure. SVRS01A displayed slightly reduced moduli, indicating partial weakening of the elastic network, whereas SVRS03AA had significantly lower G′ and G″ values, accompanied by a decreased complex viscosity (|η*|), reflecting a predominantly fluid-like behavior. Comparable viscoelastic weakening associated with network loosening during storage has been reported by Terpiłowski (2023) [55].
Overall, the results indicate a progressive reduction in rheological strength from M → SVRS01A → SVRS03AA. The modifications introduced in SVRS01A slightly affected the system’s structural integrity, while the changes in SVRS03AA led to a substantial loss of viscoelasticity and network cohesion. Thus, the control sample remains the most stable and elastic, whereas SVRS03AA represents the least structured formulation.
The results obtained in this study are consistent with previous findings reported in the scientific literature regarding the rheological behavior of yogurt during storage. The pseudoplastic behavior and the reduction in viscosity with increasing shear rate observed here have also been reported by Altay et al. (2013), who attributed these phenomena to the progressive breakdown of the protein network under mechanical stress [56]. Similarly, the thixotropic response and the gradual decrease in storage modulus (G′) during storage were confirmed by Zhang et al. (2016), indicating a structural relaxation of the protein gel matrix [57]. High viscosity at low shear rates and dominant elastic behavior (G′ > G″) have also been observed in Lucey’s (2001) study, who characterized yogurt as a weak gel with a highly structured network [58]. Additionally, Izadi et al. (2015) demonstrated that protein interactions and serum phase composition strongly determine viscoelastic stability during storage, supporting the trends observed in this study [59].
In low-fat yogurt, the reduction in the lipid phase enhances protein–protein interactions, favoring aggregation of casein micelles during gel formation. β-Glucans obtained by autolysis-assisted extraction (SVRS01A) promoted more effective protein–polysaccharide interactions, leading to a more uniform aggregation pattern and improved structural stability, whereas acid–alkaline (SVRS03AA)—extracted β-glucans resulted in weaker interactions and reduced network cohesion. These findings are consistent with previous studies demonstrating that the formation and functionality of protein aggregates significantly influence yoghurt texture and rheological stability, with controlled aggregation mechanisms playing a key role in structuring low-fat dairy systems [60,61].

5. Conclusions

This study demonstrated that β-glucans extracted from wine lees, particularly via autolysis combined with ultrasound, can be successfully incorporated into stirred yogurt to enhance its rheological properties. The yogurt samples enriched with these biopolymers showed improved structural integrity, higher viscoelastic moduli, and reduced thixotropic breakdown over storage compared to the control and chemically treated variants. The shear-thinning behavior and weak gel characteristics were preserved, while the structural stability during prolonged storage was enhanced, especially in samples containing autolysis-derived β-glucans. These findings highlight the potential of wine lees as a sustainable source of functional ingredients for clean-label dairy applications. Future research should focus on optimizing β-glucan concentration, evaluating sensory properties, and assessing the impact on probiotic viability.

Author Contributions

Conceptualization, A.C. (Aurica Chirsanova) and A.B.; methodology, A.C. (Aurica Chirsanova), A.C. (Ana Chioru) and A.D.; software, A.B. and I.A.; validation, A.C. (Aurica Chirsanova), A.C. (Ana Chioru) and A.D.; formal analysis, A.C. (Aurica Chirsanova), A.B., A.C. (Ana Chioru) and A.D.; investigation, A.C. (Aurica Chirsanova), A.B., A.C. (Ana Chioru), A.D. and I.A.; resources, A.C. (Aurica Chirsanova); data curation, A.C. (Ana Chioru), A.B. and I.A.; writing—original draft preparation, A.C. (Aurica Chirsanova), A.B., A.C. (Ana Chioru), A.D. and I.A.; writing—review and editing, A.C. (Aurica Chirsanova), A.B., A.C. (Ana Chioru), A.D. and I.A.; visualization, A.C. (Aurica Chirsanova) and A.B.; supervision, A.C. and A.C. (Ana Chioru); project administration, A.C. (Aurica Chirsanova); funding acquisition, A.C. (Aurica Chirsanova). All authors have read and agreed to the published version of the manuscript.

Funding

The research was carried out in the laboratories and specialized facilities of “Ștefan cel Mare” University of Suceava (Romania) and the Technical University of Moldova, within the Faculty of Food Technology, as part of the State Project 25.80013.5107.03RE—“Sustainable Valorization of Residual Wine Yeasts: Exploring Multifunctional Bio-Ingredients for Innovative Applications,” implemented at the Technical University of Moldova.

Institutional Review Board Statement

Not applicable.

Informed Consent Statement

Not applicable.

Data Availability Statement

The original contributions presented in the study are included in the article, further inquiries can be directed to the corresponding author.

Acknowledgments

This work was supported by a grant of the Ministry of Research, Innovation and Digitization, CNCS-UEFISCDI, project number PN-IV-P8-8.3-ROMD-2023-0121, within PNCDI.

Conflicts of Interest

The authors declare no conflicts of interest.

References

  1. Grunert, K.G.; Jensen, B.B.; Sonne, A.-M.; Brunsø, K.; Byrne, D.V.; Clausen, C.; Friis, A.; Holm, L.; Hyldig, G.; Kristensen, N.H.; et al. User-Oriented Innovation in the Food Sector: Relevant Streams of Research and an Agenda for Future Work. Trends Food Sci. Technol. 2008, 19, 590–602. [Google Scholar] [CrossRef]
  2. Farhan, J.A.; Iwaniuk, P.; Kaczyński, P.; Łozowicka, B.; Mroczko, B.; Orywal, K.; Perkowski, M.; Socha, K.; Zoń, W. Social Perception of Healthy Food in the Light of Interdisciplinary Scientific Certainty; Temida 2 with the cooperation of the Law and Partnership Foundation (Fundacja Prawo i Partnerstwo); Temida 2: Białystok, Poland, 2024. [Google Scholar]
  3. Günal-Köroğlu, D.; Karabulut, G.; Mohammadian, F.; Can Karaca, A.; Capanoglu, E.; Esatbeyoglu, T. Production of Yeast Cell Wall Polysaccharides-β-Glucan and Chitin by Using Food Waste Substrates: Biosynthesis, Production, Extraction, and Purification Methods. Compr. Rev. Food Sci. Food Saf. 2025, 24, e70161. [Google Scholar] [CrossRef]
  4. Adamczyk, D.; Jaworska, D.; Affeltowicz, D.; Maison, D. Plant-Based Dairy Alternatives: Consumers’ Perceptions, Motivations, and Barriers—Results from a Qualitative Study in Poland, Germany, and France. Nutrients 2022, 14, 2171. [Google Scholar] [CrossRef]
  5. Chen, J.; Seviour, R. Medicinal Importance of Fungal β-(1 → 3), (1 → 6)-Glucans. Mycol. Res. 2007, 111, 635–652. [Google Scholar] [CrossRef]
  6. Chioru, A.; Trohina, A.; Boistean, A.; Grisel, M.; Gore, E.; Chirsanova, A. Physicochemical and Nutritional Characteristics of Winemaking Lees of Wines from Local Varieties from Republic of Moldova. In Proceedings of the International Conference on Global Food Security, Louven, Belgium, 9–12 April 2024. [Google Scholar]
  7. Zeković, D.B.; Kwiatkowski, S.; Vrvić, M.M.; Jakovljević, D.; Moran, C.A. Natural and Modified (1 → 3)-β-D-Glucans in Health Promotion and Disease Alleviation. Crit. Rev. Biotechnol. 2005, 25, 205–230. [Google Scholar] [CrossRef]
  8. Boistean, A.; Chirsanova, A.; Chioru, A. Production of β-Glucan from Yeast Lees of Local Wines Produced Using Different Technologies. In Proceedings of the National Scientific Conference “Innovation: A Factor of Socio-Economic Development”, Cahul, Moldova, 9 December 2024; Print-Caro: Chișinău, Moldova, 2024; pp. 45–46. [Google Scholar]
  9. Călinoiu, L.-F.; Ştefănescu, B.E.; Pop, I.D.; Muntean, L.; Vodnar, D.C. Chitosan Coating Applications in Probiotic Microencapsulation. Coatings 2019, 9, 194. [Google Scholar] [CrossRef]
  10. Sousa, P.; Tavares-Valente, D.; Pereira, C.F.; Pinto-Ribeiro, I.; Azevedo-Silva, J.; Madureira, R.; Ramos, Ó.L.; Pintado, M.; Fernandes, J.; Amorim, M. Circular Economyeast: Saccharomyces Cerevisiae as a Sustainable Source of Glucans and Its Safety for Skincare Application. Int. J. Biol. Macromol. 2024, 265, 130933. [Google Scholar] [CrossRef] [PubMed]
  11. Chioru, A.; Chirsanova, A.; Dabija, A.; Avrămia, I.; Boiştean, A.; Chetrariu, A. Extraction Methods and Characterization of β-Glucans from Yeast Lees of Wines Produced Using Different Technologies. Foods 2024, 13, 3982. [Google Scholar] [CrossRef]
  12. Sarkar, N.; Mahajan, A.A.; Pathak, S.; Seth, P.; Chowdhury, A.; Ghose, I.; Das, S.; Chowdhury, R.; Bera, A.; Dey, A.; et al. Beta-Glucans in Biotechnology: A Holistic Review with a Special Focus on Yeast. Bioengineering 2025, 12, 365. [Google Scholar] [CrossRef] [PubMed]
  13. Varelas, V.; Liouni, M.; Calokerinos, A.C.; Nerantzis, E.T. An Evaluation Study of Different Methods for the Production of β-D-Glucan from Yeast Biomass. Drug Test. Anal. 2016, 8, 46–55. [Google Scholar] [CrossRef]
  14. Anchundia, M.; León-Revelo, G.; Santacruz, S.; Torres, F. Production of β-Glucans from Rhizopus oryzae M10A1 by Optimizing Culture Conditions Using Liquid Potato Starch Waste. Polymers 2025, 17, 1283. [Google Scholar] [CrossRef]
  15. Santipanichwong, R.; Suphantharika, M. Influence of Different β-Glucans on the Physical and Rheological Properties of Egg Yolk Stabilized Oil-in-Water Emulsions. Food Hydrocoll. 2009, 23, 1279–1287. [Google Scholar] [CrossRef]
  16. Lazaridou, A.; Biliaderis, C.G. Molecular Aspects of Cereal β-Glucan Functionality: Physical Properties, Technological Applications and Physiological Effects. J. Cereal Sci. 2007, 46, 101–118. [Google Scholar] [CrossRef]
  17. Anli, E.A.; Gursel, A.; Gursoy, A.; Mert, B. Assessment of the Quality Attributes of Oat β-Glucan Fortified Reduced-Fat Goat Milk Yogurt Supported by Microfluidization. Foods 2023, 12, 3457. [Google Scholar] [CrossRef]
  18. Staffolo, M.D.; Bertola, N.; Martino, M.; Bevilacqua, A. Influence of Dietary Fiber Addition on Sensory and Rheological Properties of Yogurt. Int. Dairy J. 2004, 14, 263–268. [Google Scholar] [CrossRef]
  19. Ng, S.B.X.; Nguyen, P.T.M.; Bhandari, B.; Prakash, S. Influence of Different Functional Ingredients on Physical Properties, Rheology, Tribology, and Oral Perceptions of No Fat Stirred Yoghurt. J. Texture Stud. 2018, 49, 274–285. [Google Scholar] [CrossRef]
  20. Akalın, A.S.; Karagözlü, C.; Ünal, G. Rheological Properties of Reduced-Fat and Low-Fat Ice Cream Containing Whey Protein Isolate and Inulin. Eur. Food Res. Technol. 2008, 227, 889–895. [Google Scholar] [CrossRef]
  21. Zhao, P.; Li, N.; Chen, L.; Guo, Y.; Huang, Y.; Tong, L.; Wang, L.; Fan, B.; Wang, F.; Liu, L. Effects of Oat β-Glucan on the Textural and Sensory Properties of Low-Fat Set Type Pea Protein Yogurt. Molecules 2023, 28, 3067. [Google Scholar] [CrossRef] [PubMed]
  22. Xu, Q.; Wang, H.; Ren, Y.; Sun, M.; Zhang, T.; Li, H.; Liu, X. Functionality and Application of Emulsion Gels in Fat Replacement Strategies for Dairy Products. Trends Food Sci. Technol. 2024, 152, 104673. [Google Scholar] [CrossRef]
  23. Akalın, A.; Kesenkaş, H.; Dinkci, N.; Unal, G.; Özer, E.; Kınık, O. Enrichment of Probiotic Ice Cream with Different Dietary Fibers: Structural Characteristics and Culture Viability. J. Dairy Sci. 2017, 101, 37–46. [Google Scholar] [CrossRef] [PubMed]
  24. Soukoulis, C.; Lebesi, D.; Tzia, C. Enrichment of Ice Cream with Dietary Fibre: Effects on Rheological Properties, Ice Crystallisation and Glass Transition Phenomena. Food Chem. 2009, 115, 665–671. [Google Scholar] [CrossRef]
  25. Brennan, C.S.; Tudorica, C.M. Evaluation of Potential Mechanisms by Which Dietary Fibre Additions Reduce the Predicted Glycaemic Index of Fresh Pastas. Int. J. Food Sci. Technol. 2008, 43, 2151–2162. [Google Scholar] [CrossRef]
  26. Raikos, V.; Grant, S.B.; Hayes, H.; Ranawana, V. Use of β-Glucan from Spent Brewer’s Yeast as a Thickener in Skimmed Yogurt: Physicochemical, Textural, and Structural Properties Related to Sensory Perception. J. Dairy Sci. 2018, 101, 5821–5831. [Google Scholar] [CrossRef]
  27. Elsanhoty, R.; Zaghlol, A.; Hassanein, A.H. The Manufacture of Low Fat Labneh Containing Barley β-Glucan 1-Chemical Composition, Microbiological Evaluation and Sensory Properties. Curr. Res. Dairy Sci. 2009, 1, 1–12. [Google Scholar] [CrossRef]
  28. Mykhalevych, A.; Polishchuk, G.; Nassar, K.; Osmak, T.; Buniowska-Olejnik, M. β-Glucan as a Techno-Functional Ingredient in Dairy and Milk-Based Products—A Review. Molecules 2022, 27, 6313. [Google Scholar] [CrossRef]
  29. Chioru, A.; Chiselita, N.; Suhodol, N.; Boiştean, A.; Paladi, D.; Capcanari, T.; Chirsanova, A. Physico-Chemical and Microbiological Profile of Wine Lees of Red Wines from Local Grapes Varieties. Food Nutr. Sci. 2023, 14, 1133–1148. [Google Scholar] [CrossRef]
  30. Pal, P.; Singh, A.K.; Srivastava, R.K.; Rathore, S.S.; Sahoo, U.K.; Subudhi, S.; Sarangi, P.K.; Prus, P. Circular Bioeconomy in Action: Transforming Food Wastes into Renewable Food Resources. Foods 2024, 13, 3007. [Google Scholar] [CrossRef]
  31. Lopes, J.d.C.; Madureira, J.; Margaça, F.M.A.; Cabo Verde, S. Grape Pomace: A Review of Its Bioactive Phenolic Compounds, Health Benefits, and Applications. Molecules 2025, 30, 362. [Google Scholar] [CrossRef]
  32. Goal 12|Department of Economic and Social Affairs. Available online: https://sdgs.un.org/goals/goal12 (accessed on 4 November 2025).
  33. Goal 13|Department of Economic and Social Affairs. Available online: https://sdgs.un.org/goals/goal13 (accessed on 4 November 2025).
  34. Le, X.T.; Rioux, L.-E.; Turgeon, S.L. Formation and Functional Properties of Protein–Polysaccharide Electrostatic Hydrogels in Comparison to Protein or Polysaccharide Hydrogels. Adv. Colloid Interface Sci. 2017, 239, 127–135. [Google Scholar] [CrossRef] [PubMed]
  35. Gentile, L. Protein–Polysaccharide Interactions and Aggregates in Food Formulations. Curr. Opin. Colloid Interface Sci. 2020, 48, 18–27. [Google Scholar] [CrossRef]
  36. Bourouis, I.; Pang, Z.; Liu, X. Recent Advances on Uses of Protein and/or Polysaccharide as Fat Replacers: Textural and Tribological Perspectives: A Review. J. Agric. Food Res. 2023, 11, 100519. [Google Scholar] [CrossRef]
  37. Chirsanova, A. Sustainable Gastronomy: The Impact on the Future Diet Agenda. In Proceedings of the Modern Technologies in the Food Industry Conference 2024, Chișinău, Moldova, 17–18 October 2024. [Google Scholar]
  38. Macdougall, D.B. Colour Measurement of Food: Principles and Practice; Elsevier: Amsterdam, The Netherlands, 2010; pp. 312–342. [Google Scholar]
  39. Covaliov, E.; Capcanari, T.; Reșitca, V.; Chirsanova, A.; Boiștean, A.; Sturza, R.; Patras, A.; Pocol, C.B.; Ruseva, O.; Chioru, A. Exploring the Biological Value of Red Grape Skin: Its Incorporation and Impact on Yogurt Quality. Foods 2024, 13, 3254. [Google Scholar] [CrossRef]
  40. Vásquez-Mazo, P.; Loredo, A.G.; Ferrario, M.; Guerrero, S. Development of a Novel Milk Processing to Produce Yogurt with Improved Quality. Food Bioprocess. Technol. 2019, 12, 964–975. [Google Scholar] [CrossRef]
  41. Ilić, N.; Belović, M.; Memiši, N.; Pestorić, M.; Škrobot, D.; Pezo, L.; Jevtić-Mučibabić, R.; Sanz, Y.; Brouzes, J. Rheological Properties and Sensory Profile of Yoghurt Produced with Novel Combination of Probiotic Cultures. Foods 2024, 13, 3021. [Google Scholar] [CrossRef]
  42. Černá, M.; Barros, A.S.; Nunes, A.; Rocha, S.M.; Delgadillo, I.; Čopíková, J.; Coimbra, M.A. Use of FT-IR Spectroscopy as a Tool for the Analysis of Polysaccharide Food Additives. Carbohydr. Polym. 2003, 51, 383–389. [Google Scholar] [CrossRef]
  43. Hong, T.; Yin, J.-Y.; Nie, S.-P.; Xie, M.-Y. Applications of Infrared Spectroscopy in Polysaccharide Structural Analysis: Progress, Challenge and Perspective. Food Chem. X 2021, 12, 100168. [Google Scholar] [CrossRef]
  44. Akcay, C.; Arslan, R.; Ceylan, F. Valorization of Various Lignocellulosic Wastes to Ganoderma lucidum (Curtis) P. Karst (Reishi Mushroom) Cultivation and Their FT-IR Assessments. PLoS ONE 2025, 20, e0328732. [Google Scholar] [CrossRef]
  45. Bikmurzin, R.; Bandzevičiūtė, R.; Maršalka, A.; Maneikis, A.; Kalėdienė, L. FT-IR Method Limitations for β-Glucan Analysis. Molecules 2022, 27, 4616. [Google Scholar] [CrossRef] [PubMed]
  46. Gieroba, B.; Kalisz, G.; Krysa, M.; Khalavka, M.; Przekora, A. Application of Vibrational Spectroscopic Techniques in the Study of the Natural Polysaccharides and Their Cross-Linking Process. Int. J. Mol. Sci. 2023, 24, 2630. [Google Scholar] [CrossRef] [PubMed]
  47. Kaur, R.; Riar, C.S. Sensory, Rheological and Chemical Characteristics during Storage of Set Type Full Fat Yoghurt Fortified with Barley β-Glucan. J. Food Sci. Technol. 2020, 57, 41–51. [Google Scholar] [CrossRef] [PubMed]
  48. Basyigit Kilic, G.; Akpinar Kankaya, D. Assessment of Technological Characteristics of Non-Fat Yoghurt Manufactured with Prebiotics and Probiotic Strains. J. Food Sci. Technol. 2016, 53, 864–871. [Google Scholar] [CrossRef] [PubMed]
  49. Siró, I.; Kápolna, E.; Kápolna, B.; Lugasi, A. Functional Food. Product Development, Marketing and Consumer Acceptance—A Review. Appetite 2008, 51, 456–467. [Google Scholar] [CrossRef] [PubMed]
  50. Miyaji, K.; Kuwano, Y.; Murakami, Y.; Hirata, S.; Imayoshi, Y.; Maruyama, H.; Koizumi, R.; Inoue, H.; Azuma, N. Off-Flavors Generated during Long-Term Ambient Storage of Pasteurized Drinking Yogurt from Skim Milk. Biosci. Biotechnol. Biochem. 2021, 85, 391–400. [Google Scholar] [CrossRef]
  51. Citta, A.; Folda, A.; Scalcon, V.; Scutari, G.; Bindoli, A.; Bellamio, M.; Feller, E.; Rigobello, M.P. Oxidative Changes in Lipids, Proteins, and Antioxidants in Yogurt during the Shelf Life. Food Sci. Nutr. 2017, 5, 1079–1087. [Google Scholar] [CrossRef]
  52. Gutierrez, A.M.; Boylston, T.D.; Clark, S. Effects of Pro-Oxidants and Antioxidants on the Total Antioxidant Capacity and Lipid Oxidation Products of Milk During Refrigerated Storage. J. Food Sci. 2018, 83, 275–283. [Google Scholar] [CrossRef] [PubMed]
  53. Hassan, A.N.; Ipsen, R.; Janzen, T.; Qvist, K.B. Microstructure and Rheology of Yogurt Made with Cultures Differing Only in Their Ability to Produce Exopolysaccharides. J. Dairy Sci. 2003, 86, 1632–1638. [Google Scholar] [CrossRef]
  54. Ragab, E.S.; Zhang, S.; Korma, S.A.; Buniowska-Olejnik, M.; Nasser, S.A.A.; Esatbeyoglu, T.; Lv, J.; Nassar, K.S. Physicochemical and Rheological Properties of Stirred Yoghurt during Storage Induced from High-Intensity Thermosonicated Goat and Cow Milk. Fermentation 2023, 9, 42. [Google Scholar] [CrossRef]
  55. Terpiłowski, K.; Lange, I.; Kowalczyk, K.; Tomczyńska-Mleko, M.; Sapiga, V.; Wesołowska-Trojanowska, M.; Mleko, S.; Pérez-Huertas, S. Impact of Storage Conditions of Yogurt Dry Ingredients on the Physicochemical Properties of the Final Product. Appl. Sci. 2023, 13, 13201. [Google Scholar] [CrossRef]
  56. Altay, F.; Karbancıoglu-Güler, F.; Daskaya-Dikmen, C.; Heperkan, D. A Review on Traditional Turkish Fermented Non-Alcoholic Beverages: Microbiota, Fermentation Process and Quality Characteristics. Int. J. Food Microbiol. 2013, 167, 44–56. [Google Scholar] [CrossRef]
  57. Zhang, L.; Folkenberg, D.M.; Amigo, J.M.; Ipsen, R. Effect of Exopolysaccharide-Producing Starter Cultures and Post-Fermentation Mechanical Treatment on Textural Properties and Microstructure of Low Fat Yoghurt. Int. Dairy J. 2016, 53, 10–19. [Google Scholar] [CrossRef]
  58. Lucey, J.A. The Relationship between Rheological Parameters and Whey Separation in Milk Gels. Food Hydrocoll. 2001, 15, 603–608. [Google Scholar] [CrossRef]
  59. Izadi, Z.; Nasirpour, A.; Garoosi, G.A.; Tamjidi, F. Rheological and Physical Properties of Yogurt Enriched with Phytosterol during Storage. J. Food Sci. Technol. 2015, 52, 5341–5346. [Google Scholar] [CrossRef] [PubMed]
  60. Saffon, M.; Richard, V.; Jiménez-Flores, R.; Gauthier, S.F.; Britten, M.; Pouliot, Y. Behavior of Heat-Denatured Whey: Buttermilk Protein Aggregates during the Yogurt-Making Process and Their Influence on Set-Type Yogurt Properties. Foods 2013, 2, 444–459. [Google Scholar] [CrossRef] [PubMed]
  61. Gustaw, W.; Glibowski, P.; Mleko, S. The rheological properties of yoghurt with incorporated whey protein aggregates/polymers. Milchwissenschaft 2006, 61, 415–419. [Google Scholar]
Figure 1. FT-IR-ATR spectra of SVRS03AA and SVRS01A β-glucan samples.
Sustainability 18 00989 g001
Figure 2. pH variation in control and β-glucan-enriched yogurt samples during 20 days of storage.
Sustainability 18 00989 g002
Figure 3. Changes in total titratable acidity (T°) of yogurt samples during 20 days of refrigerated storage.
Sustainability 18 00989 g003
Figure 4. Changes in syneresis (%) of yogurt samples during 20 days of refrigerated storage.
Sustainability 18 00989 g004
Figure 5. Changes in whey retention capacity (%) of yogurt samples during 20 days of refrigerated storage.
Sustainability 18 00989 g005
Figure 6. Photographic comparison of yogurt samples after 7, 14, and 20 days of refrigerated storage.
Sustainability 18 00989 g006
Figure 7. Apparent viscosity (η) as a function of shear rate ( γ ˙ ) for control yogurt sample at different storage times (0, 7, 14, and 20 days).
Sustainability 18 00989 g007
Figure 8. Shear stress (τ) as a function of shear rate ( γ ˙ ) for control yogurt sample at 0, 7, 14, and 20 days of storage.
Sustainability 18 00989 g008
Figure 9. Time-dependent shear stress (τ) and apparent viscosity (η) of control yogurt sample during continuous shearing at 100 s−1 for 10 min.
Sustainability 18 00989 g009
Figure 10. Dynamic viscoelastic properties of control yogurt sample: Storage modulus (G′), loss modulus (G″), and complex viscosity (|η|) as a function of frequency, after 0, 7, 14, and 20 days of storage.
Sustainability 18 00989 g010
Figure 11. Apparent viscosity (η) as a function of shear rate ( γ ˙ ) for yogurt sample SVRS01A at different storage times (0, 7, 14, and 20 days).
Sustainability 18 00989 g011
Figure 12. Shear stress (τ) as a function of shear rate ( γ ˙ ) for yogurt sample SVRS01A at 0, 7, 14, and 20 days of refrigerated storage.
Sustainability 18 00989 g012
Figure 13. Time-dependent shear stress (τ) and apparent viscosity (η) of yogurt sample SVRS01A during continuous shearing at 100 s−1 for 10 min.
Sustainability 18 00989 g013
Figure 14. Dynamic viscoelastic properties of yogurt sample SVRS01A: Storage modulus (G′), loss modulus (G″), and complex viscosity (|η|) as a function of frequency, after 0, 7, 14, and 20 days of storage.
Sustainability 18 00989 g014
Figure 15. Apparent viscosity (η) as a function of shear rate ( γ ˙ ) for yogurt sample SVRS03AA at different storage times (0, 7, 14, and 20 days).
Sustainability 18 00989 g015
Figure 16. Shear stress (τ) as a function of shear rate ( γ ˙ ) for yogurt samples SVRS503AA stored for 0, 7, 14, and 20 days under refrigerated conditions.
Sustainability 18 00989 g016
Figure 17. Time-dependent shear stress (τ) and apparent viscosity (η) of yogurt sample SVRS503AA during continuous shearing at 100 s−1 for 10 min.
Sustainability 18 00989 g017
Figure 18. Dynamic viscoelastic properties of yogurt sample SVRS03AA: Storage modulus (G′), loss modulus (G″), and complex viscosity (|η|) as a function of frequency, after 0, 7, 14, and 20 days of storage.
Sustainability 18 00989 g018
Table 1. Yield of the extracted β-glucan compounds, %.
SampleExtraction MethodYield of β-Glucan Compounds, %
SVRS03AAAcid–base method assisted with ultrasound, 2 mol/L NaOH, 25 kHz10.64 ± 0.37
SVRS01AAutolysis assisted with ultrasound method, 25 kHz26.59 ± 0.06
Table 2. Color of stirred yogurts fortified with β-glucan (mean ± SD).
DayTitleColor 1
L*a*b*C*hΔE
0Control sample85.78 ± 3.65−2.73 ± 0.169.23 ± 0.359.63106.48-
SVRS03AA72.07 ± 1.623.68 ± 3.499.25 ± 0.279.96248.3115.14
SVRS01A41.78 ± 0.1512.26 ± 0.42−3.93 ± 0.0912.88162.2148.31
7Control sample43.59 ± 1.15−1.44 ± 0.025.67 ± 0.135.85104.29-
SVRS03AA34.59 ± 2.711.29 ± 0.085.12 ± 0.265.28255.869.42
SVRS01A29.48 ± 1.937.97 ± 0.64−2.39 ± 0.338.32163.3018.78
14Control sample42.48 ± 8.73−1.36 ± 0.275.19 ± 0.505.37104.72-
SVRS03AA38.90 ± 1.581.64 ± 0.105.77 ± 0.246.00254.144.71
SVRS01A20.06 ± 2.794.88 ± 1.13−0.65 ± 0.654.92172.4123.99
20Control sample23.29 ± 0.634.03 ± 0.1479.71 ± 2.6579.81267.11-
SVRS03AA18.99 ± 2.263.85 ± 0.0898.62 ± 2.0498.69267.7719.40
SVRS01A9.30 ± 0.382.77 ± 0.1753.95 ± 0.3754.02267.0629.34
1 L* = lightness; a* = red/greenness; b* = yellow/blueness; C* = chroma; h = hue; ΔE = color difference.
Disclaimer/Publisher’s Note: The statements, opinions and data contained in all publications are solely those of the individual author(s) and contributor(s) and not of MDPI and/or the editor(s). MDPI and/or the editor(s) disclaim responsibility for any injury to people or property resulting from any ideas, methods, instructions or products referred to in the content.