1. Introduction
Agriculture accounts for nearly 70% of global freshwater withdrawals, and in South and Southeast Asia this share frequently exceeds more than 80%. This reflects the region’s dependency on irrigation practices for sustainable food production [
1,
2]. With global water demand expected to rise by 20–30% by 2050 [
3], improving water productivity is an urgent priority to have climate-resilient agriculture ecosystem. Yet, despite decades of technological and policy interventions, only 40–60% of the water applied in various irrigation schemes is effectively used by crops, while the remainder is lost through runoff, evaporation, or deep percolation in many Asian countries [
4,
5,
6]. These persistent inefficiencies highlight the need for effective and precise irrigation scheduling that stands for the real-time climatic variability and crop-water demand.
The Soil Water Balance (SWB) method is widely regarded as one of the most reliable frameworks for estimating irrigation requirements. This method accounts for all inputs and outputs in the field for example: rainfall, irrigation inputs, evapotranspiration losses, runoff, and deep percolation [
7,
8,
9]. However, its practical adoption by farmers remains limited, as the method is data-intensive, mathematically complex, and time-consuming when applied manually [
10]. Rapid advancements in information and communication technologies (ICT), including mobile applications, remote sensing methods, low-cost sensors, and increased availability of digital data have transformed agricultural decision-making in several countries, including India, by supporting ICT-enabled solutions for soil diagnostics, water management, pest forecasting, and crop monitoring [
11,
12]. As smartphones become increasingly available, they provide an effective solution for delivering simple, automated, and location-specific irrigation guidelines to the farmers.
A number of irrigation scheduling tools and applications have been developed over the years, ranging from worksheets [
13] and spreadsheets [
14] to desktop systems such as Cornell’s Climate Smart Farming tools, Purdue University’s IRRIS scheduler, AgriMet, CIMIS, and globally used models like FAO’s CROPWAT and AquaCrop [
14,
15,
16]. More recently, smartphone applications have gained popularity due to their ease of use and capability to incorporate real-time weather data. Examples include the SmartIrrigation suite for cotton, citrus, peanut, strawberry, turfgrass, and other crops [
17], field-validated apps for cotton irrigation in Georgia and Florida [
10], the WISE scheduling tool using automated weather stations [
18,
19], applications developed for Thai and Indian cropping systems [
20,
21], and advanced decision-support systems integrating DSSAT with economic forecasting, such as idCROP in Texas [
22]. Applications such as RiegoBerry have shown long-term water savings of up to 41% in strawberries and 29% in raspberries and blueberries [
23], underscoring the potential of mobile-based irrigation applications in enhancing crop water productivity.
Despite these advancements, existing irrigation apps show important limitations when applied to monsoon-driven agroecosystems of South and Southeast Asia. The first limitation is that most tools do not incorporate region-specific empirical formulas for Effective Rainfall (Pe) calculation, even though rainfall intensity, infiltration, runoff pattern, and monsoon variability strongly influence the portion of rainfall that is actually used by the crops [
24,
25,
26,
27,
28,
29,
30,
31,
32]. Many commonly used irrigation apps are designed for temperate regions and often fail to capture the diverse rainfall-runoff characteristic of tropical Asia, such as high-intensity rainfall, short-duration storms, and paddy-based cropping systems [
20]. The second limitation is that several tools require detailed soil-, crop-, or sensor-derived input parameters which may not be readily available to smallholder farmers, creating barriers to their adoption [
33]. Thirdly, only few applications offer multi-timescale irrigation scheduling (daily, weekly, 10-day, monthly), which is critical for aligning irrigation events with monsoon rainfall variability.
Previous studies indicated that effective irrigation scheduling tools should accurately represent local climatic conditions, crop coefficients, rainfall-runoff relationships, and water balance processes, while still being easy to use by the users with limited technical expertise [
17,
18,
20,
23,
34,
35]. Despite these advances, a clear gap remains that current irrigation applications do not integrate the SWB method with a comprehensive set of empirical effective rainfall equations specifically to the diverse climatic conditions of South and Southeast Asia. These empirical models include the USDA Soil Conservation Service, Dastane [
24], the Mekong River Commission [
28], national agencies of Vietnam, Thailand, Malaysia, Sri Lanka, Bangladesh, and India. Although these models are central to irrigation planning in their respective regions, they have not been implemented or operationalized in a mobile platform.
To address this gap, this study presents a smartphone-based irrigation scheduling application that automates SWB calculations using user inputs on crop coefficients (Kc), reference evapotranspiration (ETo), irrigation efficiency, and rainfall inputs and integrates region-specific empirical effective rainfall (Pe) equations for eleven Asian countries. The application generates Net (I) and Gross Irrigation (GI) Requirements at multiple temporal scales, enabling adaptive irrigation planning under variable rainfall conditions. The app aims to offer a practical solution for irrigation advisories suitable for diverse agro-ecological zones by reducing data complexity and supporting decision-making for smallholder farmers. Apps performance is evaluated through simulations across five representative agroclimatic regions and comparing against standard FAO-CROPWAT model to assess its reliability and practical utility. By integrating empirical rainfall modeling with the SWB framework in a mobile platform, this study provides a region-adapted, farmer-friendly irrigation tool that responds to the unique climatic challenges of south and south-east Asia.
2. Materials and Methods
2.1. Data Integration and Processing Framework of the Smartphone Application
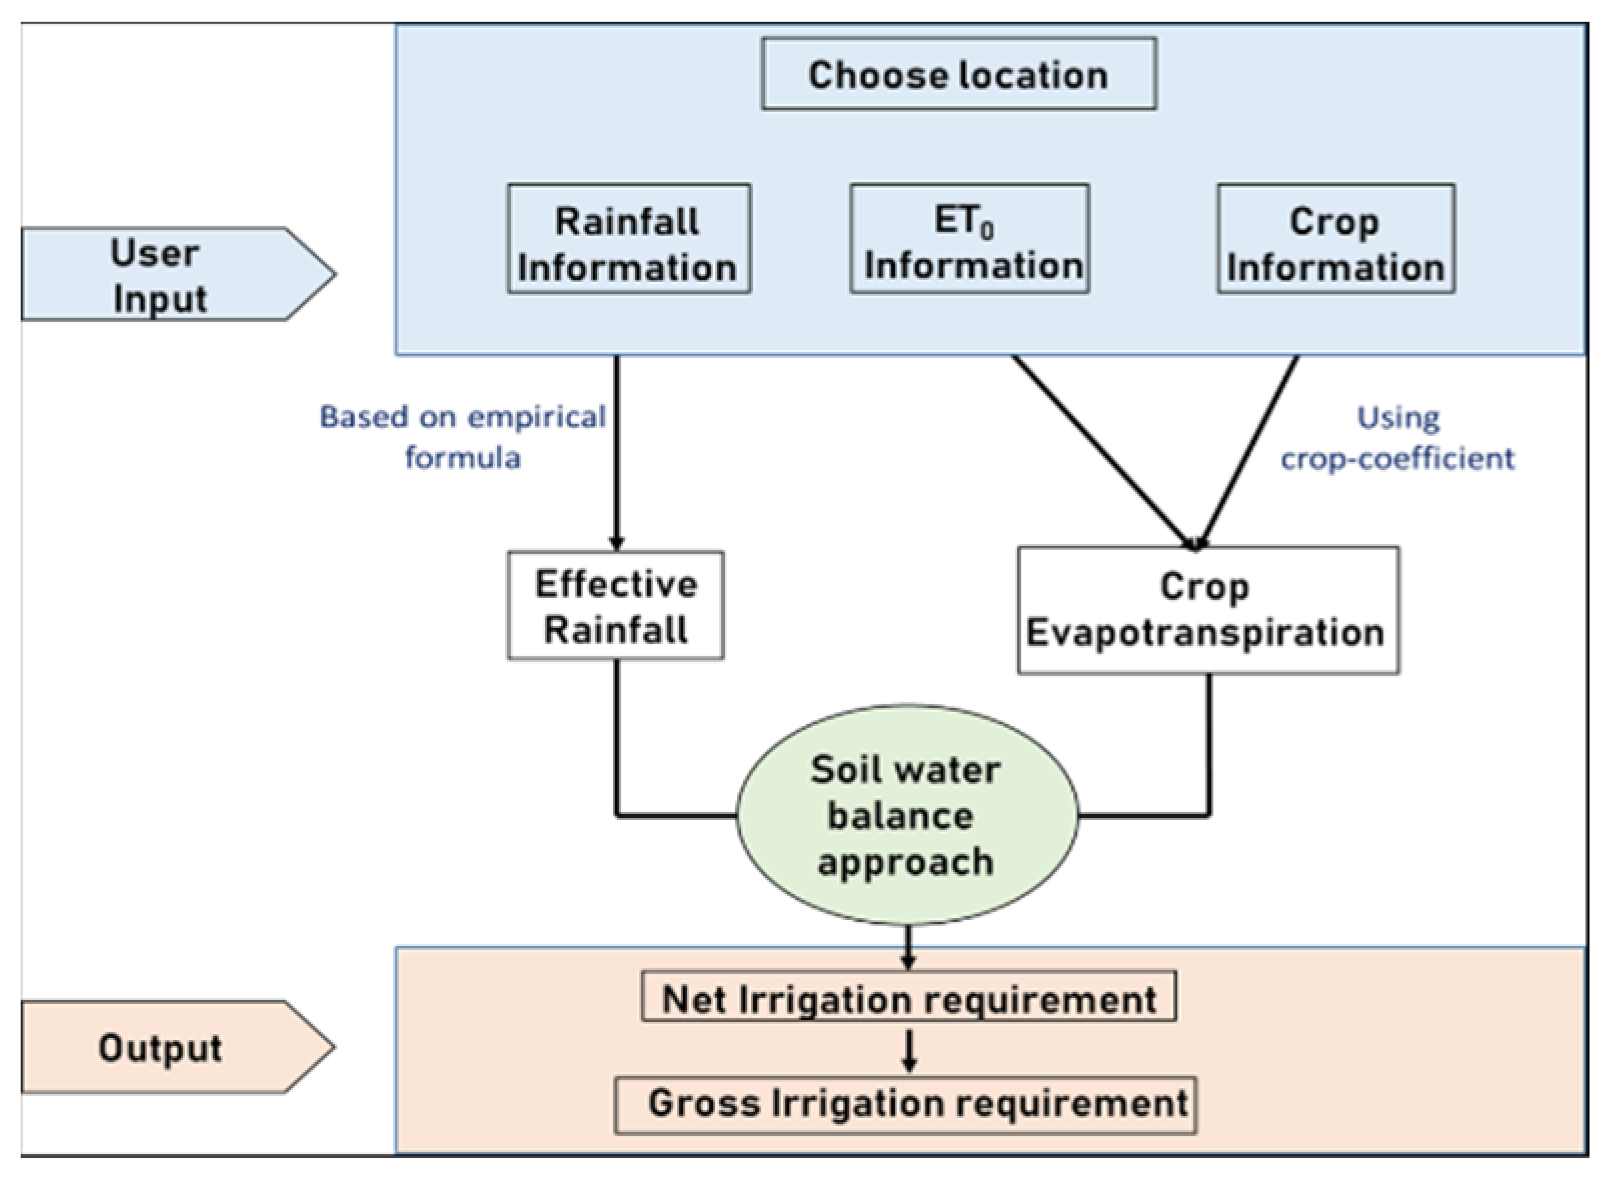
The application utilizes the Flutter framework, built on the Dart programming language, to create a cross-platform application compatible with both iOS and Android. The implementation uses Google Maps API to select the country through an interactive map interface. We use App version-1.0.0+1, google_maps_flutter-2.10.1 and geocoding-3.0.0. The software tools used were Flutter SDK-3.35.7 and Dart SDK-3.9.2. Flutter’s component-based architecture facilitates the development of a responsive user interface that manages agricultural data collection forms and ensures fluid application navigation. Users are systematically guided through parameter specification processes, with the system generating the relevant irrigation results. The smartphone-based irrigation application integrates user-supplied crop information with satellite-derived meteorological data through a structured data processing workflow (
Figure 1).
The user provides inputs such as crop type, growth stage, crop coefficient, irrigation system details (includes system type and application efficiency), and geographic location. These inputs are combined with weather data retrieved from the NASA POWER database, including solar radiation, air temperature, relative humidity, wind speed, and rainfall to calculate reference evapotranspiration. Before any computation, all inputs undergo basic validation and preprocessing to ensure consistent units, acceptable parameter ranges, and orientation with the selected temporal scale (daily, 10-day, or monthly). ETo is then computed using the FAO Penman–Monteith method, which explicitly incorporates the aerodynamic and radiative parameters of atmospheric evaporative demand.
Effective Rainfall (Pe) is estimated using region-specific empirical formula selected based on the country and crop type. The Soil Water Balance (SWB) framework then applied to compute ETc, I, and GI requirements on a weekly, 10-day, or monthly basis, depending on the crop and location. The results are presented to users in a ready-to-use format for practical irrigation planning.
2.2. Calculation of Water Demand of the Crops
The soil water balance approach computes the water demand based on soil water content and meteorological variables. These climate-based techniques collect meteorological and soil data to estimate the quantity of water required for optimum plant growth [
36]. However, water use is also highly dependent on the type of crop, its growth stage (e.g., initial, maturity, terminal), and climatic factors (e.g., temperature, solar radiation, wind, and humidity) that primarily impact Crop Evapotranspiration (
ETc) [
37].
The soil water balance method considers water inputs and losses from the root zone. The main inputs in the soil water balance approach (Equation (1)) are Effective Precipitation or Rainfall (
Pe) and irrigation (
I). Effective Rainfall (
Pe) is the amount of water held in the root zone that satisfies the plant’s water needs and is useful for the plant to grow [
38]. A deeper rooting depth means a larger volume of water is stored in the soil and is available to the plant. After some water has trickled into the soil, any surplus water from rain or irrigation will drain. The main source of water losses is crop transpiration and evaporation (or Evapotranspiration,
ETc), surface Runoff (
RO), and Deep Percolation (
D) (
Figure 2). These depend on the type of terrain (slope or flat) and the predominant soil type (e.g., sandy soils are less able to retain water than loamy soils), among other factors. Large pores between sand particles are incapable of holding onto water against gravity; hence, coarse-textured soils store the least amount of water. Deep percolation refers to the process by which water penetrates the deeper soil layers beyond the crop root zone and ultimately reaches the groundwater. Coarse-textured soils have higher infiltration rates, resulting in higher Deep Percolation (
D) than fine-textured soils (e.g., silt and clay). The surface Runoff (
RO) depends on the slope and occurs when the soil’s complete water-holding capacity is saturated.
Water-based inputs and outputs equation:
where
ΔS = Change in soil water storage (inches)/differences between inputs (water gain) and outputs (water loss)
Pe = Effective Rainfall (inches)
ETc = Crop Evapotranspiration (inches)
I = Net Irrigation (inches)
D = Deep Percolation (inches)
RO = Surface RunOff (inches)
We assume that changes in the amount of water storage (Δ
S) are negligible, as in reservoirs or aquifers [
39,
40]. In addition, we suppose that the surface Runoff (
RO) is insignificant since paddy fields are flat. Deep Percolation (
D) is also assumed to be minimal, with irrigation and rainfall being insufficient to exceed the soil’s water-holding capacity.
Equation (1) becomes Equation (2)
where
I = Net Irrigation (inches)
Pe = Effective Rainfall (inches)
ETc = Crop Evapotranspiration (inches)
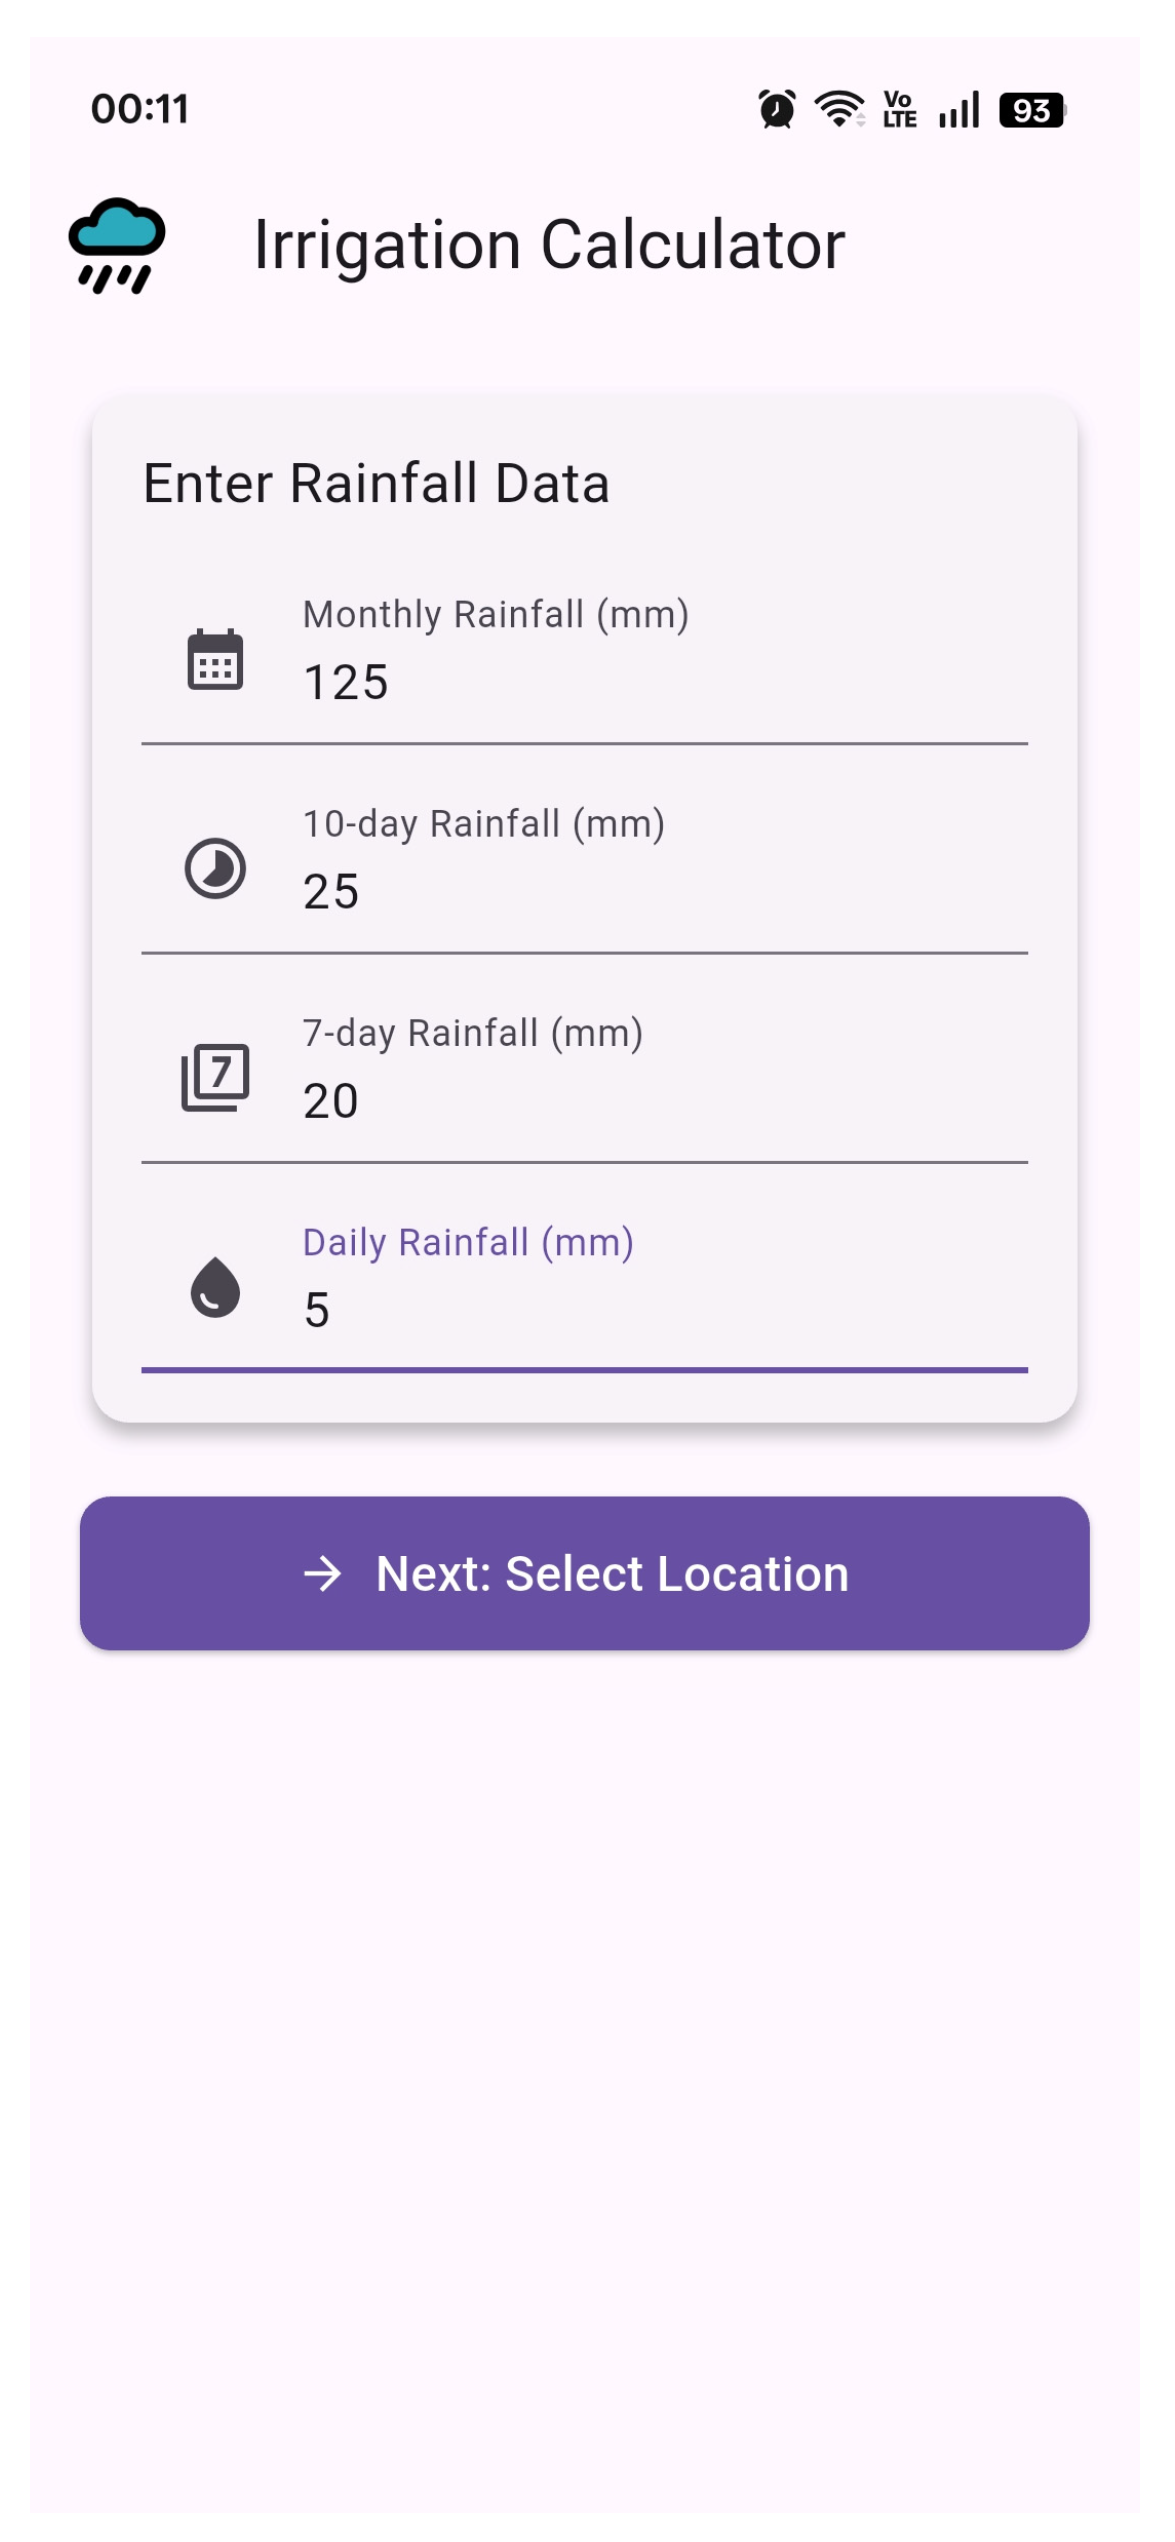
Firstly, the app calculates the Effective Rainfall (Pe), which depends on the amount of Rainfall (
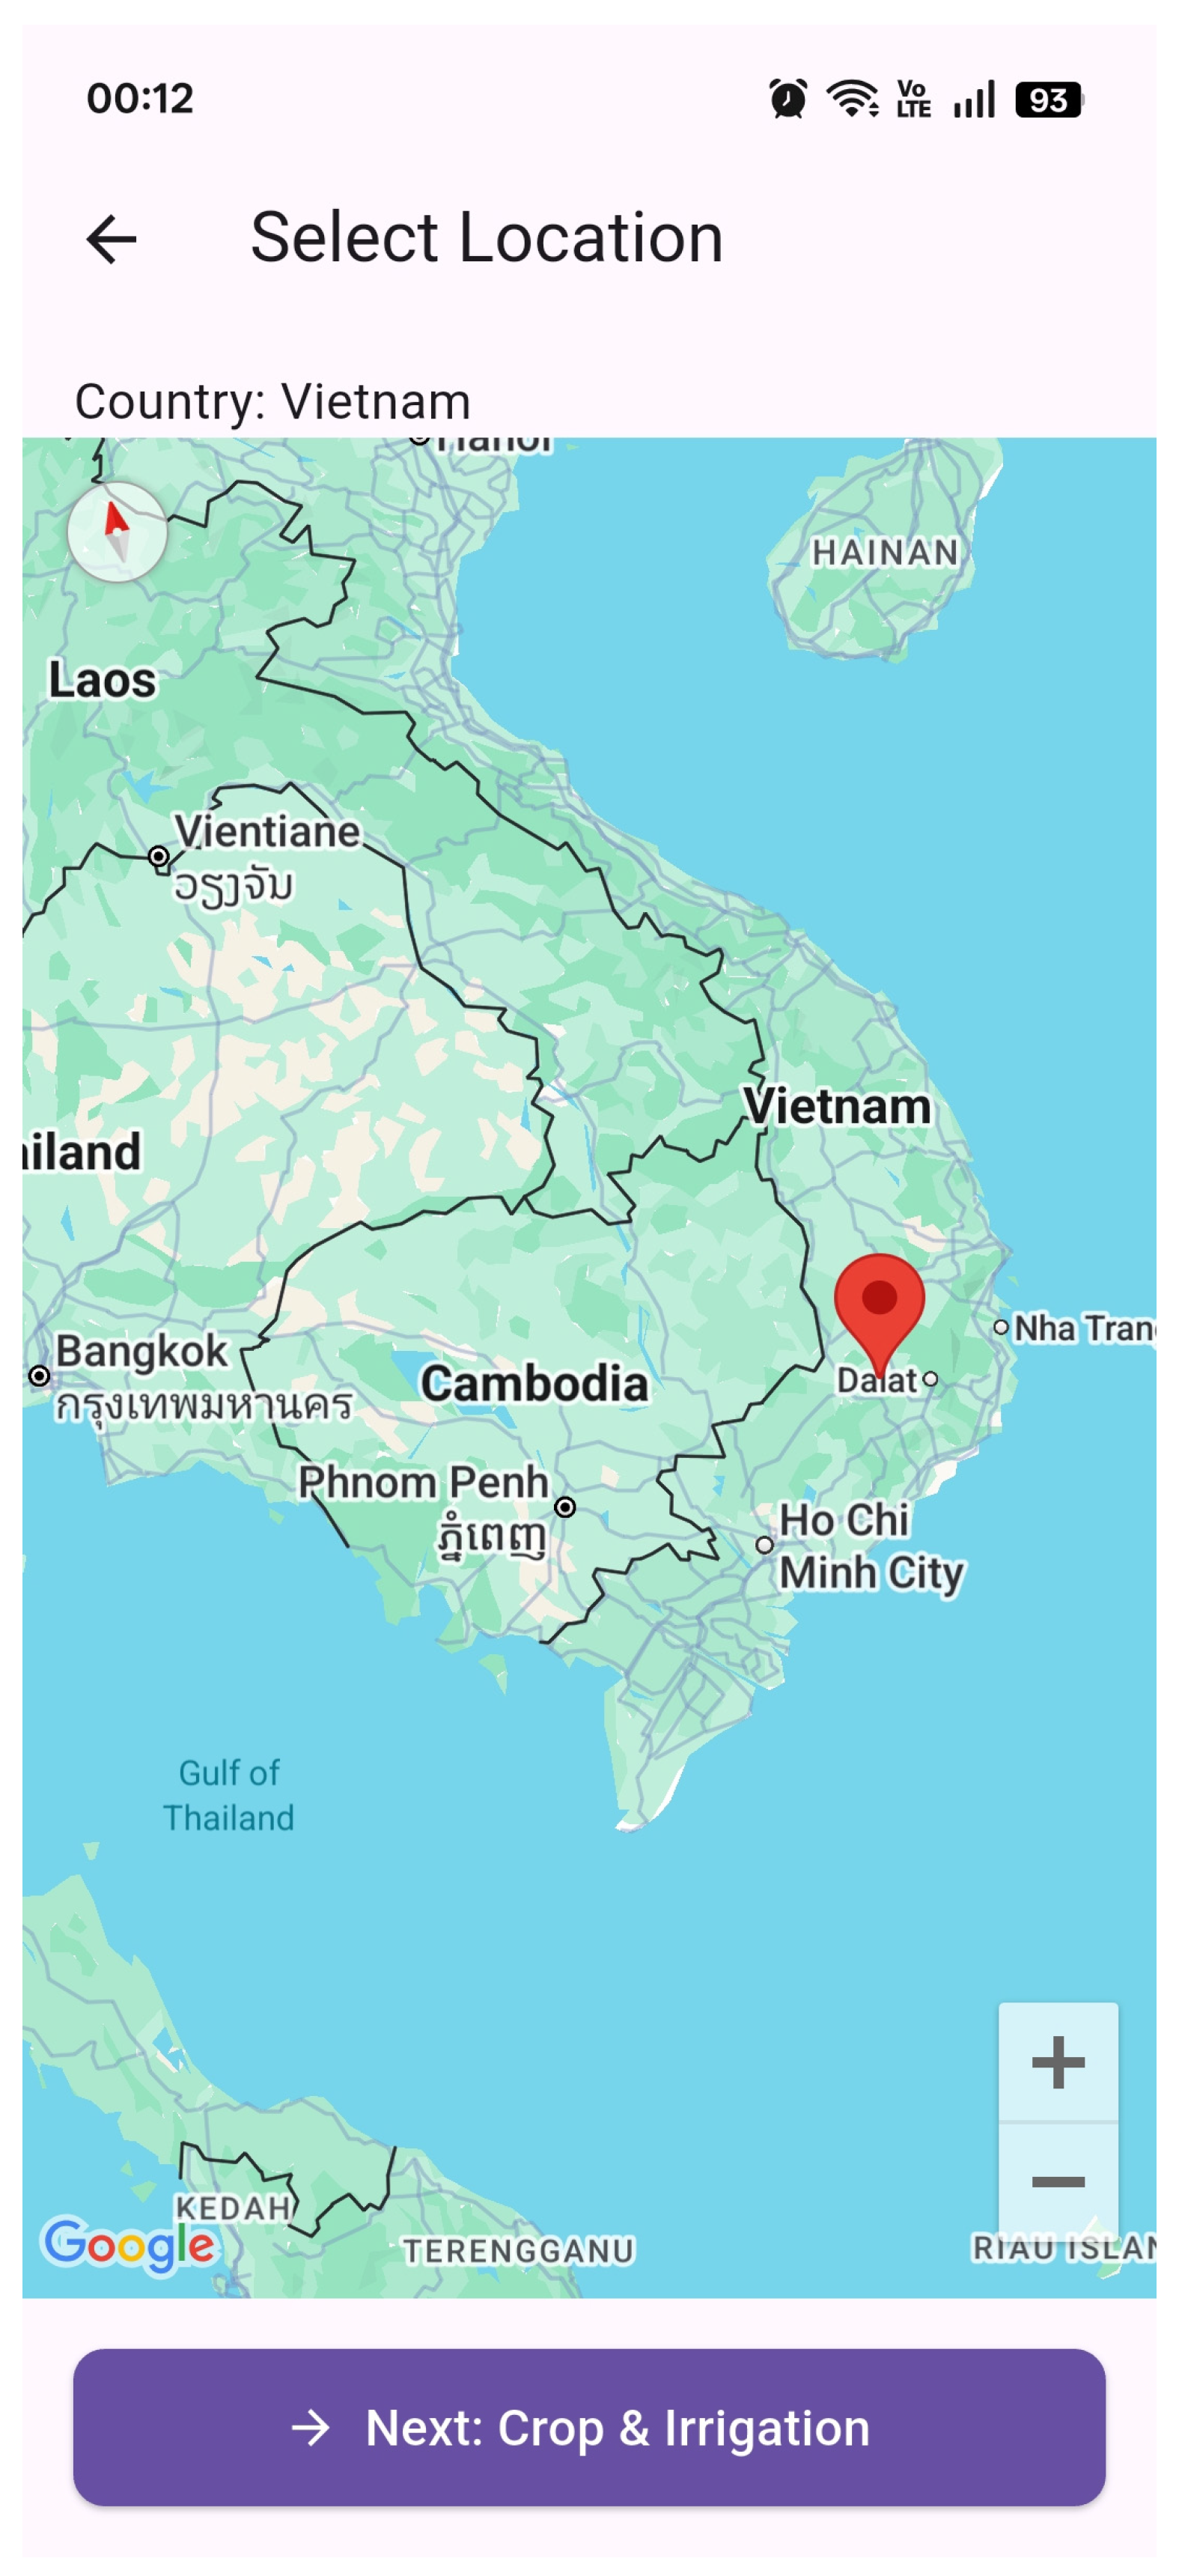
Figure 2) for a specific time period. Secondly, the user selects a location (
Figure 3).
2.3. Calculation of Crop Evapotranspiration (ETc)
Scheduling the timing and amount of irrigation water applied is primarily determined by crop evapotranspiration. Evapotranspiration is a fundamental basis for the design and management of irrigation systems [
41].
For cut grass, the reference crop evapotranspiration rate (
ETo) serves as a baseline for measuring evapotranspiration rates. The evapotranspiration rates of other crops are calculated in relation to this reference rate. Thus, accurately determining crop evapotranspiration (
ETc) and calculating crop coefficients (
Kc) at various growth stages is essential for optimizing irrigation scheduling and agricultural water management [
42,
43].
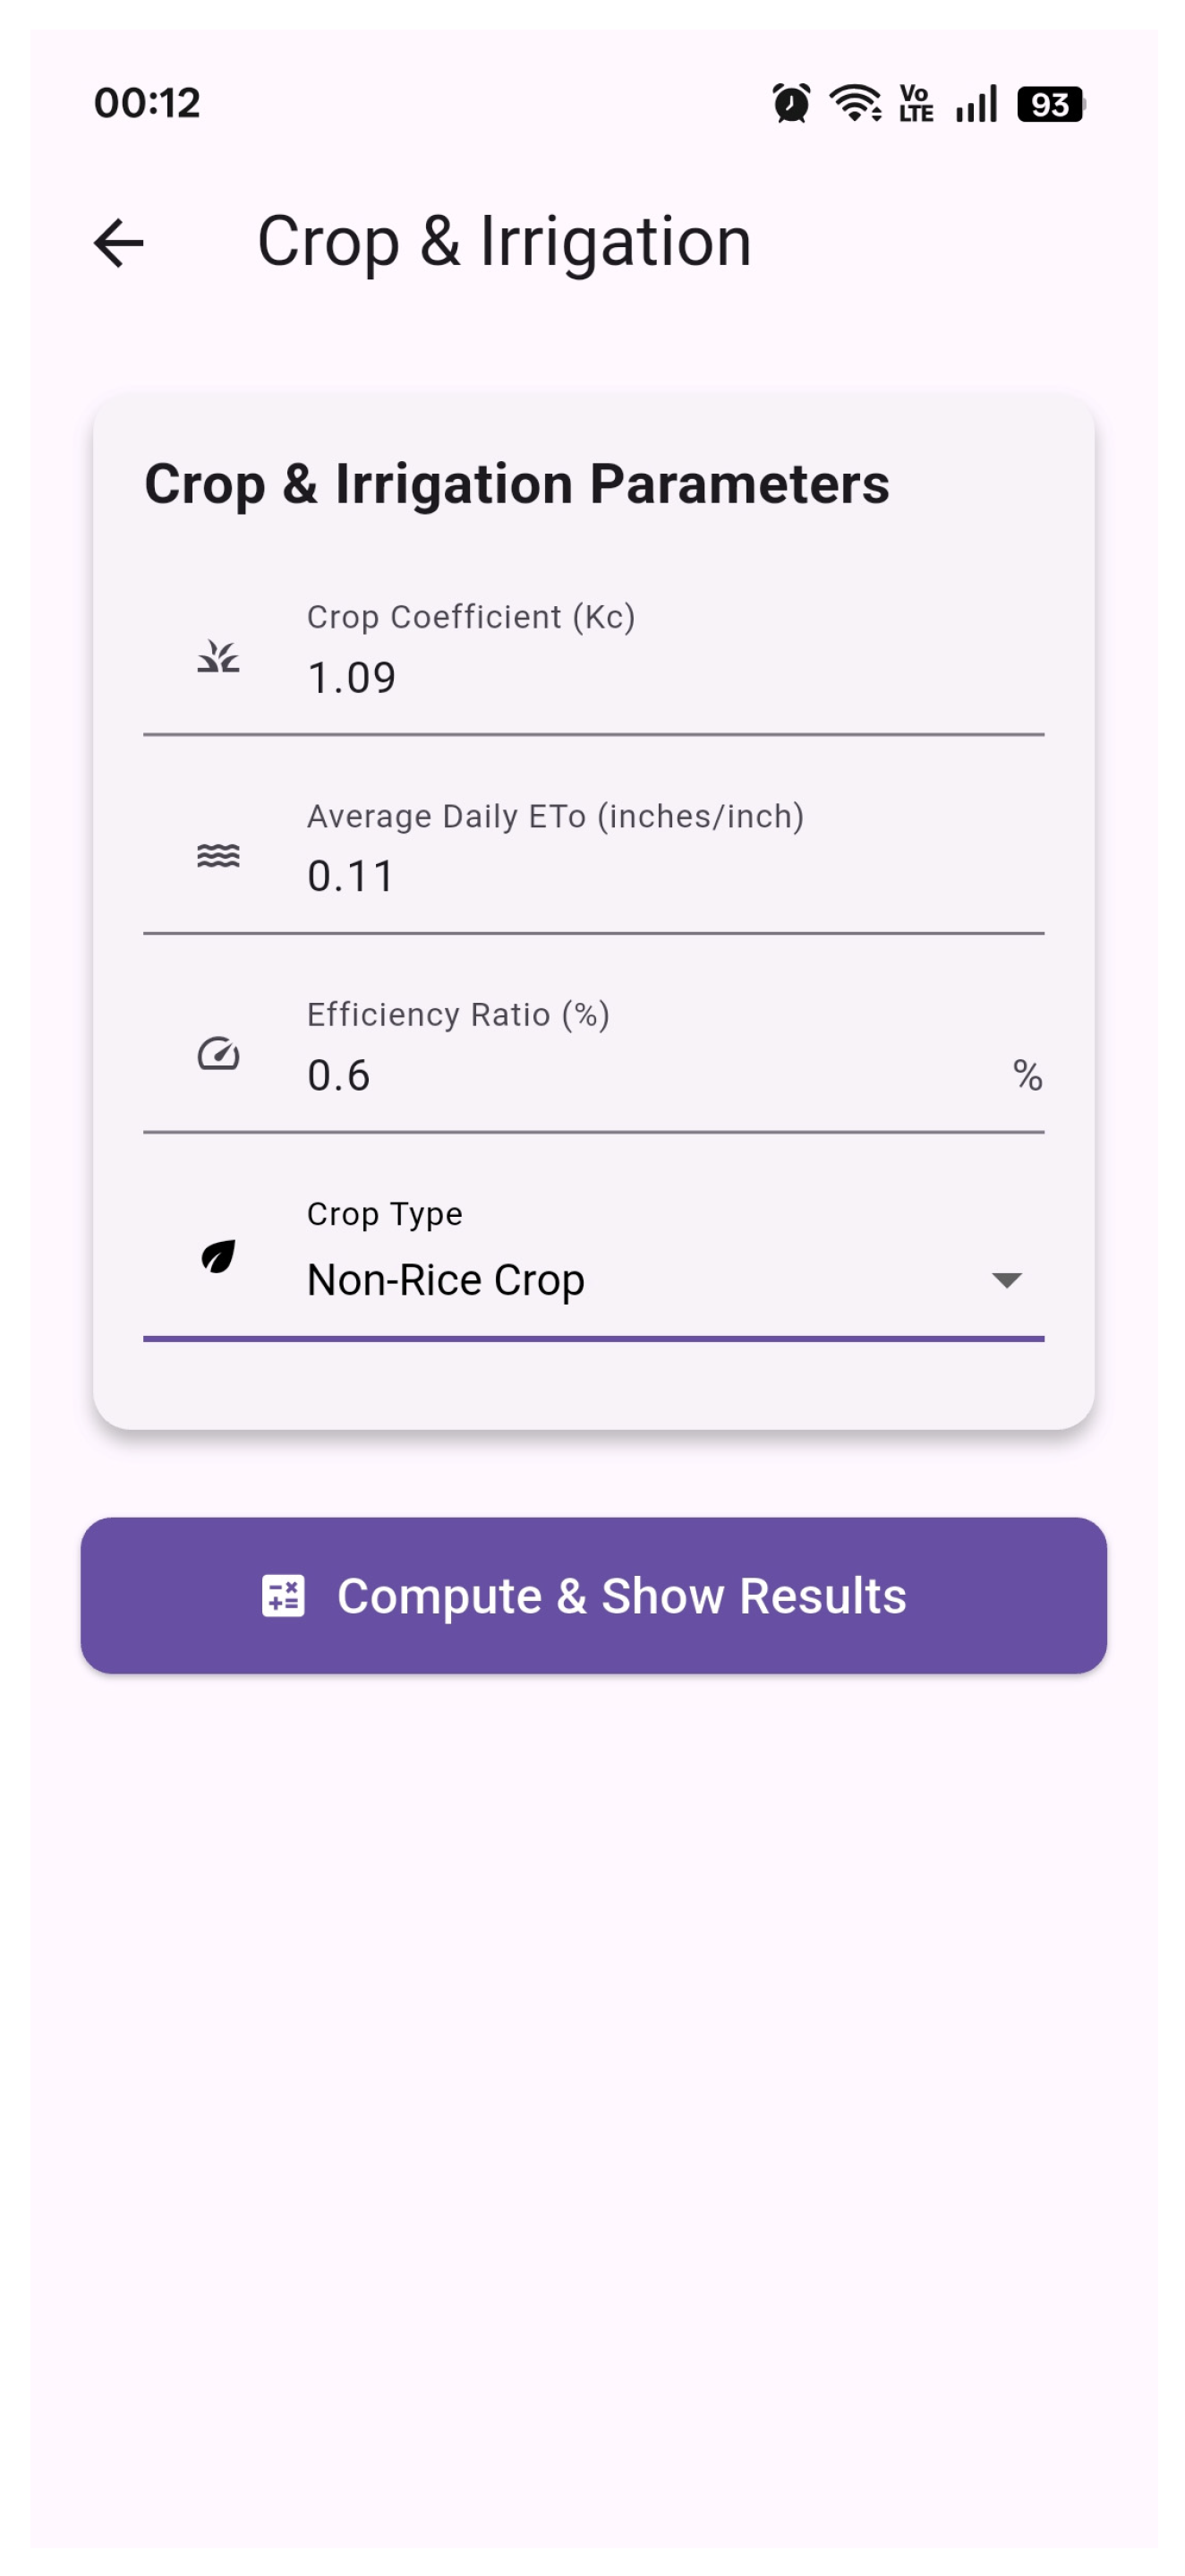
The app user provides the crop coefficients (
Kc) and the Reference Evapotranspiration (
ETo) at the selected location (
Figure 3).
The app computes the crop evapotranspiration (
ETc) using the following formula
where
ETo is the reference Evapotranspiration (ETo) for grass (inches)
Kc is the crop coefficient (dimensionless)
ETc is the crop evapotranspiration (inches)
The FAO recommends the Penman–Monteith technique as the only method for calculating Reference Evapotranspiration (
ETo). Reference Evapotranspiration (
ETo) is calculated from meteorological data and can be retrieved for the global land surface [
44] or computed on a smartphone-based evapotranspiration calculator. It can be retrieved from universities such as the University of Cranfield with its Daily
ET and Monthly
Eto software (
https://cord.cranfield.ac.uk/articles/software/DailyET/8223464, accessed on 18 November 2025), the university of Idaho with its Ref-ET Software (
https://www.uidaho.edu/cals/kimberly-research-and-extension-center/research/water-resources/ref-et-software, accessed on 18 November 2025), the King Saud University with the online
ETo calculator (
https://i-water.co/, accessed on 18 November 2025), the FAO Cropwat software (
https://www.fao.org/land-water/databases-and-software/cropwat/en/, accessed on 18 November 2025), the Bushland
ET Calculator [
45] as well as online calculators from the Canadian Fredericton Research and Development Centre (
https://etcalc.hydrotools.tech/pageMain.php, accessed on 18 November 2025) or from UC Davis (
https://biomet.ucdavis.edu/evapotranspiration.html, accessed on 18 November 2025), or from the Python package PyEt (
https://github.com/phydrus/pyet, accessed on 18 November 2025 and
https://pyeto.readthedocs.io/en/latest/api.html#evapotranspiration, accessed on 18 November 2025), commercial websites (
https://www.myweather2.com/business/weather-data/evapotranspiration.aspx, accessed on 18 November 2025), the R package (
https://rdrr.io/cran/water/man/dailyET.html, accessed on 18 November 2025).
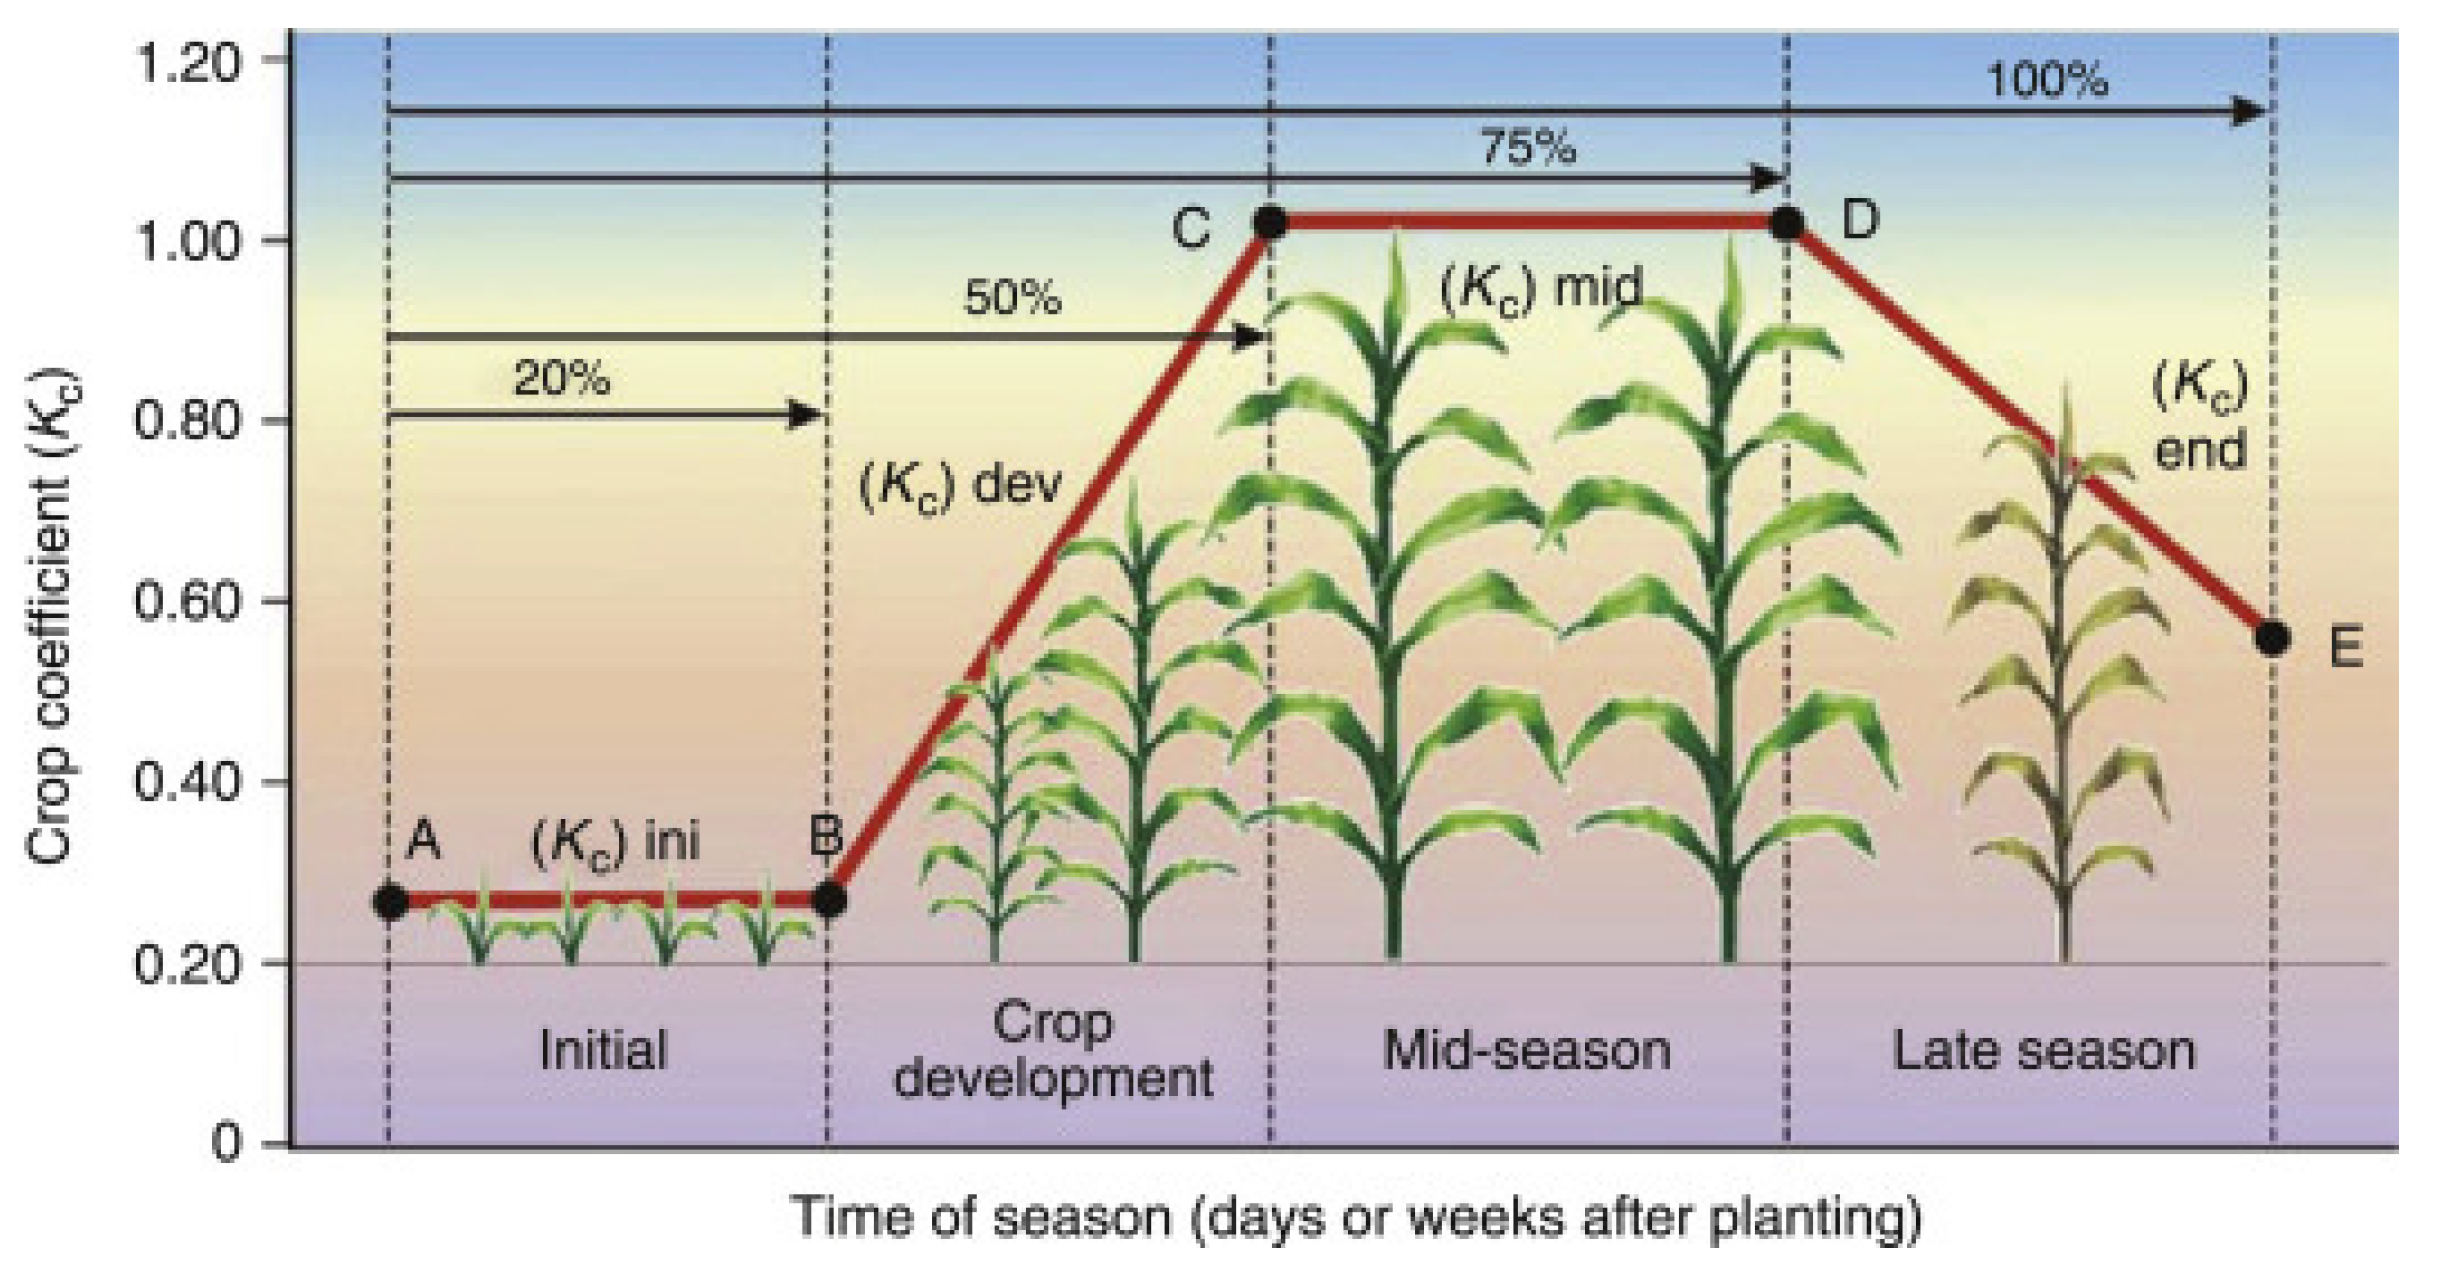
Typically, the crop coefficient (
Kc) for a specific crop varies with the crop and location. Each crop has its own set of crop coefficients, which are used to anticipate the amount of water required at various development stages. The crop coefficient (
Kc) is often defined for the four different growth stages: initial, development, mid-season, and late-season phases.
Figure 4 illustrates a Kc curve as a function of days or weeks after planting.
The crop coefficient (
Kc) is provided by the app user (
Figure 5). It indicates the combined impacts of changes in leaf area (which increases as the crop canopy develops), plant height, crop growth stage, planting date, soil and climatic conditions, and management strategies.
2.4. Calculation of the Effective Rainfall
Effective Rainfall should be considered when predicting the water needs of crops. Several factors, including the amount and intensity of rainfall, soil slope, soil texture and structure, plant cover or crop residue, evapotranspiration, percolation losses, and crop and irrigation management techniques, all influence Effective Rainfall. Techniques for calculating Effective Rainfall include direct measuring techniques, empirical techniques, and methods based on soil water balance. Among these, soil water balance is the most accurate method for estimating Effective Rainfall [
25]. Different countries prefer various methods for calculating Effective Rainfall in irrigation scheduling. These methods have proven to be quite effective in the specific contexts in which they were developed and are based on extensive experience.
If the rainfall is sufficient to meet the crops’ water needs, irrigation is unnecessary. If there is some rainfall, but not enough to satisfy the crops’ water requirements, irrigation must supplement the rainwater to ensure that, together, they fulfill the crops’ water needs [
26].
The formula for computing Effective Rainfall (
Pe) depends on the time period (daily, decadal/10-day, or monthly), the selected location (
Figure 3), and the crop type (
Figure 5). We retrieve the formula to calculate Effective Rainfall (
Pe) whenever it is available for the selected time period and location. Singapore, Indonesia, Brunei, Timor-Leste, Bhutan, Pakistan, the Maldives, and Afghanistan were excluded from the sample due to a lack of a straightforward formula to compute the effective formula. The country-specific
Pe formula were selected based on well-established empirical relationships widely used by national irrigation agencies, FAO guidelines, and peer-reviewed research work. These formulas account for local climate, rainfall patterns, soil conditions, and cropping systems, particularly in monsoon-affected regions. Instead of relying on single generalized method, the app integrates regionally validated formula to improve accuracy and minimize systematic error in irrigation calculations.
In this study, surface runoff (RO) and deep percolation (D) were assumed to be minimal under the conditions, namely flat or gently sloping irrigated fields with controlled water application, such as levelled croplands. These assumptions align with standard irrigation scheduling practices in lowland agricultural systems but may not be valid for sloping terrain or highly permeable soils.
2.4.1. Effective Rainfall (Pe) in Vietnam, Cambodia, Laos
- 1.
Non-rice crops
The app computes monthly and 10-day Effective Rainfall (
Pe) in the aforementioned countries using the following formulae (Song et al., 2016 [
27], USDA Soil Conservation Service).
Pe is monthly Effective Rainfall (in mm)
P is the total monthly Rainfall (mm)
- 2.
Rice
Another method applies to
rice only. The water holding capacity of rice soils in Vietnam is set at 50 mm (Ali & Mubarak, 2017 [
26]). Daily Rainfall below 5 mm and above 50 mm is disregarded. Therefore,
Daily Pe is calculated as:
where
Pe is daily Effective Rainfall (in mm)
P is daily Rainfall (mm).
Weekly Effective Rainfall (Pe)
A 7-day successive rainfall of up to 110 mm is taken as effective, and the excess is disregarded
where
Pe is the total weekly Effective Rainfall (mm)
P is the total weekly Rainfall (mm).
Monthly Effective Rainfall (Pe)
We can use this formula where Effective Rainfall (
Pe) is a percentage (%) of the average Monthly Rainfall. That percentage (%) varies with the quantity of Rainfall (
Table 1).
Alternatively, we can also use the following table (
Table 2), applicable to Vietnamese rice only.
2.4.2. Effective Precipitation in Thailand
Other methods applicable to Thailand consider
monthly effective Precipitation as a percentage of the total monthly Rainfall. Those percentages vary from 65% in October to 90% in March (FAO, chapter 2, 1998 [
4]), depending on rainfall intensity, as in
Table 3 and
Table 4. In the app, we choose to use these to compute monthly Effective Rainfall (
Pe) in Thailand.
In Cambodia, Effective Rainfall (Pe) was determined to be 70% of dependable Rainfall (Rainfall with an 80% probability of occurrence in 4 out of 5 years).
During heavy Rainfall, losses from runoff are high, and only the first 30 mm of Rainfall are considered effective.
2.4.3. Effective Precipitation in Burma
The formula to compute effective Precipitation in Burma [
26] depends on the season.
- 1.
Non-rice crops
During the
wet season, from mid-May to October, Rainfall of less than 0.5 in. is considered ineffective (Dastane, [
24] Chapter II, paragraph 3.5.1). Above this number, 63 percent of the amount greater than 0.5 in. is deemed effective.
where
During the
dry season from October to May, Rainfall of less than one inch is considered ineffective. Above this number, 65 percent of the amount greater than one in. is deemed usable by the crop [
30].
where
Pe is the daily Effective Rainfall (inches)
P is the daily Rainfall (inches)
- 2.
Rice
According to Mohan et al. [
31], less than 12 mm/day is considered ineffective for Burmese rice, and only 80% of the daily Rainfall over 12 mm per day is deemed effective. For Ali & Mubarak [
26], Rainfall (R) below 0.5 is seen as ineffective for Burmese rice. Above 0.5 in, 80 percent of the amount over 0.5 is considered effective, which led to the following equation:
where
Effective Rainfall (Pe) in Burma is about 70–75% of actual monthly Rainfall for rice paddy and 60–65% for other crops, depending on actual rainfall intensity [
32].
2.4.4. Effective Precipitation in Malaysia
Initially developed in the Tanjung Karang Rice Irrigation Scheme, this formula applies to other locations such as Seberang Perak [
47]. The computation of the
weekly Effective Rainfall (Pe) is based on the following empirical formula [
48,
49].
where
Pe is the weekly Effective Rainfall (mm)
P is the total weekly Rainfall (mm)
2.4.5. Effective Precipitation in Sri Lanka
- 1.
Monthly Effective Rainfall (Pe)
The monthly Effective Rainfall (Pe) depends on the location, lowlands vs. uplands [
50]
- 2.
Daily Effective Rainfall (Pe)
The daily Effective Rainfall (Pe) is computed using the following formula (JICA) [
51].
Alternatively, rainfall of less than 6 mm/day is considered ineffective. Similarly, any amount over 75 mm/day is treated as ineffective [
52].
where
2.4.6. Effective Precipitation in India
Effective Rainfall (Pe) is assumed to be equal to 70% of the seasonal mean rainfall for a specific location. Another approach substitutes Effective Rainfall (Pe) for the mean value of rain, omitting the surplus rain that exceeds 3 inches per day and 5 inches per 10 days [
31]. The lowest monsoon rainfall that occurred in three out of the last four years has also been assumed to be equivalent to Effective Rainfall (Pe). In India, the fixed-percentage approach and the USDA method are typically used to calculate the amount of Effective Rainfall (Pe) [
53].
In the USDA, Effective Rainfall (Pe) is calculated using the following formula.
- 1.
Monthly Effective Rainfall (Pe)
Pe is the monthly Effective Rainfall (mm)
P is the monthly Rainfall (mm)
- 2.
Decadal (10-day) Effective Rainfall (Pe)
Pdec is the total rainfall (mm) during a 10-day period.
Pe is the Effective Rainfall (mm) during that 10-day period
- 3.
Daily case
A rainfall less than 6 mm/day is considered ineffective. Similarly, any amount over 75 mm/day is treated as ineffective [
52].
where
- 4.
Indian-2 Method, applicable to Rice
Rainfall less than 6.25 mm on any day is considered ineffective in this approach, applicable to rice. Similarly, any amount over 75 mm/day and Rainfall over 125 mm in 10 days is treated as ineffective.
For
Decadal (10-day) Period
where
This method may be used to estimate daily or short-term Effective Rainfall (Pe) for paddy cultivation in Bangladesh and Sri Lanka [
52].
2.4.7. Effective Precipitation in Bangladesh
- 1.
For daily cases
The following formula computes daily effective Precipitation in dry times during the crop-growing period (planting to harvesting) (Source: Mridha [
54]).
where
- 2.
Monthly Effective Rainfall (Pe)
The formula to compute
monthly effective Precipitation [
55] is:
where
2.4.8. Effective Precipitation in Nepal
The Effective Rainfall (Pe) is 80% of the total Rainfall [
56].
2.4.9. Effective Precipitation in Japan
Rainfall is considered 80% effective, but daily Rainfall below 1.85 mm or above 30 mm is disregarded [
57].
where
Effective Rainfall (Pe) is never negative. The app puts Effective Rainfall (Pe) to Zero if the computation gives a negative Pe.
2.4.10. Effective Precipitation in the Philippines
The NIA (National Irrigation Administration) or DA (Department of Agriculture) provides the following formula for Monthly Effective Rainfall (Pe).
where
2.5. Net Irrigation (I) Water Requirements
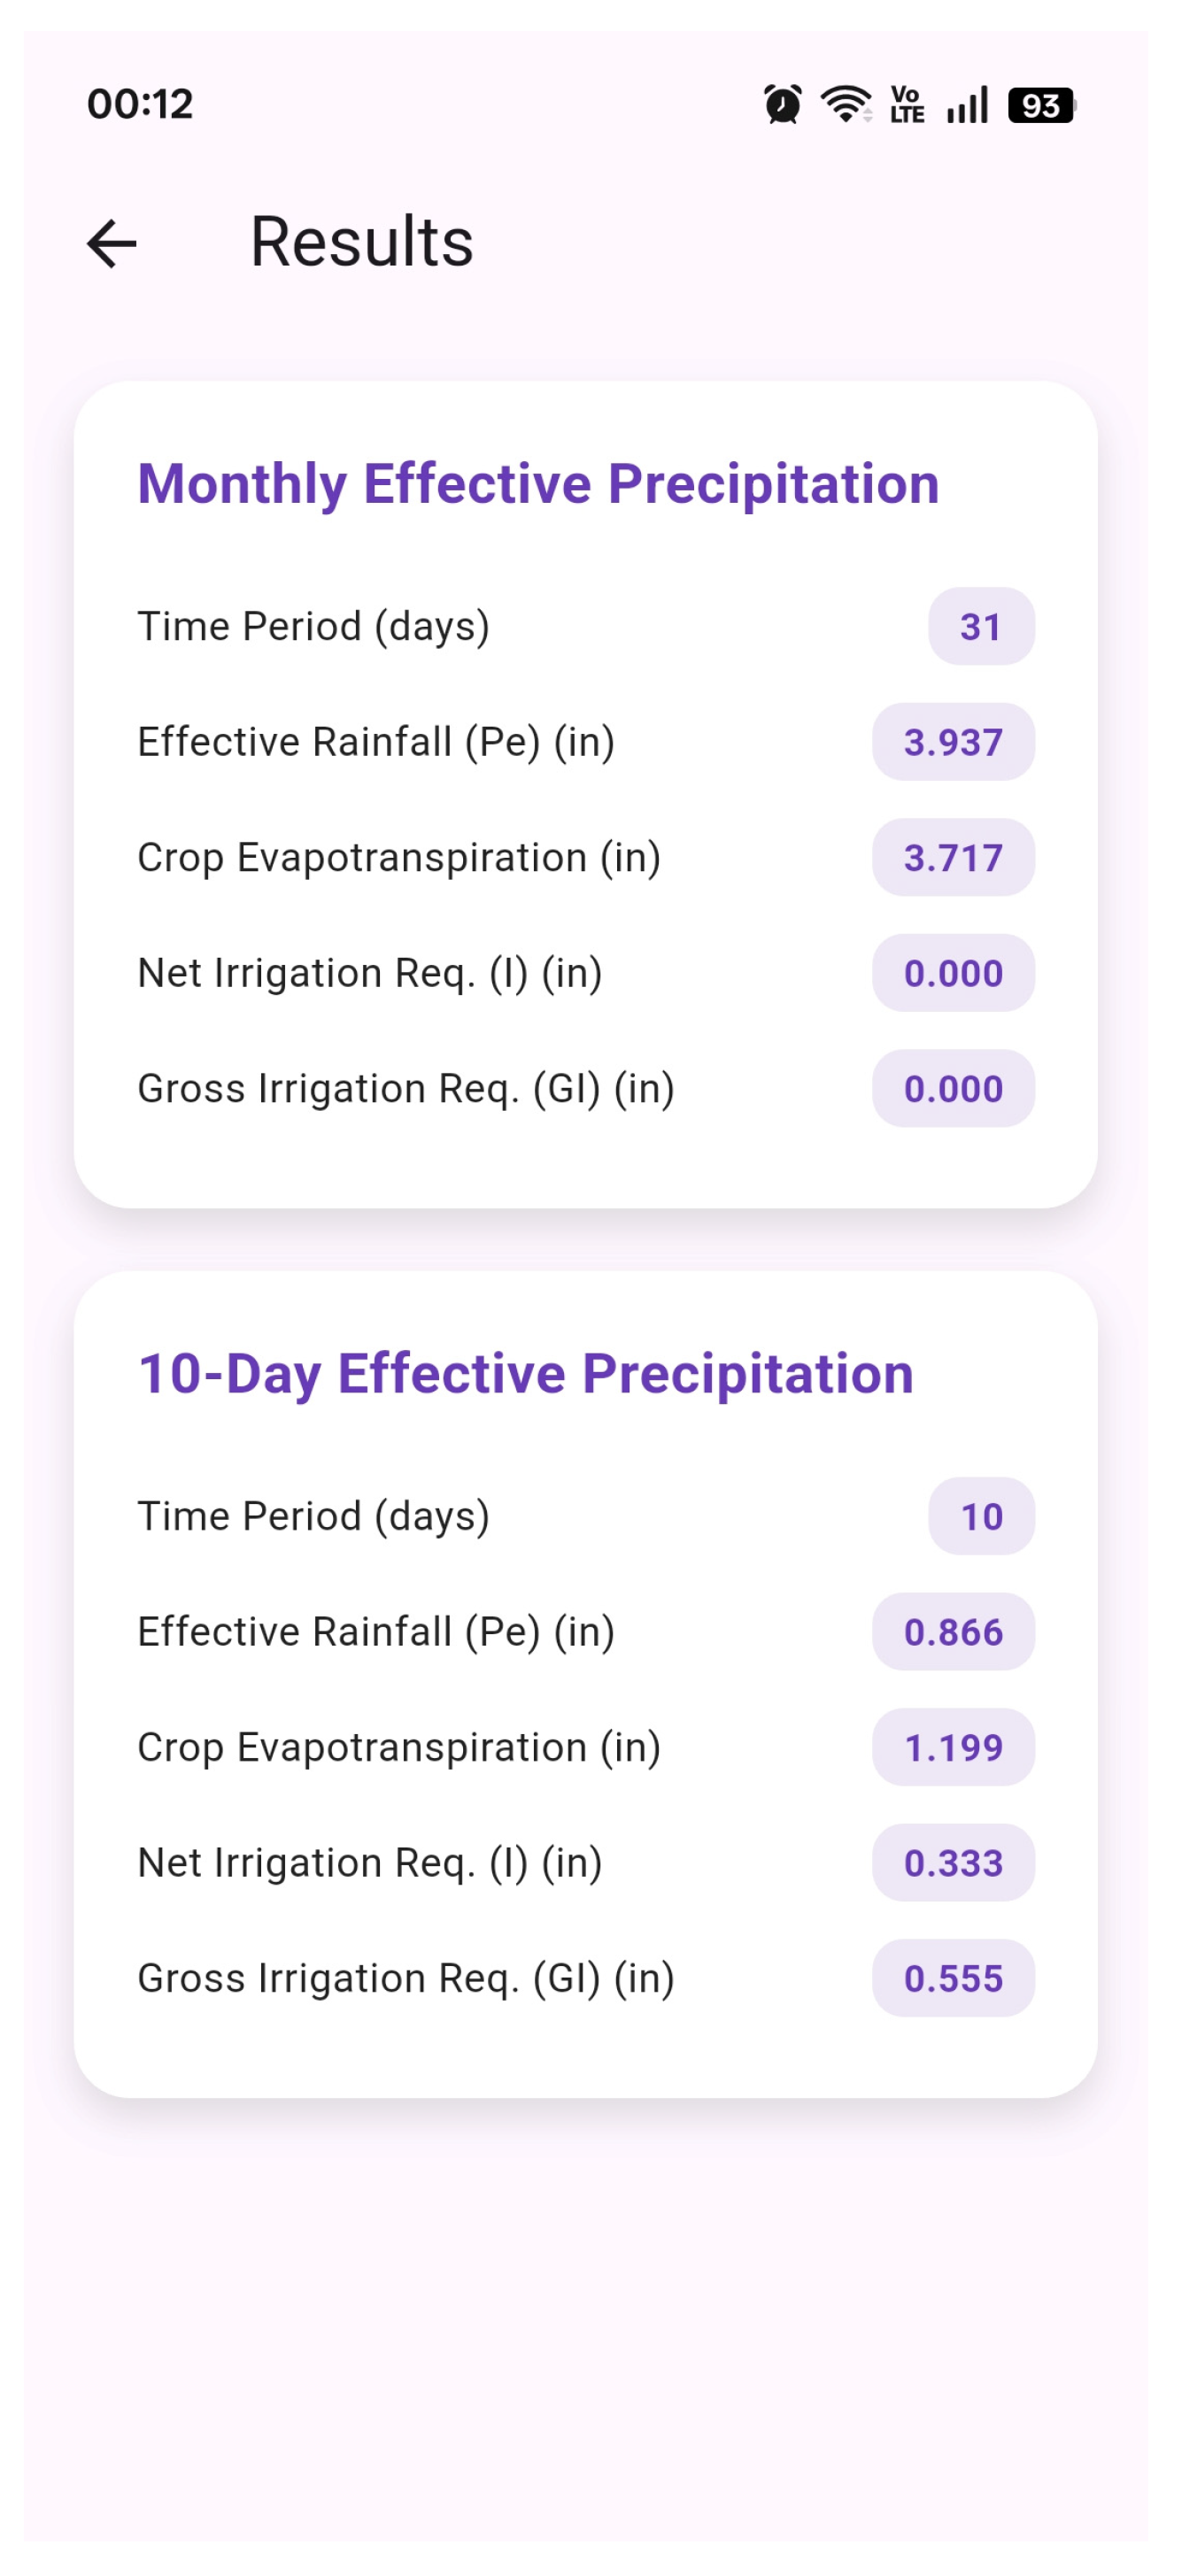
The app computes the Net Irrigation (
I) (
Figure 6) water requirement for the selected period (e.g., daily, weekly, 10-day, monthly) using the following formula:
where
I is the Net Irrigation (inches) requirement for the selected period
ETc is the crop evapotranspiration for the selected period (inches)
Pe is the Effective Rainfall for the selected period (inches)
The net irrigation requirement is the quantity of water remaining after accounting for water losses (
Figure 7). This leaves us with three scenarios.
Rainfall supplies all the water needed for crop growth; therefore, irrigation is not required.
All crop water needs must be met by irrigation (Pe is null).
Irrigation is needed to supplement the Effective Rainfall (Pe)
2.6. Gross Irrigation (GI) Water Requirements
Information on Irrigation Efficiency (
E) is needed to transform Net Irrigation (
I) into Gross Irrigation (
GI), which is the quantity of water to be applied for the period, considering inevitable water losses due to wind and evaporation. Those losses are taken into account via an Efficiency Ratio (
E).
E depends on the type of irrigation system [
4]. Overall Efficiency (
E) varies from 45% (surface) to 75% (sprinkler) to 90%. The user provides the sprinkler Efficiency Ratio (
E), and the app computes the Gross Irrigation (
GI) Requirements.
where
GI is the Gross Irrigation for the selected time period (inches)
I is the Net Irrigation for the selected time period (inches)
E is the Efficiency of the irrigation system (in %).
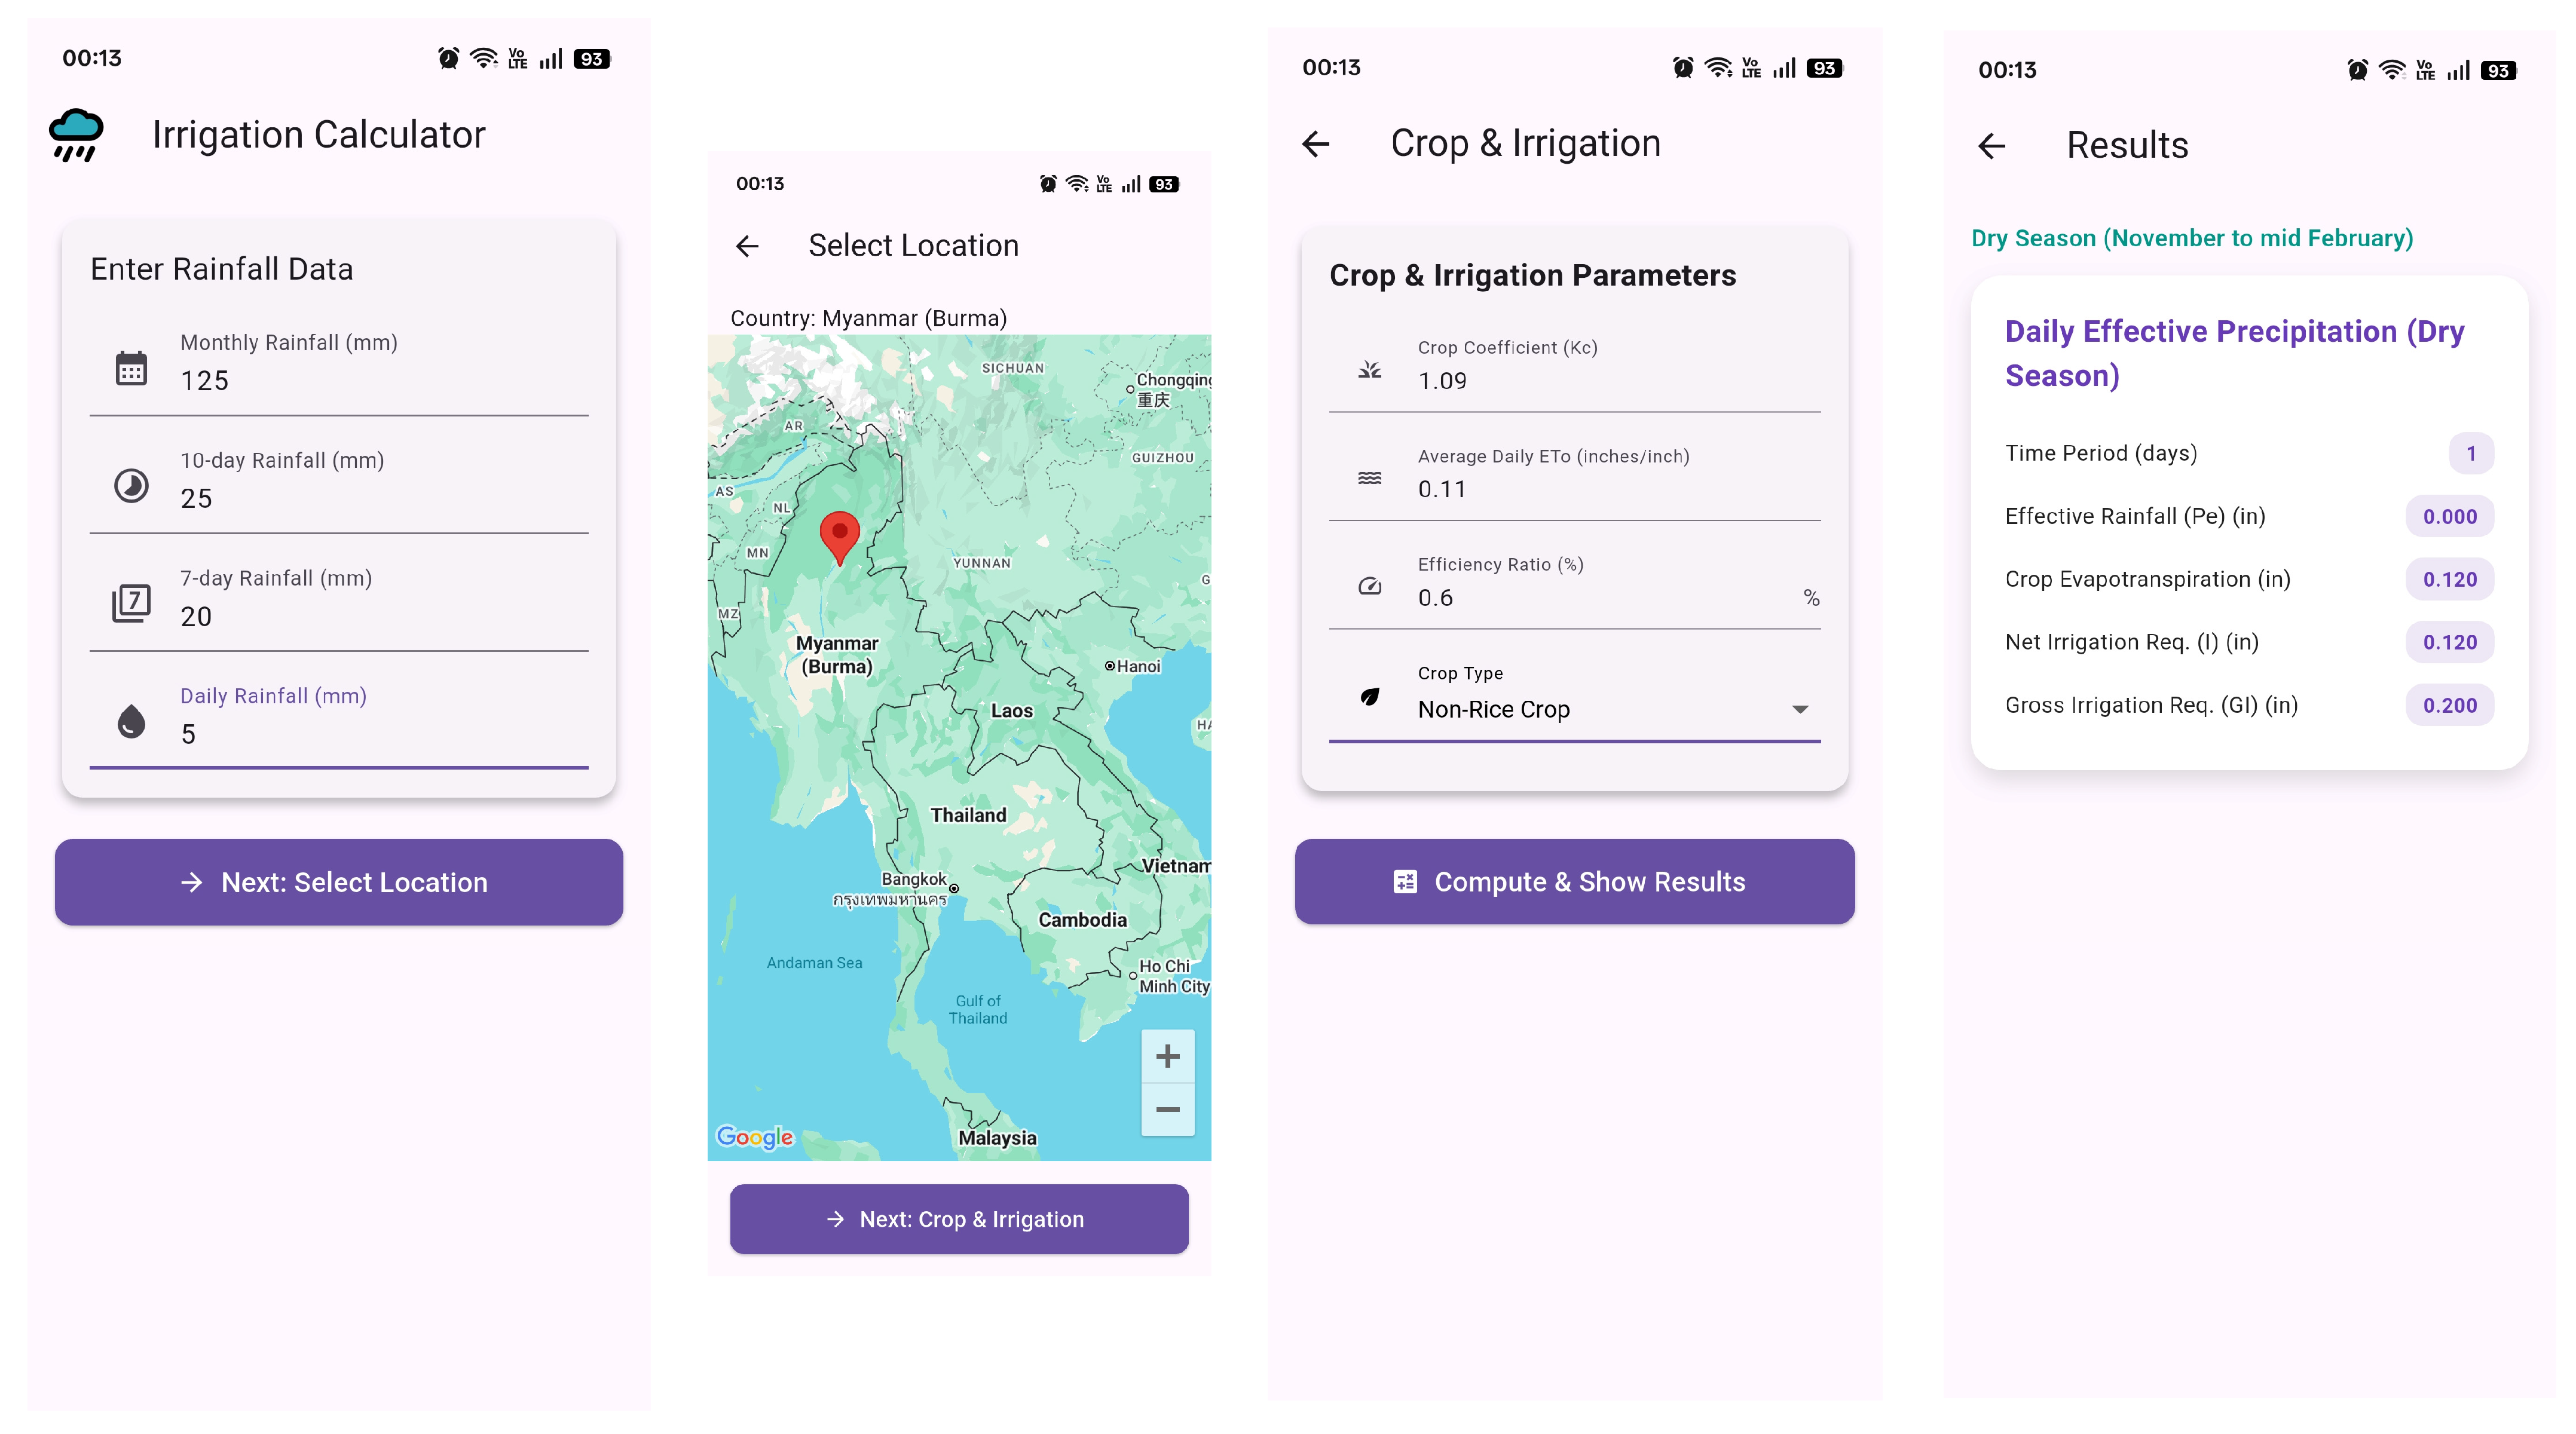
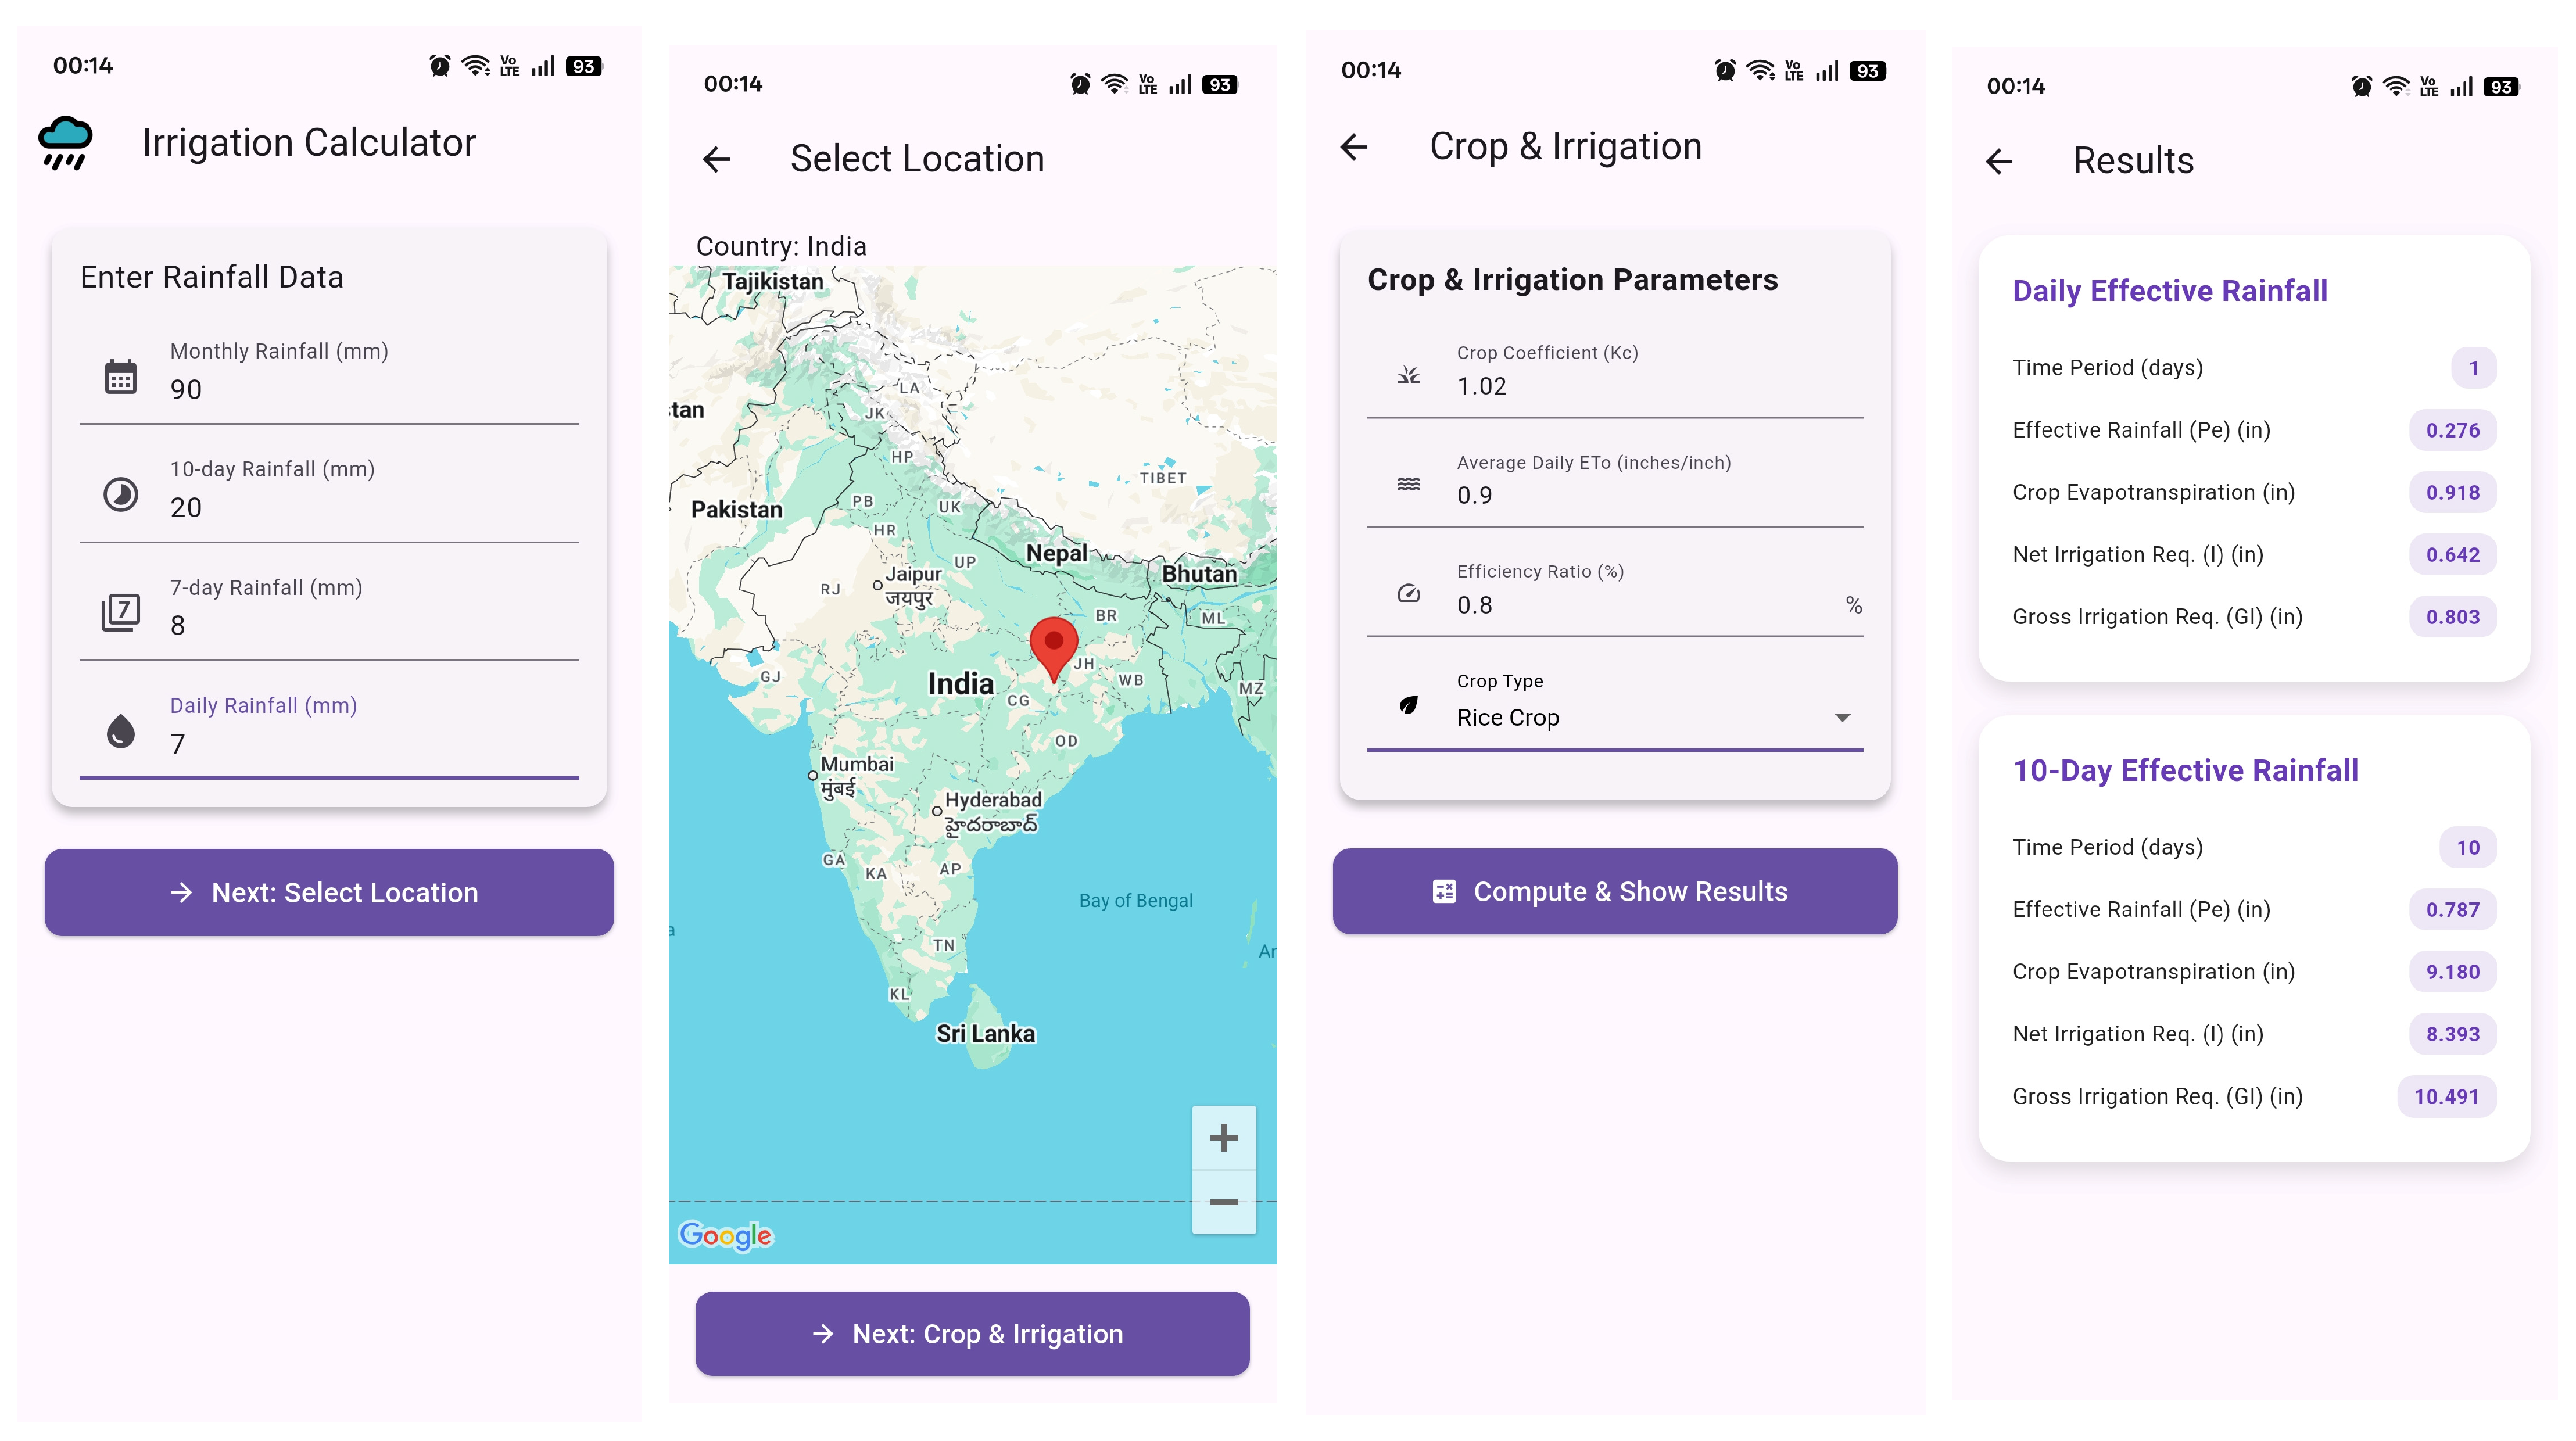
Here are two examples: one with Burma (non-rice crops) (
Figure 7) and another with India (rice crops) (
Figure 8), where the app computes the Effective Rainfall (
Pe) for selected periods and the Net (
I) and Gross Irrigation (
GI) Requirements for the corresponding time periods.
2.7. Model Validation
The performance of the smartphone-based irrigation application was evaluated through systematic comparison with FAO-CROPWAT 8.0, a widely accepted decision-support tool for crop water requirement estimation developed by USDA-ARS. Validation was carried out by applying similar climatic, crop, and irrigation scenarios in both tools to ensure methodological consistency. Meteorological data, including rainfall were retrieved from the NASA POWER database and applied uniformly in both the mobile application and CROPWAT. ETo was calculated using the FAO Penman–Monteith method. Pe in CROPWAT was estimated using the USDA-SCS method embedded within the software and the same method was adopted in the developed app. The same crop coefficients (Kc), growth stages, and irrigation efficiency values were consistently used in both platforms.
Model outputs were compared at monthly time scales for representative crops and locations. Validation performance was assessed by calculating percentage deviations between the application outputs and corresponding CROPWAT estimates and mean bias (%).
Agreement within ±5% was considered acceptable. This validation approach allowed the reliability and robustness of the application to be assessed.
3. Results and Discussion
The developed smartphone application was evaluated for its capability to compute Net Irrigation (I) and Gross Irrigation (GI) requirements using the Soil Water Balance method integrated with region-specific formulas for Effective Rainfall (Pe). Simulation trials were conducted across five agro-ecological regions in Asia: Central India, Southern Vietnam, Northern Thailand, Western Bangladesh, and Central Sri Lanka, using maize and rice as representative crops. Daily, decadal, and monthly time scales were tested to evaluate flexibility. The primary objective of this work was to explain the features and operational behavior of a smartphone-based irrigation scheduling application. The present mobile application includes an effective rainfall formula for eleven countries, but validation was conducted in five agro-climatic sites to demonstrate functionality across contrasting rainfall regions, evaporative demand, and cropping systems.
3.1. Regional Estimation of Irrigation Requirements
Results confirmed that the app accurately estimated ETc by multiplying user-supplied crop coefficients (Kc) with location-specific reference evapotranspiration (ETo). Effective Rainfall (Pe) varied significantly based on both geography and crop coefficient. For example, rice in Central India during the Kharif season required substantially higher irrigation (Net I ≈ 4.18 mm/day) due to intermittent rainfall and high evaporative demand. In contrast, Western Bangladesh, with reliable monsoonal rainfall, required only 1.4 mm/day of irrigation input during the same crop stage.
Meteorological inputs, including daily rainfall and other climatic parameters, were acquired from the NASA POWER (Prediction of Worldwide Energy Resources) database.
ETo was calculated using the FAO Penman–Monteith equation, a physical based method that explicitly represents the surface energy balance and aerodynamic factors governing the crop evapotranspiration. The NASA POWER database provides satellite-derived solar radiation data along with reanalysis-based meteorological variables such as air temperature, relative humidity, and wind speed. These input data were inserted within the FAO Penman–Monteith framework to compute ETo, ensuring that both radiative forcing and atmospheric demand were explicitly characterized rather than simplified through empirical assumptions. Crop coefficient (Kc) values were selected from FAO Irrigation and Drainage Paper No. 56 (Allen et al., 1998 [
4]) and supporting regional literature. The values correspond to the mid-season growth stage, which represents peak crop water demand and is commonly used for comparative irrigation analysis. Minor adjustments were made within FAO-recommended ranges to reflect humid tropical conditions where applicable
NASA POWER offers a globally consistent and satellite-derived meteorological dataset that has been widely validated for agro-hydrological applications. Although these datasets may not capture field-scale microclimatic variability, they provide sufficient accuracy for irrigation planning in data-scarce regions. Additional uncertainty may arise from user-supplied inputs such as crop coefficients and irrigation efficiency; however, these parameters are routinely employed in operational irrigation scheduling and can be refined through adopting standard reference values.
Simulations were conducted for five agroecological zones in South and Southeast Asia: Central India, Southern Vietnam, Northern Thailand, Western Bangladesh, and Central Sri Lanka. The gridded climate data from NASA POWER were extracted for representative coordinates within each region.
These meteorological inputs were used within the app to compute Effective Rainfall (Pe) through region-specific empirical equations, and subsequently to estimate Net and Gross Irrigation Requirements for selected crops and time scales (
Table 5).
These values illustrate the utility of incorporating location-specific Effective Rainfall (Pe) equations, without which irrigation would either be over-applied (leading to wastage and leaching) or under-applied (risking crop stress).
3.2. Influence of Rainfall Variability and Climate Anomalies
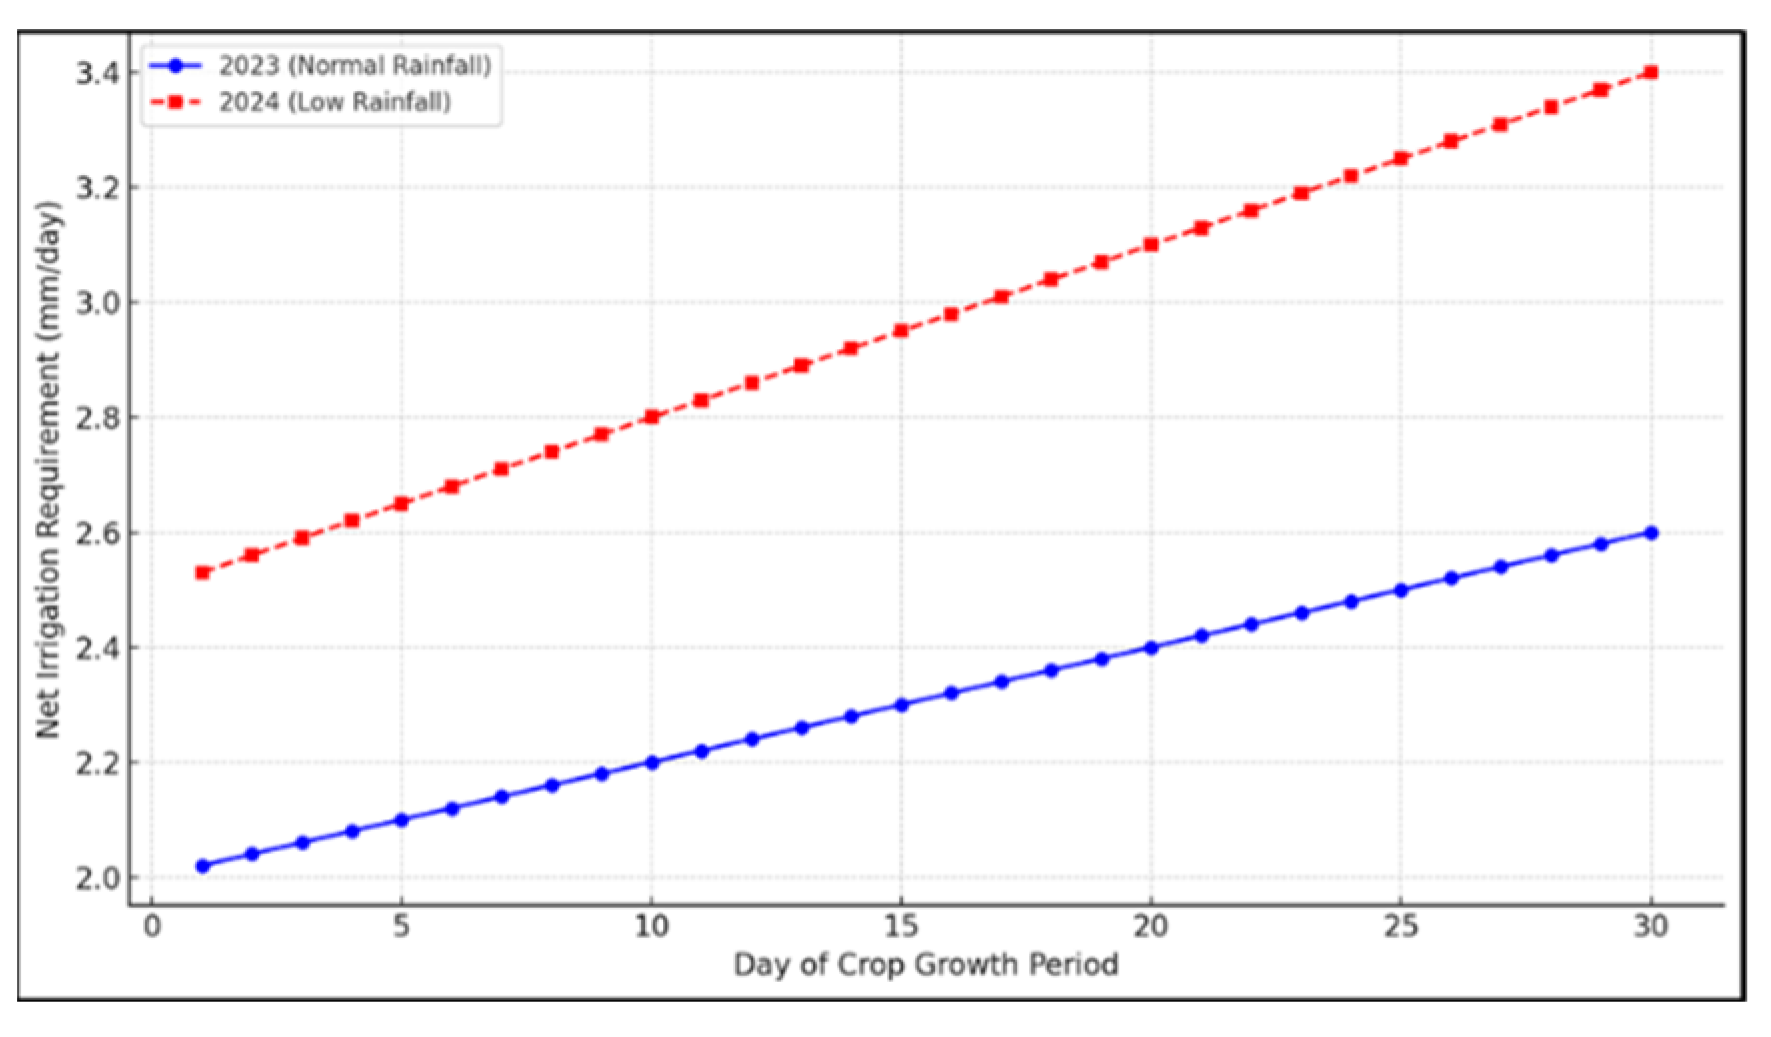
Inter-annual rainfall variability significantly impacted irrigation demand. In India (Madhya Pradesh region), a 23% reduction in early monsoon rainfall in 2024, compared to 2023, caused a 34% increase in net irrigation requirements. The app dynamically captured this trend using 10-day
Pe recalculations and highlighted the shortfall well in advance (
Figure 9).
This feature allows for adaptive planning in the face of climatic uncertainty critical for rainfed and semi-irrigated systems. Notably, the app’s Pe recalculation mechanism prevented overestimation in high-rainfall periods and adjusted irrigation targets efficiently in low-rainfall years.
3.3. Comparison of the Developed App with FAO-CROPWAT Software
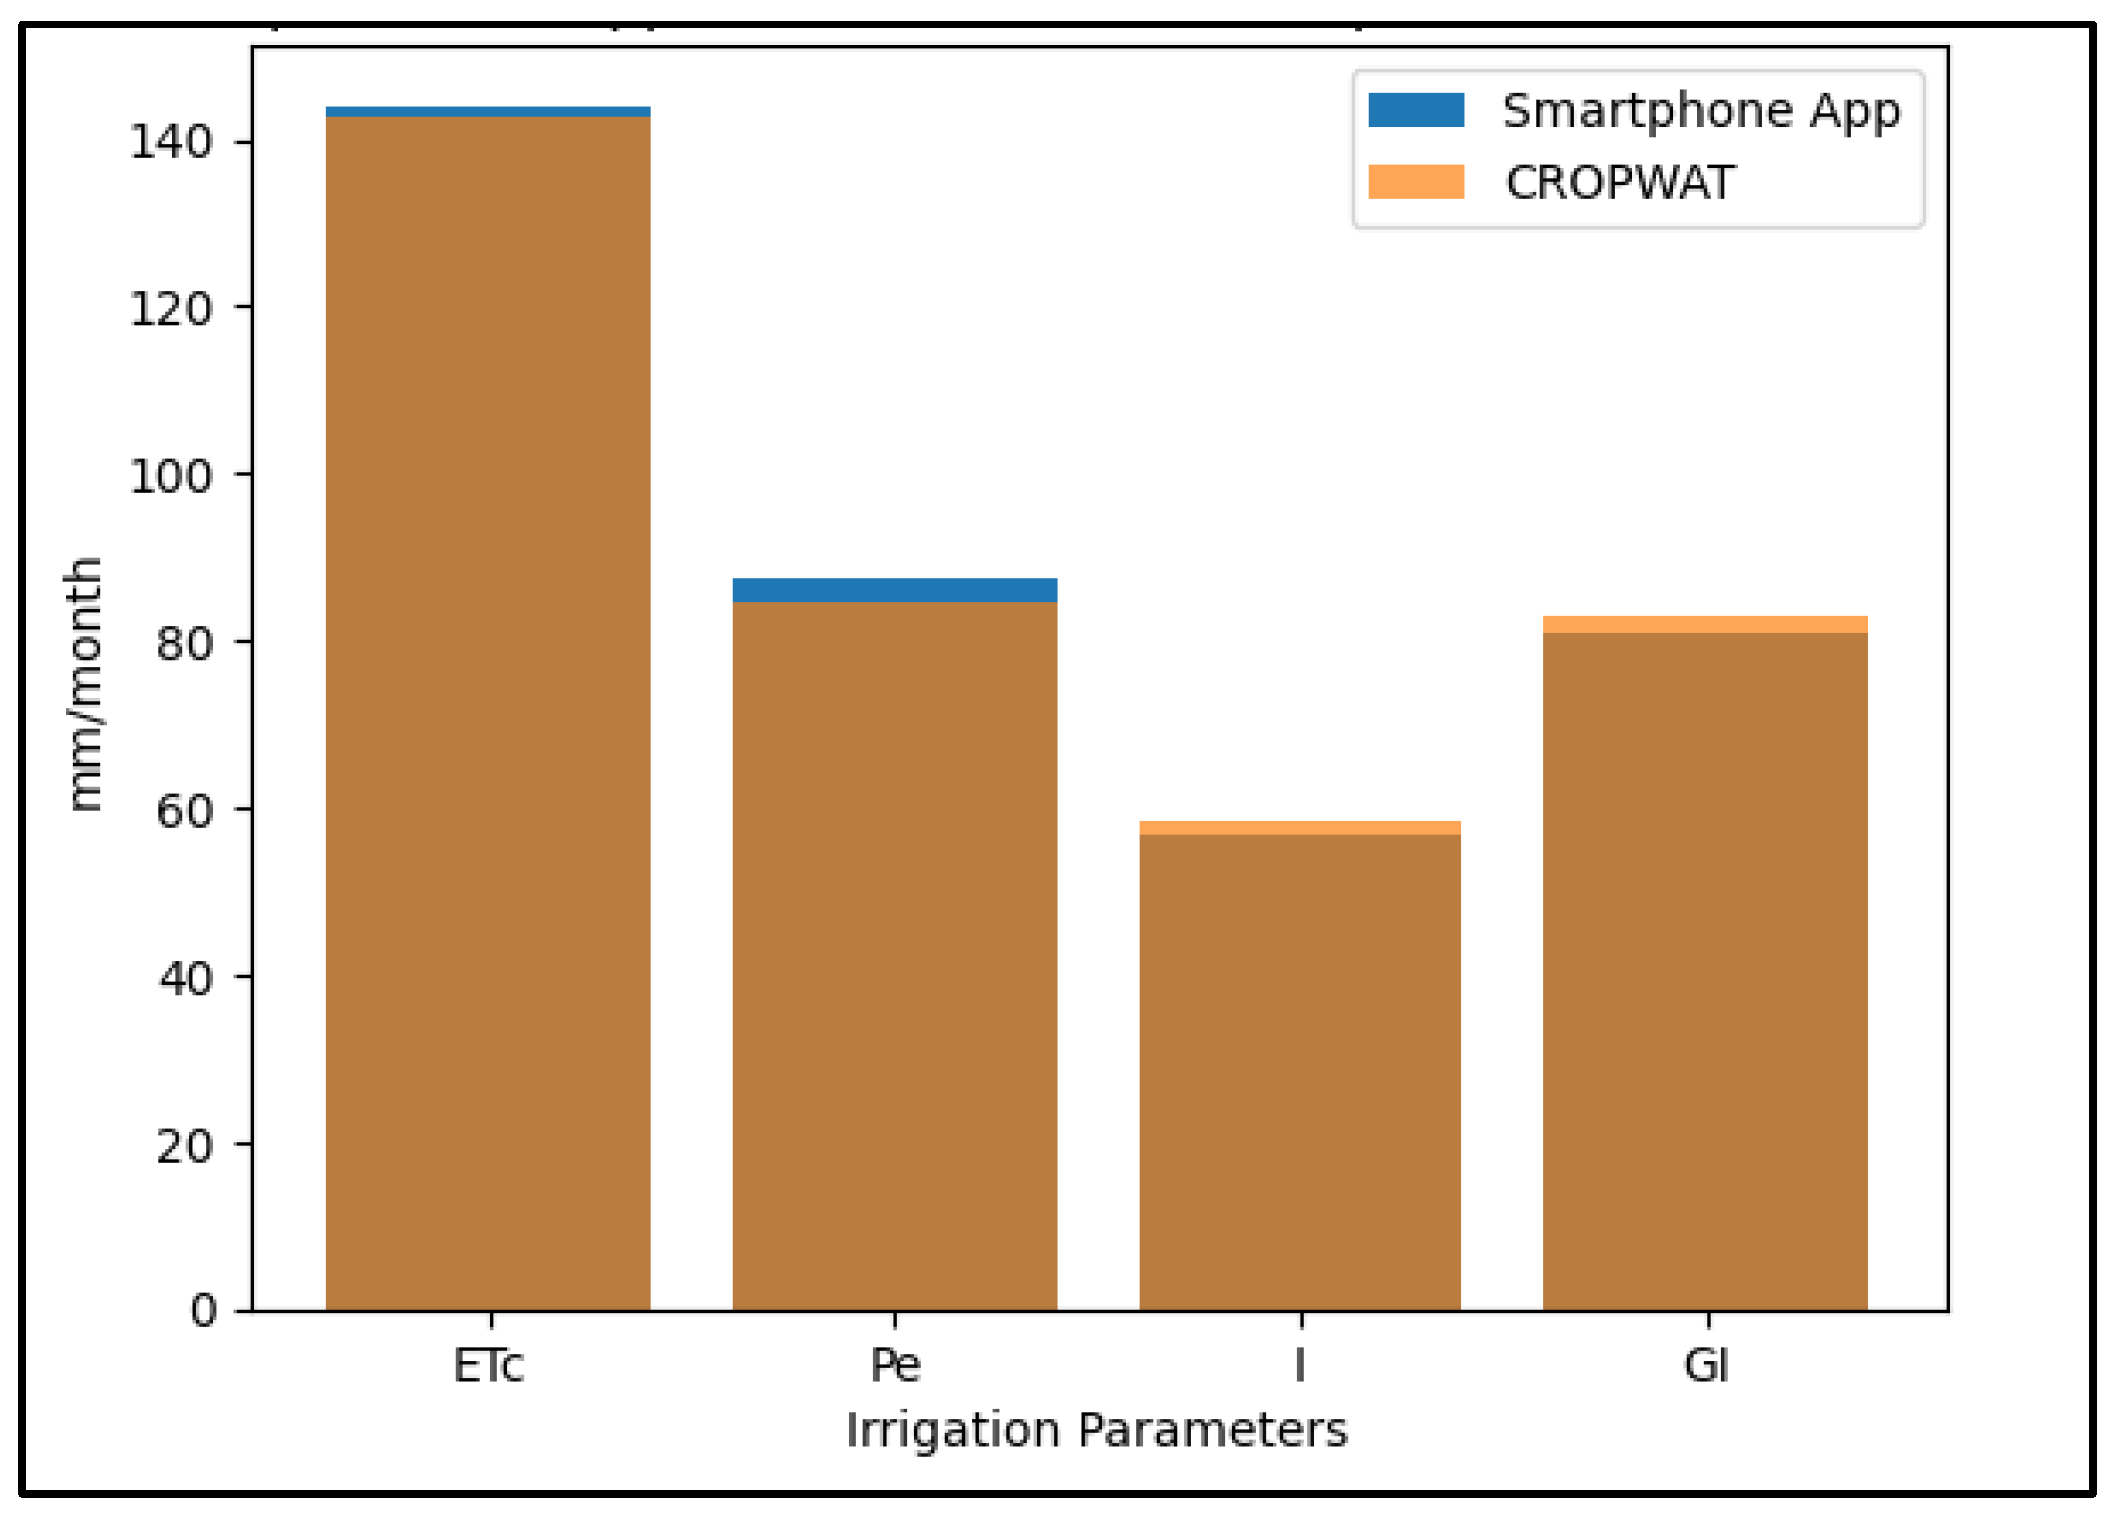
The performance of the smartphone-based irrigation application was evaluated by comparing its outputs with those of FAO CROPWAT 8.0 across representative crops, locations, and monthly time scales. Using harmonized climatic, crop, and irrigation inputs, the application produced irrigation estimates that closely matched those generated by CROPWAT. Across all validation scenarios, deviations between the two models for
Pe,
ETc,
I, and
GI) remained within ±5% (
Table 6), indicating strong agreement between the model and application.
ETc showed the highest level of agreement, whereas small differences in effective rainfall propagated proportionally into net and gross irrigation requirements.
Given the deterministic nature of both tools, performance was evaluated using percentage deviation and mean bias. The level of agreement observed confirms the reliability of the proposed application for operational irrigation planning. Mean bias values were consistently low across all parameters, indicating no systematic over- or underestimation relative to CROPWAT.
These findings support the app’s suitability for field-level irrigation planning where desktop-based tools like CROPWAT are not feasible due to lack of infrastructure or technical skills.
The results have shown that the developed smartphone application produces irrigation estimates consistent with FAO-CROPWAT while offering greater operational flexibility for field-level decision-making. Agreement between the two tools was greatest for crop evapotranspiration. Minor deviations observed in effective rainfall and subsequent irrigation requirements can be attributed primarily to differences in empirical rainfall formulations and temporal aggregation rather than evapotranspiration estimation. This performance is consistent with findings reported in other irrigation decision-support tools such as SmartIrrigation and Riego Berry, where
P identified as a major source of variability [
17,
23]. Although validation was carried out using a limited set of test sites, the primary objective of this work was to demonstrate and evaluate the functional performance of the application rather than to perform exhaustive regional calibration. Similar stepwise validation strategies have been widely used in the development of irrigation decision-support applications, where initial benchmarking is followed by broader deployment and subsequent refinement. The sensitivity of the irrigation estimates to crop coefficients and rainfall variability underscores the importance of selecting context-appropriate parameters. In particular, variations in
Kc and
P were found to have the highest influence on net irrigation requirements, in line with established FAO-based irrigation modeling principles (
Figure 10).
4. Practical Utility and Limitations
The developed mobile application offers a practical and user-oriented decision-support tool for irrigation planning and execution across diverse agro-climatic settings in South and Southeast Asia. A key strength of application is its ability to combine the soil water balance (SWB) approach with region-specific empirical methods for estimating effective rainfall, allowing farmers and practitioners to calculate net and gross irrigation needs at daily, 10-day, or monthly intervals. This flexibility enables farmers, extension workers, and irrigation planners to adjust water application practices based on crop type, growth stage, prevailing rainfall conditions, and the efficiency of the irrigation system. The application is designed to reduce technical complexity by requiring only a small set of inputs that are either pre-defined within the system or readily available to users. The app may underperform under certain conditions, including sloped terrain, which causes higher runoff, and extreme rainfall, which leads to deep percolation. Basic details such as crop type, crop growth stage, and irrigation system characteristics are generally familiar to farmers and extension workers, while crop coefficient (Kc) values can be obtained from built-in reference tables or through advisory support. As a result, the developed app can be efficiently used by smallholder farmers with limited technical background, especially when supported by extension workers, non-governmental organizations, or technology dissemination initiatives. Beyond farmers, the developed application is also useful for government organizations, private agencies involved in developing irrigation planning, command area development, water budgeting, and drought mitigation. Despite these advantages, certain limitations must be acknowledged. The output accuracy is closely linked to the user-provided inputs, particularly crop coefficients and irrigation efficiency values, which may contain errors when supplied by non-specialist users. Similarly, the effective rainfall formulas are empirical and may not adequately represent the localized hydrological conditions, including extreme rainfall events, ground water contribution, soil crusting, presence of hard pan or site-specific runoff behavior. The current operation is therefore most suited to flat or gently sloping irrigated fields, where surface runoff and deep percolation are limited, its performance may decline in sloping terrain or highly permeable soils where these processes are more pronounced.
Although the developed application includes country-specific formulations for eleven countries, validation in the present study was confined to limited representative locations to demonstrate functionality over diverse climatic conditions. In addition, meteorological database obtained from NASA POWER ensure spatial consistency but may not capture field-scale microclimatic variability.
The present validation primarily focuses on consistency with FAO-CROPWAT output rather than on formal quantification. Future development will therefore aim to incorporate sensitivity and uncertainty analyses, expand field-based validation efforts, and enhance automation through integration of real-time weather data, and soil moisture sensor data. Additional improvements, such as development of default crop libraries, inclusion of localized practices, and multilingual user interfaces, are expected to further strengthen the usability and output in subsequent versions of the application.
5. Conclusions
This study demonstrates how well-established principles of irrigation science can be effectively translated into a functional, low-complexity irrigation decision-support tool. The primary contribution lies in integrating soil water balance framework with region-specific effective rainfall formulations for operationalizing proven irrigation principles into a smartphone-based application. The developed application is accessible, transparent, and usable to data-limited agricultural environment. The results show that when driven by harmonized inputs, the application generates irrigation estimates consistent with FAO-CROPWAT, thereby supporting the validity of its computational methodology. Moreover, the findings suggest that irrigation decision support tools do not necessarily depend on complex calibration procedures, provided that physical models are combined with context-specific empirical knowledge. This underscores the value of simplified, process-oriented tools as a practical link between academic irrigation models and real-world, farm-level decision-making. The conclusions reported here are based on benchmarking against FAO-CROPWAT using pre-defined climatic inputs and representative case studies. Features such as integration of real-time weather data and field soil moisture data and expanded regional calibration should be regarded as prospective enhancements rather than performance criteria. This study demonstrates the feasibility of developing a scalable irrigation planning application that maintains scientific robustness while remaining practical for real-world use. By clearly distinguishing what has been validated from what is proposed for future development, the work provides a solid, transparent basis for further testing, refinement, and eventual wider adoption by local NGOs and civil servants responsible for water policies. Further research streams include integration of real-time meteorological data (e.g., from APIs of global services like NASA POWER, ECMWF, or local weather networks) and soil moisture data from sensors in the field; extending the app to a broader range of countries, soil types, and cropping systems; taking into consideration runoff and deep percolation; and conducting field studies with the agribusiness sector, NGOs, and policymakers.