Spatial Distribution Characteristics and Influencing Factors of High-Grade Tourism Resources in Henan Province, China


Abstract
1. Introduction
2. Literature Review
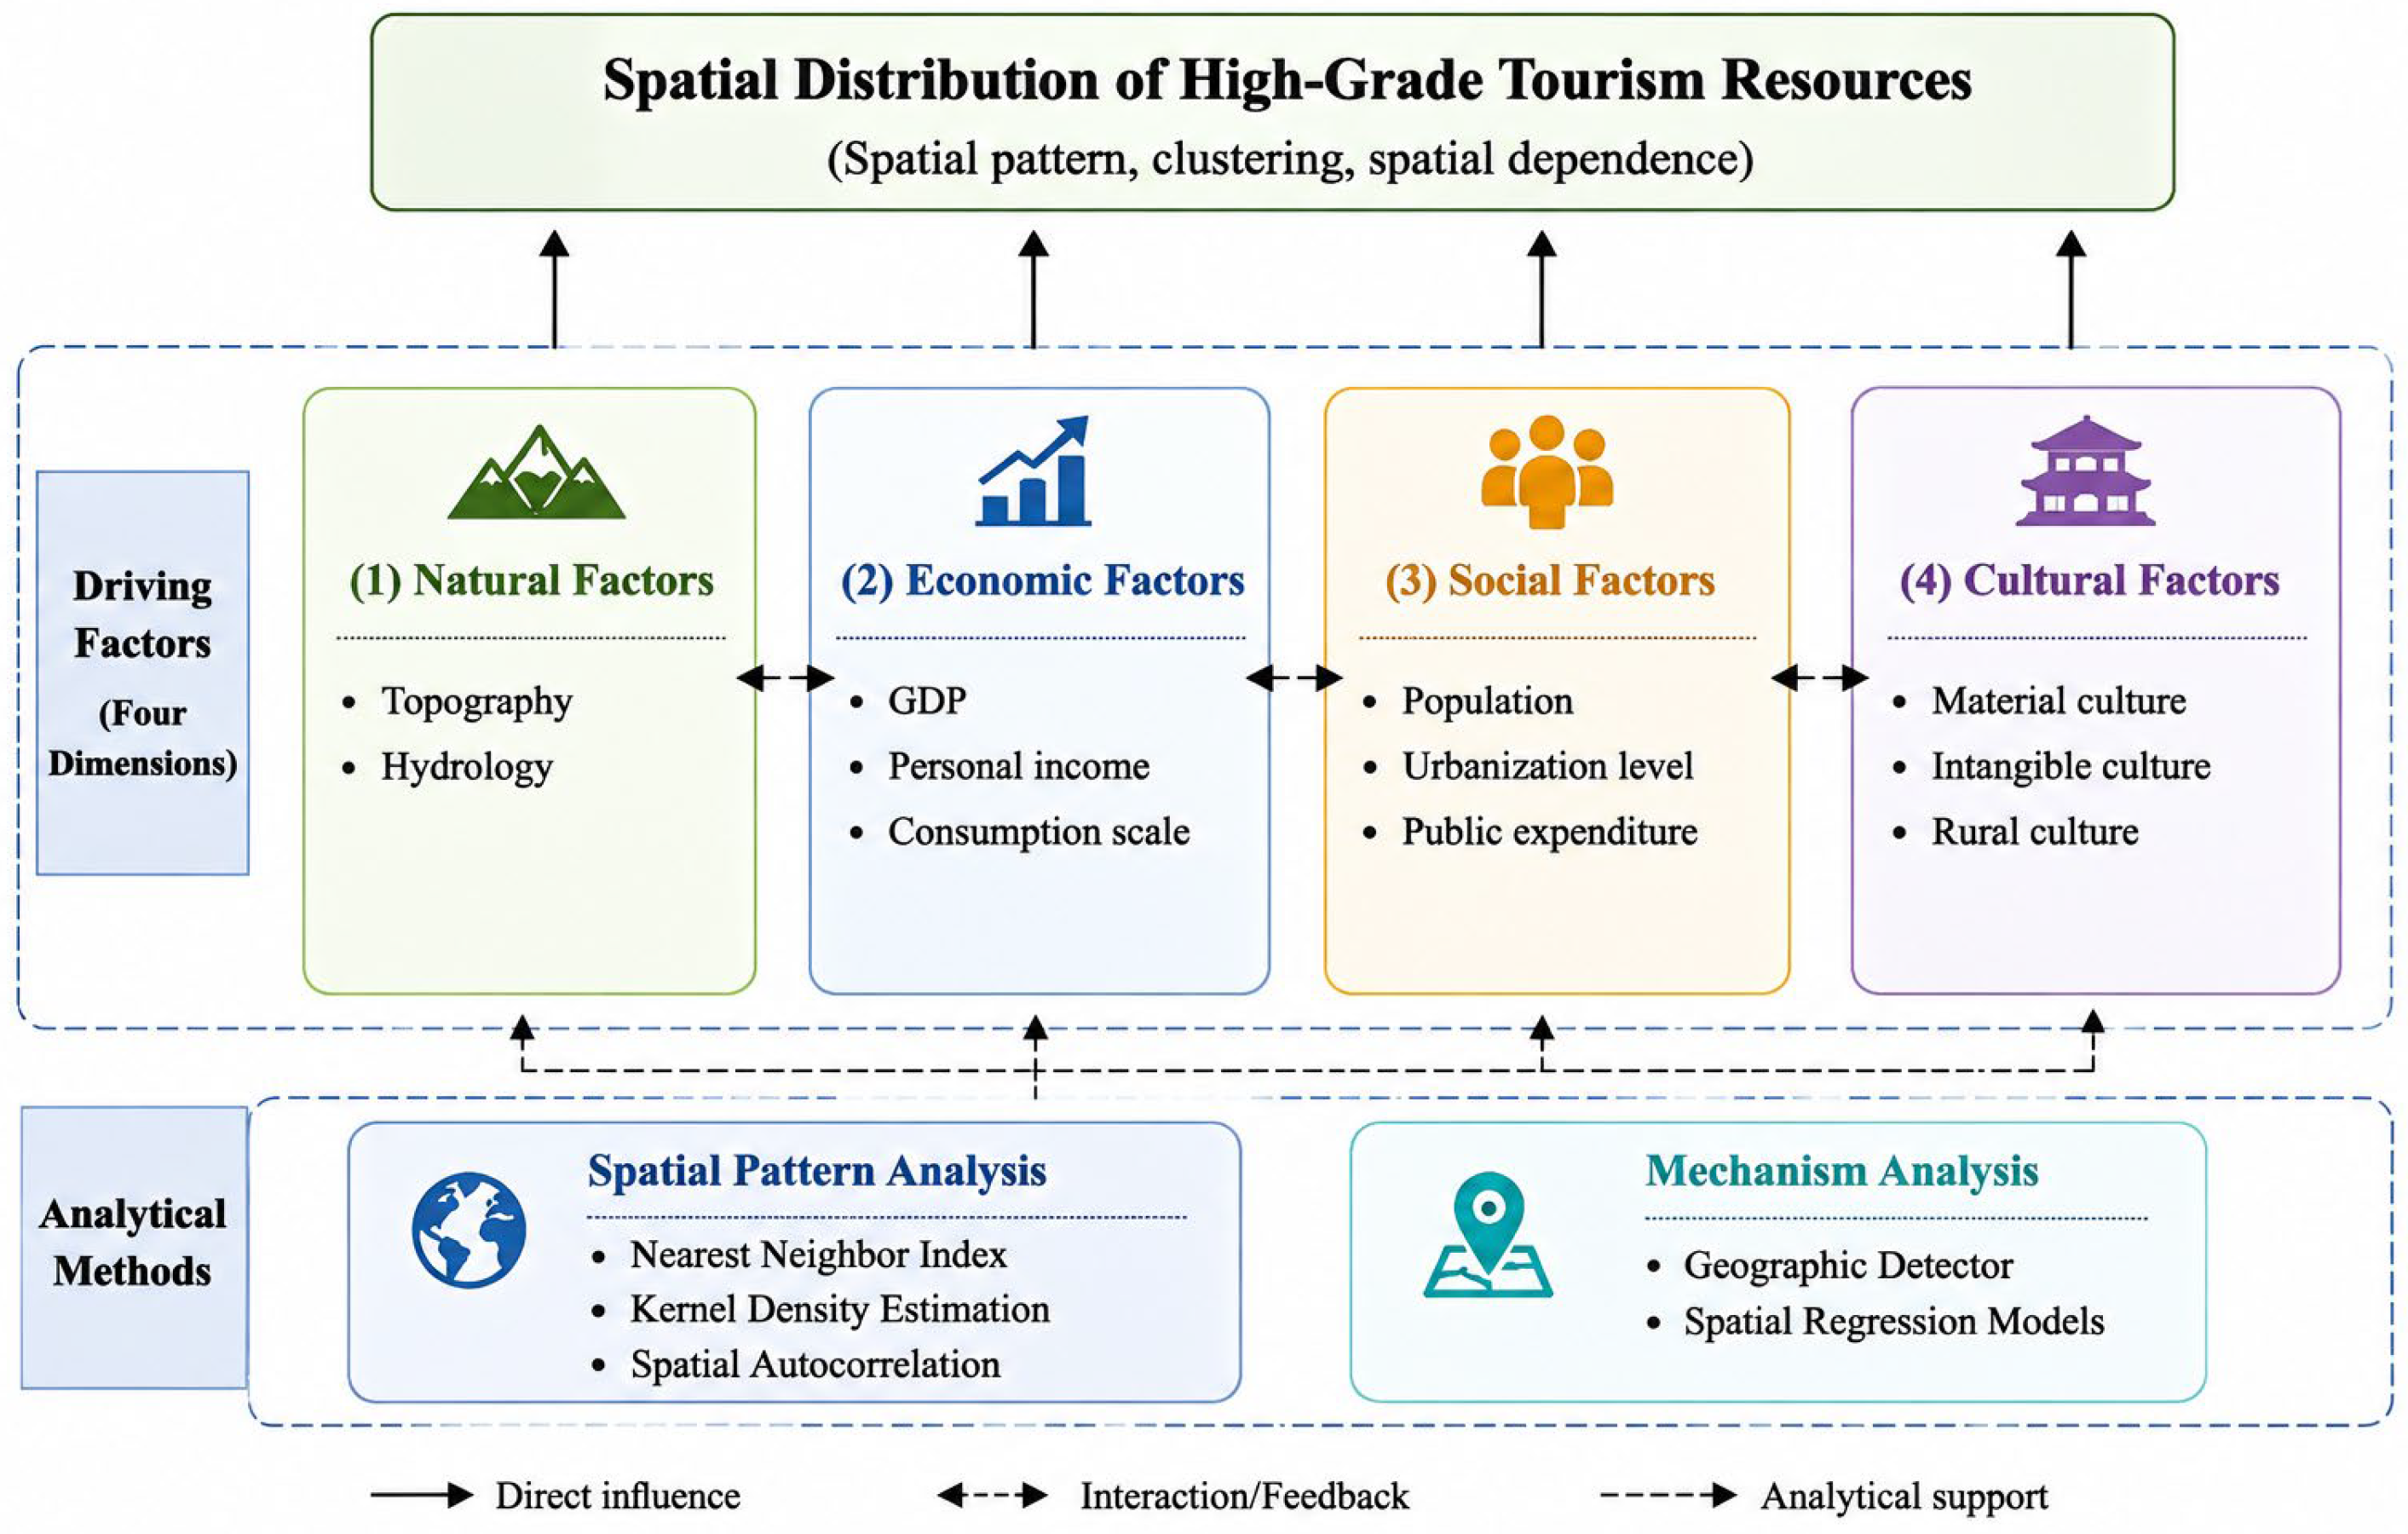
3. Analytical Framework
3.1. Natural Factors
3.2. Economic Factors
3.3. Social Factors
3.4. Cultural Factors
4. Research Methods and Data
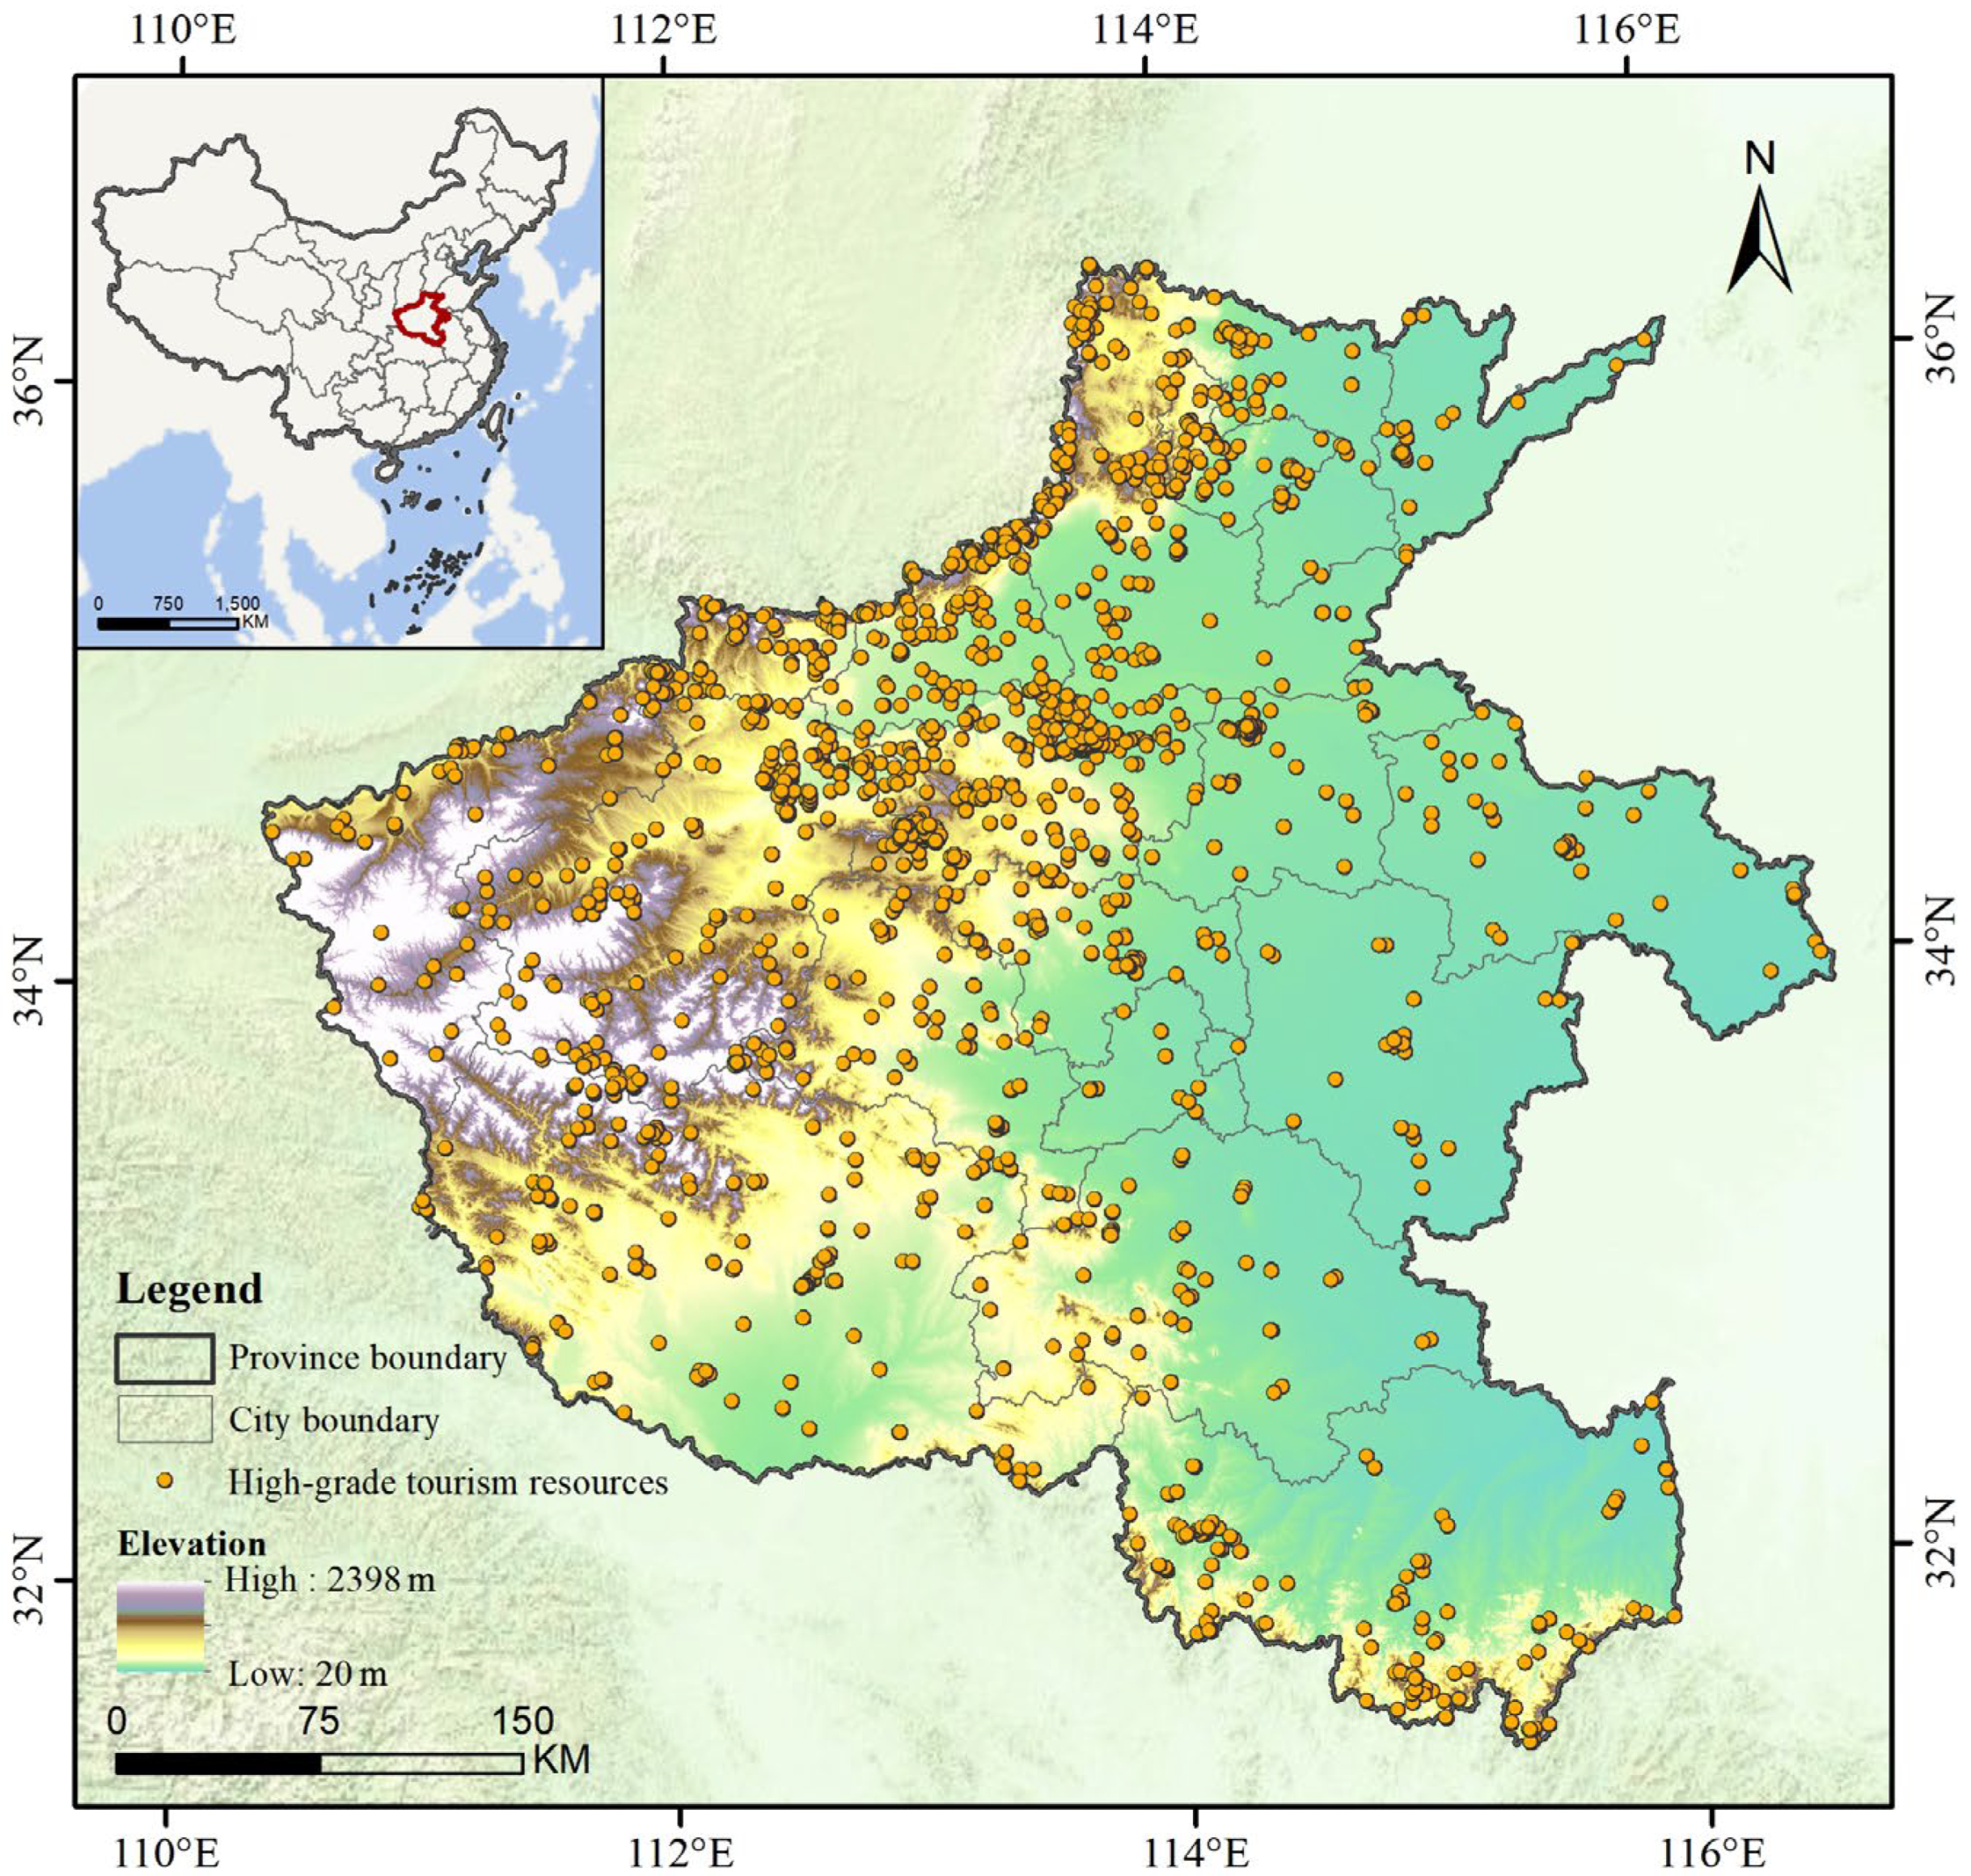
4.1. Study Area
4.2. Data Sources
4.2.1. Tourism Resource Data
4.2.2. Influencing Factor Data
4.2.3. Data Quality and Limitations
4.3. Analytical Methods
4.3.1. Nearest Neighbor Index
4.3.2. Kernel Density Estimation
4.3.3. Spatial Autocorrelation Analysis
4.3.4. GeoDetector
4.3.5. Spatial Error Model
5. Results
5.1. Spatial Distribution Characteristics of High-Grade Tourism Resources
5.1.1. Overall Spatial Aggregation
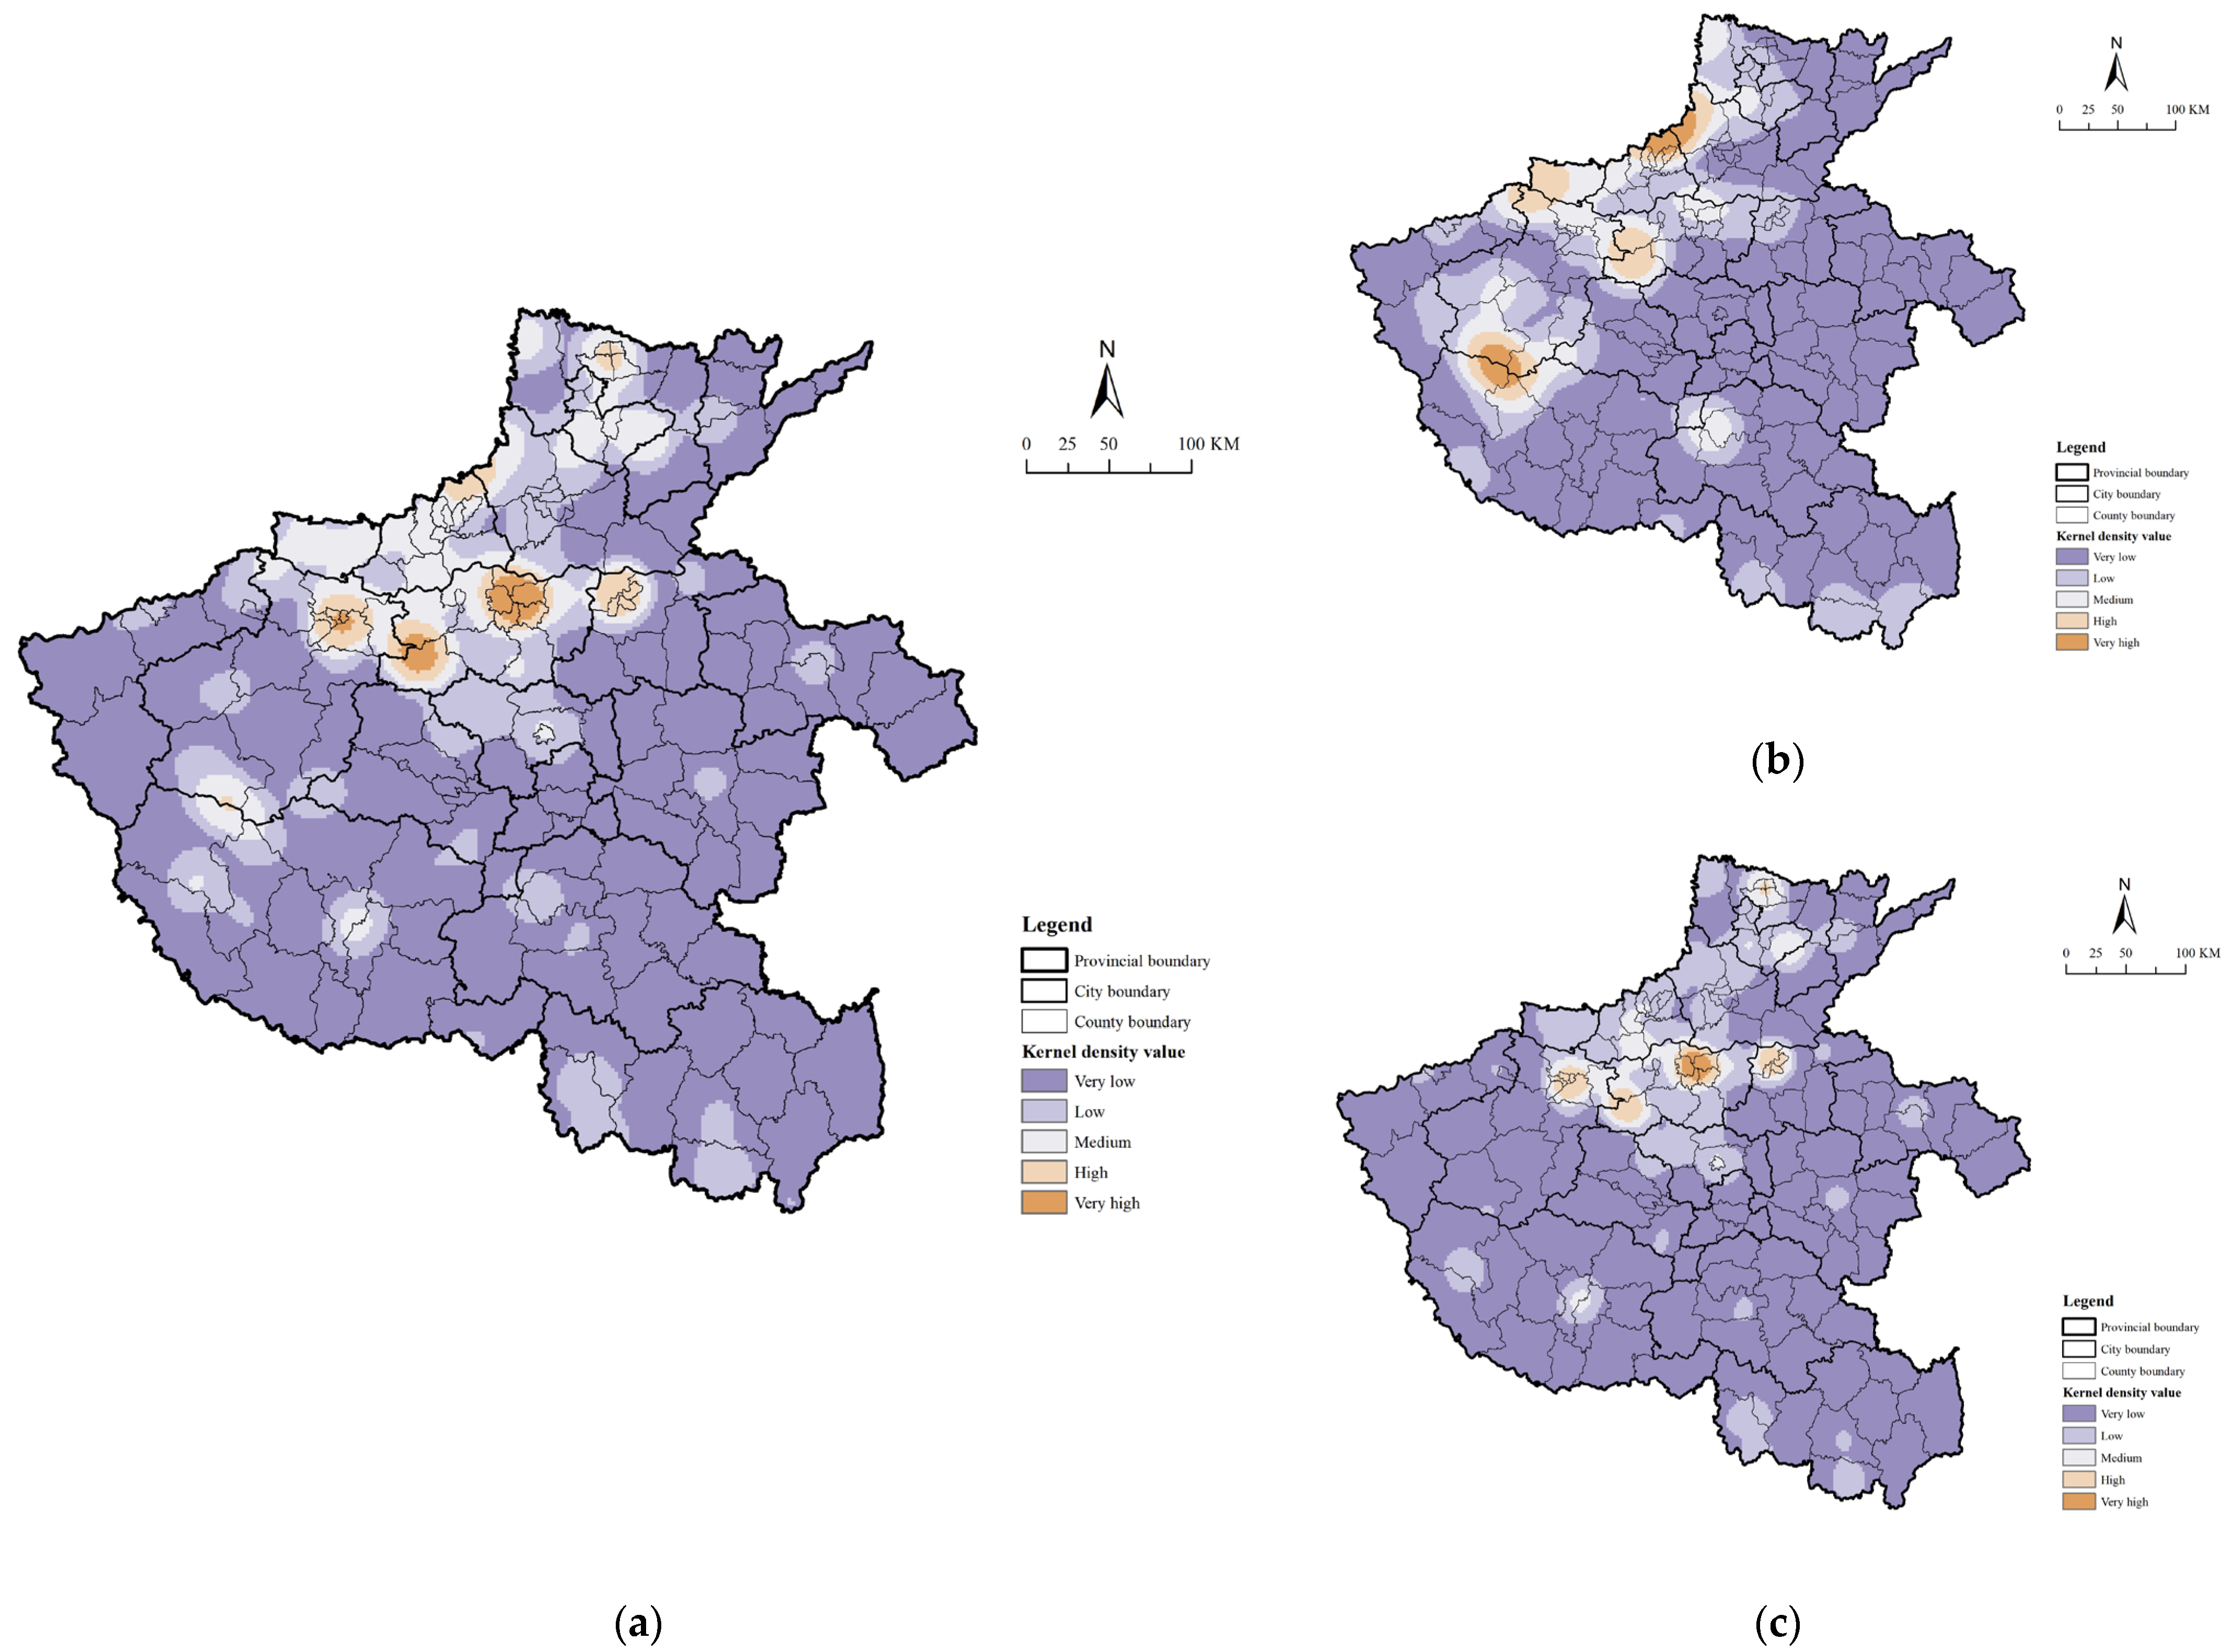
5.1.2. Density Structure and Spatial Heterogeneity
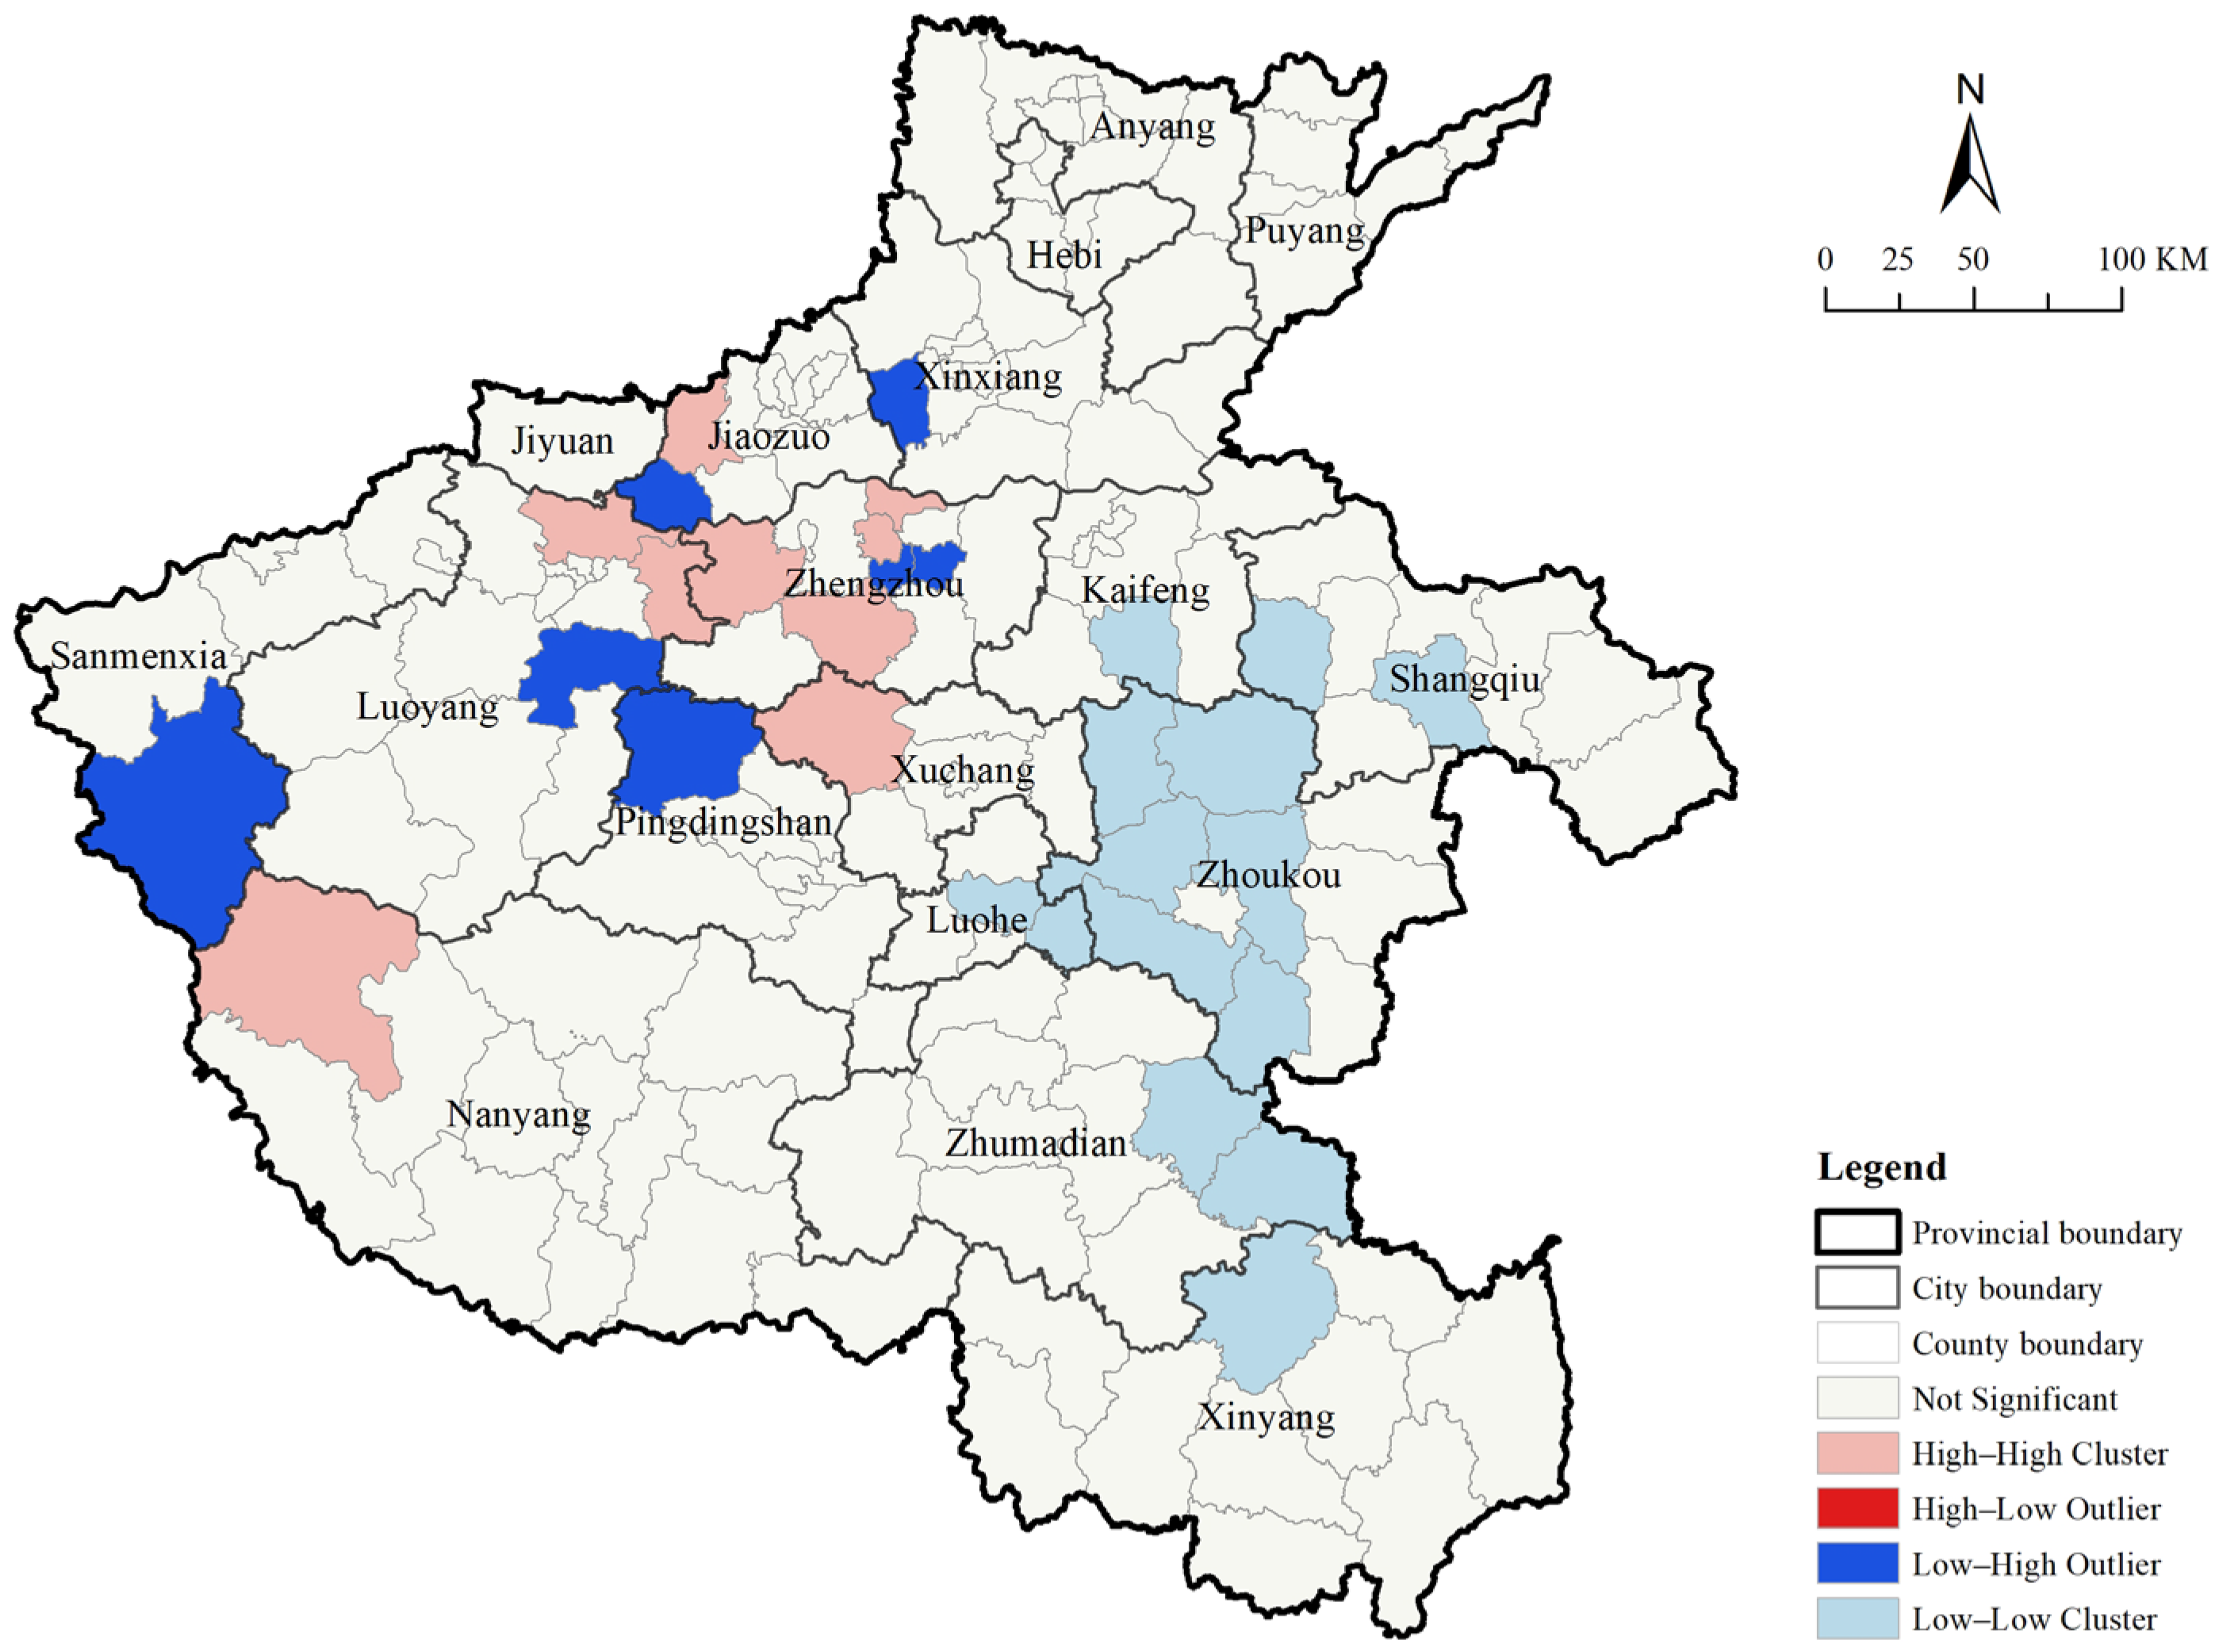
5.1.3. Spatial Autocorrelation Analysis
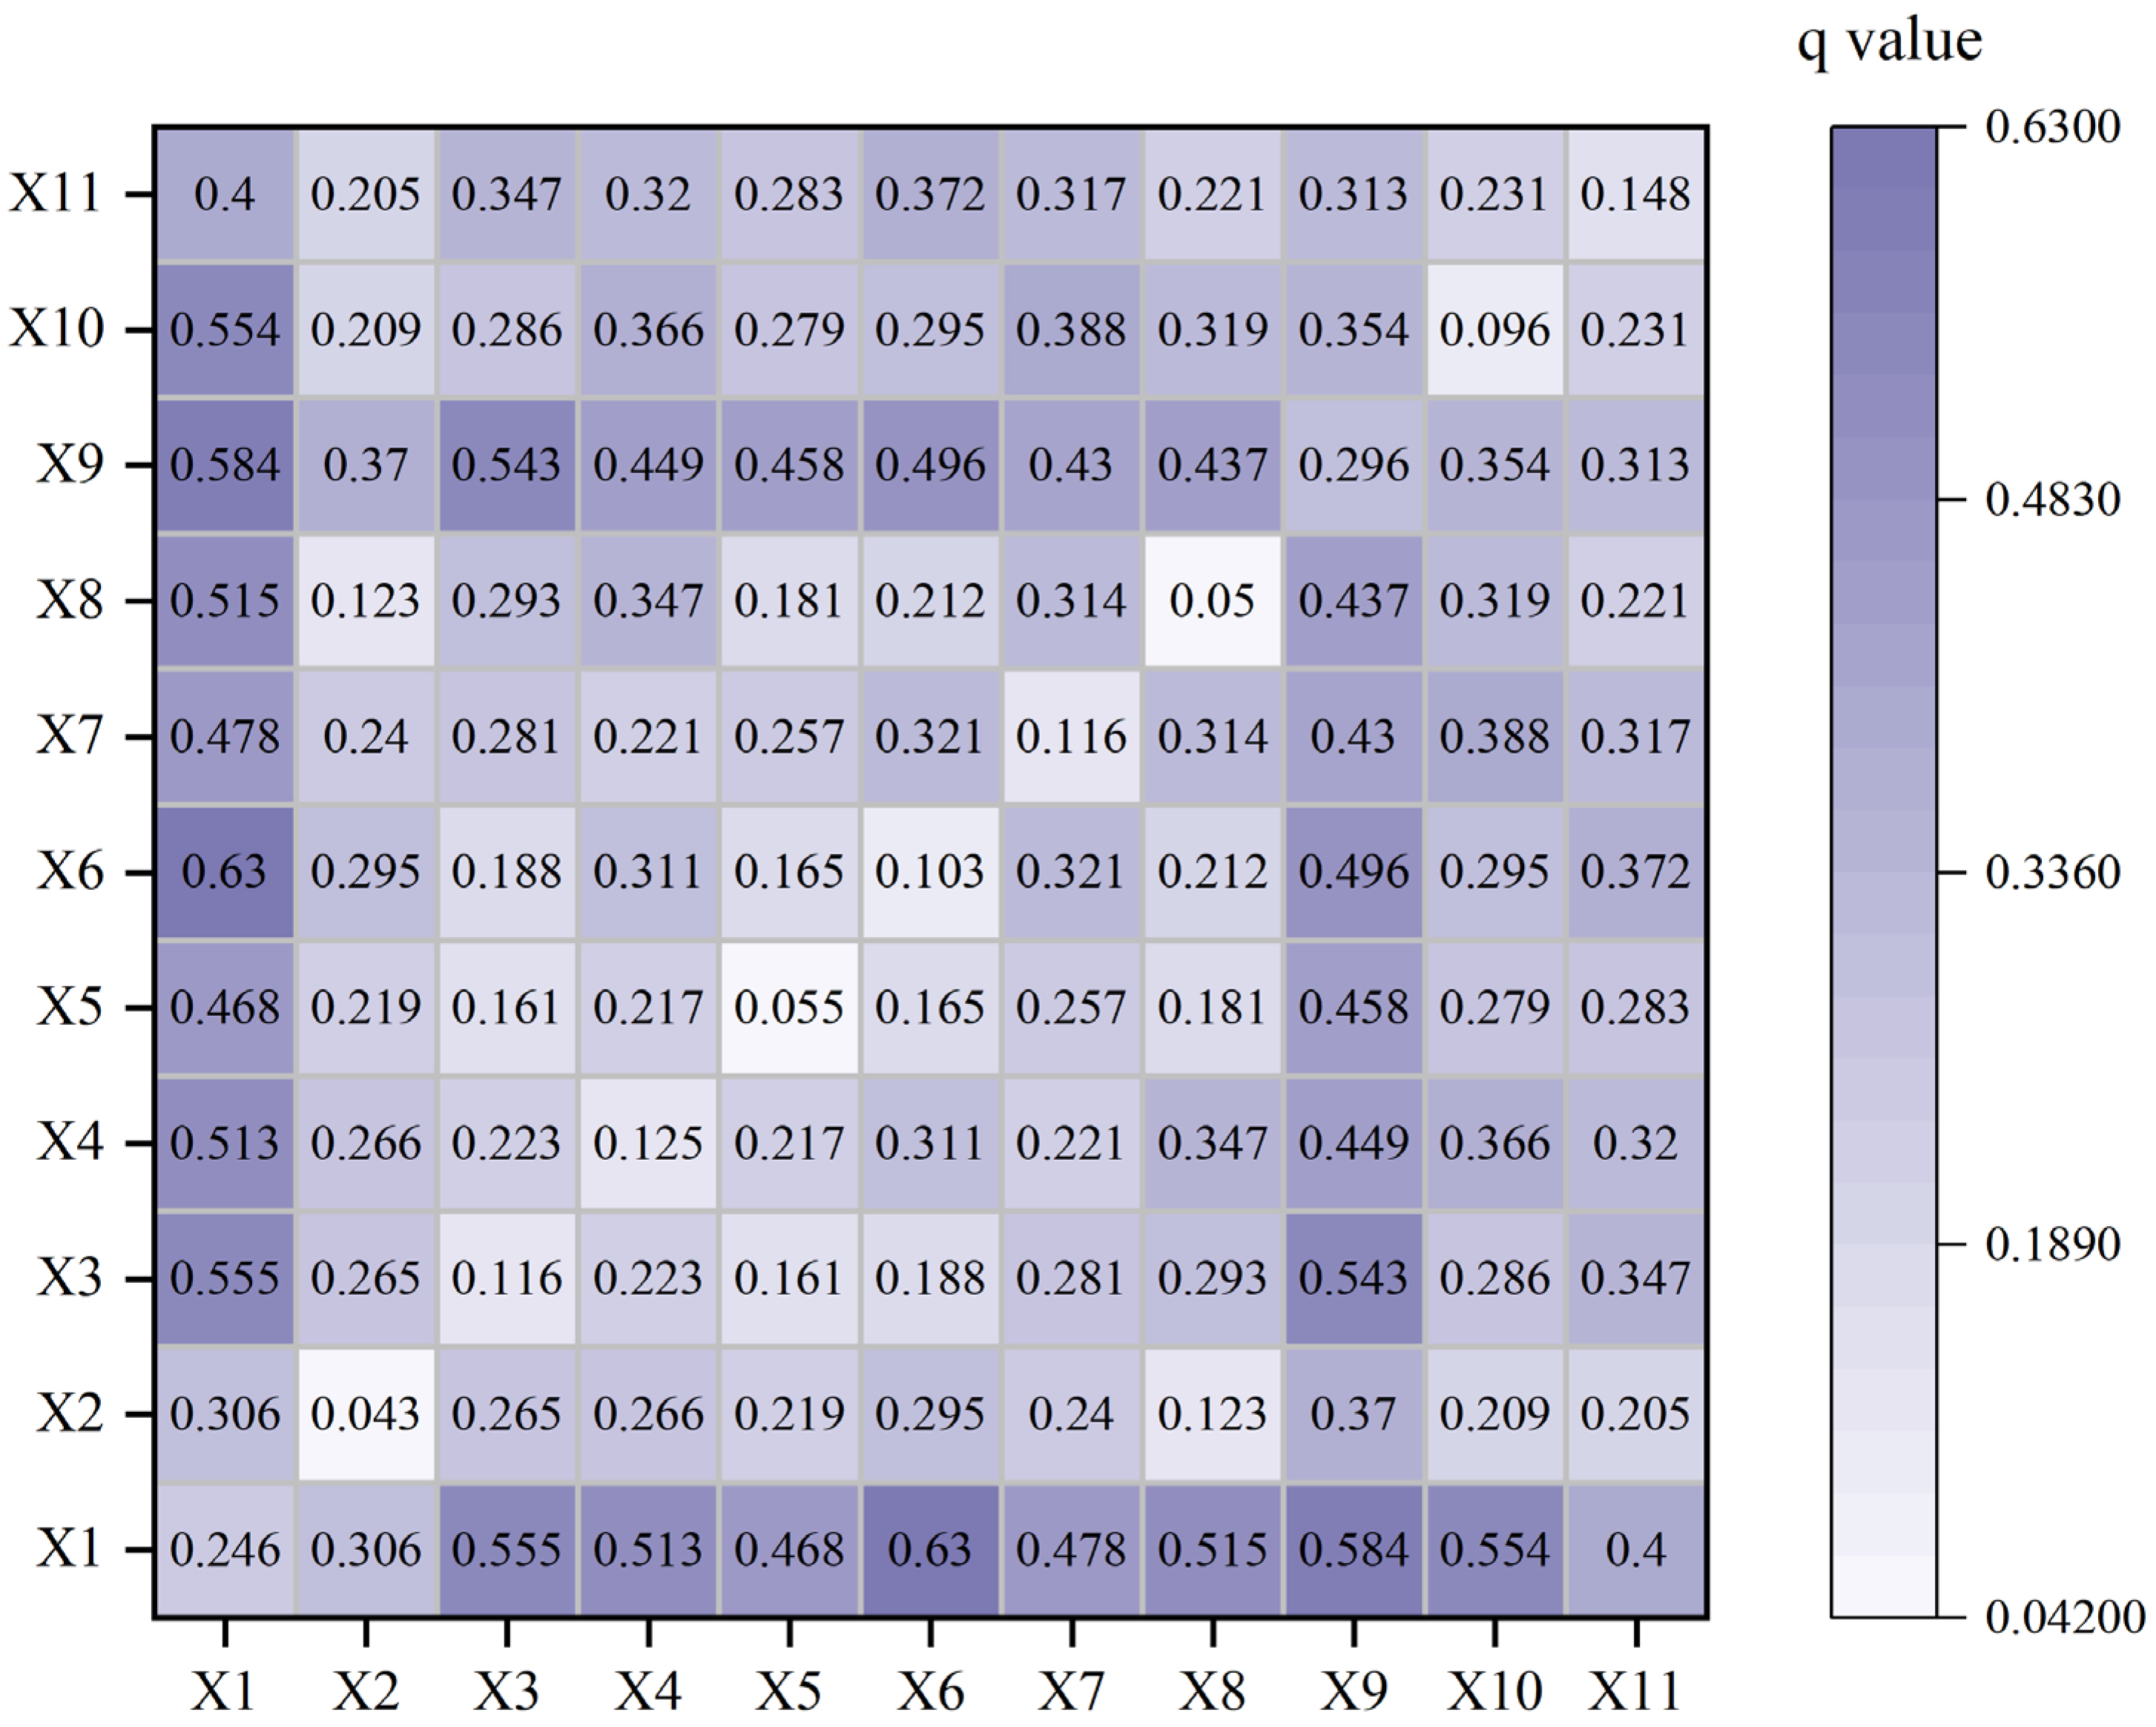
5.2. Influencing Factors and GeoDetector Results
5.3. Mechanisms and Spatial Overlay Analysis of Key Factors
5.3.1. Natural Factors
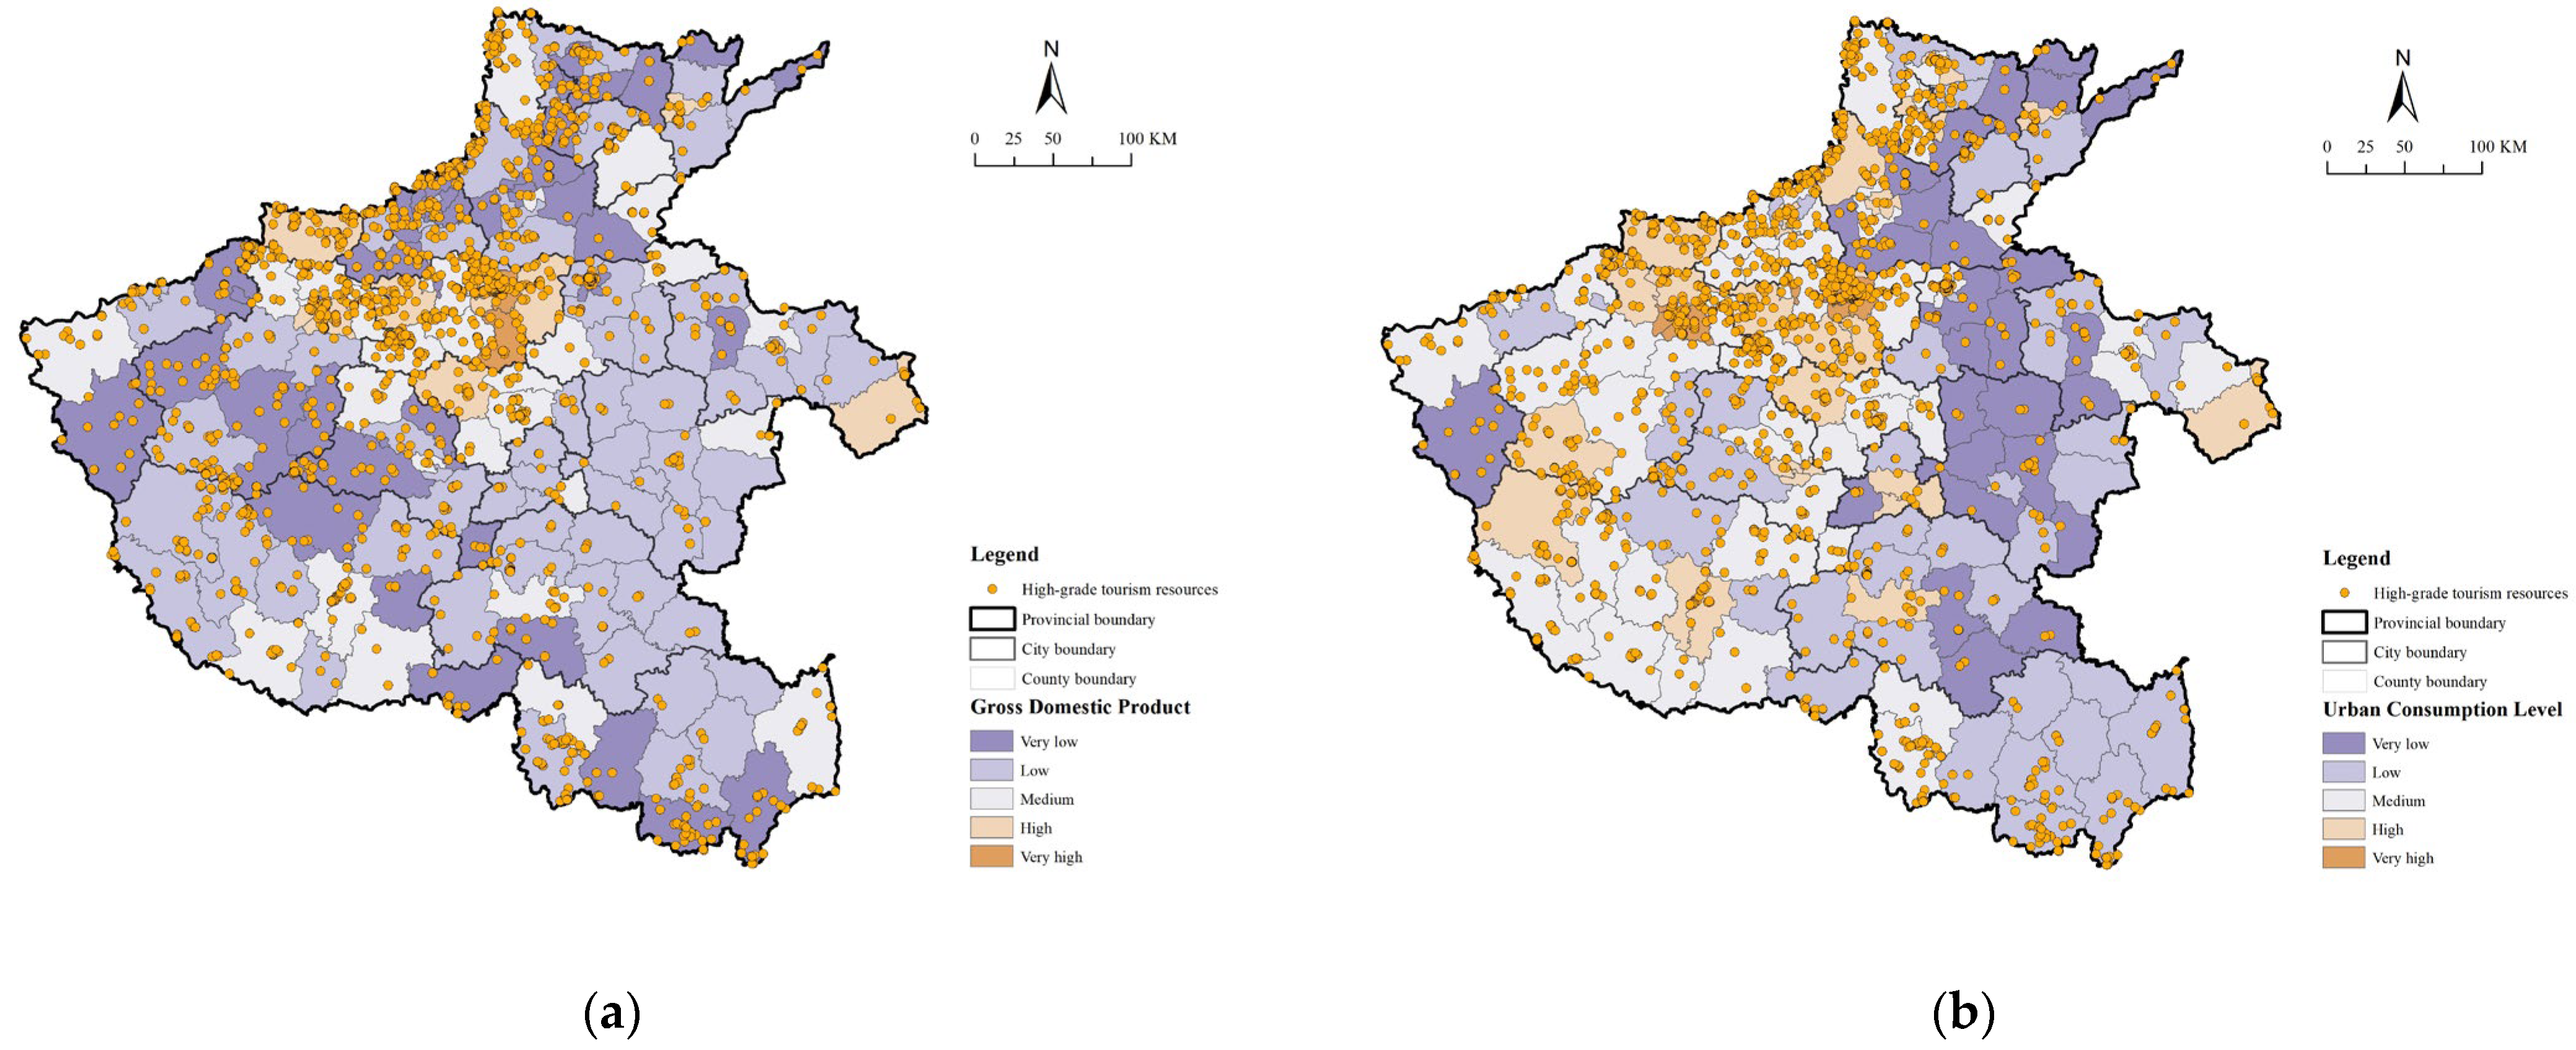
5.3.2. Economic Factors
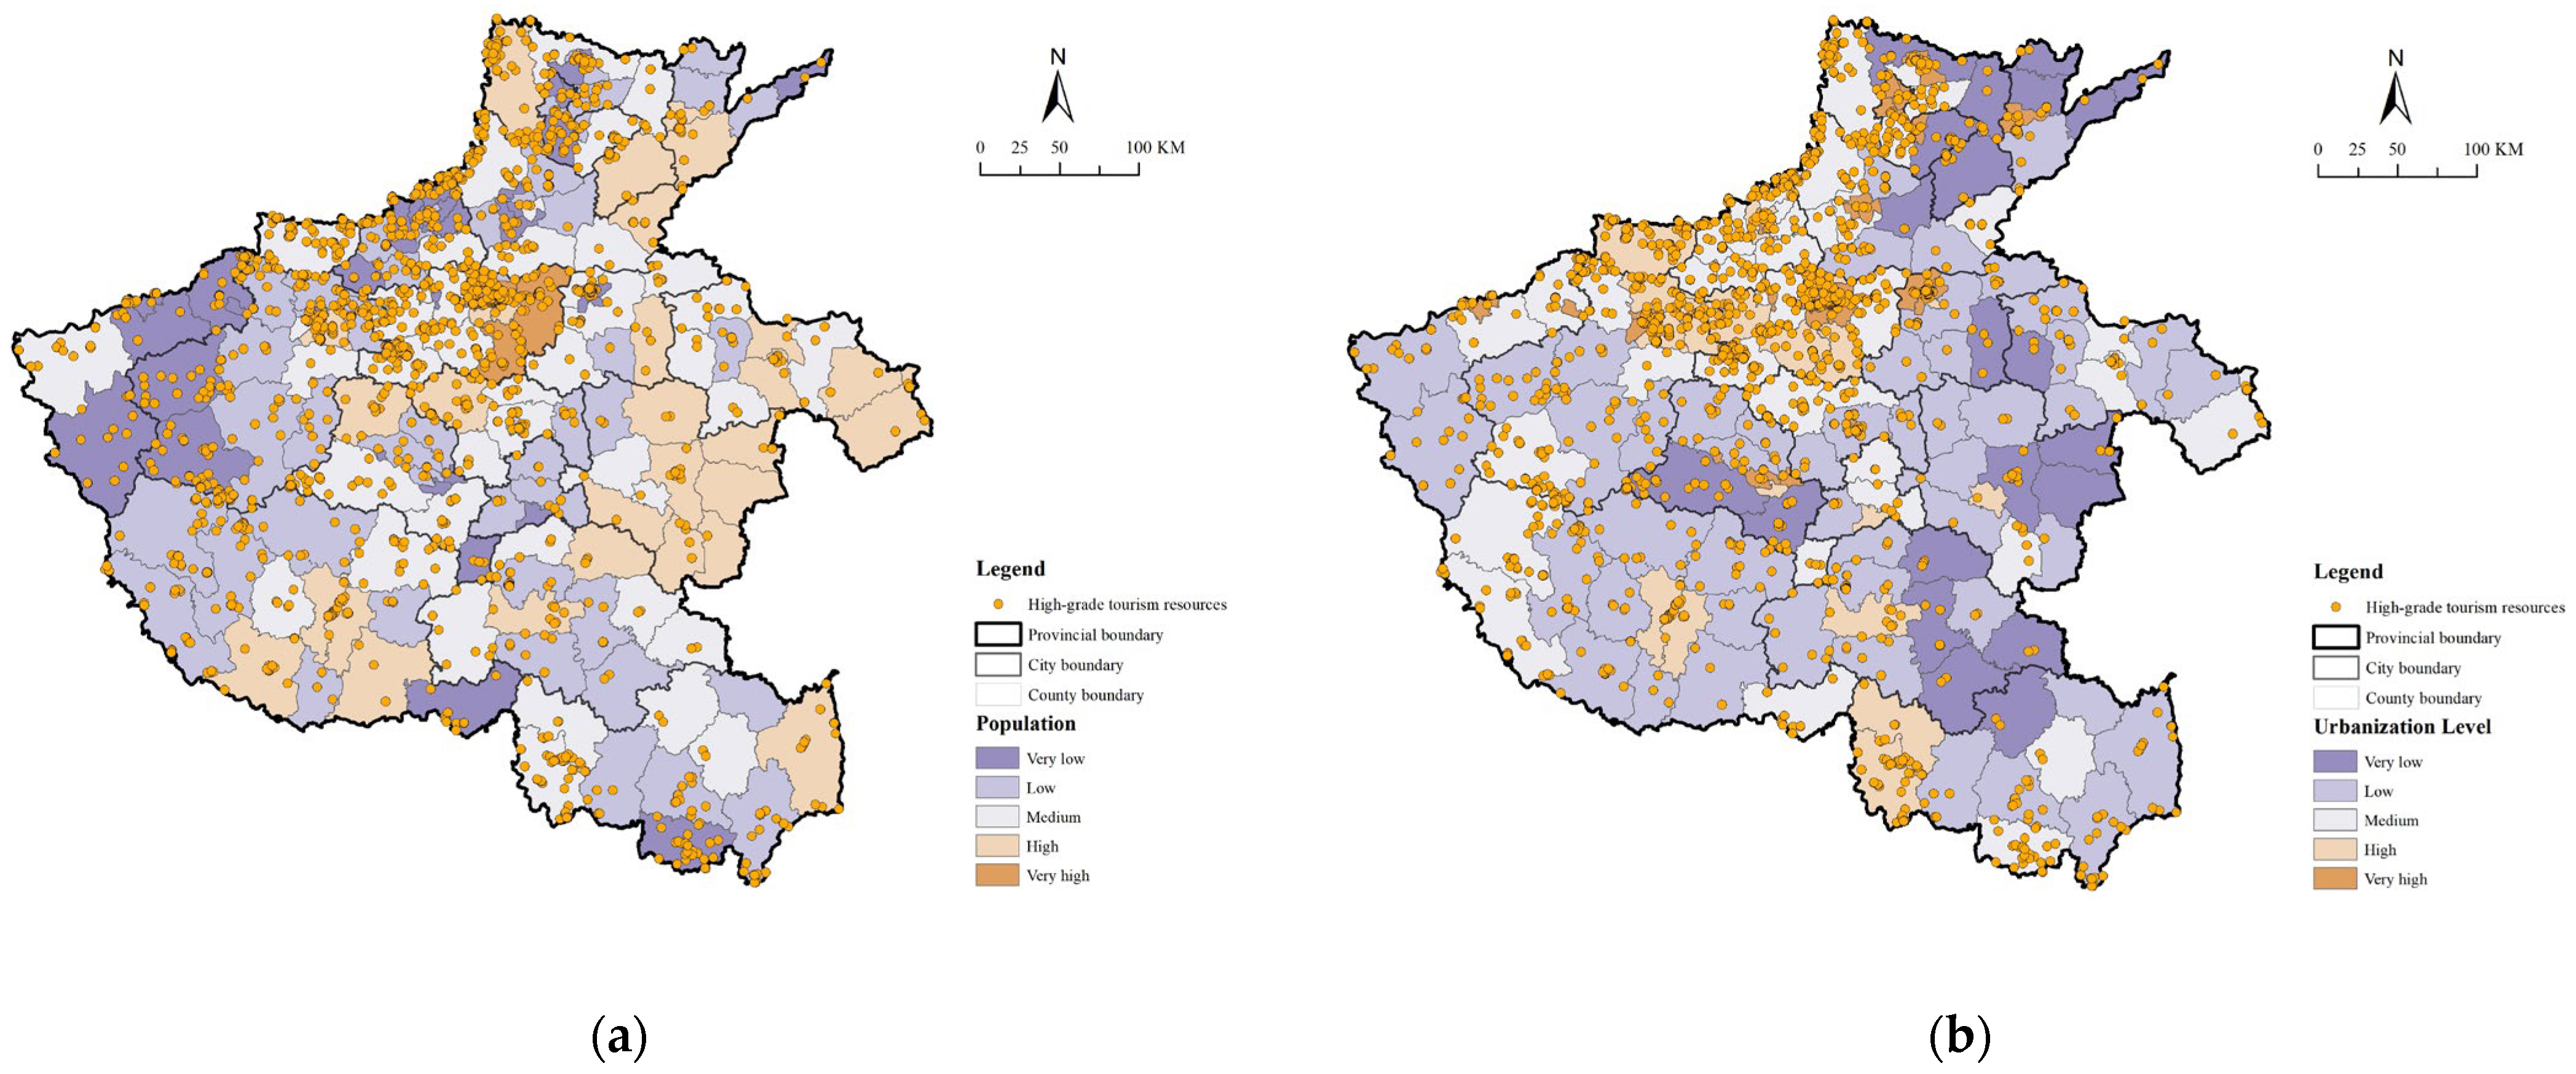
5.3.3. Social Factors
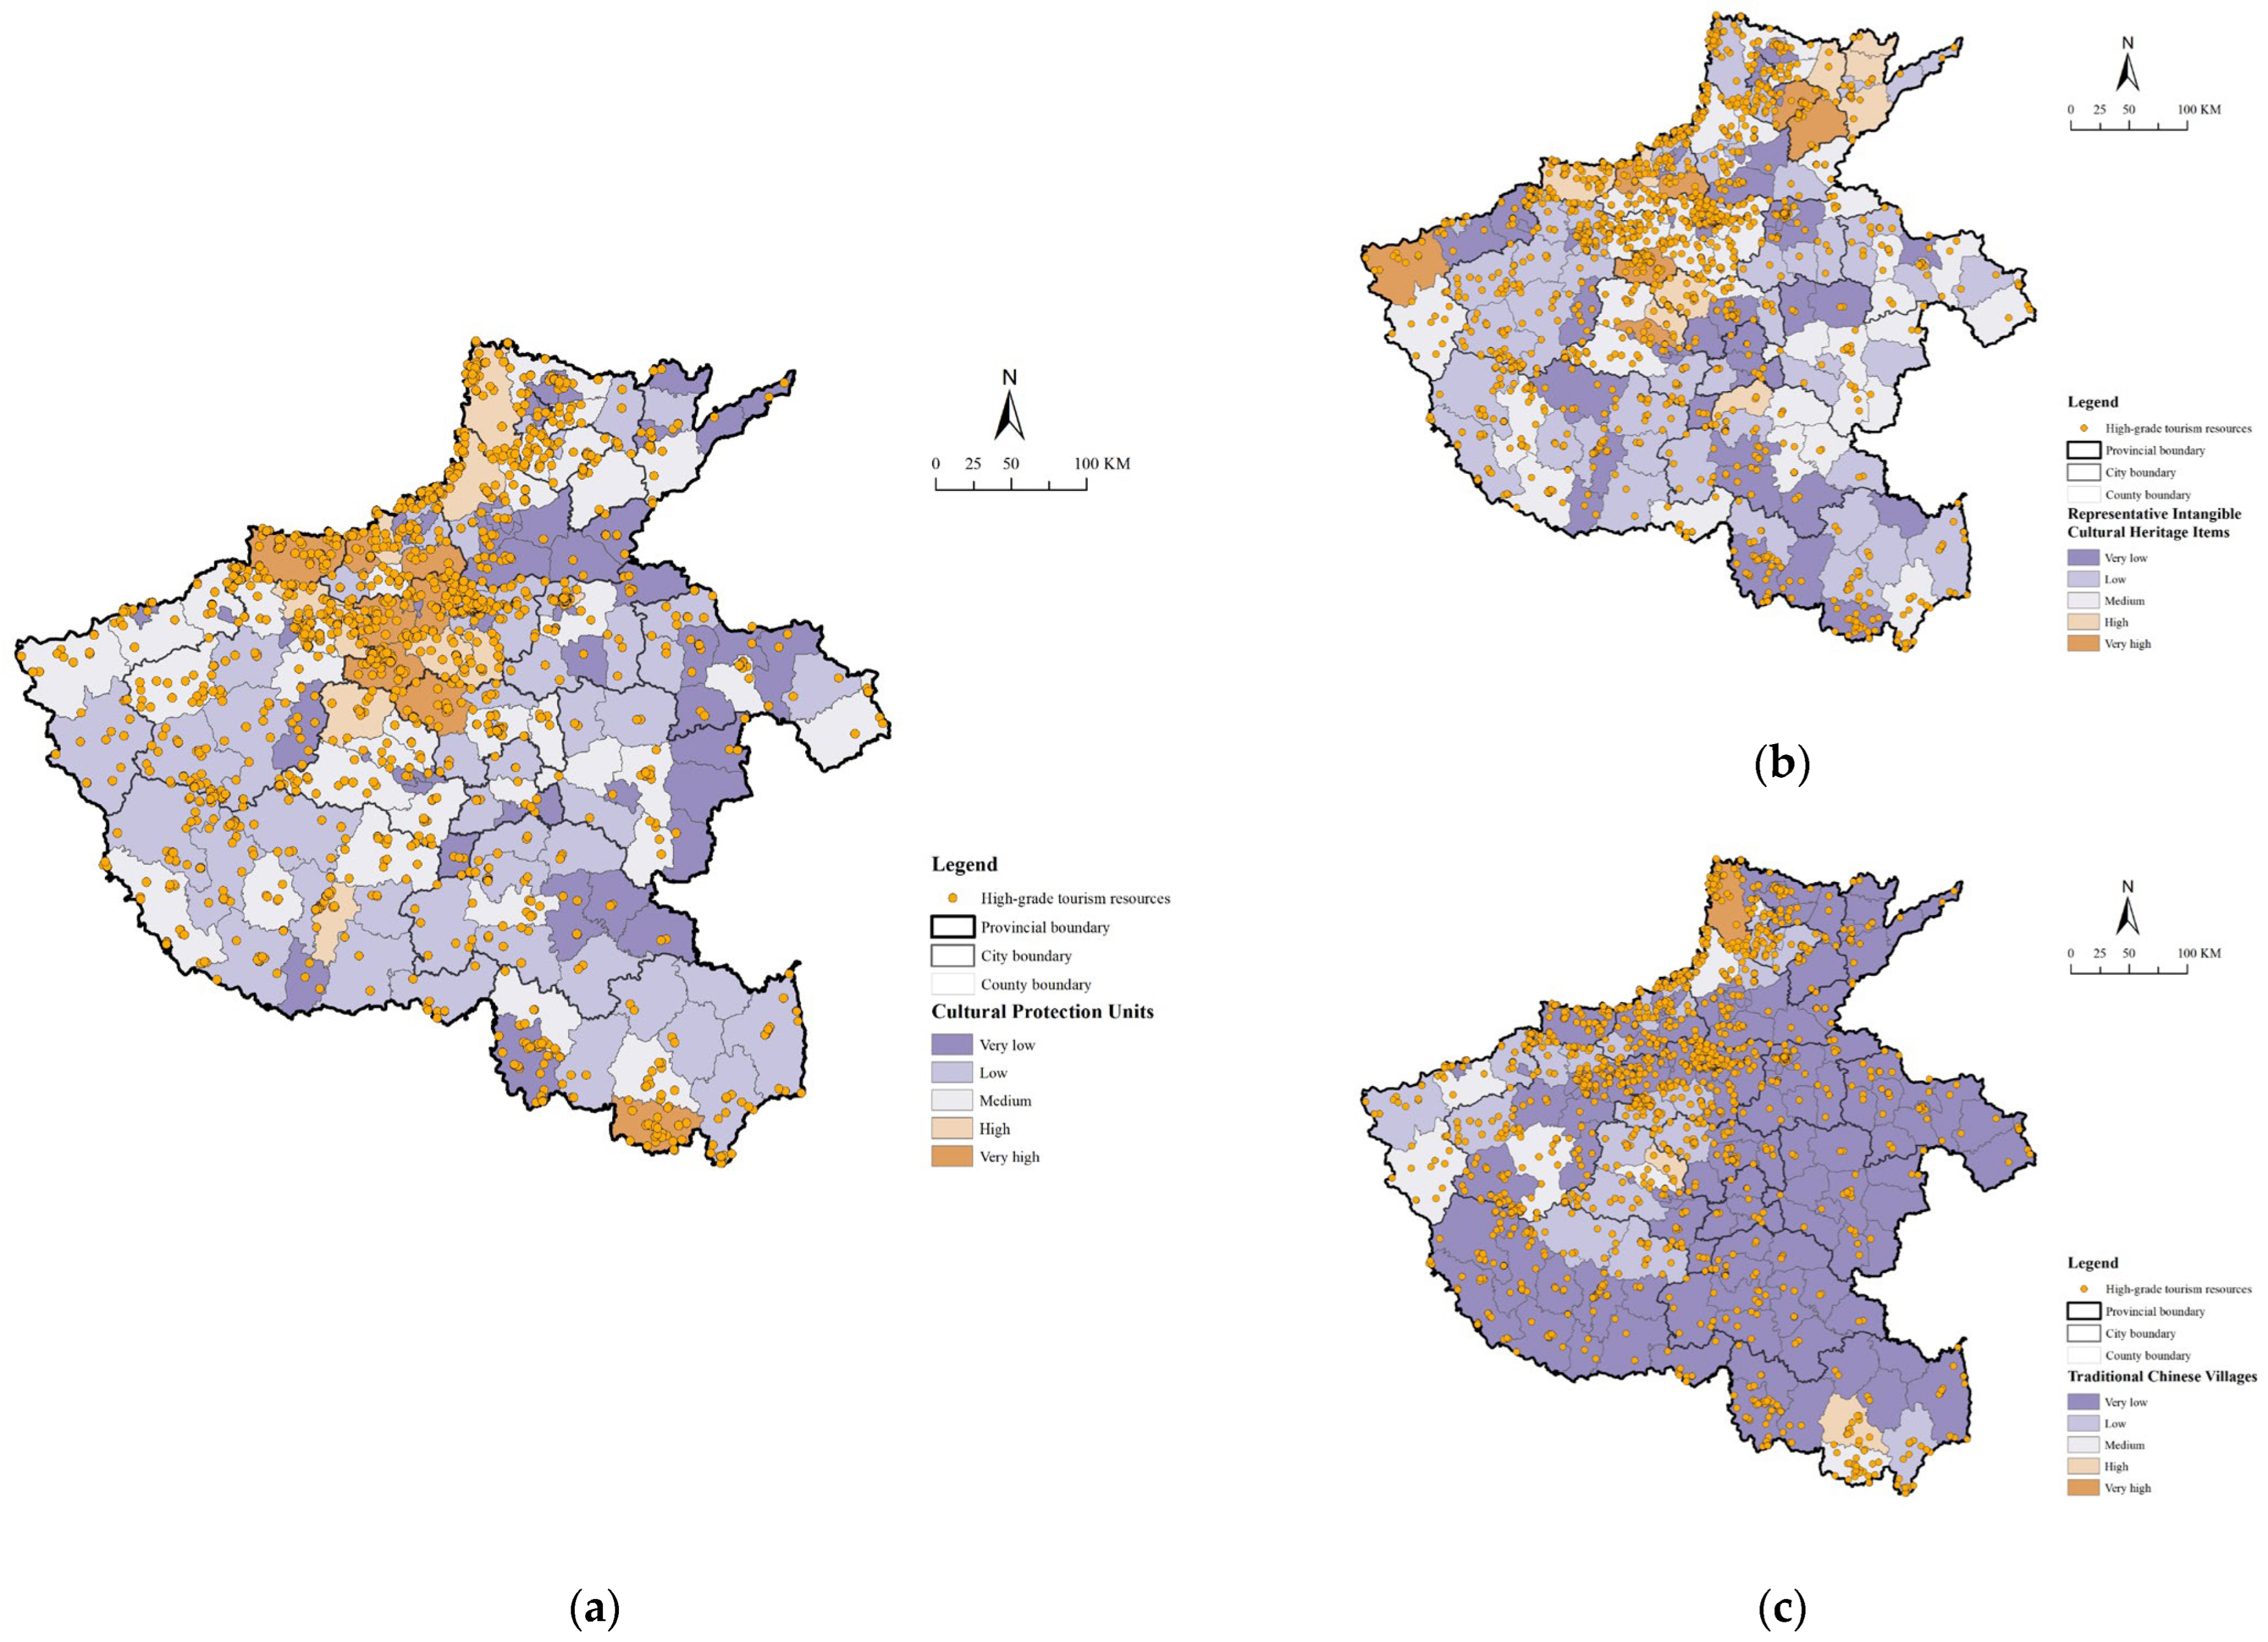
5.3.4. Cultural Factors
5.4. Spatial Regression Analysis and Model Comparison
5.4.1. Collinearity Diagnosis
5.4.2. Spatial Error Model
5.4.3. Comparison of GeoDetector and SEM
6. Discussion
6.1. Comparison with Existing Studies
6.2. Driving Mechanisms of Spatial Differentiation
6.3. Methodological Contributions
6.4. Planning and Policy Implications
6.5. Limitations
7. Conclusions
Author Contributions
Funding
Institutional Review Board Statement
Informed Consent Statement
Data Availability Statement
Conflicts of Interest
Appendix A
Appendix A.1

| Factor | Raw Count q (p) | Density q (p) | Per Capita q (p) |
|---|---|---|---|
| Topography (X1) | 0.246 (0.000) *** | 0.028 (0.387) | 0.247 (0.000) *** |
| Hydrology (X2) | 0.043 (0.167) | 0.057 (0.119) | 0.034 (0.291) |
| GDP (X3) | 0.117 (0.062) * | 0.083 (0.064) * | 0.049 (0.148) |
| Personal income (X4) | 0.125 (0.002) ** | 0.137 (0.000) *** | 0.102 (0.004) ** |
| Consumption scale (X5) | 0.055 (0.531) | 0.041 (0.398) | 0.006 (0.662) |
| Population (X6) | 0.103 (0.095) * | 0.127 (0.231) | 0.104 (0.009) *** |
| Urbanization level (X7) | 0.116 (0.002) ** | 0.252 (0.000) *** | 0.127 (0.000) *** |
| Public expenditure (X8) | 0.053 (0.124) | 0.093 (0.010) ** | 0.024 (0.464) |
| Material culture (X9) | 0.296 (0.000) *** | 0.020 (0.557) | 0.120 (0.017) ** |
| Intangible culture (X10) | 0.096 (0.047) ** | 0.011 (0.805) | 0.036 (0.371) |
| Rural culture (X11) | 0.148 (0.000) *** | 0.003 (0.979) | 0.059 (0.081) * |
Appendix A.2
| Factor | Natural Breaks (5) | Natural Breaks (6) | Natural Breaks (7) | Quantile (5) | Equal Interval (5) | Geometric Interval (5) | Rank Stability |
|---|---|---|---|---|---|---|---|
| X1 | 0.247 | 0.238 | 0.256 | 0.240 | 0.200 | 0.223 | High |
| X2 | 0.043 | 0.061 | 0.035 | 0.043 | 0.019 | 0.070 | Low |
| X3 | 0.117 | 0.115 | 0.163 | 0.073 | 0.161 | 0.105 | Medium |
| X4 | 0.125 | 0.145 | 0.135 | 0.129 | 0.120 | 0.105 | High |
| X5 | 0.056 | 0.087 | 0.080 | 0.035 | 0.052 | 0.038 | Low |
| X6 | 0.103 | 0.095 | 0.131 | 0.017 | 0.111 | 0.094 | Medium |
| X7 | 0.117 | 0.134 | 0.141 | 0.131 | 0.106 | 0.117 | High |
| X8 | 0.054 | 0.075 | 0.060 | 0.036 | 0.108 | 0.067 | Low |
| X9 | 0.297 | 0.315 | 0.306 | 0.228 | 0.350 | 0.271 | High |
| X10 | 0.097 | 0.143 | 0.141 | 0.081 | 0.138 | 0.090 | Medium |
| X11 | 0.124 | 0.225 | 0.305 | 0.207 | 0.115 | 0.201 | Low |
Appendix A.3
| Specification | X1 (Topography) | X3 (GDP) | X9 (Material Culture) | X10 (Intangible Culture) | Model Fit |
|---|---|---|---|---|---|
| Primary SEM (Rook) | 26.73 *** | 0.014 *** | 0.718 *** | 0.569 ** | AIC = 1262.78 |
| OLS with HC3 | 23.37 *** | 0.014 | 0.782 ** | 0.486 | R2 = — |
| Negative binomial | 1.275 *** | 0.0004 | 0.042 *** | 0.028 | AIC = 1093.5 |
| High-relief subsample | — | — | 0.923 ** | — | — |
| Low-relief subsample | — | — | 0.310 | — | — |
| High-resource subsample | 21.16 ** | — | — | — | — |
| Low-resource subsample | 6.26 * | — | — | — | — |
References
- Hall, C.M.; Page, S.J. The Geography of Tourism and Recreation: Environment, Place and Space, 4th ed.; Routledge: London, UK, 2014. [Google Scholar]
- Du, J.; Zhao, B.; Feng, Y. Spatial distribution and influencing factors of rural tourism: A case study of Henan Province. Heliyon 2024, 10, e29039. [Google Scholar] [CrossRef] [Scilit] [PubMed]
- Kang, J.; Duan, X.; Yan, W.; Ma, Z. Spatial Differentiation and Impact Factors of Tourism Development: A Case Study of the Central Plains, China. Sustainability 2022, 14, 7313. [Google Scholar] [CrossRef] [Scilit]
- Saarinen, J.; Rogerson, C.M.; Hall, C.M. Geographies of tourism development and planning. Tour. Geogr. 2017, 19, 307–317. [Google Scholar] [CrossRef] [Scilit]
- Richards, G. Cultural Tourism: An Integrative Review. Tour. Manag. Stud. 2025, 21, 19–31. [Google Scholar] [CrossRef] [Scilit]
- Lew, A.A.; McKercher, B. Modeling tourist movements: A local destination analysis. Ann. Tour. Res. 2006, 33, 403–423. [Google Scholar] [CrossRef] [Scilit]
- Yang, Y.; Fik, T. Spatial effects in regional tourism growth. Ann. Tour. Res. 2014, 46, 144–162. [Google Scholar] [CrossRef] [Scilit]
- Zou, Q.; Sun, J.; Luo, J.; Cui, J.; Kong, X. Spatial patterns of key villages and towns of rural tourism in China and their influencing factors. Sustainability 2023, 15, 13330. [Google Scholar] [CrossRef] [Scilit]
- Wang, Y.; Liu, N.; Chen, Y.; Wang, L.; Mei, D. Study on the spatial patterns and influencing factors of rural tourist destinations in the Yellow River Basin. Areal Res. Dev. 2026. in press (In Chinese) [Google Scholar]
- Zhang, X.; Han, H.; Tang, Y.; Chen, Z. Spatial distribution characteristics and driving factors of tourism resources in China. Land 2023, 12, 1029. [Google Scholar] [CrossRef] [Scilit]
- Wang, Y.; Wu, X.; Liu, Z.; Chen, H.; Zhao, Y. Spatial patterns of tourist attractions in the Yangtze River Delta region. Land 2022, 11, 1523. [Google Scholar] [CrossRef] [Scilit]
- Zhang, T.; Wang, Y.; Wang, Y.; Zhang, S.; Yu, H. Spatial structure and development of tourism resources based on point pattern analysis: A case study in Hainan Island, China. J. Resour. Ecol. 2022, 13, 1058–1073. [Google Scholar] [CrossRef] [Scilit]
- Xie, Y.; Meng, X.; Cenci, J.; Zhang, J. Spatial Pattern and Formation Mechanism of Rural Tourism Resources in China: Evidence from 1470 National Leisure Villages. ISPRS Int. J. Geo-Inf. 2022, 11, 455. [Google Scholar] [CrossRef] [Scilit]
- Zhang, Y.; Li, W.; Li, Z.; Yang, M.; Zhai, F.; Li, Z.; Yao, H.; Li, H. Spatial Distribution Characteristics and Influencing Factors of Key Rural Tourism Villages in China. Sustainability 2022, 14, 14064. [Google Scholar] [CrossRef] [Scilit]
- Gan, C.; Wang, K. Spatial Distribution Pattern and Influencing Factors of High-quality Scenic Spots in Wuling Mountains Area. Resour. Environ. Yangtze Basin 2021, 30, 2115–2125. (In Chinese) [Google Scholar]
- Briedenhann, J.; Wickens, E. Tourism routes as a tool for the economic development of rural areas—Vibrant hope or impossible dream? Tour. Manag. 2004, 25, 71–79. [Google Scholar] [CrossRef] [Scilit]
- Zikirya, B.; Zhou, C. Spatial distribution and influencing factors of high-level tourist attractions in China: A case study of 9296 A-level tourist attractions. Sustainability 2023, 15, 14339. [Google Scholar] [CrossRef] [Scilit]
- Ma, X.; Yang, Z.; Zheng, J. Analysis of spatial patterns and driving factors of provincial tourism demand in China. Sci. Reports. 2022, 12, 2260. [Google Scholar] [CrossRef] [Scilit] [PubMed]
- Palma, M.; De Iaco, S.; Cappello, C.; Distefano, V. Tourism composite spatial indicators through variography and geographically weighted principal components analysis. Ann. Oper. Res. 2024, 342, 1687–1705. [Google Scholar] [CrossRef] [Scilit]
- Zheng, Y.; Wu, M.; Shi, J.; Yang, H.; Wang, J.; Zhang, X.; Zhang, X. The evolution of the spatial–temporal pattern of tourism development and its influencing factors: Evidence from China (2010–2022). Sustainability 2024, 16, 10758. [Google Scholar] [CrossRef] [Scilit]
- Jiang, Y.; Huang, W.; Xiong, X.; Shu, B.; Yang, J.; Li, M.; Cui, X. Investigating spatial patterns and determinants of tourist attractions using POI data: A case study of Hubei Province, China. Heliyon 2024, 10, e32370. [Google Scholar] [CrossRef] [Scilit] [PubMed]
- Zhang, H.; Long, S. Evaluation of attraction and spatial pattern analysis of world cultural and natural heritage tourism resources in China. PLoS ONE 2023, 18, e0289093. [Google Scholar] [CrossRef] [Scilit] [PubMed]
- Hu, Q.; Yang, P.; Ma, J.; Wang, M.; He, X. The spatial differentiation characteristics and influencing mechanisms of intangible cultural heritage in China. Heliyon 2024, 10, e38689. [Google Scholar] [CrossRef] [Scilit] [PubMed]
- Zeng, H.; Tang, C.; Zhou, C.; Zhou, P. Spatial Analysis of Network Attention on Tourism Resources for Sustainable Tourism Development in Western Hunan, China: A Multi-Source Data Approach. Sustainability 2025, 17, 744. [Google Scholar] [CrossRef] [Scilit]
- Zhang, R.; Sun, Y.; Jiang, J. Factors influencing the spatial spillovers of the interprovincial tourism economy based on three-dimensional distance: Evidence from China. Sage Open 2023, 13, 1–13. [Google Scholar] [CrossRef] [Scilit]
- Fitri, R.; Philip, L.P.; Hera, O.; Heru, P.H.P. Tourism planning and planning theory: Historical roots and contemporary alignment. Tour. Manag. Perspect. 2020, 35, 100703. [Google Scholar] [CrossRef] [Scilit]
- Li, Z.; Yang, M.; Zhou, X.; Li, Z.G.; Li, H.D.; Zhai, F.F.; Zhang, Y.; Zhang, Y.X. Research on the spatial correlation and formation mechanism between traditional villages and rural tourism. Sci. Rep. 2023, 13, 8210. [Google Scholar] [CrossRef] [Scilit] [PubMed]
- Zhao, F.; Han, J. Mapping China’s sports tourism projects: Regional imbalances, urban agglomerations, and driving forces. Front. Sports Act. Living. 2026, 8, 1761223. [Google Scholar] [CrossRef] [Scilit] [PubMed]
- Shi, S.; Li, M.; Li, Z.; Xi, J. Spatial Heterogeneity and Influencing Factors of High-Grade Tourist Attractions in the Tibetan Plateau. Int. J. Environ. Res. Public Health 2023, 20, 4650. [Google Scholar] [CrossRef] [Scilit] [PubMed]
- Yang, H.; Wang, Y.; Chen, S.; Luo, Q.; Li, X. Spatial Distribution Pattern and Driving Forces of the A-level Tourist Attractions in China Based on Geo-detector. J. Resour. Ecol. 2025, 16, 1540–1553. [Google Scholar] [CrossRef] [Scilit]
- Wang, J.; Xu, J.-H.; Xia, J.-C. Study on the spatial correlation structure of China’s tourism economic and its effect: Based on social network analysis. Tour. Trib. 2017, 32, 15–26. (In Chinese) [Google Scholar] [CrossRef]
- Deng, A.; Kong, X.; Gui, C.; Zhang, D.; Huang, T. Spatial Distribution Pattern of Tourism Resorts and Its Influencing Mechanism inChina Based on Geographical Nature Principle. Econ. Geogr. 2025, 45, 215–224. (In Chinese) [Google Scholar]
- Ding, F.; Zhang, S.; Dai, L. Spatial distribution characteristics and influencing factors of tourism resources based on point of interest data. PLoS ONE 2024, 19, e0310487. [Google Scholar] [CrossRef] [Scilit] [PubMed]


| Average Observed Distance (m) | Expected Average Distance (m) | Nearest Neighbor Index | p-Value |
|---|---|---|---|
| 1731.15 | 5532.74 | 0.313 | 0.000 |
| Factor Layer | Indicator | Indicator Interpretation | Q-Value | p-Value | Rank |
|---|---|---|---|---|---|
| Natural | Topography (X1) | Relief Amplitude | 0.246 | 0.000 | 2 |
| Hydrology (X2) | River Network Density | 0.043 | 0.167 | / | |
| Economic | GDP (X3) | Regional GDP | 0.117 | 0.062 | 5 |
| Personal income (X4) | Per Capital Disposable Income of Urban Residents | 0.125 | 0.002 | 4 | |
| Consumption scale (X5) | Total Retail Sales of Consumer Goods | 0.055 | 0.531 | / | |
| Social | Population (X6) | Permanent Resident Population | 0.103 | 0.095 | 7 |
| Urbanization level (X7) | Urbanization Rate | 0.116 | 0.002 | 6 | |
| Public expenditure (X8) | General Public Budget Expenditure | 0.053 | 0.124 | / | |
| Cultural | Material culture (X9) | Number of Cultural Relic Protection Units at Provincial Level and Above | 0.296 | 0.000 | 1 |
| Intangible culture (X10) | Number of Intangible Cultural Heritage Items at Provincial Level and Above | 0.096 | 0.047 | 8 | |
| Rural culture (X11) | Number of Traditional Chinese Villages | 0.148 | 0.000 | 3 |
| X1 | X2 | X3 | X4 | X5 | X6 | X7 | X8 | X9 | X10 | X11 | |
|---|---|---|---|---|---|---|---|---|---|---|---|
| X1 | 1.000 | −0.242 | −0.068 | 0.110 | −0.135 | −0.212 | −0.019 | 0.051 | 0.240 | 0.070 | 0.440 |
| X2 | −0.242 | 1.000 | −0.039 | 0.104 | −0.003 | −0.084 | 0.177 | −0.184 | −0.146 | −0.062 | −0.194 |
| X3 | −0.068 | −0.039 | 1.000 | 0.497 | 0.899 | 0.768 | 0.251 | 0.378 | 0.187 | 0.084 | −0.071 |
| X4 | 0.110 | 0.104 | 0.497 | 1.000 | 0.513 | 0.179 | 0.734 | −0.199 | 0.085 | −0.224 | −0.020 |
| X5 | −0.135 | −0.003 | 0.899 | 0.513 | 1.000 | 0.704 | 0.330 | 0.219 | 0.047 | 0.016 | −0.138 |
| X6 | −0.212 | −0.084 | 0.768 | 0.179 | 0.704 | 1.000 | −0.141 | 0.657 | 0.219 | 0.229 | −0.108 |
| X7 | −0.019 | 0.177 | 0.251 | 0.734 | 0.330 | −0.141 | 1.000 | −0.529 | −0.150 | −0.358 | −0.109 |
| X8 | 0.051 | −0.184 | 0.378 | −0.199 | 0.219 | 0.657 | −0.529 | 1.000 | 0.382 | 0.350 | 0.107 |
| X9 | 0.240 | −0.146 | 0.187 | 0.085 | 0.047 | 0.219 | −0.150 | 0.382 | 1.000 | 0.505 | 0.346 |
| X10 | 0.070 | −0.062 | 0.084 | −0.224 | 0.016 | 0.229 | −0.358 | 0.350 | 0.505 | 1.000 | 0.164 |
| X11 | 0.440 | −0.194 | −0.071 | −0.020 | −0.138 | −0.108 | −0.109 | 0.107 | 0.346 | 0.164 | 1.000 |
| X1 | X2 | X3 | X4 | X5 | X6 | X7 | X8 | X9 | X10 | X11 |
|---|---|---|---|---|---|---|---|---|---|---|
| 1.551 | 1.137 | 7.730 | 3.232 | 6.671 | 5.386 | 3.676 | 3.323 | 1.817 | 1.588 | 1.377 |
| Variables | Coefficient | Standard Error | Z-Value | p-Value |
|---|---|---|---|---|
| Constant | −26.2711 | 11.3563 | −2.313 | 0.021 ** |
| X1 | 26.7271 | 4.864 | 5.495 | 0.000 *** |
| X2 | 1945.48 | 1936.52 | 1.005 | 0.315 |
| X3 | 0.01356 | 0.00417 | 3.249 | 0.001 *** |
| X4 | 0.00031 | 0.00033 | 0.952 | 0.341 |
| X7 | 0.06651 | 0.09681 | 0.687 | 0.492 |
| X8 | −0.02622 | 0.08526 | −0.308 | 0.758 |
| X9 | 0.71814 | 0.15411 | 4.660 | 0.000 *** |
| X10 | 0.56922 | 0.27887 | 2.041 | 0.041 ** |
| X11 | 0.29825 | 0.30558 | 0.976 | 0.329 |
| Lambda | 0.20134 | 0.11145 | 1.806 | 0.071 * |
Disclaimer/Publisher’s Note: The statements, opinions and data contained in all publications are solely those of the individual author(s) and contributor(s) and not of MDPI and/or the editor(s). MDPI and/or the editor(s) disclaim responsibility for any injury to people or property resulting from any ideas, methods, instructions or products referred to in the content. |
© 2026 by the authors. Licensee MDPI, Basel, Switzerland. This article is an open access article distributed under the terms and conditions of the Creative Commons Attribution (CC BY) license.
Share and Cite
Yuan, M.; Liu, J.; Jin, J.; Jia, J.; Zhao, P. Spatial Distribution Characteristics and Influencing Factors of High-Grade Tourism Resources in Henan Province, China. Sustainability 2026, 18, 8554. https://doi.org/10.3390/su18168554
Yuan M, Liu J, Jin J, Jia J, Zhao P. Spatial Distribution Characteristics and Influencing Factors of High-Grade Tourism Resources in Henan Province, China. Sustainability. 2026; 18(16):8554. https://doi.org/10.3390/su18168554
Chicago/Turabian StyleYuan, Meng, Jiaru Liu, Junwei Jin, Jing Jia, and Pengjun Zhao. 2026. "Spatial Distribution Characteristics and Influencing Factors of High-Grade Tourism Resources in Henan Province, China" Sustainability 18, no. 16: 8554. https://doi.org/10.3390/su18168554
APA StyleYuan, M., Liu, J., Jin, J., Jia, J., & Zhao, P. (2026). Spatial Distribution Characteristics and Influencing Factors of High-Grade Tourism Resources in Henan Province, China. Sustainability, 18(16), 8554. https://doi.org/10.3390/su18168554