1. Introduction
The hydraulic behavior of water structures is governed by complex flow interactions, such as flow separation, turbulence generation, energy dissipation, and upstream afflux. So, accurate assessment of these hydraulic phenomena is of great importance for achieving optimal performance, minimizing any type of water losses. At the same time, flow transitions and turbulence effects further modulate the hydraulic efficiency and the needed flow stability through the structure. Since field measurements and laboratory experiments are usually time-consuming and costly, in addition to the difficulty of implementing them under the same natural working conditions on site, numerical modeling has become an effective and widely adopted approach for investigating complex hydraulic phenomena, enabling engineers to simulate flow conditions, evaluate alternative design scenarios, and optimize hydraulic performance under various geometric and operational conditions. Among the available hydraulic modeling platforms, the Hydrologic Engineering Center–River Analysis System (HEC-RAS) provides a reliable environment for simulating water-surface profiles, flow hydraulics, sediment transport, and water-quality processes [
1,
2,
3,
4,
5,
6,
7]. Although the one-dimensional (1D) version of HEC-RAS computes cross-sectionally averaged hydraulic variables and cannot explicitly resolve three-dimensional flow structures, it remains a practical and computationally efficient tool for predicting bulk hydraulic performance indicators, including water-surface profiles, energy losses, and heading-up. Therefore, the present study employs HEC-RAS to investigate the combined effects of canal inside slopes and upstream wing-wall configurations on the hydraulic performance of water structures. The numerical model was validated against the experimental results of [
8], with particular emphasis on relative energy loss and relative heading-up.
Recent experimental studies have highlighted the significant influence of structural geometry on localized hydraulic behavior around water structures. Fakhimjoo et al. [
9] reported that flow velocities near piers and abutments may increase by up to 80%, depending on structural geometry. Similarly, Afzalimehr et al. [
10] found that compact abutments generate more intense vortices, whereas Setyandito et al. [
11] demonstrated that spill-through abutments provide more stable hydraulic conditions than vertical-wall configurations. Although these findings emphasize the importance of entrance geometry in controlling flow stability and hydraulic efficiency, they were obtained mainly for bridge abutments and cannot be directly applied to irrigation canal structures because of differences in geometry, hydraulic conditions, and operational objectives.
The influence of wing-wall geometry on hydraulic performance has also been widely investigated. Ashour et al. [
12] showed that a transition angle of approximately 30° for broken-type wing walls provides an effective balance between hydraulic performance and construction cost. More recently, Ashour et al. [
13] reported that combining a broken-type upstream wing wall with a 1H:1V canal inside slope reduced the relative velocity and relative heading-up by approximately 12% and 20%, respectively, compared with the conventional box-type configuration. However, that study was limited to a single wing-wall geometry and did not examine other entrance configurations or canal inside slope values.
Advanced numerical approaches for hydraulic analysis generally include one-dimensional (1D) models, such as HEC-RAS, and two- or three-dimensional computational fluid dynamics (CFD) models. CFD techniques, particularly large eddy simulation (LES), can accurately reproduce complex three-dimensional flow structures, turbulence characteristics, vortices, and local shear stresses around hydraulic structures [
14,
15]. However, these models require detailed geometric representation, extensive calibration, long computational time, and considerable computational resources, especially for large parametric investigations. In contrast, the 1D HEC-RAS model provides computational efficiency, requires relatively limited input data, and has been extensively validated for predicting bulk hydraulic characteristics, including water-surface profiles, energy losses, flow velocities, and heading-up [
1,
2,
3,
4,
5,
6,
7]. Therefore, considering that the objective of the present study is to evaluate the overall hydraulic performance of different entrance configurations rather than resolve detailed turbulence structures, HEC-RAS was considered an appropriate and practical numerical tool.
Water structures also exert a significant influence on upstream and downstream flow conditions. Atabay et al. [
16] reported that bridge geometry and upstream Froude number strongly affect backwater levels, whereas Abdel-Aal et al. [
17] showed that increasing the Froude number increases scour potential downstream of hydraulic transitions. Similarly, [
18,
19,
20] emphasized the influence of seismic loading and hydraulic transients on canal slope stability. Although these loading conditions are beyond the scope of the present study, they highlight the importance of minimizing hydraulic losses and heading-up to improve hydraulic performance and structural stability.
Detailed laboratory investigations have further revealed the complexity of three-dimensional flow around entrance structures. Barbhuiya et al. [
21,
22,
23] identified upstream and downstream vortices, irregular wake regions, and substantial variations in bed shear stress around wing-wall abutments. Although one-dimensional numerical models cannot explicitly reproduce these localized flow structures, their integrated hydraulic effects, including increased energy loss and upstream heading-up, are reflected in cross-sectionally averaged hydraulic parameters that can be reliably predicted by HEC-RAS.
Hydraulic analyses have also examined the influence of geometric parameters on afflux, flow characteristics, and energy dissipation. Hadi et al. [
24] demonstrated that increasing the opening ratio improves HEC-RAS predictions and shifts the maximum afflux farther upstream. Similarly, Ghodsian et al. [
25] reported that wing-wall angles significantly influence scour development downstream of box culverts. Ahmed et al. [
26] highlighted the effects of non-uniform velocity distributions and increased bed shear stress near abutment noses, whereas Xiao et al. [
27] demonstrated that steeper canal inside slopes promote more uniform shear-stress distributions by reducing momentum exchange. Collectively, these studies confirm that both entrance geometry and canal inside slopes play important roles in controlling hydraulic losses and sediment-related processes.
From a geotechnical perspective, considerable attention has been devoted to canal inside slopes, particularly regarding slope stability, erosion resistance, and failure mechanisms. Previous investigations examined the influence of soil properties, slope geometry, and hydraulic loading on embankment stability [
19,
28,
29,
30,
31,
32,
33]. However, these investigations focused primarily on geotechnical performance, with limited consideration of the hydraulic interaction between canal inside slopes and upstream entrance structures.
Although previous studies have provided valuable insights into the hydraulic performance of water structures, canal inside slopes and upstream wing-wall configurations have generally been investigated independently, with insufficient attention given to their combined interaction within a unified hydraulic system. While Ashour et al. [
13] partially addressed this interaction for a broken-type wing wall combined with a canal inside slope of 1:1, the hydraulic performance of other wing-wall configurations over different canal inside slopes has not been systematically investigated. Consequently, a comprehensive understanding of the combined effects of these parameters on energy loss, heading-up, velocity distribution, afflux, and overall hydraulic efficiency remains unavailable. This knowledge gap limits the development of integrated and evidence-based design recommendations for improving the hydraulic performance of irrigation water structures.
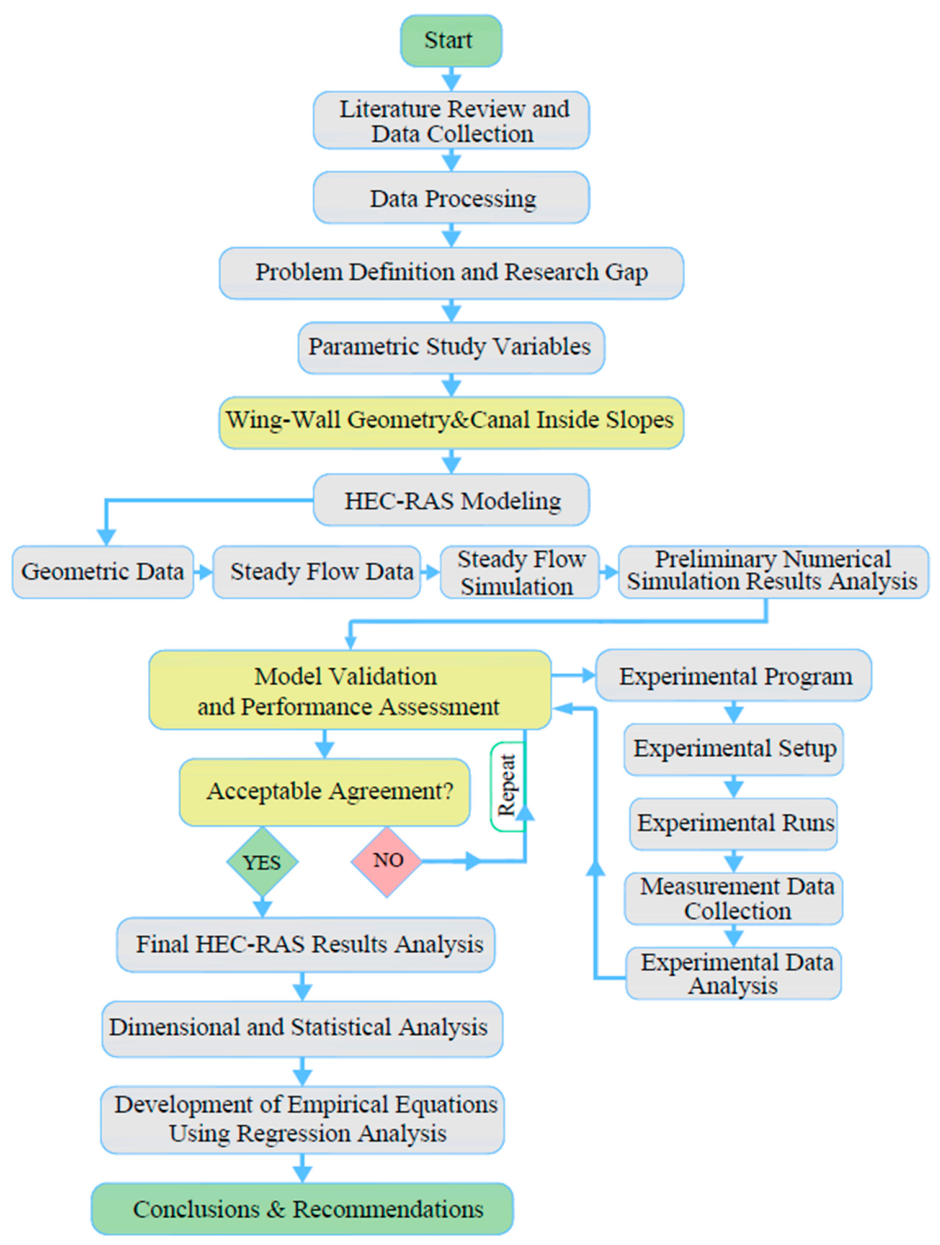
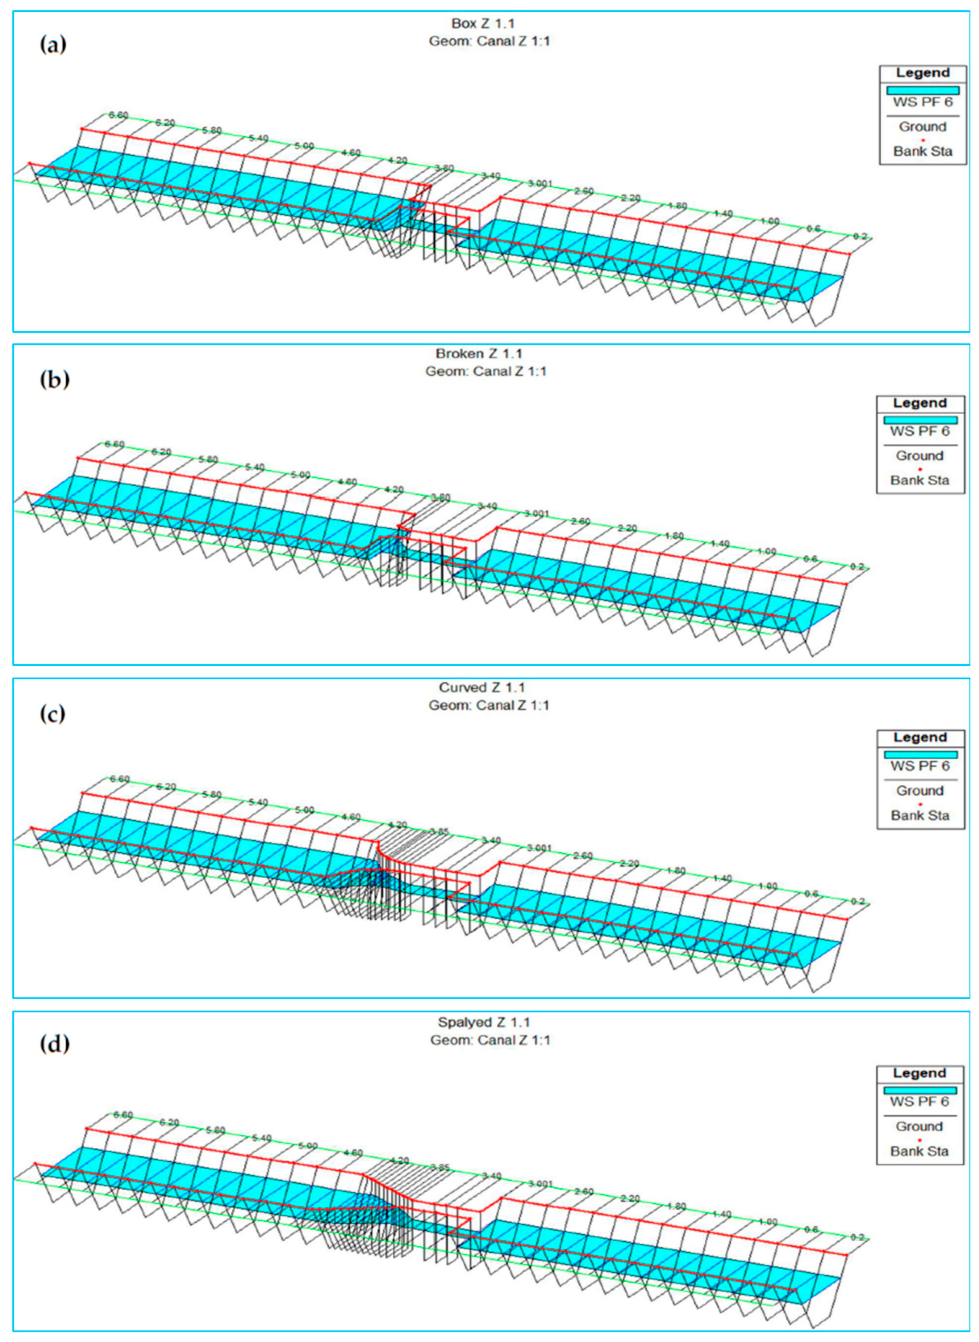
To address this knowledge gap, the present study investigates the combined effects of canal inside slopes and upstream wing-wall configurations on the hydraulic performance of water structures using the HEC-RAS numerical model under steady subcritical flow conditions. The study was conducted in two stages. First, the numerical model was validated against physical model measurements obtained from a 1:10 scale recirculating flume to evaluate its capability in predicting relative energy loss and relative heading-up. Second, a comprehensive numerical investigation was performed for four upstream wing-wall configurations (box, broken, curved, and splayed) combined with three canals inside slopes (1:1, 3:2, and 2:1) under a fixed contraction ratio of 0.6 and upstream Froude numbers ranging from 0.12 to 0.18. Finally, empirical predictive equations were developed as functions of the upstream Froude number and canal inside slope to facilitate preliminary hydraulic design. The findings are expected to provide practical guidance for selecting optimized entrance configurations that improve flow conditions, reduce hydraulic losses, and enhance the overall hydraulic performance of irrigation water structures.
The present study also supports sustainable water resources management by providing an integrated hydraulic design framework that improves water conveyance efficiency while reducing hydraulic losses and unnecessary upstream afflux. Furthermore, employing a validated numerical model enables extensive evaluation of alternative design scenarios with substantially lower material consumption, time, and cost than physical modeling alone, thereby contributing to sustainable engineering practice.
3. Results
This section presents the results of the HEC-RAS numerical simulations and their comparison with the physical model measurements of Ashour et al. [
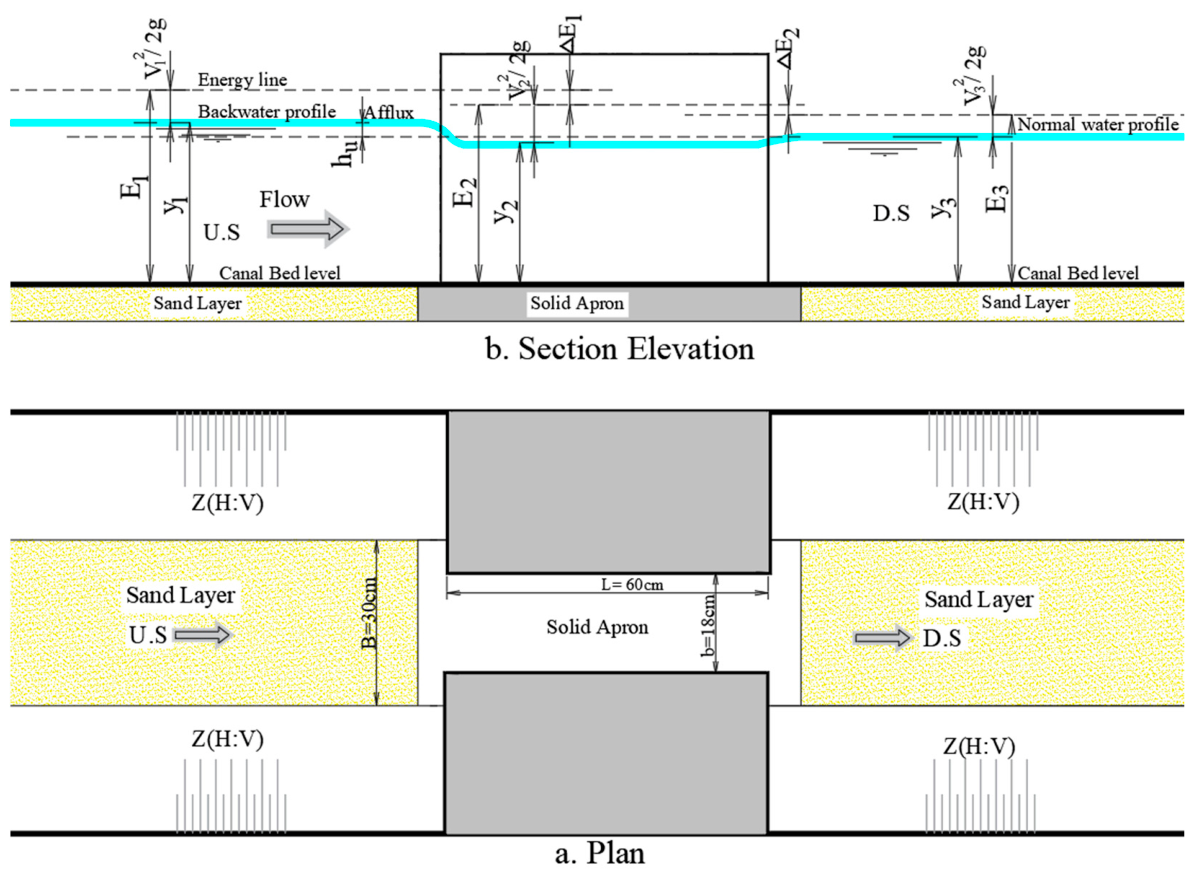
8]. The analysis was carried out to investigate the bulk hydraulic behavior of water structures under four different upstream wing-wall configurations combined with three different canal inside slope values. Particular attention was given to the influence of the investigated parameters on the following important hydraulic performance indicators: relative energy loss (Δ
E/
y1), relative heading-up (
hu/
y1), water surface profile, and cross-sectional flow velocity distribution. It is important to recall that the HEC-RAS model computes cross-sectionally averaged hydraulic variables; therefore, all results presented herein reflect flow behavior. The results are organized into two subsections:
Section 3.1 presents the model validation against physical model data, and
Section 3.2 presents the parametric HEC-RAS analysis of the combined effects of wing-wall configuration and canal inside slope on hydraulic performance under steady subcritical flow conditions.
3.1. Model Validation and Comparison with Experimental Measurements
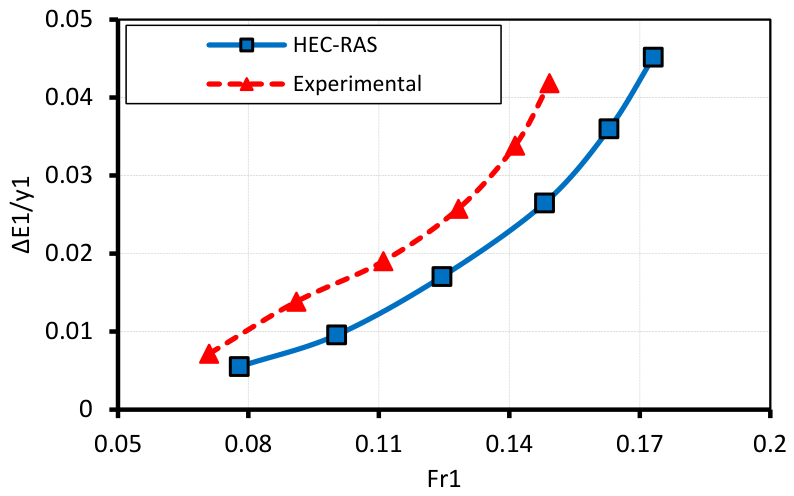
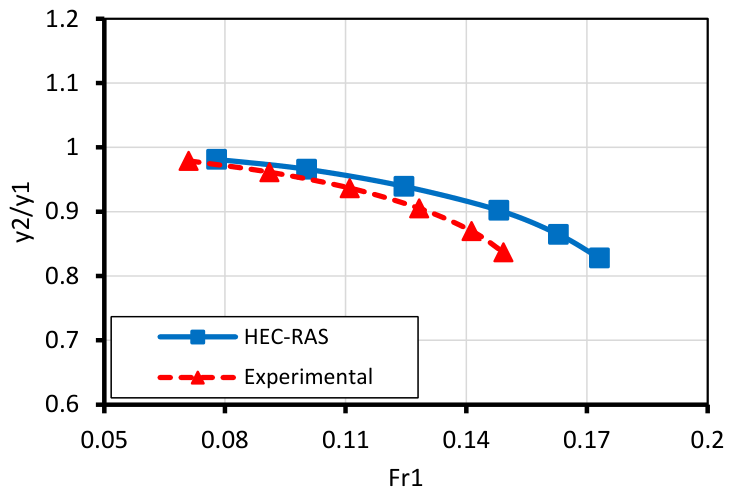
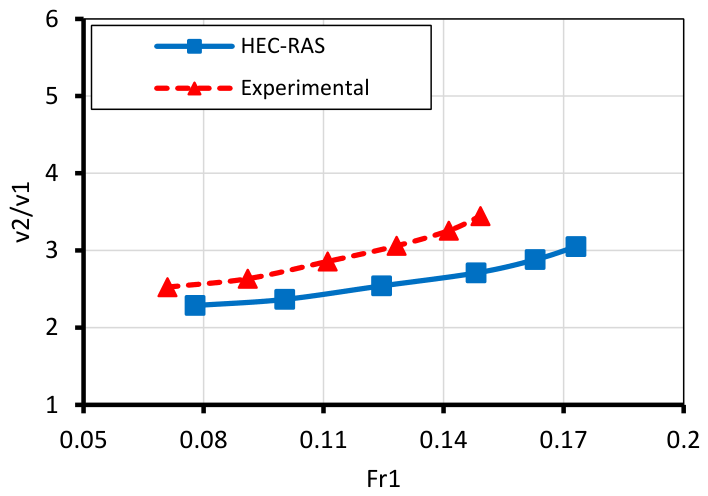
To assess the accuracy of HEC-RAS model, the computed relationships between the upstream Froude number (
Fr1) and the key dimensionless hydraulic parameters, namely relative energy loss (Δ
E/
y1), relative heading-up (
hu/
y1), relative downstream water depth (
y2/
y1), and relative velocity (
v2/
v1), were compared against the physical model measurements as shown in
Table 2 and
Table 3.
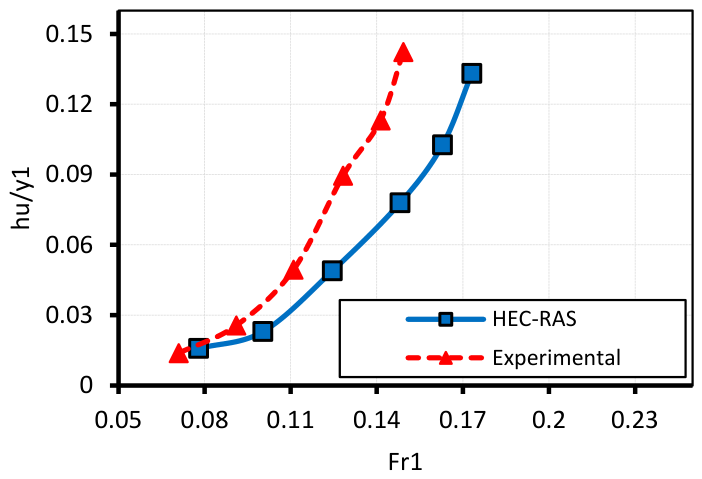
Figure 7,
Figure 8,
Figure 9 and
Figure 10 present these comparisons for the box-type wing-wall configuration with Z = 1:1, selected as a representative case.
For this configuration, increasing Fr1 produced consistent increases in both (ΔE/y1) and (hu/y1), a modest increase in (v2/v1), and a progressive decrease in (y2/y1). This behavior is physically consistent with the expected response of a contracting channel section to increasing flow intensity: higher discharges generate greater flow acceleration and turbulence, leading to increased energy losses and upstream water level rise. Satisfactory agreement was observed between the physical model measurements and the HEC-RAS numerical results, with average variations of 3.56% for hu/y1, 0.65% for y2/y1, 8.38% for ΔE/y1, and 10.40% for v2/v1, as calculated using Equation (5). The relatively higher variation for v2/v1 (10.40%) is consistent with the known limitation of models in resolving cross-sectional velocity distributions, where the model computes a single average velocity rather than the actual non-uniform velocity profile. This value remains within the range considered acceptable for hydraulic modeling in similar studies. Slight deviations are observed at higher Froude numbers, where the model systematically tends to underestimate both energy loss and heading-up. This systematic underestimation at higher Fr1 values is likely attributable to the increasing importance of three-dimensional flow effects, including stronger vortex formation and flow separation, at higher discharges, which cannot be fully captured by cross-sectional averaging.
The percentage variation (ε) between measured and computed values was calculated using:
The statistical evaluation demonstrated a good agreement between the experimental measurements and the HEC-RAS predictions. Among the investigated hydraulic parameters, the sequent depth ratio (y2/y1) showed the highest level of accuracy, yielding a mean percentage bias (MPB) of 0.65% and a mean absolute percentage error (MAPE) of only 0.77%, which indicates an almost unbiased prediction. The relative heading-up ratio (hu/y1) and the relative energy loss ratio (ΔE/y1) also exhibited satisfactory agreement, with MPB values of −3.56% and −8.38% and corresponding MAPE values of 9.32% and 9.72%, respectively. The velocity ratio (v2/v1) produced the largest deviation, with both MPB and MAPE equal to 10.40%; however, this level of error remains within acceptable limits for hydraulic modeling applications. Overall, the low MPB values and relatively small MAPE values confirm that the HEC-RAS model is capable of reproducing the hydraulic characteristics of the studied flow conditions with satisfactory accuracy and limited systematic bias.
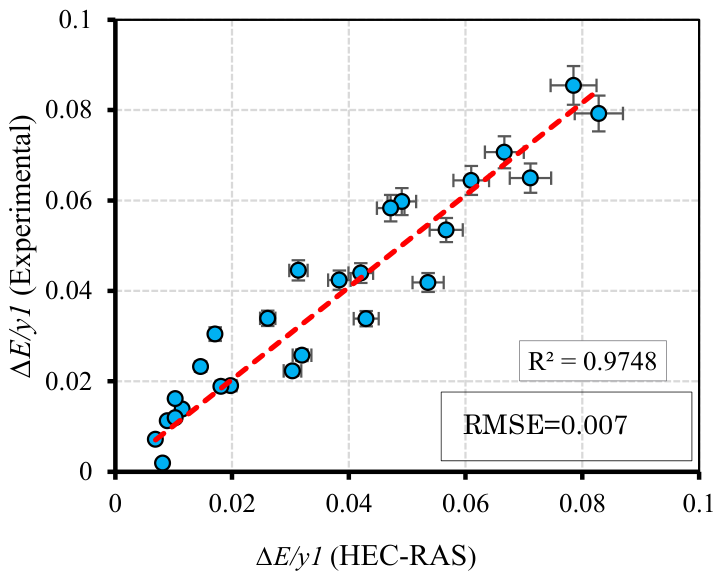
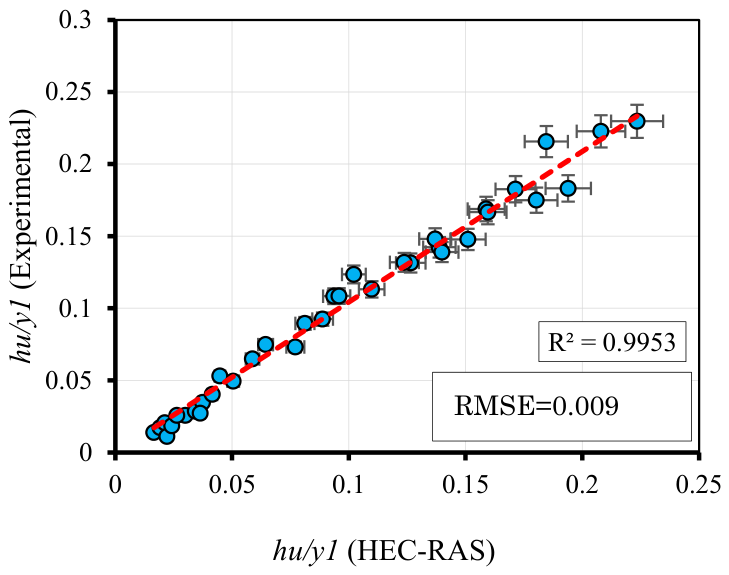
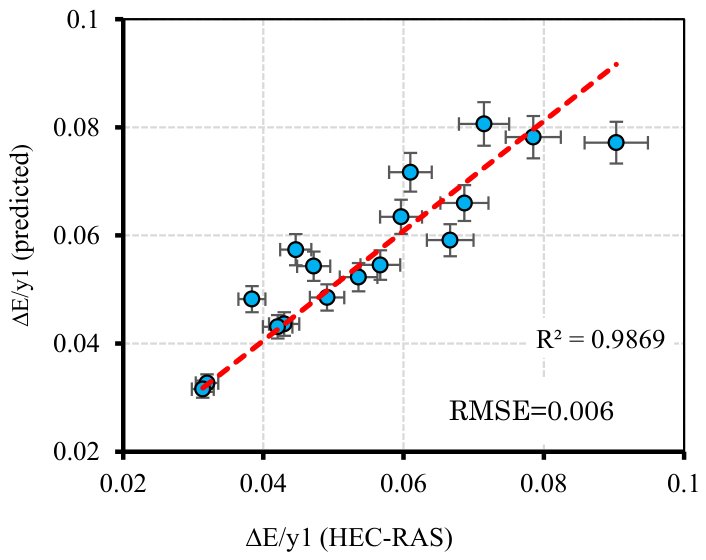
Figure 11 and
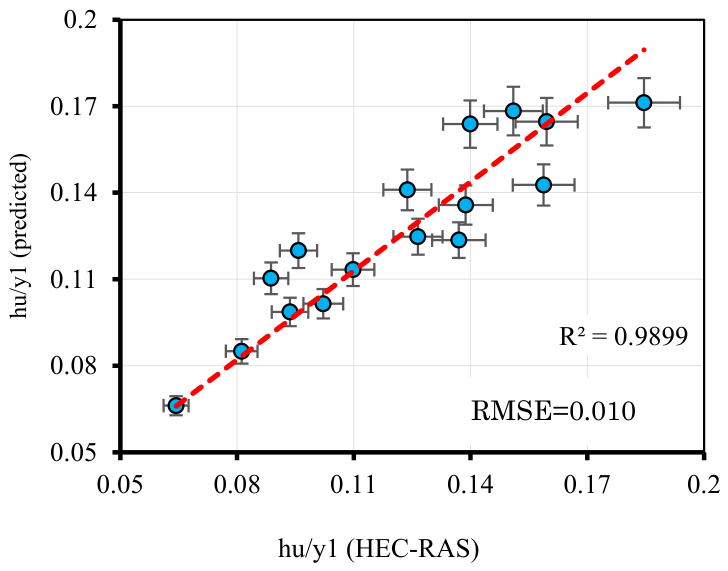
Figure 12 present the correlation between physical model measurements and HEC-RAS computed values for Δ
E/
y1 and
hu/
y1, respectively, pooled across all investigated configurations and canal inside slope values. The agreement between the measured and computed values of Δ
E/
y1 produced a coefficient of determination (R
2) of 0.9748 with a RMSE of 0.007, while
hu/
y1 produced an R
2 of 0.9953 and RMSE of 0.009. These statistics indicate that the HEC-RAS model reproduces the bulk hydraulic behavior of the investigated configurations with acceptable accuracy for the purposes of parametric design comparison. In both cases, the data points were closely distributed around the 1:1 agreement line, further indicating the capability of the HEC-RAS model to adequately reproduce the investigated bulk hydraulic parameters.
3.2. HEC-RAS Analysis of Hydraulic Behavior Under the Combined Effects of Wing-Wall Configuration with Different Canal Inside Slopes
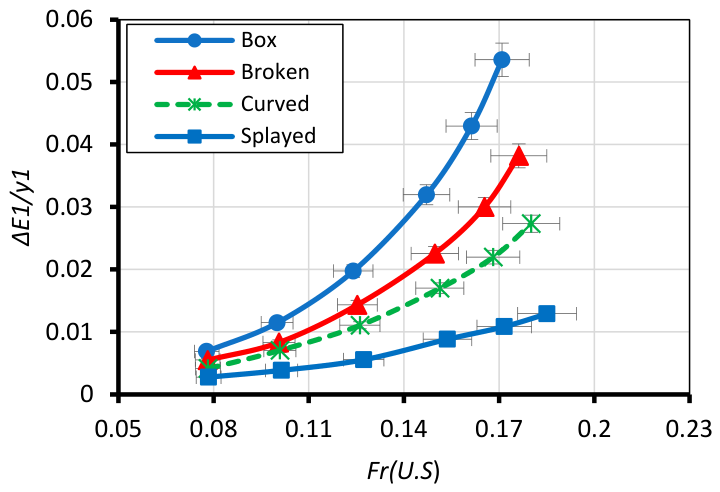
The HEC-RAS results presented in
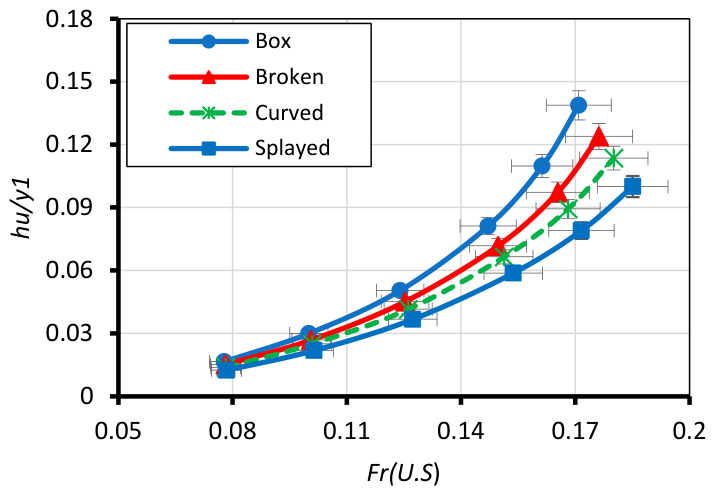
Figure 13,
Figure 14,
Figure 15 and
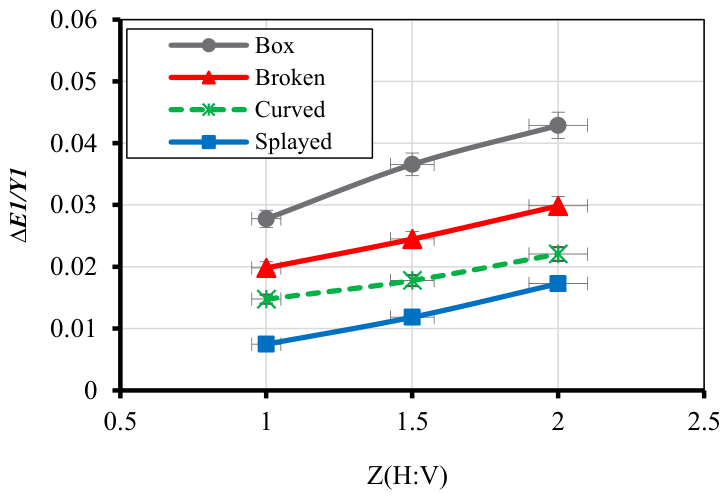
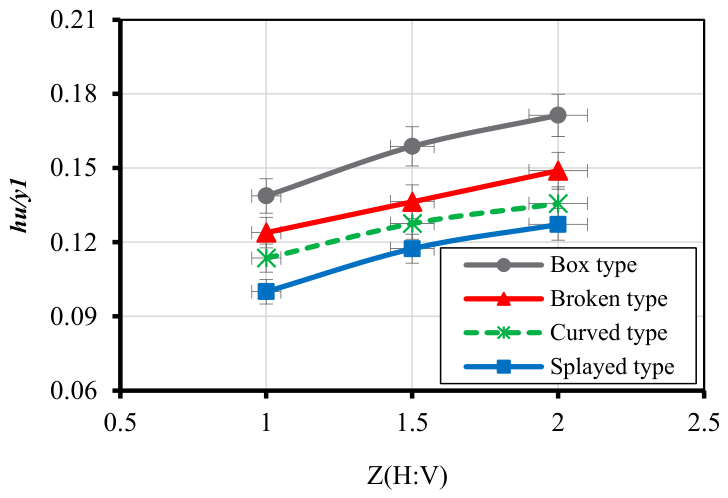
Figure 16 demonstrate that both the canal inside slope and upstream wing-wall configuration have a significantly influence on the hydraulic performance of the structure, particularly in terms of relative energy loss (Δ
E/
y1) and relative heading-up (
hu/
y1). The quantitative comparisons presented in this section are based on average values computed across the six simulated discharge levels (
Fr1 = 0.12–0.18).
For all investigated configurations, ΔE/y1 and hu/y1 increased progressively with increasing Fr1. This behavior is attributed to the increases in bulk flow velocity and momentum exchange near the transition zone at higher discharges, which intensify flow disturbances. Consequently, the model reflects these effects through greater computed hydraulic resistance and energy losses and larger upstream water surface rise. It should be noted that claims regarding flow separation, vortex formation, and turbulence dissipation as direct mechanisms cannot be verified from HEC-RAS output alone. These are inferred physical explanations consistent with the bulk hydraulic trends observed; confirmation of these localized mechanisms would require higher resolution 2D or 3D numerical modeling.
The results also indicate that a transition from Z = 1:1 to Z = 2:1 causes a consistent increase in both Δ
E/
y1 and
hu/
y1 for all wing-wall configurations, as shown in
Figure 15 and
Figure 16. Physically, wider canal side slopes expand the wetted flow cross-section near the structure entrance, increasing the interaction between the approaching flow and the wing walls. This interaction is associated with greater hydraulic resistance and energy dissipation. Moreover, the wider transition geometry reduces the flow contraction efficiency, causing greater afflux upstream of the structure.
Regarding wing-wall configurations, the box-type configuration produced consistently the highest values of both relative energy loss and heading-up across all investigated canal inside slope values and discharge levels. This is attributed to the abrupt geometric transition associated with the box-type configuration, which produces a sharp change in flow direction at the structure entrance. Compared with the box-type configuration, the broken-type wing wall reduced
hu/
y1 and Δ
E/
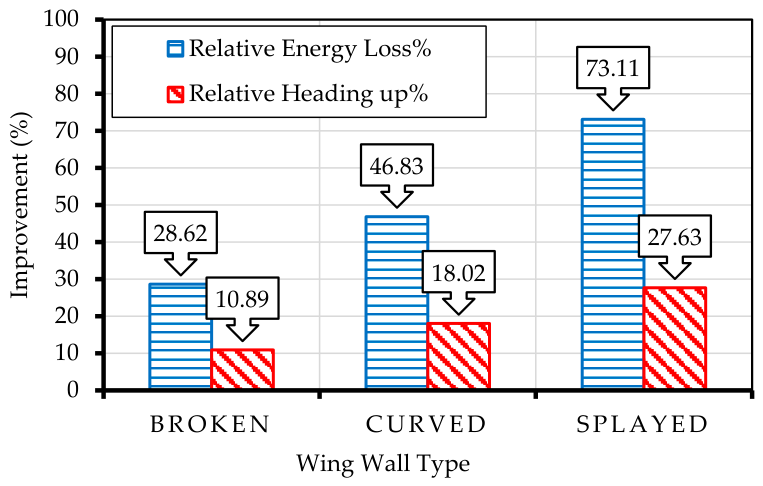
y1 by approximately 10.89% and 28.62%, respectively; these values represent averages computed across the six discharge levels at Z = 1:1 and are consistent with the trend reported by Ashour et al. [
13] for the same configuration. The curved-type wing wall provided greater improvement by reducing
hu/
y1 by approximately 18.02% and Δ
E/
y1 by approximately 46.83%. The splayed-type wing wall achieved the best hydraulic performance, with reductions of approximately 27.63% in h
u/y
1 and approximately 73.11% in Δ
E/
y1 compared with the box-type configuration. These results apply specifically to the Z = 1:1 canal inside slope condition; the corresponding improvement percentages for Z = 3:2 and Z = 2:1 are presented and discussed in the end of this section.
The performance hierarchy across configurations, splayed > curved > broken > box, was consistent across all three canal inside slope values, indicating that the relative hydraulic advantage of gradual entrance transitions is robust to changes in canal geometry within the investigated range. The superior performance of the splayed-type wing wall in terms of bulk energy loss and heading-up reduction is consistent with the gradual expansion geometry of this configuration, which is expected to produce smoother flow guidance and reduced hydraulic resistance at the structure entrance. In contrast, the broken- and curved-type wing walls exhibited intermediate hydraulic behavior, with the curved configuration consistently outperforming the broken type. This performance difference is reflected in the lower ΔE/y1 and hu/y1 values computed for the curved configuration relative to the broken type across all Fr1 values and canal inside slopes investigated.
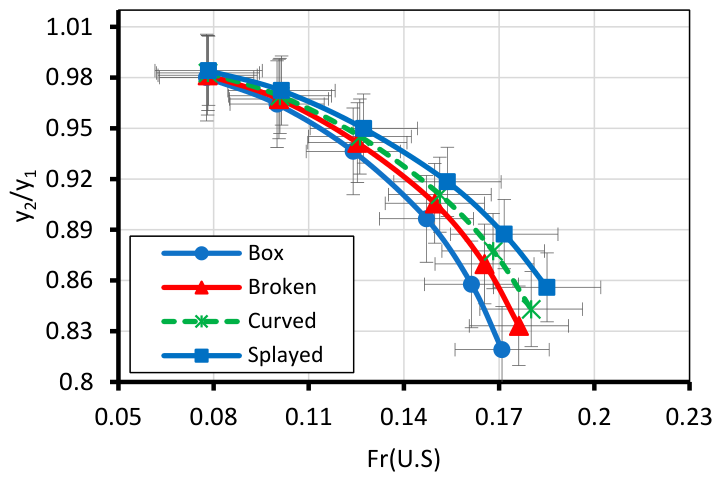
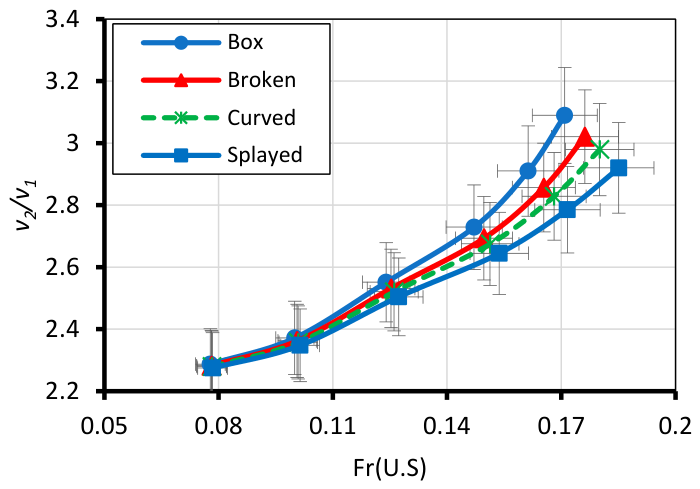
Figure 17 and
Figure 18 illustrate the influence of wing-wall configurations on the relative water depth (
y2/
y1) and relative velocity (
v2/
v1) at canal inside slope Z = 1:1. The results indicate that
y2/
y1 decreases with increasing upstream Froude number for all investigated wing-wall configurations. A decreasing
y2/
y1 with increasing Fr
1 indicates that the downstream depth becomes progressively smaller relative to the upstream depth, reflecting greater energy dissipation and flow acceleration through the contracted section. The box-type configuration exhibited the highest
y2/
y1, reflecting greater hydraulic losses associated with abrupt flow contraction. In contrast, the splayed-type wing wall produced the lowest
y2/
y1 values due to its gradual transition geometry, which is associated with reduced hydraulic resistance and improved hydraulic efficiency.
The relative velocity ratio (v2/v1) also increases progressively with increasing Fr1. This trend is physically expected: as Fr1 increases, the flow accelerates more strongly through the contracted section, producing higher velocity ratios regardless of wing-wall configuration. The splayed-type wing wall consistently produces the lowest velocity ratios compared with the box-type configuration, reflecting the lower hydraulic resistance associated with its gradual entrance geometry. Meanwhile, the box-type configuration generates the highest velocity ratios due to its abrupt entrance geometry and the associated greater contraction effects.
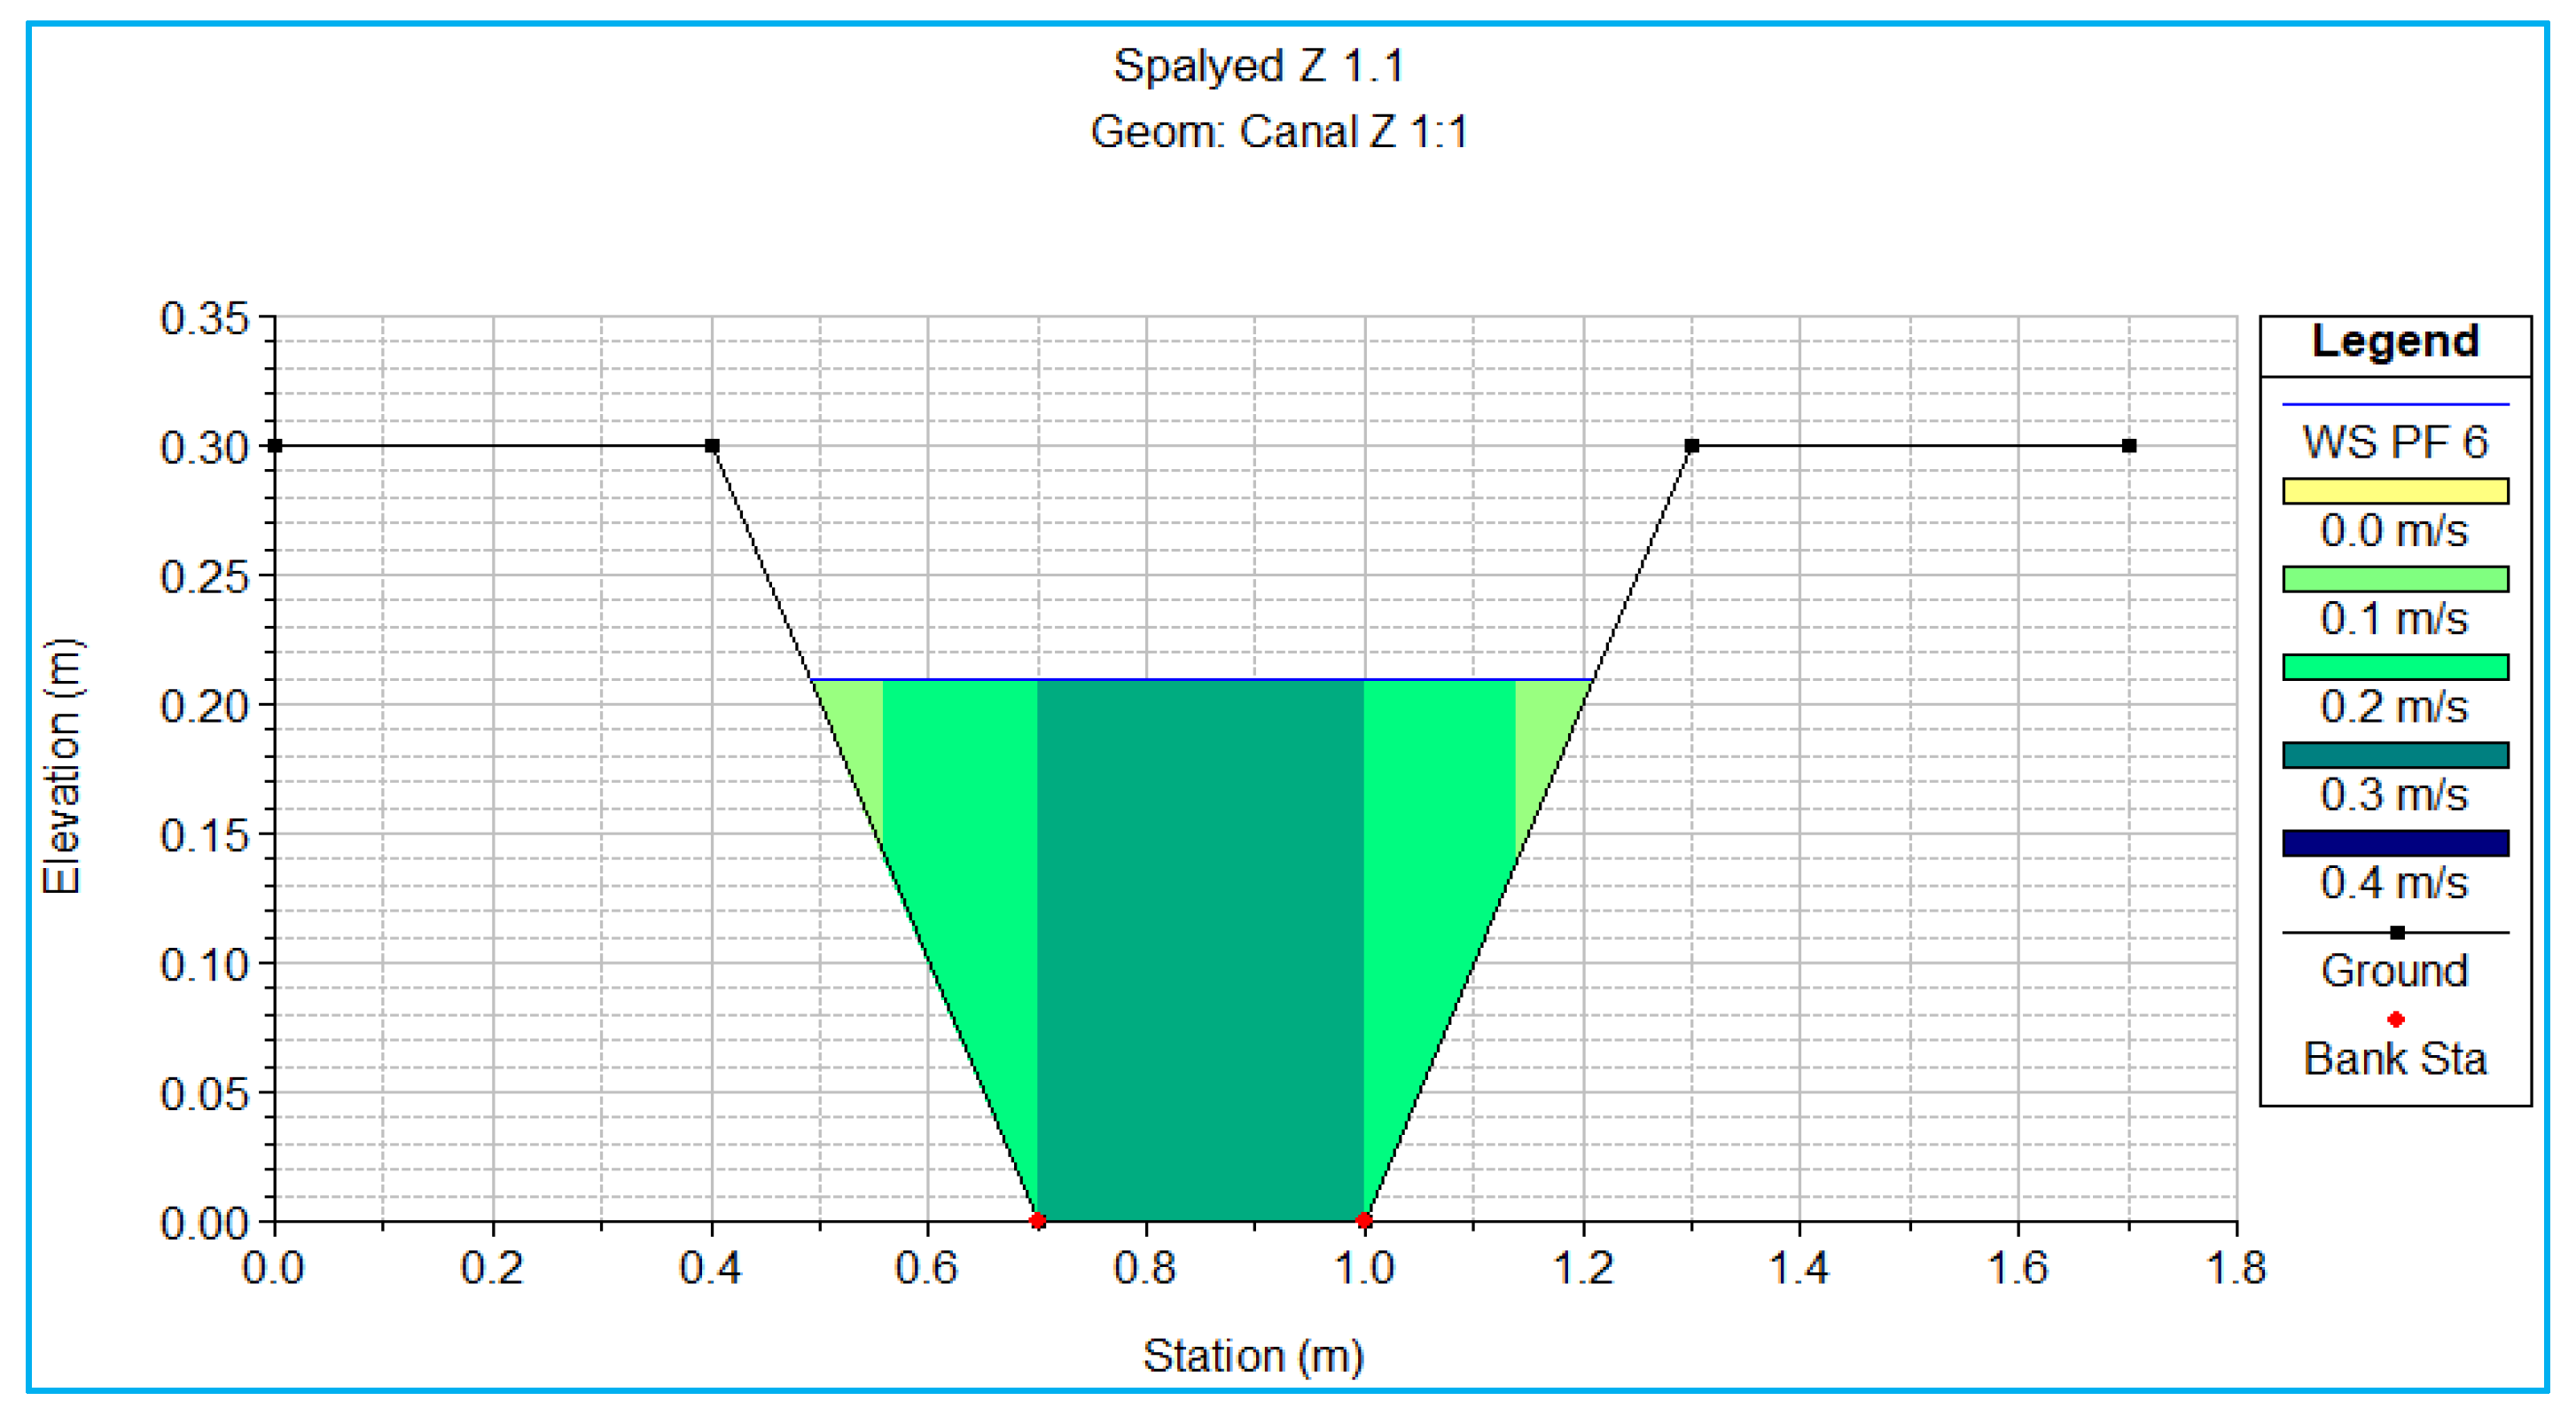
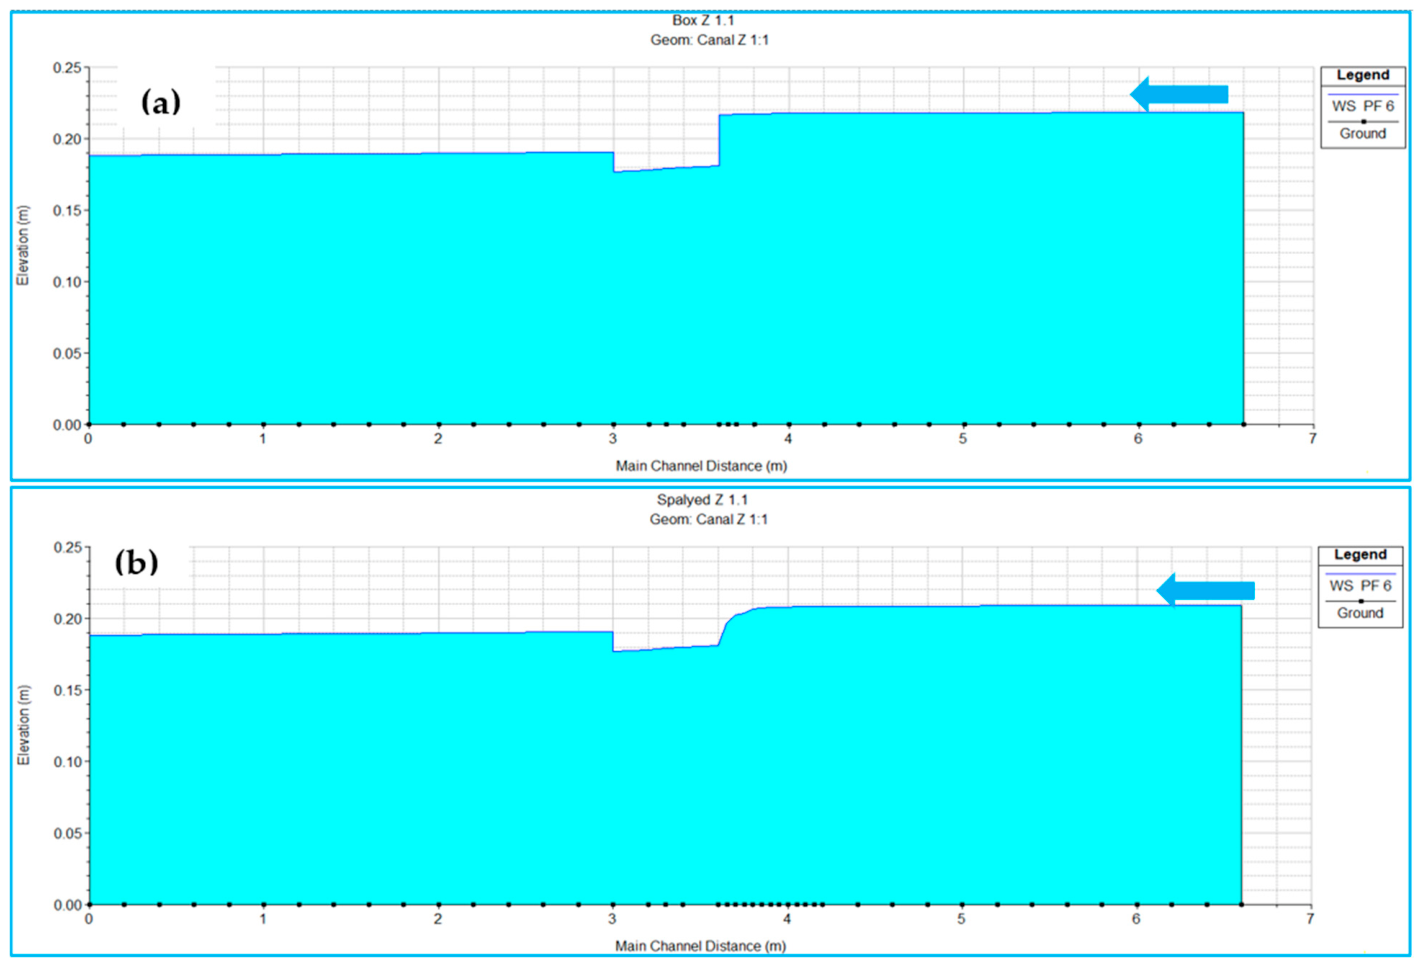
Figure 19 presents the water surface profiles computed for the box-type and splayed-type configurations at
Z = 1:1 under the maximum simulated discharge (PF 6). The splayed-type configuration produces a comparatively smoother surface profile with reduced afflux compared with the box-type configuration. The difference in upstream water surface elevation between the two configurations reflects the heading-up reduction quantified in
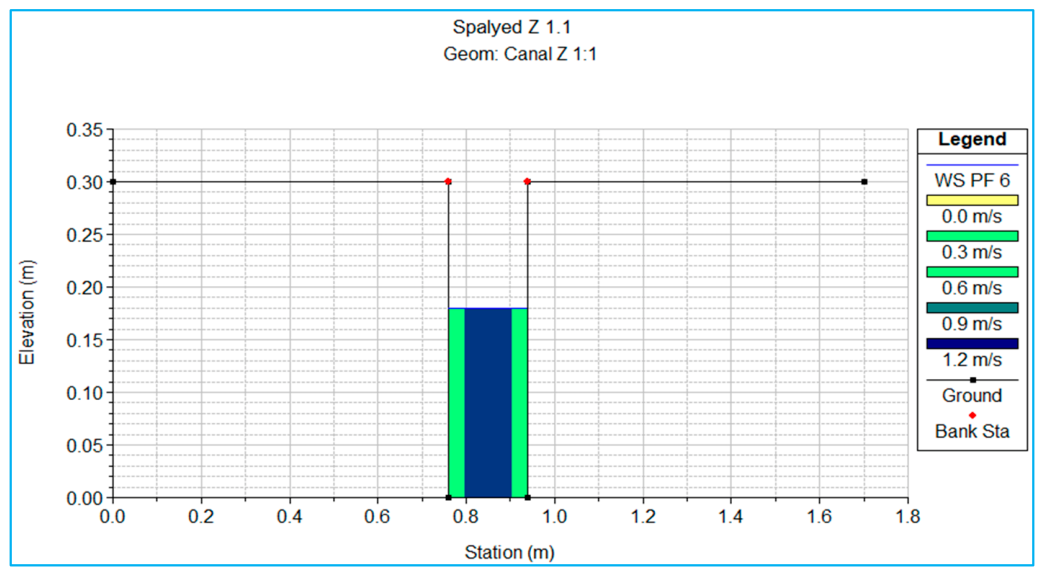
Section 3.2. Moreover, the cross-sectional velocity distributions presented in
Figure 20 and
Figure 21 show that the maximum velocities are concentrated near the channel centerline and increase within the contracted section due to flow acceleration, while the computed velocity distribution remain relatively uniform across the section. This behavior is consistent with the lower Δ
E/
y1 and
hu/
y1 values computed for the splayed-type configuration and supports the conclusion that gradual entrance geometries reduce hydraulic resistance within the investigated parametric range.
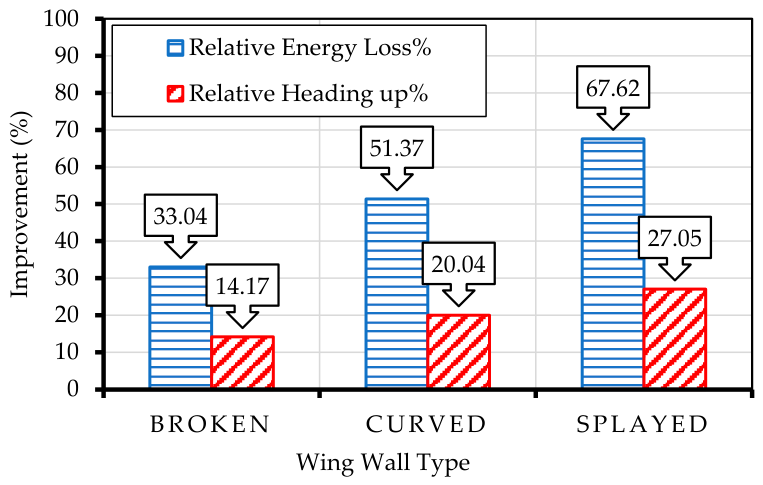
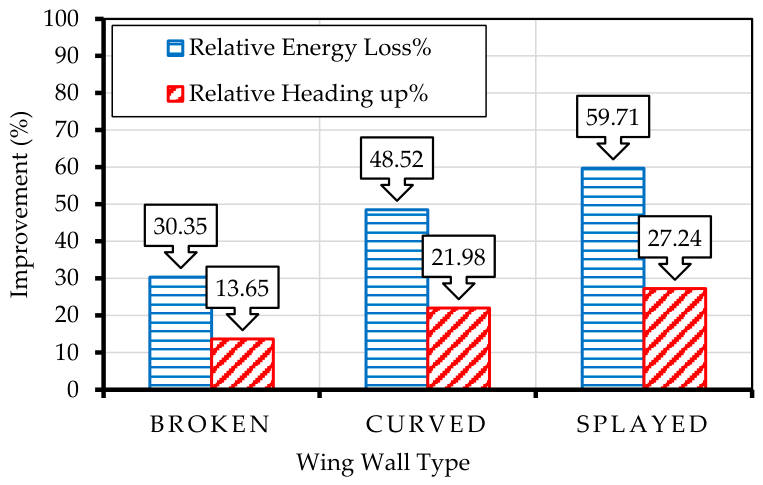
Figure 22,
Figure 23 and
Figure 24 present the percentage improvement in relative energy loss (Δ
E/
y1) and relative heading-up (
hu/
y1) for each upstream wing-wall configuration, compared with the box-type configuration, under the three canal inside slopes (Z = 1:1, 3:2, and 2:1). The results confirm that the splayed-type wing wall consistently achieves the greatest reduction in both Δ
E/
y1 and
hu/
y1 among all investigated configurations, followed in order by the curved and broken configurations. The maximum percentage reduction in relative energy loss reached approximately 73.11% for the splayed-type configuration under the canal inside slope of Z = 1:1, with a corresponding reduction in relative heading-up of approximately 27.63%; these represent the most favorable hydraulic conditions observed in the study. The percentage improvements in both Δ
E/
y1 and h
u/y
1 decrease progressively as the canal inside slope transitions from Z = 1:1 to Z = 2:1, for all non-box configurations. This trend indicates that the hydraulic advantage of gradual entrance transitions relative to the box type is most pronounced under steeper canal inside slope conditions (Z = 1:1) and diminishes as the slope becomes flatter. The physical implication is that, under wider canal geometries (Z = 2:1), the entrance transition geometry plays a comparatively smaller role in determining bulk hydraulic losses, potentially because the enlarged wetted cross-section dominates the hydraulic resistance regardless of wing-wall type. The reported hydraulic improvements substantially exceed both the estimated measurement uncertainty (±0.01–±1.22%) and the average model validation error (approximately 5.75%). Consequently, the observed differences among the investigated entrance configurations are considered to be practically significant and representative of genuine hydraulic performance improvements within the investigated conditions, rather than artifacts of measurement or numerical uncertainty.
4. Development and Statistical Validation of Empirical Equations
This section presents the development and statistical validation of empirical predictive equations for the two primary hydraulic performance indicators: relative energy loss (Δ
E/
y1) and relative heading-up
(hu/
y1). The equations were derived through nonlinear regression analysis applied to the HEC-RAS simulation results, following the dimensional analysis framework established in
Section 2.2. The statistical evaluation of the developed empirical equations is summarized in
Table 4, while the graphical comparison between predicted and HEC-RAS computed values for the box-type wing wall, presented as a representative example, is shown in
Figure 25 and
Figure 26. The proposed relationships show satisfactory agreement between the HEC-RAS values and the empirical predictions for estimating the relative energy loss (Δ
E/
y1) and relative heading-up (
hu/
y1) under the four upstream wing-wall configurations combined with the three canal inside slopes investigated. The equations were formulated as power-law functions of the canal inside slope (Z) and upstream Froude number (Fr
1), taking the general form:
where A, B, and C are empirically determined coefficients specific to each wing-wall configuration and response variable, as reported in
Table 4. These two variables were identified as the dominant governing parameters through the dimensional analysis presented in
Section 2.2, where the upstream Froude number (
Fr1) and canal inside slope (Z) were retained as the primary dimensionless variables after the Reynolds number, Weber number, contraction ratio, entrance angle, transition length, and bed slope were either shown to be negligible or held constant throughout the investigation. The physical basis for selecting a power-law form is that both Δ
E/
y1 and
hu/
y1 are expected to scale nonlinearly with
Fr1 under subcritical flow contraction conditions, consistent with classical energy loss relationships in open-channel hydraulics.
The reported statistical indicators demonstrate satisfactory predictive capability for all investigated configurations, with the adjusted coefficient of determination (R
2) ranging from 0.96 to 0.99 and RMSE values between 0.001 and 0.01.
Table 4 shows that equations for
hu/
y1 consistently exhibit slightly higher prediction accuracy than those developed for Δ
E/
y1, with adjusted R
2 values reaching 0.99 for the broken, curved, and splayed-type configurations. This difference in predictive accuracy between
hu/
y1 and Δ
E/
y1 equations may reflect the fact that heading-up is a more directly measured and spatially stable parameter, representing a single upstream water level rise, whereas energy loss integrates velocity and depth measurements at multiple cross-sections, introducing greater cumulative uncertainty into the fitted values. The box-type configuration equations produce the lowest adjusted R
2 values for Δ
E/
y1 (R
2 = 0.96), which is attributed to the greater hydraulic variability associated with the abrupt entrance geometry of this configuration, which produces a wider scatter in ΔE/y
1 values across the investigated
Fr1 and Z range and is less well approximated by a simple two-variable power-law model. This interpretation is consistent with the known behavior of abrupt contractions, where energy losses are more sensitive to local flow conditions and exhibit greater variability than in gradual transitions. In contrast, the broken-, curved-, and splayed-type configurations show consistently improved predictive performance reflected in higher adjusted R
2 values and lower RMSE, due to the smoother entrance geometry, which produces more regular hydraulic behavior and a tighter relationship between the governing variables (
Fr1, Z) and the computed performance indicators.
Specifically, the broken-type configuration equations yield adjusted R
2 values of 0.98 and 0.99 for Δ
E/
y1 and
hu/
y1, respectively, while the curved-type equations produce adjusted R
2 values of 0.97 and 0.99 for the same parameters. Similarly, the splayed-type configuration’s equations demonstrate the strongest overall agreement between empirical predictions and HEC-RAS computed values and produce the lowest RMSE values across all configurations (RMSE = 0.001 for Δ
E/
y1 and 0.004 for
hu/
y1), indicating the highest prediction accuracy for this configuration and the most regular hydraulic behavior associated with its gradual entrance geometry. The progressive improvement in equation fit from box to broken to curved to splayed configurations, reflected in both increasing R
2 and decreasing RMSE, is consistent with the performance hierarchy established in
Section 3.2 and suggests that the power-law functional form is increasingly appropriate as the entrance geometry becomes more gradually transitional.
Furthermore, all developed equations are statistically significant, as indicated by
p-values well below the significance threshold (
p < 0.001 for all equations) and correspondingly small Significance F values (ranging from 1.7 × 10
−8 to 5.17 × 10
−20, as reported in
Table 4). The high statistical significance of all equations is expected given the strong monotonic relationships between Fr
1, Z, and the hydraulic performance indicators within the narrow parametric range investigated (
Fr1 = 0.12–0.18; Z = 1:1 to 2:1). It should be noted that statistical significance does not by itself confirm physical validity or generalizability beyond the investigated range; the equations should be treated as empirical approximations calibrated to the specific geometric and flow conditions of this study. These findings confirm the statistical reliability of the proposed empirical relationships within the investigated hydraulic and geometric conditions.
The developed equations provide a practical preliminary design tool for estimating bulk hydraulic performance indicators, specifically ΔE/y1 and hu/y1. The equations are applicable to trapezoidal canal with the following geometric and hydraulic characteristics: upstream Froude number Fr1 in the range 0.12–0.18, canal inside slope Z between 1:1 and 2:1 (H:V), contraction ratio r = 0.6, entrance angle θ = 30°, and steady subcritical flow conditions. These constraints reflect the parametric scope of HEC-RAS simulations from which the equations were derived. Therefore, within these bounds, these relationships can assist in preliminary hydraulic design, performance evaluation, and systematic comparison between the four upstream wing-wall configurations studied under conditions similar to those considered in the present study.
Therefore, careful engineering judgment and site-specific assessment are recommended before applying the proposed equations under prototype-scale field conditions, particularly given that field factors such as sediment deposition, irregular channel geometry, vegetation, and non-uniform approach flow, which were not considered in the present study, may substantially alter hydraulic performance relative to the idealized laboratory conditions on which these equations are based. In particular, the contraction ratio (r = 0.6) and entrance angle (θ = 30°) were held constant throughout this investigation; sites with substantially different values of these parameters will require either additional calibration or an independent hydraulic analysis. The use of higher resolution 2D or 3D numerical modeling is recommended for detailed design applications where localized flow features, such as scour potential or velocity distribution near the wing walls, are of specific concern.
5. Discussion and Interpretation of Results
The hydraulic performance of water structures is strongly influenced by the interaction between the entrance geometry and upstream approach conditions. Accordingly, understanding the combined effect of canal inside slope and wing-wall configuration is essential for improving hydraulic efficiency, reducing energy loss, minimizing upstream afflux, and enhancing flow stability at water structures. As established in the Introduction, prior studies have predominantly examined wing-wall geometry and canal inside slope in isolation, with only one previous investigation, Ashour et al. [
13], partially addressing their combined interaction for a limited wing-wall type. The present study extends this prior work to a broader parametric basis, evaluating four wing-wall configurations across three canals inside slope values. Accordingly, the present study provides a systematic evaluation of this interaction using HEC-RAS simulations validated against physical model measurements. The discussion presented herein focuses on three interconnected themes: interpreting the bulk hydraulic behavior, examining the inferred physical mechanisms that are consistent with the observed flow patterns, and comparing the present findings with previously published investigations.
The present HEC-RAS results generally agree with the findings reported in the previous experimental and numerical investigations concerning the hydraulic behavior of canal contraction structures and the influence of entrance geometry on flow characteristics. The observed increases in ΔE/y
1 and h
u/y
1 with increasing upstream Froude number are consistent with the expected hydraulic response of a contracting channel section: as Fr
1 increases, greater flow momentum transfer occurs near the structure entrance, leading to higher hydraulic resistance and greater upstream water level rise. Similar trends were reported by Ahmed et al. [
26], who demonstrated that increasing flow intensity near hydraulic structures is associated with greater turbulence generation and elevated upstream water levels.
The HEC-RAS results also confirm that gradually transitioning wing-wall geometries produce lower bulk ΔE/y
1 and h
u/y
1 values compared with abrupt entrance configurations. The curved- and splayed-type configurations produce lower ΔE/y
1 and h
u/y
1 values than the conventional box-type configuration across all investigated canal inside slope values and Fr
1 levels, with the splayed type consistently achieving the greatest reductions (up to 73.11% in ΔE/y
1 and 27.63% in h
u/y
1 at Z = 1:1). The lower bulk energy losses computed for gradual configurations are consistent with the expected effect of smoother entrance geometry on flow guidance at the structure inlet, which is expected to reduce hydraulic resistance and minimize energy dissipation. Similar findings were reported by Ashour et al. [
12], and Ashour et al. [
13], who demonstrated that gradual entrance transitions are associated with reduced energy dissipation and improved hydraulic efficiency compared with abrupt wing-wall geometries; these findings were also obtained using HEC-RAS simulations under comparable flow conditions, providing methodologically consistent corroboration of the present results. Additional support comes from Barbhuiya et al. [
21,
22,
23], whose physical measurements around wing-wall abutments demonstrated that abrupt geometries generate stronger vortex structures and greater bed shear stress variability, effects that would be expected to manifest as higher bulk energy losses in simulations.
In contrast, the box-type configuration produces the highest computed bulk energy losses and velocity ratios among all investigated configurations, due to the abrupt entrance geometry and abrupt flow redirection at the structure inlet. The model reflects the greater hydraulic resistance of this configuration through consistently higher computed ΔE/y
1 and h
u/y
1 values across all investigated Fr
1 and Z combinations. The physical interpretation, that the sharp entrance geometry promotes flow separation, secondary circulation, and turbulence dissipation, is inferred from the computed bulk trends and is not directly observable from simulation output. These computed trends are broadly consistent with the experimental findings of Barbhuiya et al. [
21,
22,
23], who identified strong vortex structures and irregular wake regions in physical measurements around abrupt wing-wall abutment geometries, and whose results provide direct physical evidence for the three-dimensional flow mechanisms inferred in the present study.
The influence of canal inside slope on ΔE/y
1 and h
u/y
1 observed in the present study is consistent with the hypothesis that wider canal cross-sections near the entrance zone produce greater hydraulic resistance. Specifically, a transition from Z = 1:1 to Z = 2:1 consistently increased both ΔE/y
1 and h
u/y
1 across all four wing-wall configurations, as quantified in
Section 3.2 and
Figure 22,
Figure 23 and
Figure 24. A wider canal cross-section at the structure entrance enlarges the wetted perimeter and the flow interaction area with the side boundaries, which is expected to increase boundary friction effects and hydraulic resistance. As with the mechanisms discussed in the preceding paragraphs, the specific attribution to boundary shear enhancement and turbulence generation represents a physically plausible inference from the computed bulk trends rather than a directly measured or computed result. Consequently, higher ΔE/y
1 and h
u/y
1 values are consistently observed for wider canal inside slope geometries (Z = 2:1). Furthermore, the percentage improvement in ΔE/y
1 and h
u/y
1 afforded by the non-box configurations relative to the box type was found to decrease progressively with increasing canal inside slope (
Figure 22,
Figure 23 and
Figure 24), suggesting that the hydraulic advantage of gradual entrance transitions is most pronounced under steeper canal geometries and diminishes under wider cross-sectional conditions. This trend has practical implications for entrance-zone design: where site or geotechnical constraints necessitate wider canal side slopes, the selection of entrance configuration type becomes comparatively less critical in terms of bulk hydraulic performance, although gradual transitions remain preferable. This interpretation is consistent with the findings reported by Xiao et al. [
27], who demonstrated that canal inside slope geometry significantly affects momentum transfer and boundary shear stress distribution within open channels; however, it is noted that Xiao et al. [
27] investigated compound channel flow rather than canal contraction structures, and their findings are therefore qualitatively rather than quantitatively applicable to the present context.
The comparison between the HEC-RAS simulations and the physical model measurements, presented in detail in
Section 3.1, demonstrated satisfactory agreement for the key bulk hydraulic parameters, with R
2 values of 0.97–0.99 and overall average variations within 5.75%. This level of agreement supports the use of the model as a practical tool for parametric comparison of entrance-zone configurations under the investigated flow conditions, subject to the limitations noted in
Section 2.3 and
Section 3.1. The observed progressive increases in ΔE/y
1 and h
u/y
1 with increasing upstream Froude number are consistent across the numerical and physical model results. Similarly, the decrease in y
2/y
1 and the increases in v
2/v
1 agree reasonably well with the expected bulk hydraulic behavior under flow contraction conditions. It is acknowledged, however, that the agreement for v
2/v
1 was comparatively weaker (average variation of 10.40%), consistent with the known limitation of 1D cross-sectional averaging in capturing the non-uniform velocity distribution through contracted channel sections. This limitation should be borne in mind when the present velocity results are interpreted in the context of scour potential or sediment transport, which are sensitive to local rather than averaged velocity values.
The satisfactory agreement between the HEC-RAS simulations and the physical model measurements confirms that the adopted modeling approach is capable of reproducing the bulk hydraulic response of the investigated configurations with acceptable accuracy for the purposes of parametric design comparison. Specifically, the model adequately captures the influence of entrance geometry and canal inside slope on cross-sectionally averaged energy loss and heading-up, which are the primary design-relevant performance indicators assessed in this study. In addition, the numerical model adequately reproduces the differential influence of the four upstream wing-wall configurations and the three canal inside slopes on the bulk hydraulic performance indicators, confirming its suitability as a practical parametric design tool within the investigated range of conditions.
In addition to the hydraulic analysis, power-law empirical equations were developed to estimate ΔE/y
1 and h
u/y
1 as functions of Fr
1 and Z, taking the general form presented in
Section 4 (Equation (6)). The developed relationships show satisfactory predictive capability, with adjusted R
2 values of 0.96–0.99 and RMSE values of 0.001–0.01, indicating satisfactory agreement between the empirical predictions and the HEC-RAS simulation results. These equations provide a practical preliminary design tool for systematically evaluating the combined influence of Fr
1 and Z on bulk hydraulic performance within the investigated parametric range and may assist engineers in selecting optimized entrance configurations that minimize hydraulic losses and reduce upstream afflux. Several important limitations of the developed equations should be reiterated in this context. First, the equations were calibrated against HEC-RAS simulation outputs rather than directly against physical model measurements, meaning their accuracy is contingent on the validity of the modeling approach. Second, the equations are strictly valid within the ranges Fr
1 = 0.12–0.18, Z = 1:1 to 2:1, r = 0.6, and θ = 30°; extrapolation beyond these bounds is not supported by the present data. Third, field factors including sediment deposition, vegetation, and non-uniform approach flow were not accounted for and may alter the performance of the recommended configurations under prototype conditions.
The two-way ANOVA was performed on the results of the four primary dimensionless performance indicators (Δ
E/
y1,
hu/
y1,
y2/
y1, and
v2/
v1) using a 4 × 3 factorial design (four wing-wall configurations × three canal inside slopes) with six replicate discharge values per cell, as described in
Section 2.5. The analysis confirmed that both canal inside slope and wing-wall configuration significantly influenced the overall hydraulic response of the investigated intake configurations. For Δ
E/
y1, the analysis yielded F = 27.92 for the wing-wall configuration factor and F = 24.40 for the canal inside slope factor, with both effects significant at
p < 0.001.
The partial eta-squared effect size for wing-wall configuration was η2p = 0.233, indicating a large practical effect, whereas the effect size for canal inside slope was η2p = 0.150, indicating a moderate practical effect. The interaction term (configuration × slope) produced F = 0.912 (p = 0.487), indicating that the performance ranking of the wing-wall configurations remained consistent across the three canal inside slope values. The corresponding interaction effect size was very small (η2p = 0.019), confirming that the combined influence of configuration and canal inside slope was negligible for this hydraulic parameter.
Similarly, h
u/y
1 exhibited a statistically significant response to wing-wall configuration (F = 3.30,
p = 0.038), confirming its sensitivity to entrance-zone geometry. However, the relatively lower F-value compared with ΔE/y
1 indicates that heading-up is less strongly affected by configuration type than energy loss. This observation is consistent with the experimental results presented in
Section 3.2, where the maximum reduction in h
u/y
1 reached 27.63%, compared with a substantially larger reduction of 73.11% for ΔE/y
1.
The Tukey HSD post-hoc test identified the specific configurations and slope levels responsible for these differences. The canal inside slope Z = 1:1 produced significantly lower Δ
E/
y1 than Z = 2:1 (mean difference = 0.0132,
p < 0.001, Cohen’s d = 0.89), representing a large effect size according to conventional benchmarks [
36]. Likewise, the splayed-type wing-wall configuration resulted in significantly lower Δ
E/
y1 than the conventional box-type configuration (mean difference = 0.0131,
p < 0.001, Cohen’s d = 1.31), also representing a large effect. The similar meaning differences and effect sizes for these two comparisons (slope effect: Δ = 0.0132, d = 0.89; splayed vs. box: Δ = 0.0131, d = 1.31) indicate that the choice of wing-wall configuration has a practically comparable influence on bulk energy loss to the choice of canal inside slope within the investigated parametric range. This is a practically significant finding that supports the recommendation of gradual entrance configurations as an effective design strategy for reducing hydraulic losses, independent of canal inside slope.
When interpreting the statistical results, both statistical significance and practical significance should be considered. Although some comparisons exhibited relatively small numerical differences, the major hydraulic improvements reported in this study substantially exceeded the estimated measurement uncertainty (±0.01–±1.22%) and the average model validation error (approximately 5.75%). Therefore, the observed reductions in relative energy loss and heading-up represent meaningful engineering improvements rather than variations arising from measurement uncertainty or numerical prediction error. Nevertheless, comparisons involving relatively small differences should be interpreted with appropriate consideration of the reported uncertainty levels.
These findings demonstrate that both canal inside slope and wing-wall configuration are statistically significant and practically important factors governing computed bulk hydraulic performance and support the adoption of gradual entrance configurations, particularly the splayed and curved types, to improve flow conditions and reduce hydraulic losses within the parametric range investigated in this study.




 ,
,