Article

Pathways Toward Sustainable Dairy Production: Scale Economies and Human Capital Barriers in the Heterogeneous Adoption of Digital Technologies in China

1
School of Economics and Management, Shandong Institute of Petroleum and Chemical Technology, Dongying 257061, China
2
College of Economics and Management, Nanjing Agricultural University, Nanjing 210095, China
3
School of Economics, Nanjing University of Finance and Economics, Nanjing 210023, China
4
Animal Husbandry Development Service Center, Dongying 257061, China
*
Authors to whom correspondence should be addressed.
Sustainability 2026, 18(16), 8238; https://doi.org/10.3390/su18168238
Submission received: 17 June 2026 / Revised: 8 August 2026 / Accepted: 9 August 2026 / Published: 11 August 2026
(This article belongs to the Special Issue Innovative Strategies for Sustainable Livestock Production)

Abstract

Livestock digital technologies are pivotal to advancing sustainable agricultural development. However, their adoption rates in China’s livestock sector remain relatively low. Existing studies have largely overlooked the heterogeneous mechanisms through which herd size relates to the adoption of different types of agricultural digital technologies. Drawing on survey data from scaled dairy farms, this research employs an Instrumental Variable Probit (IV Probit) model to empirically examine the relationship between herd size and the adoption of information-intensive and knowledge-embedded digital technologies, as well as their effects on farm economic sustainability. The results indicate that herd size is positively associated with the adoption of both types of digital technologies. Further analysis reveals that herd expansion is associated with lower material and learning costs and higher sunk costs of farm-specific human capital. Moreover, the results suggest that the adoption of either type of digital technology is positively and significantly correlated with farm economic sustainability. These findings suggest that it is imperative to actively promote moderate-scale farm operations. Additionally, improving agricultural subsidy policies may promote the uptake of digital technologies to advance sustainable dairy farming.

1. Introduction

Digital technologies are increasingly recognized as pivotal instruments in reducing costs, enhancing operational efficiency, and promoting sustainability in agricultural production [1]. Within the livestock sector, the development and adoption of these technologies are essential for ensuring stable supplies of meat, eggs, and dairy products, increasing the income of farming households, and ultimately contributing to rural revitalization. Recognizing this imperative, the Chinese government has released a series of policies to accelerate the advancement of digital technologies in livestock production. For instance, in 2024, the Ministry of Agriculture and Rural Affairs released the Guiding Opinions on Vigorously Developing Smart Agriculture, which explicitly promotes intelligent large-scale breeding. More recently, the “No. 1 central document” for 2025 underscored the need to expand the application of data-driven and artificial intelligence technologies across the agricultural sector. Despite these policy imperatives, the adoption of digital technologies is still constrained within China’s livestock farming, and their application differs sharply by technology type. According to the China Digital Rural Development Report (2022) [2], the informatization rate of agricultural production was a mere 25.4% in 2021, substantially below the target of over 40% set by national guidelines for 2035. At the farm level, evidence from a 2020 survey of large-scale dairy farms in Shandong Province reveals a stark disparity: while 25.8% of farms had adopted digital estrus detection systems, only 14.2% utilized digital manure management systems [3]. Under these conditions, the sluggish diffusion of digital production and management systems has constrained productivity growth in the livestock sector [4]. Accelerating the adoption of digital technologies has become a critical challenge in China’s pursuit of agricultural modernization.
A growing body of literature has examined technology adoption in livestock production from various perspectives. However, systematic analysis of digital technology adoption remains relatively scarce. The first strand of this literature focuses on traditional livestock technologies. For example, studies have found that memory limitations negatively affect the application of disease control technologies [5]. Farm size and technical characteristics also significantly influence the adoption of manure detection technologies [6], while the economic, social, and environmental factors critically influence the adoption of feeding technologies [7]. A second, more recent strand of research has begun to investigate digital technologies in the livestock sector. Several studies have highlighted the importance of herd size in the adoption of such technologies [8], with larger farms more likely to adopt at least one form of precision agriculture technology [9]. Moreover, farmers’ human capital, digital knowledge, gender, perceptions, experience of extreme weather, cooperative membership, and family characteristics have been found to significantly influence farmers’ willingness to adopt digital agricultural technologies [10,11,12,13,14].
However, these studies have largely treated digital technologies as a homogeneous category, and little empirical attention has been paid to the divergent associations between herd size and the uptake of heterogeneous digital technologies within the dairy sector. This research gap warrants attention, given the high capital requirements and substantial learning costs associated with digital technology adoption [15]. To address this, we draw on a theoretical framework that classifies digital technologies into two distinct types according to their value-delivery mode and required operator skill level: information-intensive and knowledge-embedded digital technologies [16].
Information-intensive digital technologies are defined as those that employ controllers, onboard sensors, and actuators to capture production data, convert it into digital information, and provide timely information to support decision-making. However, their effective use requires operators to invest time and resources in acquiring additional specialized skills [17]. For example, digital estrus detection systems rely on wearable sensors to record daily step count data, generating monitoring information that supports decision-making in the dairy sector. The core value of such technologies lies in mitigating information asymmetry in traditional agricultural production. However, this value cannot be realized if operators lack the ability to interpret the provided information. In contrast, knowledge-embedded technologies are defined as those that integrate advanced intelligent digital systems and deliver value that is inherently embedded in the technology itself, without requiring additional operator skills [18]. For instance, digital manure management systems enable automated continuous manure removal in dairy farms. The core value of such technologies lies in addressing inefficiency of manual agricultural management.
This conceptual distinction raises several interrelated questions with both theoretical and policy-related significance: Do these two categories exhibit heterogeneous adoption patterns? Is herd size associated with the heterogeneous adoption of digital technologies? And which policy instruments are most effective in encouraging digital technology application in dairy production? This study aims to provide rigorous answers to these questions by analyzing survey data from scaled dairy farms in Shandong Province. Our empirical investigation focuses on the relationship between herd size and the uptake of both technology types, as well as the mechanisms underpinning this relationship. Our findings reveal three main results. First, herd size is positively associated with the adoption of heterogeneous agricultural digital technologies. Second, larger herd size exhibits lower material and learning costs for both technology types, but with higher sunk costs of farm-specific human capital for information-intensive technologies. Third, compared with non-adoption, the joint adoption of digital technologies on larger farms is associated with higher dairy productivity and farm profitability.
This research makes three marginal contributions to the existing literature. First, by explicitly distinguishing between information-intensive and knowledge-embedded digital technologies [19], we offer nuanced empirical evidence on the scale-technology adoption nexus within China’s dairy sector, a context that remains empirically underexplored. Although the general relationship between farm size and technology adoption has been extensively studied [20,21]. Our disaggregated approach reveals whether this relationship holds uniformly across different types of digital technologies. Second, we propose a novel analytical framework that links herd size to technology adoption through three mediating channels: material costs, learning costs, and sunk costs of farm-specific human capital. While prior work has examined the role of material costs [22,23], the mediating roles of learning costs and the sunk costs of human capital (recognized as critical barriers to adoption [24,25]) have been largely overlooked. Our research directly addresses this gap. Third, we extend the analysis to examine the economic implications, exploring linkages between the interaction of herd size and digital technology adoption, dairy productivity, and farm profitability. While numerous studies have linked farm size, technology, and productivity indicators such as technical efficiency [26] and total factor productivity [27], the specific links between herd size, heterogeneous technology adoption, and yields and profits remain unclear. Farm profit is a central goal of agricultural production, yet data on farm profit are difficult to collect. Drawing on a comprehensive survey, this study contributes to the literature by shedding light on these previously underexplored effects.

2. Technical Background and Theoretical Analysis

2.1. Background of Digital Livestock Technologies

Digital technologies have significantly enhanced both resource allocation efficiency and productivity in livestock production systems [28]. Digital technologies applied in dairy production include digital estrus detection systems and digital manure management systems. We select digital estrus detection systems as representative of information-intensive digital technologies, given that reproductive performance constitutes a core determinant of lactation output. Timely and accurate estrus detection is essential for successful insemination, conception, and calving, which is a prerequisite for milk production. Delayed detection reduces conception rates and prolongs the non-pregnant period, thereby increasing feeding and labor costs and disrupting milk supply. Digital manure management systems are chosen as representative of knowledge-embedded digital technologies, as manure management is essential to dairy operations. Manure decomposition generates ammonia (NH3) and hydrogen sulfide (H2S). Elevated NH3 levels reduce cow immunity and productivity, while H2S impairs reproductive performance.
As digital technologies, digital estrus detection systems and digital manure management systems share several common characteristics. On the one hand, both technologies exhibit a degree of indivisibility. Digital estrus detection systems require the joint usage of signal receivers and computing systems, while digital manure management systems are usually developed as fixed facilities and typically cannot be separated into independent components. On the other hand, both are marked by substantial capital requirements and uncertain returns, with effective use depending on learning processes and information sharing.
At the same time, however, the two technologies differ in functional terms. Digital estrus detection systems are decision-support tools designed to identify reproductive status based on monitoring outputs from sensing technologies. They replace human observation experience with data-driven analysis to support production decisions. In conventional farm management, estrus identification has depended on manual observation, with farmers drawing on their experience to judge outward behavioral and physiological signs, including mounting behavior, rumination, body temperature, and feed intake. Under large-scale production conditions, however, the detection rate achieved through such observation typically falls below 50% [29]. This constraint depresses reproductive efficiency, which in turn reduces total milk production. In operational terms, digital estrus detection technologies depend on wearable sensors affixed to animals, most commonly on the leg or neck, to capture daily step count data via a signal receiver. Those data are then sent to computer software for statistical analysis, generating the monitoring information system for an analysis report. By displacing manual, experience-based assessment with automated, data-driven monitoring, such systems improve estrus detection accuracy markedly, thereby contributing to higher milk yield.
In contrast, digital manure management systems are directly implemented in the production process by replacing conventional equipment, such as loaders, and improving production efficiency. Large-scale and intensive farming have increasingly led to a decoupling of crop cultivation from livestock raising, resulting in the generation of substantial volumes of dairy manure. Under the conventional system of farming, manure removal involves manual labor or use of loaders, which slows the process and often leads to severe environmental pollution [30]. Powered by electricity, digital manure management systems automate continuous manure removal, effectively overcoming the inefficiencies of traditional methods and ensuring sanitary farm conditions [31].

2.2. Theoretical Analysis and Research Hypotheses

Digital technologies share several common characteristics, including indivisibility, high capital intensity, and uncertain returns [32]. First, according to economies of scale, an expansion in production size reduces material costs. Given the indivisibility of both types of digital technologies, their unit acquisition costs decline as herd size increases, thereby promoting adoption. Second, knowledge acquisition also exhibits size economies, implying that larger herd size reduces average learning costs [33]. Since the returns to both types of digital technologies are uncertain, effective learning and information exchange are required prior to adoption. As herd size expands, the per-unit learning cost decreases, which in turn facilitates the adoption of both types of digital technologies.
In addition, the two types of digital technologies exhibit distinct characteristics. Information-intensive digital technologies provide knowledge that substitutes for experiential know-how and supports production decision-making, whereas knowledge-embedded digital technologies derive value from the technologies themselves and substitute for other capital inputs to improve productivity [34]. Drawing on asset specificity theory, production experience constitutes a form of farm-specific human capital that is accumulated through on-farm learning and tailored to its production environment. Unlike general human capital, which is readily transferable across farms, this specific human capital offers limited value outside the current operation. When a farmer considers adopting an information-intensive technology that disrupts herd management and decision-making routines, the accumulated production experience may become a sunk cost. Accordingly, more extensive production experiences raise the sunk costs of adopting information-intensive digital technologies. By contrast, because the value of knowledge-embedded digital technologies is embodied in the technologies themselves, their adoption does not increase the sunk cost of farm-specific human capital. Moreover, as farms expand in scale, the degree of internal specialization tends to increase, which may further raise sunk costs [35]. Within the context of dairy production, farm expansion is likely to inhibit the adoption of information-intensive digital technologies by raising the sunk costs associated with production experience as a form of farm-specific human capital, while having no such effect on the adoption of knowledge-embedded digital technologies.
Based on the above analysis, the following hypotheses are proposed:
Hypothesis 1.
An increase in herd size promotes the adoption of both information-intensive and knowledge-embedded digital technologies.
Hypothesis 2.
Herd size facilitates the adoption of digital technologies by reducing material and learning costs.
Hypothesis 3.
Herd size inhibits the adoption of information-intensive digital technologies by increasing the sunk costs associated with farm-specific human capital.

3. Materials and Methods

3.1. Data Sources

The empirical analysis draws on multiple data sources.
First, the primary farm-level data were obtained from a survey conducted in Shandong Province, China, during July and August 2020. The survey targeted scaled dairy farms, encompassing both medium-sized farms (50–499 head) and large-sized farms (≥500 head), following the classification criteria issued by China’s Ministry of Agriculture and Rural Affairs. Shandong Province was selected for two main reasons. First, Shandong is one of China’s leading dairy-producing provinces. According to China Dairy Yearbook data collected over the 2016–2020 period, Shandong ranks among the top nationally in milk output, dairy cattle inventory, and the number of scaled dairy farms. From 2016 to 2020, Shandong’s milk production accounted for approximately 7% of the total national milk output, ranking fourth in the country; its number of dairy cows accounted for about 8.5% of the national total, ranking fifth in the country; its proportion of scaled dairy farms accounted for 64% of the national total, ranking fourth among the top ten major dairy-producing provinces. Second, scaled dairy farms in Shandong have been early adopters of digital technologies. In 2019, the adoption rates of digital management and intelligent management systems reached 42.2% and 17.5%, respectively [3].
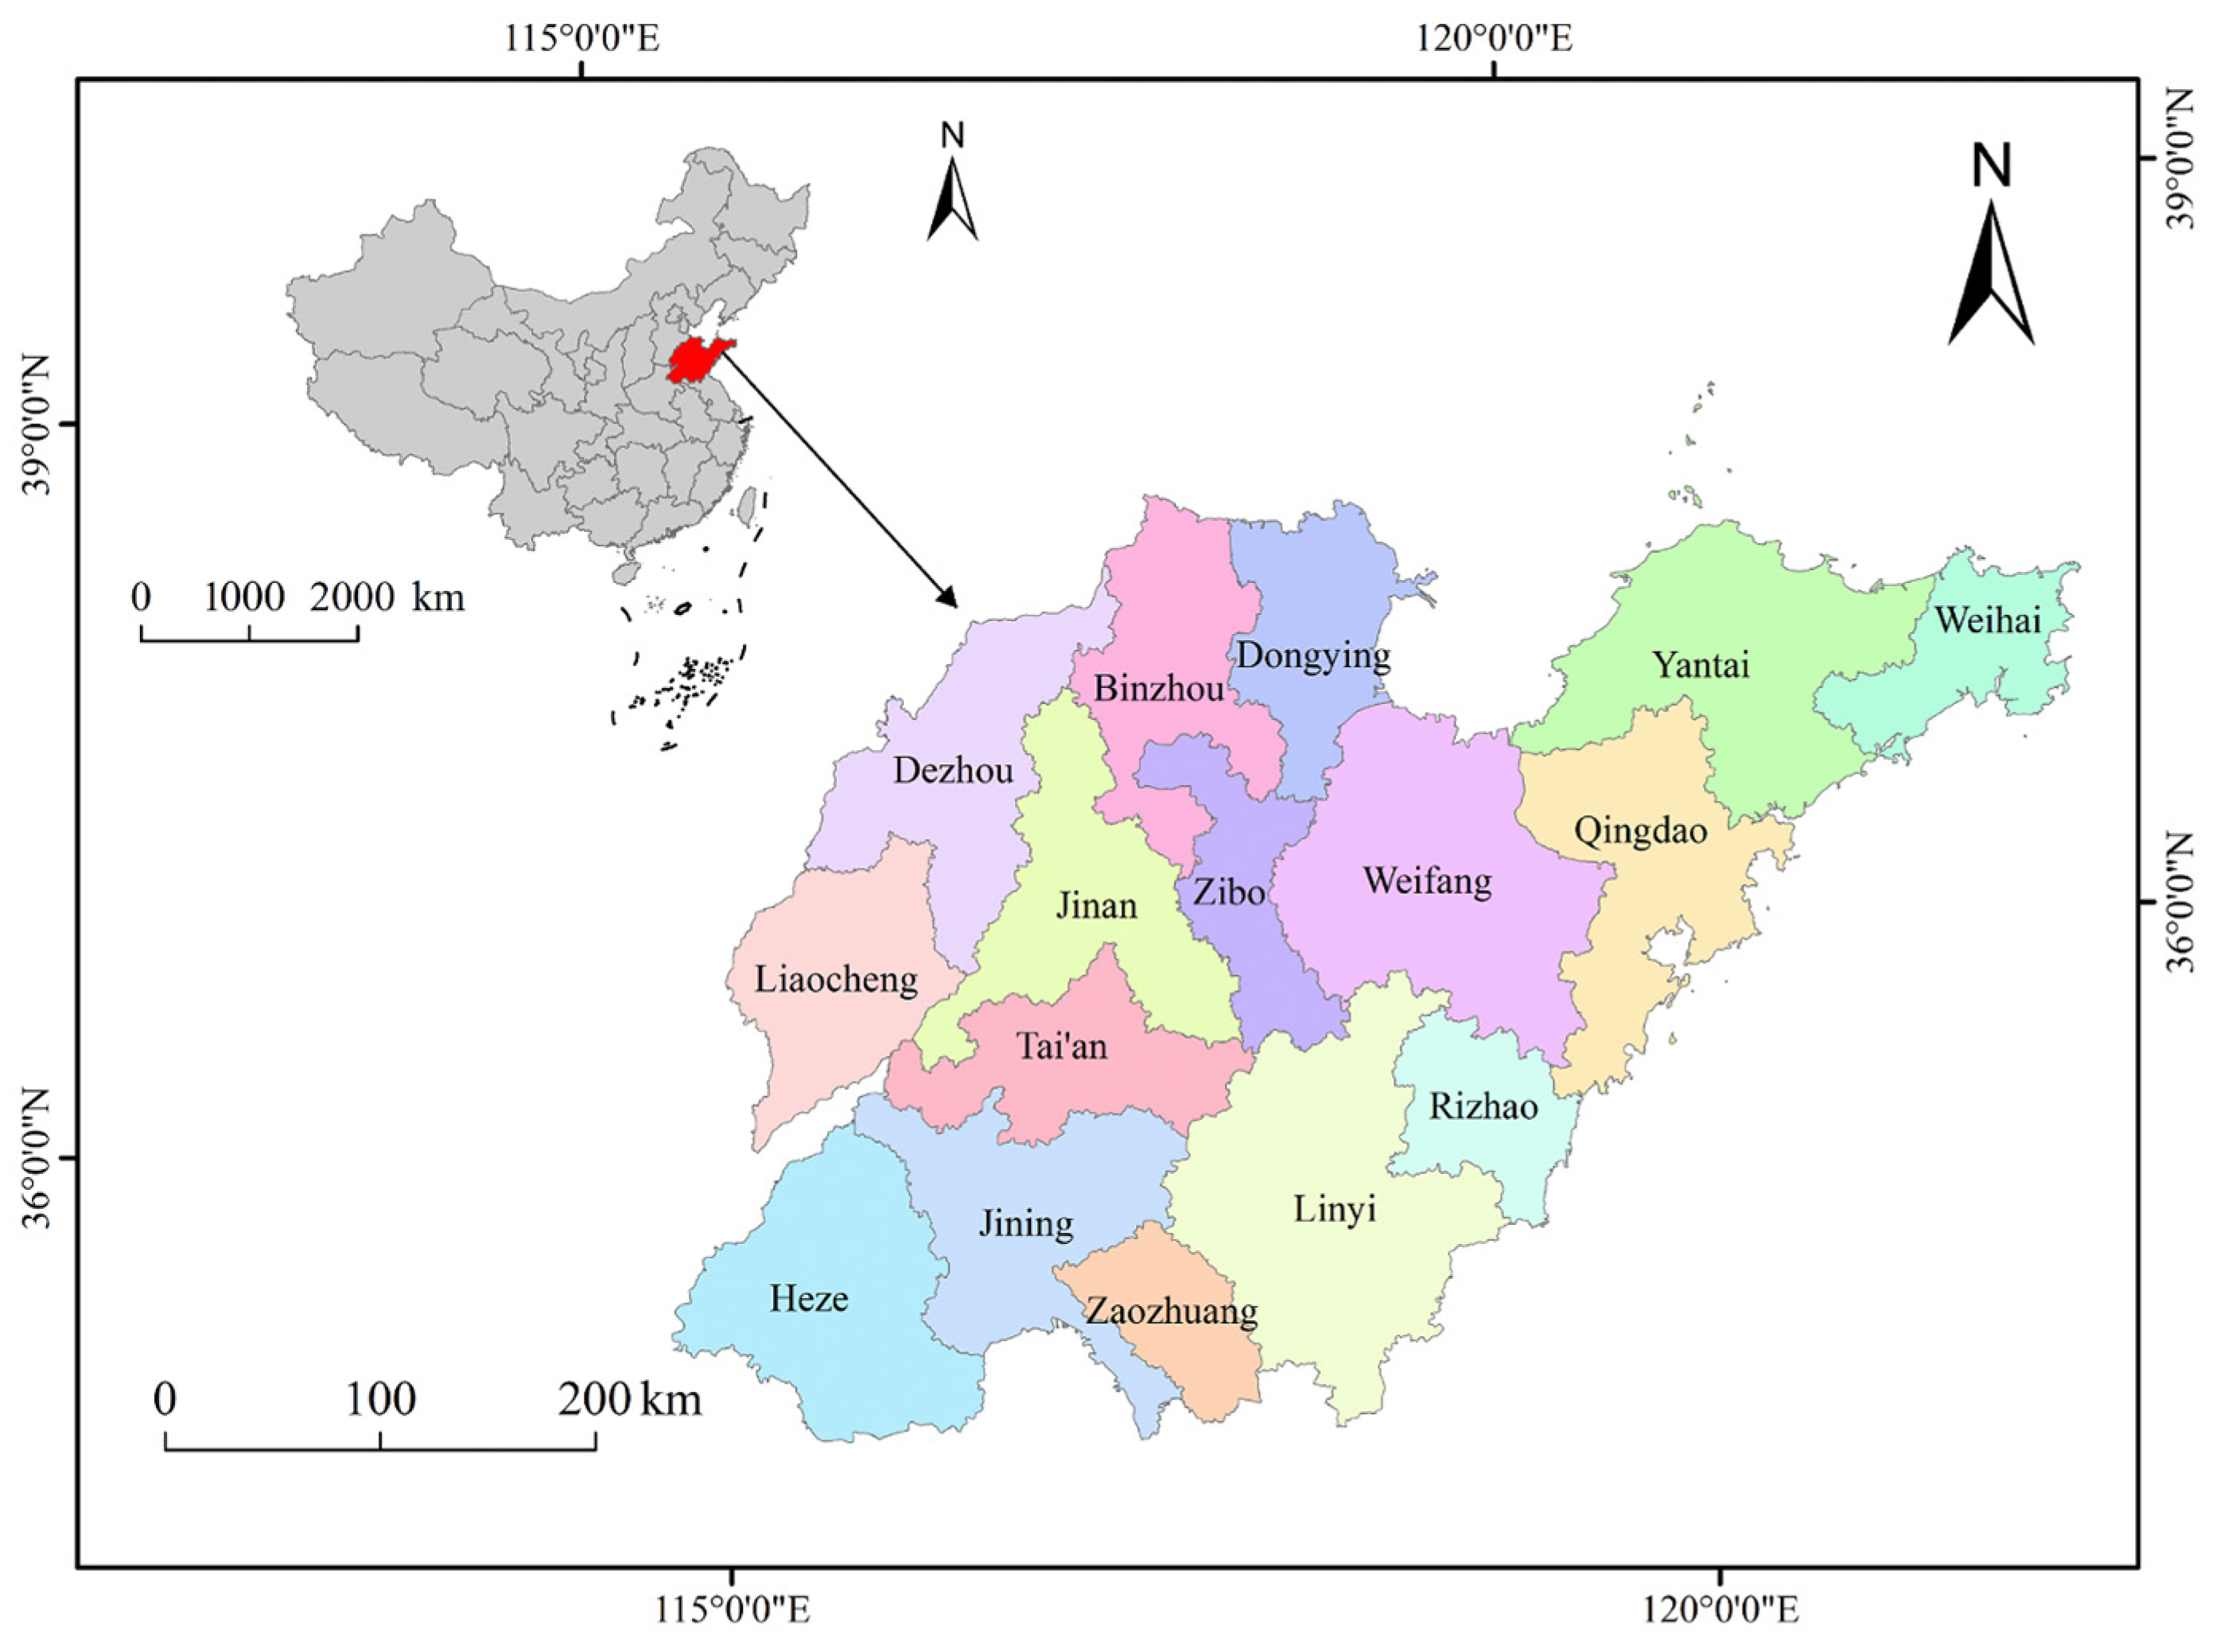
This survey adopted a stratified random sampling method. First, after excluding one prefecture-level city with fewer than ten scaled dairy farms (Zaozhuang), fifteen cities cities with the largest number of such dairy farms were selected. The study area map (Figure 1) was generated using ArcMap 10.8.1 (Esri, Redlands, CA, USA). Specifically, Kenli and Guangrao were selected in Dongying city; Wendeng and Rongcheng were selected in Weihai city; Lanshan and Lvxian were selected in Rizhao city; Jiyang and Changqing were selected in Jinan city; Ningyang and Daiyue were selected in Tai’an city; LiangShan and Jinxiang were selected in Jining city; Linzi and Gaoqing were selected in Zibo city; Laixi and Pingdu were selected in Qingdao city; Yinan and Yishui were selected in Linyi city; Linyi and Laoling were selected in Dezhou city; Zouping and Zhanhua were selected in Binzhou city; Linqu and Hanting were selected in Weifang city; Laiyang and Zhaoyuan were selected in Yantai city; Linqing and Guanxian were selected in Liaocheng city; Caoxian and Yuncheng were selected in Heze city. Second, two counties were chosen from each sampled city via stratified random sampling, with stratification criteria based on geographic differences and economic development. Third, ten scaled dairy farms were then randomly drawn from each sampled county. After excluding observations with missing variables, we obtained 281 valid samples, yielding an effective response rate of 93.6%.
Second, the instrumental variable-county average herd size (2017)-was provided by the Shandong Animal Husbandry and Veterinary Bureau. This historical aggregate measure is employed to address the potential endogeneity of individual herd size.
Third, we include county agricultural machinery power as a core control variable in all regressions. This variable is sourced from the China Statistical Yearbook (county-level).
The survey dataset encompasses detailed 2019 information on farm managers’ individual characteristics, farm operational attributes, technology adoption status, and milk production costs and income. Data were collected through face-to-face interviews with farm managers, conducted by trained postgraduate students using a structured questionnaire. The questionnaire was designed in consultation with government departments and dairy industry experts, and a pilot survey was then conducted across 15 farms.

3.2. Model Specification

This study investigates the correlation of herd size with the adoption of various digital technologies. The econometric model is specified as follows:
I T i = a 0 + a 1 l n s i z e i + A X i + ζ i ,
I T i = 1 ( I T i > 0 ) .
In Equation (1), I T i represents an unobservable latent variable. s i z e i denotes the herd size of the i-th dairy farm. X i is a vector of control variables, including the manager’s years of production experience and gender, technical communication, distance from the farm to the township center, cooperative membership, formal credit access, fixed capital, and county agricultural machinery power. ζ i is the stochastic error term. In Equation (2), I T i is an observable dummy variable derived from Equation (1), indicating the adoption status of digital technologies, including information-intensive and knowledge-embedded digital technologies. a 0 , a 1 , A are parameters to be estimated.
This study uses an IV Probit model to estimate the relationship between herd size and technology adoption. Data processing and statistical analyses were conducted using Stata/SE 16.0 (StataCorp LLC, College Station, TX, USA). However, the cross-sectional nature of the data precludes establishing a strong causal relationship between herd size and the adoption of information-intensive and knowledge-embedded digital technologies.

3.3. Variable Selection

3.3.1. Dependent Variables

The dependent variables are the digital technologies adopted on dairy farms, with a particular focus on differentiating between information-intensive and knowledge-embedded technologies. Two binary indicators are constructed. The first shows the adoption of digital estrus detection systems, coded as 1 if adopted and 0 otherwise, representing information-intensive digital technology adoption. The second captures the adoption of digital manure management systems, coded as 1 if adopted and 0 otherwise, representing knowledge-embedded digital technology adoption.

3.3.2. Independent Variable

The key explanatory variable is herd size, measured by the total number of dairy cattle on each farm. For robustness checks, an alternative measure is constructed as the sum of lactating cows and dry cows.

3.3.3. Mechanism Variables

Mechanism variables: Drawing on existing literature [36], material costs are measured by machinery cost per unit of output, defined as the annual depreciation of all machinery and equipment per kilogram of milk. The depreciation of machinery and equipment is calculated using the fixed asset depreciation method for the livestock sector, as outlined in the Compilation of National Agricultural Product Cost and Benefit Data. This proxy captures the farm’s capital cost structure and scale economies in equipment utilization. Higher depreciation of all machinery and equipment per kilogram of milk implies a greater material cost burden, raising the financial barrier to digital technologies adoption. Larger farms can spread total fixed capital costs, reducing a key barrier to technologies adoption, consistent with the theoretical hypothesis. We acknowledge that this is an indirect test of the material costs mechanism. Our annual depreciation is calculated from the acquisition cost of all machinery and equipment per kilogram of milk, whereas the theoretical mechanism operates through the unit acquisition cost of target digital technologies. The reason is that depreciation of target digital technologies is observed only among adopters, creating severe sample selection bias. By contrast, depreciation of all machinery and equipment is universally observed. A more direct measure would require expenditure data on target technologies for non-adopters, which is unavailable.
Learning costs are the expenses incurred in acquiring information about a new product or service, including the time required to obtain it [37]. Learning days directly reflect the total temporal cost of the learning process [38]. We measure learning costs by the number of days required for operators to master milk machine operation. The milking machine is selected as the reference equipment for three reasons. First, milking machines were universally adopted by dairy farms in our sample, ensuring comparability across farms. Second, we control for milking machine type to absorb technological heterogeneity in machine complexity, thereby ensuring that variations in learning costs are attributable to herd size rather than technology disparities. Third, this proxy aligns with our theoretical prediction. Under the economies of scale in knowledge acquisition hypothesis, larger herd size reduces average learning costs through enhanced information sharing and economies of scale in training. Empirically, we construct two learning costs indicators, both in logarithmic form. First, total learning costs test whether total learning days increase less than proportionally with herd size. Second, average learning costs measure the per-unit learning cost. A negative coefficient on herd size in the average learning costs equation would confirm that, as predicted by theory, the average learning costs decline with herd size. We acknowledge that this measure captures the learning cost of a specific technology, rather than the ex-ante expected costs for the digital technologies under investigation. While we argue that farm-specific learning ability is transferable across technologies, future research would benefit from employing direct measures of expected learning costs for digital technologies.
We measure managers’ production experience based on the number of years they have been engaged in dairy farming. This variable captures the farm-specific knowledge and on-farm learning accumulated by the manager, serving as a proxy for the sunk costs associated with farm-specific human capital. The rationale is twofold. First, production experience is accumulated over time, and the time invested in on-farm learning cannot be recovered. Second, the knowledge gained from experience is farm-specific rather than consisting of general principles transferable across farms. These characteristics satisfy the theoretical criteria for sunk costs associated with farm-specific human capital. We acknowledge several limitations in using production experience as a proxy for sunk costs of farm-specific human capital. First, our measure may capture managerial ability rather than the sunk costs of human capital. More experienced managers may be better at evaluating new technologies and thus more inclined to adopt them. However, if unobserved ability were the underlying driver, its effect on the adoption of both digital technologies would be consistent; yet we observe a divergence in adoption patterns. Second, we assume that production experience is specific to the current production environment. If managers have prior experience with information-intensive digital technologies elsewhere, the sunk costs interpretation is weakened, as such knowledge may be transferable across farms. We acknowledge this limitation, given the lack of detailed data on prior exposure to such technologies.

3.3.4. Control Variables

Drawing on the literature on technology adoption [39,40], we include a set of covariates to control for confounding factors that may be associated with both herd size and the uptake of digital technologies. These variables are classified into four groups. First, farm manager characteristics, including gender and production experience, capture individual-level heterogeneity in decision-making patterns. Second, farm operational characteristics include technical communication, cooperative membership, fixed capital, and distance to the township. Specifically, technical communication reflects the intensity of information exchange; cooperative membership captures institutional support and collective action; fixed capital serves as a proxy for farm resource endowments and investment capacity; and distance to the township captures broadband connectivity, market access, and transaction costs. Third, county-level factors include agricultural machinery power, which controls for the local mechanization environment that could independently relate to the adoption of digital technologies. Fourth, credit-related and regional factors are incorporated into the specification. The credit variable captures access to formal credit, while regional fixed effects covering Jiaodong, Central, and Western Shandong capture time-invariant spatial heterogeneity in policies and market conditions, respectively.
Table 1 presents descriptive statistics and variable definitions.

4. Results

4.1. Baseline Regression Results

Although herd size may facilitate the adoption of digital technologies, the adoption of digital technologies can also increase farm profitability and thereby influence subsequent expansion decisions. This suggests a potential reverse causality relationship between herd size and the adoption of digital technologies. In addition, the empirical model examining the relationship between herd size and digital technologies adoption may suffer from omitted variable bias, particularly due to unobserved managerial ability and risk preferences. These unobserved factors can simultaneously affect both the decision to adopt digital technologies and the decision to expand herd size. To mitigate potential endogeneity bias, this study employs an IV Probit model. Following previous literature [41], we use the county average herd size (2017) as an instrumental variable for the endogenous individual farm’s herd size in 2019.
For this instrument to be valid, it must satisfy the relevance condition and exclusion restriction. First, the relevance condition requires that county average herd size (2017) be correlated with individual farm-level herd size in 2019. The county average herd size (2017) reflects the county’s dairy farming tradition and industrial foundation. On the one hand, counties with larger average herd sizes in 2017 generated stronger demonstration effects, which facilitate herd size expansion by reducing information costs associated with managing larger farms. On the other hand, counties with larger average herd sizes in 2017 tend to have more developed factor markets. For example, such counties were more likely to have well-established support infrastructure, including feed supply chains and equipment services. This infrastructure reduces the marginal cost of farm expansion.
Second, the exclusion restriction requires that the county average herd size (2017) should have no direct effect on a farm’s digital technology adoption; it can only influence adoption indirectly through individual farm-level herd size. The county average herd size in 2017 is a pre-determined historical aggregate variable, which is temporally exogenous to a farm’s digital technology adoption in 2019. This temporal exogeneity rules out the possibility that unobserved farm-level latent factors simultaneously influence both the county average herd size (2017) and digital technology adoption in 2019. The critical threat to the exclusion restriction is that counties with larger average herd sizes in 2017 may also have higher levels of agricultural mechanization, which could promote digital technology adoption through regional capital intensity and farm modernization. On the one hand, mechanized infrastructure is complementary to digital technologies. Counties with higher agricultural mechanization levels may have accumulated substantial fixed capital in infrastructure, substantially reducing the construction cost of basic infrastructure for installing and operating digital technologies. Moreover, more highly mechanized counties may have developed more extensive agricultural machinery sectors. For example, equipment suppliers, repair services, and technical expertise. These modern advantages could directly facilitate the adoption of digital technologies by reducing transaction costs and investment risks. To close these potential pathways, we controlled for the county agricultural machinery power variable in all regressions. This variable absorbs the mechanization channel through which the instrumental variable might affect digital technologies adoption. Conditional on this control, the instrument affects current digital technologies adoption only through its influence on current herd size. In addition, we further incorporate the regional dummy variables to absorb time-invariant unobserved regional heterogeneity and mitigate omitted variable bias.
Table 2 presents the IV Probit estimates. Given the conservative nature of instrumental variable estimation, which prioritizes consistency over efficiency, and our moderate sample size, we interpret coefficients whose confidence intervals marginally include zero as suggestive evidence of a positive association, particularly when point estimates are economically meaningful and consistently signed across specifications.
In column (1) of Table 2, the first-stage estimates are reported. The instrumental variable is positively associated with herd size, and that effect is statistically significant, thereby meeting the relevance requirement. The Kleibergen-Paap Wald F-statistic is 20.929. This implies that the selected instrument cannot be considered a weak instrumental variable because it is much higher than the Stock-Yogo critical value [42]. While the endogeneity test may fail to detect that herd size is endogenous, the existence of the mutual causality effect between herd size and digital technologies adoption is not impossible. The IV Probit model is therefore retained to verify the association between herd size and the adoption of digital technologies.
Columns (2) and (3) of Table 2 present the average marginal effects of all variables on the probability of adopting information-intensive and knowledge-embedded digital technologies, respectively. The results show that herd size is positively associated with the adoption of both technology types, with coefficients of 0.225 (95% CI [−0.009, 0.459]) and 0.127 (95% CI [−0.002, 0.256]), respectively. These findings indicate that larger farms exhibit a higher likelihood of adopting both types of digital technologies, consistent with existing literature [43]. A potential explanation is that, under scale economies with indivisible machinery, the material costs of digital technologies decline with farm expansion. In addition, under scale economies in knowledge, learning costs decrease as herd size increases, facilitating technology adoption.

4.2. Robustness Checks

To assess robustness, we employ three approaches. First, we replace the independent variable. Specifically, total herd size is replaced by the sum of lactating and dry cows, and the IV Probit model is re-estimated. Column (1) of Table 3 reports the first-stage results, showing that the instrumental variable remains positive and statistically significant, thus satisfying the relevance condition. The weak instrument test further indicates that the instrument is not weak. Columns (2) and (3) present the estimated associations between herd size and the adoption of information-intensive and knowledge-embedded digital technologies, respectively. The results show that a 10% increase in herd size is associated with a 2.2% (95% CI [0.001, 0.440]) higher adoption probability for information-intensive technologies and a 1.17% (95% CI [0.025, 0.209]) higher adoption probability for knowledge-embedded technologies. These findings indicate that herd size is positively and significantly related to the adoption of both types of digital technologies, confirming the robustness of the baseline results.
Second, we further examine robustness by adopting an alternative estimation method. Specifically, we apply a Bivariate Probit Model to investigate the association between herd size and the adoption of information-intensive and knowledge-embedded digital technologies. The estimated marginal effects of the Bivariate Probit Model in Table 4 show that a 10% increase in herd size corresponds to a 2.21% (95% CI [0.145, 0.297]) increase in the adoption probabilities of information-intensive technologies and a 1.26% (95% CI [0.089, 0.164]) increase for knowledge-embedded digital technologies. This suggests that farm expansion is positively linked to the adoption of both types of digital technologies, supporting the robustness of the baseline findings.
Finally, we adopt a robustness check by redefining the dependent variable. To be specific, there are four choices for the dependent variable: non-adoption of digital technologies, adoption of information-intensive digital technologies only, adoption of knowledge-embedded digital technologies only, and joint adoption of both types. Table 5 presents the estimation results from the mixed Logit model, where columns (1)–(4) report the marginal effects of herd size for non-adoption, adoption of information-intensive digital technologies only, adoption of knowledge-embedded digital technologies only, and joint adoption of both types, respectively. The results show that a 10% increase in herd size is associated with 1.21% (95% CI [0.039, 0.204]) and 0.36% (95% CI [0.003, 0.069]) higher adoption probabilities of information-intensive digital technologies only and knowledge-embedded digital technologies only, respectively. These results further indicate that the baseline conclusions remain robust.

4.3. Mechanism Analysis

Based on the theoretical framework presented above, herd size is significantly and positively linked to the adoption of information-intensive and knowledge-embedded digital technologies via three main mechanisms.
First, we explore the relationship between herd size and material costs of digital technologies. Columns (1) and (2) in Table 6 present the two-stage least squares (IV-2SLS) estimation results. The second-stage results show a negative association between herd size and material costs (95% CI [−0.614, 0.043]). In economic terms, a 10 percent rise in herd size is associated with a 2.86 percent reduction in material costs. This observed pattern is consistent with the indivisibility of digital technologies: larger herd size correlates with lower per-unit material costs, which in turn is associated with higher adoption of digital technologies.
Second, we explore how herd size is associated with learning costs of digital technologies. We construct two learning costs indicators: total learning costs and average learning costs. The two-stage least squares (IV-2SLS) estimation results are shown in Columns (3) and (4) of Table 6, capturing the relationship between herd size and total learning costs. The findings reveal that herd size exhibits a positive and significant association with total learning costs (95% CI [−0.062, 1.134]). In economic terms, a 10% expansion in herd size corresponds to a 5.36% increase in total learning costs, indicating the growth rate of total learning costs is slower than the growth rate of herd size, consistent with the theoretical analysis.
Column (5) of Table 6 reports the second-stage IV-2SLS estimates using average learning cost as the dependent variable. The coefficient on herd size is −0.499 (95% CI [−0.962, 0.063]). This indicates that a 10% increase in herd size reduces average learning cost by 4.49%. This directly confirms our hypothesized mechanism.
Third, we examine whether herd size relates to the adoption of digital technologies via the sunk costs channel of farm-specific human capital. Table 7 presents the IV Probit estimation results. The first-stage regression results are presented in Columns (1) and (2), showing that both the instrumental variable and its interaction with production experience are significantly and positively associated with the endogenous variables and its interaction term with production experience, respectively. The weak instrument test confirms that neither instrument variable is weak. The endogeneity test further indicates that herd size is endogenous.
The columns (3) and (4) in Table 7 show the marginal effects obtained from IV Probit regressions, which analyze the effect of sunk costs associated with farm-specific human capital on information-intensive and knowledge-embedded digital technologies adoption, respectively. It is observed that the interaction of herd size and production experience exhibits a significant and negative association with information-intensive digital technologies (95% CI [−0.835, 0.036]), but there is no significance associated with knowledge-embedded digital technologies adoption. The negative interaction coefficient indicates that the relationship between herd size and the adoption of information-intensive digital technologies weakens with greater production experience. This suggests that scale-driven promotion of information-intensive digital technology adoption is weaker on farms with more experienced managers. By contrast, the interaction coefficient is not statistically significant for knowledge-embedded technology, indicating that the linkage between herd size and the adoption of such technology doesn’t vary with production experience. These findings are consistent with the theory of sunk costs of human capital. The rationale is that farmers are unwilling to adopt information-intensive digital technologies because such technologies replace accumulated production experience, and this perceived loss reflects the sunk costs of farm-specific human capital. In contrast, knowledge-embedded digital technologies primarily substitute for physical capital and equipment, and therefore do not incur additional sunk costs of farm-specific human capital.

4.4. Further Analysis

Based on the above theoretical analysis and empirical data, the adoption of digital technologies in livestock production exhibits clear scale economy characteristics. Specifically, the expanded herd size is positively associated with the adoption of digital technologies. While the rationale for technology adoption lies in its contribution to farm economic sustainability, it is necessary to further explore the relationship between the adoption of digital technologies and farm production efficiency and economic returns [44]. This extension has direct implications for SDG 2 (Zero Hunger) and SDG 12 (Responsible Consumption and Production). Accordingly, the analysis is extended to examine how herd size and the use of digital technologies are associated with dairy productivity and farm profitability. The results are presented in Table 8, Table 9 and Table 10.

4.4.1. Effects on Dairy Productivity

Referring to the China Dairy Yearbook, the dependent variable, dairy productivity, is measured as the average daily milk output per cow. Table 8 and Table 9 present the complete two-stage least squares (IV-2SLS) estimates. The first-stage regressions are presented in Columns (1) and (2) of both Table 8 and Table 9. The findings verify that the instrumental variables are valid: first, the instrumental variables are positively associated with the endogenous variables, satisfying the relevance condition; second, the weak instrument tests indicate that the instruments are not weak.
Column (3) of Table 8 and Column (3) of Table 9 report the second-stage IV-2SLS estimates for the linkage between the interaction of herd size and digital technology adoption and dairy productivity. The estimates indicate that the interaction between herd size and information-intensive digital technologies is positive, with a coefficient of 0.156 (95% CI [−0.004, 0.316]), while the interaction term between herd size and knowledge-embedded digital technologies is also positive, with a coefficient of 0.173 (95% CI [−0.016, 0.363]). These findings indicate that the marginal effect of herd size on dairy productivity tends to be higher among adopters of digital technologies than among non-adopters. This pattern suggests that both herd size and digital technologies are complementary in enhancing dairy productivity. A possible explanation is that information-intensive digital technologies can support managerial decision-making and improve management efficiency, which in turn helps maintain or enhance dairy productivity. By contrast, knowledge-embedded digital technologies function more directly as productive inputs and can therefore improve production performance more directly.

4.4.2. Effects on Farm Profitability

Consistent with the existing literature [45,46], farm profit is measured as the average daily profit per dairy cow across all cows within the farm. To address potential endogeneity issues, an instrumental variable two-stage least squares (IV-2SLS) model is applied to investigate the linkage between the interaction of digital technology adoption and herd size and dairy farm profitability.
Columns (1) and (2) of Table 10 present the second-stage IV-2SLS estimates for associations between the interactions of herd size with information-intensive and knowledge-embedded digital technologies and the profitability of scaled dairy farms, respectively. The interaction terms between herd size and each category of digital technologies are positive, with coefficients of 11.555 (95% CI [−1.170, 24.279]) and 8.594 (95% CI [−0.603, 17.790]), respectively. These findings indicate that the marginal effect of herd size on farm profitability may be greater among adopters of both information-intensive and knowledge-embedded digital technologies than among non-adopters. Furthermore, both types of digital technologies may complement larger farms in enhancing farm profitability. In other words, large-scale farms that adopt digital technologies generate significantly higher profits than those that do not. One possible explanation is that digital technologies help improve farms’ managerial capabilities and optimize production efficiency.

5. Discussion

This study provides empirical evidence on the association between herd size and the uptake of heterogeneous digital technologies in China’s dairy sector. By disaggregating digital technologies into information-intensive and knowledge-embedded categories, and by employing IV Probit models to address potential endogeneity, we offer novel insights into the scale-technology nexus, the underlying mechanisms, and the resulting economic implications for farm sustainability.
Our baseline results indicate that herd size is positively and significantly associated with the adoption of both information-intensive and knowledge-embedded digital technologies. Most of the existing literature has treated digital technologies as a homogeneous category when examining the determinants of technology adoption, typically employing Multinomial or Multivariate Logit models to assess the impact of farm size on digital technology adoption. For instance, the Mixed Logit model shows that farm size significantly influences the adoption of smart drip irrigation [47]. By disaggregating digital technologies into information-intensive and knowledge-embedded categories, this study finds that herd size is positively and significantly correlated with the adoption of both types in Chinese dairy farming. This is consistent with the positive effect of farm size on the adoption of precision agricultural technologies reported in previous studies [48,49].
In terms of mechanisms, our findings confirm that larger herds reduce material costs through fixed-cost amortization, consistent with classical scale-economy theory. The existing literature has largely emphasized material cost constraints as the primary channel through which farm size facilitates digital technology uptake [50]. Our results show that larger herds are negatively associated with material costs, and lower material costs are negatively associated with the investment threshold for both technology types. This is consistent with classical scale-economy theory, in which fixed-cost amortization plays an important role in advancing technology adoption [51]. However, this study extends beyond material costs to also examine learning costs and sunk costs of farm-specific human capital. In terms of learning costs, we find that the total learning days increase less than proportionally with herd size, while average learning days decline as herd size increases. This aligns with the hypothesis that herd size reduces average learning costs.
Moreover, our analysis reveals that production experience moderates the positive association between herd size and the adoption of information-intensive digital technologies, whereas no such moderating effect is observed for knowledge-embedded digital technologies. This finding aligns with asset specificity theory: experiential knowledge constitutes a form of farm-specific human capital; information-intensive digital technology provides knowledge that substitutes for experiential knowledge; and knowledge-embedded digital technologies derive value from the technologies themselves and substitute for other capital inputs. These results support the interpretation that the adoption of information-intensive digital technologies is associated with higher sunk costs of farm-specific human capital, which hinder adoption, and that these sunk costs are positively related to herd size. This pattern may help explain the lower adoption rates of such technologies. This is consistent with previous studies, which found that firm size affects the sunk costs of capability erosion and consequently influences the operational decisions [52].
Our further analysis of economic outcomes reveals that the linkage between herd size and adoption of either technology type is positively associated with both dairy productivity and farm profitability. This finding suggests that digital technologies and herd expansion are complementary in enhancing farm-level economic sustainability, rather than being substitutes. While previous research has established that larger farms tend to achieve higher output and profit per unit [53], our results indicate that this advantage is significantly amplified when digital technologies are adopted. This complementarity is particularly relevant for policy design, as it implies that promoting digital adoption in conjunction with scale-appropriate farm management may yield synergistic gains that exceed the sum of individual effects [54].
Several limitations of this study should be acknowledged. First, the cross-sectional nature of our data precludes establishing a strong causal relationship between herd size and technology adoption, and also prevents capturing the dynamic effects of herd size on digital technologies adoption over time. Second, this study draws on data from 281 medium- and large-scale dairy farms in Shandong Province, which limits the generalizability of our findings to smallholder dairy farms or to farms in other regions with substantially different production conditions. Moreover, the level of digitalization in the dairy sector differs substantially from that in other livestock sectors, including pig production, beef cattle farming, and poultry operations. Our conclusions are specific to dairy farming and may not be transferable to other livestock sectors.

6. Conclusions

Accelerating the digital transformation of livestock production is a strategic imperative for ensuring food security, enhancing farm viability, and achieving the sustainable development goals of China’s agricultural sector. Despite its recognized importance, however, the adoption of digital technologies in China’s livestock sector remains limited and uneven, and the mechanisms through which farm scale influences adoption decisions remain insufficiently understood. This study addresses this gap by providing new empirical evidence on the relationship between herd size and the heterogeneous adoption of digital technologies, with a particular focus on the mediating roles of material costs, learning costs, and sunk costs of farm-specific human capital. We further extend the analysis to examine how these adoption patterns relate to dairy productivity and farm profitability.
Drawing on survey data from scaled dairy farms in Shandong Province and employing IV Probit and IV-2SLS models to address endogeneity, our study yields several findings with direct policy implications. First, both information-intensive and knowledge-embedded digital technologies are positively correlated with herd size. This suggests that moderate-scale management is important for the digital and intelligent transformation of dairy farming. However, given that this study focuses exclusively on medium- and large-scale commercial dairy farms in Shandong province, this suggestion may not generalize to smallholder dairy farms, other livestock sectors such as pig or beef cattle production, or farms in other regions with substantially different production conditions.
Second, our mechanism analysis reveals that larger farms benefit from lower material costs and lower average learning costs-two key facilitators of adoption. This highlights an emphasis that may be placed on improvement of the relevant agricultural support policies aimed at encouraging the adoption of digital technologies in the dairy sector. Specifically, the agricultural machinery subsidies program could be broadened, incorporating more livestock-oriented digital technologies and helping minimize the material costs of these digital technologies and encourage their wider use. Moreover, a wide range of subsidized training programs and targeted technical support could be provided to reduce average learning costs and enhance producers’ willingness to adopt new technologies. Additionally, the sunk costs of farm-specific human capital, which constrain the use of information-intensive digital technologies, may be mitigated through institutional mechanisms that encourage experienced farms to adopt them. An “experience exchange voucher” policy, similar to the federal accelerated investment incentive policy in Canada, could serve as an example of transforming production experience into benefits when buying digital technologies. Furthermore, retraining and reskilling programs could help experienced managers adapt to a new production environment.
Third, farms that have adopted information-intensive and knowledge-embedded digital technologies achieve greater dairy productivity and farm profitability, relative to those dairy farms that have not adopted digital technologies. These findings offer empirical evidence that supports current digital agricultural policies. Accordingly, policymakers could continue promoting digital transformation in the dairy sector.
While our study is contextually grounded in Shandong’s commercial dairy sector, future research could fruitfully extend this analytical framework to other settings. Future research could examine whether herd size affects the heterogeneous adoption of digital technologies by material costs, learning costs and sunk costs of farm-specific human capital in wider contexts. Moreover, future research would benefit from using longitudinal data and incorporating more representative proxies for material costs, learning costs and sunk costs of farm-specific human capital to better explore how herd size influences heterogeneous adoption of digital technologies. Future research could also consider including additional control variables, such as broadband connectivity, the coverage of local extension services and subsidy policies that promote digital agriculture, and employing a Structural Equation Model.


Author Contributions

Conceptualization, Y.Q.; methodology, Y.Q.; software, Y.Q.; validation, J.H., X.C. and C.Y.; formal analysis, Y.Q.; investigation, Y.Q., C.Y. and J.H.; resources, J.H.; data curation, Y.Q.; writing-original draft preparation, Y.Q.; writing-review and editing, X.C.; visualization, Y.Q.; supervision, J.H. and C.Y.; project administration, Y.Q. and J.H.; funding acquisition, Y.Q. and J.H. All authors have read and agreed to the published version of the manuscript.

Funding

This research was funded by Dongying Municipal Science and Technology Bureau (2024kyqd032), National Statistical Science Research Program (2024LY058), and General Program of Shandong Provincial Natural Science Foundation (ZR2024MG012).

Institutional Review Board Statement

Not applicable.

Informed Consent Statement

Not applicable.

Data Availability Statement

The data used in this study could be made available upon reasonable request.

Conflicts of Interest

The authors declare no conflicts of interest.

References

  1. Balaine, L.; Dillon, E.J.; Läpple, D.; Lynch, J. Can Technology Help Achieve Sustainable Intensification? Evidence from Milk Recording on Irish Dairy Farms. Land Use Policy 2020, 92, 104437. [Google Scholar] [CrossRef] [Scilit] [PubMed]
  2. Information Center of the Ministry of Agriculture and Rural Affairs. China Digital Rural Development Report 2022; China Agriculture Press: Beijing, China, 2023; ISBN 978-7-109-31100-8. [Google Scholar]
  3. Qi, Y.; Han, J.; Shadbolt, N.M.; Zhang, Q. Can the Use of Digital Technology Improve the Cow Milk Productivity in Large Dairy Herds? Evidence from China’s Shandong Province. Front. Sustain. Food Syst. 2022, 6, 1083906. [Google Scholar] [CrossRef] [Scilit]
  4. Gwaka, L.; Dubihlela, J. The Resilience of Smallholder Livestock Farmers in Sub-Saharan Africa and the Risks Imbedded in Rural Livestock Systems. Agriculture 2020, 10, 270. [Google Scholar] [CrossRef] [Scilit]
  5. Ahmed, H.; Giffin, E.; Manian, S. Memory Constraints in Adoption of Productive Technologies. J. Econ. Behav. Organ. 2025, 236, 107118. [Google Scholar] [CrossRef] [Scilit]
  6. Pan, D.; Tang, J.; Zhang, L.; He, M.; Kung, C.-C. The Impact of Farm Scale and Technology Characteristics on the Adoption of Sustainable Manure Management Technologies: Evidence from Hog Production in China. J. Clean. Prod. 2021, 280, 124340. [Google Scholar] [CrossRef] [Scilit]
  7. Birhanu, M.Y.; Girma, A.; Puskur, R. Determinants of Success and Intensity of Livestock Feed Technologies Use in Ethiopia: Evidence from a Positive Deviance Perspective. Technol. Forecast. Soc. Change 2017, 115, 15–25. [Google Scholar] [CrossRef] [Scilit]
  8. Palma-Molina, P.; Hennessy, T.; O’Connor, A.H.; Onakuse, S.; O’Leary, N.; Moran, B.; Shalloo, L. Factors Associated with Intensity of Technology Adoption and with the Adoption of 4 Clusters of Precision Livestock Farming Technologies in Irish Pasture-Based Dairy Systems. J. Dairy Sci. 2023, 106, 2498–2509. [Google Scholar] [CrossRef] [Scilit] [PubMed]
  9. Pandeya, S.; Gyawali, B.R.; Upadhaya, S. Factors Influencing Precision Agriculture Technology Adoption among Small-Scale Farmers in Kentucky and Their Implications for Policy and Practice. Agriculture 2025, 15, 177. [Google Scholar] [CrossRef] [Scilit]
  10. Hailemariam, A.; Kalsi, J.; Mavisakalyan, A. Gender Gaps in the Adoption of Climate-Smart Agricultural Practices: Evidence from Sub-Saharan Africa. J. Agric. Econ. 2024, 75, 764–793. [Google Scholar] [CrossRef] [Scilit]
  11. Kahsay, G.A.; Endalew, Y.G. The Role of Cooperatives in Promoting Climate-Smart Agriculture: Panel Evidence from Ethiopia. Agric. Econ. 2025, 56, 637–665. [Google Scholar] [CrossRef] [Scilit]
  12. Cho, W.; Sarasty, O.; Wang, T. Exploring Differences in Precision Agriculture Adoption: New and Beginning Farmers, and Established Farmers. Appl. Econ. Perspect. Policy 2026, aepp.70067. [Google Scholar] [CrossRef] [Scilit]
  13. Katuwal, Y.; Maesano, G.; Viaggi, D. Smart Farming Technology Adoption and Perceived Impacts: Evidence from Italian Farms. Smart Agric. Technol. 2026, 14, 102216. [Google Scholar] [CrossRef] [Scilit]
  14. Reissig, L.; Siegrist, M. From the attitude towards digitalisation in agriculture to the acceptance of future agricultural technologies. Smart Agric. Technol. 2025, 12, 101095. [Google Scholar] [CrossRef] [Scilit]
  15. Aguirre, E.; Baraldo, J.; Caffera, M.; Laguna, H. Outcomes of a Public Program to Support Sustainable Livestock Farming: Evidence from Uruguay. J. Agric. Econ. 2026, 77, 253–266. [Google Scholar] [CrossRef] [Scilit]
  16. Barnes, A.P.; Soto, I.; Eory, V.; Beck, B.; Balafoutis, A.; Sánchez, B.; Vangeyte, J.; Fountas, S.; Van Der Wal, T.; Gómez-Barbero, M. Exploring the Adoption of Precision Agricultural Technologies: A Cross Regional Study of EU Farmers. Land Use Policy 2019, 80, 163–174. [Google Scholar] [CrossRef] [Scilit]
  17. Griffin, T.W.; Miller, N.J.; Bergtold, J.; Shanoyan, A.; Sharda, A.; Ciampitti, I.A. Farm’s Sequence of Adoption of Information-Intensive Precision Agricultural Technology. Appl. Eng. Agric. 2017, 33, 521–527. [Google Scholar] [CrossRef] [Scilit]
  18. Miller, N.J.; Griffin, T.W.; Ciampitti, I.A.; Sharda, A. Farm Adoption of Embodied Knowledge and Information Intensive Precision Agriculture Technology Bundles. Precis. Agric. 2019, 20, 348–361. [Google Scholar] [CrossRef] [Scilit]
  19. Kolady, D.E.; Van Der Sluis, E.; Uddin, M.M.; Deutz, A.P. Determinants of Adoption and Adoption Intensity of Precision Agriculture Technologies: Evidence from South Dakota. Precis. Agric. 2021, 22, 689–710. [Google Scholar] [CrossRef] [Scilit]
  20. Fontana, O.; Arata, L.; Muzzillo, M.; Sckokai, P. Drivers of Precision Agriculture Adoption in Italian Viticulture. Appl. Econ. Perspect. Policy 2026, aepp.70090. [Google Scholar] [CrossRef] [Scilit]
  21. Žáková Kroupová, Z.; Rumánková, L.; Bajan, B.; Čechura, L.; Hloušková, Z.; Aulová, R.; Šimek, P.; Jarolímek, J. Drivers and Barriers to Precision Agriculture Adoption in Czech Agriculture. Precis. Agric. 2026, 27, 17. [Google Scholar] [CrossRef] [Scilit]
  22. Khanna, M.; Atallah, S.S.; Kar, S.; Sharma, B.; Wu, L.; Yu, C.; Chowdhary, G.; Soman, C.; Guan, K. Digital Transformation for a Sustainable Agriculture in the United States: Opportunities and Challenges. Agric. Econ. 2022, 53, 924–937. [Google Scholar] [CrossRef] [Scilit]
  23. Hadera, A.; Tadesse, T. Risk and Ambiguity Aversion: Incentives or Disincentives for Adoption of Improved Agricultural Land Management Practices? Agric. Econ. 2023, 54, 867–883. [Google Scholar] [CrossRef] [Scilit]
  24. Chen, M.; Hu, C.; Myers, R.J. Understanding Transient Technology Use among Smallholder Farmers in Africa: A Dynamic Programming Approach. Agric. Econ. 2022, 53, 91–107. [Google Scholar] [CrossRef] [Scilit]
  25. Marette, S.; Disdier, A.; Bodnar, A.; Beghin, J. New Plant Engineering Techniques, R&D Investment and International Trade. J. Agric. Econ. 2023, 74, 349–368. [Google Scholar] [CrossRef] [Scilit]
  26. Wang, Z.; Wang, L.; Wu, H.; Ma, X. Does Digital Information Use Improve Technical Efficiency? Evidence from Potato Smallholders in China. Agric. Food Econ. 2026, 14, 31. [Google Scholar] [CrossRef] [Scilit]
  27. Chancellor, W. Exploring the Relationship between Information and Communication Technology (ICT) and Productivity: Evidence from Australian Farms. Aust. J. Agric. Resour. Econ. 2023, 67, 285–302. [Google Scholar] [CrossRef] [Scilit]
  28. Ohashi, T.; Saijo, M.; Suzuki, K.; Arafuka, S. From Conservatism to Innovation: The Sequential and Iterative Process of Smart Livestock Technology Adoption in Japanese Small-Farm Systems. Technol. Forecast. Soc. Change 2024, 208, 123692. [Google Scholar] [CrossRef] [Scilit]
  29. Michaelis, I.; Burfeind, O.; Heuwieser, W. Evaluation of Oestrous Detection in Dairy Cattle Comparing an Automated Activity Monitoring System to Visual Observation. Reprod. Domest. Anim. 2014, 49, 621–628. [Google Scholar] [CrossRef] [Scilit] [PubMed]
  30. Wang, Y.; Jiang, G.; Min, J. Does Livestock Manure Recycling among Acquaintance Networks Decouple Crop and Livestock Production? Evidence from Rural China. Agric. Econ. 2025, 71, 512–525. [Google Scholar] [CrossRef] [Scilit]
  31. Shi, Z.; Liang, F.; Marinello, F.; Pezzuolo, A. How AI and Digital Technologies Can Enhance Sustainable Livestock Manure Management: An Overview from Treatment to Distribution. Sustain. Dev. 2026, 1–20. [Google Scholar] [CrossRef] [Scilit]
  32. McFadden, J.R.; Rosburg, A.; Njuki, E. Information Inputs and Technical Efficiency in Midwest Corn Production: Evidence from Farmers’ Use of Yield and Soil Maps. Am. J. Agric. Econ. 2022, 104, 589–612. [Google Scholar] [CrossRef] [Scilit]
  33. Collier, P.; Dercon, S. African Agriculture in 50Years: Smallholders in a Rapidly Changing World? World Dev. 2014, 63, 92–101. [Google Scholar] [CrossRef] [Scilit]
  34. Deininger, K.; Byerlee, D. The Rise of Large Farms in Land Abundant Countries: Do They Have a Future? World Dev. 2012, 40, 701–714. [Google Scholar] [CrossRef] [Scilit]
  35. Ferguson, C.; Pinnuck, M.; Skinner, D.J. Why Did the Big Four Get so Large? Evidence from Australia. Rev. Account. Stud. 2025, 30, 2508–2554. [Google Scholar] [CrossRef] [Scilit]
  36. Mburu, M.; Mugera, A.; Mburu, J.; Nyikal, R.; Ndambi, O.A. Climate-Smart Dairy Practices: The Role of Practice Clusters in Enhancing the Performance of Dairy Farms in Kenya. Agribusiness 2026, 42, 717–732. [Google Scholar] [CrossRef] [Scilit]
  37. Liu, J.; Kauffman, R.J.; Ma, D. Competition, Cooperation, and Regulation: Understanding the Evolution of the Mobile Payments Technology Ecosystem. Electron. Commer. Res. Appl. 2015, 14, 372–391. [Google Scholar] [CrossRef] [Scilit]
  38. Molina-Castillo, F.-J.; Lopez-Nicolas, C.; De Reuver, M. Mobile Payment: The Hiding Impact of Learning Costs on User Intentions. J. Theor. Appl. Electron. Commer. Res. 2020, 15, 1–12. [Google Scholar] [CrossRef] [Scilit]
  39. Lenaerts, B.; De Mey, Y.; Demont, M. Revisiting Multi-stage Models for Upstream Technology Adoption: Evidence from Rapid Generation Advance in Rice Breeding. J. Agric. Econ. 2022, 73, 277–300. [Google Scholar] [CrossRef] [Scilit] [PubMed]
  40. Varshney, D.; Mishra, A.K.; Joshi, P.K.; Roy, D. Social Networks, Heterogeneity, and Adoption of Technologies: Evidence from India. Food Policy 2022, 112, 102360. [Google Scholar] [CrossRef] [Scilit]
  41. Debrah, G.; Adanu, K. Does the Inverse Farm Size-Productivity Hypothesis Hold beyond Five Hectares? Evidence from Ghana. J. Agric. Appl. Econ. 2022, 54, 548–559. [Google Scholar] [CrossRef] [Scilit]
  42. Stock, J.H.; Yogo, M. Testing for Weak Instruments in Linear IV Regression. In Identification and Inference for Econometric Models; Cambridge University Press: Cambridge, UK, 2005; pp. 80–108. [Google Scholar]
  43. Gargiulo, J.I.; Eastwood, C.R.; Garcia, S.C.; Lyons, N.A. Dairy Farmers with Larger Herd Sizes Adopt More Precision Dairy Technologies. J. Dairy Sci. 2018, 101, 5466–5473. [Google Scholar] [CrossRef] [Scilit] [PubMed]
  44. Wu, Z.; Du, Y.; Yang, G.; Lin, L.; Hou, X.; Tan, Y.; Fan, X.; Ren, Y.; Wu, B.; Liu, S.; et al. Improving the Sustainability of Milk Production across Different Climate Regions in China. Sustain. Prod. Consum. 2024, 49, 446–461. [Google Scholar] [CrossRef] [Scilit]
  45. Grovermann, C.; Quiédeville, S.; Muller, A.; Leiber, F.; Stolze, M.; Moakes, S. Does Organic Certification Make Economic Sense for Dairy Farmers in Europe?—A Latent Class Counterfactual Analysis. Agric. Econ. 2021, 52, 1001–1012. [Google Scholar] [CrossRef] [Scilit]
  46. Vandeplas, A.; Minten, B.; Swinnen, J. Multinationals vs. Cooperatives: The Income and Efficiency Effects of Supply Chain Governance in India. J. Agric. Econ. 2013, 64, 217–244. [Google Scholar] [CrossRef] [Scilit]
  47. Tao, H.; Xiong, H.; You, L.; Li, F. Farmers’ Willingness to Pay for Smart Farming Technologies: Evidence from a Smart Drip Irrigation Technology in North China. China Agric. Econ. Rev. 2024, 16, 114–134. [Google Scholar] [CrossRef] [Scilit]
  48. Kramarz, P.; Runowski, H. Possibilities of Using Digital Technologies in Agriculture in Areas with High Agrarian Fragmentation. Precis. Agric. 2025, 26, 48–70. [Google Scholar] [CrossRef] [Scilit]
  49. Abdelaziz, F.; Abay, K.A. Digital Literacy Training to Promote Diffusion of Digital Agricultural Tools to Smallholder Farmers: Evidence from a Randomized Intervention in Egypt. Food Policy 2026, 141, 103108. [Google Scholar] [CrossRef] [Scilit]
  50. Troiano, S.; Carzedda, M.; Marangon, F. Better Richer than Environmentally Friendly? Describing Preferences toward and Factors Affecting Precision Agriculture Adoption in Italy. Agric. Food Econ. 2023, 11, 16–30. [Google Scholar] [CrossRef] [Scilit] [PubMed]
  51. Feder, G.; Umali, D.L. The Adoption of Agricultural Innovations. Technol. Forecast. Soc. Change 1993, 43, 215–239. [Google Scholar] [CrossRef] [Scilit]
  52. Ross, J.-M.; Li, T.X.; Hawk, A.; Reuer, J.J. Resource Idling and Capability Erosion. Acad. Manag. J. 2023, 66, 1334–1359. [Google Scholar] [CrossRef] [Scilit]
  53. Ameye, H.; Bachewe, F.N.; Minten, B.; Tamru, S. Farm Size and Agricultural Productivity of Nutritious Foods: Evidence from Ethiopia. J. Agric. Econ. 2025, 76, 296–337. [Google Scholar] [CrossRef] [Scilit]
  54. Chen, W.; Wu, G.; Wang, S. Measurement and Regional Disparities of Pig Farming Efficiency under Different Production Scales: Evidence from China. Agric. Econ. 2026, 57, e70105. [Google Scholar] [CrossRef] [Scilit]
Figure 1. The study area map.
Sustainability 18 08238 g001
Table 1. Definitions of variables and descriptive statistics.
VariablesDefinitionMeanSD
Information technologyEquals 1 if the farm uses a digital estrus detection system, and 0 otherwise0.2590.439
Knowledge technologyEquals 1 if the farm adopts a digital manure management system, and 0 otherwise0.1400.347
Material costAnnual depreciation of machinery per kilogram of milk (RMB/kg/year)0.0300.018
Learning costLearning days of milking machine operation (days)15.93939.462
Dairy productivityAverage daily milk output per cow (kg/cow/day)28.1523.524
Farm profitabilityAverage daily net profit per cow (RMB/cow/day)−2.16413.154
Herd sizeTotal number of cattle in the herd (heads)557.322753.843
County average herd size (2017)Average herd size per farm at the county level in 2017 (heads)287.614291.456
Production experienceYears of dairy production experience (years)14.1686.178
GenderMale = 1, Female = 00.8980.303
Technical communicationNumber of interactions with feed suppliers (times/year)51.73176.471
Cooperative membershipIndividual farm = 1, cooperative = 00.8570.351
Fixed capitalAnnual depreciation of machinery (RMB/year)0.8550.498
Township distanceDistance from farm to township center (km)6.2704.447
County agricultural machinery powerTotal power of agricultural machinery (ten thousand kilowatts)110.59848.752
Formal credit accessEquals 1 if the farm obtained formal credit, and 0 otherwise.0.7010.459
Central ShandongEquals 1 if the farm is located in Central Shandong, and 0 otherwise.0.3390.474
Western ShandongEquals 1 if the farm is located in Western Shandong, and 0 otherwise.0.0800.272
Milk priceSelling price of raw milk (RMB/kg)3.6010.334
Diarrhea vaccineEquals 1 if vaccinated, and 0 otherwise0.2340.424
Tuberculosis vaccineEquals 1 if vaccinated, and 0 otherwise0.1470.355
Herd structureShare of adult cows in total herd (%)0.5500.096
Milking parlor1 = Fishbone milking parlor, 2 = Abreast milking parlor, 3 = Rotary milking parlor1.3920.550
Table 2. The association between herd size and digital technologies.
VariablesFirst StageSecond StageSecond Stage
SizeInformation TechnologyKnowledge Technology
(1)(2)(3)
County average herd size (2017)0.258 ***
(0.150, 0.366)
Herd size 0.225 *0.127 *
(−0.009, 0.459)(−0.002, 0.256)
Production experience−0.067−0.040−0.042
(−0.228, 0.093)(−0.158, 0.079)(−0.101, 0.017)
Gender−0.0580.0110.018
(−0.331, 0.215)(−0.145, 0.168)(−0.085, 0.121)
Technical communication0.028−0.0110.014
(−0.078, 0.134)(−0.044, 0.022)(−0.014, 0.043)
Cooperative membership0.203 *0.0470.077
(−0.021, 0.427)(−0.114, 0.209)(−0.033, 0.186)
Fixed capital−0.1410.164 ***0.047 *
(−0.316, 0.034)(0.062, 0.267)(−0.005, 0.099)
Township distance0.0630.0370.003
(−0.022, 0.149)(−0.036, 0.110)(−0.069, 0.075)
County agricultural machinery power0.278 *−0.145 **0.044
(−0.023, 0.578)(−0.288, −0.001)(−0.063, 0.151)
Formal credit access0.227 **0.0720.040
(0.050, 0.405)(−0.063, 0.206)(−0.042, 0.123)
Central Shandong0.4630.0500.024
(−0.089, 1.015)(−0.269, 0.369)(−0.175, 0.223)
Western Shandong−0.313 ***0.087−0.146 *
(−0.513, −0.112)(−0.077, 0.251)(−0.302, 0.010)
Constant3.117 ***
(1.301, 4.933)
Observations237237237
Wald χ2 34.2250.22
Prob > χ2 0.0000.000
Log pseudolikelihood −351.811−305.314
Kleibergen-Paap Wald F statistic20.929
Wald test of Exogeneity x2 (1)0.231
p-value0.631
Notes: Standard errors are clustered at the county level. The 95% confidence interval for each coefficient is reported in parentheses. ***, **, * represent significant at 1%, 5% and 10% respectively.
Table 3. The robustness check by changing the independent variable.
VariablesFirst StageSecond StageSecond Stage
SizeInformation TechnologyKnowledge Technology
(1)(2)(3)
County average herd size (2017)0.491 ***
(0.345, 0.637)
Herd size 0.220 **0.117 **
(0.001, 0.440)(0.025, 0.209)
Production experience−0.059−0.048−0.047
(−0.235, 0.117)(−0.160, 0.065)(−0.104, 0.011)
Gender−0.1470.0230.020
(−0.422, 0.127)(−0.123, 0.168)(−0.086, 0.125)
Technical communication0.023−0.0120.014
(−0.108, 0.154)(−0.044, 0.020)(−0.015, 0.042)
Cooperative membership0.1500.0520.078
(−0.069, 0.369)(−0.091, 0.196)(−0.036, 0.191)
Fixed capital −0.0830.151 ***0.040
(−0.260, 0.093)(0.062, 0.241)(−0.008, 0.089)
Township distance0.0460.0350.001
(−0.026, 0.119)(−0.038, 0.108)(−0.076, 0.077)
County agricultural machinery power0.035−0.140 **0.049
(−0.125, 0.194)(−0.266, −0.014)(−0.061, 0.160)
Formal credit access 0.167 *0.0790.046
(−0.001, 0.335)(−0.051, 0.209)(−0.039, 0.130)
Central Shandong 0.2080.068−0.003
(−0.118, 0.535)(−0.243, 0.379)(−0.174, 0.168)
Western Shandong −0.169 **0.071−0.144 *
(−0.320, −0.019)(−0.088, 0.229)(−0.293, 0.004)
Constant1.843 ***
(0.457, 3.229)
Observations237237237
Wald χ2 32.72112.14
Prob > χ2 0.0000.000
Log pseudolikelihood −360.563−314.386
Kleibergen-Paap Wald F statistic41.563
Wald test of Exogeneity x2 (1)0.165
p-value0.685
Notes: Standard errors are clustered at the county level. The 95% confidence interval for each coefficient is reported in parentheses. ***, **, * represent significant at 1%, 5% and 10% respectively.
Table 4. The robustness check by changing the estimation method.
VariablesInformation TechnologyKnowledge Technology
(1)(2)
Herd size0.221 ***0.126 ***
(0.145, 0.297)(0.089, 0.164)
Production experience−0.039−0.041 *
(−0.152, 0.074)(−0.088, 0.007)
Gender0.0100.018
(−0.145, 0.165)(−0.087, 0.122)
Technical communication−0.0110.014
(−0.042, 0.021)(−0.014, 0.042)
Cooperative membership0.0460.077
(−0.083, 0.174)(−0.024, 0.179)
Fixed capital 0.166 ***0.047 **
(0.076, 0.255)(0.000, 0.094)
Township distance0.0410.003
(−0.026, 0.108)(−0.071, 0.077)
County agricultural machinery power−0.120 **0.045
(−0.225, −0.016)(−0.060, 0.149)
Formal credit access 0.0710.040
(−0.038, 0.181)(−0.045, 0.124)
Central Shandong 0.0510.025
(−0.184, 0.287)(−0.159, 0.208)
Western Shandong 0.090−0.143 **
(−0.038, 0.219)(−0.269, −0.017)
Observations237237
Wald χ2284.46284.46
Prob > χ20.0000.000
Log pseudolikelihood−167.852−167.852
Notes: Standard errors are clustered at the county level. The 95% confidence interval for each coefficient is reported in parentheses. ***, **, * represent significant at 1%, 5% and 10% respectively.
Table 5. The robustness check by changing the dependent variable.
VariablesBoth AdoptionInformation TechnologyKnowledge
Technology
None Adoption
(1)(2)(3)(4)
Herd size0.082 ***0.121 ***0.036 **−0.239 ***
(0.054, 0.109)(0.039, 0.204)(0.003, 0.069)(−0.319, −0.160)
Production experience−0.005−0.029−0.0330.067
(−0.052, 0.041)(−0.140, 0.082)(−0.095, 0.028)(−0.037, 0.172)
Gender0.006−0.0060.003−0.003
(−0.053, 0.066)(−0.170, 0.158)(−0.089, 0.094)(−0.141, 0.135)
Technical communication0.005−0.0120.014−0.007
(−0.010, 0.021)(−0.043, 0.019)(−0.020, 0.049)(−0.057, 0.042)
Cooperative membership0.068 ***−0.0140.028−0.082
(0.041, 0.096)(−0.140, 0.111)(−0.047, 0.102)(−0.234, 0.069)
Fixed capital 0.0270.138 ***0.014−0.179 ***
(−0.006, 0.060)(0.055, 0.221)(−0.034, 0.062)(−0.255, −0.103)
Township distance−0.0080.0460.013−0.050
(−0.030, 0.014)(−0.016, 0.108)(−0.060, 0.085)(−0.141, 0.041)
County agricultural machinery power0.034−0.141 **0.0120.096 **
(−0.015, 0.083)(−0.259, −0.024)(−0.070, 0.093)(0.006, 0.185)
Formal credit access 0.0240.0500.018−0.091
(−0.015, 0.063)(−0.073, 0.172)(−0.049, 0.085)(−0.205, 0.023)
Central Shandong0.0170.038−0.002−0.053
(−0.099, 0.133)(−0.199, 0.276)(−0.129, 0.126)(−0.250, 0.143)
Western Shandong −0.0240.115 *−0.120 ***0.029
(−0.072, 0.025)(−0.011, 0.240)(−0.202, −0.037)(−0.114, 0.171)
Observations237237237237
Wald χ226,383.2626,383.2626,383.2626,383.26
Prob > χ20.0000.0000.0000.000
Log pseudolikelihood−164.725−164.725−164.725−164.725
Notes: Standard errors are clustered at the county level. The 95% confidence interval for each coefficient is reported in parentheses. ***, **, * represent significant at 1%, 5% and 10% respectively.
Table 6. The mechanism estimates.
VariablesFirst StageSecond StageFirst StageSecond StageSecond Stage
Herd SizeMaterial CostHerd SizeTotal Learning CostsAverage Learning Costs
(1)(2)(3)(4)(5)
County average herd size (2017)0.272 *** 0.254 ***
(0.158, 0.385) (0.147, 0.362)
Herd size −0.286 * 0.536 *−0.449 *
(−0.614, 0.043) (−0.062, 1.134)(−0.962, 0.063)
Production experience−0.035−0.180 ***−0.0570.212 **0.176 **
(−0.234, 0.163)(−0.309, −0.052)(−0.166, 0.052)(0.011, 0.413)(0.016, 0.336)
Gender−0.0960.088−0.0420.0680.040
(−0.380, 0.188)(−0.140, 0.315)(−0.378, 0.294)(−0.264, 0.400)(−0.266, 0.346)
Technical communication0.025−0.0150.054−0.049−0.055
(−0.082, 0.132)(−0.103, 0.073)(−0.058, 0.166)(−0.161, 0.062)(−0.144, 0.034)
Cooperative membership0.1480.408 ***0.132−0.277−0.231
(−0.084, 0.379)(0.248, 0.568)(−0.103, 0.367)(−0.728, 0.173)(−0.629, 0.167)
Fixed capital −0.222 **0.0770.089
(−0.420, −0.024)(−0.110, 0.263)(−0.081, 0.260)
Township distance0.074−0.0160.067−0.186 ***−0.169 ***
(−0.023, 0.171)(−0.109, 0.078)(−0.042, 0.176)(−0.301, −0.070)(−0.274, −0.064)
County agricultural machinery power0.282 *0.0070.316 **−0.074−0.054
(−0.031, 0.596)(−0.138, 0.152)(0.011, 0.621)(−0.357, 0.209)(−0.307, 0.199)
Formal credit access 0.228 **0.0570.187 **−0.0230.016
(0.040, 0.415)(−0.099, 0.212)(0.016, 0.358)(−0.320, 0.273)(−0.220, 0.252)
Central Shandong 0.4750.0310.446−0.370−0.168
(−0.126, 1.076)(−0.191, 0.252)(−0.105, 0.998)(−0.837, 0.098)(−0.537, 0.201)
Western Shandong −0.299 ***−0.169 *−0.274 **−0.002−0.032
(−0.512, −0.085)(−0.350, 0.012)(−0.491, −0.057)(−0.365, 0.362)(−0.355, 0.290)
Abreast parlor 0.181 **0.0990.069
(0.027, 0.334)(−0.065, 0.264)(−0.068, 0.206)
Rotary parlor 1.717 ***−0.357−0.237
(1.150, 2.283)(−1.366, 0.651)(−1.110, 0.636)
Constant3.054 ***−1.7952.749 ***−0.479−0.608
(1.127, 4.980)(−3.988, 0.397)(1.063, 4.435)(−4.216, 3.257)(−3.737, 2.522)
Observations237237237237237
Wald χ2 67.54 68.88106.83
Prob > χ2 0.000 0.0000.000
Kleibergen-Paap Wald F statistic24.079 23.565
Wald test of Exogeneity x2 (1)0.372 0.861
p-value 0.542 0.354
R-squared0.2490.1110.4060.0890.276
Notes: Standard errors are clustered at the county level. The 95% confidence interval for each coefficient is reported in parentheses. ***, **, * represent significant at 1%, 5% and 10% respectively.
Table 7. The association between herd size, production experience and technology adoption.
Variables First StageFirst StageSecond StageSecond Stage
SizeSize * Production ExperienceInformation TechnologyKnowledge Technology
(1)(2)(3)(4)
County average herd size (2017)0.258 ***0.007
(0.150, 0.366)(−0.042, 0.056)
County average herd size (2017) * Production experience−0.0060.223 ***
(−0.192, 0.180)(0.111, 0.335)
Herd size 0.1810.116 **
(−0.065, 0.427)(0.003, 0.229)
Herd size * Production experience −0.400 *−0.161
(−0.835, 0.036)(−0.371, 0.050)
Production experience−0.068−0.034−0.051−0.045 *
(−0.230, 0.094)(−0.186, 0.118)(−0.195, 0.092)(−0.091, 0.002)
Gender−0.058−0.0410.0010.011
(−0.336, 0.220)(−0.100, 0.019)(−0.142, 0.144)(−0.085, 0.106)
Technical communication0.0280.023−0.0000.018
(−0.079, 0.135)(−0.022, 0.067)(−0.034, 0.033)(−0.012, 0.049)
Cooperative membership0.202 *−0.105 **−0.0010.059
(−0.017, 0.422)(−0.203, −0.007)(−0.191, 0.188)(−0.054, 0.172)
Fixed capital −0.1420.0050.145 **0.042
(−0.317, 0.033)(−0.048, 0.058)(0.030, 0.259)(−0.011, 0.095)
Township distance0.0630.0160.0420.004
(−0.025, 0.150)(−0.058, 0.091)(−0.040, 0.125)(−0.060, 0.069)
County agricultural machinery power0.279 *0.046−0.0950.060
(−0.027, 0.584)(−0.041, 0.133)(−0.229, 0.040)(−0.053, 0.173)
Formal credit access 0.226 **0.0220.0690.034
(0.032, 0.421)(−0.067, 0.111)(−0.059, 0.198)(−0.045, 0.114)
Central Shandong 0.462−0.0340.0330.011
(−0.094, 1.019)(−0.174, 0.105)(−0.295, 0.361)(−0.184, 0.206)
Western Shandong −0.314 ***−0.0530.034−0.161 **
(−0.519, −0.108)(−0.153, 0.047)(−0.142, 0.210)(−0.310, −0.012)
Constant−1.686 ***−0.181
(−2.943, −0.429)(−0.620, 0.258)
Observations237237237237
Wald χ2 66.8950.33
Prob > χ2 0.0000.000
Log pseudolikelihood −436.407−391.685
Kleibergen-Paap Wald F statistic9.9189.918
Wald test of Exogeneity x2 (1)2.5352.535
p-value 0.2820.282
Notes: Standard errors are clustered at the county level. The 95% confidence interval for each coefficient is reported in parentheses. ***, **, * represent significant at 1%, 5% and 10% respectively.
Table 8. Herd size, information-intensive technology and dairy productivity.
VariablesFirst StageFirst StageSecond Stage
Herd SizeHerd Size * Information TechnologyDairy Productivity
(1)(2)(3)
County average herd size (2017)0.189 ***0.016
(0.065, 0.313)(−0.041, 0.074)
County average herd size (2017) * Information technology−0.0040.172 **
(−0.171, 0.163)(0.042, 0.301)
Herd size −0.175 *
(−0.374, 0.023)
Herd size * Information technology 0.156 *
(−0.004, 0.316)
Information technology0.492 ***0.352 ***0.102 ***
(0.304, 0.679)(0.183, 0.521)(0.024, 0.179)
Knowledge technology0.699 ***0.522 ***0.080
(0.446, 0.952)(0.267, 0.776)(−0.035, 0.195)
Production experience0.030−0.0020.012
(−0.065, 0.126)(−0.128, 0.124)(−0.023, 0.047)
Gender−0.0370.036−0.029
(−0.269, 0.194)(−0.107, 0.179)(−0.093, 0.035)
Technical communication0.025−0.070 *0.042 ***
(−0.057, 0.107)(−0.146, 0.006)(0.021, 0.063)
Cooperative membership−0.0320.052−0.034
(−0.263, 0.199)(−0.060, 0.164)(−0.103, 0.036)
Fixed capital −0.237 ***−0.045−0.034
(−0.365, −0.109)(−0.123, 0.033)(−0.094, 0.025)
County agricultural machinery power0.331 **0.187 *0.023
(0.045, 0.617)(−0.018, 0.392)(−0.015, 0.061)
Formal credit access 0.038−0.0460.031
(−0.103, 0.180)(−0.107, 0.016)(−0.011, 0.072)
Central Shandong 0.0760.0180.012
(−0.353, 0.504)(−0.193, 0.229)(−0.085, 0.108)
Western Shandong −0.0880.078−0.004
(−0.264, 0.087)(−0.067, 0.223)(−0.066, 0.059)
Milk price 2.501 ***0.991 *0.594 **
(1.407, 3.595)(−0.188, 2.171)(0.073, 1.115)
Diarrhea vaccine0.210 **0.0290.051
(0.022, 0.398)(−0.109, 0.168)(−0.016, 0.119)
Tuberculosis vaccine−0.0970.035−0.043
(−0.323, 0.128)(−0.084, 0.155)(−0.098, 0.013)
Herd structure −0.293−0.0230.032
(−0.709, 0.122)(−0.328, 0.281)(−0.093, 0.157)
Constant−5.348 ***−2.069 *2.278 ***
(−7.382, −3.315)(−4.149, 0.010)(1.447, 3.108)
Observations237237237
Wald χ2 115.66
Prob > χ2 0.000
Kleibergen-Paap Wald F statistic8.5598.559
Wald test of Exogeneity x2 (1)6.7096.709
p-value 0.0350.035
R-squared0.538 0.467 0.155
Notes: Standard errors are clustered at the county level. The 95% confidence interval for each coefficient is reported in parentheses. ***, **, * represent significant at 1%, 5% and 10% respectively.
Table 9. Herd size, knowledge-embedded technology and dairy productivity.
VariablesFirst StageFirst StageSecond Stage
Herd SizeHerd Size * Knowledge TechnologyDairy Productivity
(1)(2)(3)
County average herd size (2017)0.168 ***−0.040 *
(0.057, 0.279)(−0.083, 0.003)
County average herd size (2017) * Knowledge technology0.1250.287 ***
(−0.080, 0.329)(0.087, 0.488)
Herd size −0.127
(−0.283, 0.030)
Herd size * Knowledge technology 0.173 *
(−0.016, 0.363)
Information technology0.483 ***0.182 **0.100 ***
(0.290, 0.677)(0.043, 0.321)(0.036, 0.163)
Knowledge technology0.658 ***0.687 ***−0.006
(0.435, 0.881)(0.441, 0.934)(−0.112, 0.100)
Production experience0.0340.0220.004
(−0.057, 0.125)(−0.063, 0.106)(−0.031, 0.038)
Gender−0.0390.025−0.024
(−0.271, 0.192)(−0.053, 0.102)(−0.079, 0.032)
Technical communication0.028−0.0390.037 ***
(−0.053, 0.109)(−0.118, 0.041)(0.017, 0.057)
Cooperative membership−0.0310.113 *−0.040
(−0.278, 0.217)(−0.001, 0.227)(−0.100, 0.019)
Fixed capital −0.244 ***−0.077 *−0.017
(−0.369, −0.119)(−0.158, 0.003)(−0.063, 0.029)
County agricultural machinery power0.314 **−0.0420.032 *
(0.015, 0.613)(−0.168, 0.084)(−0.004, 0.068)
Formal credit access 0.0420.0260.023
(−0.092, 0.176)(−0.030, 0.083)(−0.014, 0.060)
Central Shandong 0.0710.100−0.007
(−0.373, 0.514)(−0.109, 0.309)(−0.072, 0.059)
Western Shandong −0.0870.0190.011
(−0.262, 0.088)(−0.063, 0.101)(−0.044, 0.067)
Milk price 2.563 ***0.7750.510 **
(1.503, 3.623)(−0.163, 1.713)(0.079, 0.941)
Diarrhea vaccine0.215 **0.0180.043
(0.033, 0.396)(−0.138, 0.173)(−0.013, 0.099)
Tuberculosis vaccine−0.0930.095 *−0.045 *
(−0.320, 0.134)(−0.004, 0.193)(−0.094, 0.004)
Herd structure −0.296−0.0230.047
(−0.726, 0.134)(−0.214, 0.168)(−0.074, 0.168)
Constant−5.380 ***−0.9722.408 ***
(−7.472, −3.288)(−2.462, 0.518)(1.684, 3.132)
Observations237237237
Wald χ2 95.63
Prob > χ2 0.000
Kleibergen-Paap Wald F statistic7.2497.249
Wald test of Exogeneity x2 (1)7.287.28
p-value 0.0260.026
R-squared0.5410.56 -
Notes: Standard errors are clustered at the county level. The 95% confidence interval for each coefficient is reported in parentheses. ***, **, * represent significant at 1%, 5% and 10% respectively.
Table 10. Herd size, digital technologies and farm profitability.
VariablesSecond StageSecond Stage
Farm ProfitabilityFarm Profitability
(1)(2)
Size−6.775−3.054
(−16.434, 2.884)(−13.032, 6.924)
Herd size * Information technology11.555 *
(−1.170, 24.279)
Herd size * Knowledge technology 8.594 *
(−0.603, 17.790)
Information technology3.0543.677
(−4.186, 10.295)(−1.281, 8.635)
Knowledge technology2.356−0.782
(−6.192, 10.905)(−8.097, 6.533)
Production experience−0.972−1.534
(−4.369, 2.426)(−4.390, 1.321)
Gender1.4982.042
(−3.683, 6.679)(−2.193, 6.276)
Technical communication1.2680.698
(−0.561, 3.097)(−1.045, 2.441)
Cooperative membership1.8241.793
(−2.301, 5.950)(−2.186, 5.772)
Fixed capital −4.484 ***−3.419 **
(−7.743, −1.225)(−6.672, −0.166)
County agricultural machinery power1.8022.439 **
(−0.702, 4.306)(0.241, 4.638)
Formal credit access −0.747−1.250
(−3.368, 1.874)(−3.515, 1.016)
Central Shandong −2.354−3.254
(−8.931, 4.223)(−10.390, 3.882)
Western Shandong −2.727−1.547
(−6.424, 0.971)(−5.151, 2.057)
Milk price 40.022 **36.166 **
(9.037, 71.007)(8.444, 63.887)
Diarrhea vaccine−0.221−0.801
(−3.719, 3.277)(−4.049, 2.446)
Tuberculosis vaccine−4.315 **−4.093 ***
(−7.623, −1.007)(−6.789, −1.397)
Herd structure 30.463 ***31.517 ***
(19.664, 41.262)(19.897, 43.138)
Constant−48.672 **−42.177 **
(−95.726, −1.619)(−83.306, −1.047)
Observations237237
Wald χ2129.44101.29
Prob > χ20.0000.000
R-squared0.270.321
Notes: Standard errors are clustered at the county level. The 95% confidence interval for each coefficient is reported in parentheses. ***, **, * represent significant at 1%, 5% and 10% respectively.
Disclaimer/Publisher’s Note: The statements, opinions and data contained in all publications are solely those of the individual author(s) and contributor(s) and not of MDPI and/or the editor(s). MDPI and/or the editor(s) disclaim responsibility for any injury to people or property resulting from any ideas, methods, instructions or products referred to in the content.