Article

Seeking Stability Amid Uncertainty: The Impact of Climate Policy Uncertainty on Corporate Innovation Resilience

1
Post-Doctoral Research Station of Business Administration, Southwest University of Finance and Economics, Chengdu 611130, China
2
School of Business, Chengdu University of Technology, Chengdu 610059, China
3
School of Management, Sichuan Agricultural University, Chengdu 611130, China
4
School of Public Finance and Taxation, Southwestern University of Finance and Economics, Chengdu 611130, China
*
Author to whom correspondence should be addressed.
Sustainability 2026, 18(16), 8171; https://doi.org/10.3390/su18168171
Submission received: 24 May 2026 / Revised: 11 July 2026 / Accepted: 30 July 2026 / Published: 10 August 2026

Abstract

As the global sustainability agenda and carbon neutrality goals continue to advance, climate policy has become an important governance instrument for promoting firms’ green and low-carbon transformation. Adjustments in policy timing, regulatory intensity, and enforcement arrangements may create uncertainty for firms’ long-term technological investment and their capacity to sustain this transformation. Accordingly, this study focuses on corporate innovation resilience and examines firms’ ability to maintain, adjust, and recover innovation activities amid climate policy fluctuations. Using Shanghai and Shenzhen A-share-listed firms from 2010 to 2023, this study matches firm-level data with prefecture-level climate policy uncertainty indicators based on firms’ registered locations and empirically examines the impact of climate policy uncertainty on corporate innovation resilience. The results show that climate policy uncertainty is positively associated with corporate innovation resilience. This finding remains robust after changing fixed-effect specifications, adjusting the clustering level of standard errors, excluding special-year observations, and conducting instrumental variable, entropy balancing, and placebo tests. Mechanism tests provide evidence consistent with the channels of corporate sustainable transformation, external attention pressure, and managerial sustainable governance capability. Heterogeneity analysis further shows that this positive association is more pronounced in regions with stronger environmental regulation and among firms receiving higher government environmental subsidies. At the industry level, the effect is mainly observed among heavy-polluting firms and non-high-tech firms. These results indicate that the association is stronger where sustainable transition pressure or policy support is greater. This study extends the firm-level consequences of climate policy uncertainty from innovation quantity and green innovation to the adaptive capacity of corporate innovation systems and provides evidence on how firms sustain innovation while long-term low-carbon transition goals are implemented under fluctuating climate policies.

1. Introduction

Accelerated technological iteration, fluctuations in market demand, supply chain adjustments, and changes in the institutional environment can all reshape firms’ existing innovation plans and resource allocation. At the same time, innovation activities are characterized by long investment cycles, high failure risks, and strong path dependence. Once external shocks exceed firms’ adaptive capacity, prior R&D investment may turn into sunk costs, and innovation projects may be delayed, interrupted, or even terminated. Therefore, the core of corporate innovation capability lies not only in increasing R&D investment or generating more patents, but also in firms’ ability to sustain innovation activities, adjust innovation trajectories, and restore or even strengthen innovation capability after external shocks. Innovation resilience captures this dynamic capability by focusing on whether corporate innovation systems can remain stable, adapt their trajectories, and recover after external disturbances. It reflects firms’ ability to withstand shocks, reconfigure resources, and sustain innovation momentum over time, thereby extending traditional innovation measures that mainly capture quantitative changes such as patent growth [1,2,3]. This capability is particularly relevant to sustainable transition, which depends on firms’ ability to preserve long-term technological accumulation and organizational adjustment despite changes in the external environment.
At the same time, the continued advancement of global climate governance has made policies related to carbon reduction, environmental regulation, green finance, and low-carbon technology support increasingly important instruments for translating sustainability goals into firm-level changes in production modes and innovation choices [4]. These policies have become a key institutional factor affecting corporate innovation resilience [5]. Since China announced its dual carbon goals and gradually established a supporting policy framework, low-carbon transition has become an unavoidable direction for firms’ long-term development. However, climate policy is not a static institutional arrangement. To reconcile long-term climate objectives with changing conditions related to energy security, economic growth, industrial upgrading, technological progress, and regional development, policy instruments, implementation schedules, and regulatory stringency are often adjusted dynamically. Climate policy uncertainty makes it difficult for firms to predict whether, when, and how governments will adjust climate-related policies, thereby affecting their assessment of future returns, costs, and risks [6,7]. Importantly, climate policy uncertainty does not imply ambiguity about the long-term direction of low-carbon transition. Instead, it reflects uncertainty in the implementation of long-term sustainability objectives, including policy timing, regulatory intensity, implementation pathways, and enforcement arrangements, all of which may reshape firms’ expectations and resource allocation during the transition process [8]. Therefore, climate policy uncertainty is not merely a general institutional risk; it is also a governance challenge arising when long-term low-carbon goals are translated into firm-level action. It may either constrain firms’ innovation space or serve as an external signal that encourages them to adjust innovation strategies in advance.
Existing studies have actively explored the innovation effects of climate policy uncertainty, but their conclusions remain mixed. On the one hand, climate policy uncertainty increases the difficulty for firms in assessing future compliance costs, innovation returns, and financing conditions, making them more cautious about long-term R&D and technological upgrading [9,10]. It may weaken firms’ innovation incentives by reducing R&D investment and risk-taking capacity [11], and may also affect innovation decisions through financing constraints and changing expectations of green subsidies [12,13]. Such responses may delay low-carbon technological accumulation and interrupt the innovation activities required for long-term sustainable transition. On the other hand, when the direction of green and low-carbon transition is relatively clear, policy fluctuations may also signal stricter future regulation and expanding opportunities for green technologies [14]. Climate policy uncertainty can promote corporate innovation, green innovation, and invention patents through expectations of environmental regulation [15,16,17]. More recent evidence further suggests that climate policy uncertainty may not only increase green innovation output, but also encourage firms to expand their green innovation boundaries by entering new green technological domains and deepening existing green technological trajectories through green strategic orientation and digital–green technology integration capability [18]. From the perspective of growth options, uncertainty does not only imply the value of waiting; it may also contain future development opportunities. By proactively investing in low-carbon technologies and innovation capabilities, firms can gain transition advantages in subsequent competition [19]. Firms therefore face a tension between controlling short-term policy risks and maintaining the innovation commitment required for long-term sustainable transition. Whether climate policy uncertainty ultimately strengthens or weakens the innovation resilience needed to manage this tension requires further investigation.
In addition, existing studies have identified various firm responses to climate policy uncertainty, including green innovation, technological innovation, ESG performance, digital transformation, and sustained innovation, which mainly reflect changes in innovation output, innovation orientation, or corporate transformation behavior [20,21,22]. For instance, climate policy uncertainty may increase firms’ environmental attention, green investment, and strategic orientation toward green development, thereby promoting corporate green transformation [23]. It may also heighten firms’ perception of climate risks and operational uncertainty, encouraging them to rely on digital transformation to improve information recognition, environmental compliance, and operational efficiency [24]. These studies provide an important foundation for understanding how firms respond to climate policy uncertainty. However, this output- and transformation-oriented evidence does not fully explain whether firms can preserve the functioning of their innovation systems when the external innovation environment changes. In particular, it remains unclear whether climate policy uncertainty enables firms to maintain innovation continuity, adjust innovation trajectories, and recover innovation capability relative to regional innovation trends. An increase in innovation output may reflect an improvement in the external innovation environment rather than stronger firm-specific adaptive capacity. Likewise, the adoption of green or digital transformation initiatives does not by itself demonstrate that the innovation system can remain continuous when policy conditions change [25,26]. From a sustainability perspective, this distinction is important because low-carbon transition is a long-term process that depends not only on individual green outcomes, but also on firms’ ability to preserve technological accumulation, reallocate resources, and adjust innovation trajectories over time. Therefore, the effect of climate policy uncertainty is not simply a matter of inhibiting or promoting innovation output. The key issue is whether firms can develop stable and adaptive innovation capacity that enables sustainable transition to continue under policy fluctuations.
Based on this logic, this study incorporates climate policy uncertainty and corporate innovation resilience into a unified analytical framework, focusing on whether firms can maintain the continuity and adaptability of innovation activities amid climate policy fluctuations and thereby preserve the capability base required for sustainable transition. Specifically, climate policy uncertainty may be associated with firms’ innovation resilience through corporate sustainable transformation, external attention pressure, and managerial sustainable governance capability. The potential marginal contributions of this study are threefold. First, this study extends the literature on the micro-level consequences of climate policy uncertainty by shifting the focus from innovation output and transformation behavior to innovation resilience. This shift highlights firms’ ability to sustain, adjust, and recover innovation activities under policy fluctuations, distinguishes capability-based innovation resilience from simple patent growth or innovation-output expansion, and clarifies its role as a capability foundation for maintaining long-term low-carbon transformation. Second, this study places climate policy uncertainty in a sustainability-governance context where long-term climate objectives coexist with short-term adjustments in policy instruments and implementation. By explaining how risk constraints and transition-driven incentives may operate simultaneously, it helps clarify why uncertainty in policy implementation may be positively associated with corporate adaptive innovation capacity. Third, this study examines this relationship through three sustainability-related dimensions: corporate sustainable transformation, external attention pressure, and managerial sustainable governance capability. These dimensions, respectively, capture firms’ technological and organizational adjustment, stakeholders’ scrutiny of climate responsibility and long-term adaptability, and managers’ ability to interpret policy signals and maintain long-term innovation arrangements. The findings provide useful insights for firms seeking to sustain innovation during low-carbon transition and for governments aiming to improve the consistency, predictability, and adaptability of climate policy implementation.

2. Research Hypotheses

2.1. Climate Policy Uncertainty and Corporate Innovation Resilience

Innovation activities usually involve long investment cycles and high sunk costs. When short-term policy signals change frequently, firms may tend to postpone some irreversible investments in order to reduce potential losses caused by future policy adjustments [11,12]. However, climate policy uncertainty does not mean that firms can avoid innovation in the long run. Although the choice of policy instruments and the intensity of implementation may change, the overall direction of low-carbon transition and green development is relatively clear. For firms, prolonged wait-and-see behavior may reduce exposure to uncertainty, but it may also lead to insufficient technological accumulation, delayed transition preparation, and weaker future competitiveness. In the context of China’s continued advancement of its dual carbon goals, the key issue for firms is not whether to innovate, but how to build innovation resilience in advance before the policy environment becomes fully stable.
Innovation resilience provides a useful lens for explaining firms’ proactive adaptation to climate policy uncertainty. Unlike patent growth or innovation output measures that mainly capture changes in innovation quantity, innovation resilience emphasizes whether firms can sustain innovation activities, adjust innovation directions, and recover innovation capability when external conditions change. Although climate policy uncertainty increases the risks associated with innovation decisions, firms may also respond to changes in environmental regulation and climate-related risks by maintaining the continuity of innovation activities, especially as the low-carbon transition continues to advance [27].
From the perspective of strategic adaptation, climate policy uncertainty may prompt firms to reassess their existing development paths and respond to changes in environmental regulation and climate-related risks by maintaining the continuity of innovation activities [27]. Policy fluctuations make it difficult for firms to rely on past experience to predict future regulatory boundaries, while also increasing the pressure to adjust traditional production modes and technological trajectories. To avoid falling into a passive position in subsequent low-carbon competition, firms need to build technological reserves and make forward-looking innovation arrangements [28,29]. Climate policy uncertainty can promote corporate green innovation by strengthening expectations of environmental regulation and increasing R&D investment, suggesting that firms may transform policy pressure into a driver of R&D resource reallocation and technological upgrading [15]. Such strategic adaptation is not equivalent to a short-term increase in innovation input or patent output. Rather, it reflects firms’ efforts to maintain the continuous functioning of their innovation systems and adjust technological trajectories in response to future policy changes.
From the perspective of stakeholder pressure, climate policy uncertainty increases the external visibility of firms’ environmental behavior and innovation performance. Although it may raise the risks associated with innovation decisions, it also leads external stakeholders, including governments, investors, the media, and the public, to pay closer attention to whether firms are capable of responding to climate risks and green transition pressures. Firms that maintain a passive wait-and-see strategy for an extended period may face reputational losses, lower market valuation, and weaker access to external resources [21]. External monitoring pressure can translate capital market and public attention to climate risks into corporate innovation behavior, suggesting that stakeholder attention reduces the room for firms to respond passively [16]. Under such pressure, firms have stronger incentives to maintain innovation continuity in order to meet external expectations regarding their long-term adaptive capacity.
From the perspective of internal governance, climate policy uncertainty can heighten managerial attention to internal governance and long-term strategic adjustment, while early investment in low-carbon technologies and innovation capabilities may also create future opportunities [19,30]. Faced with the same policy fluctuations, firms may choose to cut back on R&D, or they may adjust their innovation strategies in advance. The key lies in whether managers can identify the long-term trends behind policy changes and coordinate internal resources to support sustained innovation [28,31]. Managerial openness shapes firms’ strategic responses to climate policy uncertainty, indicating that managers do not passively absorb external shocks but play an important role in policy interpretation and innovation decision-making [32]. When internal governance helps reduce short-termism and provides relatively stable resource arrangements for long-term innovation, firms are more likely to transform external uncertainty into innovation resilience.
Taken together, climate policy uncertainty may not only impose short-term adjustment costs but also strengthen firms’ incentives to build adaptive innovation capacity. Through strategic adaptation, stakeholder pressure, and internal governance responses, firms may become more capable of sustaining innovation activities and adjusting technological trajectories under policy fluctuations. Accordingly, this study proposes the following hypothesis:
H1. 
Climate policy uncertainty significantly enhances corporate innovation resilience.

2.2. Mechanism Analysis

2.2.1. Corporate Sustainable Transformation

When facing climate policy uncertainty, firms must not only meet compliance requirements but also anticipate future changes in regulatory direction, technological demand, and market preferences. Given the high adjustment costs involved, firms may find it difficult to break away from established production modes and technological paths in the short term, and may respond by reducing R&D investment. However, a decline in R&D intensity can substantially narrow firms’ future innovation space and weaken their long-term competitiveness. Climate policy uncertainty may therefore encourage firms to incorporate green development and technological upgrading into longer-term innovation planning, thereby promoting corporate sustainable transformation [33]. First, policy fluctuations can increase firms’ environmental attention, stimulate green investment, and foster a clearer strategic orientation toward green development [34]. This suggests that firms may actively pursue transformation under uncertain conditions rather than simply waiting for policy signals to become fully clear [23], thereby improving their long-term adaptability. Second, from the perspective of internal motivation, sustainable transformation is not merely the combination of green practices and digital adoption. Rather, it represents a broader adjustment of firms’ technological foundations, management practices, and innovation resource allocation in response to policy fluctuations. Such transformation can reduce the constraints imposed by traditional development paths on innovation direction and make innovation activities more aligned with future policy requirements and market demand. In this process, digital transformation provides an important enabling mechanism by improving information processing and carbon information disclosure, thereby linking firms’ low-carbon monitoring and disclosure practices with substantive technological upgrading and green technology innovation [35]. More specifically, by relying on digital technologies and other sustainable transformation tools, firms can improve information acquisition, environmental monitoring, and resource allocation, strengthen their perception of climate and operational risks, and enhance their ability to identify and respond to policy changes, thereby improving environmental compliance and operational efficiency [24,36].
As sustainable transformation deepens, firms are more likely to accumulate green technological capabilities and information processing capabilities that are less vulnerable to policy fluctuations. These capabilities help firms identify policy changes earlier, reallocate innovation resources more efficiently, and maintain innovation continuity when external conditions shift [37]. In essence, climate policy uncertainty may be associated with sustainable transformation because it encourages firms to reallocate innovation resources, improve technological foundations, and enhance organizational responsiveness in line with future low-carbon development requirements. Through this process, firms are more likely to maintain innovation investment, adjust innovation directions, and restore innovation activities amid policy fluctuations. Moderate digitalization can help maintain the stability and adaptability of the innovation system by improving information acquisition, facilitating knowledge sharing, and strengthening stakeholder interaction [38,39]. Meanwhile, firms with stronger capabilities to identify, absorb, and transform external knowledge are better able to recover and adjust innovation activities under policy fluctuations [25]. Accordingly, this study proposes the following hypothesis:
H2a. 
Climate policy uncertainty enhances corporate innovation resilience by promoting corporate sustainable transformation.

2.2.2. External Attention Pressure

Changes in climate policy affect firms’ future compliance costs, environmental responsibilities, and long-term development capacity. As a result, external stakeholders such as governments, investors, the media, and analysts are likely to pay closer attention to whether firms have the capacity to respond to climate risks and green transition pressures. Prior research also suggests that public environmental attention can strengthen the innovation incentivizing effect of policy support and encourage firms to pursue higher-quality sustainable innovation rather than merely increasing innovation quantity [40]. In this context, corporate innovation is not merely an internal R&D arrangement. It also becomes an important basis for external stakeholders to assess firms’ long-term value and strategic adaptability. Therefore, climate policy uncertainty may be associated with stronger external attention to firms’ climate risk responses and long-term innovation capacity, which may encourage firms to maintain innovation continuity under transition pressure.
First, external attention creates reputational and legitimacy constraints [41]. If firms remain on the sidelines for a long time in an uncertain policy environment, external markets may interpret this as a lack of transition capability or innovation willingness. To maintain market confidence, firms need to send positive signals of their response to climate policy changes through sustained innovation. In this sense, external attention to climate risks can reduce the room for passive corporate responses and encourage firms to address market and social expectations through innovation [42]. Second, external attention can improve the information environment for corporate innovation. Innovation projects usually have long cycles and unstable short-term returns, which makes them vulnerable to market underestimation. Information intermediaries such as analysts can increase the visibility of corporate innovation activities, reduce the cost for external stakeholders to understand firms’ long-term innovation value, and mitigate the problem that long-term innovation is obscured by short-term performance [43,44]. When the value of innovation is more easily recognized by external stakeholders, managers have stronger incentives to maintain R&D investment and long-term innovation arrangements, thereby enhancing corporate innovation resilience [45]. Finally, external attention pressure can provide firms with continuous feedback. The higher the level of climate policy uncertainty, the greater the need for firms to understand changes in policy expectations, market attitudes, and social evaluations [46]. Online media attention and investor attention can influence corporate green innovation through information transmission and reputational constraints, indicating that external attention not only plays a monitoring role but also helps firms adjust environmental behavior and innovation strategies in a timely manner [42]. In this context, firms are better able to revise their innovation directions based on external feedback and reduce the mismatch between innovation activities and changes in policy and market conditions.
Therefore, external attention pressure can transform climate policy uncertainty into external constraints, greater information transparency, and potential resource support. Under such pressure, firms are less likely to remain in a prolonged wait-and-see position. Instead, they are more likely to maintain innovation continuity and respond to future policy and market changes through innovation. Accordingly, this study proposes the following hypothesis:
H2b. 
Climate policy uncertainty enhances corporate innovation resilience by increasing external attention pressure.

2.2.3. Managerial Sustainable Governance Capability

Faced with the same policy fluctuations, firms may respond in different ways. Some may reduce R&D investment and postpone technological upgrading, while others may make forward-looking technological investments and adjust resource allocation in advance. The key to this divergence lies in whether managers can understand the long-term transition trends underlying climate policy changes and translate them into relatively stable innovation arrangements.
First, managerial sustainable governance capability helps firms identify policy signals. Climate policy uncertainty does not mean that the direction of green development is unclear. Rather, the uncertainty lies mainly in policy instruments, implementation schedules, and enforcement intensity. If managers can identify the low-carbon transition signals embedded in policy fluctuations, firms are more likely to turn policy uncertainty into an opportunity for innovation adjustment [21]. The better managers understand green development issues, the more likely firms are to develop green technological innovation responses in an uncertain climate policy environment [47]. Second, managerial sustainable governance capability helps firms coordinate innovation resources. Improved investment efficiency enables firms to allocate more resources to innovation activities and provides an important foundation for sustained innovation [27]. By contrast, agency costs reduce internal governance efficiency and weaken firms’ ability to respond to policy uncertainty [22]. Only when managers reduce short-termism and governance frictions can firms secure relatively stable resource support for continuous innovation [48]. Finally, managerial sustainable governance capability helps firms maintain a long-term orientation. If managers focus excessively on short-term financial performance, firms may reduce high-risk and long-cycle green R&D and technological upgrading. Such short-termism can also weaken ESG-oriented green investment and the sustainability of green innovation, making it harder for firms to maintain innovation commitments under external uncertainty [49,50]. Conversely, sustained managerial attention to innovation and sustainability issues can help firms transform external policy pressure into long-term innovation momentum [16].
In summary, managerial sustainable governance capability helps firms identify policy signals, coordinate innovation resources, and maintain long-term strategic stability. Under climate policy uncertainty, managerial sustainable governance capability becomes more relevant for translating external policy fluctuations into the adaptability and recovery capacity of corporate innovation systems. Accordingly, this study proposes the following hypothesis:
H2c. 
Climate policy uncertainty enhances corporate innovation resilience by strengthening managerial sustainable governance capability.

3. Research Design

3.1. Data and Sample

This study uses Shanghai and Shenzhen A-share-listed firms from 2010 to 2023 as the research sample. Following the common sample screening procedures in the literature, financial firms, ST, *ST, and PT firms, and observations with missing key variables are excluded. The final sample contains 30,632 firm-year observations. To mitigate the influence of outliers, all continuous variables are winsorized at the 1st and 99th percentiles. Firm-level financial, governance, and innovation data are mainly obtained from the CSMAR database and listed firms’ annual reports. The climate policy uncertainty index is matched with firm-year observations according to the prefecture-level city in which each firm is registered.

3.2. Model Specification

To examine the relationship between climate policy uncertainty and corporate innovation resilience, this study estimates the following baseline model:
IRi,t = α0 + α1CCPUc,t + γControlsi,t + Industry + Year + εi,t,
where IRi,t denotes the innovation resilience of firm i in year t. CCPUc,t represents climate policy uncertainty in prefecture-level city c, where firm i is registered, in year t. Controlsi,t denotes a set of firm-level and regional control variables. Industry and Year represent industry and year fixed effects, respectively, and εi,t is the random error term. The coefficient of interest is α1. A significantly positive α1 indicates a positive association between climate policy uncertainty and corporate innovation resilience.
To further examine the potential channels associated with the relationship between climate policy uncertainty and corporate innovation resilience, this study tests whether climate policy uncertainty is related to the proposed channel variables and estimates the following model:
Mi,t = β0 + β1CCPUc,t + θControlsi,t + Industry + Year + μi,t,
where Mi,t denotes the mechanism variables, including corporate sustainable transformation, external attention pressure, and managerial sustainable governance capability. If β1 is statistically significant and consistent with theoretical expectations, the results are interpreted as evidence consistent with the proposed channel.

3.3. Variables

3.3.1. Dependent Variable

The dependent variable in this study is corporate innovation resilience (IR). Corporate innovation resilience reflects a firm’s ability to maintain the continuity and adaptability of innovation activities under external shocks and uncertainty. Following the relative resilience measurement approach of Martin and Gardiner (2019) [51] and Peng and Jia (2024) [3], this study constructs a corporate innovation resilience indicator based on changes in firms’ patent applications. Compared with innovation input indicators such as R&D investment, patent applications are more closely related to firms’ current innovation activities and can more promptly reflect firms’ innovation responses to changes in the external environment. The specific calculation formulas are as follows:
IR i , t = P i , t E i , t | E i , t |
P i , t = P i , t P i , t 1
E i , t = P c , t P c , t 1 P c , t 1 × P i , t 1 ,
where I R i , t denotes the innovation resilience of firm i in year t ; P i , t and P i , t 1 denote the number of patent applications filed by firm i   in year t and year t 1 , respectively; P i , t denotes the actual change in the number of patent applications of firm i   from year t 1 to year t ; P c , t and P c , t 1 denote the total number of patent applications in city c , where firm i is registered, in year t and year t 1 , respectively; and E i , t denotes the expected change in the number of patent applications of the firm estimated according to the overall patent application trend of the city in which the firm is located. This study uses the total number of patent applications in the city to measure the city-level benchmark trend, without excluding the patent applications of the sample firm itself. This treatment is mainly intended to capture the firm’s innovation performance relative to the overall innovation environment of its city.
Regarding the statistical scope of the indicator, the main tests in this study use the total number of firm patent applications, including invention patents, utility model patents, and design patents. Unlike patent growth indicators that merely reflect absolute changes in the number of patents, the I R i , t indicator constructed in this study compares the actual change in a firm’s patent applications with the expected change corresponding to the innovation environment of the city in which the firm is located. Therefore, it can capture the resilience of a firm’s innovation activities relative to changes in the external innovation environment. A higher value of I R i , t indicates that the firm’s actual innovation performance exceeds the level predicted by the city’s overall innovation trend, suggesting stronger corporate innovation resilience; conversely, a lower value indicates weaker corporate innovation resilience.

3.3.2. Independent Variable

Climate policy uncertainty (CCPU) is measured by the prefecture-level city climate policy uncertainty index in China. Following Ma et al. (2023) [52], the index is constructed using a combination of manual review and the MacBERT deep learning model based on climate policy-related news reports from six major Chinese newspapers, including People’s Daily, Guangming Daily, Economic Daily, Global Times, Science and Technology Daily, and China News Service. This study matches the city-level annual CCPU index with listed firms according to their registered cities. A higher value indicates greater uncertainty surrounding climate policy formulation, implementation timing, policy content, enforcement intensity, and policy outcomes.

3.3.3. Control Variables

To reduce the influence of firm characteristics, corporate governance, and regional economic conditions on corporate innovation resilience, this study controls for firm size (Size), leverage ratio (Lev), operating cash flow (Cash), intangible asset ratio (Int), ownership concentration (Top1), audit opinion (Opinion), Big Four auditor (Big4), duality (Dual), executive compensation (Salary), and regional economic development (PGDP). The detailed definitions are reported in Table 1.

3.3.4. Mechanism Variables

To provide empirical evidence on the potential channels associated with the relationship between climate policy uncertainty and corporate innovation resilience, this study constructs channel-related variables from three dimensions: corporate sustainable transformation, external attention pressure, and managerial sustainable governance capability. First, corporate sustainable transformation consists of green transformation (GRE) and digital transformation (Digitaleco). GRE is measured as the natural logarithm of one plus the total number of granted green invention and utility model patents. Digitaleco, following Xu et al. (2023) [53], is measured by the proportion of digital technology-related items in year-end intangible assets disclosed in the notes to financial statements relative to total intangible assets.
Second, external attention pressure is measured by analyst attention (Analyst) and research report attention (Report). Following Pan et al. (2026) [54], Analyst is measured as the natural logarithm of one plus the number of analyst teams tracking and analyzing the same listed firm in a given year. Report is measured as the natural logarithm of one plus the number of research reports tracking and analyzing the same listed firm in a given year. Higher values indicate greater external attention from capital market information intermediaries.
Third, managerial sustainable governance capability is measured by executive green perception (EGP) and corporate green governance (Green_gov). Drawing on Wang et al. (2025) [49], EGP is measured by the frequency of keywords related to executive green perception in annual reports divided by the total number of words and multiplied by 100. These keywords are selected from three dimensions, namely the perception of green competitive advantage, the perception of corporate social responsibility, and the perception of external environmental pressure. Drawing on Tang et al. (2026) [55], Green_gov is constructed based on firms’ green governance practices disclosed in the CSMAR environmental database, including whether the firm has established an environmental management system, provided environmental education and training, and carried out environmental protection initiatives.

4. Empirical Results

4.1. Descriptive Statistics

Table 2 reports the descriptive statistics of the main variables. Enterprise innovation resilience (IR) has a mean value of −2.4446, a standard deviation of 21.8739, a minimum value of −139.3849, and a maximum value of 61.8689, indicating substantial cross-firm heterogeneity in firms’ ability to sustain and adjust innovation activities. The mean value of climate policy uncertainty (CCPU) is 1.7531, with a standard deviation of 0.7287, and its values range from 0.2110 to 3.8285. This suggests that the sample contains sufficient variation in climate policy uncertainty across cities and years. The distributions of the remaining control variables are generally within reasonable ranges and are broadly consistent with prior studies.

4.2. Baseline Estimates

Table 3 presents the baseline regression results for the relationship between climate policy uncertainty and corporate innovation resilience. Column (1) includes only the core explanatory variable. The coefficient of CCPU is 0.4848 and is significant at the 1% level, indicating a positive association between climate policy uncertainty and corporate innovation resilience. Column (2) further controls for industry and year fixed effects, and the coefficient of CCPU remains positive and statistically significant. Column (3) adds the full set of control variables, including firm characteristics, governance variables, and regional economic conditions. The coefficient of CCPU is 0.4527 and remains significant at the 5% level. These results indicate that climate policy uncertainty is significantly and positively associated with corporate innovation resilience, and this relationship remains stable as the model specification is gradually enriched. Thus, the result is consistent with Hypothesis H1.
This study further evaluates the economic magnitude of the baseline estimate. Based on Column (3), the coefficient of CCPU is 0.4527, and the standard deviation of CCPU is 0.7287. Therefore, holding other factors constant, a one-standard-deviation increase in CCPU is associated with an increase of approximately 0.3299 units in corporate innovation resilience. Given that the standard deviation of IR is 21.8739, this effect accounts for approximately 1.51% of one standard deviation of IR. To better interpret this magnitude, this study compares it with recent evidence on the determinants of firm innovation resilience. Li et al. (2024) [56] examine the relationship between cooperative R&D network embeddedness and firm innovation resilience. Based on their reported coefficient and descriptive statistics, a one-standard-deviation increase in structural holes corresponds to approximately 2.49% of one standard deviation of firm innovation resilience. Compared with this benchmark, the economic magnitude estimated in this study is smaller but remains within a comparable order of magnitude. Considering that CCPU is a broad macro-level uncertainty indicator rather than a direct firm-level resource, capability, or network-position variable, the estimated effect is consistent with the nature of an external uncertainty shock. Therefore, the baseline result suggests a moderate but economically interpretable positive association between climate policy uncertainty and corporate innovation resilience.

4.3. Robustness Tests

To examine the robustness of the baseline findings, this study conducts four additional tests: changing the fixed-effects specification, adjusting the clustering level of standard errors, excluding observations from special years, and adding firm-level and policy-level control variables. The results are reported in Table 4.
First, firm fixed effects are further included to control for time-invariant unobserved firm characteristics. As shown in Column (1) of Table 4, the coefficient of CCPU is 0.6797 and remains significant at the 1% level. This indicates that the positive association between climate policy uncertainty and corporate innovation resilience is not driven by unobserved firm-level heterogeneity.
Second, considering that the core explanatory variable is matched at the city-year level, firms located in the same city may be exposed to similar climate policy uncertainty, local policy environments, and regional shocks, while firm-level panel data may also exhibit serial correlation within firms over time. Therefore, we further adjust the clustering level of standard errors and use firm–city two-way clustered standard errors. As shown in Column (2), the coefficient of CCPU is 0.4508 and remains significant at the 5% level. This result indicates that the positive association between climate policy uncertainty and corporate innovation resilience remains robust after simultaneously accounting for within-firm correlation and within-city correlation in the error term.
Third, China’s capital market experienced abnormal fluctuations in 2015, and the COVID-19 shock in 2020 and 2021 may have affected firms’ operating environments, innovation decisions, and policy expectations. This study therefore excludes observations from 2015, 2020, and 2021 and re-estimates the baseline model. Column (3) shows that the coefficient of CCPU is 0.5533 and significant at the 5% level. The main association is therefore not driven by these special-year shocks.
Fourth, this study further adds a set of firm-level and policy-level control variables to mitigate potential omitted-variable bias. At the firm level, the additional controls include firm age (Age), profitability (Roa), Tobin’s Q (TobinQ), R&D intensity (RD), ownership type (State), financing constraints (SA), and market competition (HHI). At the policy level, this study further controls for the green finance reform and innovation pilot policy (Gfr_pilot) and the carbon emissions trading pilot policy (Carbon_pilot). As shown in Column (4), after adding these additional control variables, the coefficient of CCPU is 0.5708 and remains significant at the 5% level. This indicates that the positive association between climate policy uncertainty and corporate innovation resilience remains robust after further controlling for firm characteristics, financing conditions, market competition, and related green policy shocks.

4.4. Endogeneity Tests

4.4.1. Instrumental Variable Method

To mitigate potential endogeneity concerns arising from reverse causality and omitted variables, this study adopts an instrumental variable approach. Specifically, the natural logarithm of the number of extreme high-temperature days in the previous year in each city is used as the instrument for climate policy uncertainty. Extreme high-temperature events are exogenous meteorological shocks that can increase governmental, public, and market attention to climate risks and may induce adjustments in climate governance agendas and related policy responses. Therefore, they are expected to be closely related to climate policy uncertainty. In addition, using the lagged value helps reduce the direct influence of contemporaneous high-temperature shocks on firms’ operations and innovation activities, allowing the instrument to better capture the effect of extreme climate shocks on subsequent climate policy expectations and policy adjustments.
Considering that extreme weather and regional climate conditions may also affect firms’ operating environments and innovation decisions through non-policy channels, this study further controls for weather, climate, and related policy environment variables in the instrumental variable regressions, including environmental concern (PEC), daily average wind speed (Wind_speed), annual precipitation (Annual_precip), and the climate adaptation pilot city dummy variable (Adapt_pilot). These variables are included to reduce the potential influence of general meteorological conditions, regional climate differences, and local climate adaptation policy environments on the estimation results. Based on this specification, this study conducts two-stage least squares estimation.
Columns (1) and (2) of Table 5 report the first-stage and second-stage regression results, respectively. The first-stage results show that the coefficient of the instrumental variable (IV) is 0.0277 and is significant at the 1% level. The second-stage results show that, after using lagged extreme high-temperature days as the instrument and controlling for weather, climate, and other relevant variables, the coefficient of climate policy uncertainty (CCPU) is 27.4909 and remains significant at the 1% level. In addition, the Kleibergen–Paap rk LM statistic is 15.357 and is significant at the 1% level, while the Cragg–Donald Wald F statistic is 12.214. Overall, the instrumental-variable results provide supplementary evidence consistent with the baseline finding that climate policy uncertainty is positively related to corporate innovation resilience. Given that the instrument is designed to address potential reverse causality and omitted-variable concerns, these results strengthen, rather than solely establish, the empirical interpretation.

4.4.2. Entropy Balancing

To further mitigate potential sample selection bias, this study applies entropy balancing. Specifically, the industry-year mean of climate policy uncertainty is used as the grouping benchmark. Firms with CCPU values higher than the mean value of their corresponding industry-year group are classified as the high-CCPU group, while the remaining firms are classified as the low-CCPU group. Entropy balancing is then used to reweight the sample so that the covariates of the two groups are balanced in terms of their first, second, and third moments. All control variables in the baseline regression are included as balancing covariates. Column (3) of Table 5 reports the re-estimation results after entropy balancing. The coefficient of CCPU is 0.4240 and remains significant at the 10% level, indicating that the positive association between climate policy uncertainty and corporate innovation resilience remains after alleviating potential sample selection bias.

4.4.3. Placebo Test

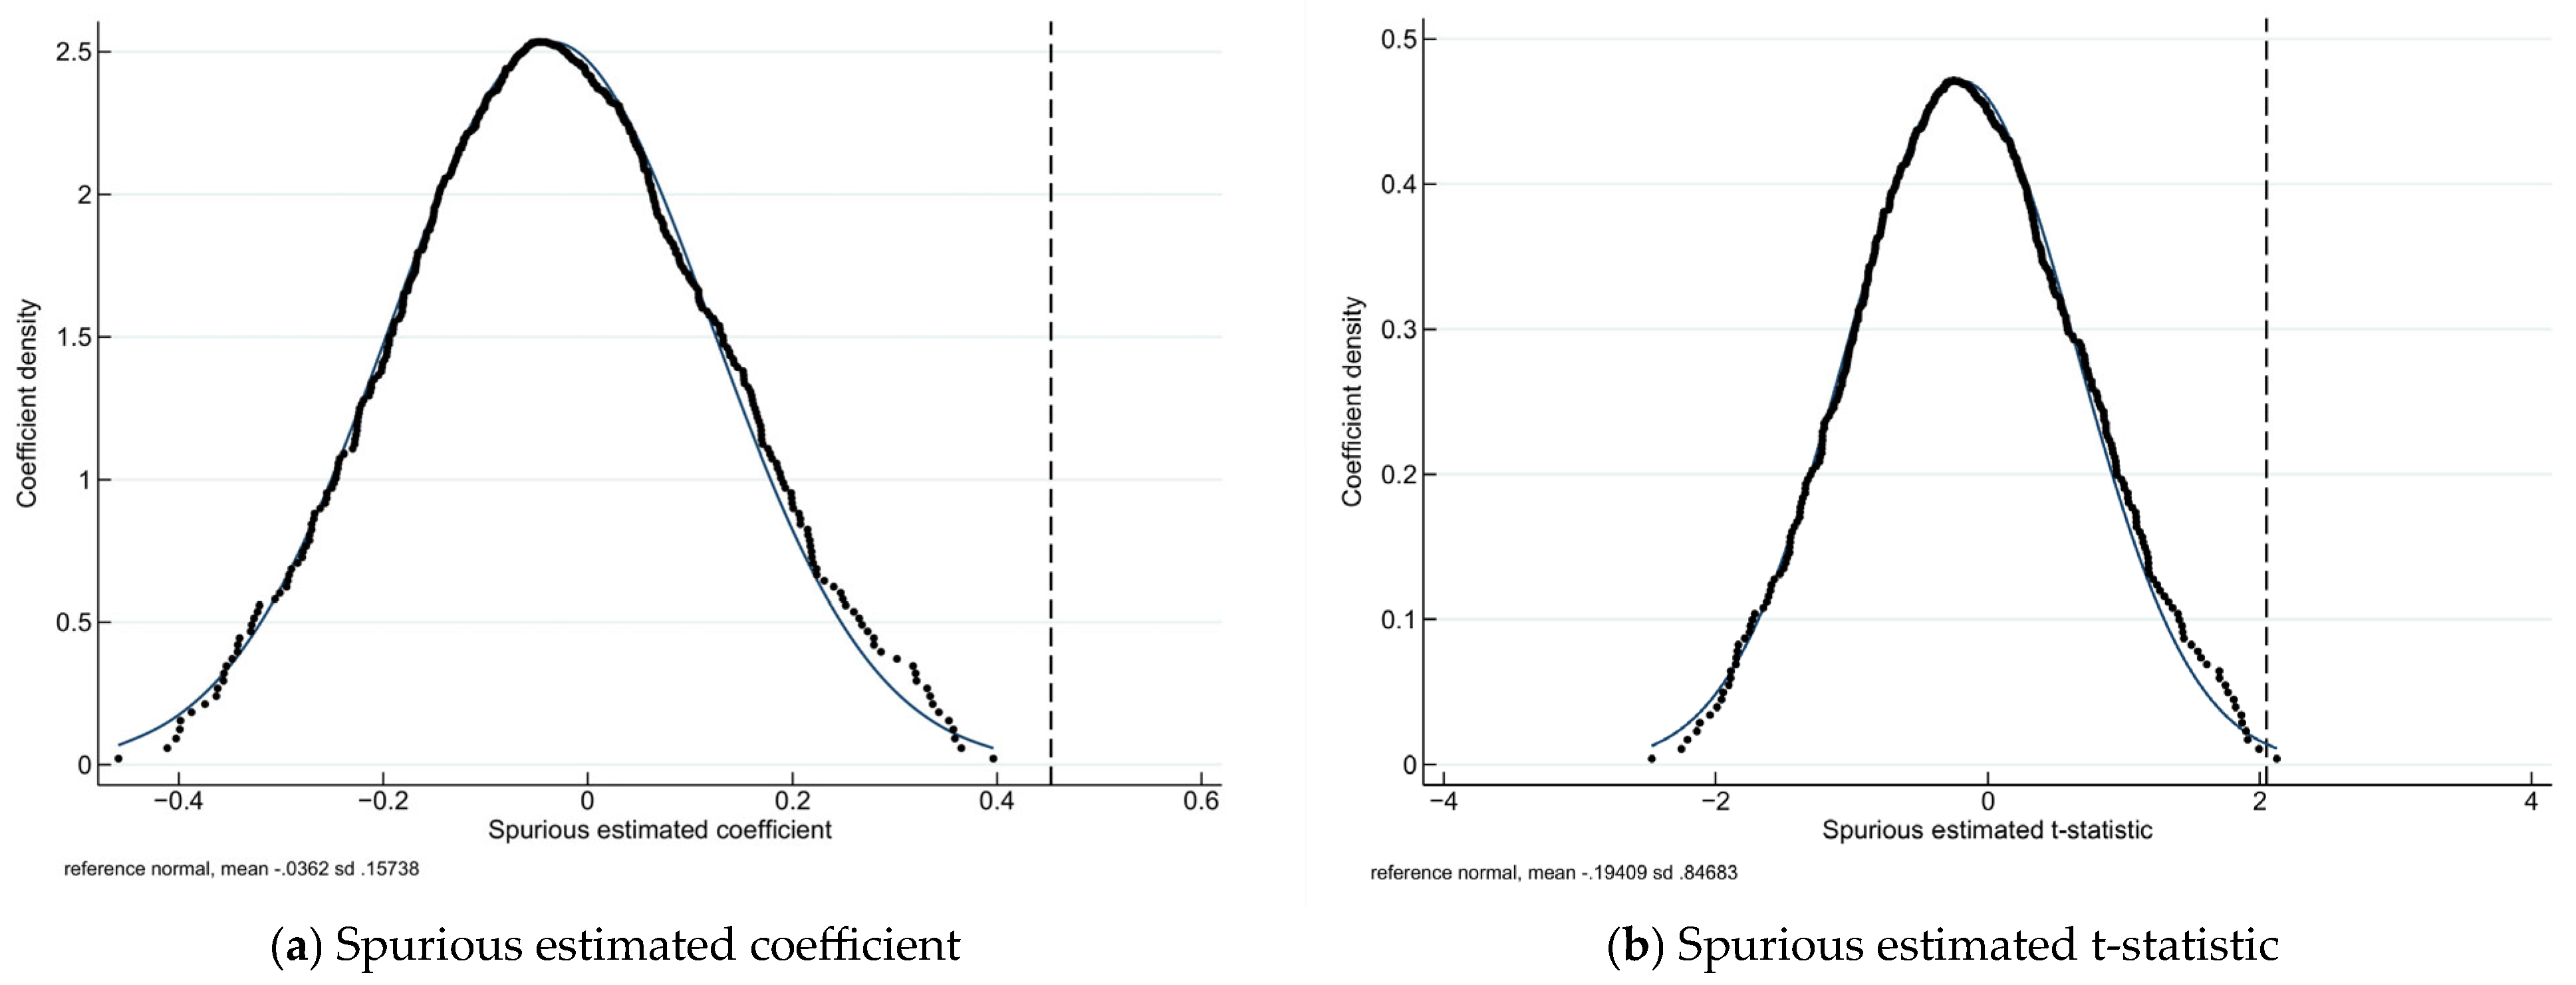
To rule out the possibility that the baseline regression results are driven by random shocks or unobservable factors, this study conducts a placebo test. Considering that CCPU is a city-year-level variable, this study randomly shuffles the actual CCPU values at the city-year observation level to generate a pseudo climate policy uncertainty variable. In theory, this pseudo variable preserves the city-year structure of CCPU but should not be associated with corporate innovation resilience. The pseudo variable is then substituted into the baseline model, and the randomization procedure is repeated 500 times. Figure 1 shows that the estimated coefficients and t-statistics of the pseudo CCPU are mainly concentrated around zero and approximately normally distributed. By contrast, the estimated coefficient and t-statistic of the actual CCPU are located in the right tail of the placebo-test distribution. This result suggests that the positive association identified in this study is unlikely to be caused by random assignment or unobservable confounding factors.

4.5. Mechanism Tests

4.5.1. Empirical Evidence on the Corporate Sustainable Transformation Channel

Based on the mechanism variable construction in Section 3.3.4, this study first examines the corporate sustainable transformation channel. Corporate sustainable transformation reflects the process through which firms adjust production and operation modes, optimize technological trajectories, and strengthen long-term development capabilities under the combined pressure of green development and digital transformation. It should be noted that whether firms advance green transformation and digital transformation may also depend on their existing technological foundations, accumulated green innovation capabilities, digital capabilities, and resource endowments. Against this background, this study further examines whether climate policy uncertainty is associated with a higher level of corporate sustainable transformation, thereby providing empirical evidence for the sustainable transformation channel.
Table 6 presents the results. Column (1) shows that the coefficient of CCPU on GRE is 0.0300 and significant at the 1% level. Column (2) shows that the coefficient of CCPU on Digitaleco is 0.0057 and significant at the 1% level. These findings indicate that climate policy uncertainty is positively associated with both green transformation and digital transformation. This result suggests that firms facing greater climate policy uncertainty are more likely to advance green innovation and digital transformation. Such transformation may help firms improve environmental adaptability and adjust innovation activities under changing policy conditions. These results are consistent with the corporate sustainable transformation channel proposed in H2a.

4.5.2. Empirical Evidence on the External Attention Pressure Channel

Second, this study examines the external attention pressure channel. External attention pressure captures the extent to which capital markets and information intermediaries pay attention to firms’ operating decisions, environmental performance, and long-term development capabilities. When climate policy uncertainty increases, external investors, analysts, and research institutions are more likely to focus on firms’ green strategies, risk management, and long-term innovation capabilities, thereby generating external monitoring pressure and information constraints. However, analyst coverage and research report coverage are also selective and may be affected by firm size, growth potential, market visibility, and prior innovation performance. Therefore, after controlling for firm characteristics and regional factors, this study further examines the relationship between climate policy uncertainty and external attention pressure.
Table 7 reports the results. Column (1) shows that the coefficient of CCPU on Analyst is 0.0290 and significant at the 1% level. Column (2) shows that the coefficient of CCPU on Report is 0.0369 and significant at the 1% level. These results indicate that climate policy uncertainty is positively associated with firms’ exposure to external information intermediaries. Greater external attention may improve the information environment and strengthen external monitoring, thereby encouraging firms to pay more attention to green strategies, innovation investment, and long-term risk management. This finding provides evidence consistent with the external attention pressure channel proposed in H2b.

4.5.3. Empirical Evidence on the Managerial Sustainable Governance Capability Channel

Finally, this study examines the managerial sustainable governance capability channel. Managerial sustainable governance capability reflects managers’ ability to identify green development trends, respond to policy changes, and embed sustainability-oriented practices into internal governance. Under climate policy uncertainty, managerial green perception and corporate green governance may determine whether firms can transform external policy pressure into sustained innovation momentum. Meanwhile, managerial sustainable governance capability may also be rooted in firms’ original governance quality, managerial preferences, ESG orientation, and long-term strategic capacity. Based on this logic, this study further examines whether climate policy uncertainty is associated with improvements in managerial green perception and corporate green governance.
Table 8 reports the results. Column (1) shows that the coefficient of CCPU on EGP is 0.1209 and significant at the 1% level, indicating that climate policy uncertainty is positively associated with managerial attention to green development and sustainable transformation. Column (2) shows that the coefficient of CCPU on Green_gov is 0.0422 and significant at the 1% level, indicating that climate policy uncertainty is positively associated with corporate green governance practices. These findings suggest that firms facing greater climate policy uncertainty tend to show stronger managerial green perception and more active green governance practices. Such governance responses may help firms allocate innovation resources and maintain innovation activities under uncertain policy environments. These findings are consistent with the managerial sustainable governance capability channel proposed in H2c.

4.6. Heterogeneity Analysis

4.6.1. Local Attention to Environmental Protection

Local environmental governance and policy support may affect firms’ perception of climate policy pressure and their access to green transformation resources, thereby changing the marginal effect of climate policy uncertainty on corporate innovation resilience. This study conducts subsample tests based on environmental regulation intensity (ER) and government environmental subsidies (GESs). Environmental regulation intensity captures the stringency of local environmental governance. Following Li and Yan (2025) [57], ER is measured by the proportion of characters in sentences containing environment-related keywords in the government work report of the city where the firm is located relative to the total number of characters in the report. Government environmental subsidies capture the financial support received by firms for environmental governance and green transformation. Drawing on Ma and Peng (2025) [58], this study identifies environmental subsidies from the government subsidy items disclosed in firms’ annual reports using green-related keywords, such as “green”, “environmental protection”, “environment”, “sustainable”, “clean”, “pollution”, and “energy saving”. GESs are measured as the ratio of environmental subsidies to operating revenue, multiplied by 100. The sample is then divided into high- and low-ER groups and high- and low-GES groups based on the industry-year median of each variable.
Table 9 reports the heterogeneity results. In regions with high environmental regulation intensity, the coefficient of CCPU is 0.8565 and significant at the 1% level, whereas the coefficient is not statistically significant in regions with low environmental regulation intensity. For government environmental subsidies, the coefficient of CCPU is 0.4287 and significant at the 10% level in the high-GES subsample, whereas it is not statistically significant in the low-GES subsample. These results suggest that the positive association between climate policy uncertainty and corporate innovation resilience is more consistently observed in regions with stronger environmental regulation and among firms receiving higher environmental subsidy support.
One possible explanation is that environmental regulation increases the credibility of green transition signals and raises firms’ expected costs of passive adjustment. Environmental subsidies, in turn, ease resource constraints and reduce the adjustment costs of green technology upgrading. As a result, firms are more likely to convert climate policy uncertainty into sustained innovation responses when both pressure and support are stronger.

4.6.2. Industry Attribute Characteristics

Industry attributes influence firms’ exposure to climate policy constraints and technological adjustment pressure, thereby shaping the effect of climate policy uncertainty on innovation resilience. This study conducts heterogeneity analysis based on heavy-polluting and high-tech industry attributes. Heavy-polluting firms are identified according to the heavy-polluting industry catalog matched with the 2012 CSRC industry classification. High-tech firms are identified by matching the high-tech firm catalog with the 2012 CSRC industry classification. Firms that belong to these catalogs are classified as heavy-polluting or high-tech firms, respectively, and all other firms are classified as the corresponding comparison group.
Columns (1) and (2) of Table 10 show that the coefficient of CCPU is 1.2031 and significant at the 1% level in the heavy-polluting subsample, whereas it is insignificant in the non-heavy-polluting subsample. This indicates that the positive association between climate policy uncertainty and corporate innovation resilience is mainly concentrated among heavy-polluting firms. Heavy-polluting firms usually face stricter emission constraints and higher compliance costs. Therefore, when climate policy uncertainty increases, they may have stronger incentives to maintain innovation continuity and prepare for future regulatory adjustments.
Columns (3) and (4) of Table 10 further show that the coefficient of CCPU is not significant in the high-tech subsample, while it is 0.6497 and significant at the 10% level in the non-high-tech subsample. This suggests that the positive association between climate policy uncertainty and innovation resilience is mainly observed among non-high-tech firms. A possible explanation is that high-tech firms already possess stronger R&D foundations and technological adjustment capabilities, making their innovation resilience less dependent on external policy signals. By contrast, non-high-tech firms face greater pressure to upgrade technologies and adjust innovation strategies, so their innovation resilience may respond more strongly to climate policy uncertainty.

5. Conclusions and Recommendations

5.1. Conclusions

With the continued advancement of China’s dual carbon goals, climate policy uncertainty has become an important external factor influencing corporate innovation decisions. Using Shanghai and Shenzhen A-share-listed firms from 2010 to 2023, this study examines the relationship between climate policy uncertainty and corporate innovation resilience and further investigates its underlying mechanisms and heterogeneous effects.
The main findings are as follows.
First, climate policy uncertainty is significantly and positively associated with corporate innovation resilience. This association remains robust after changing fixed-effect specifications, adjusting the clustering level of standard errors, excluding special-year observations, adding additional controls, and conducting instrumental variable, entropy-balancing, and placebo tests.
Second, the mechanism tests provide evidence consistent with the proposed channels of corporate sustainable transformation, external attention pressure, and managerial sustainable governance capability. Specifically, CCPU is positively associated with green and digital transformation, analyst and research report coverage, executive green perception, and corporate green governance practices.
Third, the heterogeneity analysis shows that the positive association between climate policy uncertainty and innovation resilience is more consistently observed in regions with stronger environmental regulation and among firms receiving higher government environmental subsidy support. At the industry level, this effect is mainly observed among heavy-polluting firms and non-high-tech firms.
Taken together, these findings suggest that climate policy uncertainty does not merely operate as a constraint on corporate innovation. In a transition context where the long-term direction of low-carbon development is relatively clear, such uncertainty may also induce firms to strengthen adaptive innovation capacity through transformation, external scrutiny, and internal governance responses.

5.2. Policy Implications

The continued advancement of climate governance is reshaping the external institutional environment in which firms operate. For enterprises, climate policy uncertainty is not merely a source of policy volatility. It may also encourage firms to reassess their green development strategies, resource allocation decisions, and long-term innovation capacity. Therefore, policy responses should aim not only to reduce unnecessary policy ambiguity, but also to provide credible long-term signals that help firms transform policy adjustments into expectations for sustainable transformation and sustained innovation.
First, the expectation-guiding role of climate policy should be strengthened to enhance firms’ awareness of sustained innovation. Climate policy is inherently long-term and may be adjusted dynamically during implementation. In promoting climate governance, governments should send stable and consistent signals of green transformation through carbon reduction targets, green development plans, low-carbon technology standards, and environmental regulation requirements. Local governments should also improve the transparency and predictability of policy implementation, so that firms can form relatively stable expectations and make continuous innovation plans under changing policy conditions.
Second, the coordinated development of green transformation and digital transformation should be promoted. The mechanism results suggest that sustainable transformation is an important channel associated with the relationship between climate policy uncertainty and corporate innovation resilience. Therefore, governments should encourage firms to increase R&D investment in green technologies, energy conservation, carbon reduction, clean production, and low-carbon products. At the same time, firms should be supported in using digital technologies to improve information collection, production management, energy efficiency monitoring, and supply chain coordination, thereby strengthening their ability to adjust innovation activities in uncertain environments.
Third, environmental regulation and environmental subsidies should be better coordinated to improve the precision and effectiveness of policy support. The heterogeneity results show that the positive association between climate policy uncertainty and innovation resilience is more consistently observed in regions with stronger environmental regulation and among firms receiving higher government environmental subsidy support. Local governments should therefore design environmental regulation and subsidy arrangements according to firms’ industry characteristics and transformation pressures. For firms facing stronger climate policy constraints, especially heavy-polluting firms, policy support should focus on green technology upgrading, energy-saving transformation, and low-carbon innovation projects. This may reduce firms’ risk concerns and support sustained innovation under policy uncertainty.
Fourth, external monitoring and internal green governance should be strengthened to improve firms’ responsiveness to climate policy changes. The mechanism results suggest that external attention and managerial sustainable governance capability are important channels associated with the relationship between climate policy uncertainty and innovation resilience. Therefore, environmental information disclosure and sustainability disclosure should be further improved to enhance the transparency of firms’ green strategies, green innovation, and climate risk responses. Enterprises should also strengthen managers’ green perception, improve environmental management systems, enhance environmental education and training, and implement environmental protection initiatives, which may help build organizational capacity for continuous innovation.

5.3. Limitations and Future Research Directions

Although this study provides a systematic analysis of the relationship between climate policy uncertainty and corporate innovation resilience and offers empirical evidence from the perspectives of mechanisms and heterogeneous effects, several limitations remain. Future research may be extended in the following directions.
First, this study measures firms’ policy environment using a news-based climate policy uncertainty index constructed from Chinese newspaper texts. Although this news-based index provides a systematic measure of climate policy uncertainty in China, it may still be affected by differences in local media environments, news reporting intensity, and media attention to climate-related policies. In addition, this study matches the index to firms based on their registered locations. This approach captures the institutional background of the registered location. However, for firms with cross-regional operations, off-site production facilities, or geographically dispersed supply chains, the registered location may not fully represent their actual exposure to climate policy uncertainty. Future studies could incorporate information on firms’ production locations, subsidiaries, and supply chain networks to measure climate policy exposure more accurately. Further research could also replicate this framework in markets with different media environments, such as Europe and the United States, to examine the external validity of the findings.
Second, the measurement of corporate innovation resilience in this study is mainly based on changes in patent applications. Although this approach helps capture the continuity and adaptability of firms’ innovation activities relative to the external innovation environment, it still focuses primarily on the quantity dimension of innovation. Patent applications may not fully reflect differences in patent quality, technological originality, economic value, or the sustainability orientation of innovation outcomes. Future research could combine patent citations, invention–patent ratios, patent value indicators, green patent classifications, or patent text information to construct a more multidimensional measure of corporate innovation resilience.
Third, this study explains the underlying mechanisms from three perspectives: corporate sustainable transformation, external attention pressure, and managerial sustainable governance capability. However, the formation of corporate innovation resilience may also be influenced by organizational capabilities, R&D team stability, and the continuity of innovation strategies. Future research could use more detailed management data, R&D team information, or textual evidence on strategic decision-making to further uncover the organizational processes through which firms build and maintain innovation resilience.

Author Contributions

Conceptualization, Z.C.; methodology, Y.W.; software, Y.W.; validation, Y.Q.; formal analysis, Z.C. and Y.W.; investigation, Y.W.; resources, Z.C.; data curation, Y.Q.; writing—original draft preparation, Z.C. and Y.W.; writing—review and editing, P.P.; visualization, Y.Q.; supervision, P.P.; project administration, P.P.; funding acquisition, Z.C. All authors have read and agreed to the published version of the manuscript.

Funding

This research was funded by the Natural Science Foundation of Sichuan Province under the project “Digital Local Government Regulation and Corporate Environmental-Economic Synergy: Time Lags, Spillover Effects, and Optimization Path” (Grant No. 2025NSFSC1974), and by the Sichuan Province Science and Technology Support Program (Soft Science Research Project) (Grant No. 2025NSFSCR0120).

Institutional Review Board Statement

Not applicable.

Informed Consent Statement

Not applicable.

Data Availability Statement

The raw data supporting the conclusions of this article will be made available by the authors on request.

Conflicts of Interest

The authors declare no conflicts of interest.

References

  1. Zhang, X.; Jia, J.; Wu, J.; Xu, B. CEO Power and Sustainable Innovation Resilience: The Influence of Corporate Reputation and AI Adoption. Sustainability 2026, 18, 2480. [Google Scholar] [CrossRef]
  2. Ortiz-de-Mandojana, N.; Bansal, P. The long-term benefits of organizational resilience through sustainable business practices. Strateg. Manag. J. 2016, 37, 1615–1631. [Google Scholar] [CrossRef]
  3. Peng, Y.; Jia, L. Impacts of digital transformation on enterprise innovation resilience: A study from China. S. Afr. J. Bus. Manag. 2024, 55, a4527. [Google Scholar] [CrossRef]
  4. Giglio, S.; Kelly, B.; Stroebel, J. Climate Finance. Annu. Rev. Financ. Econ. 2021, 13, 15–36. [Google Scholar] [CrossRef]
  5. Lee, C.; Li, M.; Zhang, J. How Climate Risk Affects Corporate Green Innovation: Fresh Evidence from China’s Listed Companies. Emerg. Mark. Financ. Trade 2025, 61, 2302–2315. [Google Scholar] [CrossRef]
  6. Li, J.; Kong, T.; Gu, L. The impact of climate policy uncertainty on green innovation in Chinese agricultural enterprises. Financ. Res. Lett. 2024, 62, 105145. [Google Scholar] [CrossRef]
  7. Borozan, D.; Pirgaip, B. Climate policy uncertainty and firm-level carbon dioxide emissions: Assessing the impact in the US market. Bus. Strategy Environ. 2024, 33, 5920–5938. [Google Scholar] [CrossRef]
  8. Lang, W.; Yuan, J.; Zuo, J.; Jia, T.; Zhao, J. Huddling for Stability: Climate Policy Uncertainty and Corporate Supply Chain Configuration. Sustainability 2026, 18, 4656. [Google Scholar] [CrossRef]
  9. Bloom, N. The Impact of Uncertainty Shocks. Econometrica 2009, 77, 623–685. [Google Scholar] [CrossRef]
  10. Julio, B.; Yook, Y. Political Uncertainty and Corporate Investment Cycles. J. Financ. 2012, 67, 45–83. [Google Scholar] [CrossRef]
  11. Niu, S.; Zhang, J.; Luo, R.; Feng, Y. How does climate policy uncertainty affect green technology innovation at the corporate level? New evidence from China. Environ. Res. 2023, 237, 117003. [Google Scholar] [CrossRef] [PubMed]
  12. Sun, G.; Fang, J.; Li, T.; Ai, Y. Effects of climate policy uncertainty on green innovation in Chinese enterprises. Int. Rev. Financ. Anal. 2024, 91, 102960. [Google Scholar] [CrossRef]
  13. Zhao, L.; Ma, Y.; Chen, N.; Wen, F. How does climate policy uncertainty shape corporate investment behavior? Res. Int. Bus. Financ. 2025, 74, 102696. [Google Scholar] [CrossRef]
  14. Lanoie, P.; Laurent-Lucchetti, J.; Johnstone, N.; Ambec, S. Environmental Policy, Innovation and Performance: New Insights on the Porter Hypothesis. J. Econ. Manag. Strategy 2011, 20, 803–842. [Google Scholar] [CrossRef]
  15. Bai, D.; Du, L.; Xu, Y.; Abbas, S. Climate policy uncertainty and corporate green innovation: Evidence from Chinese A-share listed industrial corporations. Energy Econ. 2023, 127, 107020. [Google Scholar] [CrossRef]
  16. Liu, Y.; Chen, L.; Cao, Z.; Wen, F. Uncertainty breeds opportunities: Assessing climate policy uncertainty and its impact on corporate innovation. Int. Rev. Financ. Anal. 2024, 96, 103560. [Google Scholar] [CrossRef]
  17. Dai, J.; Kiaw, J.; Hiung, E. Is some uncertainty better than none? Nonlinear relationships between climate policy uncertainty and corporate green performance. Int. Rev. Econ. Financ. 2025, 102, 104336. [Google Scholar] [CrossRef]
  18. Fu, J.; Zhang, J. Turning Uncertainty into Opportunity: Climate Policy Uncertainty and Firms’ Green Innovation Boundaries. Sustainability 2026, 18, 4814. [Google Scholar] [CrossRef]
  19. Bian, Z.; Luo, M. Impact of climate policy uncertainty on enterprises’ green technology innovation: Based on growth option theory. Sustain. Futur. 2025, 10, 101305. [Google Scholar] [CrossRef]
  20. Hong, N.T.H.; Kien, P.T.; Linh, H.G.; Thanh, N.V.H.; Tuan, N.L.; Anh, P.D. Do climate policy uncertainty and economic policy uncertainty promote firms’ green activities? Evidence from an emerging market. Cogent Econ. Financ. 2024, 12, 2307460. [Google Scholar] [CrossRef]
  21. Liu, X.; Xiang, Y. Climate policy uncertainty and corporate sustainability capability: Evidence from ESG performance. Corp. Soc. Responsib. Environ. Manag. 2025, 32, 5302–5322. [Google Scholar] [CrossRef]
  22. Ge, H.; Zhang, X. From uncertainty to sustainability: How climate policy uncertainty shapes corporate ESG? Int. Rev. Econ. Financ. 2025, 98, 104011. [Google Scholar] [CrossRef]
  23. Zhang, Z.; Hong, Y.; Yang, Z.; Chen, L.; Feng, Y. Navigating Uncertainty: How Climate Policy Uncertainty Drives Firms’ Green Transformation. Sustainability 2025, 17, 8370. [Google Scholar] [CrossRef]
  24. Fan, L.; Sun, Y.; Wu, T.-J. Is climate policy uncertainty an angel or a devil? Empirical evidence from corporate digital transformation. Int. Rev. Financ. Anal. 2025, 103, 104135. [Google Scholar] [CrossRef]
  25. Luo, T.; Qu, J.; Cheng, S. How does digital transformation affect the innovation resilience of manufacturing firms? J. Manuf. Technol. Manag. 2025, 36, 901–920. [Google Scholar] [CrossRef]
  26. Liu, B.; Liu, Z.; Zhao, Y. Corporate uncertainty perception, innovation resilience and environmental performance: Evidence from Chinese listed companies. Appl. Econ. 2025, 57, 4614–4629. [Google Scholar] [CrossRef]
  27. Ling, S.; Xia, H.; Liu, Z.; Treepongkaruna, S.; Haroon, S. Navigating climate policy uncertainty: Impacts on continuous innovation in corporations. Financ. Res. Lett. 2025, 71, 106436. [Google Scholar] [CrossRef]
  28. Li, S.; Fan, H.; Wang, Z.; Zhao, Q. Exploring the relationship between climate policy uncertainty perception and green technology innovation in Chinese enterprises. Econ. Anal. Policy 2025, 86, 880–892. [Google Scholar] [CrossRef]
  29. Wang, M.; Li, Y.; Cao, X. How enterprise climate risk perception affects organizational resilience: A green technology innovation perspective. Stoch. Environ. Res. Risk Assess. 2024, 38, 4369–4391. [Google Scholar] [CrossRef]
  30. Sahu, A.K.; Debata, B.; Khanna, G. Unveiling the nexus between ESG performance, climate policy uncertainty and corporate innovation: Evidence from textual analysis. Soc. Responsib. J. 2025, 21, 893–921. [Google Scholar] [CrossRef]
  31. Xiao, J.; Zhou, Y.; Zeng, P. How does green strategy orientation promote substantive green innovation? Evidence from Chinese manufacturing enterprises. Econ. Chang. Restruct. 2024, 57, 225. [Google Scholar] [CrossRef]
  32. Huo, M.; Li, C.; Liu, R. Climate policy uncertainty and corporate green innovation performance: From the perspectives of organizational inertia and management internal characteristics. Manag. Decis. Econ. 2024, 45, 34–53. [Google Scholar] [CrossRef]
  33. Qin, X.; Wang, Z.; Liang, Y.; Virtanen, Y. How Does Climate Policy Uncertainty Affect Corporate Sustainability? Evidence from a Quasi-Natural Experiment in China. Sustainability 2026, 18, 1554. [Google Scholar] [CrossRef]
  34. Yang, J.; Shen, H.; Nachiangmai, S.; Kunthino, A. Research on the Impact and Mechanism of Climate Risk on Substantive and Strategic Green Technology Innovation of Enterprises. Emerg. Mark. Financ. Trade 2026, 62, 2225–2250. [Google Scholar] [CrossRef]
  35. Pan, M.; Meng, J. Impact of Enterprise Digital Transformation on Green Technology Innovation in China: Roles of Carbon Information Disclosure and Media Attention. Sustainability 2025, 17, 10901. [Google Scholar] [CrossRef]
  36. Ren, X.; Zhang, Z.; Cao, Y.; Cheng, X.; Taghizadeh-Hesary, F. Unleashing potential: How climate policy uncertainty impacts digital transformation in China’s listed companies. Discov. Sustain. 2025, 6, 255. [Google Scholar] [CrossRef]
  37. Deng, Q.; Karia, N. How ESG Performance Promotes Organizational Resilience: The Role of Ambidextrous Innovation Capability and Digitalization. Bus. Strategy Dev. 2025, 8, e70079. [Google Scholar] [CrossRef]
  38. Sun, Z.; Zhao, L.; Mehrotra, A.; Salam, M.A.; Yaqub, M.Z. Digital transformation and corporate green innovation: An affordance theory perspective. Bus. Strategy Environ. 2025, 34, 433–449. [Google Scholar] [CrossRef]
  39. He, K.; Chen, W. Can digital transformation improve corporate green innovation? Technol. Anal. Strateg. Manag. 2025, 37, 1509–1525. [Google Scholar] [CrossRef]
  40. Sun, Y.; Chen, C.; Yi, H. Government Subsidies, Public Environmental Attention, and Sustainable Innovation Performance of Environmental Protection Enterprises. Sustainability 2026, 18, 5057. [Google Scholar] [CrossRef]
  41. Cheng, B.; Ioannou, I.; Serafeim, G. Corporate social responsibility and access to finance. Strateg. Manag. J. 2014, 35, 1–23. [Google Scholar] [CrossRef]
  42. Liu, L.; Ge, M.; Ding, Z. Impacts of online media and investor attention on enterprise green innovation. Int. Rev. Econ. Financ. 2024, 96, 103569. [Google Scholar] [CrossRef]
  43. Zhang, P.; Wang, Y. The bright side of analyst coverage on corporate innovation: Evidence from China. Int. Rev. Financ. Anal. 2023, 89, 102791. [Google Scholar] [CrossRef]
  44. Fan, L.; Xu, W. Green Credit Policy, Analyst Attention, and Corporate Green Innovation. Sustainability 2025, 17, 3362. [Google Scholar] [CrossRef]
  45. He, J.; Tian, X. The dark side of analyst coverage: The case of innovation. J. Financ. Econ. 2013, 109, 856–878. [Google Scholar] [CrossRef]
  46. Bond, P.; Edmans, A.; Goldstein, I. The Real Effects of Financial Markets. Annu. Rev. Financ. Econ. 2012, 4, 339–360. [Google Scholar] [CrossRef]
  47. Zafar, S.; Huang, Q.; Zafar, Z.; Haq, M.A.U. Impact of Managerial Environmental Concerns on Environmental Performance: Mediating Role of Green Entrepreneurship Orientation. Sustainability 2025, 17, 11242. [Google Scholar] [CrossRef]
  48. Wei, J.; Zheng, Q. Environmental, social and governance performance: Dynamic capabilities through digital transformation. Manag. Decis. 2024, 62, 4021–4049. [Google Scholar] [CrossRef]
  49. Wang, L.; Chen, L.; Zhong, S.; Zhou, Q. How executive green perception affect high-quality growth: Evidence from Chinese listed companies. Int. Rev. Financ. Anal. 2025, 108, 104693. [Google Scholar] [CrossRef]
  50. Cao, L.; Jiang, H.; Niu, H. The Co-Inhibiting Effect of Managerial Myopia on ESG Performance-Based Green Investment and Continuous Innovation. Sustainability 2024, 16, 7983. [Google Scholar] [CrossRef]
  51. Martin, R.; Gardiner, B. The resilience of cities to economic shocks: A tale of four recessions (and the challenge of Brexit). Pap. Reg. Sci. 2019, 98, 1801–1833. [Google Scholar] [CrossRef]
  52. Ma, Y.-R.; Liu, Z.; Ma, D.; Zhai, P.; Guo, K.; Zhang, D.; Ji, Q. A news-based climate policy uncertainty index for China. Sci. Data 2023, 10, 881. [Google Scholar] [CrossRef] [PubMed]
  53. Xu, G.; Li, G.; Sun, P.; Peng, D. Inefficient investment and digital transformation: What is the role of financing constraints? Financ. Res. Lett. 2023, 51, 103429. [Google Scholar] [CrossRef]
  54. Pan, H.; Wang, Y.; Gong, W.; Zhen, J. Potential forces for low-carbon transition: The role of analyst attention in China’s high-polluting industries. J. Environ. Manag. 2026, 404, 129393. [Google Scholar] [CrossRef] [PubMed]
  55. Tang, Z.; Zhang, Z.; Zhang, C. How do green investors drive firms toward a win-win of carbon reduction and value creation? Res. Int. Bus. Financ. 2026, 87, 103410. [Google Scholar] [CrossRef]
  56. Li, J.; Peng, D.; Zheng, L.; Yuan, L.; Li, R. Cooperative R&D networks embeddedness and innovation resilience: The moderating role of environmental turbulence. Eur. J. Innov. Manag. 2024. [Google Scholar] [CrossRef]
  57. Li, B.; Yan, T. Environmental regulation intensity, financial mismatch, and environmental penalties for listed companies. Financ. Res. Lett. 2025, 86, 108707. [Google Scholar] [CrossRef]
  58. Ma, C.; Peng, D. Government subsidies, environmental costs, and green innovation. Int. Rev. Econ. Financ. 2025, 101, 104237. [Google Scholar] [CrossRef]
Figure 1. Placebo tests. Panel (a) reports the distribution of spurious estimated coefficients, and panel (b) reports the distribution of spurious estimated t-statistics. The dotted curve represents the kernel density distribution of the placebo estimates, the solid curve represents the corresponding normal density distribution, and the vertical dashed line indicates the estimate obtained from the actual sample.
Sustainability 18 08171 g001
Table 1. Main variables.
Variable TypeVariablesSymbolVariable Measurement
Independent VariableClimate policy uncertaintyCCPUPrefecture-level city comprehensive index of climate policy uncertainty
Dependent VariableCorporate innovation resilienceIRLevel of corporate innovation resilience assessed by changes in the number of patent applications
Control VariablesFirm sizeSizeLN (the total number of employees)
Leverage ratioLevTotal liabilities at year-end/Total assets at year-end
Net cash flowCashNet cash flow from operating activities/total assets
Intangible asset ratioIntNet intangible assets/Total assets
Ownership concentrationTop1Shareholding ratio of the largest shareholder
Audit opinionOpinionType of opinion issued by the audit firm on the annual report. 1 = Standard unqualified opinion; 0 = Others
Big Four auditorBig4Whether the domestic audit firm is one of the international Big Four; 1 = Yes, 0 = No
DualityDualWhether the chairperson and the general manager are the same person; 0 = No, 1 = Yes
Executive compensation incentiveSalaryNatural logarithm of total executive compensation
Regional economic levelPGDPPer capita gross regional product (10,000 CNY)
Mechanism VariableGreen transformationGRELN (1 + total number of granted green invention and utility model patents)
Digital transformationDigitalecoProportion of digital technology-related items in year-end intangible assets as disclosed in the notes to the financial statements, relative to total intangible assets
Analyst coverageAnalystLN (1 + the number of analyst teams covering the firm in a given year)
Research report coverageReportLN (1 + the number of research reports covering the firm in a given year)
Executive green perceptionEGP(Frequency of green-related keywords in the annual report/total word count) × 100
Corporate green governanceGreen_govSum of environmental management system, environmental training, and environmental protection initiatives
Table 2. Descriptive statistics of the main variables.
VarNameObsMeanSDMinMax
IR30,632−2.444621.8739−139.384961.8689
CCPU30,6321.75310.72870.21103.8285
Size30,6327.75061.21775.204011.2810
Lev30,6320.41770.20220.05410.8899
Cash30,6320.04640.0656−0.14260.2318
Int30,6320.04530.04790.00010.3136
Top130,63233.398214.74088.040973.3305
Opinion30,6320.97340.16080.00001.0000
Big430,6320.06360.24400.00001.0000
Dual30,6320.30210.45920.00001.0000
Salary30,63215.43930.715813.729617.4039
PGDP30,63211.19284.84122.090820.3489
Table 3. Baseline regression results.
Variables(1)
IR
(2)
IR
(3)
IR
CCPU0.4848 ***0.3701 *0.4527 **
(2.6030)(1.8850)(2.0494)
Size 0.6016 ***
(4.0913)
Lev −1.6958 *
(−1.9505)
Cash −1.7559
(−0.8280)
Int 2.6375
(0.8799)
Top1 0.0178 *
(1.8771)
Opinion 5.7476 ***
(4.9742)
Big4 −0.9402 *
(−1.8542)
Dual −0.3146
(−1.0712)
Salary 0.7455 ***
(3.3718)
PGDP −0.0651 *
(−1.8686)
Constant−3.2946 ***−3.0936 ***−24.0460 ***
(−8.5156)(−7.7961)(−7.4116)
IndustryNOYESYES
YearNOYESYES
Observations30,63230,63130,631
Adj. R20.00020.00460.0085
Note: t-statistics are reported in parentheses; * p < 0.10, ** p < 0.05, and *** p < 0.01.
Table 4. Robustness test results.
Variables(1)
IR
(2)
IR
(3)
IR
(4)
IR
CCPU0.6797 ***0.4508 **0.5533 **0.5708 **
(2.6159)(2.0354)(2.4186)(2.4570)
Size2.0326 ***0.6017 ***0.5248 ***0.6496 ***
(5.5056)(5.1559)(3.1261)(3.9223)
Lev−5.3918 ***−1.6942 **−0.51391.2415
(−3.5736)(−2.2099)(−0.5115)(1.2856)
Cash−0.6422−1.7627−1.8194−8.4111 ***
(−0.2383)(−0.9937)(−0.7491)(−3.5099)
Int−3.89322.65266.2757 *4.6939
(−0.7425)(0.8629)(1.8106)(1.5445)
Top10.01440.0177 *0.0148−0.0078
(0.6091)(1.9232)(1.3655)(−0.7885)
Opinion4.7077 ***5.7475 ***7.0045 ***4.3719 ***
(3.7041)(5.0158)(4.9563)(3.6416)
Big40.9101−0.9386−0.8571−1.0232 *
(0.7544)(−1.5994)(−1.4723)(−1.9514)
Dual−0.0606−0.3154−0.3373−0.5012
(−0.1206)(−1.3379)(−0.9956)(−1.5955)
Salary0.8115 *0.7432 ***0.4713 *0.4116 *
(1.9308)(3.5915)(1.8770)(1.7393)
PGDP−0.0547−0.0645−0.0897 **−0.0557
(−0.6058)(−1.6329)(−2.2976)(−1.4296)
Age −1.1517 ***
(−4.7765)
Roa 20.4176 ***
(6.8217)
TobinQ 0.0767
(0.5969)
RD −3.6228
(−0.4685)
State 1.4758 ***
(4.4205)
SA −0.3735
(−0.5852)
HHI −0.3189
(−0.3351)
Gfr_pilot 0.9496 *
(1.6738)
Carbon_pilot −0.1493
(−0.4274)
Constant−34.0289 ***−24.0140 ***−20.7657 ***−18.6156 ***
(−5.1976)(−7.6069)(−5.6230)(−4.3350)
Firm & Industry & YearYES
Industry & Year YESYESYES
Observations30,24630,62123,07028,736
Adj. R20.01480.00850.00840.0122
Note: t-statistics are reported in parentheses; * p < 0.10, ** p < 0.05, and *** p < 0.01.
Table 5. Endogeneity test results.
Variables(1)
First-Stage CCPU
(2)
Second-Stage IR
(3)
Entropy Balancing
IV0.0277 ***
(3.9203)
CCPU 27.4909 ***0.4240 *
(5.0355)(1.8069)
Size−0.0143 ***0.5162 ***0.6026 ***
(−3.3648)(2.5940)(3.3704)
Lev−0.03211.1576−1.9401 **
(−1.3468)(1.2800)(−1.9832)
Cash−0.2860 ***10.3147 ***−2.7798
(−4.4233)(2.9238)(−1.1960)
Int0.0947−3.41511.3161
(1.1065)(−1.0558)(0.3914)
Top10.0005 *−0.01830.0245 **
(1.8188)(−1.6360)(2.2796)
Opinion0.0049−0.17695.8035 ***
(0.1993)(−0.1993)(4.6980)
Big40.1022 ***−3.6849 ***−0.9173
(5.7860)(−3.2991)(−1.5415)
Dual0.0147 *−0.5295−0.3304
(1.6490)(−1.5091)(−0.9980)
Salary0.0247 ***−0.8919 ***0.8657 ***
(3.4828)(−2.5767)(3.2054)
PGDP0.0771 ***−2.7812 ***−0.0506
(71.1659)(−3.9412)(−1.3620)
PEC−0.0246 *0.8889 *
(−1.8325)(1.6691)
Wind_speed−0.0146 ***0.5273 ***
(−5.7368)(3.4014)
Annual_precip−0.0078 ***0.2800 ***
(−48.2144)(3.8553)
Adapt_pilot0.4003 ***−14.4355 ***
(12.6911)(−3.8173)
Constant0.9750 ***36.0657 ***−28.1708 ***
(8.2762)(3.9203)(−6.5913)
IndustryYESYESYES
YearYESYESYES
Observations23,67723,67730,631
Adj. R2 0.009
Kleibergen-Paap rk LM statistic15.357 ***
Cragg-Donald Wald F statistic12.214 [16.38]
Note: t-statistics are reported in parentheses; * p < 0.10, ** p < 0.05, and *** p < 0.01.
Table 6. Mechanism test results: corporate sustainable transformation.
Variables(1)
GRE
(2)
Digitaleco
CCPU0.0300 ***0.0057 ***
(3.5878)(2.9844)
Size0.2930 ***−0.0096 ***
(48.7804)(−6.9802)
Lev0.4488 ***0.0060
(14.3957)(0.8255)
Cash−0.5074 ***−0.0223
(−6.2437)(−1.1405)
Int0.5535 ***−0.6623 ***
(4.4275)(−28.3628)
Top10.0011 ***−0.0002 ***
(2.8114)(−2.9058)
Opinion0.0813 ***−0.0106
(2.6222)(−1.2113)
Big40.1875 ***0.0109 **
(6.9448)(2.5096)
Dual−0.0427 ***−0.0016
(−3.8881)(−0.6335)
Salary0.1470 ***−0.0020
(15.6215)(−1.0214)
PGDP0.0080 ***0.0020 ***
(5.6411)(7.5694)
Constant−4.1343 ***0.2159 ***
(−30.8932)(7.6218)
IndustryYESYES
Year YESYES
Observations30,63130,318
Adj. R20.37010.2698
Note: t-statistics are reported in parentheses; ** p < 0.05, and *** p < 0.01.
Table 7. Mechanism test results: external attention pressure.
Variables(1)
Analyst
(2)
Report
CCPU0.0290 ***0.0369 ***
(3.0925)(3.1678)
Size0.3173 ***0.3938 ***
(49.7179)(49.5551)
Lev−0.9118 ***−1.1070 ***
(−26.5271)(−25.8932)
Cash2.0115 ***2.6234 ***
(21.7512)(22.7056)
Int−0.6186 ***−0.6897 ***
(−4.6504)(−4.1266)
Top10.00010.0001
(0.2591)(0.1217)
Opinion0.2617 ***0.3287 ***
(8.6761)(8.7615)
Big40.1213 ***0.1522 ***
(5.0997)(5.1506)
Dual0.1923 ***0.2412 ***
(15.1139)(15.2422)
Salary0.4668 ***0.5763 ***
(45.8760)(45.6186)
PGDP0.0105 ***0.0131 ***
(6.7999)(6.7676)
Constant−8.4301 ***−10.4468 ***
(−60.3096)(−60.0966)
IndustryYESYES
Year YESYES
Observations30,63130,631
Adj. R20.34520.3428
Note: t-statistics are reported in parentheses; *** p < 0.01.
Table 8. Mechanism test results: managerial sustainable governance capability.
Variables(1)
EGP
(2)
Green_gov
CCPU0.1209 ***0.0422 ***
(2.9869)(5.2034)
Size0.3396 ***0.1750 ***
(12.5889)(32.9999)
Lev0.8520 ***−0.0105
(5.8528)(−0.3772)
Cash−0.19850.0840
(−0.5583)(1.1292)
Int4.2496 ***−0.0080
(6.5447)(−0.0704)
Top10.0062 ***0.0032 ***
(3.6770)(9.3939)
Opinion0.5393 ***0.1036 ***
(3.8011)(4.1772)
Big4−0.3776 ***0.3407 ***
(−3.7341)(14.0250)
Dual−0.3620 ***−0.0665 ***
(−7.2434)(−6.7516)
Salary0.1689 ***0.1582 ***
(3.8669)(18.8483)
PGDP−0.0144 **−0.0028 **
(−2.2279)(−2.1925)
Constant−3.0140 ***−3.4005 ***
(−4.9072)(−28.4605)
IndustryYESYES
Year YESYES
Observations30,61530,623
Adj. R20.22860.2378
Note: t-statistics are reported in parentheses; ** p < 0.05, and *** p < 0.01.
Table 9. Heterogeneity test of local attention to environmental protection.
Variables(1)
High ER
(2)
Low ER
(3)
High GES
(4)
Low GES
CCPU0.8565 ***−0.18460.4287 *0.9347
(2.7593)(−0.4249)(1.8734)(1.1100)
Size0.7718 ***0.4787 **0.6331 ***0.3681
(3.4663)(2.4168)(4.1225)(0.7198)
Lev−2.5624 **−1.0266−2.1155 **2.5417
(−1.9876)(−0.8682)(−2.3173)(0.8837)
Cash−1.1563−3.2703−1.6600−3.1529
(−0.3638)(−1.1444)(−0.7509)(−0.4121)
Int4.5797−0.70192.41005.3189
(0.9907)(−0.1757)(0.7552)(0.5946)
Top10.01630.0246 **0.01330.0548
(1.1269)(1.9808)(1.3596)(1.5548)
Opinion6.0571 ***4.7431 ***6.0883 ***1.4387
(3.4349)(3.1815)(5.0196)(0.3903)
Big4−0.3508−1.5115 **−1.3060 **1.6817
(−0.4644)(−2.2129)(−2.3358)(1.3842)
Dual−0.4522−0.2042−0.42281.0080
(−1.0109)(−0.5282)(−1.3807)(0.9533)
Salary0.54650.8542 ***0.7934 ***0.1771
(1.6375)(2.8798)(3.4046)(0.2463)
PGDP−0.1249 **−0.0146−0.0515−0.2175 *
(−2.3150)(−0.2870)(−1.4068)(−1.7720)
Constant−22.5165 ***−23.3904 ***−25.1243 ***−12.1762
(−4.6895)(−5.2964)(−7.3317)(−1.1860)
IndustryYESYESYESYES
Year YESYESYESYES
Observations15,16315,08327,8982724
Adj. R20.00990.00930.00890.0096
Note: t-statistics are reported in parentheses; * p < 0.10, ** p < 0.05, and *** p < 0.01.
Table 10. Heterogeneity test of industry attribute characteristics.
Variables(1)
Heavy-Polluting
(2)
Non-Heavy-Polluting
(3)
High-Tech
(4)
Non-High-Tech
CCPU1.2031 ***0.13750.37360.6497 *
(3.0517)(0.5173)(1.3972)(1.6826)
Size0.7487 ***0.5471 ***0.7070 ***0.4816 **
(2.5766)(3.1933)(3.8914)(1.9884)
Lev−0.9807−2.1228 **−1.4141−2.2292
(−0.5804)(−2.0879)(−1.3360)(−1.4845)
Cash0.4551−2.71500.5902−5.4933
(0.1159)(−1.0759)(0.2283)(−1.5038)
Int6.97991.3981−1.48745.6875
(1.2292)(0.3965)(−0.3154)(1.4677)
Top10.00770.0212 *0.00530.0377 **
(0.4062)(1.9446)(0.4745)(2.2653)
Opinion4.4269 **6.1797 ***6.8366 ***4.2070 **
(2.0758)(4.5254)(4.4878)(2.3698)
Big4−0.3287−1.1912 *−0.3138−1.3635 *
(−0.3924)(−1.8851)(−0.5534)(−1.6706)
Dual−0.2774−0.3226−0.1899−0.5995
(−0.4639)(−0.9567)(−0.5574)(−1.0566)
Salary0.08441.0350 ***0.8330 ***0.5401
(0.2024)(3.9629)(3.0984)(1.4365)
PGDP−0.0797−0.06270.0036−0.1747 ***
(−1.2076)(−1.5130)(0.0822)(−2.9341)
Constant−15.4327 **−27.7061 ***−27.4154 ***−18.2887 ***
(−2.4658)(−7.2744)(−6.1762)(−3.6188)
IndustryYESYESYESYES
Year YESYESYESYES
Observations870721,92418,73211,884
Adj. R20.00560.01010.00830.0083
Note: t-statistics are reported in parentheses; * p < 0.10, ** p < 0.05, and *** p < 0.01.
Disclaimer/Publisher’s Note: The statements, opinions and data contained in all publications are solely those of the individual author(s) and contributor(s) and not of MDPI and/or the editor(s). MDPI and/or the editor(s) disclaim responsibility for any injury to people or property resulting from any ideas, methods, instructions or products referred to in the content.