1. Introduction
Feeding the world will remain a great challenge, as the global population is projected to approach 10 billion within the next 60 years [
1]. Meeting sustainable future food demand under a changing climate will require increasing food production while limiting the associated environmental pressures. The question today is not so much whether we can feed everyone, but how to do so sustainably—that is, in a way that does not compromise the ability of future generations to meet their own needs. Therein lies an inherent tension—almost a contradiction—between producing enough food and preserving the environment. Yet these need not be opposing goals; they are better viewed as two sides of the same coin.
Food trade plays a key role in achieving the United Nations’ Sustainable Development Goals (SDGs) as it not only impacts goals such as “zero hunger” (goal 2), but has spillover effects on other goals such as “clean water and sanitation” (goal 6), “affordable and clean energy” (goal 7), and “climate action” (goal 13) [
2]. Governments, international organisations, as well as private-sector actors play a central role in balancing these effects through trade, agricultural, and environmental interventions [
3]. In the face of climate change, geopolitical tensions, and economic shocks, reconciling these opposing forces has become ever more complex and critical, given that global food security increasingly depends on international trade, a dependency which itself results from uneven distribution of arable land, water, and climate conditions [
4].
Currently, the global food system largely prioritises efficiency over long-term resilience [
5,
6]. Any rebalancing of the status quo must take account of agricultural pressures (the negative impacts, demands, and stresses that farming activities place on the natural environment), alongside climate change, soil degradation, and water scarcity. Analysing countries’ food trade vulnerability and current agricultural practices is essential for understanding global needs and identifying more sustainable strategies for the future. The overarching question of this project is: how does international food trade influence the environmental sustainability of national food supplies, and how can this be quantified through a composite index? For this work, sustainability is limited to minimising the environmental pressures associated with food production while maintaining food supply.
Although indices of food security and sustainability already exist, they typically do not provide a framework that combines these dimensions with international trade in a quantitative and transparent way [
7]. For example: the Global Food Security Index (GFSI) “evaluates food security in 113 countries across four key pillars: affordability, availability, quality and safety, and sustainability and adaptation” [
8]; the Environmental Performance Index (EPI) “ provides a data-driven summary of the state of sustainability around the world” [
9]; the Food Systems NDC Scorecard “assesses the integration of food systems in NDCs [Nationally Determined Contributions]” [
10]; and the Aqueduct informs “companies, governments, and nongovernmental organizations (NGOs) about water-related risks” [
11]. These existing indices fail to connect food security, trade, and climate projections. To our knowledge, no existing index integrates these three dimensions within a single transparent and representative framework.
The Food Supply Sustainability Index (FSSI) is a composite, cross-country index that evaluates the sustainability of food imports while explicitly accounting for international trade patterns and future climate scenarios. In so doing, the FSSI addresses a key gap in the literature, where environmental sustainability, trade dependencies, and future climate impacts are typically assessed separately [
12]. This approach provides a novel perspective on global vulnerability to food trade by linking environmental pressures directly to trade dependencies. It will also serve as a complementary pillar to the existing Jameel Index for Food Trade and Vulnerability (Jameel Index) [
13]—which focuses on trade resilience—and shed light on unsustainable production and future climate-driven trade dynamics, and the phenomenon we later describe as “sustainability by necessity”.
The FSSI serves three purposes: (i) improving our understanding of the interactions between food production, trade, and climate-related environmental pressures; (ii) informing decision-makers on the sustainability implications of current and alternative trade patterns; and (iii) providing a transparent, data-driven tool to evaluate and monitor progress toward sustainable food systems under future climate scenarios. The aim with this index is to promote sustainable efficiency, defined as producing food while minimising environmental pressures and maintaining resilience to future shocks, as a guiding principle for future agricultural and trade practices—one that allows both people and the planet to thrive.
2. Materials and Methods
The Food Supply Sustainability Index (FSSI) is a novel, composite, cross-country index designed to assess the environmental sustainability of food production while accounting for international trade and future climate-driven trade dynamics. The index integrates three environmental pillars: carbon footprint, soil degradation, and water stress. It uses a distance-to-target normalisation to score the sustainability of domestic food production (inspired by other prominent indices such as the Environmental Performance Index or the Human Development Index [
9,
14]). Then it adjusts these scores using import shares and future trade projections under climate change to capture how environmental pressures move through global food trade.
Sustainability is a multidimensional concept [
15]. To ensure analytical tractability and focus on the most critical planetary boundaries, this iteration of the FSSI restricts its scope to three core environmental pillars: carbon footprint, soil degradation, and water stress. These were selected based on a systematic review of existing frameworks (e.g., [
16]), their direct measurability at the global scale, and their policy relevance to agricultural systems.
The carbon footprint pillar captures greenhouse gas emissions associated with agricultural production and land use. Carbon sequestration was ignored to highlight emitted emissions only. In total, 12 emission sources were selected from the Food and Agriculture Organization Corporate Statistical Database (FAOSTAT) Climate Change: Agrifood systems emissions database [
17], encompassing both on-farm and land-use-related processes:
All emissions were converted to carbon dioxide equivalents (CO
2e) using Global Warming Potentials from the IPCC Sixth Assessment Report (AR6), with values of 27 for CH
4 and 273 for N
2O [
18]. CO
2e emissions are the representation of the total national carbon footprint. Emissions were aggregated at the country level and normalised by total food production (in tonnes, from [
19]) to obtain emissions per tonne of food produced, enabling cross-country comparability. This metric was specifically developed as part of the FSSI framework. Although normalising by food mass does not account for differences in the caloric or nutrient content of commodities, it provides a consistent and transparent basis for comparing the environmental pressure associated with aggregated national food production systems. Commodity-specific weighting could be added in the future.
The soil degradation pillar reflects the anthropogenic pressures on soil due to agricultural chemical inputs, rather than directly measuring soil condition or degradation outcomes. It represents the state of inputs at a national level. Two indicators were selected based on their documented impacts on soil health, ecosystems, and water quality: synthetic fertiliser use and pesticide use. Fertiliser use was measured as the sum of nitrogen (N), phosphate (P
2O
5), and potash (K
2O) applied per hectare of cropland. Pesticide use was measured as total application per hectare of cropland. Both indicators were obtained from FAOSTAT and expressed in kg/ha [
20]. Direct measures of soil condition, such as soil organic carbon (SOC) or soil organic matter (SOM), were not included as no harmonised global datasets exist that allow robust cross-country comparisons.
Water stress is defined as the “ratio between total freshwater withdrawn by all major sectors and total renewable freshwater resources, after taking into account environmental water requirements” [
21]. It was sourced from FAO’s AQUASTAT database [
22]. This indicator captures pressure on renewable water supplies from agricultural use and reflects both blue and green water availability.
Domestic production and environmental indicators were sourced primarily from FAOSTAT and AQUASTAT, with 2021 selected as the base year due to data completeness. Trade and dietary data were obtained from the International Food Policy Research Institute (IFPRI), covering 9 major agricultural commodities (dairy, maize, meat, oil crops, pulses, rice, soy, sugar, and wheat). These crops represent the most traded and calorically significant food commodities globally [
13,
23]. Accordingly, this study focuses on calorie supply and does not seek to represent dietary quality or micronutrient adequacy. IFPRI data provide bilateral trade shares, country-level import shares relative to domestic production, and crop-specific dietary importance weights. Future trade projections were obtained from IFPRI’s IMPACT model across 18 climate–socioeconomic scenarios and three time points (2020, 2035, and 2050) [
24]. All datasets were harmonised to a common country list, resulting in coverage of 151 countries or country groups with complete data across all indicators.
All indicators were transformed to a common 0–100 scale, where higher scores indicate higher environmental pressure. For carbon footprint and soil degradation indicators, a distance-to-target normalisation [
25] was applied. The best target was set to zero (i.e., zero emissions or soil degradation), while the worst target was defined using the 95th percentile of the indicator distribution, averaged over the 2011–2020 period to improve robustness—a technique similarly used by the Human Development Index [
26]. Values exceeding the worst target were capped at 100. Soil degradation scores were calculated separately for fertiliser and pesticide use and then averaged with equal weights. For water stress, percentage values were directly mapped to scores, with values above 100% capped at 100. The whole system was developed for the present study.
Country scores for each pillar were classified into five environmental pressure levels: very low, low, medium, high, and extreme. For carbon footprint and soil degradation, classification thresholds were derived using a quantile-based approach inspired by the Jameel Index framework [
13], with thresholds calculated annually over 2011–2020 and then averaged to obtain stable cutoff values. Water stress classes followed established Aqueduct risk thresholds [
11].
The three pillars were aggregated using a geometric mean to emphasise imbalance across dimensions. Each pillar was assigned equal weight. The resulting composite score was normalised to a 0–100 scale and classified into five overall environmental pressure categories using the same cutoff points as the Jameel Index. All calculations were performed in MATLAB R2025a and the whole methodology is fully replicable.
Limitations to this scoring system are the classification thresholds, and equal weighting across pillars which are methodological choices informed by the literature and by the Jameel Index framework. Alternative normalisation methods, weighting schemes, or classification approaches would yield different results. While grouping countries into five environmental categories improves interpretability for policy audiences, it also represents a simplification that may obscure underlying variation.
Trade-adjusted sustainability scores were constructed by combining a country’s domestic production with its imports. For each country, an import share (
) was calculated as a diet-weighted average across the nine crops. The combined sustainability score (
) was calculated as a linear combination of domestic and imported components (respectively
and
), weighted by the country’s import share. In other words:
The imports-only score was also kept to isolate exposure through trade. This metric was also specifically developed as part of the FSSI framework.
Future sustainability exposure was analysed by applying projected trade patterns from IFPRI’s IMPACT model [
24], while holding the sustainability of domestic production constant. This approach isolates the effect of changing trade networks under climate change. Trade-adjusted scores were recalculated for all scenario–year combinations, generating novel projections of future environmental pressure across countries and regions.
Several simplifying assumptions are embedded in the trade and climate components. The trade integration assumes a proportional and linear transfer of environmental pressures through imports, without accounting for substitution effects, transport emissions, changes in consumer behaviour, or feedback loops between trade and sustainability. Similarly, future climate scenarios assume constant domestic agricultural sustainability to isolate trade-driven effects, and these projections should be interpreted as indicative trends rather than precise forecasts. Other factors such as migration may also play a role and increase local pressure on our resources, but that is beyond the scope of this study.
3. Results
3.1. Measuring the Sustainability of Production by Country
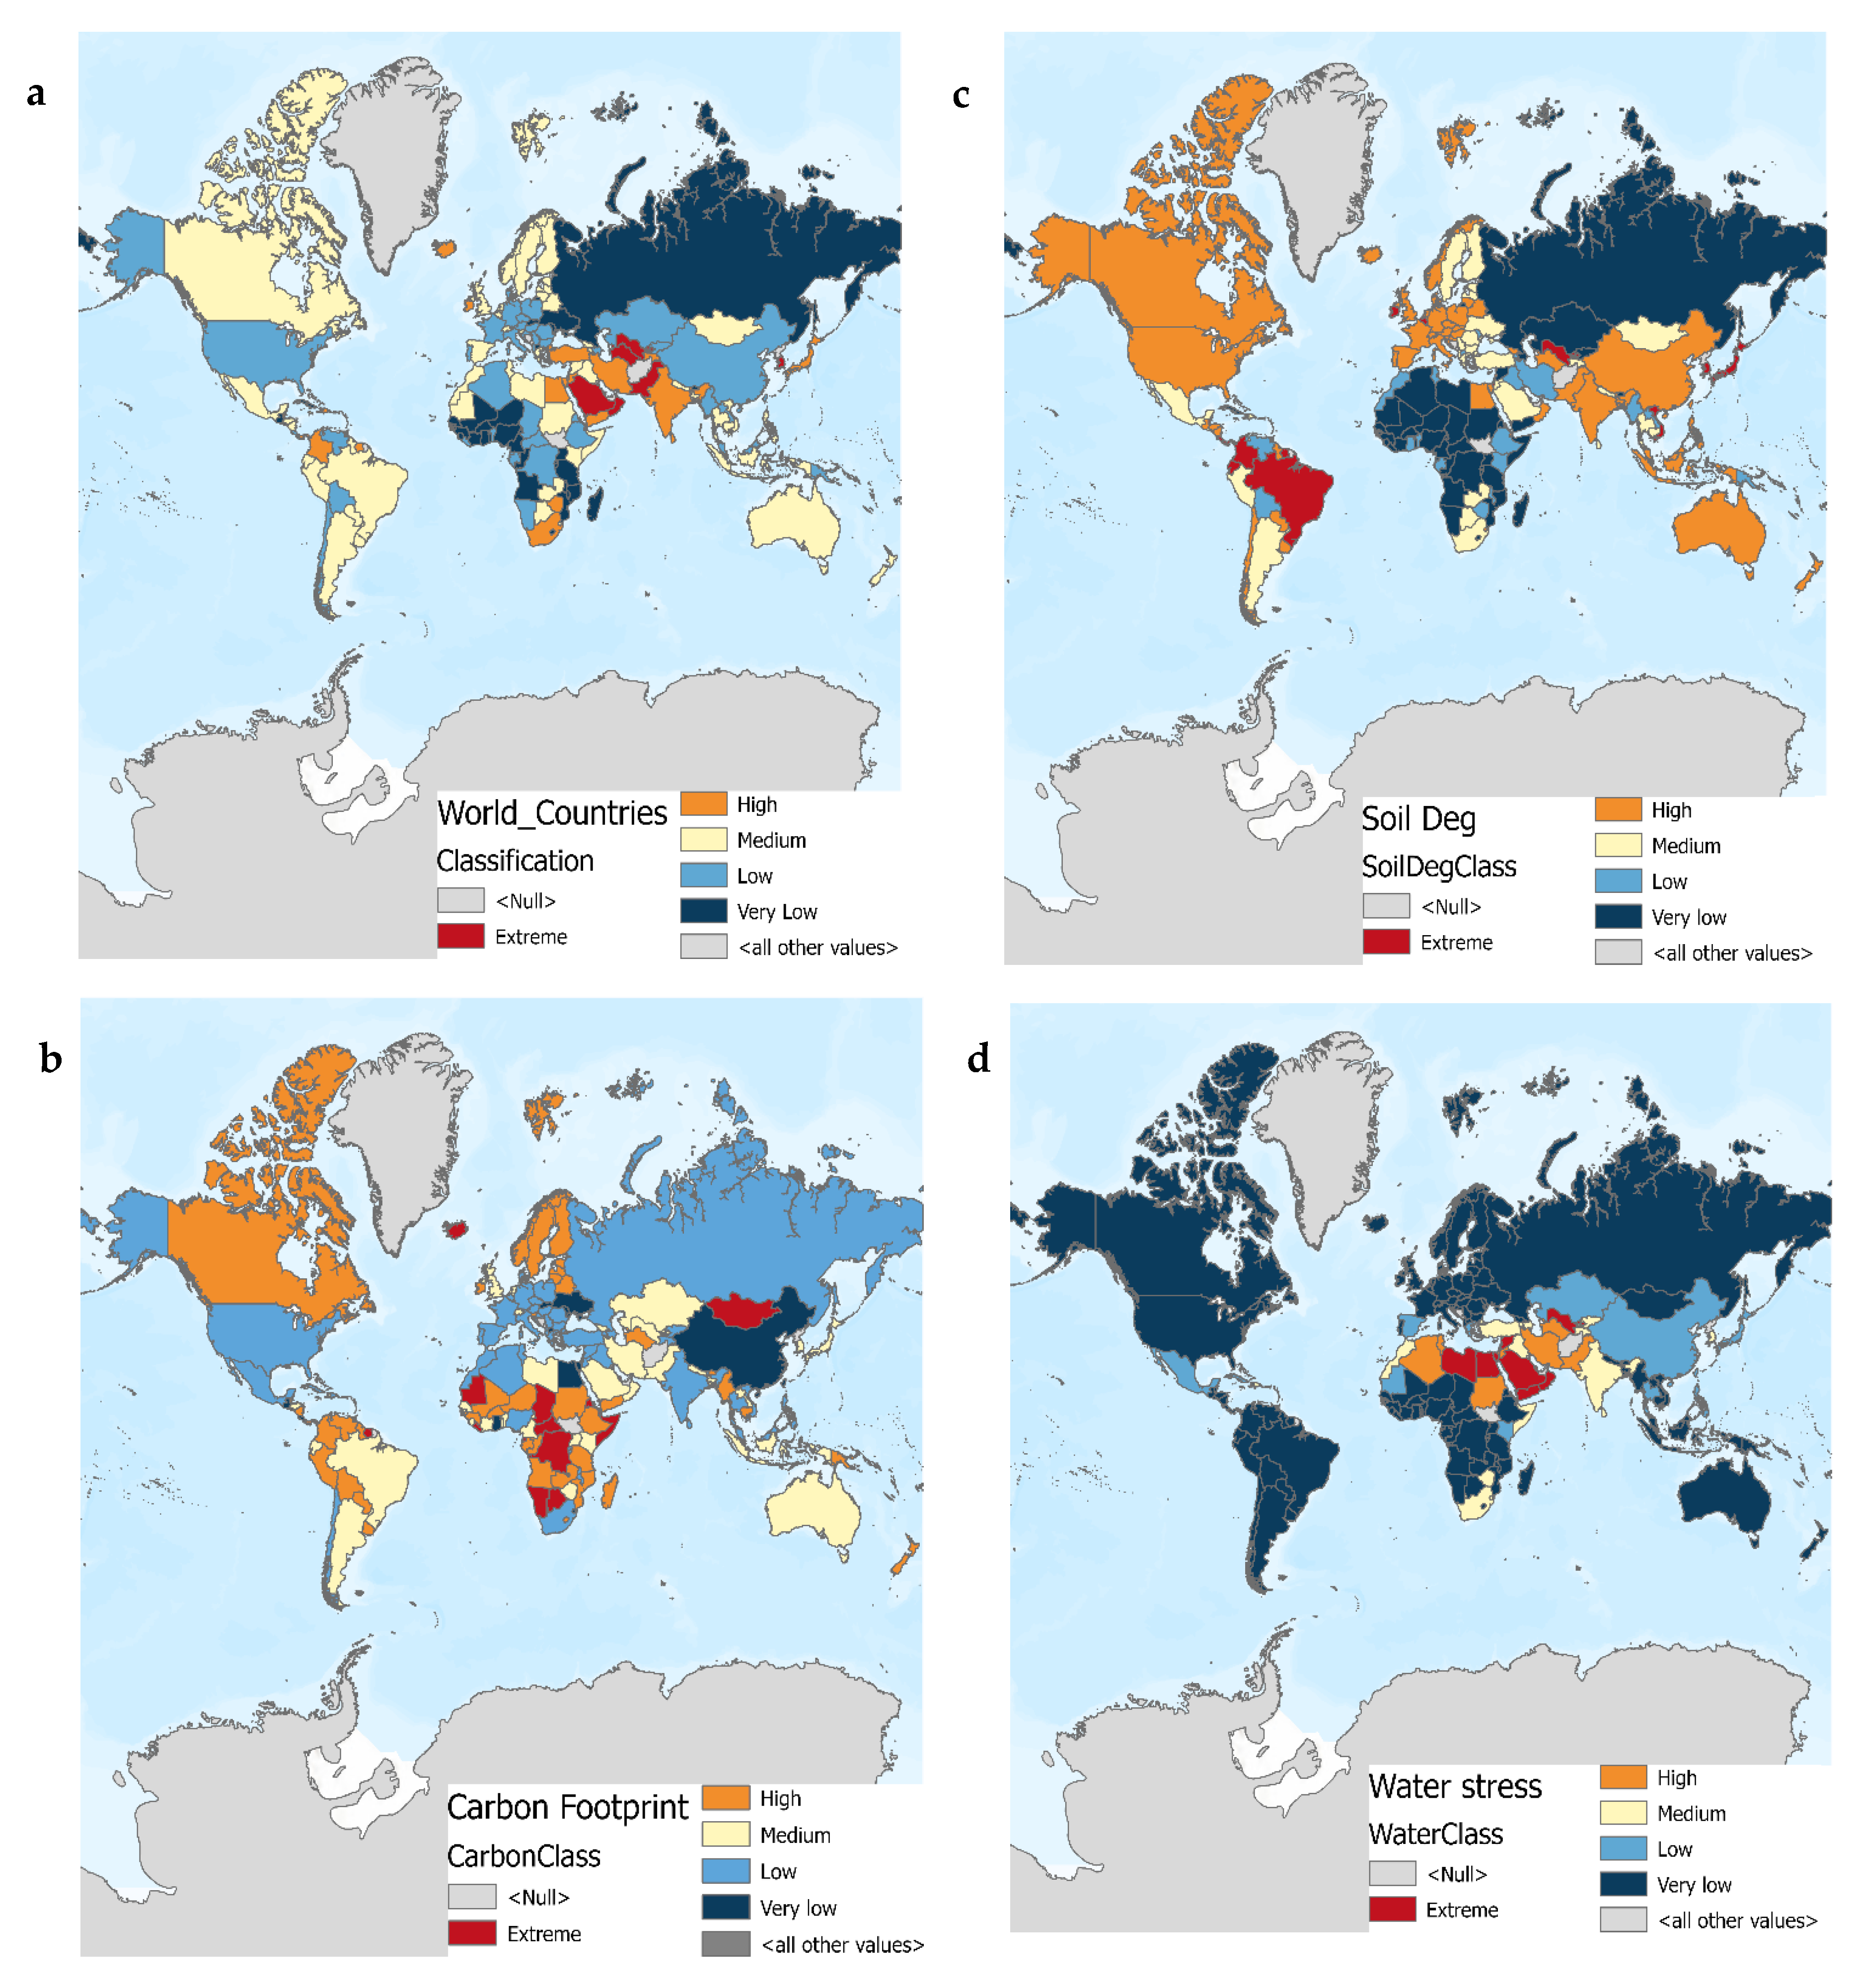
First, we look at the sustainability of domestic food production by country. Country-level scores are mapped into five environmental pressure classes (very low, low, medium, high, and extreme) revealing substantial geographical heterogeneity across the global food system (
Figure 1a).
High environmental pressure is concentrated in arid, agriculturally intensive regions such as Saudi Arabia and Australia, while many Sub-Saharan African nations (e.g., Angola, Mali) fall within lower pressure classes.
Disaggregating results from the FSSI by pillar (carbon footprint, soil degradation, and water stress), reveals distinct geographical patterns (
Figure 1b–d). Carbon footprint pressures are higher across much of Africa from Chad down to Namibia, while many higher-income countries fall into lower pressure classes. The level of soil degradation is low across most of Africa but higher among major producers and higher-income countries, including Brazil and China. Water stress exhibits strong regional concentration in the Middle East and generally lower national-level pressure elsewhere.
Across income groups, the share of countries classified in medium pressure or higher increases with income level (
Table 1).
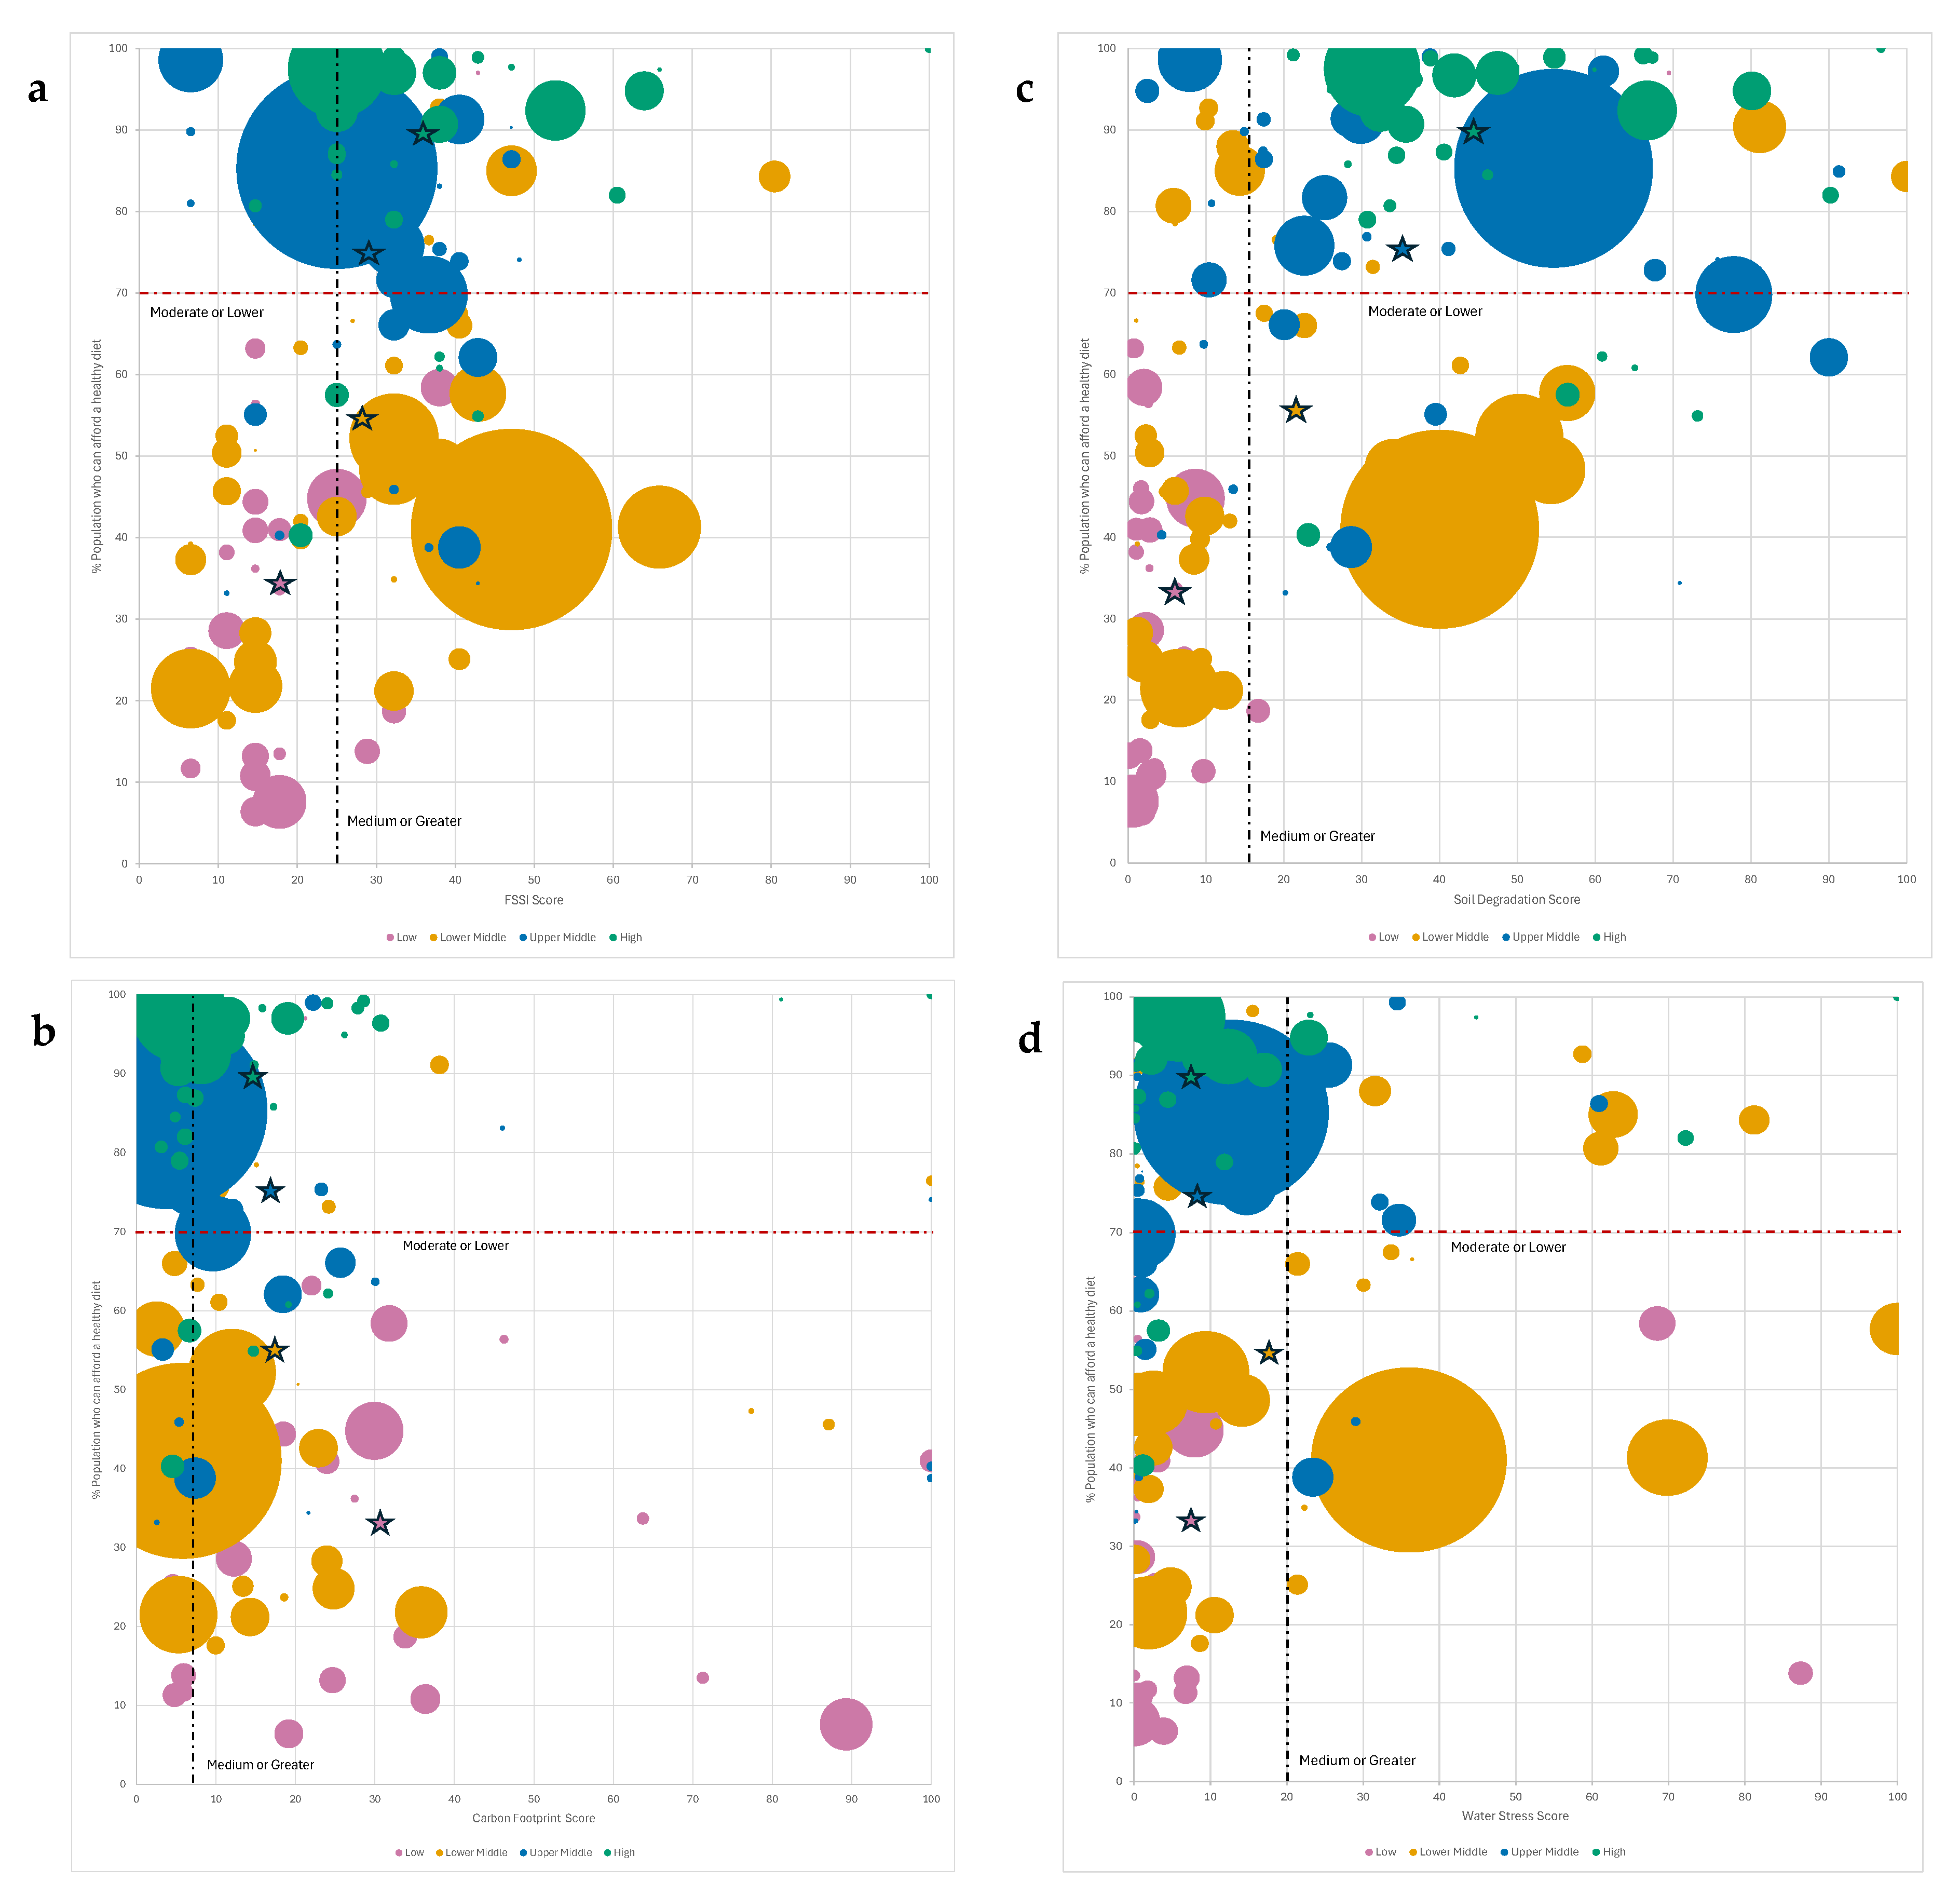
To examine the relationship between sustainability and food access, the FSSI scores are plotted against the share of the population able to afford a healthy diet (
Figure 2a) [
27]. Across income classes [
28], higher-income countries exhibit both greater diet affordability and higher FSSI scores (in other words, not very sustainable), producing an upward and rightward shift across income groups.
This apparent trade-off should not be interpreted as suggesting that higher-input agriculture cannot contribute to food security. Rather, as previously mentioned, sustainability for this work looks at the environmental pressures associated with food production. High-input systems may improve productivity and support sustainable intensification, but they also increase pressures on greenhouse gas emissions, soil, and water, potentially compromising future generations to use the land for agriculture. Additional factors such as population density and urbanisation may also influence these relationships but are beyond the scope of the present analysis.
The pattern persists across individual pillars (
Figure 2b–d). Diet affordability increases with income across all pillars. For carbon footprint, scores are broadly similar across the middle- and high-income groups, while low-income countries exhibit higher scores. The soil degradation score increases systematically with income. Water stress shows relatively little variation across income groups.
3.2. Trade-Adjusted Sustainability Outcomes
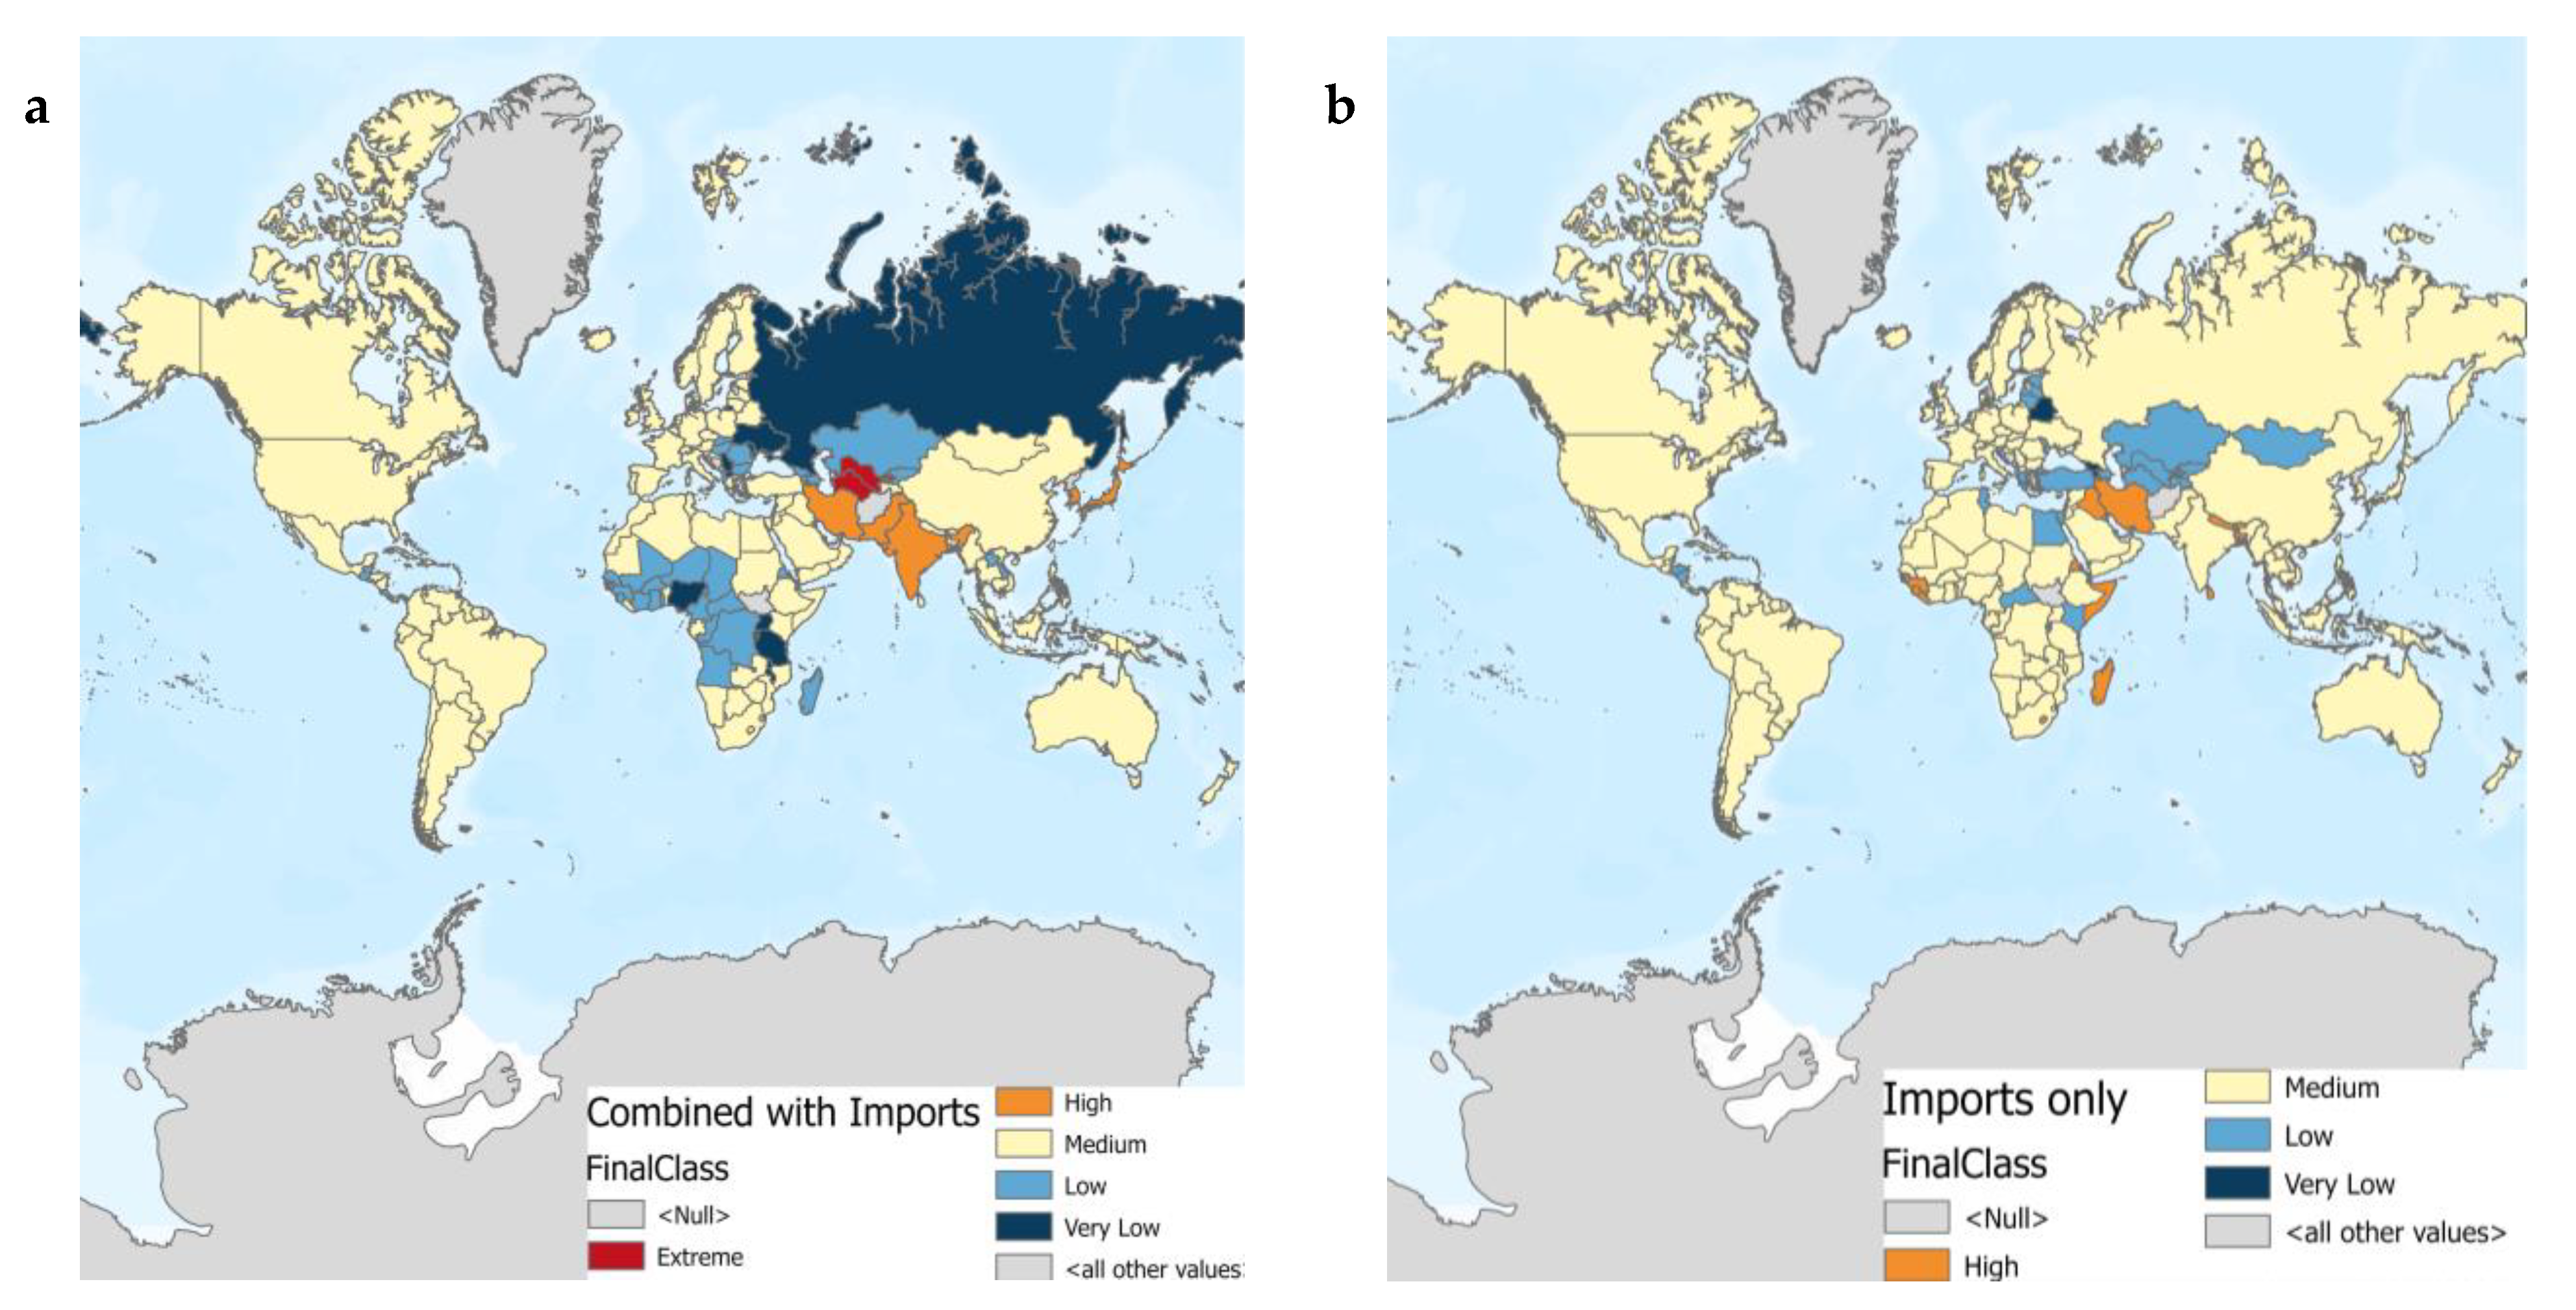
We next include international trade by adjusting countries’ scores based on their imports. When domestic production and imports are combined, sustainability pressure worldwide converges toward the medium class, with fewer countries remaining in extreme pressure categories (
Figure 3a). For example, Saudi Arabia goes down from extreme to medium pressure. An imports-only perspective further accentuates this convergence, with most countries classified in the medium pressure class (
Figure 3b). This reflects a redistribution of environmental pressure through trade.
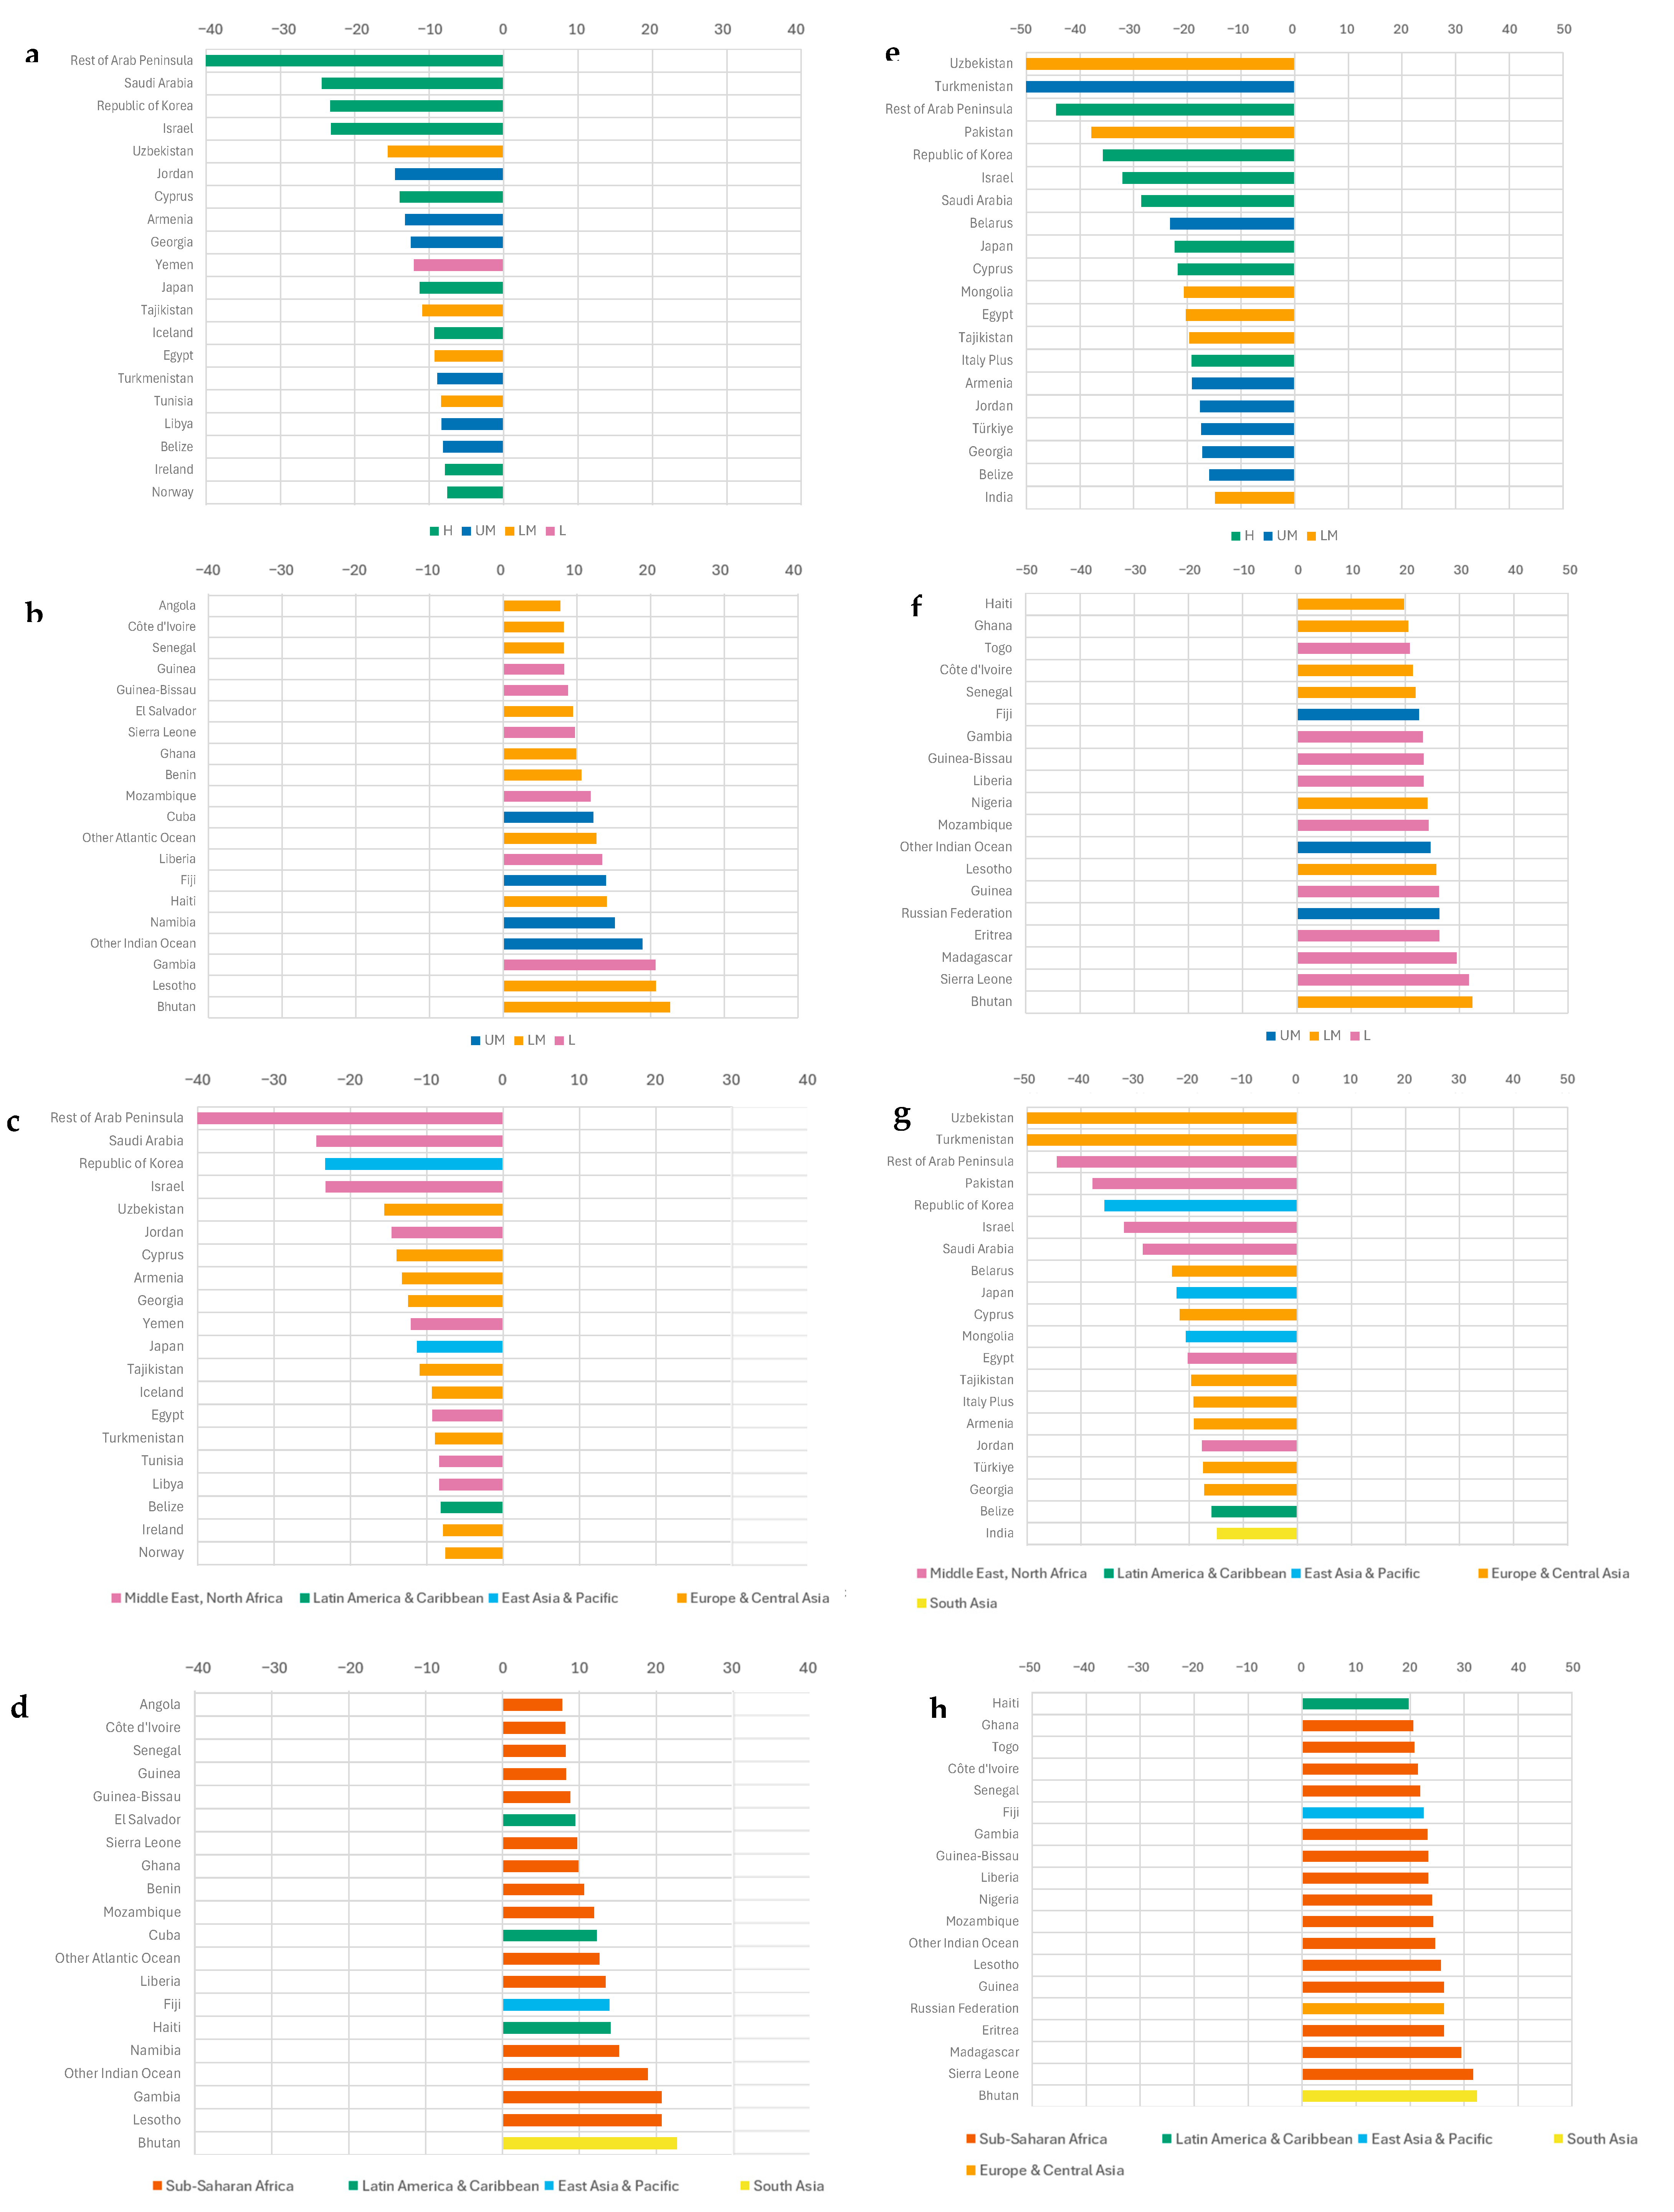
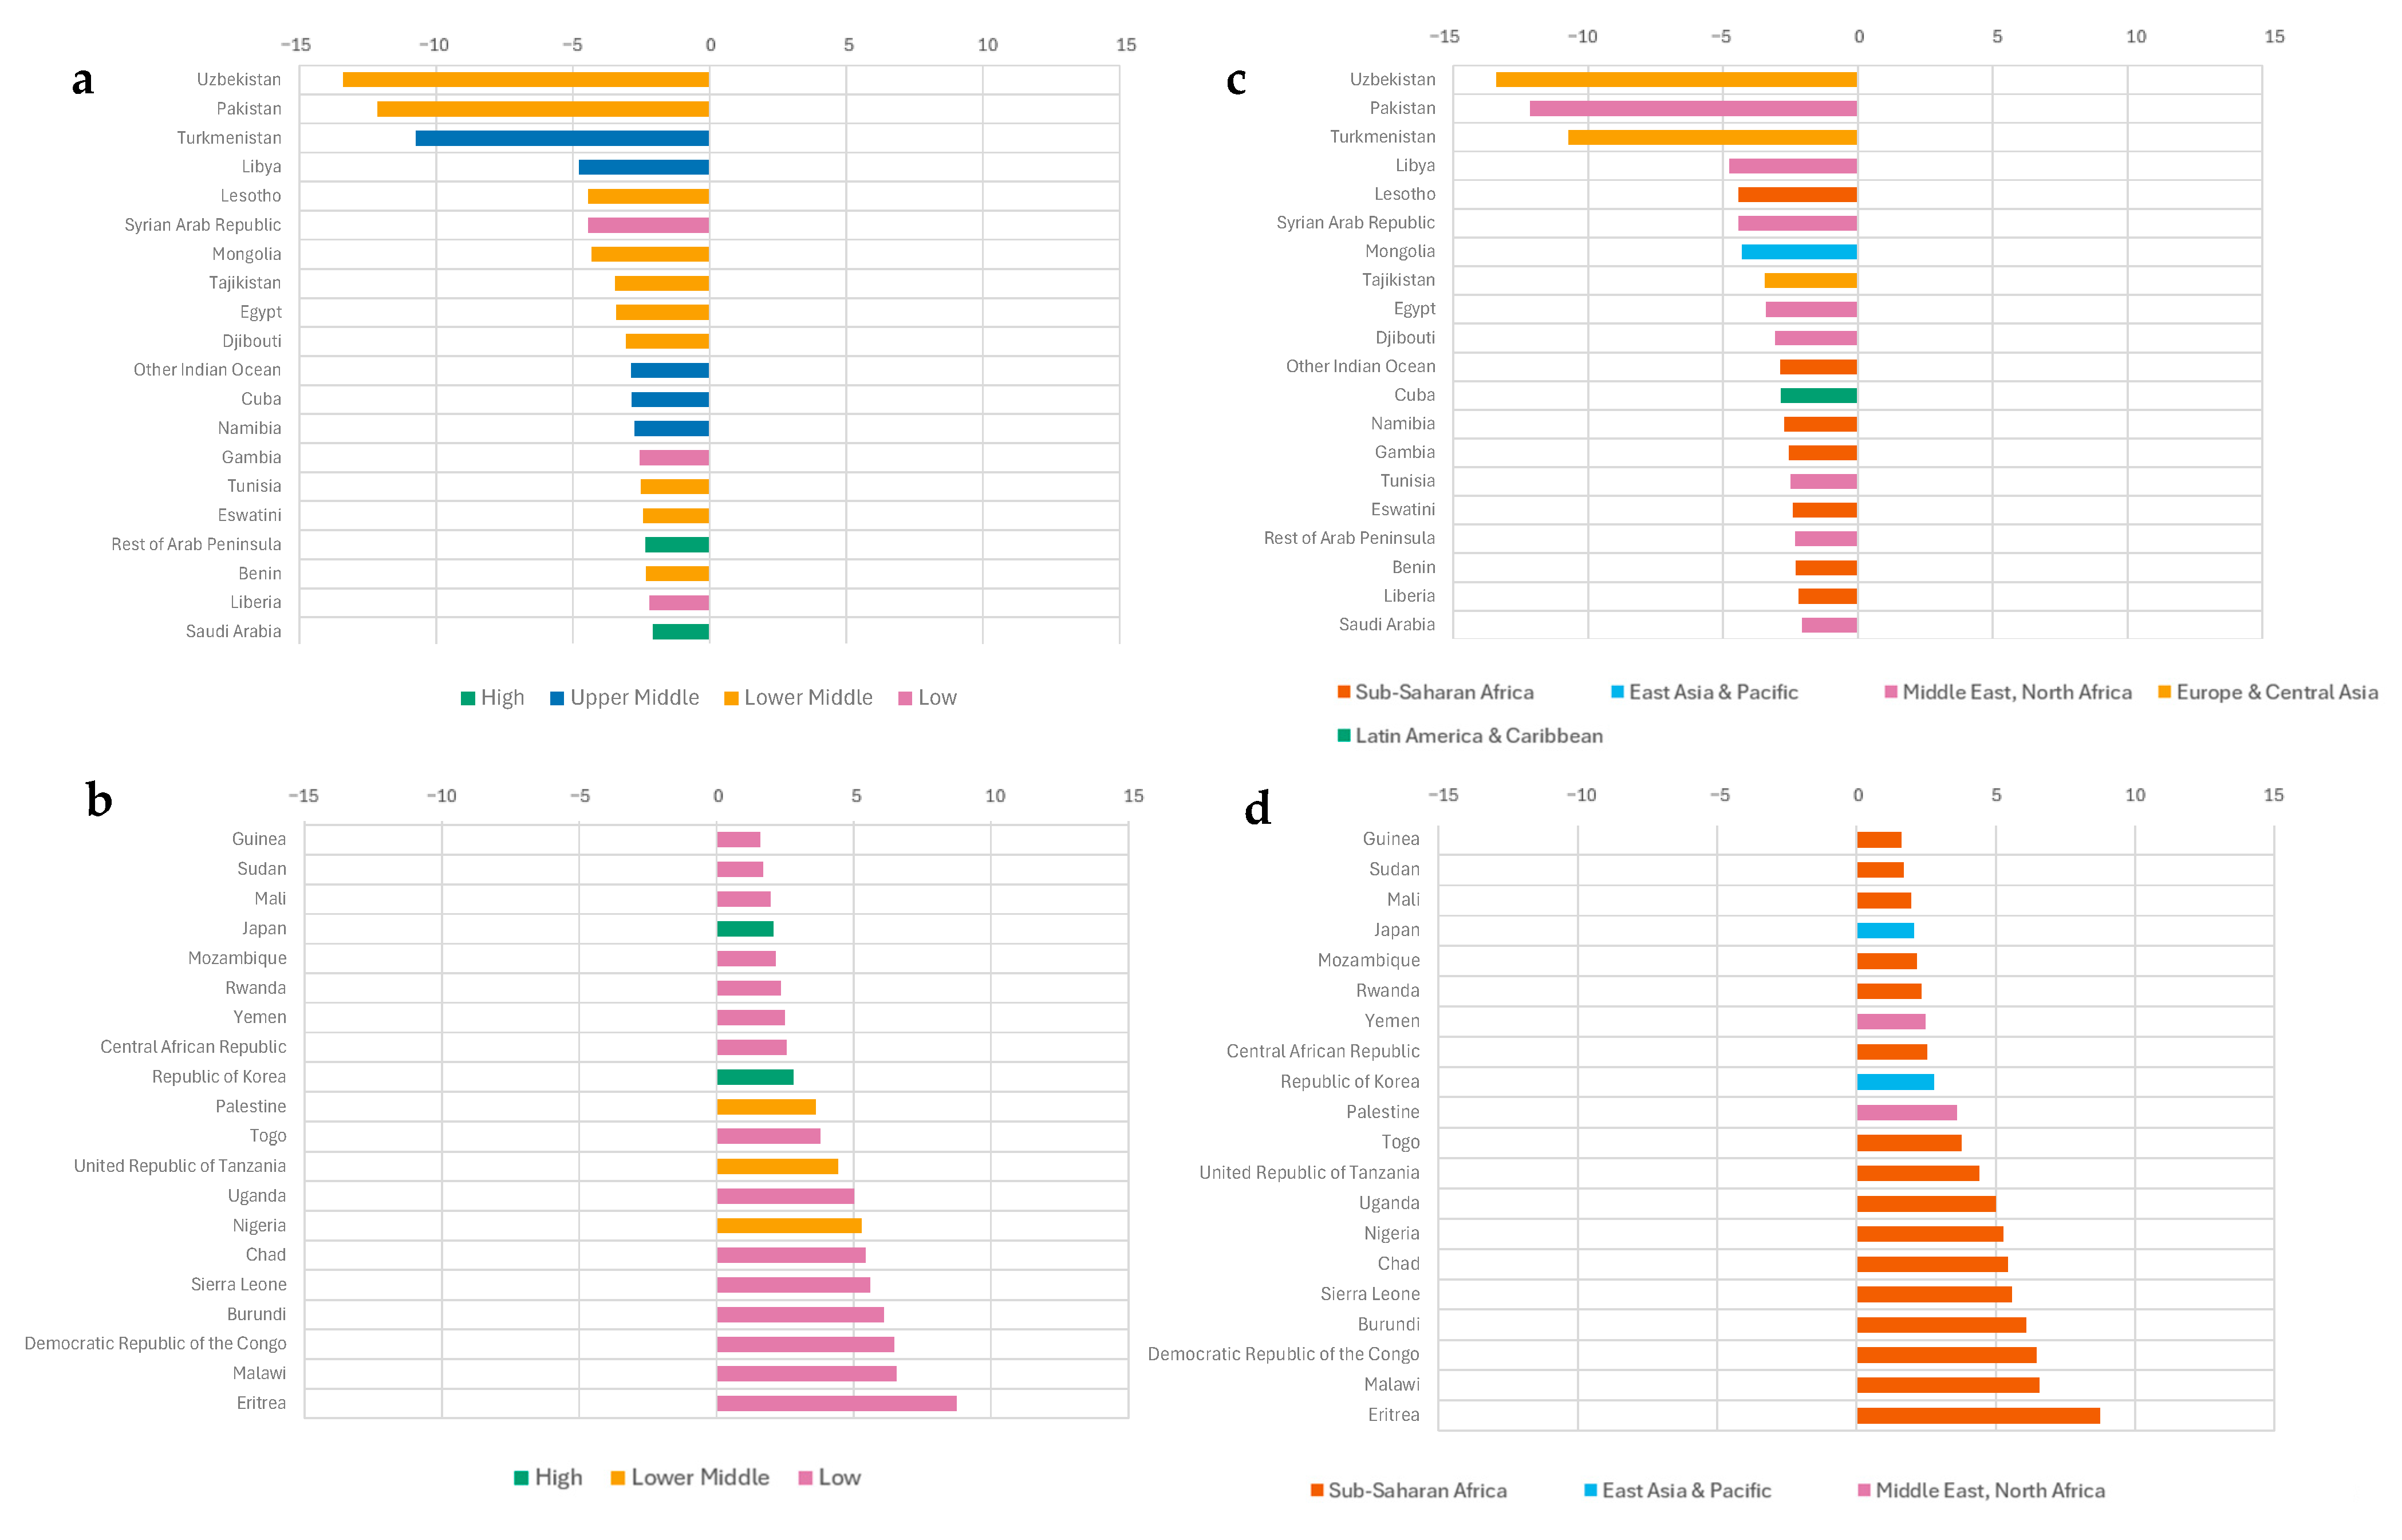
Changes in sustainability scores relative to domestic production are also quantified. A negative change indicates that the sustainability score decreases after accounting for imports, implying an improvement in sustainability. A positive change indicates that sustainability worsens after imports.
When comparing domestic-only and combined (domestic with imports) scores, higher-income countries tend to experience reductions in environmental pressure, while lower-income countries more often experience increases. Regionally, countries in North Africa and the Middle East like Egypt or Saudi Arabia show the largest reductions, while Sub-Saharan African countries frequently experience increased pressure (
Figure 4).
Comparisons between domestic production and imports-only scores show similar but more pronounced patterns. Score changes are larger in magnitude, with higher-income countries again dominating national improvements (offshoring their environmental pressure) and lower-income regions, particularly Sub-Saharan Africa, showing worsening outcomes.
3.3. Future Climate-Driven Trade Dynamics
We projected future sustainability outcomes using IFPRI’s IMPACT model. IMPACT is a network of linked economic, water, and crop models. At its core is a partial equilibrium multi-market economic model, which simulates national and international agricultural markets. The links to water and crop models support the integrated analysis of changing environmental, biophysical, and socioeconomic trends, allowing for in-depth analysis [
29]. We obtained annual IMPACT outputs for the Shared Socioeconomic Pathway 2 (SSP2) to 2050 with an ensemble of 18 future climate change scenarios [
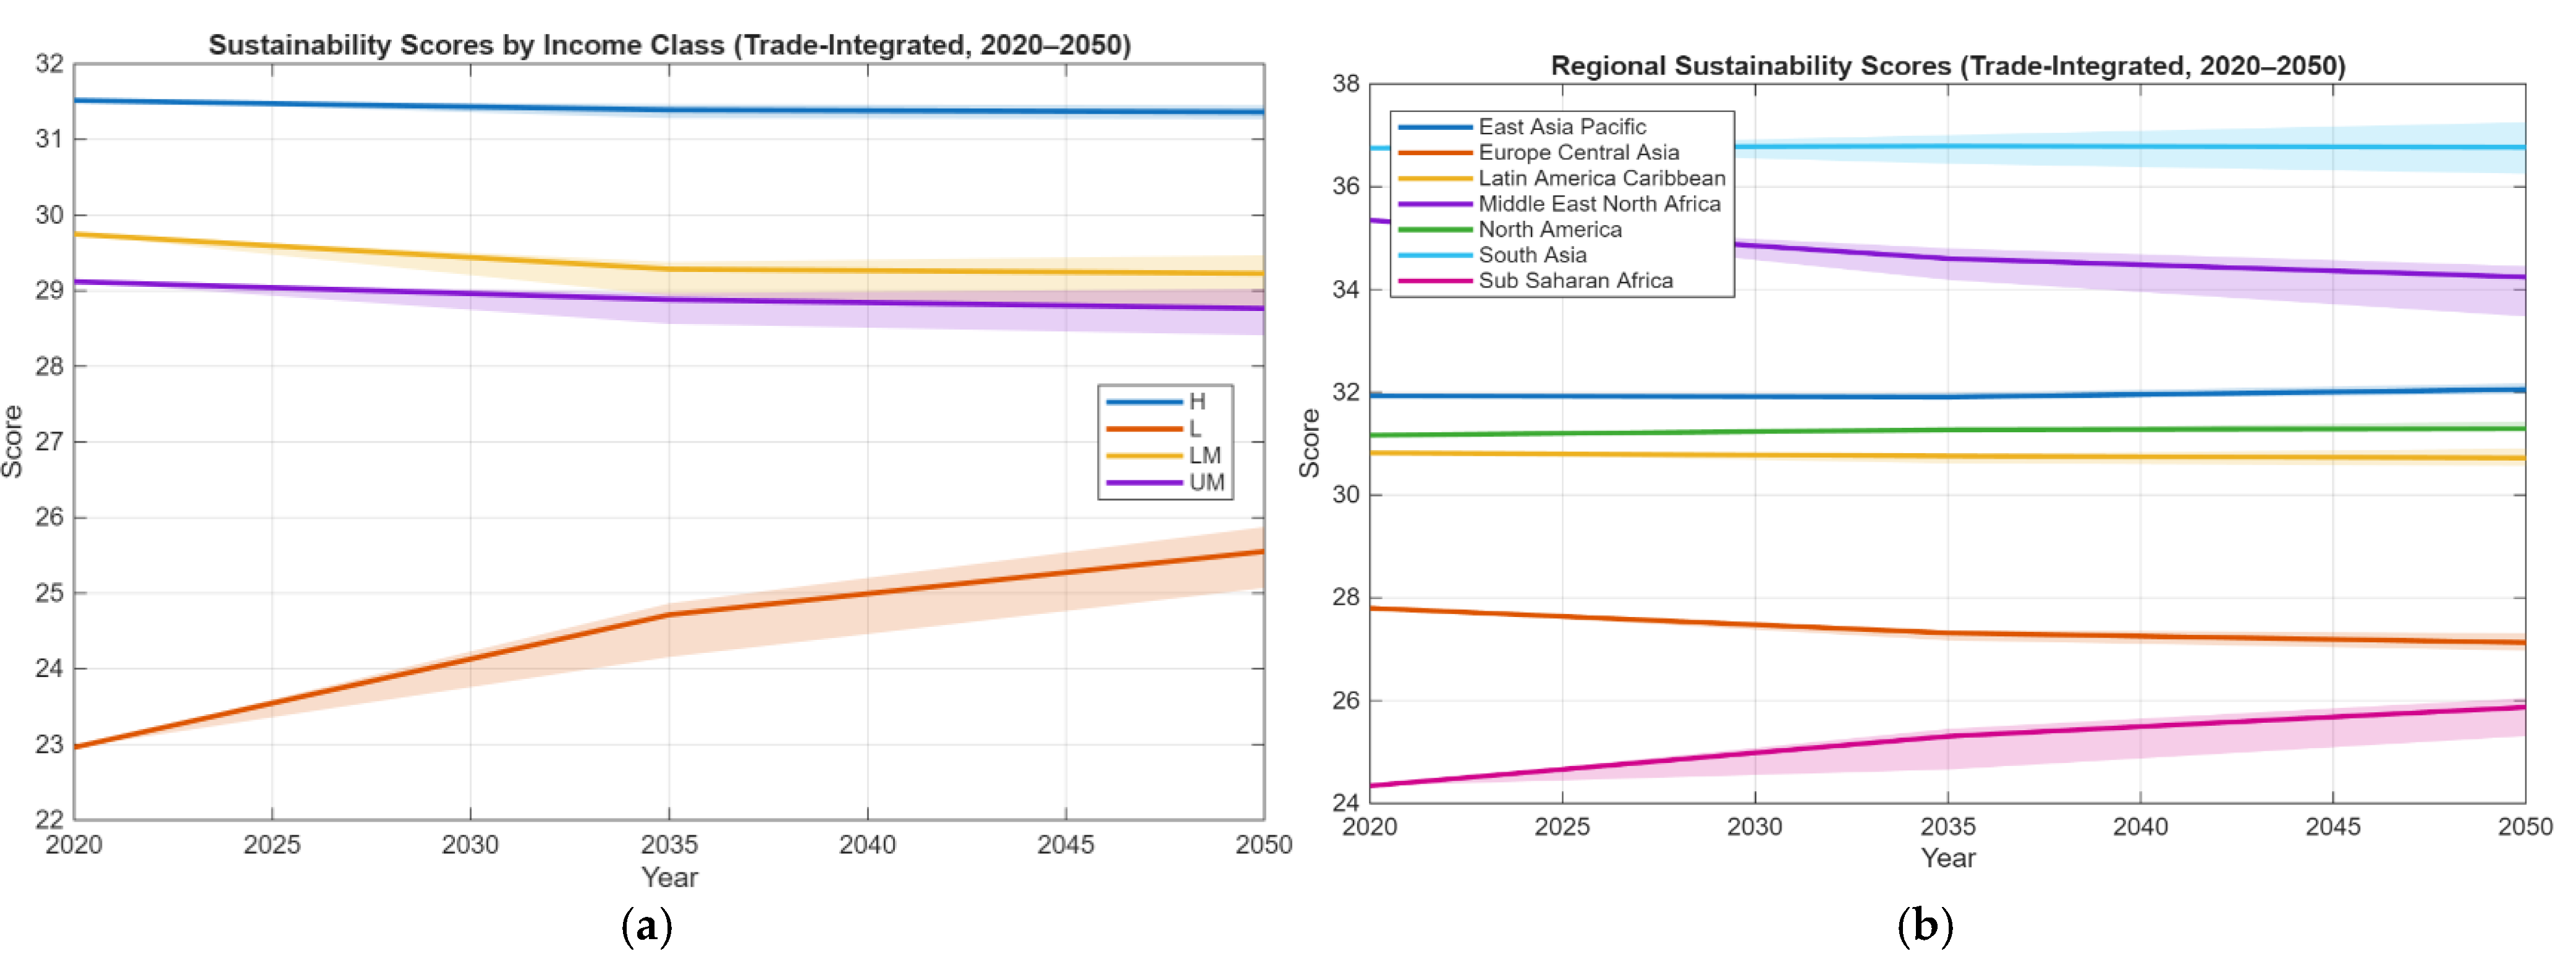
30]. We examined FSSI score trajectories between 2020 and 2050 across income classes and regions (
Figure 5). Scores represent averages across multiple climate scenarios, with shaded ranges showing uncertainty.
Across income classes, high-income countries maintain relatively stable scores over time, while low-income countries exhibit increasing scores, highlighting rising environmental pressure. Regionally, South Asia and the Middle East/North Africa display the highest scores, while Europe and Sub-Saharan Africa show lower baseline scores. Over time, Sub-Saharan Africa exhibits an upward trend in pressure, while Europe shows a slight decline.
Uncertainty ranges are substantially larger for low-income countries and regions such as Sub-Saharan Africa and South Asia than for high-income countries and regions such as Europe and North America.
To further illustrate these changes, baseline (2020) scores were compared with outcomes under a high-impact climate scenario in 2050 (SSP3) at the country level. Countries experiencing the largest increases in environmental pressure are predominantly low-income and lower-middle-income, whereas high-income countries show comparatively small changes. Regionally, Sub-Saharan Africa dominates the largest increases in pressure, while Europe and the Middle East show relatively smaller changes (
Figure 6).
Countries with larger score changes tend to experience greater population growth and larger shifts in import volumes, while the number of trade partners remains relatively stable.
3.4. Summary of Results
Across domestic production, trade-adjusted outcomes, and future climate scenarios, the results show that international food trade redistributes, rather than eliminates, environmental pressures—which remain unevenly distributed across income groups and regions—and that future climate dynamics are likely to exacerbate these disparities. Together, these findings address the overarching research question by demonstrating how international food trade influences the environmental sustainability of national food supplies and how these effects can be quantified and monitored through the FSSI.
4. Discussion
This study provides a system-level assessment of the environmental sustainability of national food supply systems, rather than overall national sustainability, by explicitly linking three globally comparable indicators of environmental pressure to international trade and future climate dynamics. The results highlight three central insights: (i) sustainability outcomes vary systematically across income groups and regions, (ii) trade redistributes environmental pressures rather than eliminating them, and (iii) future climate-driven trade dynamics are likely to amplify sustainability disparities, particularly for lower-income regions.
With respect to domestic food production, higher-income countries are more frequently classified by the index in higher environmental pressure categories, reflecting high-input agricultural systems that prioritise productivity. By contrast, many lower-income countries exhibit lower aggregate environmental pressure, though this pattern reflects structural constraints rather than deliberate sustainability choices which could be called “sustainability by necessity”. These findings highlight that sustainability outcomes are shaped not just by environmental conditions, but also by development choices and production systems. The observed trade-off between diet affordability and environmental pressure further illustrates the tension between food access and environmental performance across income groups.
Incorporating trade into the FSSI reveals that international food exchange plays a central role in reshaping sustainability outcomes. Including trade as an element of the index shifts many countries from higher/lower categories toward intermediate sustainability classes. While higher-income and trade-integrated countries tend to improve their sustainability scores through imports, effectively offshoring their environmental impact, lower-income countries, particularly in Sub-Saharan Africa, often experience increased pressure. These patterns suggest that trade redistributes environmental burdens, rather than reducing them globally. As a result, environmental risks appear more evenly distributed but remain unevenly experienced.
Future socioeconomic and climate change scenarios further accentuate these disparities. While sustainability scores in higher-income countries remain relatively stable under projected trade dynamics, lower-income countries exhibit increasing pressure over time, alongside greater uncertainty. Regionally, Sub-Saharan Africa emerges as particularly exposed, experiencing both rising environmental pressure and wider uncertainty ranges. These findings indicate that climate change interacts with trade dependencies and demographic trends to deepen existing inequalities in sustainability outcomes.
From an economic perspective, these dynamics are consistent with theories of green growth and the environmental Kuznets curve [
31,
32]. Lower-income regions seeking economic development may initially experience worsening environmental outcomes before potential long-term improvements as income, technology, and institutional capacity increase. The FSSI provides a framework for examining how such transitions may unfold in the context of global trade and climate change, and how sustainability trajectories evolve alongside economic growth.
The analysis also highlights several avenues for improving sustainability outcomes through economic and structural change. Reducing over-reliance on a narrow set of trade partners may lessen exposure to environmental externalities and improve resilience to shocks. Integrating circular economy principles into agriculture—such as nutrient recycling, waste reduction, and renewable energy use—can further enhance sustainability. Similarly, sustainable intensification strategies that prioritise efficiency gains through knowledge, technology, and infrastructure (like regenerative agriculture), rather than increased input use, can pave the way for reconciling productivity with environmental constraints.
There are several limitations to this work. First, sustainability is a broad concept and defining it in an agricultural context is complex. The choice of variables and pillars reflects a simplification of environmental impacts to exclude, for example, social and economic factors, that could be integrated in future extensions of the index. The selected indicators should therefore be viewed as a starting point rather than a comprehensive representation of agricultural sustainability.
Second, the global scope adopted to enable cross-country comparability necessarily implies aggregation and reduced granularity. National-level indicators may mask substantial subnational heterogeneity, particularly for water stress. Future work could address this limitation by applying the framework at finer spatial scales or through country-specific case studies to support more targeted decision-making.
Third, future scenarios focus on the nine major traded crops and assume uniform domestic sustainability across them. Furthermore, the current coverage spans 151 countries, reflecting data availability rather than the full global system.
While policy implications are discussed, the index does not simulate policy impacts directly. Instead, it provides a structured, transparent framework that highlights sustainability trade-offs and can inform future policy analysis. Addressing these limitations—through expanded indicators, higher spatial resolution, dynamic feedback, and policy simulation—offers possible pathways for future research.
Overall, this work demonstrates that sustainable food systems depend as much on trade structure and governance as on domestic production practices. By integrating environmental pressures, trade dependencies, and climate dynamics within a single framework, the FSSI provides a transparent and globally comparable framework to assess and monitor the environmental sustainability of national food supply systems. The FSSI therefore contributes to ongoing debates on how global food systems can be transformed to remain both sustainable and resilient in a changing world.