3.1. Soil Hydrophysical Properties
The influence of soil texture on soil hydraulic behavior was evaluated through water retention characteristics and hydraulic conductivity parameters, which collectively determine water storage and movement within the soil profile.
3.1.1. Soil Water Retention Characteristics
The relationship between matric suction (
ψ) and volumetric water content (
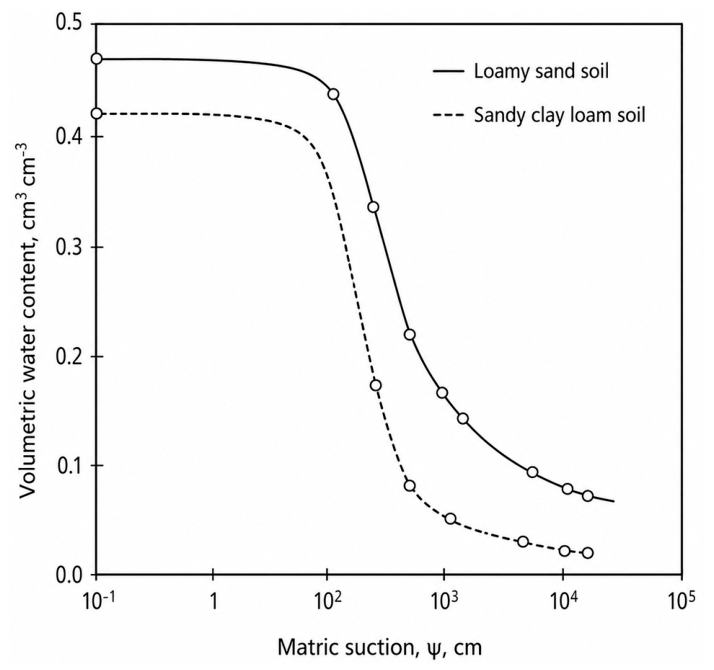
θ) for the studied soils is presented in
Figure 2. Distinct water retention behaviors were observed between the loamy sand and sandy clay loam soils, reflecting differences in soil texture and pore-size distribution. In both soils, θ decreased rapidly with increasing ψ at low suction levels, followed by a more gradual decline at higher suction values. This pattern reflects rapid drainage of macropores followed by progressive water release from smaller pores. The reduction in
θ with increasing
ψ was more pronounced in the loamy sand soil. At
ψ = 300 cm,
θ values were 0.0912 and 0.2217 cm
3 cm
−3 for the loamy sand and sandy clay loam soils, respectively. At
ψ = 15,000 cm,
θ further decreased to 0.0375 cm
3 cm
−3 in the loamy sand soil and 0.08395 cm
3 cm
−3 in the sandy clay loam soil, confirming the greater water retention capacity of the finer-textured soil throughout the entire suction range. Field capacity values were approximately 0.1875 cm
3 cm
−3 for the loamy sand soil (
ψ ≈ 100 cm) and 0.2217 cm
3 cm
−3 for the sandy clay loam soil (
ψ ≈ 300 cm). The soil water retention curves were described using the Van Genuchten model based on limited measured θ–ψ data across the suction range of 100 to 15,000 cm of water. The fitted parameters indicated that the model provides an excellent representation of the retention behavior for both soils. The Van Genuchten parameters (
θs,
θr,
α,
n, and
m) showed clear differences between the two soils, where the loamy sand soil exhibited
θs = 0.4146 cm
3 cm
−3,
θr = 0.0390 cm
3 cm
−3,
α = 0.0228 cm
−1,
n = 2.0208, and
m = 0.5052, while the sandy clay loam soil showed
θs = 0.4614 cm
3 cm
−3,
θr = 0.0690 cm
3 cm
−3, α = 0.0148 cm
−1,
n = 1.5972, and
m = 0.3739. These parameters reflect the stronger water retention capacity and smoother retention curve of the sandy clay loam soil compared with the loamy sand soil.
Likewise, the residual water content (θr) at ψ = 15,000 cm was lower in the loamy sand soil, indicating reduced water availability under dry conditions. The soil water retention curves were accurately described using the Van Genuchten model, with a coefficient of determination (R2 = 0.999) for both soils. Lower fitted parameters (α, n, and m) in the sandy clay loam soil indicate a smoother retention curve and greater pore-water retention relative to the loamy sand soil. The differences in soil water retention behavior between the two soils reflected the strong influence of soil texture and pore-size distribution on water storage under unsaturated conditions. The sandy clay loam soil consistently retained greater volumetric water content across the entire matric suction range compared with the loamy sand soil, indicating higher water-holding capacity associated with its finer texture and greater proportion of micropores. In addition, the high coefficient of determination (R2 = 0.999) obtained from the Van Genuchten model confirmed the excellent agreement between the measured and fitted soil water retention data for both soils. The results demonstrate the dominant role of soil texture in controlling soil water retention and water availability under unsaturated conditions.
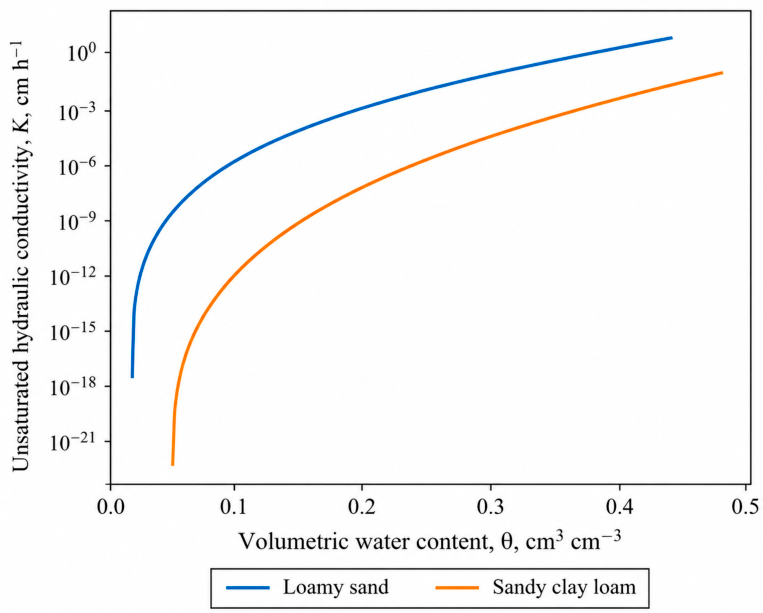
3.1.2. Hydraulic Conductivity Functions
The relationship between unsaturated hydraulic conductivity (
K) and volumetric water content (
θ) for the studied soils is presented in
Figure 3. Hydraulic conductivity exhibited a highly nonlinear response to changes in water content in both soils, varying over several orders of magnitude across the investigated moisture range. At low
θ values,
K remained extremely small, indicating limited hydraulic continuity under dry conditions. As
θ increased,
K increased sharply, particularly near higher water contents, reflecting progressive pore connectivity and enhanced water transmission through water-filled pores. The two soils exhibited distinctly different conductivity behaviors. At equivalent
θ values, the loamy sand soil consistently exhibited greater
K values than the sandy clay loam soil. For example, at
θ ≈ 0.30 cm
3 cm
−3,
K reached approximately 6 × 10
−2 cm h
−1 in the loamy sand soil, whereas the sandy clay loam soil exhibited a substantially lower value of approximately 2 × 10
−3 cm h
−1. This behavior reflects the dominance of larger and more continuous macropores in the coarse-textured soil. In contrast, under comparable matric suction conditions (
ψ), particularly at relatively high suction levels, the sandy clay loam soil maintained greater hydraulic conductivity than the loamy sand soil. At
ψ ≈ 300 cm,
K values were approximately 3.4 × 10
−5 cm h
−1 in the loamy sand soil and 1.7 × 10
−4 cm h
−1 in the sandy clay loam soil. The greater conductivity observed in the sandy clay loam soil under drier conditions reflects its greater water retention and improved hydraulic continuity at lower water potentials.
Differences in the curvature of the K–θ functions further reflected variations in pore-size distribution between the two soils. The loamy sand soil exhibited a steeper conductivity response, indicating rapid transition from low to high conductivity over a relatively narrow moisture range. In contrast, the sandy clay loam soil showed a more gradual increase in conductivity, consistent with a broader pore-size distribution and smoother desaturation behavior. The observed differences in hydraulic conductivity behavior between the two soils were strongly associated with differences in pore-size distribution and soil texture. The loamy sand soil exhibited greater conductivity at relatively high water contents due to the dominance of larger and better-connected macropores, whereas the sandy clay loam soil maintained relatively greater hydraulic continuity under drier conditions because of its higher water retention capacity and greater proportion of fine pores. The conductivity functions were accurately represented by the Van Genuchten–Mualem model. Lower fitted parameters (α, n, and m) in the sandy clay loam soil contributed to smoother conductivity behavior and greater water retention, whereas the larger parameter values in the loamy sand soil produced a sharper increase in conductivity with increasing θ.
Overall, the results demonstrate the strong influence of soil texture on unsaturated hydraulic behavior, with the loamy sand soil favoring rapid water transmission at higher water contents and the sandy clay loam soil maintaining greater hydraulic continuity under drier conditions.
3.2. Evaporation Dynamics
This section presents the effects of soil texture, nitrate application, and mulch depth on evaporation dynamics and soil water loss, highlighting the response of the different treatments under arid conditions.
3.2.1. Effect of Mulching on Cumulative Evaporation
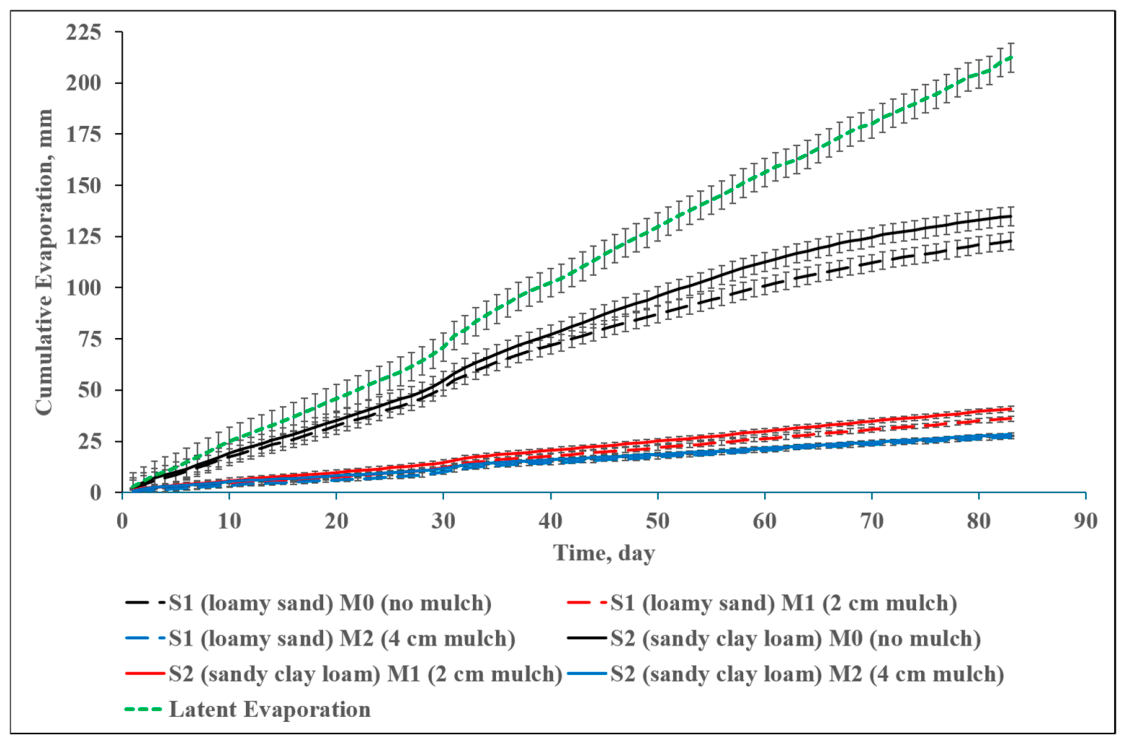
The effect of sawdust mulching on cumulative evaporation from loamy sand (
S1) and sandy clay loam (
S2) soils is presented in
Figure 4. The results clearly demonstrate that sawdust mulching substantially reduced evaporation losses in both soils throughout the experimental period. Cumulative evaporation increased progressively with time under all treatments; however, the magnitude of evaporation was strongly influenced by mulch depth and soil texture. In both soils, the non-mulched treatment (
M0) consistently exhibited the highest cumulative evaporation values throughout the experiment, whereas the mulched treatments, particularly those receiving 2 cm (
M1) and 4 cm (
M2) sawdust layers, showed markedly lower evaporation rates and cumulative evaporation. Statistical analysis based on factorial ANOVA confirmed that mulch treatment had a highly significant effect (
p ≤ 0.01) on cumulative evaporation across all soil depths and interactions (see
Table S1 in Supplementary Materials). Differences among mulch treatments were significant at
p ≤ 0.01 according to the LSD test, confirming the effectiveness of mulch application in suppressing evaporative water losses under arid conditions.
The evaporation curves of the non-mulched treatment displayed the typical multi-stage evaporation behavior characterized by an initially rapid evaporation phase followed by a gradual decline over time. In contrast, the mulched treatments maintained substantially lower evaporation rates throughout the experimental period, indicating a strong reduction in cumulative water loss from the soil surface. Evaporation reduction increased with increasing mulch thickness in both soils. In the loamy sand soil, cumulative evaporation after 83 days reached 122.8 mm under the non-mulched treatment, whereas it decreased to 36.1 mm and 27.1 mm under the 2 cm and 4 cm mulch treatments, respectively. Relative to the non-mulched control, cumulative evaporation was reduced by approximately 70.6% under the 2 cm mulch treatment and by 78.0% under the 4 cm mulch treatment. Similarly, cumulative evaporation in the sandy clay loam soil reached 134.9 mm in the non-mulched treatment and decreased to 40.8 mm and 28.2 mm under the 2 cm and 4 cm mulch treatments, corresponding to reductions of approximately 69.7% and 79.1%, respectively. These results demonstrate the strong effectiveness of sawdust mulch in suppressing evaporative water losses under both soil conditions. Cumulative latent evaporation reached 212.2 mm during the experimental period and greatly exceeded actual soil evaporation under all mulch treatments. Despite the lower evaporation coefficients observed under the 4 cm mulch treatment, the differences between the 2 and 4 cm mulch depths remained comparatively small. Although increasing mulch thickness from 2 to 4 cm further reduced evaporation, the additional reduction remained relatively limited compared with the substantial decrease achieved by the initial 2 cm mulch application.
The additional reduction achieved by increasing mulch depth from 2 to 4 cm was approximately 7.3 percentage points in the loamy sand soil and 9.3 percentage points in the sandy clay loam soil, indicating that most of the evaporation suppression was already achieved with the 2 cm mulch layer, indicating that most of the evaporation suppression was achieved with the 2 cm mulch layer. Clear differences between soil textures were also observed. The sandy clay loam soil consistently exhibited greater cumulative evaporation than the loamy sand soil under all mulch treatments. After 83 days, cumulative evaporation from the sandy clay loam soil exceeded that of the loamy sand soil by approximately 9.9%, 13.0%, and 4.1% for the M0, M1, and M2 treatments, respectively. The effect of soil texture on cumulative evaporation was statistically significant (p ≤ 0.01), with the sandy clay loam soil consistently exhibiting greater evaporation losses than the loamy sand soil throughout the experimental period.
Cumulative latent evaporation increased continuously throughout the experiment and reached 212.2 mm after 83 days (
Figure 4). Actual cumulative evaporation under all treatments remained substantially lower than cumulative latent evaporation during the entire evaporation period. At the end of the experiment, cumulative evaporation represented approximately 57.9%, 17.0%, and 12.8% of cumulative latent evaporation in the loamy sand soil under the
M0,
M1, and
M2 treatments, respectively. The corresponding values for the sandy clay loam soil were 63.6%, 19.2%, and 13.3%, respectively. Relative to cumulative latent evaporation, the 2 cm mulch treatment reduced actual evaporation losses by approximately 70.6% and 69.8% in the loamy sand and sandy clay loam soils, respectively, while the 4 cm mulch treatment reduced evaporation losses by approximately 77.9% and 79.1%, respectively.
Figure 4 further shows that the differences between mulched and non-mulched treatments became progressively larger with time, reflecting the cumulative effect of mulch in limiting evaporative water loss during prolonged drying. The greatest cumulative evaporation was consistently recorded under the non-mulched treatment, whereas the lowest values were observed under the 4 cm mulch treatment in both soils throughout the experimental period.
Overall, the results presented in
Figure 4 confirm that sawdust mulching was highly effective in reducing cumulative evaporation under arid conditions. The reduction was evident in both soil types and increased with increasing mulch thickness, with the greatest reduction observed under the 4 cm mulch treatment.
3.2.2. Effect of Nitrogen Application on Evaporation
The effect of nitrate nitrogen application rates on cumulative evaporation from the loamy sand (
S1) and sandy clay loam (
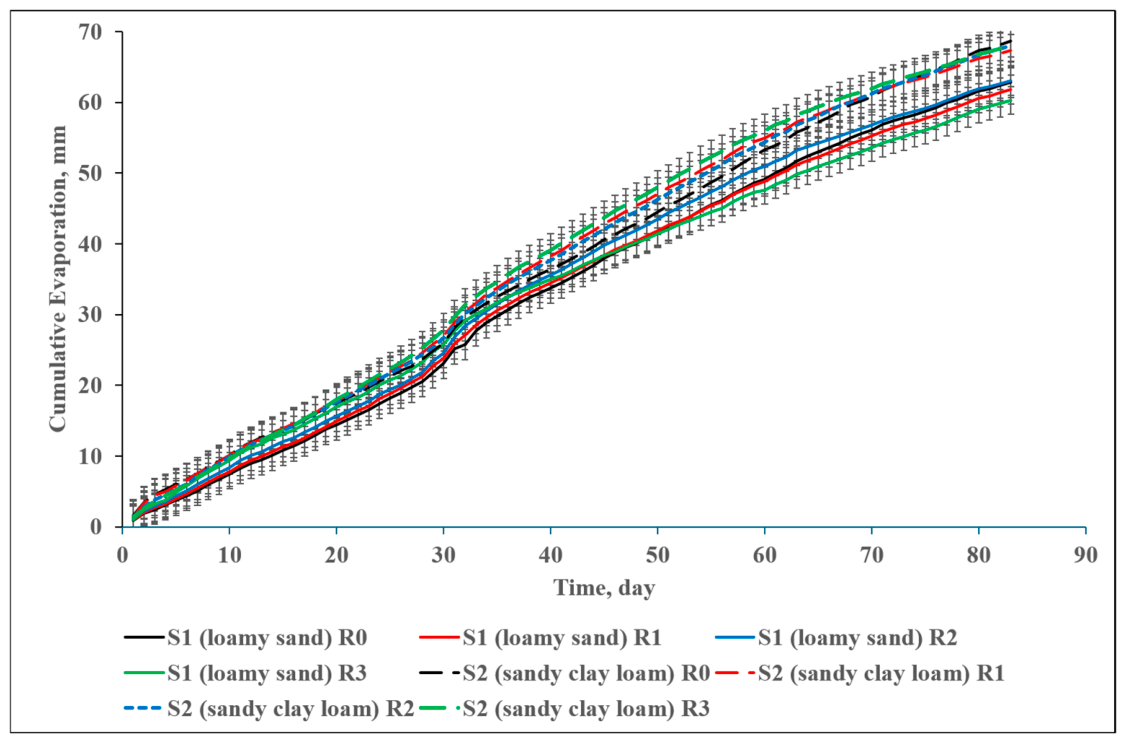
S2) soils is presented in
Figure 5. Overall, nitrate nitrogen application had no significant effect on cumulative evaporation in either soil throughout the experimental period.
Figure 5 shows that cumulative evaporation increased progressively with time under all nitrogen application rates in both soils. The cumulative evaporation curves corresponding to the different nitrogen treatments exhibited very similar temporal trends throughout the 83-day evaporation period. No consistent response to increasing nitrate application rate was observed under either soil type, or the evaporation curves remained closely grouped during the entire experiment.
In the loamy sand soil (S1), cumulative evaporation after 83 days reached 62.8, 61.8, 63.1, and 60.2 mm under the R0 (0 kg NO3−–N ha−1), R1 (200 kg NO3−–N ha−1), R2 (300 kg NO3−–N ha−1), and R3 (400 kg NO3−–N ha−1) treatments, respectively. Relative to the control treatment (R0), cumulative evaporation decreased by approximately 1.6% and 4.1% under the R1 and R3 treatments, respectively, whereas a slight increase of approximately 0.5% was observed under the R2 treatment. Despite these small numerical differences, no consistent trend associated with increasing nitrogen application rate was evident. A similar pattern was observed in the sandy clay loam soil (S2). At the end of the experiment, cumulative evaporation values were 68.6, 67.3, 68.0, and 68.0 mm under the R0, R1, R2, and R3 treatments, respectively. Compared with the control treatment, cumulative evaporation decreased by approximately 1.9%, 0.9%, and 0.9% under the R1, R2, and R3 treatments, respectively. The differences among nitrogen treatments remained small throughout the evaporation period.
Statistical analysis using factorial ANOVA confirmed that nitrate nitrogen application had no consistent significant effect on cumulative evaporation across most soil depths (
p > 0.05 overall), although a limited depth-specific response was observed at the 20–30 cm soil layer (
p < 0.05), as shown in
Supplementary Table S1.
As shown in
Figure 5, the evaporation curves under the different nitrogen treatments largely overlapped throughout the drying period in both soils. The absence of clear separation among the curves indicates that nitrate nitrogen application had only a limited influence on cumulative evaporation under the conditions of this study. Analysis of variance confirmed that nitrate nitrogen application had no statistically significant effect on cumulative evaporation in either soil (
p > 0.05). In contrast, soil texture remained the dominant factor affecting evaporation behavior throughout the experiment. The sandy clay loam soil consistently exhibited greater cumulative evaporation than the loamy sand soil across all nitrogen application rates. After 83 days, cumulative evaporation in the sandy clay loam soil exceeded that in the loamy sand soil by approximately 9.2%, 8.9%, 7.8%, and 13.0% under the
R0,
R1,
R2, and
R3 treatments, respectively. A temporary increase in the evaporation rate was observed around day 31 for all treatments in both soils. This increase coincided with a rise in greenhouse temperature during the experimental period. However, despite this temporary increase, the overall evaporation pattern remained similar among all nitrogen application rates.
Finally, the results indicate that nitrate nitrogen application within the investigated range did not significantly influence cumulative evaporation under the conditions of this study. The absence of significant treatment effects (
p > 0.05) suggests that evaporation dynamics were primarily governed by soil texture and atmospheric evaporative demand rather than by nitrate nitrogen application rate. The results presented in
Figure 5 demonstrate that cumulative evaporation followed nearly identical temporal patterns across all nitrogen treatments in both soils throughout the experimental period.
3.3. Soil Water Distribution and Storage
3.3.1. Soil Water Distribution After Drainage
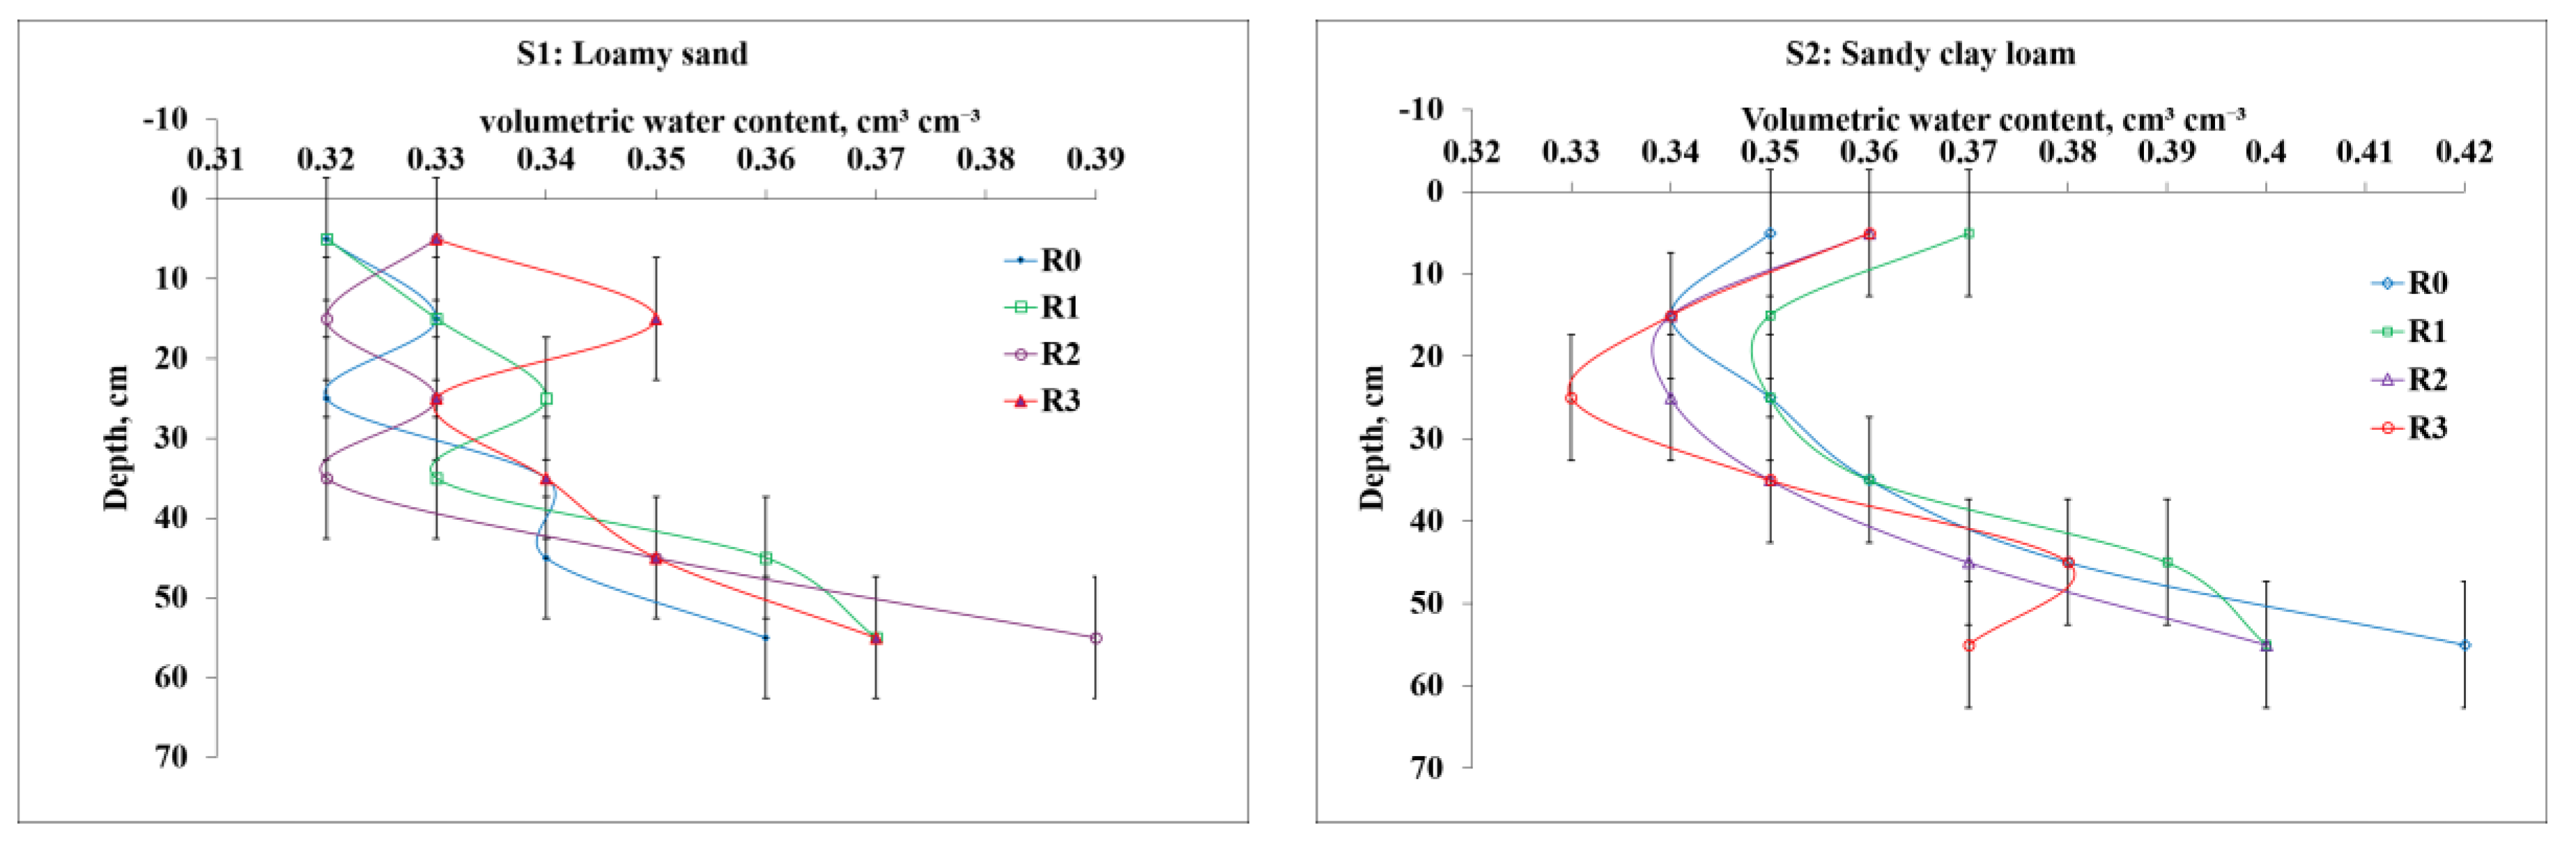
Figure 6 presents the vertical distribution of volumetric water content (
θ) within the soil profiles immediately after free drainage in the loamy sand soil (
S1) and the sandy clay loam soil (
S2) under different nitrate–nitrogen application rates (
R0,
R1,
R2, and
R3). The results indicate that nitrate applications exerted only a limited influence on soil water redistribution following drainage. Volumetric water content values remained relatively similar among the four nitrogen application rates at all depths investigated in both soils, suggesting that nitrate addition did not substantially affect post-drainage soil moisture distribution. Statistical analysis confirmed that nitrate–nitrogen application had no significant effect on volumetric water content after drainage across most soil depths (
p > 0.05). In contrast, soil texture exerted a highly significant effect on water distribution and storage within the profile (
p ≤ 0.01), highlighting the dominant role of soil physical properties in controlling water retention after drainage.
In the loamy sand soil (S1), volumetric water content within the surface layer (5 cm) ranged from 0.32 cm3 cm−3 under R0 and R1 to 0.33 cm3 cm−3 under R2 and R3. Similar values were observed throughout the upper and middle portions of the profile, where θ generally varied between 0.32 and 0.35 cm3 cm−3. At 15 cm depth, values ranged from 0.32 to 0.35 cm3 cm−3, while at 25 and 35 cm depths they remained within a narrow interval of approximately 0.32–0.34 cm3 cm−3. A gradual increase in water content was observed toward the lower profile layers, where θ reached 0.34–0.36 cm3 cm−3 at 45 cm depth and increased further to between 0.36 and 0.39 cm3 cm−3 at 55 cm depth. The highest value recorded in this soil was 0.39 cm3 cm−3 under the R2 treatment in the deepest layer.
The sandy clay loam soil (S2) consistently maintained greater volumetric water contents than the loamy sand soil throughout the profile. In the surface layer, θ ranged from 0.35 to 0.37 cm3 cm−3 across the nitrogen treatments. Between 15 and 35 cm depth, volumetric water content remained relatively stable and varied between approximately 0.33 and 0.36 cm3 cm−3. As observed in the loamy sand soil, water content increased in the deeper layers, reaching values between 0.37 and 0.39 cm3 cm−3 at 45 cm depth and between 0.37 and 0.42 cm3 cm−3 at 55 cm depth. The maximum volumetric water content measured in the experiment was 0.42 cm3 cm−3 under the R0 treatment at the deepest layer, confirming the greater water retention capacity of the sandy clay loam soil.
When averaged across nitrogen application rates, volumetric water content in the upper 5 cm layer was approximately 0.33 cm3 cm−3 in the loamy sand soil and 0.36 cm3 cm−3 in the sandy clay loam soil. Corresponding values in the deepest layer increased to approximately 0.37 and 0.40 cm3 cm−3, respectively. The increase in water content with depth observed in both soils indicates that complete redistribution of water had not yet been achieved immediately after drainage. Greater water contents in the lower profile layers suggest that gravitational water movement remained more active near the bottom of the soil columns, whereas the upper layers had already undergone greater drainage and water depletion.
The observed differences between the two soils reflect the strong influence of soil texture on post-drainage water retention and redistribution. The coarser loamy sand soil exhibited lower residual water contents because its larger pore network promoted more rapid drainage and reduced water retention. In contrast, the sandy clay loam soil retained greater amounts of water throughout the profile owing to its finer pore-size distribution, higher specific surface area, and stronger matric forces. Consequently, the sandy clay loam soil maintained consistently higher volumetric water contents than the loamy sand soil at nearly all depths.
Overall, the results presented in
Figure 6 demonstrate that soil texture was the primary factor controlling soil water distribution and storage after free drainage, whereas nitrate–nitrogen application had only minor effects on the vertical redistribution of soil moisture. The consistently greater volumetric water contents observed in the sandy clay loam soil confirm its superior water-holding capacity relative to the loamy sand soil and emphasize the importance of soil physical characteristics in governing post-drainage water dynamics.
3.3.2. Effect of Mulching on Volumetric Soil Water Content After Evaporation
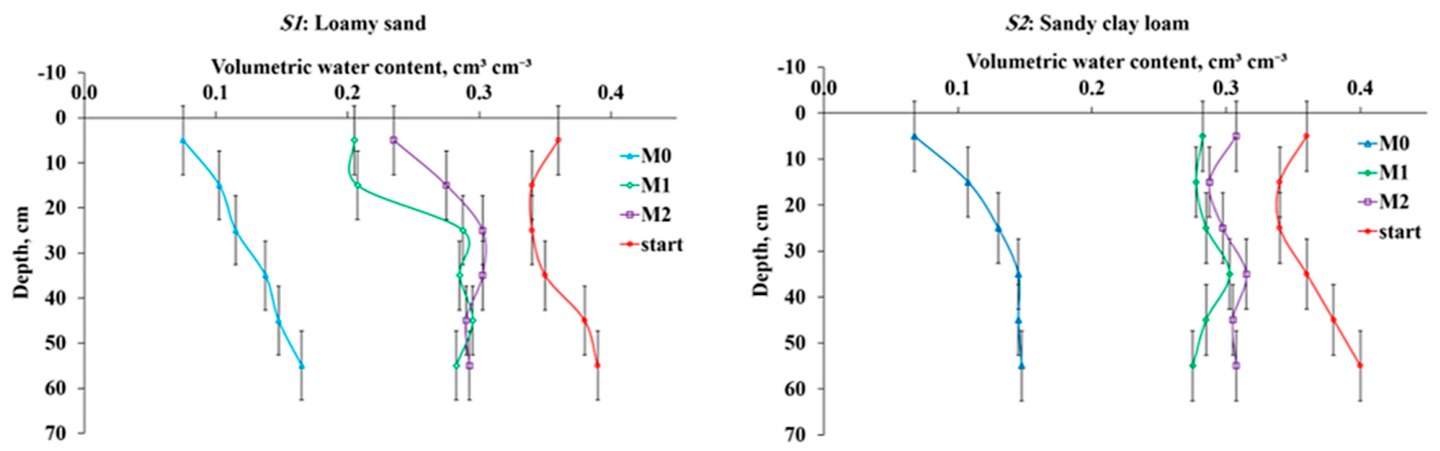
Figure 7 illustrates the effect of sawdust mulch on the vertical distribution of volumetric water content (
θ) within the profiles of the loamy sand soil (
S1) and the sandy clay loam soil (
S2) after 83 days of evaporation. The results clearly demonstrate that mulch application substantially influenced soil water conservation and residual moisture distribution throughout the soil profile. In general, the average volumetric water content in both soils decreased considerably compared with the Initial moisture distribution measured at the beginning of the evaporation period. However, the magnitude of moisture depletion varied markedly according to mulch treatment. Statistical analysis based on factorial ANOVA confirmed that mulch treatment had a highly significant effect on volumetric soil water content after evaporation (
p ≤ 0.01), while nitrogen application showed no significant effect (
p > 0.05). Soil texture also showed no significant interaction effect in most soil depths. The complete ANOVA outputs, including degrees of freedom, F-values, and significance levels, are provided in
Supplementary Table S1.
Under the non-mulched treatment (M0), evaporation caused substantial depletion of soil water throughout the profile in both soils. In the loamy sand soil (S1), volumetric water content in the surface layer (5 cm) decreased from an Initial value of 0.36 cm3 cm−3 to only 0.08 cm3 cm−3 after 83 days of evaporation. Similar reductions were observed throughout the profile, with θ values increasing gradually from 0.10 cm3 cm−3 at 15 cm depth to 0.17 cm3 cm−3 at 55 cm depth. These results indicate severe drying throughout the profile and the development of an extensive dry zone extending through most of the soil column. The strong reduction in moisture content reflects the high evaporation losses that occurred in the absence of mulch protection. A similar trend was observed in the sandy clay loam soil (S2), although the moisture distribution pattern differed somewhat from that observed in the loamy sand soil. Volumetric water content in the surface layer decreased from an Initial value of 0.36 cm3 cm−3 to 0.07 cm3 cm−3 under M0. Water content remained relatively low within the upper portion of the profile, ranging between 0.11 and 0.15 cm3 cm−3 from 15 to 55 cm depth. The results suggest the formation of a dry zone within the upper half of the profile followed by a relatively wetter transmission zone in the lower layers. This pattern indicates the occurrence of at least two stages of evaporation decline, where water movement from deeper layers partially compensated for moisture losses near the soil surface.
Application of a 2 cm sawdust mulch layer (M1) substantially improved soil water conservation in both soils. In the loamy sand soil, volumetric water content within the upper 20 cm of the profile increased markedly relative to the non-mulched treatment, reaching approximately 0.21 cm3 cm−3 at both 5 and 15 cm depths. Compared with the field capacity value of approximately 0.1875 cm3 cm−3 for this soil, mulch application increased moisture content in the upper layers by about 12%. In the deeper profile layers, θ values ranged between 0.28 and 0.30 cm3 cm−3, representing an increase of approximately 55% above field capacity. The moisture profile under M1 was therefore characterized by a distinct transmission zone with substantially greater water storage than that observed under M0. The positive effect of mulching was even more evident in the sandy clay loam soil. Under M1, volumetric water content remained remarkably uniform throughout the entire profile, varying only between 0.28 and 0.30 cm3 cm−3. Compared with the field capacity of approximately 0.2217 cm3 cm−3, moisture content increased by nearly 31% throughout most of the profile. The relatively uniform moisture distribution indicates that mulch application effectively reduced evaporation losses and maintained favorable hydraulic conditions within the soil column. Unlike the loamy sand soil, which still exhibited some variation with depth, the sandy clay loam soil developed an almost entirely uniform transmission zone.
Increasing mulch depth to 4 cm (M2) provided the greatest moisture conservation in both soils. In the loamy sand soil, volumetric water content increased to 0.24 cm3 cm−3 in the surface layer and remained between 0.28 and 0.30 cm3 cm−3 throughout the remainder of the profile. These values were consistently greater than those observed under M1, although the differences between the two mulch treatments were not statistically significant. The absence of a pronounced dry surface layer under M2 indicates that the thicker mulch effectively suppressed evaporation and preserved soil moisture throughout the profile.
Similarly, the sandy clay loam soil under M2 exhibited the highest and most uniform moisture contents among all treatments. Volumetric water content ranged from 0.29 to 0.32 cm3 cm−3 throughout the profile, compared with Initial values ranging from 0.34 to 0.40 cm3 cm−3. Although some moisture loss occurred during the 83-day evaporation period, the reductions were substantially smaller than those observed under the non-mulched treatment. The nearly uniform distribution of θ throughout the profile indicates that the thicker mulch layer greatly reduced evaporation-driven moisture gradients and maintained a stable soil water regime.
Comparison of the mulch treatments with the Initial moisture distribution further highlights the effectiveness of sawdust mulch in conserving soil water. Initially, volumetric water content ranged from 0.34–0.39 cm3 cm−3 in the loamy sand soil and from 0.34–0.40 cm3 cm−3 in the sandy clay loam soil. After 83 days of evaporation, the non-mulched treatment retained only a small fraction of this moisture, whereas both mulch treatments preserved substantially greater amounts of water throughout the profile. The beneficial effect became more pronounced as mulch depth increased from 2 cm to 4 cm, reflecting the progressive reduction in soil surface evaporation.
Overall, the results presented in
Figure 7 demonstrate that sawdust mulching exerted a highly significant effect on volumetric soil water content after evaporation. Mulch applications reduced evaporative water losses, increased residual soil moisture, and promoted the development of a more uniform moisture distribution throughout the soil profile. The beneficial effects were particularly evident when comparing the mulched treatments (
M1 and
M2) with the non-mulched treatment (
M0). Although the sandy clay loam soil generally maintained slightly greater moisture contents than the loamy sand soil, both soils responded similarly to mulch application. Consequently, mulch thickness emerged as the dominant factor controlling soil water conservation during evaporation, while increasing mulch depth improved the ability of the soil profile to retain moisture and resist surface desiccation.
3.3.3. Soil Water Conservation
The effects of sawdust mulching on soil water storage after 83 days of evaporation are presented in
Table 3, while the corresponding moisture distribution within the soil profile is illustrated in
Figure 7. Statistical analysis revealed that mulch application significantly increased soil water storage in both soils (
p ≤ 0.01), whereas nitrate nitrogen application showed no significant effect (
p > 0.05). No significant interaction effects were observed between mulch and soil type or between mulch and nitrogen application rate.
As shown in
Table 3, soil water storage in the loamy sand soil (
S1) under non-mulched conditions (
M0) after 83 days of evaporation was 38.1%. Application of sawdust mulch substantially increased soil water storage to 81.8% and 86.4% under mulch depths of 2 cm (
M1) and 4 cm (
M2), respectively, corresponding to relative increases of approximately 114.7% and 126.8% compared with the control treatment. Similarly, soil water storage in the sandy clay loam soil (
S2) increased from 38.9% under non-mulched conditions to 81.5% and 87.2% under
M1 and
M2 treatments, respectively, representing relative increases of approximately 109.5% and 124.2%.
The moisture profiles shown in
Figure 7 support these results and demonstrate that mulch application effectively reduced water depletion throughout the soil profile, particularly within the upper layers where evaporation losses were greatest. Under non-mulched conditions, severe drying developed near the soil surface, resulting in substantial reductions in residual soil water storage by the end of the experimental period. In contrast, the mulch treatments maintained considerably higher moisture contents at all profile depths. The beneficial effects of mulching can be attributed to the reduction in direct soil exposure to atmospheric demand, which suppressed evaporation and limited upward water movement toward the soil surface. Consequently, a greater proportion of the initial soil water remained stored within the soil profile throughout the evaporation period.
Although increasing mulch thickness from 2 cm to 4 cm resulted in additional improvements in soil water storage, the magnitude of this increase was relatively small and not statistically significant (p > 0.05). Therefore, the 2 cm mulch treatment appears sufficient to achieve most of the water conservation benefits associated with thicker mulch applications.
Differences between the two soils remained evident throughout the experiment. The sandy clay loam soil generally maintained slightly greater water storage than the loamy sand soil because of its finer texture and greater water-holding capacity. Nevertheless, both soils responded strongly to mulch application, confirming the effectiveness of sawdust mulch as a practical and sustainable soil water conservation practice under arid conditions.
3.4. Soil Salinity Dynamics
Salt transport and redistribution within the soil profile were strongly influenced by soil water movement during drainage and evaporation processes. Variations in soil texture, nitrate nitrogen application, and mulch treatment affected both downward salt leaching during drainage and upward salt accumulation during evaporation. To evaluate these processes, electrical conductivity of the leachate (EC) and soil saturation extract (ECe) were monitored under the different experimental treatments. The obtained results provide insight into the combined effects of soil hydraulic behavior, evaporation dynamics, and mulching on salinity redistribution within the soil profile under arid conditions.
3.4.1. Salinity in Leachate
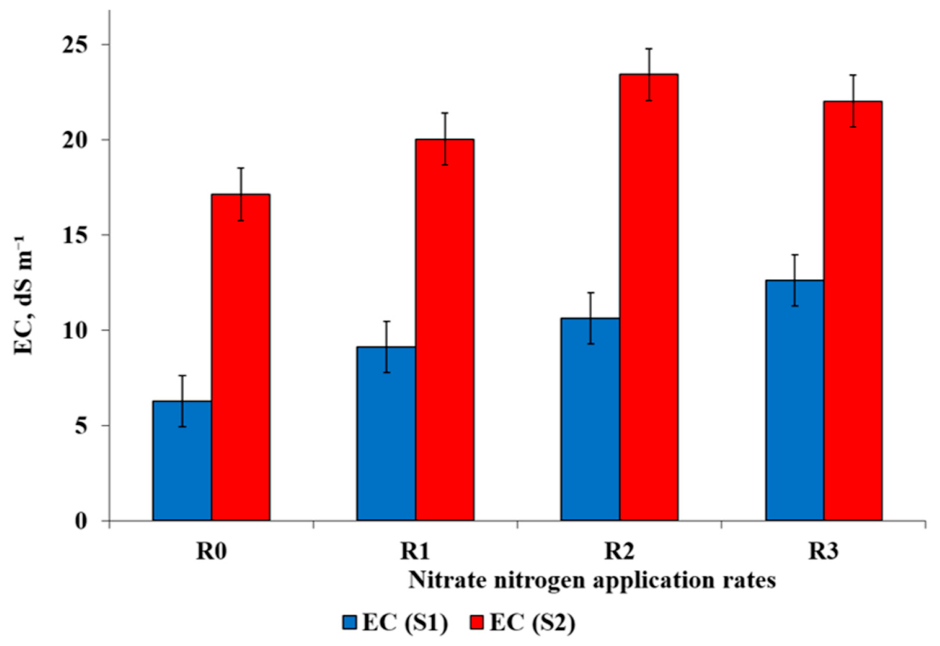
The electrical conductivity (
EC) of the leachate collected immediately after free drainage is presented in
Figure 8. The results revealed clear differences in leachate salinity between the two soil textures and among nitrate nitrogen application rates, indicating substantial variation in salt mobility and leaching behavior during drainage. As shown in
Figure 8, the sandy clay loam soil (
S2) consistently exhibited considerably greater leachate
EC values than the loamy sand soil (
S1) under all nitrogen application rates. In the loamy sand soil,
EC values increased progressively from approximately 7.5 dS m
−1 under the control treatment (
R0) to approximately 14 dS m
−1 under the highest nitrogen application rate (
R3). Similarly, the sandy clay loam soil exhibited higher
EC values ranging from approximately 18 dS m
−1 at
R0 to more than 20 dS m
−1 at
R3.
The increase in leachate EC with increasing nitrate nitrogen application reflects the greater concentration of soluble salts within the soil solution following fertilizer addition. Higher nitrate application rates increased ionic concentration in the soil water, resulting in greater salt transport during gravitational drainage. This trend was particularly evident in the loamy sand soil, where EC values increased sharply with increasing nitrogen application rate. The consistently greater EC values observed in the sandy clay loam soil indicate stronger retention of dissolved salts within the finer pore system and a greater concentration of salts in the drainage water. The finer texture and higher water-holding capacity of the sandy clay loam soil likely enhanced solute residence time and promoted greater salt accumulation within the soil solution prior to leaching.
Despite the higher hydraulic conductivity generally associated with coarse-textured soils under near-saturated conditions, the sandy clay loam soil produced more saline leachate, suggesting that soil texture influenced not only water movement but also solute concentration and redistribution processes during drainage. The results presented in
Figure 8 demonstrate that nitrate nitrogen application increased leachate salinity in both soils, while soil texture exerted a dominant influence on the magnitude of salt leaching during free drainage. Statistical analysis showed that both soil texture and nitrate nitrogen application significantly affected leachate salinity following free drainage. Soil texture exerted a highly significant effect on
EC values (
p ≤ 0.01), with the sandy clay loam soil consistently producing more saline leachate than the loamy sand soil. Nitrogen application rate also significantly increased leachate
EC (
p ≤ 0.01), reflecting enhanced soluble salt concentrations in the soil solution with increasing nitrate addition. Moreover, the interaction between soil texture and nitrogen application (S × RF) was significant at several profile depths, indicating that the salinity response to nitrate application differed according to soil texture. The complete ANOVA outputs, including degrees of freedom, F-values, and significance levels, are provided in
Supplementary Table S2.
3.4.2. Salt Distribution After Drainage
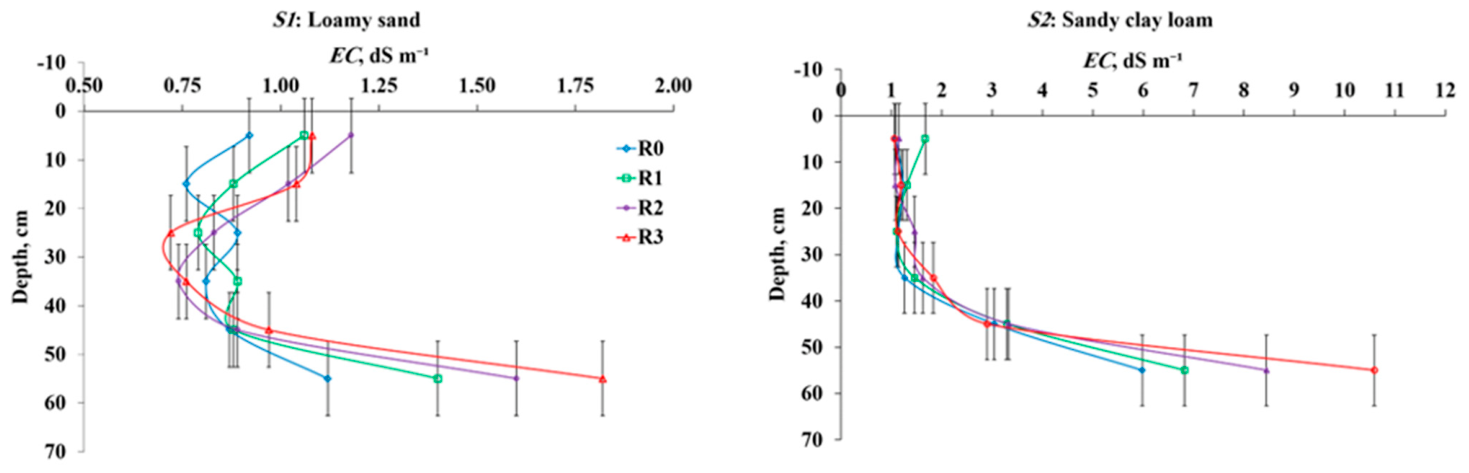
The vertical distribution of soil salinity immediately after free drainage is presented in
Figure 9. The results indicate downward redistribution of soluble salts within both soil profiles following gravitational water movement. Soil texture exerted a strong influence on salinity distribution patterns, while nitrate nitrogen application affected both the magnitude and distribution of
EC throughout the profile.
In the loamy sand soil (S1), EC values remained relatively low throughout the profile, ranging from 0.72 to 1.82 dS m−1. The lowest values were generally observed within the intermediate depths (25–35 cm), whereas higher EC values occurred in the deeper layer (55 cm). Under the control treatment (R0), EC varied between 0.76 and 1.12 dS m−1. Increasing nitrate application increased EC in the lower part of the profile, reaching 1.40, 1.60, and 1.82 dS m−1 at 55 cm depth under R1, R2, and R3, respectively. These results indicate downward transport and partial accumulation of soluble salts in the lower layers during drainage. In contrast, the sandy clay loam soil (S2) exhibited substantially greater EC values, particularly in the deeper layers. EC values ranged from 1.06 to 10.59 dS m−1 and increased markedly with depth under all treatments. In the upper layers (5–35 cm), EC values generally remained below 2.0 dS m−1, whereas a sharp increase occurred below 45 cm depth. At 55 cm depth, EC reached 5.98, 6.82, 8.45, and 10.59 dS m−1 under R0, R1, R2, and R3, respectively. The pronounced salinity buildup in the lower profile demonstrates considerable downward movement and accumulation of dissolved salts during free drainage.
The progressive increase in EC with depth, particularly in S2, reflects the leaching effect associated with gravitational water movement. As drainage water moved downward through the soil columns, soluble salts were transported from the upper layers and accumulated in deeper portions of the profile. This redistribution pattern was considerably more pronounced in the sandy clay loam soil than in the loamy sand soil, likely due to its greater water-holding capacity and lower hydraulic conductivity, which promoted salt retention and accumulation in the lower layers. Nitrogen application rate also influenced post-drainage salinity distribution. Although the effect was relatively limited in the upper layers, increasing nitrate application generally increased EC values in the deeper layers of both soils. The highest salinity levels were consistently observed under the R3 treatment, particularly at 55 cm depth, confirming that greater nitrate inputs increased the concentration of soluble ions available for downward transport and accumulation during drainage.
Overall, the results demonstrate that free drainage promoted substantial downward salt movement in both soils, with the magnitude of salt accumulation strongly controlled by soil texture and nitrogen application rate. Statistical analysis confirmed that soil texture significantly affected post-drainage salinity distribution within the soil profile (
p ≤ 0.01), particularly in the deeper soil layers where salt accumulation was greatest. Nitrate nitrogen application also significantly increased
EC values at several depths, especially within the lower portions of the profile (
p ≤ 0.01). In addition, significant soil texture × nitrogen application (S × RF) interactions were observed for salinity distribution in some layers, indicating that the extent of downward salt transport differed between the two soils depending on nitrogen application level. The complete ANOVA results, including degrees of freedom, F-values, and significance levels, are provided in
Supplementary Table S3.
3.4.3. Effect of Mulching on Soil Electrical Conductivity Distribution After Evaporation
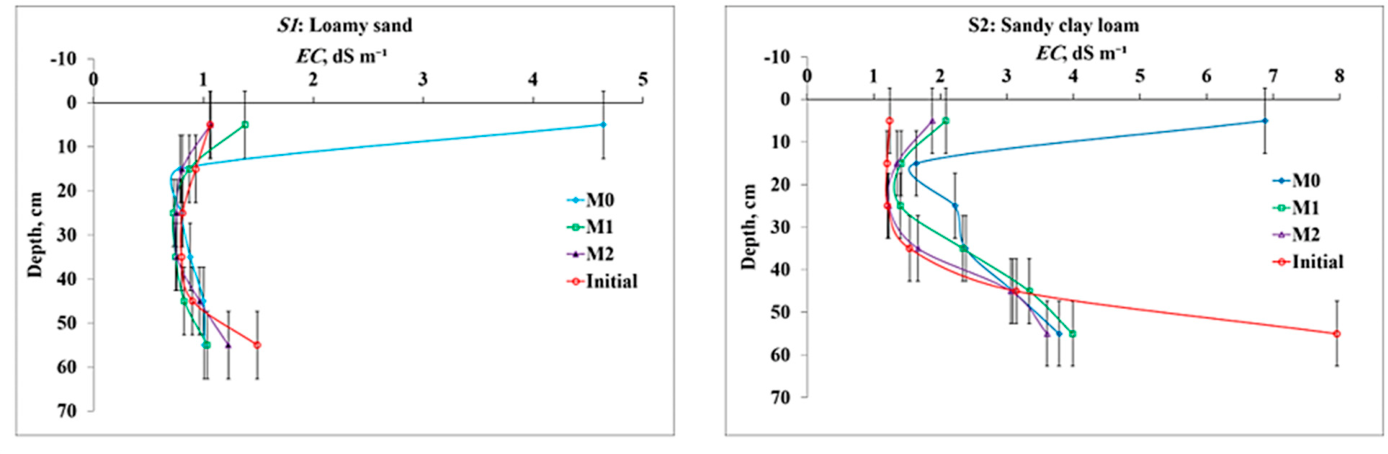
Figure 10 shows the effect of sawdust mulch on the vertical distribution of soil electrical conductivity (
EC) in the loamy sand soil (
S1) and the sandy clay loam soil (
S2) after 83 days of evaporation. The figure also includes the initial salinity distribution (Initial), representing the average
ECe values measured before the beginning of the evaporation period. Comparison between the initial and final salinity distributions clearly demonstrates the influence of evaporation and mulch application on salt redistribution within the soil profile. Following the cessation of free drainage and the onset of evaporation, salts remaining within the soil profile were redistributed upward due to evaporation-induced capillary flow. This process was particularly evident in the non-mulched treatment (
M0), where substantial salt accumulation occurred in the upper soil layer. In both soils, the surface
EC values under
M0 were considerably greater than the corresponding initial values, indicating strong upward transport and concentration of soluble salts near the evaporating surface.
In the loamy sand soil (S1), the initial EC value in the upper layer was approximately 1.06 dS m−1, whereas it increased to 4.64 dS m−1 under the non-mulched treatment. Application of sawdust mulch markedly reduced this accumulation, with surface EC decreasing to 1.38 and 1.07 dS m−1 under the 2 cm (M1) and 4 cm (M2) mulch treatments, respectively. These values were very close to the initial salinity level, indicating that mulch effectively minimized evaporation-induced salt accumulation and maintained a more stable salinity distribution. Furthermore, the EC profiles under M1 and M2 were relatively uniform throughout the soil column, suggesting that the salinity distribution approached a near-equilibrium condition by the end of the evaporation period.
A similar response was observed in the sandy clay loam soil (S2), although salinity levels were generally higher than those recorded in S1. The surface EC increased from an initial value of approximately 1.24 dS m−1 to 6.88 dS m−1 under the non-mulched treatment, reflecting severe salt accumulation near the soil surface. Mulch application substantially reduced surface salinity, with EC values declining to 2.08 and 1.88 dS m−1 under M1 and M2, respectively. Despite this reduction, the salinity distribution in S2 remained less uniform than in S1, as EC values in the lower half of the profile were generally greater than those in the upper half. This pattern indicates that salt redistribution in the sandy clay loam soil had not yet reached equilibrium by the end of the evaporation period.
Comparison between the two soils revealed no significant differences in EC values at most profile depths. However, a significant difference was observed at the deepest layer (55 cm), where the average EC value was approximately 1.10 dS m−1 in the loamy sand soil and 3.80 dS m−1 in the sandy clay loam soil. The greater salinity observed in the lower layer of S2 reflects the higher water-holding capacity and stronger salt retention characteristics of the finer-textured soil.
The statistical analysis demonstrated a highly significant effect of mulch application on salinity distribution after evaporation (
p ≤ 0.01). Significant differences were detected between the non-mulched treatment (
M0) and both mulch treatments (
M1 and
M2) within the upper 10 cm layer in both soils, where salt accumulation was greatest. In contrast, no significant differences among treatments were observed in the remaining profile layers. Moreover, no significant differences were detected between the 2 cm and 4 cm mulch treatments, indicating that both mulch depths were similarly effective in suppressing surface salt accumulation. These results confirm that the statistical outputs correspond to
Supplementary Table S3, which summarizes the full ANOVA results for post-evaporation salinity distribution.
The comparison with the Initial profile further confirms the role of mulch in controlling salinity development. While the non-mulched treatment produced a pronounced salinity gradient characterized by strong surface accumulation, the mulch treatments-maintained EC values close to their initial levels and reduced vertical salinity gradients throughout the profile. This response indicates that mulch reduced evaporation from the soil surface, weakened upward capillary flow, and consequently limited the upward transport of dissolved salts.
Overall, the results demonstrate that sawdust mulching effectively mitigated evaporation-induced salt accumulation and promoted a more uniform salinity distribution within both soils. The beneficial effect was most evident in the surface layer, where mulch reduced EC by approximately 70–80% relative to the non-mulched treatment. These findings highlight the importance of mulch application as an effective management practice for reducing salt accumulation and maintaining favorable soil conditions under arid and semi-arid environments.
3.5. Nitrate Dynamics and Transport
3.5.1. Nitrate Leaching
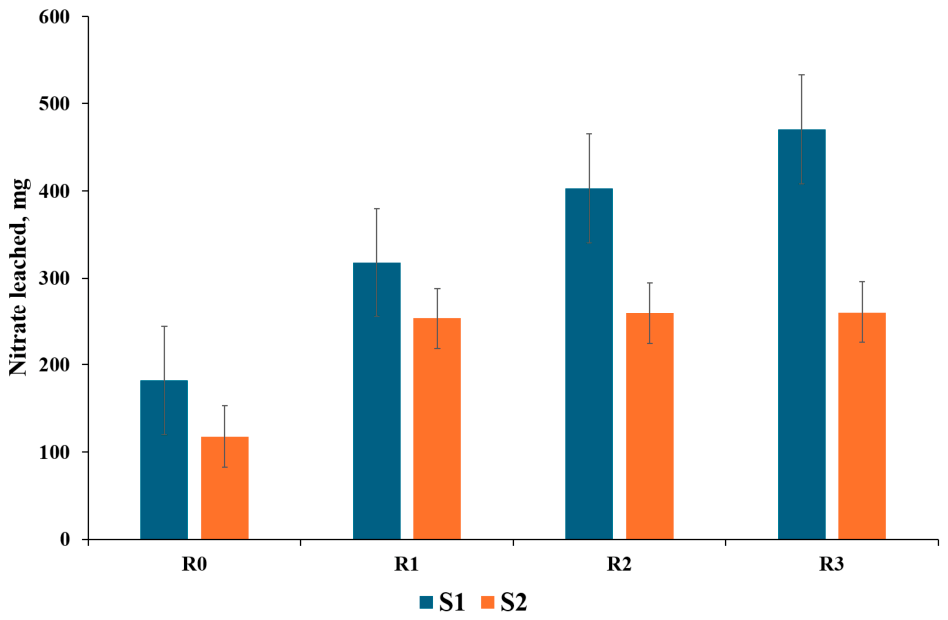
The amount of nitrate leached in the drainage water under different nitrate nitrogen application rates is presented in
Figure 11. The results demonstrated significant differences in nitrate leaching between the two soil textures and among nitrogen application levels, indicating strong effects of soil hydraulic properties and fertilizer rate on nitrate mobility during free drainage.
As shown in
Figure 11, the loamy sand soil (
S1) consistently exhibited significantly greater nitrate leaching than the sandy clay loam soil (
S2) under all nitrogen application rates. The amount of nitrate leached from the loamy sand soil exceeded that from the sandy clay loam soil by approximately 1.55, 1.25, 1.55, and 1.80 times under
R0,
R1,
R2, and
R3 treatments, respectively. These results indicate that the coarse-textured loamy sand soil was more susceptible to nitrate loss through leaching due to its larger pore system, greater hydraulic conductivity, and lower nitrate retention capacity. The greater nitrate retention observed in the sandy clay loam soil reflects its finer texture, higher water-holding capacity, and lower permeability relative to the loamy sand soil. These properties reduced downward water flux and prolonged nitrate residence time within the soil profile, thereby decreasing nitrate transport with drainage water. Nitrate leaching increased progressively with increasing nitrogen application rate in both soils. Relative to the control treatment (
R0), nitrate leaching from the loamy sand soil increased by approximately 74.7%, 121.6%, and 158.8% under nitrogen application rates of 200, 300, and 400 kg NO
3−–N ha
−1, respectively. Similarly, nitrate leaching from the sandy clay loam soil increased by approximately 115.4%, 120.5%, and 121.8% under the same nitrogen treatments. The increase in nitrate leaching with increasing nitrogen application reflects the greater concentration of soluble nitrate ions within the soil solution following fertilizer addition. Higher nitrate concentrations increased the amount of nitrate available for downward transport during gravitational drainage, particularly under conditions of heavy irrigation and free drainage. The effect of nitrogen application rate on nitrate leaching was especially pronounced in the loamy sand soil, where rapid water movement through the coarse pore network facilitated nitrate transport beyond the soil profile. In contrast, the sandy clay loam soil retained a larger proportion of nitrate within the soil matrix, thereby reducing nitrate losses in the leachate.
The observed differences between the two soils are consistent with the previously described hydraulic behavior (
Figure 2 and
Figure 3), where the loamy sand soil exhibited greater hydraulic conductivity and faster water transmission, while the sandy clay loam soil maintained greater water retention and lower permeability. These contrasting hydraulic characteristics strongly controlled nitrate mobility and leaching behavior during drainage. The fraction of total nitrate lost through leaching also differed between the two soils and among nitrogen application rates. In the loamy sand soil, nitrate leaching fractions ranged from approximately 58.3% under the control treatment to approximately 69.7% under the highest nitrogen application rate. Corresponding values in the sandy clay loam soil ranged from approximately 55.9% to 45.7%. In general, nitrate leaching fractions were consistently greater in the loamy sand soil than in the sandy clay loam soil, particularly under the higher nitrogen application rates.
The results presented in
Figure 11 demonstrate that nitrate leaching was strongly influenced by both soil texture and nitrogen application rate. The loamy sand soil showed substantially greater susceptibility to nitrate loss through leaching, whereas increasing nitrate application rates significantly enhanced nitrate transport in both soils. Statistical analysis using factorial ANOVA confirmed that both soil texture and nitrate nitrogen application rate had highly significant effects on nitrate leaching (
p ≤ 0.01), and a significant interaction effect (S × R) was also detected, indicating that the response of nitrate leaching to fertilizer rate depended on soil texture (
Supplementary Table S2).
3.5.2. Nitrate Distribution in Soil Profile
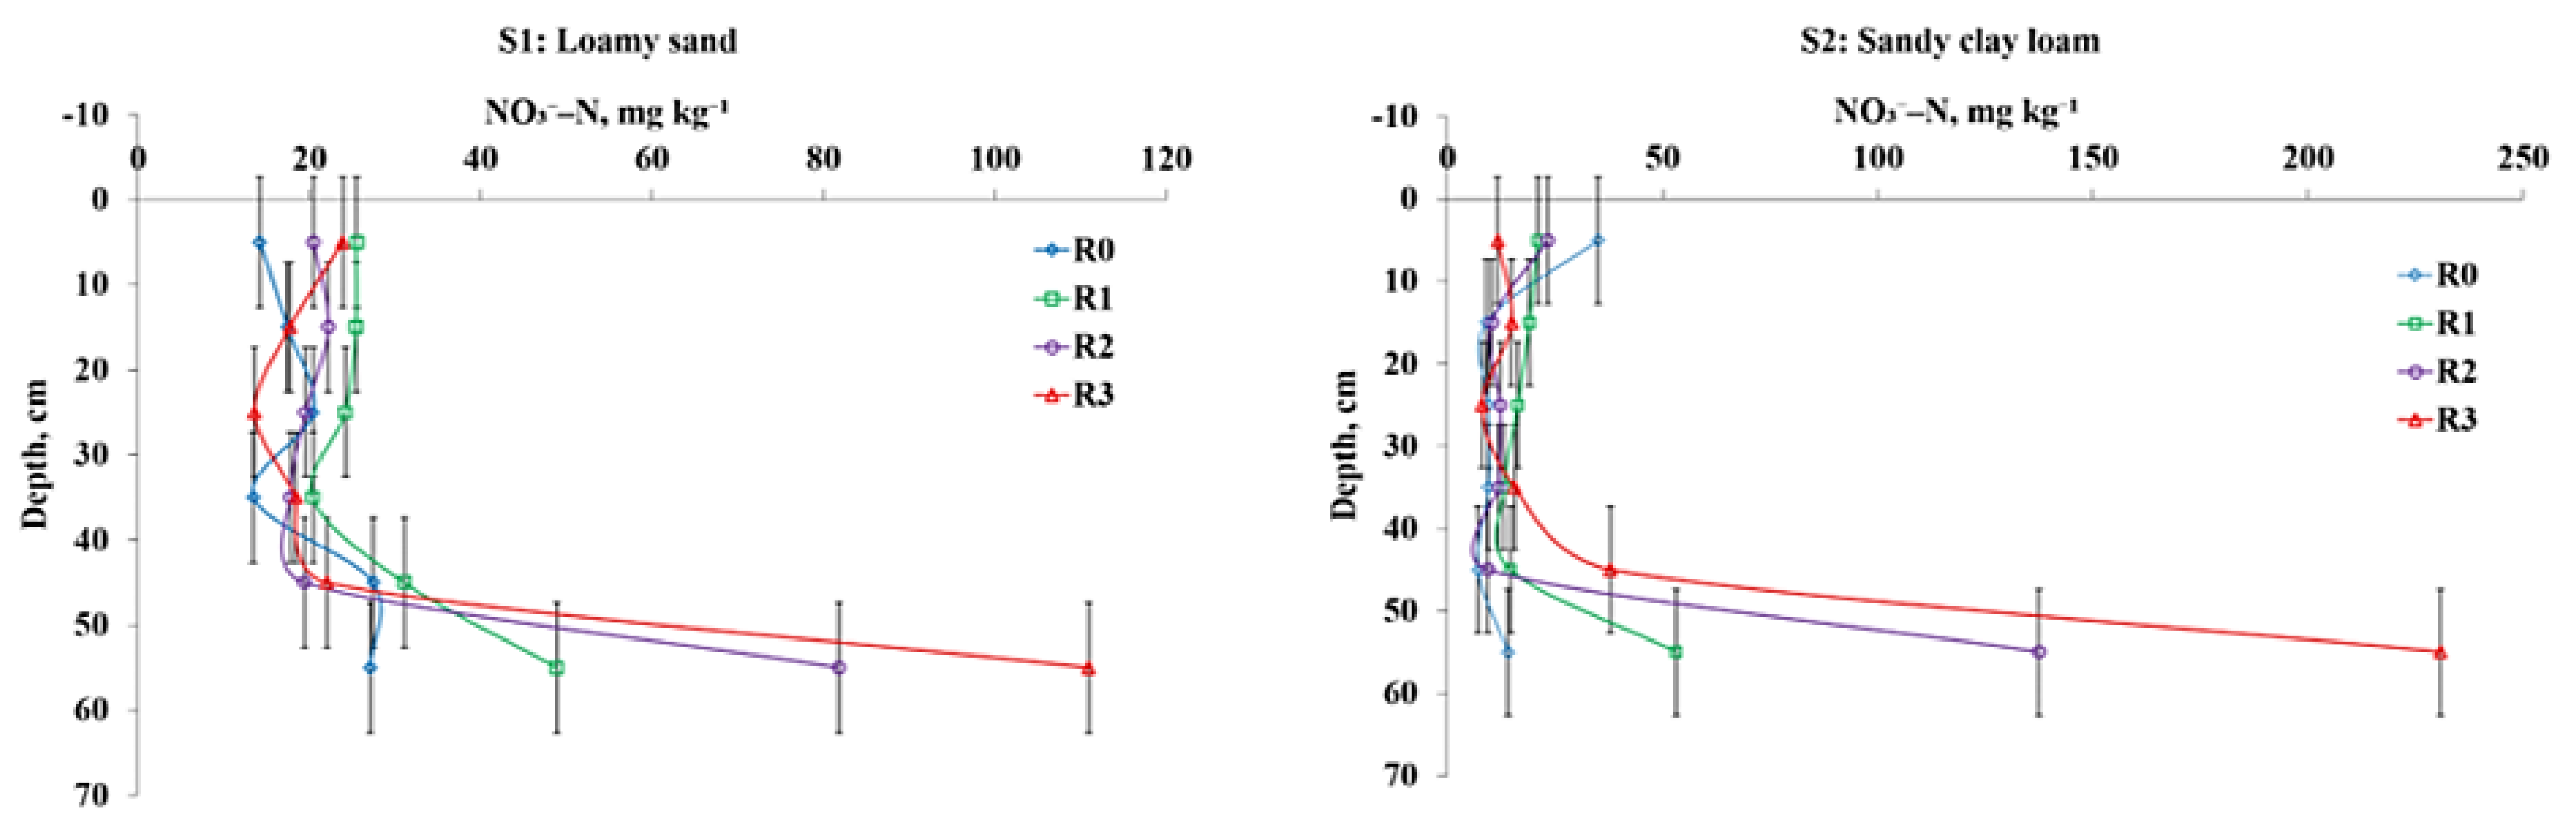
The vertical distribution of nitrate within the soil profile immediately after free drainage and after 83 days of evaporation is presented in
Figure 12 and
Figure 13, respectively. The obtained results indicate that nitrate redistribution was strongly influenced by water movement within the soil profile, soil texture, nitrogen application rate, evaporation, and mulch application. Distinct redistribution patterns were observed following free drainage and after the subsequent evaporation period.
Figure 12 shows the nitrate distribution within the loamy sand (
S1) and sandy clay loam (
S2) soils immediately after free drainage under the four nitrate–nitrogen application rates (
R0,
R1,
R2, and
R3). The results indicate that nitrate distribution was relatively uniform throughout most of the soil profile in both soils, except within the deepest layer (55 cm), where nitrate accumulation increased markedly with increasing nitrogen application rate. Statistical analysis revealed no significant differences among nitrogen application rates throughout most profile depths in either soil, whereas significant differences were observed in the bottom layer (
p ≤ 0.01).
In the loamy sand soil (S1), nitrate concentration at 55 cm increased from 27.11 mg under R0 to 48.86, 81.80, and 110.97 mg under R1, R2, and R3, respectively. Relative to the control treatment (R0), nitrate accumulation increased by approximately 75.9%, 194.5%, and 285.1% under R1, R2, and R3, respectively. Similar trends were observed in the sandy clay loam soil (S2), although the magnitude of accumulation was substantially greater. Nitrate concentration at the bottom layer increased from 14.18 mg under R0 to 53.16, 137.50, and 230.73 mg under R1, R2, and R3, respectively, corresponding to increases of approximately 211.7%, 798.5%, and 1289.5% relative to the control treatment. These results clearly demonstrate the downward transport of nitrate with drainage water and the accumulation of nitrate within the lower portion of the soil profile following heavy irrigation.
The results further indicate substantial nitrate leaching during free drainage in both soils. However, nitrate movement appeared more rapid in the loamy sand soil because of its higher permeability and lower water-holding capacity. At the same time, nitrate accumulation within the lower profile was more pronounced in the sandy clay loam soil, reflecting its greater capacity to retain drainage water and dissolved nitrate within the deeper layers. Consequently, the lower portion of the sandy clay loam profile acted as an important zone of nitrate accumulation following free drainage.
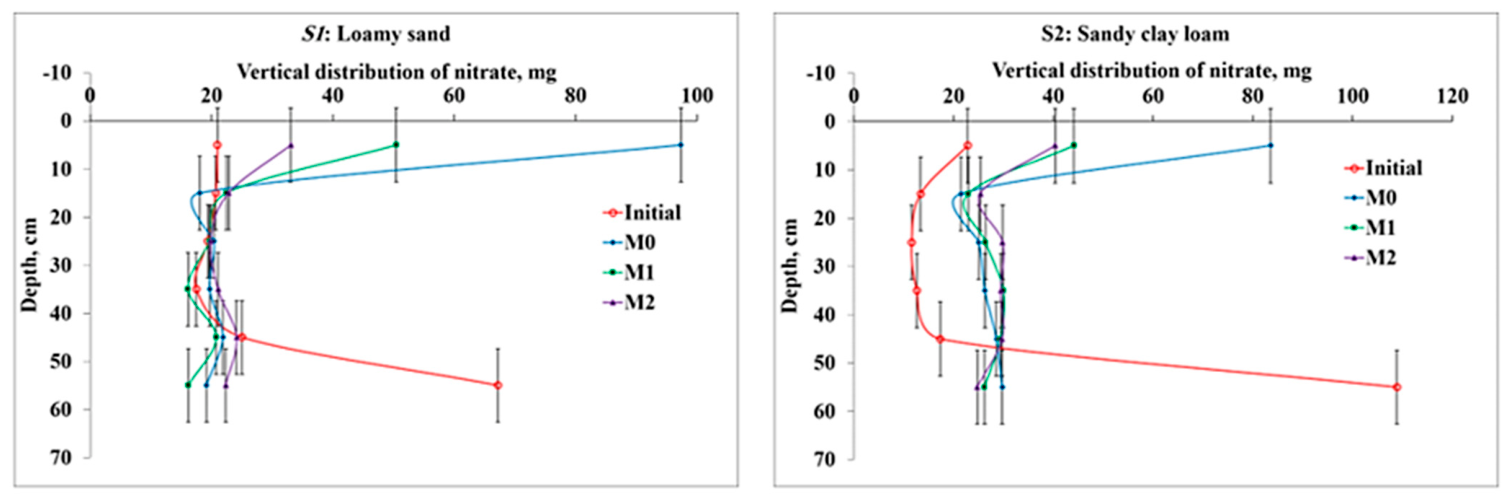
The effect of sawdust mulch on nitrate redistribution after 83 days of evaporation is presented in
Figure 13. The results indicate that nitrate moved upward from the lower layers toward the soil surface during evaporation, particularly under the non-mulched treatment (
M0). This upward redistribution was associated with evaporation-induced upward water movement and was considerably reduced by mulch application. In both soils, nitrate distribution remained relatively uniform throughout most of the profile, whereas nitrate accumulation increased substantially within the upper 0–10 cm layer.
In the loamy sand soil (
S1), nitrate concentration within the surface layer reached 97.35 mg under
M0, compared with 50.44 mg under the 2 cm mulch treatment (
M1) and 33.06 mg under the 4 cm mulch treatment (
M2). The corresponding Initial value before the beginning of evaporation was only 21.00 mg. Similarly, in the sandy clay loam soil (
S2), nitrate concentration within the surface layer increased to 83.55 mg under
M0, whereas values decreased to 44.10 and 40.36 mg under
M1 and
M2, respectively, compared with an Initial value of 22.81 mg. These results clearly indicate substantial nitrate accumulation near the soil surface during evaporation and demonstrate the effectiveness of mulch in reducing upward nitrate transport. Statistical analysis using factorial ANOVA confirmed that soil texture, nitrogen application rate, mulch treatment, and their interactions significantly affected nitrate distribution within the soil profile at different depths (
p ≤ 0.01), as summarized in
Supplementary Table S3.
Comparison of the mulch treatments with the Initial nitrate distribution further demonstrates the effect of evaporation on nitrate redistribution. In the loamy sand soil, the Initial nitrate concentration increased from 21.00 mg at 5 cm depth to 67.18 mg at 55 cm depth, whereas in the sandy clay loam soil the corresponding Initial values ranged from 22.81 mg at the surface to 108.89 mg at the bottom layer. Following evaporation, nitrate accumulated near the surface under M0, while the use of M1 and particularly M2 reduced this upward redistribution and promoted a more uniform nitrate distribution throughout the profile. These results indicate that sawdust mulch effectively suppressed evaporation-driven upward nitrate transport by reducing soil water losses and maintaining greater moisture contents within the soil profile.
Overall, the results demonstrate two contrasting nitrate redistribution processes. Free drainage promoted downward nitrate transport and accumulation within the lower profile, particularly under the higher nitrogen application rates (R2 and R3), whereas prolonged evaporation induced upward nitrate movement and accumulation near the soil surface, especially under the non-mulched treatment (M0). Mulch application substantially reduced this upward redistribution, with the 4 cm mulch treatment (M2) providing the greatest reduction in surface nitrate accumulation.
The significant effects of soil texture, nitrogen application rate, and mulch treatment, together with the observed redistribution patterns, confirm that nitrate movement within the soil profile was strongly controlled by the interaction between water flow processes and soil hydraulic properties.
3.6. Nitrate Balance
Nitrate balance was evaluated under both drainage and evaporation conditions to assess the influence of soil texture, nitrate application rate, and mulch treatment on nitrate retention and redistribution within the soil system.
3.6.1. Nitrate Balance After Drainage
The nitrate balance within the soil system immediately after free drainage is presented in
Table 4. The obtained results provide a quantitative assessment of nitrate partitioning between leaching losses and nitrate retained within the soil profile following the drainage event. The balance calculations demonstrated that both nitrate leaching and nitrate retention increased with increasing nitrate–nitrogen application rate in the two soils. However, substantial differences were observed between the loamy sand soil (
S1) and the sandy clay loam soil (
S2), indicating a strong influence of soil texture on nitrate transport, retention, and overall nitrate recovery.
In the loamy sand soil (S1), the amount of nitrate recovered in the drainage water increased progressively with increasing nitrogen application rate. Nitrate leaching increased from 181.86 mg under the control treatment (R0) to 317.66 mg under R1, 403.02 mg under R2, and 470.70 mg under R3. Relative to the control treatment, nitrate losses increased by approximately 74.7%, 121.6%, and 158.8% under R1, R2, and R3, respectively. These results indicate that increasing nitrate application substantially enhanced nitrate mobility within the coarse-textured soil and increased the quantity of nitrate transported beyond the soil profile during free drainage.
At the same time, the quantity of nitrate retained within the loamy sand profile also increased with increasing nitrogen application rate, although at a considerably lower rate than nitrate leaching. Nitrate retained within the soil profile increased from 128.67 mg under R0 to 175.52 mg under R1, 181.15 mg under R2, and 202.60 mg under R3. Despite this increase in nitrate retention, the proportion of nitrate remaining within the soil profile decreased progressively as nitrogen application rate increased. Approximately 41.4% of the recovered nitrate remained within the soil profile under the control treatment, whereas this proportion decreased to approximately 35.6%, 31.0%, and 30.1% under R1, R2, and R3, respectively. Conversely, nitrate losses through leaching increased from approximately 58.6% of the recovered nitrate under R0 to approximately 69.9% under R3. These results clearly demonstrate that the loamy sand soil became increasingly susceptible to nitrate loss as nitrogen application increased, reflecting its coarse texture, high hydraulic conductivity, and limited capacity to retain dissolved nitrate during drainage.
A different response was observed in the sandy clay loam soil (S2). Although nitrate leaching increased with increasing nitrogen application rate, the magnitude of increase was considerably smaller than that observed in the loamy sand soil. Nitrate leaching increased from 117.61 mg under R0 to 253.28 mg under R1, 259.32 mg under R2, and 260.86 mg under R3. The large increase between R0 and R1 indicates a strong initial response to nitrogen addition; however, further increases in fertilizer application produced only modest increases in nitrate losses through drainage. This behavior suggests that the finer-textured soil possessed a greater capacity to retain additional nitrate within the soil matrix and thereby limit further increases in nitrate transport with drainage water.
The quantity of nitrate retained within the sandy clay loam profile increased markedly with increasing nitrogen application rate. Nitrate retained within the soil profile increased from 88.78 mg under R0 to 133.93 mg under R1, 218.64 mg under R2, and 307.07 mg under R3. The increase in nitrate retention between the lowest and highest nitrogen application rates exceeded 245%, demonstrating the substantial capacity of the sandy clay loam soil to retain dissolved nitrate within the profile. Unlike the loamy sand soil, the proportion of recovered nitrate retained within the soil increased with increasing nitrogen application rate. Retention represented approximately 43.0% of recovered nitrate under R0 and increased to approximately 34.6%, 45.7%, and 54.1% under R1, R2, and R3, respectively. Correspondingly, the proportion lost through leaching decreased from approximately 57.0% under R0 to approximately 45.9% under R3. These results indicate that the sandy clay loam soil retained an increasingly greater proportion of the applied nitrate as fertilizer application increased.
Comparison between the two soils clearly demonstrates the dominant role of soil texture in controlling nitrate fate during free drainage. Under all nitrogen application rates, nitrate losses through leaching were greater in the loamy sand soil than in the sandy clay loam soil. For example, under the highest nitrogen application rate (R3), nitrate leaching reached 470.70 mg in the loamy sand soil compared with only 260.86 mg in the sandy clay loam soil. In contrast, nitrate retained within the soil profile under the same treatment reached 307.07 mg in the sandy clay loam soil compared with only 202.60 mg in the loamy sand soil. These differences reflect the contrasting hydraulic characteristics of the two soils. The larger pore system and greater permeability of the loamy sand soil promoted rapid downward water movement and enhanced nitrate transport beyond the root zone, whereas the greater water-holding capacity and lower permeability of the sandy clay loam soil increased nitrate residence time and promoted retention within the soil profile.
The total recovered nitrate values showed excellent agreement with the total amount of nitrate initially present in the soil system plus the applied nitrate fertilizer. In the loamy sand soil, total recovered nitrate ranged from 310.53 to 673.30 mg, compared with expected values ranging from 312.10 to 675.26 mg. Similarly, in the sandy clay loam soil, total recovered nitrate ranged from 206.39 to 567.93 mg, whereas the corresponding expected values ranged from 207.10 to 570.26 mg. The differences between recovered and expected nitrate quantities remained very small for all treatments, varying from only −0.50 to −1.96 mg in the loamy sand soil and from −0.71 to −2.33 mg in the sandy clay loam soil. These small discrepancies indicate a high degree of nitrate recovery and confirm the reliability of the nitrate balance calculations. The close agreement between measured and expected values further suggests that nitrate losses through processes other than leaching were negligible during the drainage period.
Statistical analysis confirmed that both soil texture and nitrate–nitrogen application rate exerted highly significant effects on nitrate partitioning between leaching losses and nitrate retained within the soil profile (p ≤ 0.01). Nitrate leaching increased significantly with increasing nitrogen application rate, while nitrate retention was strongly influenced by soil texture. The loamy sand soil exhibited significantly greater nitrate losses through leaching, whereas the sandy clay loam soil retained significantly greater amounts of nitrate within the soil profile, particularly under the higher nitrogen application rates. Significant interactions between soil texture and nitrogen application rate were also detected (S × RF), indicating that the response of nitrate transport and retention to increasing fertilizer addition depended strongly on soil hydraulic properties. These findings demonstrate that the fate of nitrate following irrigation and free drainage is governed not only by the amount of nitrate applied but also by the capacity of the soil to retain water and dissolved solutes within the profile. The nitrate balance results demonstrate that increasing nitrate–nitrogen application enhanced both nitrate leaching and nitrate retention in the two soils. However, the relative importance of these processes differed markedly between soil textures. The loamy sand soil lost a larger proportion of nitrate through leaching, whereas the sandy clay loam soil retained a greater proportion within the soil profile. Consequently, soil texture emerged as the primary factor controlling nitrate partitioning and nitrate recovery following free drainage.
3.6.2. Nitrate Balance After Evaporation
The nitrate balance after 83 days of evaporation is presented in
Table 5. The results demonstrated clear effects of both soil texture and sawdust mulching on nitrate retention and loss within the soil profile following the evaporation period. Under non-mulched conditions, both soils exhibited positive nitrate balance values, indicating net increases in soil nitrate content during the evaporation period.
Net nitrate gain ranged from approximately 2.2–7.6% in the loamy sand soil and from 3.9–20.3% in the sandy clay loam soil. In contrast, mulch application resulted in negative nitrate balance values in both soils, indicating net nitrate depletion relative to the initial nitrate content. Under the 2 cm mulch treatment, nitrate loss ranged from approximately 4.3–5.9% in the loamy sand soil and from 4.8–6.5% in the sandy clay loam soil. Increasing mulch depth to 4 cm further increased nitrate depletion, with losses ranging from approximately 4.7–7.0% and 5.4–6.8% in the loamy sand and sandy clay loam soils, respectively. Although mulch application resulted in moderate nitrate depletion, the overall nitrate losses remained relatively limited and generally did not exceed approximately 10% of the initial nitrate content. These results indicate that sawdust mulching substantially improved soil water conservation while causing only limited reductions in nitrate retention within the soil profile. The positive nitrate balance observed under non-mulched conditions can be related to nitrate redistribution and concentration processes occurring during prolonged evaporation, where upward and downward water fluxes influenced nitrate accumulation within the sampled soil profile. In contrast, the negative balance under mulched conditions reflects the modified water movement and reduced evaporative concentration effects associated with surface mulch. The observed balance differences therefore represent changes in nitrate distribution within the soil system rather than simple nitrate gain or loss alone.
In general, the results demonstrate that mulch application altered nitrate balance during evaporation by reducing nitrate accumulation and promoting moderate nitrate depletion, with the magnitude of change depending on both mulch depth and soil texture. Statistical analysis revealed that mulch application significantly affected nitrate balance after evaporation (p ≤ 0.01), whereas soil texture also exerted a significant influence on nitrate retention and depletion patterns within the soil profile. The interaction between mulch depth and soil texture was significant, indicating that the magnitude of nitrate depletion under mulched conditions differed between the loamy sand and sandy clay loam soils. Non-mulched treatments exhibited significantly greater nitrate accumulation within the soil profile compared with the mulched treatments, while increasing mulch depth significantly reduced nitrate accumulation and promoted more stable nitrate distribution during evaporation.
3.7. Composite Sustainability Index (CSI)
A Composite Sustainability Index (CSI) was developed to provide an integrated evaluation of the combined effects of mulch application and soil texture on the major hydrological and chemical processes controlling soil sustainability under arid conditions. While the individual analyses presented in previous sections described the responses of soil water storage, evaporation, salinity, and nitrate dynamics separately, practical soil management decisions often require simultaneous consideration of all these factors. Therefore, a composite index was constructed to integrate multiple sustainability indicators into a single quantitative metric that reflects the overall performance of each treatment.
The
CSI incorporated four principal indicators representing the dominant processes affected by mulch application: soil water conservation, evaporation suppression, salinity control, and nitrate control. Each indicator was normalized to a common scale ranging from 0 to 1, where higher values represented more favorable environmental performance. The normalized indicators were then combined to generate a single sustainability score for each treatment. The resulting
CSI values are presented in
Table 6.
As shown in
Table 6, substantial differences in sustainability performance were observed among mulch treatments and between soil textures. In both soils, the non-mulched treatment (
M0) consistently produced the lowest
CSI values, with scores of 0.19 and 0.17 for the loamy sand and sandy clay loam soils, respectively. These low values reflected the combined effects of poor soil water conservation, weak evaporation suppression, greater salinity accumulation, and unfavorable nitrate redistribution during the evaporation period. The low
CSI values obtained under non-mulched conditions demonstrate the vulnerability of uncovered soils to evaporation-driven degradation processes under arid environments. Application of sawdust mulch substantially improved all sustainability indicators and consequently increased
CSI values in both soils. According to
Table 6, the 2 cm mulch treatment (
M1) increased
CSI from 0.19 to 0.83 in the loamy sand soil and from 0.17 to 0.87 in the sandy clay loam soil. These marked improvements indicate that even a moderate mulch depth effectively enhanced overall soil sustainability through simultaneous improvements in soil water conservation, evaporation suppression, salinity control, and nitrate management.
Table 6 further shows that the 4 cm mulch treatment (
M2) produced the highest
CSI values in both soils, reaching 0.88 in the loamy sand soil and 0.90 in the sandy clay loam soil. The higher scores obtained under
M2 indicate that the thicker mulch layer provided the best overall performance when all sustainability indicators were considered together. However, the improvement achieved by increasing mulch depth from 2 to 4 cm was relatively modest compared with the substantial gains obtained by the initial application of mulch. This trend agrees with the results presented previously for soil water storage (
Table 3), where both mulch treatments markedly improved water conservation relative to the control, whereas differences between the 2 and 4 cm mulch depths were comparatively small. The
CSI results are also consistent with the evaporation, salinity, and nitrate analyses presented in earlier sections. Treatments exhibiting higher soil water storage and lower cumulative evaporation generally produced higher
CSI values. Similarly, treatments that reduced salt accumulation and moderated nitrate redistribution achieved improved sustainability scores. The nitrate-control component of the
CSI was derived from nitrate redistribution patterns observed during the evaporation phase (
Table 5), whereas
Table 4 describes nitrate recovery and mass balance during the free-drainage stage. Consequently, the
CSI integrates information from both the hydrological and chemical responses of the soil system while avoiding reliance on a single indicator.
To evaluate the sensitivity of the
CSI to weighting assumptions, treatment rankings were recalculated using four alternative weighting schemes emphasizing soil water conservation, evaporation suppression, salinity control, or nitrate control. The resulting treatment rankings are presented in
Table 7. As shown in
Table 7, the rankings remained highly stable across all tested scenarios. The sandy clay loam soil with 4 cm mulch (
SCL-
M2) consistently achieved the highest ranking, whereas the non-mulched sandy clay loam treatment (
SCL-
M0) remained the lowest-ranked treatment under all weighting schemes. Only a minor interchange between
LS-M2 and
SCL-M1 was observed when nitrate control received greater weighting, reflecting the slightly superior nitrate-control performance of
SCL-
M1. Overall, the sensitivity analysis demonstrated that the
CSI conclusions were robust and not materially influenced by the weighting assumptions adopted for index construction.
An important advantage of the CSI is its ability to reveal overall treatment performance that may not be fully apparent when individual variables are evaluated separately. For example, some treatments may perform well with respect to water conservation but provide smaller improvements in nitrate control, whereas other treatments may produce more balanced responses across several indicators. By integrating all indicators into a single metric, the CSI facilitates direct comparison among treatments and provides a comprehensive assessment of sustainability performance.
Differences between soil textures were also evident in the CSI values. The sandy clay loam soil consistently achieved slightly higher CSI values than the loamy sand soil under comparable mulch treatments. This behavior reflects the greater water-holding capacity and lower susceptibility to rapid moisture loss characteristic of finer-textured soils. Nevertheless, the relative improvement resulting from mulch application was particularly pronounced in the loamy sand soil, where evaporation losses and moisture depletion were most severe under non-mulched conditions.
The consistency between
Table 6 and the individual results presented in
Table 3,
Table 4 and
Table 5 confirms the robustness of the composite index. Treatments that achieved superior performance in water conservation, evaporation suppression, salinity control, and nitrate management also received the highest
CSI scores. This agreement demonstrates that the CSI successfully captured the integrated response of the soil system to mulch management under arid conditions.
Overall, the CSI provided a practical framework for synthesizing multiple hydrological and chemical indicators into a single sustainability metric. The results demonstrate that sawdust mulching substantially improved overall soil sustainability through its combined effects on conserving soil water, suppressing evaporation, reducing salinity accumulation, and limiting nitrate redistribution. Although the 4 cm mulch treatment produced the highest CSI values, the 2 cm mulch treatment achieved nearly comparable sustainability performance while requiring less mulch material. Therefore, the CSI highlights the potential of moderate sawdust mulch applications to provide efficient and sustainable soil management under arid and semi-arid conditions, while also serving as a useful decision-support tool for evaluating alternative soil conservation practices.