1. Introduction
The global push toward digital transformation has made Information and Communication Technology (ICT) competency a central component of education policy worldwide. The United Nations’ Sustainable Development Goal 4 (SDG 4) calls for inclusive and equitable quality education, and its sub-indicator SDG 4.4.1 specifically tracks the proportion of youth and adults who have demonstrated ICT skills [
1]. For developing countries in the Asia-Pacific region, meeting this target requires not only investment in digital infrastructure but also sustained improvement in teacher capacity to deliver ICT instruction effectively [
2,
3].
Cambodia faces particular challenges in this regard. Despite the Ministry of Education, Youth and Sport (MoEYS) introducing an ICT curriculum for Grades 4 through 12 in 2017, the country’s education system continues to confront a gap between policy ambition and classroom reality [
4]. A World Bank study documented that Cambodian teachers suffered from insufficient content knowledge, inadequate pre-service preparation, and limited access to professional development [
5]. More recent evidence confirms that late-career teachers in Cambodia report infrastructure shortages, time constraints, and language barriers as persistent obstacles to technology integration [
6]. A systematic review of ICT integration in secondary education across developing countries reported infrastructure deficits, training gaps, and low teacher self-efficacy as recurring barriers [
7].
To narrow this policy and practice gap, national policymakers can be advised to pair curriculum mandates with sustained, system-linked teacher development, in-school ICT infrastructure, and continuous professional learning structures rather than one-off training events. Comparable lower- and middle-income countries have pursued similar measures. Lao PDR has adopted national ICT competency standards for teachers [
8], regional ASEAN frameworks promote teacher professional development and mobility [
9], and several systems have tied ICT teacher standards to measurable competency indicators. Framing Cambodia’s reform within these regional responses clarifies why a multi-component, multi-year intervention, rather than isolated infrastructure or training inputs, was adopted in the present project.
International development agencies have responded through Official Development Assistance (ODA) programs that combine infrastructure investment with teacher capacity building. The Korea International Cooperation Agency (KOICA) launched the “Project for ICT Capacity Building of Lower Secondary Education in Cambodia” in 2021, a five-year initiative implemented in partnership with MoEYS. The project adopted a multi-component approach encompassing curriculum reform aligned with the UNESCO ICT Competency Framework for Teachers (ICT CFT) [
2], development of nine RTTC-level textbooks and three sets of Grade 7–9 student textbooks and teacher guides, construction of 48 ICT laboratories across four provinces (Kampong Cham, Kandal, Prey Veng, and Takeo), and a structured teacher training program encompassing both pre-service teacher educators at RTTCs and in-service teachers at 20 pilot schools [
10,
11].
Previous research on this project established the design rationale for the ICT curriculum [
10] and reported short-term training effects using a pre–post design with 20 teachers [
11]. Song [
11] found statistically significant improvements in 7 of 11 SDG 4.4.1 domains on self-report measures but noted that objective assessments yielded more conservative results, raising questions about measurement validity and the durability of short-term gains. What remains unexamined is whether the broader, multi-year intervention, incorporating curriculum reform, infrastructure deployment, and repeated training cycles, produces measurable competency gains when assessed through a baseline–midline framework that covers a larger and more differentiated sample.
This study addresses that gap by examining changes in teacher ICT competency indicators from baseline to midline and subgroup patterns at midline. It poses four research questions. RQ1 examines change across the 11 SDG 4.4.1 domains. RQ2 compares the midline profiles of pre-service and in-service teachers in light of their different training pathways. RQ3 examines regional differences across the four target provinces. RQ4 examines patterns in student objective assessment performance and the limits of the conclusions that can be drawn. Each question is interpreted within the constraints of the monitoring design.
2. Literature Review
2.1. UNESCO ICT Competency Framework and International Standards
The UNESCO ICT Competency Framework for Teachers, now in its third version, provides a widely adopted reference for defining and assessing teacher ICT competencies [
2]. The framework is organized into three progressive stages (Technology Literacy, Knowledge Deepening, and Knowledge Creation), spanning six domains that together yield 18 competencies and 64 performance objectives. Countries across the Asia-Pacific region, including Lao PDR [
8] and several ASEAN member states [
9], have adapted this framework to develop national ICT teacher standards. The Southeast Asia Teachers Competency Framework (SEA-TCF), endorsed by education ministers from 11 countries including Cambodia, further contextualizes these standards for the regional setting [
3].
SDG indicator 4.4.1 operationalizes ICT competency measurement by tracking the proportion of youth and adults who have performed specific ICT activities within a reference period [
12]. The UNESCO Institute for Statistics defines the indicator across five activity domains (communication, problem-solving, safety, content creation, and information literacy). For the present study, these domains are mapped onto 11 sub-indicators (SDG 4.4.1.1 through 4.4.1.11), following the operational definitions used by Song [
11] and aligned with the ITU ICT literacy measurement framework.
2.2. Teacher Professional Development in Developing Countries
Research on teacher professional development (PD) in low-income countries highlights both the potential and the limits of training interventions. A meta-analysis of 128 high-quality studies reported mean effect sizes of
g = 0.71 at the teacher level but only
g = 0.19 at the student achievement level [
13], indicating that teacher-level gains do not automatically translate into improved student learning. The Global Partnership for Education [
14] has emphasized that effective PD requires sustained engagement of 30 to 100 h over at least six months, with one-off workshops and cascade models showing limited impact. Design features associated with higher effect sizes include performance-based criteria, self-regulated learning activities, coaching, and collaborative teacher structures [
15].
In this review, teacher professional development (TPD) refers to the structured and ongoing set of formal and school-based learning activities, namely pre-service coursework, in-service workshops, continuous professional development (CPD), and professional learning communities (PLCs), through which teachers acquire and refine the knowledge and practices required for effective instruction. This definition is adopted because TPD is used in the literature with varying scope, and the present intervention spans both pre-service and in-service pathways.
In Southeast Asia, OECD TALIS data show that 50–60% of lower secondary teachers report participating in ICT-related PD, though the depth and relevance of such training vary [
16]. UNESCO Bangkok [
17] found that while teachers across the region receive general professional training, subject-specific and technology-focused coaching remains scarce. These patterns are consistent with findings from Vietnam [
18], Lesotho [
19], and Kazakhstan [
20], where studies document persistent gaps between policy goals for teacher ICT integration and the actual support provided.
2.3. ODA-Based Education Programs and Evaluation Frameworks
The effectiveness of ODA investments in education has been subject to rigorous scrutiny. World Bank analyses indicate that aid directed toward teacher training and facility construction yields the strongest effects on education quality, though overall ODA impact on learning outcomes remains modest [
21]. Kirkpatrick’s four-level evaluation model (reaction, learning, behavior, and results) provides a standard framework for training program assessment [
22], and several ODA agencies have adapted this model for developing-country contexts.
Cambodia-specific evidence from RTI International [
23] documents that sustainable system strengthening requires multi-year government collaboration progressing through capacity development, piloting, and institutionalization. The KOICA project under study follows a similar trajectory. The first two years focused on curriculum design and initial teacher training in Korea, the third year expanded to local training and infrastructure deployment, and the fourth and fifth years shifted toward textbook approval, classroom implementation, and baseline–midline assessment [
10,
11].
2.4. The Technological Pedagogical Content Knowledge (TPACK) Framework
Mishra and Koehler’s TPACK framework [
24] provides a theoretical lens for understanding how teachers integrate technology into instruction. The framework posits that effective technology use requires the intersection of technological knowledge (TK), pedagogical knowledge (PK), and content knowledge (CK). Jeon, Jeong, and Song [
10] drew on this framework when designing the RTTC curriculum, ensuring that ICT courses addressed not only technical skills but also pedagogical applications and content-area connections.
A systematic review of TPACK development through lesson study [
25] confirmed that iterative cycles of practice and reflection are central to building integrated technology competence. This finding aligns with the project’s use of continuing professional development (CPD) workshops and professional learning community (PLC) structures to support teachers beyond initial training.
Tools for assessing teacher digital competency have undergone rapid development [
26,
27], with increasing attention to construct validity and cross-cultural applicability. The present study contributes to this literature by applying SDG 4.4.1-aligned self-assessment instruments within the specific context of a multi-year, multi-component ODA intervention in Cambodian lower secondary education.
These strands form a single logic model for the present study. SDG 4.4.1 supplies the measurable competency indicators, that is, the “what”. TPACK and the TPD literature explain how structured and sustained training is expected to develop teacher competency, that is, the how. The ODA and sustainability literature situates the intervention as a system-linked, multi-component reform intended to be institutionally durable, that is, the why and for how long. Rather than treating these perspectives in parallel, the study uses them jointly. Training inputs from TPD and TPACK are expected to register as baseline to midline change in SDG 4.4.1 indicators, interpreted as monitoring evidence of progress toward sustainable and system-level capacity.
3. Materials and Methods
3.1. Study Design and Context
This study is situated within the Project for ICT Capacity Building of Lower Secondary Education in Cambodia, a KOICA-funded initiative (2021–2026) implemented in partnership with Cambodia’s MoEYS. The project operates across four provinces (Kampong Cham, Kandal, Prey Veng, and Takeo), targeting four RTTCs and 20 ICT pilot schools.
The project operates in four provinces, located in Cambodia’s central and southeastern lowland plains. These provinces share broadly comparable structural characteristics relevant to interpreting the regional results. All four have predominantly Khmer populations and follow the same nationally centralized MoEYS curriculum, textbooks, and teacher-deployment system. Their economies are largely agricultural, with rice cultivation dominant outside the provincial towns. Kandal, which surrounds Phnom Penh, is the most peri-urban and has comparatively better transport and digital infrastructure. Kampong Cham is among the most populous provinces and contains a regional urban center on the Mekong. Prey Veng and Takeo are predominantly rural and agricultural with more limited connectivity. Household computer access is low across all four provinces, so student ICT practice is largely confined to school laboratories.
The study used a monitoring design with measurements at baseline and midline. It documented changes in SDG 4.4.1 indicators and examined subgroup and regional patterns at midline. The same target panel of teachers was assessed at both points. The anonymized data did not contain identifiers that allowed individual records to be linked, so change was analyzed at the aggregate level. The study did not use random assignment. Group and regional comparisons were therefore treated as descriptive, and the findings were interpreted as evidence from program monitoring.
Evaluation designs with baseline, midline, and endline measurements are widely used when random assignment is not feasible [
28]. The SEA-PLM project tracked primary learning metrics across seven Southeast Asian countries from 2019 to 2023 and provides a regional precedent for repeated measurement and survey refinement. These designs do not establish causal effects with the rigor of randomized trials. They can nevertheless monitor trends, identify subgroup patterns, and generate hypotheses for further study.
3.2. Participants
Two participant groups were included in the baseline–midline assessment.
The teacher sample included 40 participants. Twenty were pre-service teacher educators based at RTTCs, and 20 were in-service ICT teachers at the pilot schools. Pre-service teachers completed three semesters of university ICT coursework in Korea and were responsible for training later cohorts. In-service teachers were practicing classroom teachers who received repeated training through CPD workshops and coaching at their schools.
The student sample included 4535 Grade 8 students enrolled across the 20 pilot schools in December 2025. They had entered Grade 7 in 2024, completed one academic year of the revised ICT curriculum, and were assessed after entering Grade 8. The sample included 2160 male students and 2375 female students from Kampong Cham, Kandal, Prey Veng, and Takeo. A separate group of 4799 newly enrolled Grade 7 students was surveyed in December 2025 as the baseline for the next cycle. This group is used as a cross-sectional reference in
Section 4.5 and is not part of the primary comparison. Students completed an objective assessment with 39 items across SDG 4.4.1.1, 4.4.1.3, and 4.4.1.11. Scores could range from 0 to 39. The highest observed score at midline was 30.
3.3. Program Description and Intervention Logic
The intervention combined five components. Curriculum reform redesigned the two-year RTTC ICT teacher preparation curriculum as a 50-credit program covering computing fundamentals, data communication, educational multimedia, programming, databases, ICT-based STEAM education, and digital literacy [
10]. Textbook development produced nine RTTC textbooks and three sets of student textbooks and teacher guides for Grades 7 to 9. All materials were approved by the MoEYS Education Material Approval Board. Infrastructure development constructed and equipped 48 ICT laboratories. Training was delivered in several rounds to teacher educators at RTTCs and teachers at pilot schools through intensive courses in Korea, workshops in Cambodia, continuing professional development, and an ICT festival. Institutional support involved MoEYS officials in policy coordination and established professional learning communities across the pilot schools.
These components formed a single chain of intervention logic rather than separate inputs. Curriculum reform defined the target competencies. Textbooks and ICT laboratories provided aligned materials and opportunities for practice. Repeated training and professional learning communities developed teacher capacity. Institutional support embedded the reform within MoEYS structures. Delivery from 2021 to 2026 was supported by standardized curricula, approved textbooks, scheduled training, attendance records, CPD records, and monitoring of professional learning communities. The aligned inputs were expected to produce measurable changes in teacher SDG 4.4.1 indicators.
3.4. Instruments
For teacher self-assessment, the instrument consisted of items aligned with 11 SDG 4.4.1 sub-indicators, each measuring a specific ICT competency domain:
SDG 4.4.1.1, Uploading files and folders to cloud storage
SDG 4.4.1.2, Selecting appropriate tools for digital communication
SDG 4.4.1.3, Using basic arithmetic formulas in a spreadsheet
SDG 4.4.1.4, Identifying hardware and device types (e.g., input and output devices)
SDG 4.4.1.5, Downloading, installing, and configuring software
SDG 4.4.1.6, Creating presentations using presentation software
SDG 4.4.1.7, Transferring files between devices and cloud storage
SDG 4.4.1.8, Setting up security features (e.g., passwords, access controls)
SDG 4.4.1.9, Understanding digital footprint and protecting personal data
SDG 4.4.1.10, Verifying the reliability of online information
SDG 4.4.1.11, Writing a computer program or code
Each domain was assessed with one item on a four-point competency scale. Teachers reported their level of competency, and the total self-assessment score ranged from 11 to 44. The instrument was administered in Khmer and English.
Teachers also completed an objective ICT knowledge test with 39 multiple-choice items distributed across the same 11 SDG 4.4.1 domains. The total score from this test was used for the comparisons between teacher groups and provinces. It was not the self-assessment total.
The project developed the self-assessment instrument to align directly with the 11 SDG 4.4.1 indicators used for monitoring. General measures of teacher digital competence do not map directly onto these indicators [
26,
27,
29]. Each item described a concrete ICT task. Items were drafted in English, translated into Khmer, translated back into English, and reviewed by specialists in ICT and computer education. The instrument was refined before field administration. A parallel observation rubric covered the same domains. This close alignment supports content validity. Internal consistency was not estimated in the present sample and is acknowledged as a limitation.
For practical observation, specialists in ICT and computer education used a parallel rubric to assess classroom activity and task performance in the same 11 domains. Each domain included three criteria rated from 1 to 3. The 33 ratings produced a total score from 33 to 99.
Students completed an objective test with multiple-choice items covering SDG 4.4.1.1, 4.4.1.3, and 4.4.1.11. The maximum score was 39. They also completed one self-assessment item for each domain on a four-point competency scale. Higher values indicated higher perceived competency. Students met the threshold for a domain when their self-assessment rating was at least 3 and their score on the objective items for that domain was at least 60%.
3.5. Data Collection and Analysis
Baseline data were collected in December 2024 after ICT laboratories had been deployed and the initial teacher training had been completed. Midline data were collected from November to December 2025 after additional CPD workshops, the ICT festival, and one full academic year of Grade 7 ICT curriculum implementation. The interval was approximately 12 months.
Data were analyzed in Python 3.13.5 using pandas 2.2.3, NumPy 2.3.5, SciPy 1.17.0, and Matplotlib 3.10.8. Descriptive statistics were calculated for the teacher and student scores used in the analysis. Shapiro–Wilk tests examined the score distributions. Changes from baseline to midline were summarized with pass counts for each domain and percentage changes. Teachers met the threshold for a domain when they reported a self-assessment rating of at least 3, achieved at least 60% on the corresponding objective test items, and received a rating of 3 on all three practical observation criteria. Students met the threshold when they reported a self-assessment rating of at least 3 and achieved at least 60% on the corresponding objective test items.
Objective ICT knowledge scores were compared between pre-service and in-service teachers using Welch’s t test. Cohen’s d described the magnitude of the difference. The Mann–Whitney U test served as a nonparametric check. The same methods were used for practical observation totals. Differences across the four provinces were examined with analysis of variance. Levene’s test assessed equality of variances, and eta squared described the effect size. Student results were summarized descriptively.
The significance level was set at 0.05. All statistics were reported according to APA 7th edition conventions.
The objective ICT knowledge score was the primary group outcome. Welch’s correction was used without an adjustment for multiple comparisons. The Mann–Whitney U test served as a nonparametric check. Comparisons of the 11 self-assessment items were secondary and used a Bonferroni adjusted significance level of 0.0045. Results for individual items were interpreted mainly as descriptive because the four-point responses were ordinal, bounded, and nonnormal. Student analyses were descriptive. The absence of linkage identifiers prevented paired analyses and analyses of individual growth.
During the preparation of this manuscript, the authors used Claude Code (Anthropic, Claude 4.5 Agent) and ChatGPT (OpenAI, GPT-5.5 Pro) to assist with statistical code development and verification in Python. The authors reviewed and edited all output and take full responsibility for the content of this publication.
4. Results
4.1. Descriptive Statistics for Individual Items
Table 1 presents descriptive statistics for the 11 self-assessment items and two total scores at midline. The first total is the sum of the self-assessment items. The second is the total score on the objective ICT knowledge test. Higher self-assessment scores indicate higher perceived competency.
File management had the highest mean score, with M = 3.82 and SD = 0.45. Security followed with M = 3.75 and SD = 0.49. Coding had the lowest mean at 2.90, followed by privacy at 3.02 and information verification at 3.18. Several items showed pronounced negative skewness. File management had a skewness of −2.639 and messaging had a skewness of −2.149, which indicates ceiling effects. All 11-item distributions departed from normality. Shapiro–Wilk W values ranged from 0.443 to 0.806 and all p values were below 0.001. The self-assessment total had M = 38.15, SD = 4.78, a range from 23 to 44, and Mdn = 39.0. The objective ICT knowledge test total had M = 28.65 and SD = 4.32. Scores ranged from 15 to 35. This mean was 73.5% of the possible 39 points. The departure from normality was milder for the objective test, with W = 0.940 and p = 0.034.
4.2. Comparison of Baseline and Midline
Table 2 compares the number of teachers who met the competency threshold at baseline and midline in each SDG 4.4.1 domain. Teachers met the threshold only when they satisfied all three criteria. They needed a self-assessment rating of at least 3, a score of at least 60% on the corresponding objective test items, and a rating of 3 on all three practical observation criteria.
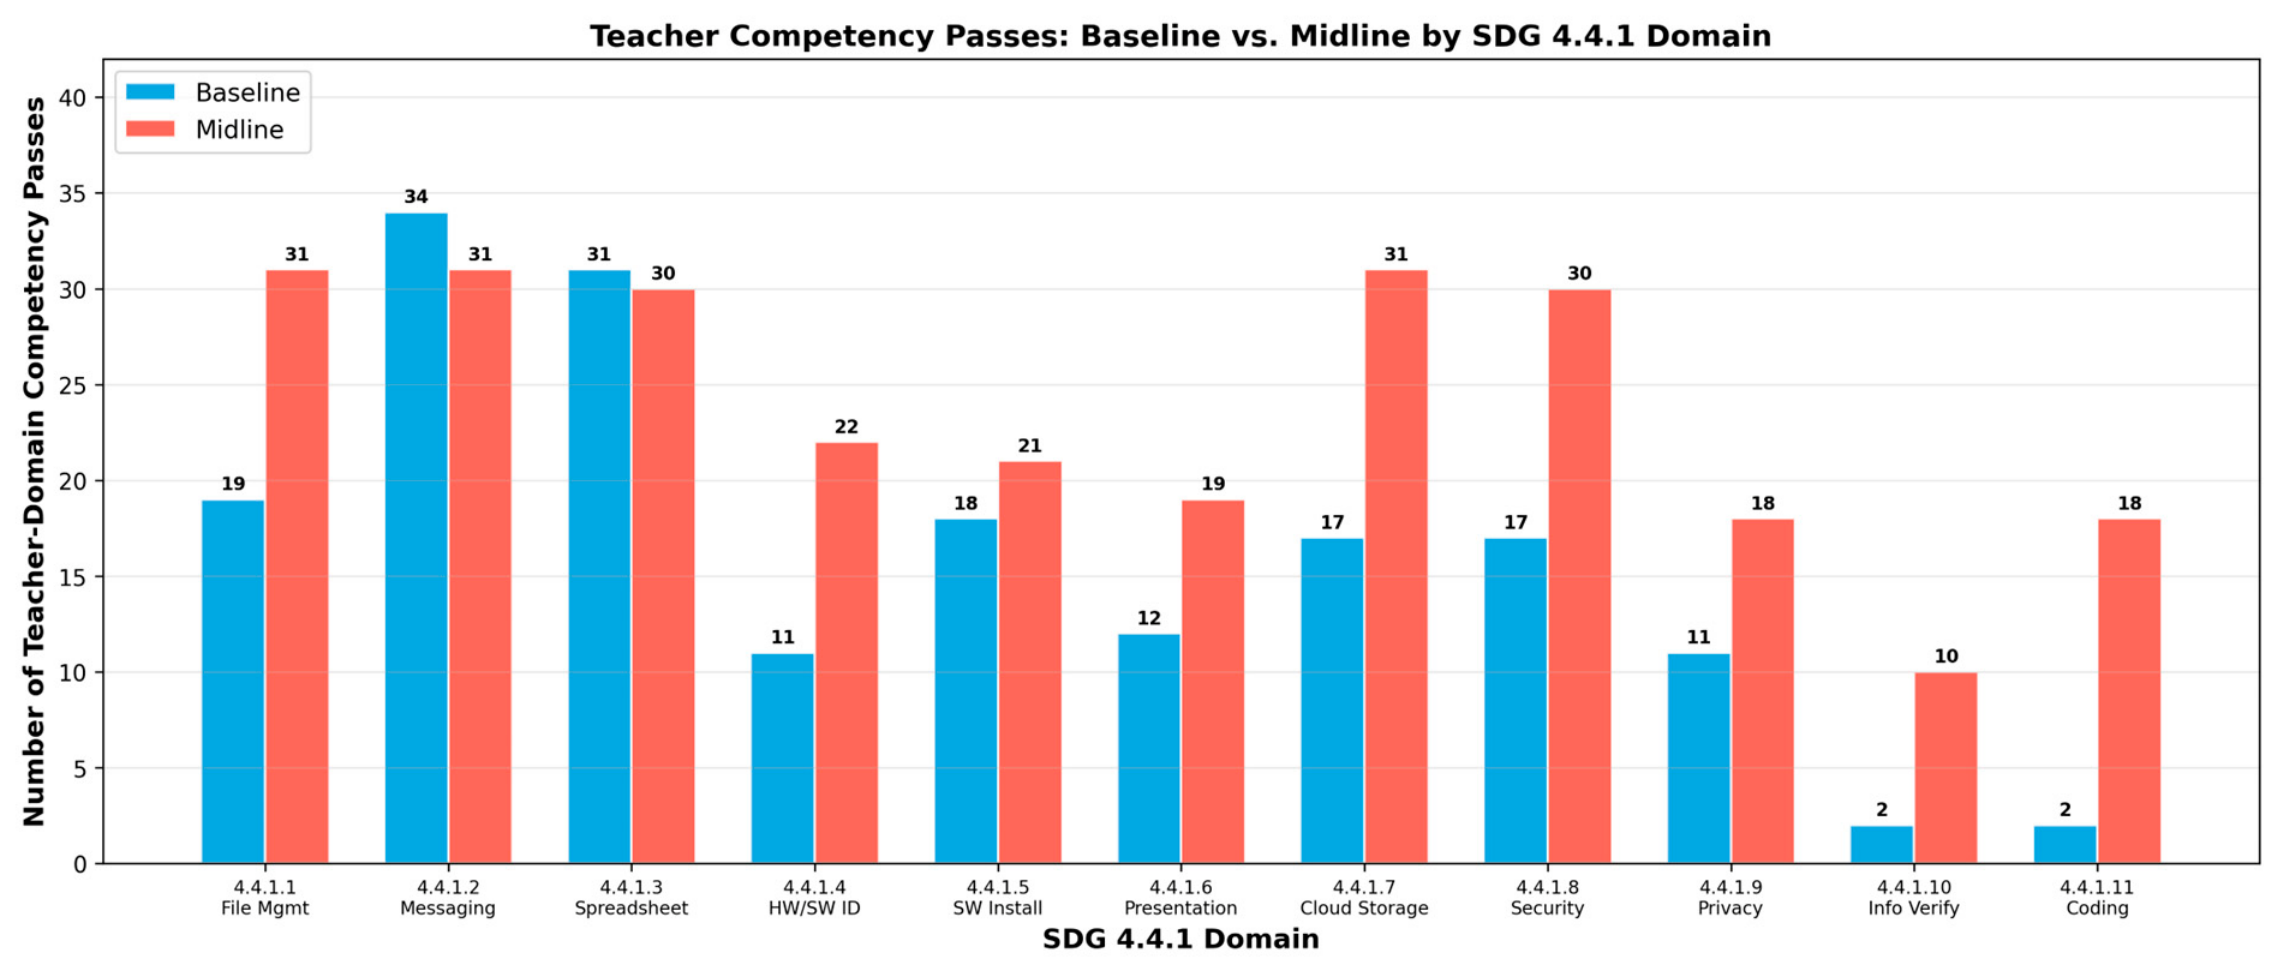
Across the 11 domains, teacher competency passes increased from 174 of 440 possible passes at baseline to 261 at midline. This was an increase from 39.5% to 59.3%, or 19.8 percentage points. Nine domains improved. Messaging and spreadsheet skills showed small declines. The largest gains were found in coding, which rose from 2 to 18 teachers, and information verification, which rose from 2 to 10 teachers (
Figure 1).
4.3. Comparison of Pre-Service and In-Service Teachers
Table 3 compares pre-service and in-service teachers on the 11 self-assessment items and the objective ICT knowledge test total. Welch’s correction was applied to the objective test because the group variances differed. The table reports means, standard deviations, mean differences, test statistics, effect sizes, and 95% confidence intervals.
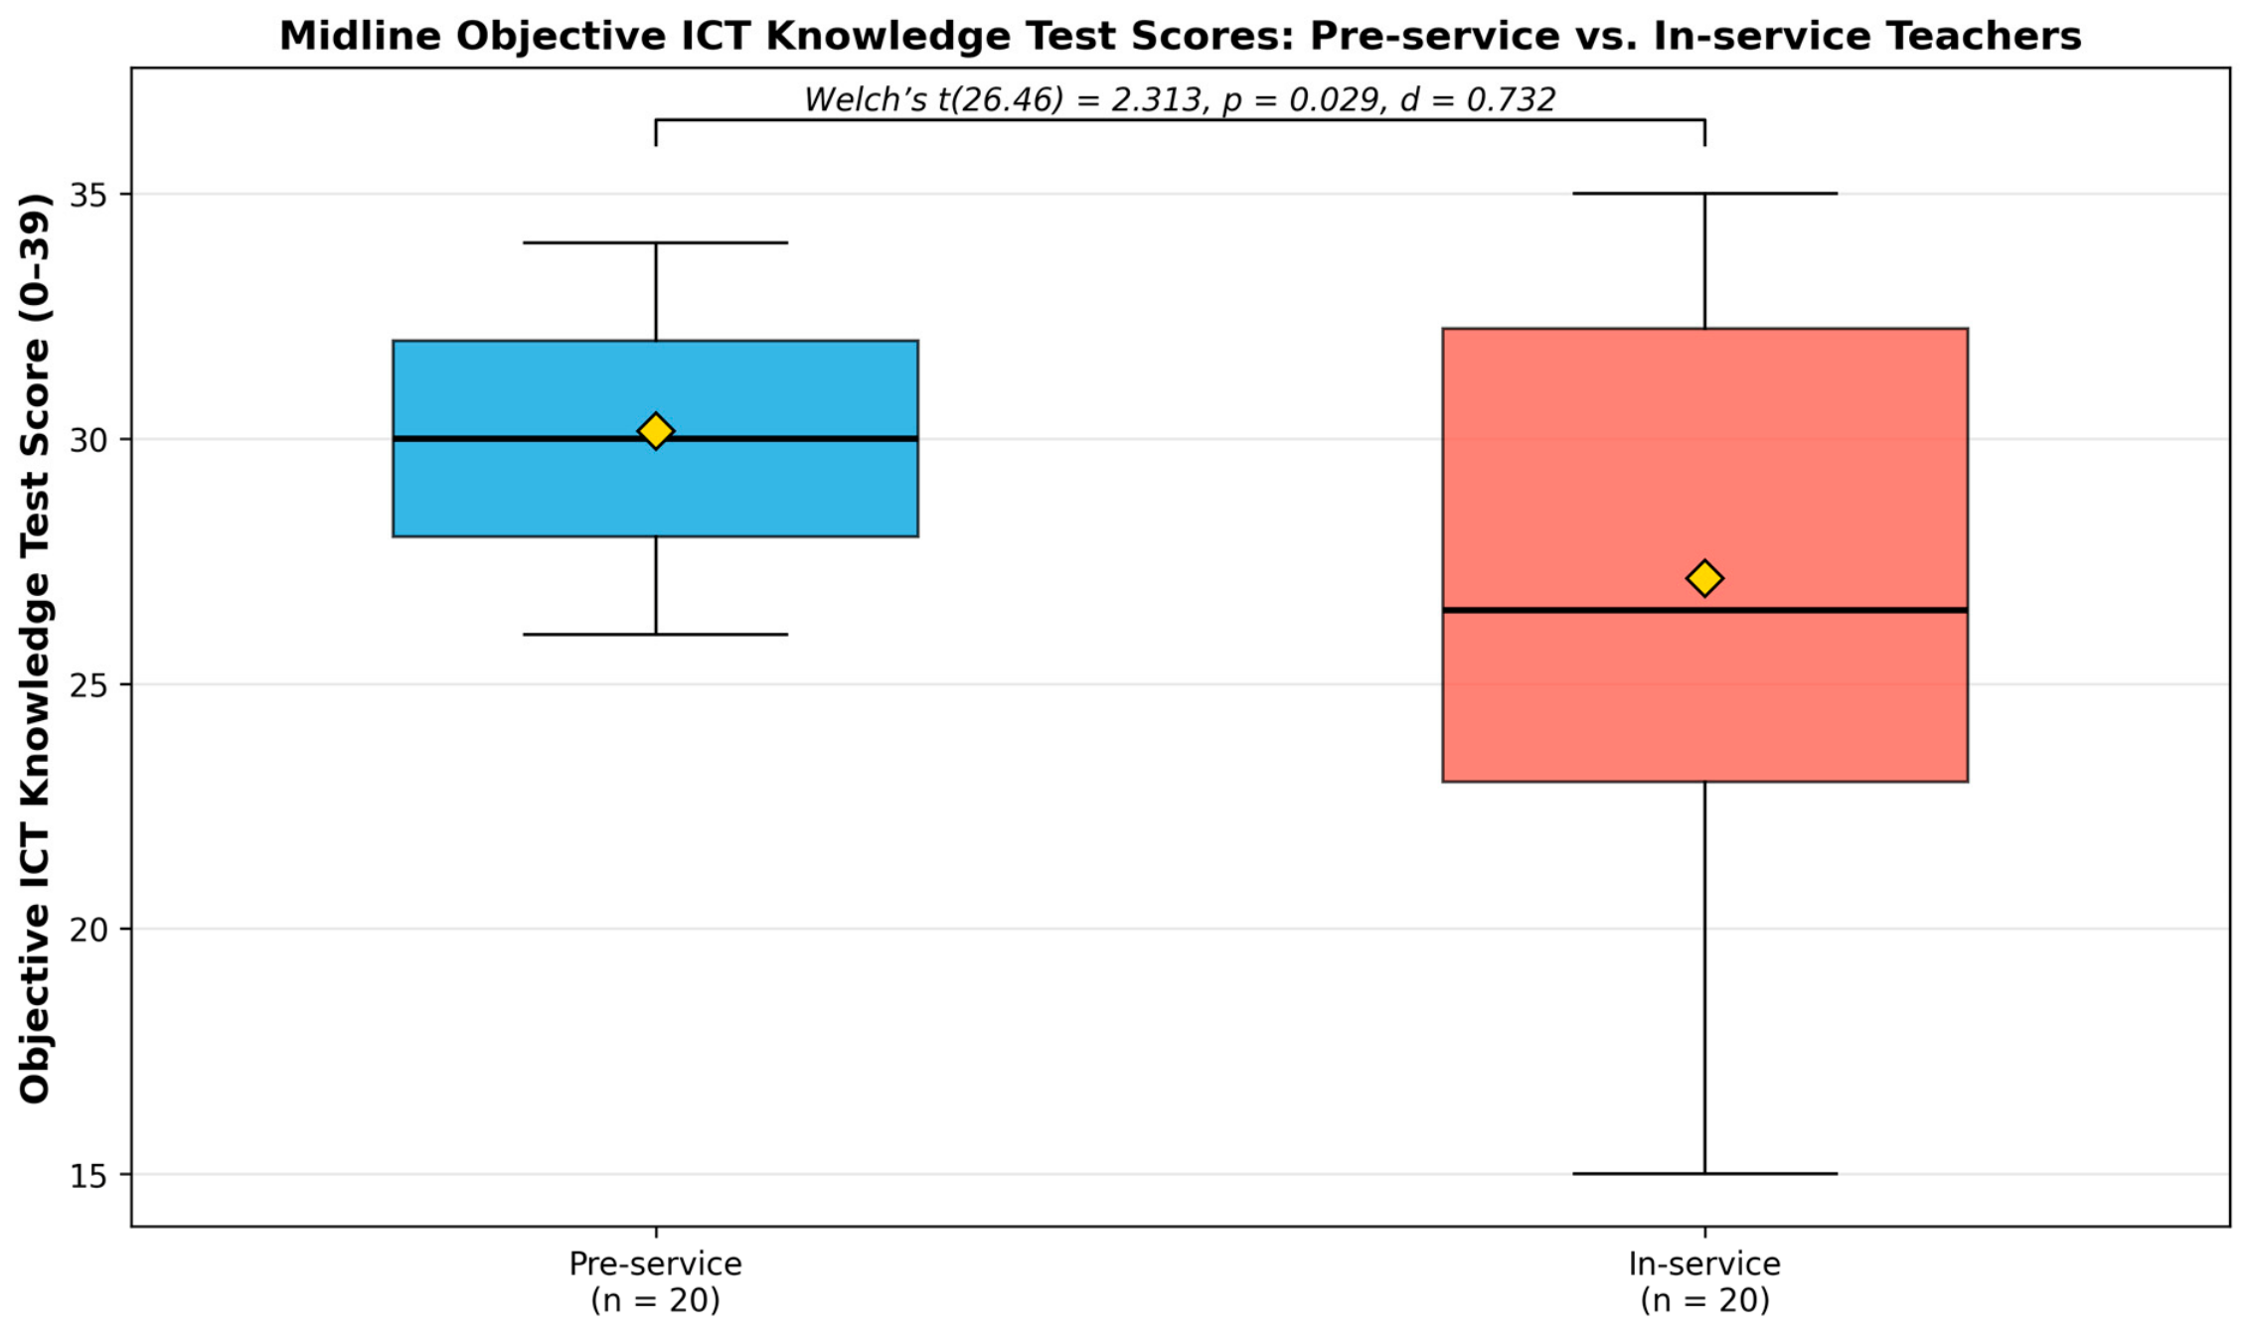
Pre-service teachers had higher objective ICT knowledge scores than in-service teachers. Their means were 30.15 and 27.15, respectively. Welch’s
t(26.46) = 2.313 with
p = 0.029. The mean difference had a 95% CI [0.34, 5.66], and Cohen’s
d = 0.732 indicated a moderate to large difference. The Mann–Whitney
U test showed the same direction but did not reach the 0.05 level, with
U = 269.00 and
p = 0.063. The pre-service group also showed less variability (
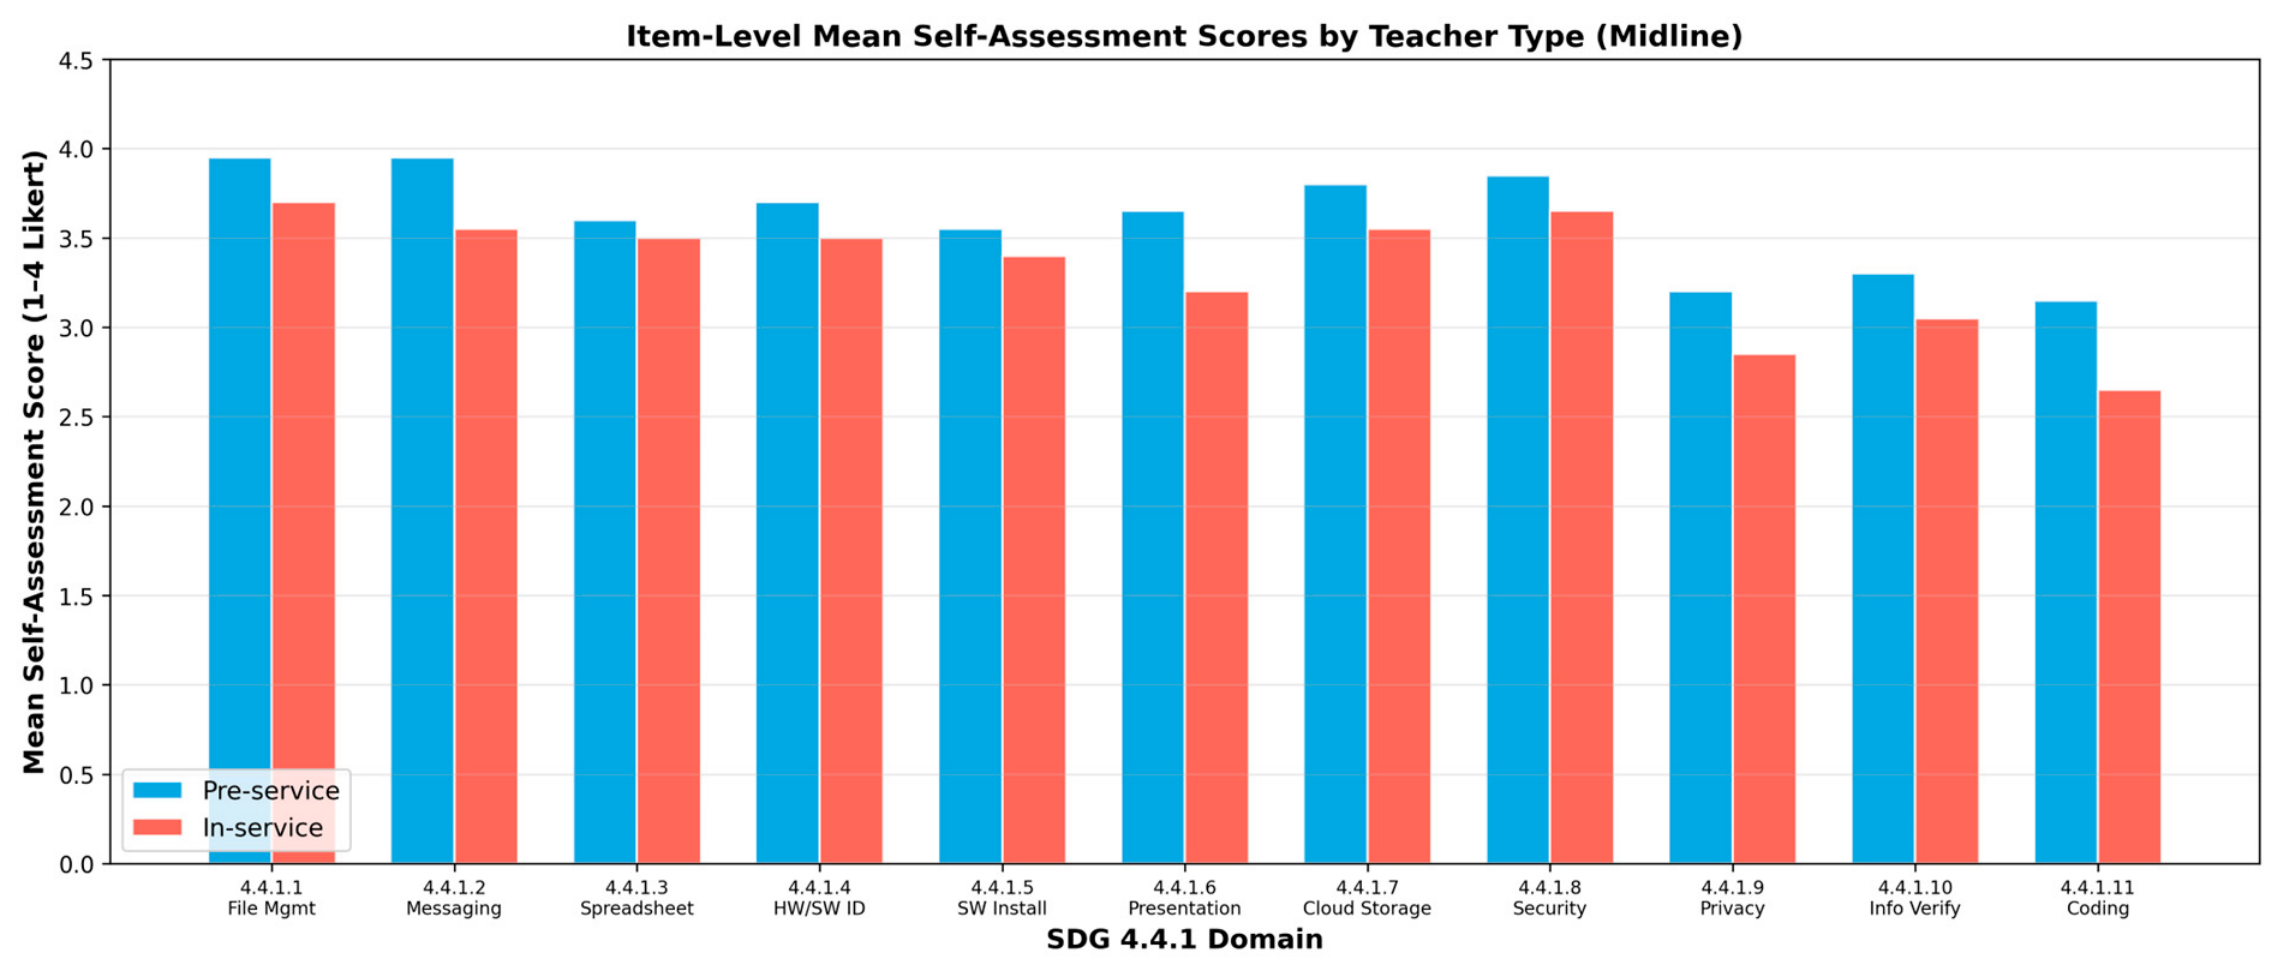
Figure 2). Mean self-assessment scores were higher for pre-service teachers on all 11 items. None met the Bonferroni adjusted level of 0.0045. The largest differences were found for coding, messaging, and presentation. Coding had the largest effect with
d = 0.852, but the adjusted threshold was not met (
Figure 3).
The practical observation total provided a complementary expert rating. The overall mean was 88.80 with SD = 9.64 and scores from 51 to 99. Pre-service teachers had a mean of 93.75 and in-service teachers had a mean of 83.85. Welch’s t (25.42 = 3.754 with p < 0.001, and Cohen’s d = 1.187 indicated a large difference. The Mann–Whitney U test also produced p < 0.001).
4.4. Regional Comparison by Province
Analysis of variance compared the objective ICT knowledge test total across Kampong Cham, Kandal, Prey Veng, and Takeo. Each province contributed 10 teachers. The analysis was also conducted for the 11 self-assessment items. Levene’s test supported equality of variances for all variables. For the objective test total, F(3, 36) = 0.628 and
p = 0.602.
Table 4 reports the analysis of variance, and
Table 5 presents descriptive statistics for the objective test total.
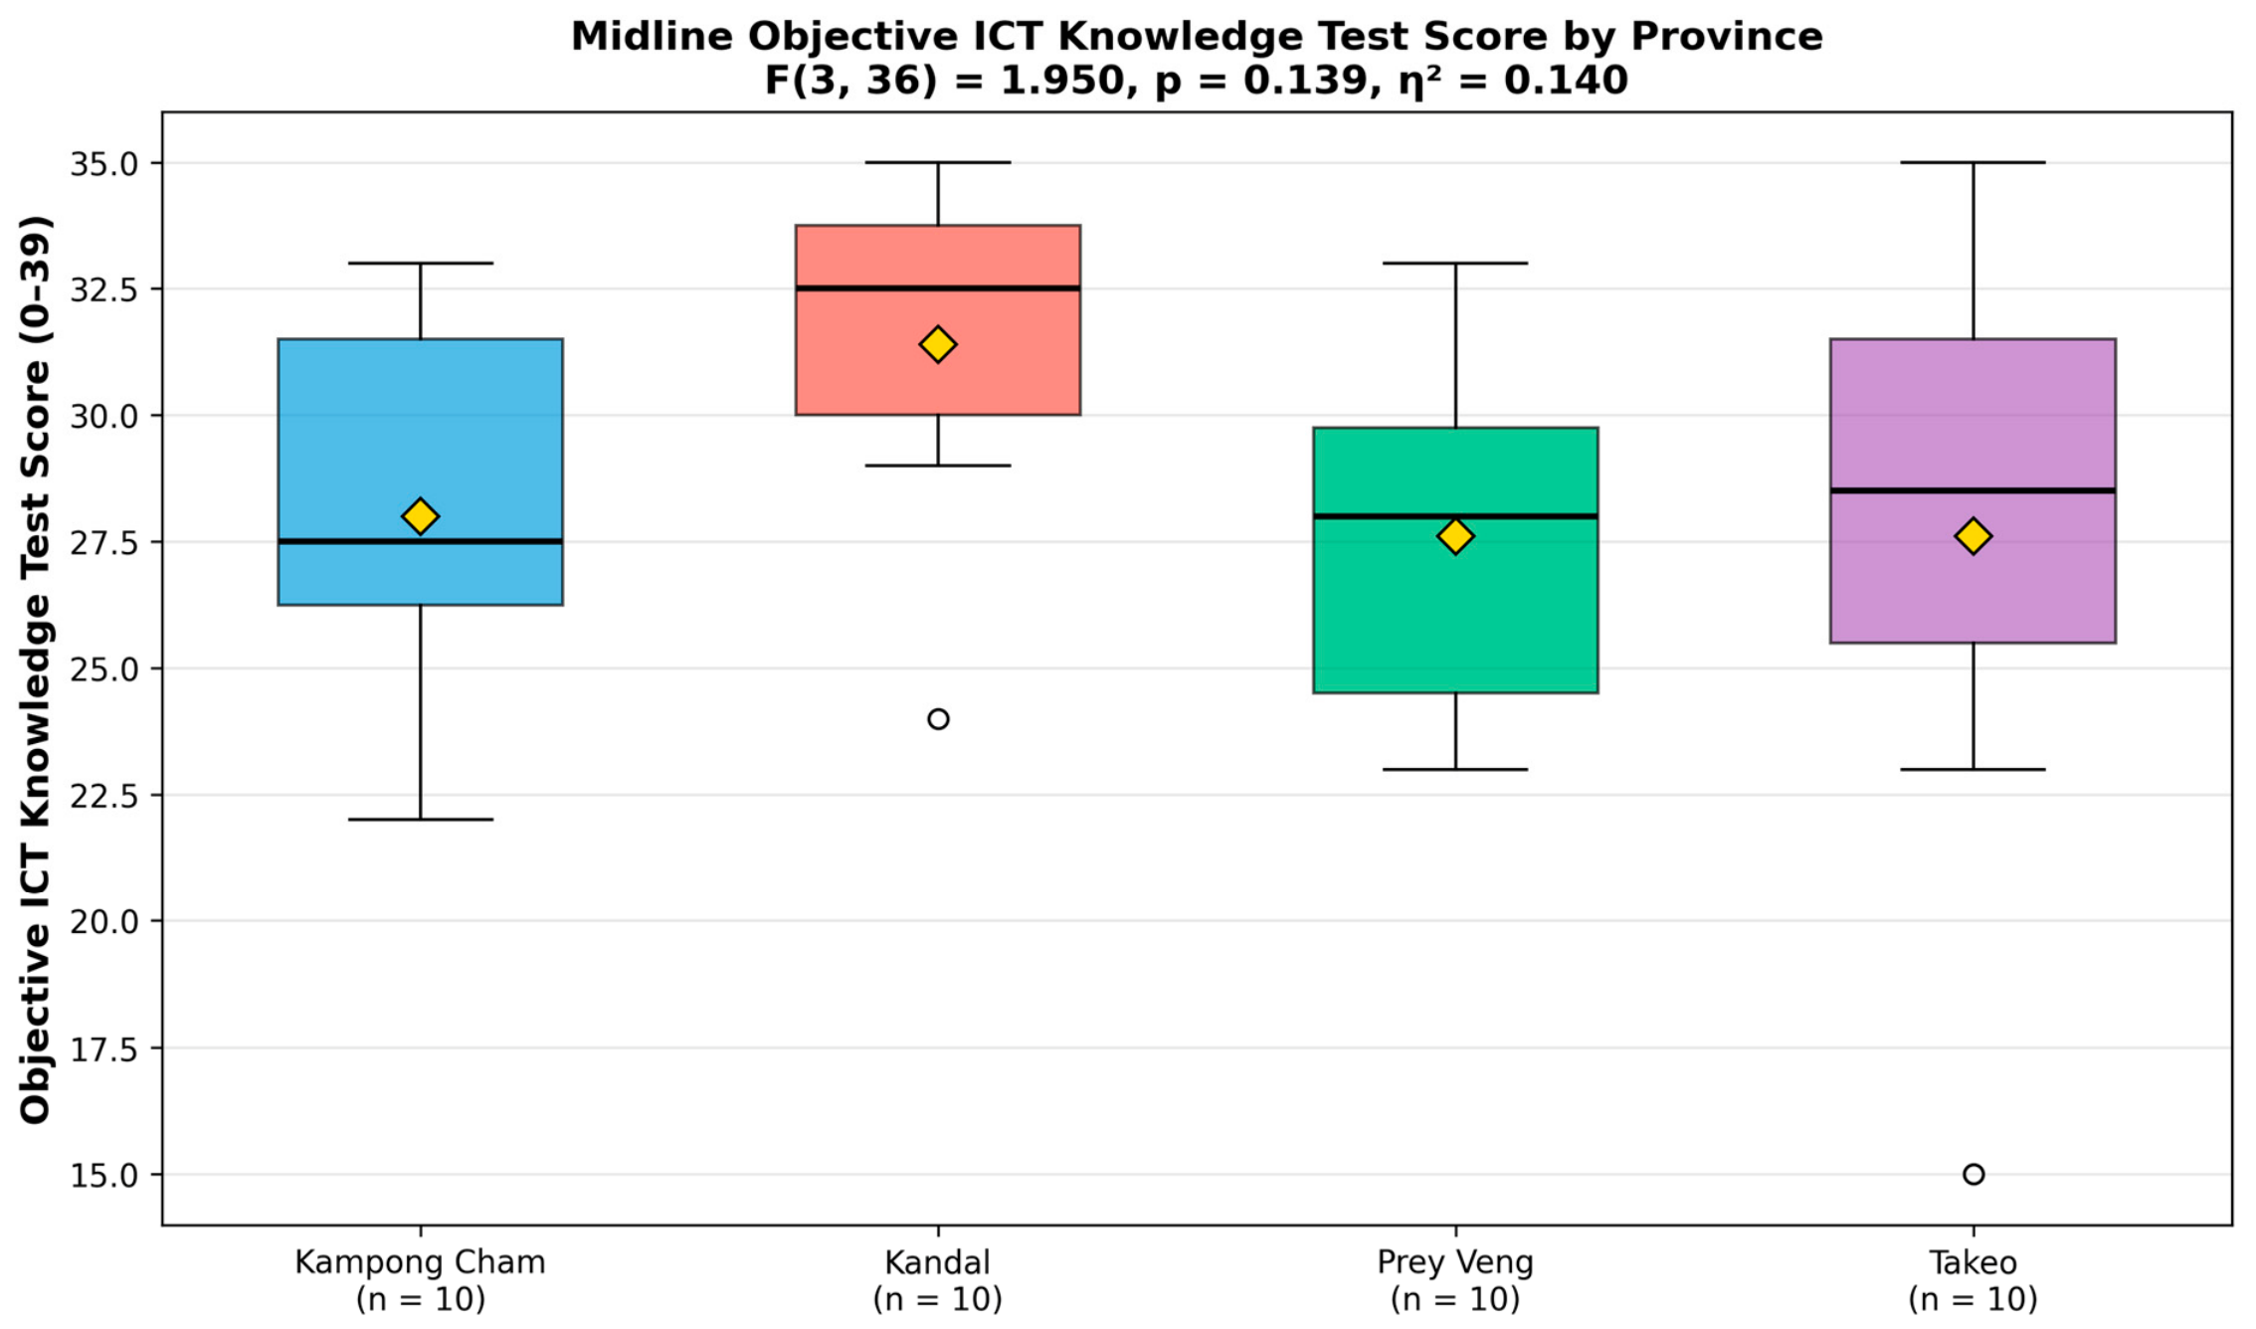
No statistically significant provincial differences were detected for the individual self-assessment items or the objective ICT knowledge test total. For the objective test total, F(3, 36) = 1.950, p = 0.139, and η2 = 0.140. Only 10 teachers were included from each province, which limited statistical power.
Figure 4 shows the score distributions by province. Kandal had the highest mean, but the difference was not statistically significant.
4.5. Student Achievement
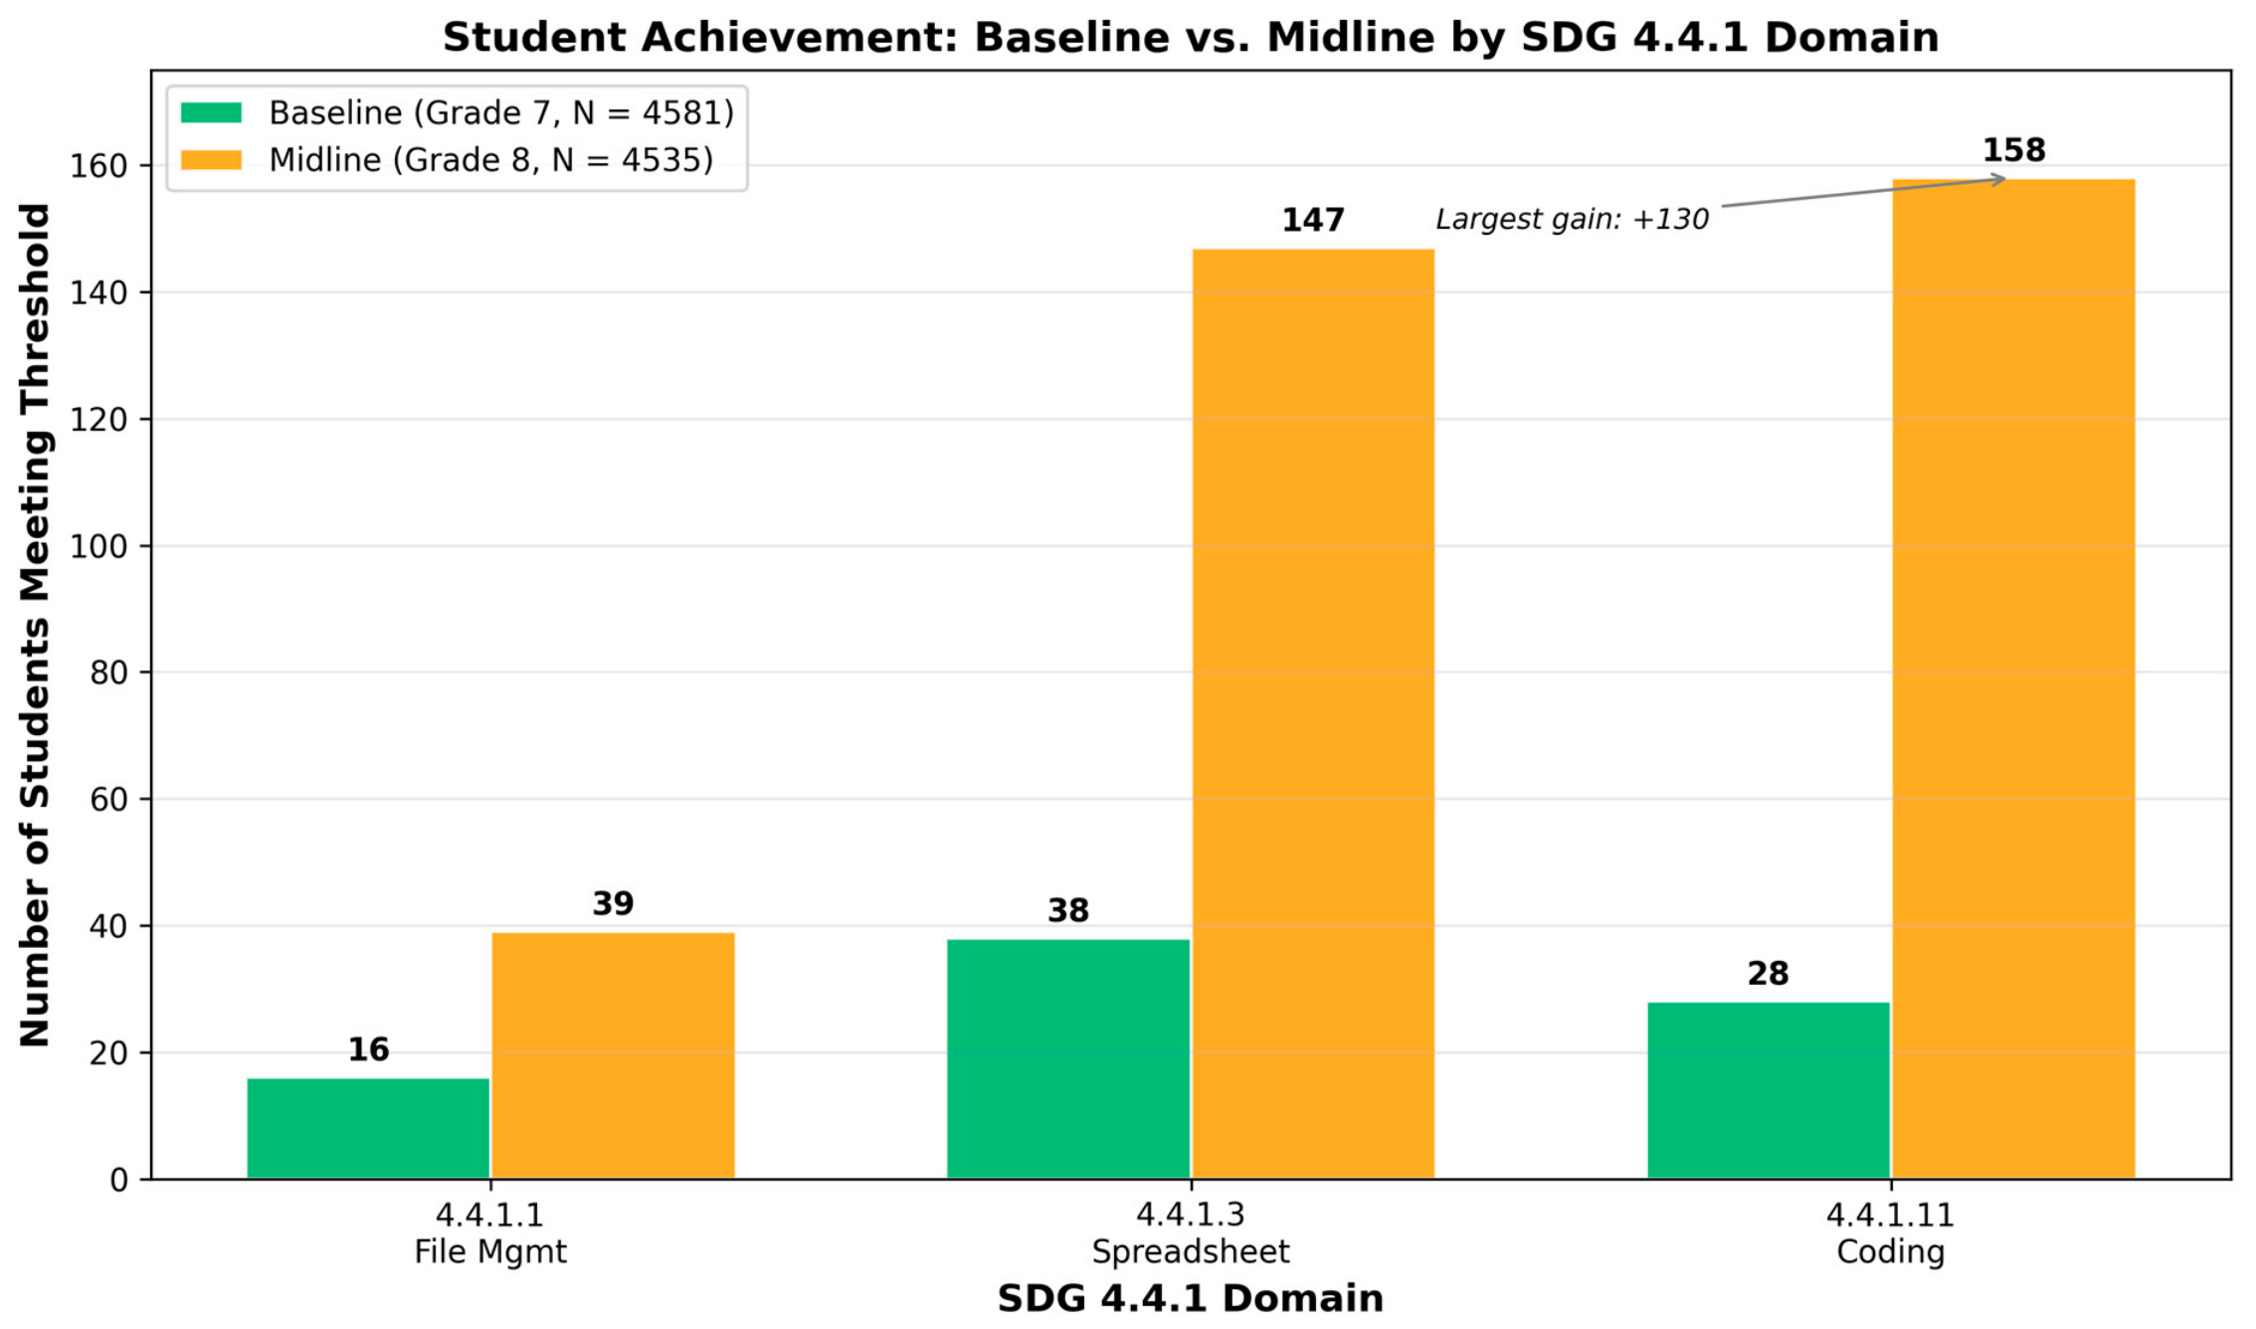
At midline, 4535 Grade 8 students achieved a mean of 8.37 out of 39 points. The standard deviation was 5.05, the median was 9.00, and observed scores ranged from 0 to 30. The distribution had slight positive skewness of 0.22. The Shapiro–Wilk statistic was 0.975 with p < 0.001. The mean corresponded to 21.5% of the possible score and indicated an early level of mastery. File management increased from 16 to 39 students, spreadsheet arithmetic increased from 38 to 147, and coding increased from 28 to 158. Coding had the largest increase at 130 students. The midline rates for these domains were 0.86%, 3.24%, and 3.48%. The corresponding baseline rates were 0.35%, 0.83%, and 0.61%. The baseline cohort included 4581 students and the midline cohort included 4535. Individual records could not be linked, so this comparison is descriptive. A separate group of 4799 newly enrolled Grade 7 students completed the assessment at the same time. Their mean was 5.80 with SD = 4.88, which was 2.57 points below the Grade 8 mean.
5. Discussion
5.1. Interpretation of Teacher Competency Gains
The rise in teacher competency passes was associated with gains across the SDG 4.4.1 framework. This pattern is consistent with evidence that well-structured teacher development can produce moderate to large effects at the teacher level [
13,
15]. The largest changes occurred in programming and information verification. Messaging and spreadsheet skills changed little or declined slightly, which is consistent with ceiling effects in domains that had high initial pass rates.
Messaging and spreadsheet skills had high pass rates at baseline, which left limited room for improvement. The small declines may reflect random variation or differences in interpretation across measurement points. Information verification and programming began at 5% and rose to 25% and 45%, respectively.
5.2. Pre-Service Versus In-Service Differences
The higher objective ICT knowledge score among pre-service teachers requires careful interpretation. Cohen’s d = 0.732 indicated a moderate to large difference. Pre-service teachers completed three semesters of intensive university ICT coursework in Korea and supervised practice at RTTCs. In-service teachers received shorter training in Cambodia through CPD workshops and coaching. The difference in means and variability may reflect the amount and consistency of training.
Group differences varied across domains. The largest differences were observed in coding, messaging, and presentation, although none met the Bonferroni adjusted level. The coding difference is consistent with the stronger emphasis on Python, AI programming, and Scratch in the pre-service curriculum. Differences in spreadsheet use and software installation were small.
This pattern is consistent with evidence that training lasting at least six months and providing 30 to 100 h of engagement can produce stronger outcomes [
14,
15]. The wider distribution among in-service teachers may reflect varied prior experience. Such variation is common where teacher backgrounds are diverse [
5,
17].
The lower mean for in-service teachers does not show that their training was ineffective. The study could not determine how much each group improved from its own baseline. Pre-service teachers may also have entered the program with stronger ICT knowledge, so selection may explain part of the difference.
5.3. Provincial Comparison
Table 4 showed no statistically significant provincial differences. The effect size for the objective test was η
2 = 0.140, and only 10 teachers were included from each province. Meaningful provincial variation therefore cannot be ruled out. Kandal had a higher mean, but the difference was not significant. Standardized curricula, textbooks, and laboratory specifications may have contributed to similar outcomes. The study was not powered to establish provincial equivalence.
5.4. Student Achievement Patterns
Student results require cautious interpretation. Grade 8 students achieved a mean of 8.37 out of 39 after one year of the revised curriculum. A parallel Grade 7 cohort had a mean of 5.80. The difference was 2.57 points. This comparison may reflect curriculum exposure, age, schooling, or other factors. Evidence from teacher development research suggests that student outcomes often change more slowly than teacher outcomes [
13].
Age and an additional year of schooling cannot be separated from curriculum exposure in this design. Linked records at endline would allow a more direct analysis of student change.
Coding showed the largest increase in students who met the threshold. This provides preliminary evidence that curriculum content reached classrooms. A longer observation period and endline assessment are needed to evaluate student outcomes more fully.
5.5. Measurement Considerations
Shapiro–Wilk tests indicated departures from normality in the analyzed score distributions. The deviation was moderate for the teacher comparison, and the balanced groups provided some protection against inflated Type I error. The student distribution was only slightly skewed, and the significant test partly reflected the large sample. The low student mean should also be considered in relation to limited access to computers outside school. Practice was largely confined to ICT laboratory sessions. Student change could not be assessed at the individual level because records could not be linked.
Figure 5 therefore reports aggregate counts.
Self-assessment can overestimate competency when compared with objective or observed performance [
11]. In this study, the practical observation and objective test both showed higher scores for pre-service teachers. All 11 self-assessment means pointed in the same direction. This convergence supports the observed pattern, but all measures were collected at one point. Future studies should document agreement among observers.
5.6. Implications for ODA Supported Teacher Training
The findings extend evidence on education interventions supported by ODA. An approach that combined curriculum reform, approved textbooks, infrastructure, and repeated teacher training was associated with gains in competency. This is consistent with evidence that investments in teacher training and facilities can support education quality [
21] and that sustained government collaboration can strengthen education systems [
23].
The project combined intensive training in Korea with CPD and professional learning communities in Cambodia. This approach addressed the limits of isolated workshops [
14]. Different pathways were used to build capacity among teacher educators and practicing teachers.
5.7. Contribution to Sustainable Education
Beyond reporting indicator change, the study speaks directly to sustainable education. The intervention’s contribution to sustainability lies less in any single test result than in its model. It builds teacher capacity at both the pre-service and in-service levels so that capacity is renewed rather than depleted. It embeds curricula and textbooks within MoEYS approval structures, which supports institutional sustainability. It distributes ICT laboratories and standardized inputs across four provinces with comparable outcomes, which supports equity and scalability. It aligns all components with the internationally tracked SDG 4.4.1 indicators, which supports system-level monitoring. These features address the equity, institutional durability, and scalability dimensions of sustainable education that distinguish system-linked ODA reform from short-lived and project-bound training.
5.8. From ICT Competency to AI Competency
A final consideration concerns the rapidly shifting competency horizon. The present study measures ICT competencies and therefore cannot be integrated directly with UNESCO’s AI Competency Framework for Teachers (2024) [
30], which targets a distinct set of AI-specific competencies. Nonetheless, the foundational ICT competencies assessed here, namely file and data handling, information verification, security and privacy, and programming, are widely regarded as the enabling base on which AI competencies are built. The project’s emphasis on programming and computational thinking in the pre-service pathway is especially relevant, because these skills underpin later engagement with AI tools and pedagogy. We therefore read the current results not as an AI-competency assessment but as evidence of the ICT foundation required before AI competency frameworks can be meaningfully introduced into Cambodian teacher development, which we identify as a priority for the endline and subsequent project phases.
5.9. Limitations
Several limitations should be acknowledged. The study had no comparison group, so causal effects cannot be established. Maturation, repeated testing, or concurrent policy changes may have influenced the results. Teacher records could not be linked across measurement points, which prevented analysis of individual change. Self-assessment may be affected by response bias, although objective test and practical observation results showed a similar pattern. Student records also could not be linked over time. The 12-month interval covered only part of the five-year intervention. Generalizability is limited to the four provinces and 20 pilot schools.
6. Conclusions
The baseline and midline data indicate measurable changes in teacher ICT competency across the SDG 4.4.1 framework. Pass counts increased in most domains, and pre-service teachers had higher objective knowledge scores at midline. These findings suggest progress toward the intermediate outcomes of an intervention that combined curriculum, textbooks, ICT laboratories, and repeated teacher training. They are interpreted as evidence from program monitoring rather than causal effects.
The findings address the four research questions. For RQ1, teacher competency indicators improved in most domains, with the largest gains in advanced skills that began at low levels. For RQ2, pre-service teachers had higher objective knowledge scores at midline, although training dosage and selection may explain part of the difference. For RQ3, no statistically significant provincial differences were detected. For RQ4, student performance remained at an early level and comparisons between cohorts were descriptive.
Several areas require continued attention. Fewer than half of the teachers met the thresholds in some advanced domains, despite improvement from low baselines. Student achievement also remained low after one year of curriculum implementation. The endline assessment will provide a fuller evaluation of teacher and student outcomes.
For policy and practice, the findings support sustained ODA interventions that address infrastructure, curriculum, materials, and teacher capacity together. The structured pre-service pathway may inform similar efforts in other developing countries. Continued in-service training remains essential because practicing teachers make up the current workforce.





 ,
,