Article

Policy-Led Digital Transformation and Sustainability-Oriented High-Quality Development of the Tourism Economy: Quasi-Experimental Evidence from China’s National Big Data Comprehensive Pilot Zones
1
School of Tourism Management, Wuhan Business University, Wuhan 430056, China
2
School of Business Administration, Zhongnan University of Economics and Law, Wuhan 430073, China
*
Author to whom correspondence should be addressed.
Sustainability 2026, 18(12), 6327; https://doi.org/10.3390/su18126327
Submission received: 17 May 2026 / Revised: 17 June 2026 / Accepted: 18 June 2026 / Published: 20 June 2026
(This article belongs to the Special Issue Tourism Promotes Local Sustainable Development)

Abstract

Tourism digitalization is widely viewed as a tool for sustainable local development, yet whether policy-led digital transformation generates measurable improvements in tourism-economy quality remains insufficiently tested. Treating the staggered establishment of China’s National Big Data Comprehensive Pilot Zones as a quasi-natural experiment, a sustainability-oriented index of high-quality tourism-economy development was constructed using 2011–2019 provincial panel data, and the policy effect was estimated with difference-in-differences and propensity-score-matched difference-in-differences models. The results show that the pilot zones significantly improve the sustainability-oriented quality of the tourism economy, a finding supported by parallel-trends tests, placebo tests, and multiple robustness checks. Heterogeneity analyses indicate positive effects across regional contexts and relatively larger estimated responses in the innovation, green, and shared development dimensions. For pilot-zone type, a more precisely estimated positive effect is shown for regional pilot zones within the current sample. Mechanism-oriented analyses show empirical patterns consistent with improvements in digital infrastructure, digital industry development, and regional innovation capacity as plausible explanatory channels. Quasi-natural experimental evidence is thus provided on how digital policy supports sustainable tourism and local development, with implications for destination governance, tourism service quality, and responsible digital transformation.

1. Introduction

Tourism, as a pivotal driver of local sustainable development, contributes significantly to job creation, income generation, intercultural exchange, community empowerment, and the reinforcement of local identity. At the same time, tourism growth may lead to resource consumption, pollution emissions, spatial congestion, cultural commodification, and dependence on tourism-led regional development. Therefore, the sustainability of tourism should not be understood only as growth in tourist arrivals or tourism revenue. It should instead be understood as an integrated balance among local economic vitality, community well-being, cultural continuity, and environmental carrying capacity. Existing research on sustainable tourism shows that tourism development needs to consider economic, social, and environmental impacts simultaneously, and that measurable indicator systems are required to translate sustainability goals into evaluable objects of governance [1,2,3,4]. In this sense, the evaluation of tourism economy development needs to shift from scale expansion alone to multidimensional quality improvement.
Digital transformation is changing how the tourism industry pursues sustainable development. Early eTourism research shows that information and communication technologies change the processes of tourism information search, booking, marketing, distribution, and firm management [5]. Smart tourism further incorporates big data, mobile technology, cloud computing, the Internet of Things, and platform ecosystems into the operational systems of tourism destinations and tourism firms [6]. In the hospitality field, system connectivity and data interoperability are regarded as important conditions for improving service agility, operational efficiency, and interfirm coordination [7]. These technologies can help destinations improve tourist flow management, resource allocation, service quality, environmental monitoring, and market responsiveness. From the perspective of sustainable tourism, however, the potential value of digital technologies does not automatically translate into actual effects. Whether these technologies can support higher-quality, more resource-efficient, and more inclusive tourism development still depends on the institutional environment, industrial structure, and governance capacity [8].
The relationship between digitalization and sustainable tourism therefore should not be understood through technological determinism. A systematic review of tourism digitalization indicates that digital tools can support visitor experience, destination management, business solutions, and smart sustainable destinations, but existing research still needs clearer conceptual boundaries and stronger empirical evidence [9]. In hotel-related research, Kukanja and Planinc also show that managers’ attitudes toward AI do not automatically translate into the adoption of AI [10]. Therefore, digitalization should not be assumed to promote sustainable development automatically; rather, its effects need to be tested under specific institutional, industrial, and local conditions.
Existing tourism research has begun to examine the relationship between the digital economy and tourism development. Evidence from the United Kingdom shows that the digital economy can promote tourism development [11]. Research on the Campania region in Italy also finds that ICTs can help local tourism regions improve economic vitality [12]. These studies provide an important basis for understanding the relationship between digital technologies and the tourism economy. However, two limitations remain. First, many studies mainly focus on growth-oriented outcomes, such as tourism revenue, tourist volume, tourism demand, or tourism competitiveness, while paying insufficient attention to sustainability-oriented and multidimensional performance of the tourism economy. Second, existing studies often use the general level of digital economy development or ICT applications as explanatory variables, while relatively few studies treat government-led digital policy as a quasi-natural experiment to identify its causal effects. Therefore, whether digital economy policy can promote sustainability-oriented high-quality development of the tourism economy still requires more rigorous empirical evidence.
Policy-led digital transformation provides a suitable setting for addressing this question. Digital economy value chain theory emphasizes that digital infrastructure, digital technology research and development, digital industry systems, and the application of data factors jointly constitute the value creation process of the digital economy [13]. Macro-level empirical research also shows that digital infrastructure, such as broadband, can affect economic growth [14], and that the digital economy can improve total factor productivity through innovation mechanisms [15]. In the Chinese context, the National Big Data Comprehensive Pilot Zone policy is a regional policy pilot focused on digital infrastructure construction, data resource sharing, digital industry cultivation, and institutional innovation. Existing research uses this policy setting to examine the effect of the digital economy on overall high-quality development [16]. However, tourism has pronounced service intensity, spatial embeddedness, resource dependence, and community linkage. Evidence on high-quality development at the aggregate economic level cannot directly substitute for evidence on sustainability at the level of the tourism economy. Whether National Big Data Comprehensive Pilot Zones can improve sustainability-oriented high-quality development of the tourism economy, and through which mechanisms this effect occurs, remains a question that requires direct empirical testing. To fill this gap, this study focuses on three research questions:
RQ1: Does the establishment of National Big Data Comprehensive Pilot Zones promote sustainability-oriented high-quality development of the tourism economy?
RQ2: How do digital infrastructure enablement, digital upgrading of the tourism industry, and regional innovation spillovers serve to explain the policy effect?
RQ3: Is this policy effect heterogeneous?
To answer these questions, this study uses provincial panel data from China for 2011–2019 and treats the staggered establishment of National Big Data Comprehensive Pilot Zones as a quasi-natural experiment. Identification is implemented through a multi-period difference-in-differences (DID) model and a propensity-score-matched difference-in-differences (PSM-DID) model. The DID model is suitable for evaluating differences in changes between the treatment group and the control group under policy shocks, but inference in panel data requires careful attention to robustness [17]. Propensity score matching helps reduce selection bias arising from observable covariates [18]. This study further examines the robustness of the results through a parallel trends test, placebo tests, alternative dependent variables, a counterfactual test, additional control variables, a shortened sample period, and winsorization. The contribution of this study is to integrate digital economy policy, sustainable tourism, and local high-quality development into a unified analytical framework, thereby providing quasi-experimental evidence on the effect of policy-led digital transformation on the sustainable performance of the tourism economy. Mechanism-oriented empirical evidence is further offered on three theoretically grounded channels—digital infrastructure enablement, digital upgrading of the tourism industry, and regional innovation spillovers—and an examination is conducted of how the estimated policy effect appears across regional contexts, pilot-zone types, and development dimensions.

2. Literature Review and Research Hypotheses

2.1. Policy-Led Digital Transformation and Sustainability-Oriented High-Quality Development of the Tourism Economy

The core issue addressed in this study is not whether digital technology generally promotes tourism growth, but whether policy-led digital transformation can be converted into multidimensional quality improvement in the tourism economy. Existing studies on smart tourism and smart destinations show that digital technologies are not only operational tools for individual firms but can also reshape information organization, service connection, and governance responsiveness at the destination level [6,19,20,21]. Following this logic, the effects of digital transformation on the tourism economy are mainly reflected in three changes in capability. Digital transformation reduces information friction among tourists, firms, and governments and improves market matching efficiency. It strengthens coordination among different service providers within destinations and improves service quality and operational efficiency. It also enhances the ability of local governments to monitor and respond to tourist flows, resource use, environmental pressure, and demand for public services. These capability changes are directly related to sustainability-oriented high-quality development of the tourism economy, because development dimensions such as innovation development, green development, shared development, coordinated development, and open development all depend on more effective information processing and cross-actor coordination.
National Big Data Comprehensive Pilot Zones have policy attributes that distinguish them from the general digital adoption of firms. Research on digital transformation shows that the influence of digital technologies on economic and organizational systems is often not a simple process of technological substitution, but a recombination of value creation, organizational processes, and resource allocation structures [22,23]. Research on the digital economy value chain also emphasizes that digital infrastructure, digital technology research and development, digital industry systems, and the application of data factors jointly constitute the value creation process of the digital economy [13]. The policy significance of National Big Data Comprehensive Pilot Zones therefore lies in their use of public policy to promote digital infrastructure, data resource sharing, data governance, and digital industry cultivation in a concentrated manner, thereby improving regional digital capacity. Existing research uses this policy setting to examine the effect of the digital economy on overall high-quality development [16]. However, the service orientation, spatial embeddedness, and resource dependence of tourism mean that conclusions at the overall economic level cannot directly substitute for judgments at the level of the tourism economy. Thus, we propose:
H1. 
The establishment of National Big Data Comprehensive Pilot Zones promotes sustainability-oriented high-quality development of the tourism economy.

2.2. Mechanisms of Policy-Led Digital Transformation

This study further distinguishes three testable mechanisms: digital infrastructure enablement, digital upgrading of the tourism industry, and regional innovation spillovers. These mechanisms correspond respectively to infrastructure conditions, diffusion of industrial applications, and the regional innovation environment in the formation of digital capacity.

2.2.1. Digital Infrastructure Enablement

Digital infrastructure is the foundational channel through which policy-led digital transformation affects the tourism economy. Telecommunications networks, broadband access, data platforms, and mobile communication facilities can increase the speed of information transmission, reduce transaction and coordination costs, and expand the coverage of digital services. Macro-level research shows that telecommunications infrastructure and broadband infrastructure can affect economic growth and firm performance [14,24,25,26]. In the tourism industry, however, the role of digital infrastructure should not be understood only as a general condition for economic growth, but as a basic capacity for destination governance and service supply.
Specifically, digital infrastructure can improve the connectivity, observability, and responsiveness of tourism destinations. Connectivity means that information exchange among tourists, tourism firms, and government departments becomes smoother. Observability means that local governments and destination managers can obtain more timely information on tourist flows, traffic pressure, environmental load, and service demand. Responsiveness means that destinations can allocate public services, issue risk warnings, and adjust services more rapidly. Research on smart hotels, smart scenic areas, and smart destinations shows that system connectivity and data interoperability are important conditions for improving service quality, operational efficiency, and destination competitiveness [7,20,21]. Thus, we propose:
H2a. 
Digital infrastructure enablement serves as a plausible explanatory channel through which the establishment of National Big Data Comprehensive Pilot Zones is linked to sustainability-oriented high-quality development of the tourism economy.

2.2.2. Digital Upgrading of the Tourism Industry

Beyond infrastructure, digital policy may also affect the development quality of the tourism economy through digital upgrading of the tourism industry. The tourism industry consists of multiple segments, including accommodation, catering, transport, travel services, scenic area operations, cultural entertainment, and platform services. Its value creation depends on the organizational efficiency of service chains and the capacity for product innovation. After the integration of digital industry development with tourism, tourism firms can adjust business models and service processes through platform-based distribution, digital marketing, online services, mobile payment, data analytics, and intelligent recommendation. Research on new tourism technologies indicates that digital technologies are reshaping tourism market structures, modes of interaction among tourism actors, and processes of value creation [27]. Research on tourism innovation also shows that information technology, collaborative networks, human capital, and market competition are important conditions for innovation in tourism firms [28,29].
This mechanism is particularly important for tourism SMEs and destination service systems. Many tourism firms do not have the capacity to develop digital systems independently, and their digital transformation often depends on the regional digital industry base, the supply of platform services, and the public digital environment. By cultivating digital industries, expanding digital services, and promoting the application of data factors, National Big Data Comprehensive Pilot Zones can lower the threshold for tourism firms to access digital tools and improve market visibility and service response speed. At the same time, digital industry development may generate digital cultural tourism products, immersive experiences, online-offline integrated services, and data-driven destination operation models, thereby improving the innovation capacity and service quality of the tourism economy. Existing macro-level research also shows that the digital economy can improve productivity and industrial operating efficiency through innovation mechanisms [15]. Thus, we propose:
H2b. 
Digital upgrading of the tourism industry serves as a plausible explanatory channel through which the establishment of National Big Data Comprehensive Pilot Zones is linked to sustainability-oriented high-quality development of the tourism economy.

2.2.3. Regional Innovation Spillovers

National Big Data Comprehensive Pilot Zones may also affect the development quality of the tourism economy through regional innovation spillovers. Digital policies often attract digital firms, R&D capital, technical talent, and innovation service organizations to pilot regions, thereby changing local innovation environments. Research on regional innovation indicates that innovation activities are closely related to local industrial structures, knowledge bases, firm capabilities, and institutional environments, and that differences in regional innovation conditions affect policy effects [30]. Research on knowledge spillovers further shows that innovation resources do not diffuse automatically. Instead, they enter related industries through channels such as industrial linkages, organizational networks, talent mobility, and spatial proximity [31]. Research on constructed regional advantage also emphasizes that combinations across different knowledge bases help promote cross-industry innovation and local development [32].
In tourism contexts, regional innovation spillovers are not limited to the introduction of new technological equipment. They may also appear in updates to product design, service processes, organizational management, and destination governance. As regional innovation capacity improves, tourism firms and destination management organizations may gain easier access to knowledge and technical support related to data analytics, intelligent recommendation, digitalization of cultural resources, low-carbon management, environmental monitoring, and tourist behavior analysis. These innovation resources can promote the development of smart scenic areas, renewal of cultural tourism products, optimization of service standards, and improvement in resource allocation efficiency. Because sustainability-oriented high-quality development of the tourism economy includes dimensions such as innovation development, green development, and shared development, regional innovation spillovers may become an important channel through which digital policy is converted into quality improvement in the tourism economy. Thus, we propose:
H2c. 
Regional innovation spillovers serve as a plausible explanatory channel through which the establishment of National Big Data Comprehensive Pilot Zones is linked to sustainability-oriented high-quality development of the tourism economy.

2.3. Contextual Heterogeneity of Policy Effects

The effects of policy-led digital transformation should not be assumed to be fully consistent across all regions, all types of pilot zones, and all development dimensions. Whether digital policy can be converted into quality improvement in the tourism economy depends on local digital readiness, tourism resource endowments, market maturity, governance capacity, and firm absorptive capacity. Research on regional innovation policy indicates that regions differ in innovation foundations and institutional conditions, and that a unified policy instrument may produce differentiated outcomes [30,32]. Research on regional policy evaluation also shows that local development stages, resource conditions, and governance capacity affect policy implementation effects [33]. Therefore, this study further develops heterogeneity hypotheses from three aspects: regional development context, pilot zone type, and development dimension.
First, policy effects may show heterogeneity across regional development contexts. Regions with more complete digital infrastructure, more mature tourism markets, and stronger digital capabilities among firms may convert digital policy more rapidly into tourism service innovation and destination governance capacity. By contrast, regions with relatively weak digital infrastructure and tourism industry foundations may have weaker initial conditions, but they may also obtain greater marginal improvements from policy inputs. Therefore, it should not be simply assumed that one type of region necessarily has stronger policy effects. Instead, whether policy effects differ across regional development contexts should be tested empirically. Thus, we propose:
H3a. 
The effect of National Big Data Comprehensive Pilot Zones on sustainability-oriented high-quality development of the tourism economy may differ across regional development contexts.
Second, policy effects may show heterogeneity by pilot zone type. Cross-regional pilot zones and regional pilot zones differ in spatial scope, governance actors, coordination costs, and modes of policy resource allocation. Cross-regional pilot zones cover a larger spatial scope and may have stronger potential for cross-regional coordination, but they may also face higher costs of organizational coordination and policy transmission. Regional pilot zones have a more concentrated spatial scope, clearer local governance actors, and policy resources that may be more easily converted into local digital infrastructure construction, digital applications in the tourism industry, and regional innovation capacity improvement. Chinese-language policy evaluation studies on National Big Data Comprehensive Pilot Zones also suggest that different types of pilot zones may differ in their effects on regional digital economy development [34]. Therefore, the effects of different types of pilot zones on sustainability-oriented high-quality development of the tourism economy may not be consistent. Thus, we propose:
H3b. 
The effect of National Big Data Comprehensive Pilot Zones on sustainability-oriented high-quality development of the tourism economy may differ by pilot zone type.
Third, policy effects may show heterogeneity across development dimensions. This study decomposes sustainability-oriented high-quality development of the tourism economy into five dimensions: innovation development, coordinated development, green development, open development, and shared development. Digital policies do not have the same pathways or effect intensity across these dimensions. For innovation development, digital policy can directly improve tourism product and service innovation through data applications, digital services, and technology diffusion. For green development, digital technologies can support environmental monitoring, improvement in resource use efficiency, and low-carbon management. For shared development, digital platforms and public service systems can improve access to tourism information, infrastructure, and cultural resources. By comparison, coordinated development and open development are also jointly shaped by industrial structure, transport conditions, regional cooperation, external market demand, and cultural dissemination capacity. Research on sustainable tourism indicators also shows that sustainability outcomes across different dimensions have different governance conditions and evaluation priorities [3,4]. Thus, we propose:
H3c. 
The effect of National Big Data Comprehensive Pilot Zones on sustainability-oriented high-quality development of the tourism economy may differ across development dimensions.

3. Materials and Methods

3.1. Baseline Model Construction

To examine the effect of the establishment of National Big Data Comprehensive Pilot Zones on sustainability-oriented high-quality development of the tourism economy, this study adopts a difference-in-differences (DID) model [35]. The National Big Data Comprehensive Pilot Zone policy is implemented through phased approvals, and the timing of entry into the policy pilot differs across regions. Provinces approved for the establishment of National Big Data Comprehensive Pilot Zones constitute the treatment group, whereas provinces without such approval constitute the control group.
To capture policy treatment status, this study constructs the policy treatment variable d i g i t as follows:
d i g i t = t r e a t e d i × p o s t i t ,
where t r e a t e d i indicates whether province i belongs to the treatment group, and p o s t i t indicates whether province i has entered the pilot period in year t . If province i belongs to the treatment group and year t is equal to or later than the year in which the province is approved to establish a National Big Data Comprehensive Pilot Zone, d i g i t equals 1; otherwise, it equals 0.
The DID model identifies the effect of the policy pilot on sustainability-oriented high-quality development of the tourism economy by comparing changes in the treatment group and the control group before and after policy implementation. This method can control, to some extent, for time-invariant regional differences and common time shocks, but its validity depends on the parallel trends assumption. Following existing studies on multi-period DID [36], this study specifies the model as follows:
H q d i t = α + β d i g i t + γ X i t + μ i + λ t + ε i t ,
where H q d i t denotes the level of sustainability-oriented high-quality development of the tourism economy in province i in year t ; d i g i t is the core explanatory variable, namely the treatment variable for the National Big Data Comprehensive Pilot Zone policy; β is the estimated coefficient of the core explanatory variable and captures the effect of the establishment of National Big Data Comprehensive Pilot Zones on sustainability-oriented high-quality development of the tourism economy; X i t denotes a set of control variables; μ i denotes province fixed effects; λ t denotes year fixed effects; and ε i t is the random error term.
Considering that the selection of pilot regions for National Big Data Comprehensive Pilot Zones may be affected by regional economic foundations, industrial structure, science and education investment, and tourism human capital, this study further uses a propensity-score-matched difference-in-differences (PSM-DID) model as a robustness test [37]. Specifically, this study first estimates a Logit model using the control variables as covariates to calculate the propensity score for each province to enter the pilot. It then applies caliper nearest-neighbor matching to match treatment group observations with control group observations that have similar observable characteristics. Finally, the DID regression is re-estimated based on the matched sample to mitigate sample selection bias caused by differences in observable covariates between the treatment group and the control group.

3.2. Variable Selection

3.2.1. Dependent Variable

The dependent variable in this study is the level of sustainability-oriented high-quality development of the tourism economy, denoted by H q d . Conceptually, this variable measures the extent to which the tourism economy moves from scale-oriented expansion toward multidimensional quality improvement. In the Chinese policy and academic context, innovation, coordination, green development, openness, and sharing are core dimensions of the New Development Philosophy and constitute a widely used framework for evaluating high-quality development [38]. Drawing on this policy framework and prior studies on the measurement of high-quality development in China’s tourism economy [39,40,41], the five dimensions are adapted to the tourism economy, and an indicator system covering innovation development, coordinated development, green development, open development, and shared development is constructed.
Innovation development reflects the efficiency, productivity, and knowledge-output capacity of the tourism economy. Coordinated development reflects tourism’s structural embeddedness in the regional economy, the service-sector structure, and the urban–rural development context. Specifically, tourism revenue relative to regional GDP and tourism revenue relative to tertiary-industry value added measure the relative position of tourism within the regional economy and the service sector, while the urban population share captures the urban–rural development context. It should be noted that the coordinated-development dimension, as measured here, primarily captures tourism’s relative economic position within the regional economy and service-sector structure, together with the urban–rural development context. It does not directly measure inter-sectoral coordination, community-level distributional outcomes, or possible spillover costs such as agricultural displacement, housing-market pressure, or supply-chain leakages. This measurement limitation reflects the constraints of available provincial-level data and should be considered when interpreting the coordinated-development results. Green development reflects environmental pressure, ecological endowment, and environmental governance capacity. Open development captures international tourism linkages, transport accessibility, and cultural dissemination. Shared development reflects tourism infrastructure, cultural-resource accessibility, and tourism reception capacity.
The complete indicator system and the measurement of each indicator are reported in Table 1. The entropy weighting method is applied to determine the weight of each standardized indicator, after which the composite score for each province in each year is calculated. The resulting H q d is a dimensionless composite index. A higher score indicates a higher level of sustainability-oriented high-quality development of the tourism economy. To improve transparency, the composite-index analysis is complemented by dimension-specific regressions in Section 5.1. In the empirical analysis, coefficients on the policy variable are reported in index points and interpreted relative to the mean and standard deviation of H q d .

3.2.2. Mechanism Variables

To provide mechanism-oriented empirical evidence on the theoretical channels that help explain the policy effect, three mechanism variables corresponding to digital infrastructure enablement, digital upgrading of the tourism industry, and regional innovation spillovers are constructed. Digital infrastructure enablement is measured by the number of internet access ports, which reflects regional digital infrastructure conditions. Digital upgrading of the tourism industry is measured by telecommunications business volume, which captures the intensity of regional digital economy activity and the foundation for integrated development between digital industries and service industries. Regional innovation spillovers are measured by the number of patent applications, which reflects regional innovation resources and knowledge production capacity.
The selection of these mechanism variables draws on studies related to the digital economy, high-quality development, government-driven innovation, and National Big Data Comprehensive Pilot Zones [42,43,44]. To connect the DID evidence with the proposed theoretical channels, the following mechanism-oriented models are specified:
M i t = α + ρ d i g i t + γ X i t + μ i + λ t + ε i t ,
H q d i t = α + β d i g i t + θ M i t + γ X i t + μ i + λ t + ε i t ,
where M i t denotes the mechanism variables, namely the proxy variables for digital infrastructure enablement, digital upgrading of the tourism industry, and regional innovation spillovers. Equation (3) evaluates the relationship between pilot-zone establishment and each mechanism variable. Equation (4) assesses the relationship between each mechanism variable and sustainability-oriented high-quality development of the tourism economy conditional on the policy variable, control variables, province fixed effects, and year fixed effects. The estimation of mediated effect shares would require additional identifying assumptions beyond this study’s design [45].

3.2.3. Control Variables

Following existing studies [46,47,48], a set of control variables capturing regional fiscal and governance capacity, knowledge investment, external openness, industrial structure, and tourism-specific human capital is included in this study. These variables describe regional socioeconomic and institutional conditions associated with both the implementation environment of digital policy pilots and the development quality of the tourism economy.
Government fiscal performance (govfy), measured by the ratio of regional GDP to fiscal expenditure, is used to characterize local fiscal efficiency and administrative capacity. These fiscal and administrative conditions are relevant to public service provision, tourism infrastructure maintenance, and the implementation of digital policy pilots. Science and education development level (scied), measured by the ratio of government fiscal expenditure on science and education to regional GDP, represents regional knowledge investment and talent-training capacity. It reflects the knowledge base, innovation resources, and skill foundations that shape local absorptive capacity and digital tourism service development. Foreign direct investment (invest), measured by the ratio of FDI to regional GDP, captures regional openness and external capital linkage. These linkages are associated with tourism market integration, managerial learning, and service upgrading. Industrial structure upgrading (upgrade), measured by the ratio of the value added of the tertiary industry to the value added of the secondary industry, indicates the service-oriented transformation of the regional economy and provides an industrial foundation for tourism integration and quality upgrading. Tourism human capital (hum), measured by the number of students enrolled in tourism higher education institutions per 10,000 people, reflects the supply of specialized tourism talent and service capability, which is closely related to destination management, tourism product innovation, and service quality.
Transport accessibility and environmental governance are represented in the dependent-variable index through the open-development and green-development dimensions. Accordingly, the baseline control set focuses on regional socioeconomic and institutional conditions outside the outcome-index components, helping reduce omitted-variable bias while maintaining consistency in the construction of the dependent variable.

3.3. Data Sources and Processing

This study uses 30 provincial-level administrative regions in mainland China from 2011 to 2019 as the main estimation sample, yielding 270 province-year observations. Due to data availability and differences in statistical coverage, Hong Kong, Macao, Taiwan, and Tibet are excluded. The 2011–2019 window is used for the baseline DID analysis because it provides a pre-pandemic policy evaluation period and avoids the large and uneven shock of COVID-19 to the tourism economy after 2020. The data mainly come from the China Regional Economic Statistical Yearbook, the China Tourism Statistical Yearbook, provincial statistical yearbooks, and the EPS Data Platform. Monetary indicators are deflated to reduce the influence of price changes on the estimation results. All data processing and empirical analyses are conducted using Stata 17.
Policy treatment status follows the official approval timing of the National Big Data Comprehensive Pilot Zones. Guizhou entered pilot status in 2015. The other nine treated regions—Beijing, Tianjin, Hebei, Inner Mongolia, Liaoning, Shanghai, Henan, Guangdong, and Chongqing—entered pilot status in 2016. No additional treated regions entered during 2017–2019. In the DID coding, a treated region takes the value of one from the approval year onward. With the approval year included as a treated year, the average number of post-treatment observations per treated unit by 2019 is 4.1 years.
As a complement to the baseline analysis, a supplementary extended-sample sensitivity analysis is conducted using a panel covering 2011–2023. This additional analysis incorporates observations from the COVID-19 pandemic and recovery period and includes a COVID-19 shock control to account for pandemic-period disturbances in the tourism economy. The results are reported in Appendix A Table A1.

4. Results

4.1. Parallel Trends Test

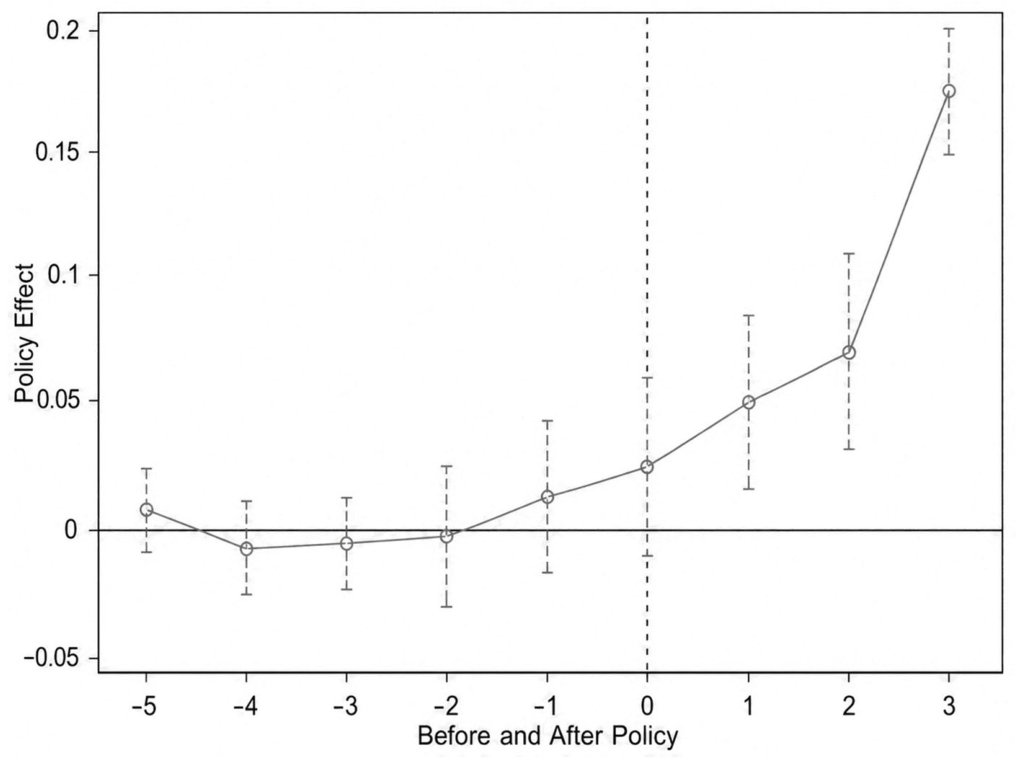
An important prerequisite for the validity of the difference-in-differences model is the parallel-trends assumption. This assumption requires that, before the establishment of National Big Data Comprehensive Pilot Zones, the treatment group and the control group follow similar trends in sustainability-oriented high-quality development of the tourism economy. To examine this condition, an event-study specification is adopted, and year-by-year policy coefficients before and after pilot-zone establishment are estimated [49].
Figure 1 plots the dynamic coefficients and confidence intervals. The vertical dashed line marks the policy implementation year. Negative relative years represent pre-policy periods, and positive relative years represent post-policy periods. The estimated coefficients in the pre-policy periods fluctuate around zero and are statistically insignificant. The joint Wald test for the pre-policy coefficients gives F(4,29) = 0.9438 and p = 0.4528, indicating that the null hypothesis of no pre-policy difference in trends cannot be rejected.
In the year of policy implementation, the estimated coefficient is not statistically significant, suggesting that the policy effect requires time to materialize. After policy implementation, the estimated coefficients gradually turn positive and become statistically significant, showing that the effect of National Big Data Comprehensive Pilot Zones emerges progressively after the establishment of the pilot zones. The results are shown in Figure 1.
As shown in Figure 1, the estimated coefficients in the pre-policy periods fluctuate around zero and are statistically insignificant. Together with the joint Wald test reported above, this pattern supports the empirical plausibility of the parallel trends condition. In the year of policy implementation, the estimated coefficient is not statistically significant, indicating that the policy effect requires time to materialize. After policy implementation, the estimated coefficients gradually turn positive and become statistically significant, showing that the effect of National Big Data Comprehensive Pilot Zones emerges progressively after the establishment of the pilot zones.

4.2. Baseline Estimation Results

Table 2 reports the baseline regression results for the effect of the establishment of National Big Data Comprehensive Pilot Zones on sustainability-oriented high-quality development of the tourism economy. Model (1) presents the estimation results of the DID model. The estimated coefficient of the core explanatory variable, dig, is 0.041 and is significantly positive at the 1% level. The dependent variable H q d is a dimensionless entropy-weighted composite index, so the coefficient represents a 0.041-point increase in the tourism-economy quality index. For scale, this increase equals approximately 20.8% of the pre-treatment mean of H q d among treated provinces and about 0.44 standard deviations of the full-sample H q d distribution, corresponding to a Cohen’s d-style standardized effect size of approximately 0.44. This magnitude indicates that the establishment of National Big Data Comprehensive Pilot Zones produces a statistically significant and substantively meaningful improvement in the sustainability-oriented quality of the tourism economy after relevant covariates and fixed effects are accounted for.
Model (2) further reports the estimation results of the propensity-score-matched difference-in-differences (PSM-DID) model. After propensity score matching is used to reduce observable differences between the treatment group and the control group, the estimated coefficient of the core explanatory variable, d i g , is 0.054 and remains significantly positive at the 1% level. This result is consistent with the baseline DID model, indicating that National Big Data Comprehensive Pilot Zones have a relatively stable positive effect on sustainability-oriented high-quality development of the tourism economy. Therefore, H1 is supported.

4.3. Placebo Test

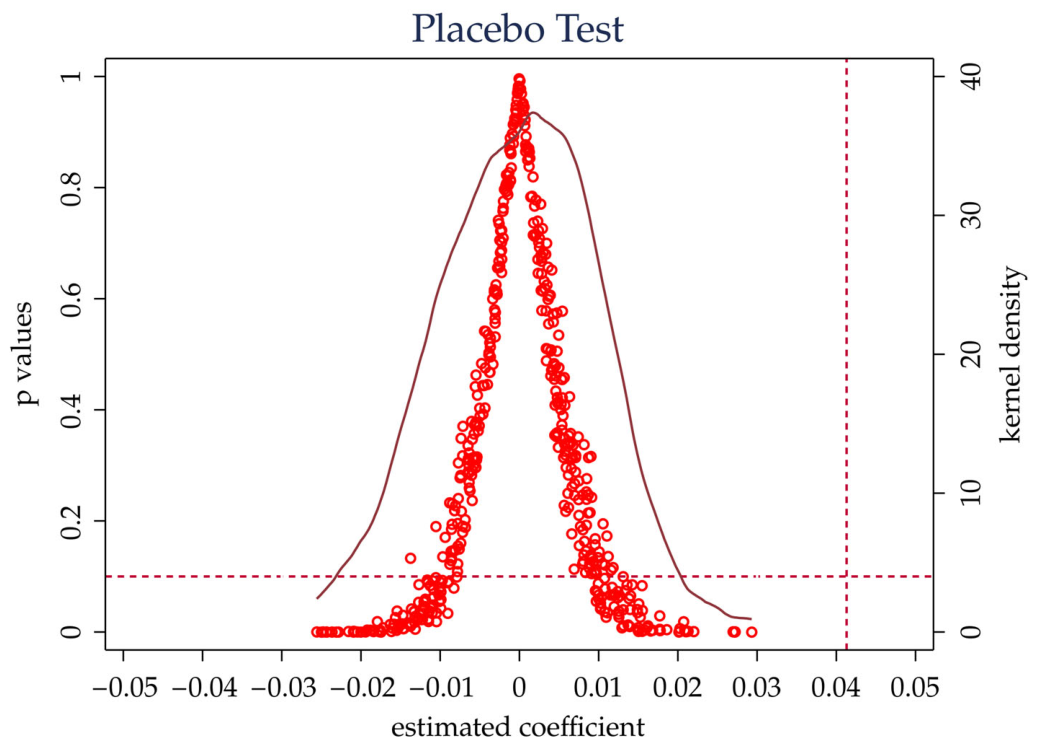
To further rule out the influence of random factors on the estimation results, this study conducts a placebo test by randomly assigning the treatment group and the timing of policy implementation [50]. Specifically, this study first randomly selects 10 provincial-level administrative regions from the 30 provincial-level units as the pseudo-treatment group, with the remaining regions assigned to the pseudo-control group. It then randomly assigns a pseudo policy implementation year and constructs a pseudo policy treatment variable. Finally, the difference-in-differences (DID) estimation is re-estimated using the pseudo policy variable. This procedure is repeated 500 times to obtain the distribution of the estimated coefficients of the pseudo policy variable.
Figure 2 reports the distribution of the estimated coefficients from the 500 random assignments. In the 500 placebo assignments, none of the placebo coefficients exceeds the observed DID estimate of 0.041, corresponding to an empirical exceedance rate of 0.0%, indicating that the randomly assigned pseudo policy does not generate a systematic policy effect. This result suggests that the improvement in sustainability-oriented high-quality development of the tourism economy is unlikely to be driven by random factors and is more consistent with the policy effect of the establishment of National Big Data Comprehensive Pilot Zones.

4.4. Robustness Tests

To examine the robustness of the baseline results, this study conducts further analyses from two perspectives. First, it replaces the dependent variable with alternative dependent variables. Second, it conducts robustness tests using a counterfactual test, additional control variables, a shortened sample period, and winsorization.
First, this study replaces the dependent variable with total tourism revenue, per capita tourism revenue, and the tourist arrivals ratio to examine the effect of National Big Data Comprehensive Pilot Zones on tourism economy outcomes [51]. Table 3 reports the estimation results after replacing the dependent variable. Models (3), (4), and (5) use total tourism revenue, per capita tourism revenue, and the tourist arrivals ratio as the dependent variables, respectively. The results show that the estimated coefficients of the core explanatory variable, d i g , are all significantly positive. This finding indicates that National Big Data Comprehensive Pilot Zones not only improve the level of sustainability-oriented high-quality development of the tourism economy measured by the composite index, but also have positive effects on indicators related to tourism revenue and tourism scale.
Second, this study further conducts additional robustness tests, and the results are reported in Table 4. Model (6) presents the results of the counterfactual test. Following existing research, this study assumes that the establishment of National Big Data Comprehensive Pilot Zones occurs three years earlier than the actual implementation year and reconstructs the policy variable for estimation [35]. The results show that the artificially advanced policy variable is not statistically significant, indicating that the baseline results are not driven by trend differences that already exist before policy implementation.
Model (7) further adds the share of the value added of the tertiary industry in GDP to the existing set of control variables to account for the influence of industrial structure [34]. The estimated coefficient of the core explanatory variable remains positive and statistically significant, indicating that the baseline finding persists after further controlling for regional industrial-structure conditions. Model (8) uses a shortened sample period, and Model (9) applies 5% winsorization. Under both specifications, the estimated coefficient of the policy variable remains significantly positive. Overall, the robustness checks reported in Table 4 indicate that the positive effect of National Big Data Comprehensive Pilot Zones on sustainability-oriented high-quality development of the tourism economy is not driven by a single model specification.
To provide additional evidence from a broader time window, a supplementary extended-sample sensitivity analysis using 2011–2023 data is reported in Appendix A Table A1. This auxiliary analysis incorporates a COVID-19 shock control and covers the pandemic and recovery period, during which tourism-economy outcomes were subject to unusually large external disturbances. The main robustness evidence in Table 4 remains based on the primary 2011–2019 pre-pandemic sample. The smaller coefficient in the extended sample is consistent with pandemic-related attenuation of tourism-economy activity and with the possibility that the policy effect is more pronounced in the early post-treatment period; distinguishing these explanations requires longer post-pandemic observations.

5. Heterogeneity and Mechanism Analyses

5.1. Heterogeneity Analysis

The baseline regression results show that National Big Data Comprehensive Pilot Zones significantly promote sustainability-oriented high-quality development of the tourism economy. To further examine how the policy effect varies across different contexts, heterogeneity analysis is conducted from three perspectives: regional development context, pilot-zone type, and development dimension. These analyses help reveal whether the estimated policy effect remains positive across different regional and institutional settings and which dimensions of tourism economic development respond more strongly to policy-led digital transformation. To further examine whether this policy effect differs across contexts, this study conducts heterogeneity analysis from three perspectives. It first examines differences in policy effects across regional development contexts. It then examines differences in policy effects across types of pilot zones. Finally, it examines whether the effects of pilot zones differ across dimensions of sustainability-oriented high-quality development of the tourism economy.
First, this study divides the sample into eastern regions and central-western regions according to geographical location and development level and conducts subgroup regressions. Table 5 reports the results of the regional heterogeneity analysis. Models (10) and (11) report the estimation results for eastern regions and central-western regions, respectively. The estimated coefficients of the core explanatory variable, dig, are positive and statistically significant in both subsamples. The estimated coefficients of the policy variable are positive and statistically significant in both subsamples. Model (12) further reports the fully interacted specification. The interaction term between the policy variable and the eastern-region indicator is significantly negative (β = −0.066, SE = 0.020), indicating that the policy effect is more pronounced in central-western regions than in eastern regions. This result suggests that regions with greater marginal room for digital improvement may benefit more from the establishment of National Big Data Comprehensive Pilot Zones. Therefore, H3a is supported.
This study further examines differences in policy effects across types of pilot zones. According to the establishment mode and coverage scope of pilot zones, this study classifies them into cross-regional pilot zones and regional pilot zones, and conducts separate regression analyses [34]. Table 6 reports the results of the heterogeneity test by pilot zone type. Model (13) reports the estimation results for regional pilot zones, Model (14) reports the estimation results for cross-regional pilot zones, and Model (15) reports the fully interacted specification by pilot-zone type.
The results show that the estimated coefficient for cross-regional pilot zones is positive but not statistically significant, whereas the estimated coefficient for regional pilot zones is positive and significant at the 5% level. A fully interacted specification was further estimated to assess whether the policy effect differs by pilot-zone type. The interaction term between the policy variable and the cross-regional pilot-zone indicator is not statistically significant (β = −0.008, SE = 0.030), indicating that the policy effect does not differ significantly between cross-regional and regional pilot zones in the current sample. This pattern suggests that, within the current sample, the policy effect is more precisely estimated for regional pilot zones. One possible explanation is that regional pilot zones have more concentrated spatial coverage, clearer local governance actors, and shorter policy transmission chains, which may facilitate the conversion of digital policy resources into tourism-related infrastructure, services, and innovation capacity. By contrast, cross-regional pilot zones may require more complex interregional coordination before policy effects are reflected in provincial tourism economy indicators. Therefore, the pilot-zone-type results provide limited support for H3b.
This study examines whether National Big Data Comprehensive Pilot Zones have different effects across dimensions of sustainability-oriented high-quality development of the tourism economy. The dependent variable is further decomposed into five dimensions: innovation development, coordinated development, green development, open development, and shared development. Separate regression analyses are then conducted for each dimension. Table 7 reports the results of the heterogeneity test by development dimension.
The results of Models (16) to (20) show that the estimated coefficients of National Big Data Comprehensive Pilot Zones are positive across all five development dimensions. The estimated responses are relatively larger for innovation development, green development, and shared development, and these coefficients are statistically significant at least at the 5% level. This pattern is consistent with the theoretical expectation that policy-led digital transformation is more directly connected with tourism innovation capacity, environmental governance capacity, and shared service provision through digital infrastructure, digital industry applications, and the agglomeration of innovation resources. Coordinated development and open development also show positive estimated effects, but these dimensions may depend more heavily on regional industrial structure, transport linkages, external market demand, and cultural dissemination capacity. Overall, consistency with H3c is found in the dimension-specific results.

5.2. Mechanism-Oriented Empirical Analysis

The preceding DID results indicate that the establishment of National Big Data Comprehensive Pilot Zones has a significant positive effect on sustainability-oriented high-quality development of the tourism economy. A further question is which empirical mechanisms may help explain this policy effect. Based on the theoretical analysis, three potential channels are focused on: digital infrastructure enablement, digital upgrading of the tourism industry, and regional innovation spillovers. Specifically, the number of internet access ports, telecommunications business volume, and the number of patent applications are used as proxy indicators for these three mechanism variables.
To avoid overstating identification, this section does not treat the mechanism analysis as a formal causal mediation test. The proposed mechanism variables may themselves respond to the policy, so coefficients from models that include these variables should not be interpreted as decomposing the total policy effect into causal mediation effects. Instead, the analysis examines whether the empirical patterns align with the three theoretically proposed channels: whether the policy is linked to changes in the mechanism variables and whether these variables are positively related to the dependent variable after controlling for observed covariates and fixed effects. This approach provides mechanism-oriented empirical evidence that is consistent with the proposed theoretical channels, while the causal interpretation of the mechanism estimates is kept appropriately bounded.
The results of the mechanism analysis are reported in Table 8. Models (21), (23), and (25) examine whether the establishment of National Big Data Comprehensive Pilot Zones is associated with the proposed mechanism variables: digital infrastructure enablement, digital upgrading of the tourism industry, and regional innovation spillovers. The coefficients of the policy variable are positive and statistically significant in these three models. This pattern indicates that the establishment of pilot zones is followed by improvements in digital infrastructure conditions, digital industry activity, and regional innovation output, which is consistent with the proposed mechanism logic.
Models (22), (24), and (26) further examine the conditional associations between the three mechanism variables and sustainability-oriented high-quality development of the tourism economy. The estimated coefficients of the number of internet access ports, telecommunications business volume, and the number of patent applications are all significantly positive. These results indicate that provinces with stronger digital infrastructure, more active digital industry development, and greater innovation capacity tend to have higher levels of sustainability-oriented high-quality development of the tourism economy, after controlling for control variables and fixed effects. These estimates therefore help clarify the empirical relevance of the proposed channels, but they should not be interpreted as a formal decomposition of the total policy effect into causal mediation effects.
Overall, the results in Table 8 provide mechanism-oriented empirical evidence consistent with the three proposed paths of digital infrastructure enablement, digital upgrading of the tourism industry, and regional innovation spillovers. The establishment of pilot zones is positively related to the three mechanism variables, and these variables are also positively related to the level of sustainability-oriented high-quality development of the tourism economy. Therefore, the findings are consistent with H2a, H2b, and H2c.

6. Conclusions, Policy Implications, and Limitations

6.1. Main Findings

This study examines the effect of National Big Data Comprehensive Pilot Zones on sustainability-oriented high-quality development of the tourism economy and further investigates heterogeneity and mechanism-oriented empirical patterns. The main findings are as follows. First, National Big Data Comprehensive Pilot Zones significantly promote sustainability-oriented high-quality development of the tourism economy. The baseline DID results show that the estimated coefficient of the pilot policy is significantly positive. The PSM-DID results, parallel trends test, placebo test, and multiple robustness tests further support this conclusion.
Second, the policy effect of National Big Data Comprehensive Pilot Zones has a certain lag. The effect is not significant in the year of policy implementation but gradually appears in subsequent periods. This suggests that digital infrastructure construction, improvement in data governance capacity, and digital applications in the tourism industry require time before they are converted into effects on tourism economy development.
Third, the heterogeneity analyses show how the policy effect appears across regional contexts, pilot-zone types, and development dimensions. The regional subsample results show significant positive coefficients for both eastern and central-western regions, and the fully interacted specification further indicates a more pronounced effect in central-western regions. Results by pilot-zone type show a positive and significant coefficient for regional pilot zones, while the coefficient for cross-regional pilot zones is positive but less precisely estimated. The dimension-specific results show positive estimated effects across all five dimensions, with relatively larger responses for innovation development, green development, and shared development.
Fourth, the mechanism-oriented empirical analysis provides patterns consistent with three proposed explanatory channels: digital infrastructure enablement, digital upgrading of the tourism industry, and regional innovation spillovers. The pilot-zone policy is associated with increases in internet access ports, telecommunications business volume, and patent applications, and these variables are positively related to the sustainability-oriented development index after controlling for covariates and fixed effects. These findings support the empirical plausibility of the proposed explanatory channels within the theoretical framework of this study.

6.2. Policy Implications

The findings provide several policy implications. First, digital transformation should be embedded in sustainable tourism development strategies. When promoting tourism development, local governments should move beyond a narrow focus on tourist volume and tourism revenue growth, and should recognize the role of digital infrastructure, data governance, green management, and shared services in improving the quality of the tourism economy.
Second, digital infrastructure and data governance for tourism should be strengthened. Broadband networks, public data platforms, smart scenic area systems, tourism information services, and environmental monitoring systems are essential conditions for improving destination management and service quality.
Third, tourism firms should be supported in adopting digital tools and platform-based services. Policy support should pay particular attention to small and medium-sized tourism firms, which often lack sufficient internal digital capabilities.
Fourth, differentiated policies should be designed according to pilot zone type and development dimension. Regional pilot zones can focus on promoting the application of digital technologies in local tourism industries. Cross-regional pilot zones should strengthen cross-regional data sharing, standard coordination, and joint governance. Across development dimensions, digital policy should continue to reinforce innovation development, green development, and shared development, while improving the transport linkages, industrial collaboration, and cultural dissemination capacity required for coordinated development and open development.
Fifth, responsible digital transformation requires attention to the environmental and distributional consequences of tourism digitalization. The positive average effect identified in this study highlights the potential of policy-led digital transformation to improve tourism-economy quality. Attention must also be paid to the costs and constraints associated with digital systems in sustainable tourism governance. When not supported by green infrastructure and energy-efficient operation, digital infrastructure, data centers, smart scenic-area systems, and platform-based services can increase electricity demand and resource consumption. Platform algorithms and online traffic allocation can also concentrate tourist flows in already popular destinations, intensifying congestion, environmental pressure, and overtourism risks. Furthermore, small destinations and tourism SMEs with limited digital capacity may face disadvantages in platform visibility, data access, and technology adoption. Responsible digital transformation therefore requires green digital infrastructure, inclusive digital training for tourism firms, support for smaller destinations, transparent data governance, and monitoring systems that connect digital tourism growth with environmental carrying capacity and community well-being [8,9].

6.3. Limitations and Future Research

This study has several limitations. First, it uses National Big Data Comprehensive Pilot Zones as the policy shock and mainly examines the effect of a digital policy pilot, without constructing a composite indicator for the regional level of digital economy development. Future research can develop a more detailed indicator system for the digital economy from the perspectives of digital infrastructure, digital industries, digital innovation, and digital applications. Second, this study focuses on three mechanisms: digital infrastructure enablement, digital upgrading of the tourism industry, and regional innovation spillovers. However, the channels through which digital transformation affects tourism economy development may be more complex. Future research can further examine mechanisms related to the platform economy, digital finance, firm digital capability, tourist digital behavior, and public data openness. Third, this study is based on provincial panel data, which makes it possible to identify the overall policy effect at the regional level but limits the ability to reveal micro-level changes at the levels of cities, scenic areas, firms, and tourists. Future research can use more fine-grained data to further analyze how digital policy affects innovation in tourism firms, tourist experience, service quality, and community benefits.
Fourth, a supplementary extended-sample sensitivity analysis using data through 2023 is reported in Appendix A Table A1, while the primary identification window remains 2011–2019 to reduce potential confounding from the severe and uneven COVID-19 shock to the tourism industry. As a result, the findings are best understood as short- to medium-term evidence, and further work would be valuable to assess long-term policy effects. The shortened post-policy observation window in the primary sample may also mean that the estimated long-run effect is somewhat conservative, particularly for pilot regions with fewer post-treatment observations. Future research could usefully explore whether digital policy enhances the resilience and recovery capacity of the tourism economy during and after major external shocks, especially by incorporating city-level, destination-level, firm-level, or tourist-level data and more detailed measures of pandemic exposure.

Author Contributions

Conceptualization, Z.W.; methodology, Z.W.; software, Z.W.; validation, Z.W.; formal analysis, Z.W.; investigation, Z.W.; resources, Z.W.; data curation, Z.W.; writing—original draft preparation, Z.W.; writing—review and editing, M.L.; visualization, M.L.; supervision, M.L.; funding acquisition, Z.W. All authors have read and agreed to the published version of the manuscript.

Funding

This research was funded by the Hubei Provincial Social Science Foundation General Project (later-funded project), grant number HBSKJJ20253239; the 2025 China Ethnic Culture and Tourism Research General Project, grant number 2025B0024; and the Education Department of Hunan Province of China, grant number 25B0463.

Institutional Review Board Statement

Not applicable.

Informed Consent Statement

Not applicable.

Data Availability Statement

The data used in this study were obtained from the China Regional Economic Statistical Yearbook, the China Tourism Statistical Yearbook, provincial statistical yearbooks, and the EPS Data Platform. Because part of the underlying data is subject to third-party licensing restrictions, the compiled dataset is not publicly available. The data supporting the findings of this study are available from the corresponding author upon reasonable request, subject to the terms and conditions of the original data providers.

Acknowledgments

All authors sincerely acknowledge the valuable assistance provided by Deguang Liu in project administration.

Conflicts of Interest

The authors declare no conflicts of interest.

Appendix A

Table A1. Supplementary Extended-Sample Sensitivity Analysis Using 2011–2023 Data.
VariableExtended SampleS.E.
dig0.019 *(0.010)
GovFy0.032 ***(0.000)
SciEd0.014 ***(0.010)
invest0.001(0.000)
upgrade−0.010 *(0.010)
HUM0.001(0.000)
COVID0.028(0.080)
Control variablesYES
n390
R20.234
Adjusted R20.220
Notes: Standard errors are reported in parentheses. This auxiliary specification uses 2011–2023 data, includes a COVID-19 shock control, and is reported as a supplementary extended-sample sensitivity analysis. * and *** indicate significance at the 10% and 1% levels, respectively.

References

  1. Buckley, R. Sustainable Tourism: Research and Reality. Ann. Tour. Res. 2012, 39, 528–546. [Google Scholar] [CrossRef]
  2. Lee, T.H. Influence Analysis of Community Resident Support for Sustainable Tourism Development. Tour. Manag. 2013, 34, 37–46. [Google Scholar] [CrossRef]
  3. Rasoolimanesh, S.M.; Ramakrishna, S.; Hall, C.M.; Esfandiar, K.; Seyfi, S. A Systematic Scoping Review of Sustainable Tourism Indicators in Relation to the Sustainable Development Goals. J. Sustain. Tour. 2023, 31, 1497–1517. [Google Scholar] [CrossRef]
  4. Miller, G.; Torres-Delgado, A. Measuring Sustainable Tourism: A State of the Art Review of Sustainable Tourism Indicators. J. Sustain. Tour. 2023, 31, 1483–1496. [Google Scholar] [CrossRef]
  5. Buhalis, D.; Law, R. Progress in Information Technology and Tourism Management: 20 Years on and 10 Years after the Internet—The State of eTourism Research. Tour. Manag. 2008, 29, 609–623. [Google Scholar] [CrossRef]
  6. Gretzel, U.; Sigala, M.; Xiang, Z.; Koo, C. Smart Tourism: Foundations and Developments. Electron. Mark. 2015, 25, 179–188. [Google Scholar] [CrossRef]
  7. Buhalis, D.; Leung, R. Smart Hospitality—Interconnectivity and Interoperability towards an Ecosystem. Int. J. Hosp. Manag. 2018, 71, 41–50. [Google Scholar] [CrossRef]
  8. Gössling, S. Tourism, Technology and ICT: A Critical Review of Affordances and Concessions. J. Sustain. Tour. 2021, 29, 733–750. [Google Scholar] [CrossRef]
  9. Rodrigues, V.; Eusébio, C.; Breda, Z. Enhancing Sustainable Development through Tourism Digitalisation: A Systematic Literature Review. Inf. Technol. Tour. 2023, 25, 13–45. [Google Scholar] [CrossRef]
  10. Kukanja, M.; Planinc, T. Corporate Social Responsibility Practices, Managerial Attitudes Toward Artificial Intelligence, and AI Adoption in Micro and Small Restaurant SMEs. Sustainability 2026, 18, 3030. [Google Scholar] [CrossRef]
  11. Tang, R. Digital Economy Drives Tourism Development—Empirical Evidence Based on the UK. Econ. Res.-Ekon. Istraž. 2023, 36, 2003–2020. [Google Scholar] [CrossRef]
  12. Marino, A.; Pariso, P. E-Tourism: How ICTs Help the Local Tourist District Drive Economic Vitality. The Case of Campania, Italy. Int. J. Innov. Technol. Manag. 2021, 18, 2150009. [Google Scholar] [CrossRef]
  13. Miao, Z. Digital Economy Value Chain: Concept, Model Structure, and Mechanism. Appl. Econ. 2021, 53, 4342–4357. [Google Scholar] [CrossRef]
  14. Czernich, N.; Falck, O.; Kretschmer, T.; Woessmann, L. Broadband Infrastructure and Economic Growth. Econ. J. 2011, 121, 505–532. [Google Scholar] [CrossRef]
  15. Pan, W.; Xie, T.; Wang, Z.; Ma, L. Digital Economy: An Innovation Driver for Total Factor Productivity. J. Bus. Res. 2022, 139, 303–311. [Google Scholar] [CrossRef]
  16. Yu, D.; Yang, L.; Xu, Y. The Impact of the Digital Economy on High-Quality Development: An Analysis Based on the National Big Data Comprehensive Test Area. Sustainability 2022, 14, 14468. [Google Scholar] [CrossRef]
  17. Bertrand, M.; Duflo, E.; Mullainathan, S. How Much Should We Trust Differences-in-Differences Estimates? Q. J. Econ. 2004, 119, 249–275. [Google Scholar] [CrossRef]
  18. Rosenbaum, P.R.; Rubin, D.B. The Central Role of the Propensity Score in Observational Studies for Causal Effects. Biometrika 1983, 70, 41–55. [Google Scholar] [CrossRef]
  19. Gretzel, U.; Werthner, H.; Koo, C.; Lamsfus, C. Conceptual Foundations for Understanding Smart Tourism Ecosystems. Comput. Hum. Behav. 2015, 50, 558–563. [Google Scholar] [CrossRef]
  20. Boes, K.; Buhalis, D.; Inversini, A. Smart Tourism Destinations: Ecosystems for Tourism Destination Competitiveness. Int. J. Tour. Cities 2016, 2, 108–124. [Google Scholar] [CrossRef]
  21. Ivars-Baidal, J.A.; Celdrán-Bernabeu, M.A.; Mazón, J.-N.; Perles-Ivars, Á.F. Smart Destinations and the Evolution of ICTs: A New Scenario for Destination Management? Curr. Issues Tour. 2019, 22, 1581–1600. [Google Scholar] [CrossRef]
  22. Vial, G. Understanding Digital Transformation: A Review and a Research Agenda. J. Strateg. Inf. Syst. 2019, 28, 118–144. [Google Scholar] [CrossRef]
  23. Verhoef, P.C.; Broekhuizen, T.; Bart, Y.; Bhattacharya, A.; Dong, J.Q.; Fabian, N.; Haenlein, M. Digital Transformation: A Multidisciplinary Reflection and Research Agenda. J. Bus. Res. 2021, 122, 889–901. [Google Scholar] [CrossRef]
  24. Röller, L.-H.; Waverman, L. Telecommunications Infrastructure and Economic Development: A Simultaneous Approach. Am. Econ. Rev. 2001, 91, 909–923. [Google Scholar] [CrossRef]
  25. Koutroumpis, P. The Economic Impact of Broadband on Growth: A Simultaneous Approach. Telecommun. Policy 2009, 33, 471–485. [Google Scholar] [CrossRef]
  26. Bertschek, I.; Cerquera, D.; Klein, G.J. More Bits—More Bucks? Measuring the Impact of Broadband Internet on Firm Performance. Inf. Econ. Policy 2013, 25, 190–203. [Google Scholar] [CrossRef]
  27. Sigala, M. New Technologies in Tourism: From Multi-Disciplinary to Anti-Disciplinary Advances and Trajectories. Tour. Manag. Perspect. 2018, 25, 151–155. [Google Scholar] [CrossRef]
  28. Hjalager, A.-M. A Review of Innovation Research in Tourism. Tour. Manag. 2010, 31, 1–12. [Google Scholar] [CrossRef]
  29. Divisekera, S.; Nguyen, V.K. Determinants of Innovation in Tourism Evidence from Australia. Tour. Manag. 2018, 67, 157–167. [Google Scholar] [CrossRef]
  30. Tödtling, F.; Trippl, M. One Size Fits All? Towards a Differentiated Regional Innovation Policy Approach. Res. Policy 2005, 34, 1203–1219. [Google Scholar] [CrossRef]
  31. Breschi, S.; Lissoni, F. Knowledge Spillovers and Local Innovation Systems: A Critical Survey. Ind. Corp. Change 2001, 10, 975–1005. [Google Scholar] [CrossRef]
  32. Asheim, B.T.; Boschma, R.; Cooke, P. Constructing Regional Advantage: Platform Policies Based on Related Variety and Differentiated Knowledge Bases. Reg. Stud. 2011, 45, 893–904. [Google Scholar] [CrossRef]
  33. Becker, S.O.; Egger, P.H.; von Ehrlich, M. Going NUTS: The Effect of EU Structural Funds on Regional Performance. J. Public Econ. 2010, 94, 578–590. [Google Scholar] [CrossRef]
  34. Li, Q.; Du, K. Evaluation of the Impact of the Establishment of National Big Data Comprehensive Pilot Zones on Regional Digital Economy Development. Sci. Technol. Manag. Res. 2021, 41, 81–89. (In Chinese) [Google Scholar]
  35. Liu, R.; Zhao, R. Have National High-Tech Zones Promoted Regional Economic Development? Evidence from a Difference-in-Differences Approach. Manag. World 2015, 8, 30–38. (In Chinese) [Google Scholar] [CrossRef]
  36. Tian, X.; Meng, Q. Can Equity Incentive Plans Promote Corporate Innovation? Nankai Bus. Rev. 2018, 21, 176–190. (In Chinese) [Google Scholar]
  37. Tian, L.; Wang, K. The Concealing Effect of Corporate Social Responsibility Disclosure and Stock Price Crash Risk: Evidence from China’s Stock Market Based on DID-PSM Analysis. Manag. World 2017, 11, 146–157. (In Chinese) [Google Scholar] [CrossRef]
  38. China.org.cn. New Concept for Development. Available online: https://www.china.org.cn/english/china_key_words/2023-01/12/content_85056662.html (accessed on 16 May 2026).
  39. Sun, X.; Liu, L.; Chen, J. Measurement of High Quality Development of China’s Tourism Economy. Stat. Decis. 2021, 37, 126–130. (In Chinese) [Google Scholar]
  40. Zhang, X.; Liang, X.; Song, X.; Zhao, Y. Spatial Network Structure and Formation Mechanism of High-Quality Integrated Development of the Culture and Tourism Industry. Stat. Decis. 2022, 38, 16–21. (In Chinese) [Google Scholar]
  41. Liu, Y.; Tang, J. Measurement and Spatiotemporal Evolution Characteristics of the High-Quality Development Level of China’s Tourism Industry. Stat. Decis. 2022, 38, 91–96. (In Chinese) [Google Scholar]
  42. Zhao, T.; Zhang, Z.; Liang, S. Digital Economy, Entrepreneurial Activity and High-Quality Development: Empirical Evidence from Chinese Cities. Manag. World 2020, 36, 65–76. (In Chinese) [Google Scholar]
  43. Wu, F.; Chang, X.; Ren, X. Government-Driven Innovation: Fiscal Science and Technology Expenditure and Enterprise Digital Transformation. Public Financ. Res. 2021, 1, 102–115. (In Chinese) [Google Scholar]
  44. Hou, L.; Cheng, G.; Wang, Y. How the National Big Data Comprehensive Pilot Zone Enables Enterprises to Make Digital Transformation. Sci. Technol. Prog. Policy 2023, 40, 45–55. (In Chinese) [Google Scholar] [CrossRef]
  45. Imai, K.; Keele, L.; Tingley, D. A General Approach to Causal Mediation Analysis. Psychol. Methods 2010, 15, 309–334. [Google Scholar] [CrossRef] [PubMed]
  46. Liu, N.; Song, Q.; Hou, J.; An, K.K.; Liu, J. Evolution of Tourism Industrial Structure and Spatial Network in China. Geogr. Geo-Inf. Sci. 2020, 36, 119–127. (In Chinese) [Google Scholar]
  47. Liu, Y.; Han, Y. Factor structure, institutional environment and high-quality development of the tourism economy in China. Tour. Trib. 2020, 35, 28–38. (In Chinese) [Google Scholar]
  48. Zhao, L.; Fang, C. Nonlinear Threshold Effects between Tourism and Economic Growth: A Panel Smooth Transition Regression Approach. Tour. Trib. 2017, 32, 20–32. (In Chinese) [Google Scholar]
  49. Beck, T.; Levine, R.; Levkov, A. Big Bad Banks? The Winners and Losers from Bank Deregulation in the United States. J. Financ. 2010, 65, 1637–1667. [Google Scholar] [CrossRef]
  50. Li, P.; Lu, Y.; Wang, J. Does Flattening Government Improve Economic Performance? Evidence from China. J. Dev. Econ. 2016, 123, 18–37. [Google Scholar] [CrossRef]
  51. Zhao, L. Tourism Development and Economic Growth: Empirical Evidence from China. Tour. Trib. 2015, 30, 33–49. (In Chinese) [Google Scholar]
Figure 1. Parallel trends test with 95% confidence intervals. Note: The vertical dashed line indicates the year of policy implementation (event time 0).
Sustainability 18 06327 g001
Figure 2. Distribution of placebo coefficients. Notes: The vertical red dashed line marks the observed baseline DID estimate of 0.041. The horizontal red dashed line indicates the 10% significance threshold. The dots represent placebo estimates from 500 random assignments, and the curve shows the kernel density of the placebo coefficients.
Sustainability 18 06327 g002
Table 1. Indicator System for Measuring the Sustainability-Oriented High-Quality Development of the Tourism Economy.
TargetPrimary DimensionSecondary DimensionMeasurement
Sustainability-oriented high-quality development of the tourism economyInnovation developmentInvestment efficiencyTotal tourism revenue/total social fixed-asset investment
Labor productivityTotal tourism revenue/number of employees in the tourism industry
Innovation inputR&D expenditure intensity
Technological outputNumber of patents granted
Coordinated developmentRegional coordinationRegional tourism revenue/regional GDP
Industrial coordinationTourism revenue/value added of the tertiary industry
Urban–rural coordinationShare of urban population
Green developmentPollution emissions(total tourism revenue/GDP) × total wastewater discharge
Ecological endowmentPer capita park green area, in square meters
Environmental governanceGarbage treatment rate, in %
Open developmentTourism foreign exchange earningsForeign exchange earnings/total tourism revenue
Transport accessibilityPassenger volume by railway and highway, in 10,000 passenger-trips
Cultural disseminationNumber of cultural and artistic performances
Shared developmentTourism infrastructureFixed assets in the tourism industry, in 10,000 yuan
Tourism cultural resourcesNumber of museums
Tourism reception capacityNumber of travel agencies, hotels, and A-level or higher scenic areas
Table 2. Baseline Regression Results.
(1)(2)
dig0.041 ***
(0.013)
0.054 ***
(0.012)
govfy−0.025 **
(0.012)
−0.033 **
(0.013)
scied−0.011
(0.007)
−0.016
(0.013)
invest0.006 **
(0.002)
0.009 **
(0.004)
upgrade0.001
(0.004)
0.001
(0.005)
hum−0.002
(0.002)
−0.001
(0.002)
cons0.319 ***
(0.073)
0.362 ***
(0.101)
Fixed effectsYESYES
n270238
Adjusted R20.8520.840
Notes: Cluster-robust standard errors are reported in parentheses. ** and *** indicate significance at the 5% and 1% levels, respectively.
Table 3. Robustness Test Results Using Alternative Dependent Variables.
(3)(4)(5)
dig0.395 **
(0.176)
0.357 **
(0.013)
3.435 **
(1.480)
Control variablesYESYESYES
Fixed effectsYESYESYES
n270270270
R20.8410.8870.613
Notes: Cluster-robust standard errors are reported in parentheses. ** indicates significance at the 5% level.
Table 4. Additional Robustness Test Results Based on the Primary 2011–2019 Sample.
(6)(7)(8)(9)
dig0.0190
(0.014)
0.034 **
(0.013)
0.037 ***
(0.012)
0.038 ***
(0.013)
Control variablesYESYESYESYES
Fixed effectsYESYESYESYES
n270270240270
R20.8420.8870.8630.832
Notes: Cluster-robust standard errors are reported in parentheses. ** and *** indicate significance at the 5% and 1% levels, respectively.
Table 5. Regional Heterogeneity and Interaction Results.
(10)(11)(12)
ScoreScoreScore
dig0.065 ***
(0.01)
0.032 **
(0.01)
0.073 ***
(0.01)
d i g × r e g i o n −0.066 ***
(0.02)
Control variablesYESYESYES
Fixed effectsYESYESYES
n17199270
R20.7120.9190.860
adj. R20.6640.9030.838
Notes: Cluster-robust standard errors are reported in parentheses. ** and *** indicate significance at the 5% and 1% levels, respectively.
Table 6. Heterogeneity and Interaction Results by Pilot-Zone Type.
(13)(14)(15)
ScoreScoreScore
dig0.039 **
(0.01)
0.035
(0.03)
0.040 ***
(0.01)
d i g × c r o s s   r e g i o n −0.008
(0.03)
Cross region −0.000 *
(0.00)
Control variablesYESYESYes
Fixed effectsYESYESYes
N225225450
R20.8140.8530.838
adj. R20.7850.8310.823
Notes: Cluster-robust standard errors are reported in parentheses. *, **, and *** indicate significance at the 10%, 5%, and 1% levels, respectively.
Table 7. Dimension-Specific Heterogeneity Results.
(16)(17)(18)(19)(20)
dig0.078 ***
(0.015)
0.066 *
(0.038)
0.079 ***
(0.023)
0.021 ***
(0.007)
0.070 **
(0.033)
Control variablesYESYESYESYESYES
Fixed effectsYESYESYESYESYES
n270270270270270
R20.8680.5610.8110.8960.783
Notes: Cluster-robust standard errors are reported in parentheses. *, **, and *** indicate significance at the 10%, 5%, and 1% levels, respectively.
Table 8. Results of Mechanism-Oriented Empirical Analysis.
(21)(22)(23)(24)(25)(26)
lnfHqdLndHqdLniHqd
dig0.538 ***
(0.125)
0.019 **
(0.008)
0.590 ***
(0.134)
0.028 ***
(0.006)
0.503 ***
(0.0936)
0.023 **
(0.008)
lnf 0.067 ***
(0.007)
Lnd 0.049 ***
(0.004)
Lni 0.067 ***
(0.008)
Control variablesYESYESYESYESYESYES
Fixed effectsYESYESYESYESYESYES
n270270270270270270
R20.8220.9270.6390.9420.927 0.908
Notes: Cluster-robust standard errors are reported in parentheses. ** and *** indicate significance at the 5% and 1% levels, respectively.
Disclaimer/Publisher’s Note: The statements, opinions and data contained in all publications are solely those of the individual author(s) and contributor(s) and not of MDPI and/or the editor(s). MDPI and/or the editor(s) disclaim responsibility for any injury to people or property resulting from any ideas, methods, instructions or products referred to in the content.