Article

Trade-Offs Between Production–Living–Ecological Space Transformation and Ecosystem Carbon Stock Under Multi-Scenario Simulation in the Qinghai Lake Basin


by
Lei Li
1,2,3,
Xingyue Li
1,2,3,
Chengyong Wu
3,4,
Yanli Han
5,
Ziwei Yang
1,2,3,
Yuyu Ma
1,2,3,
Dong Han
1,2,3 and
Kelong Chen
1,2,3,*
1
College of Geographical Science, Qinghai Normal University, Xining 810008, China
2
Key Laboratory of Tibetan Plateau Land Surface Processes and Ecological Conservation (Ministry of Education), Qinghai Normal University, Xining 810008, China
3
National Positioning Observation and Research Station of Qinghai Lake Wetland Ecosystem in Qinghai, National Forestry and Grassland Administration, Haibei 812300, China
4
College of Resources and Environmental Engineering, Tianshui Normal University, Tianshui 741001, China
5
College of Ecological Environmental and Resources, Qinghai Minzu University, Xining 810007, China
*
Author to whom correspondence should be addressed.
Sustainability 2026, 18(12), 6199; https://doi.org/10.3390/su18126199
Submission received: 9 May 2026 / Revised: 9 June 2026 / Accepted: 11 June 2026 / Published: 16 June 2026
(This article belongs to the Special Issue Geospatial Analysis for Sustainable Environmental Management)

Abstract

The Qinghai Lake Basin, a typical ecologically vulnerable, high-altitude, cold region, requires coordinated ecosystem conservation and socio-economic development to achieve territorial sustainability. Based on the Production–Living–Ecological Space (PLES) framework, this study used land use data from five periods between 2000 and 2020 and integrated the PLUS and InVEST models to examine and simulate the evolution of PLES patterns and carbon stock under four scenarios—natural development, ecological protection, economic development, and sustainable development—in 2035. The results show that the PLES pattern in the Qinghai Lake Basin remained generally stable from 2000 to 2020, with ecological space dominating the landscape, while production and living spaces expanded slowly. Carbon stock increased from 214.73 × 10⁶ Mg to 264.70 × 10⁶ Mg, representing a growth rate of 23.27%. Its spatial distribution is highly consistent with the PLES pattern, with ecological space being the main contributor. By 2035, carbon stock is projected to slightly increase under the natural development scenario; under the ecological protection scenario, the expansion of ecological space leads to an increase in carbon stock; it decreases under the economic development scenario due to the encroachment of ecological space by construction land expansion; and under the sustainable development scenario, which balances economic development and ecological protection, carbon stock increases by 4.87 × 10⁶ Mg, achieving the best overall performance. Therefore, it is essential to properly coordinate the relationships among PLES components to achieve synergistic enhancement of ecosystem services and regional sustainable development. The findings provide methodological references and decision support for sustainable development in the Qinghai–Tibet Plateau and other ecologically vulnerable regions.

1. Introduction

1.1. Research Background

The Qinghai Lake Basin, as a typical high-altitude inland lake ecosystem, serves as an important ecological security barrier in the northeastern Tibetan Plateau and represents a fragile cold-region ecosystem [1]. In recent years, against the backdrop of climate warming, human disturbances such as tourism development and livestock activities have continuously intensified, resulting in significant changes in land use patterns in the basin [2,3]. Due to the low stability of high-altitude, cold region ecosystems, regional carbon stock and carbon cycling processes are particularly sensitive to land use changes and spatial pattern adjustments, making the Qinghai Lake Basin an important area for studying the ecological effects of land use change in high-altitude, cold regions [4,5].
The Production–Living–Ecological Space (PLES) framework emphasizes the functional attributes of land spaces and their coordination, providing an effective approach to reveal the spatial conflicts and ecological consequences between land resource development and ecological protection in fragile cold regions [6]. With ongoing implementation of ecological protection policies and increasing economic development demands, competition and transformation among production, living, and ecological spaces in the Qinghai Lake Basin have become increasingly prominent [7]. The encroachment of ecological space and land use conflicts have intensified, and the restructuring of PLES not only alters the regional landscape pattern but also further affects ecosystem carbon sources and sinks and the stability of carbon stock [8,9]. Studying land-system structural changes and their responses in carbon stock from a PLES perspective is of great significance for elucidating the ecological effects of land use change in high-altitude, cold regions, optimizing regional territorial spatial patterns, and achieving sustainable ecosystem development.

1.2. Literature Review

At present, global sustainable development and low-carbon transition have become core directions for regional development. The optimization of territorial space, ecological protection, and carbon mitigation are complementary and constitute important support for promoting low-carbon development [10]. With the continuous advancement of territorial space optimization and ecological civilization construction, the PLES framework has gradually become an important topic in land system science [11]. Jin et al. [12] systematically elaborated the scientific connotation and optimization pathways of coordinated development among the three types of space, providing a theoretical basis for research on territorial space functions. Bu et al. [13] employed multi-source geographic data and machine learning methods to identify PLES functional patterns, further promoting the quantitative study of PLES. However, studies that systematically couple the PLES trade-off analysis framework with dynamic simulation of carbon stock remain relatively scarce.
In terms of carbon stock research, commonly used estimation models include the CENTURY model [14], the Biome-BGC model [15], and the CASA model [16]. These models generally require extensive parameters and data, which introduces certain uncertainties when applied at the regional scale. In contrast, the InVEST model can efficiently evaluate the integrated effects of land use changes on different carbon pools and has been widely applied in carbon stock assessment [17]. Nelson et al. [18] first proposed an ecosystem service trade-off simulation approach, laying the foundation for the application of the InVEST model in ecosystem service assessment. Regarding multi-scenario simulation, Liang et al. [19] developed the PLUS model based on patch-generation mechanisms, providing a new technical approach for multi-scenario land use simulation. Subsequently, Zhang et al. [20] applied the PLUS model to simulate land use changes in the Fuxian Lake Basin, verifying its applicability at the watershed scale. Zhang et al. [21], Xiao [22], and Sun et al. [23] coupled the PLUS–InVEST framework to study the spatiotemporal evolution of carbon stock at watershed, national park, and Tibetan Plateau scales, better exploring the impacts of multi-scenario simulation on regional carbon stock capacity.
Moreover, the Tibetan Plateau and the Qinghai Lake Basin, as typical high-altitude, cold regions, have gradually become hotspots in ecological and environmental research. Gong [24] emphasized the importance of ecological security in the Tibetan Plateau from the perspective of ecological protection legislation. Hua et al. [25] showed that ecosystem services on the Tibetan Plateau are highly sensitive to climate change. Focusing on the Qinghai Lake Basin, Wang et al. [26] analyzed the spatiotemporal dynamics of regional ecological carbon sinks but did not reveal the response differences of carbon stock to land use changes under different development pathways. Mei et al. [27] examined regional ecological security patterns from the perspectives of ecosystem services and ecological risks, providing important references for research on high-altitude, cold regions, but lacked a quantitative characterization of the trade-offs among PLES functions.

1.3. Research Gaps

In summary, although existing studies have achieved substantial progress in PLES evolution, land use simulation, and carbon stock assessment, several limitations remain. (1) Limitations in spatial scale: most current PLES studies are concentrated in urban agglomerations, provincial regions, or plain areas in central and eastern China, as well as general watersheds, while studies focusing on high-altitude, cold region characteristics, PLES classification, and scenario simulation remain insufficient. (2) Relatively single research perspective: existing studies mainly focus on land use change or carbon stock dynamics, with limited attention to revealing regional ecological change mechanisms from the perspective of trade-offs among production–living–ecological spaces. (3) Insufficient comprehensive scenario analysis: current applications of the PLUS–InVEST model mainly focus on carbon stock assessment under a single scenario, while comparative studies on PLES evolution and its impacts on carbon stock under different development pathways remain limited and require further improvement.

1.4. Aim of the Work

Based on the PLES functional zoning framework, this study constructs a coupled PLUS–InVEST model to simulate the evolution of land spatial patterns and corresponding carbon stock responses in the Qinghai Lake Basin under multiple scenarios in 2035, thereby revealing the internal coupling mechanism from the perspective of “multi-functional space–landscape pattern evolution–carbon stock response.”
The objectives of this study are as follows: (1) to reveal the spatiotemporal evolution characteristics and spatial transformation patterns of PLES in the Qinghai Lake Basin; (2) to analyze the differences in the impacts of PLES changes on regional carbon stock under different development scenarios; and (3) to explore the coupling relationship and ecological effects between PLES evolution and carbon stock responses. This study aims to provide a scientific reference for territorial spatial optimization and low-carbon development in high-altitude, cold regions, as well as methodological support for production development, living improvement, and ecological protection in similar ecologically fragile regions.

2. Materials and Methods

2.1. Study Area

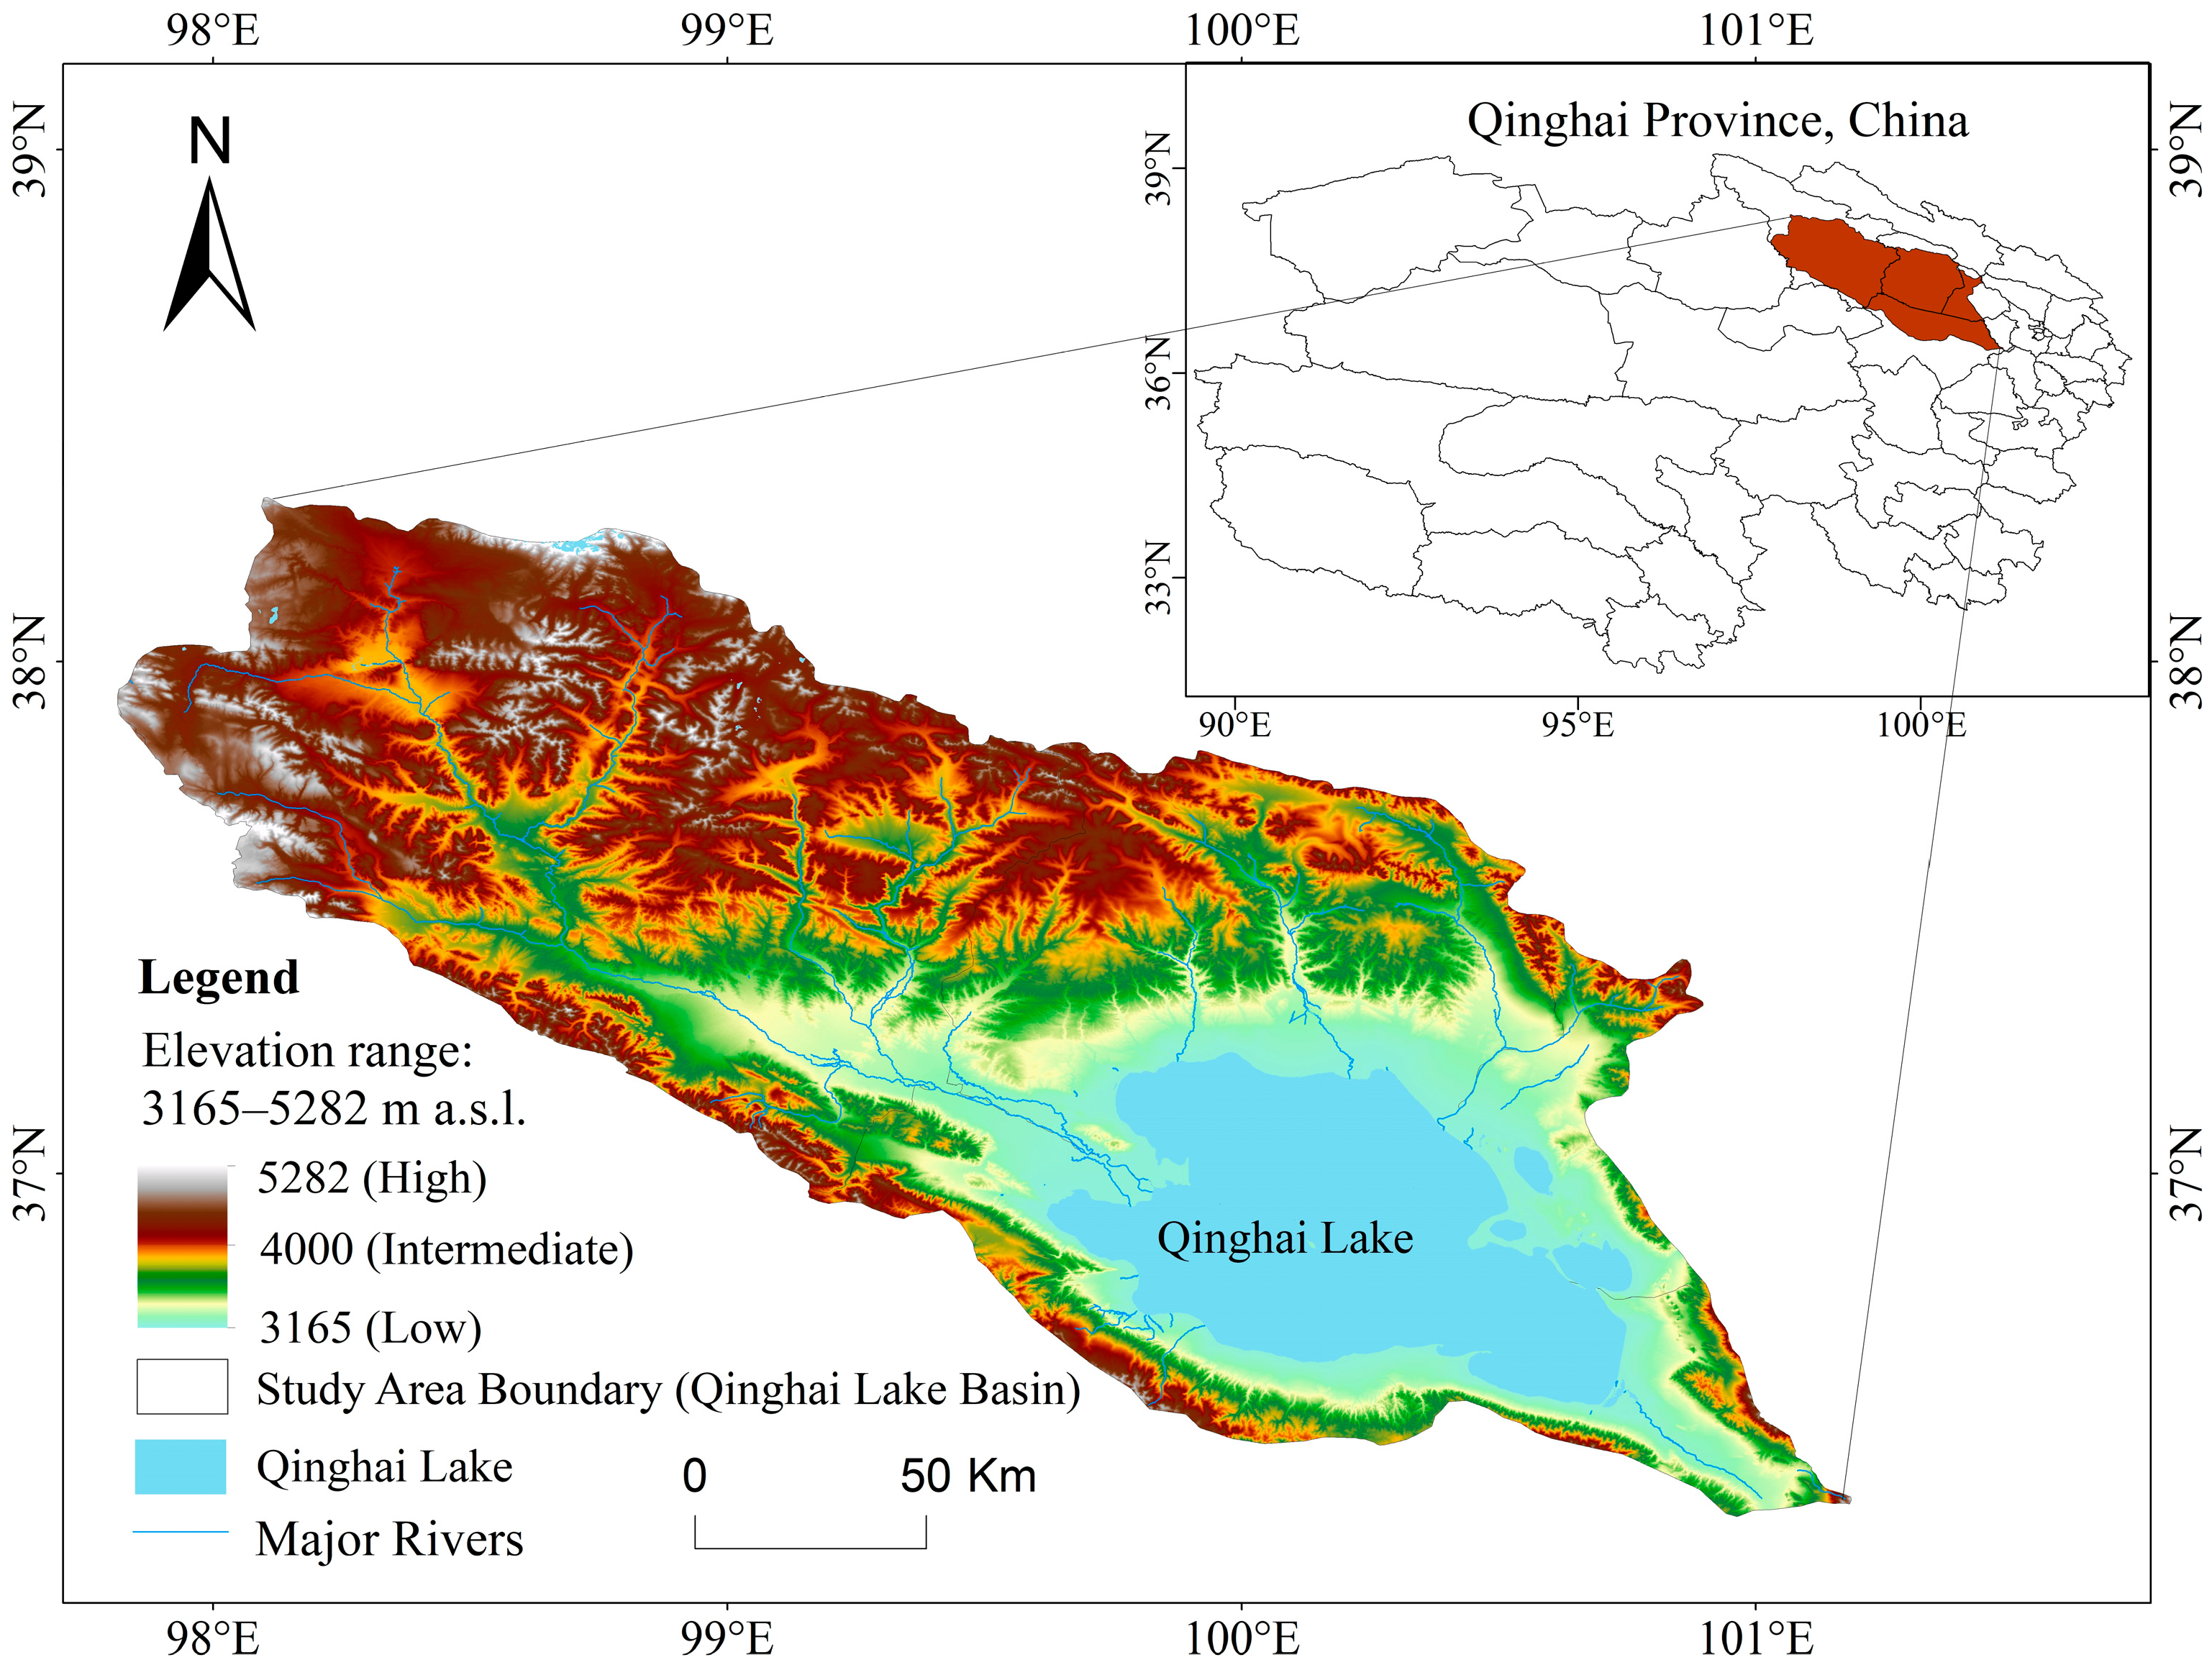
The Qinghai Lake Basin is located in the northeastern part of the Qinghai–Tibet Plateau (36°15′–38°20′ N, 97°50′–101°20′ E) [28] and is one of the key ecological functional areas for ensuring ecological security in the region. The basin spans an area of approximately 29,600 km2 [29]. The overall topography slopes from the northwest to the southeast (Figure 1). It is a typical plateau inland basin, with a lake surface elevation of about 3200 m [30]. The study area has a typical plateau continental climate, with low temperatures and pronounced interannual variability. The mean annual precipitation is approximately 350–400 mm, mainly concentrated in summer [31]. Influenced by climatic conditions and topography, the region’s vegetation is dominated by high-altitude meadows and grasslands, and the ecological environment is highly fragile and sensitive. From the perspective of land—use multifunctionality, ecological space is dominant in the basin, while production space is mainly composed of pastoral land, and living space is primarily located in towns surrounding the lake.

2.2. Data Sources

This study uses land use data from five stages. Driving factors include natural, socio-economic, and locational variables. Of these, natural factors, for instance DEM and slope, are treated as time—invariant variables. Dynamic factors, including NDVI, GDP, and population density, are derived from the baseline year. Precipitation and temperature are calculated as multi-year averages to reduce interannual variability. Locational factors such as roads and urban areas are derived from the latest spatial datasets (Table 1). All driving factors were processed through clipping, projection transformation, resampling, and normalization, based on the ArcMap10.8.1 (ESRI, Redlands, CA, USA) Euclidean distance analysis tool. Spatial distance variables were extracted for each raster cell to roads, rivers, lakes, urban areas, and railways.
Using the PLES land-function framework [32] (Table 2), land use data were classified into three primary categories and further subdivided into secondary classes. This classification system was mainly constructed based on land use functional attributes, the existing PLES theoretical framework, and previous studies in the Qinghai Lake Basin [33]. Considering the regional characteristics of the Qinghai Lake Basin as a typical high-altitude, cold region, the classification system was adapted to local conditions.
Specifically, ecological lands such as grasslands, wetlands, and water bodies account for a relatively high proportion of the basin and exhibit prominent ecological functions; these were prioritized as ecological space. Although natural grasslands in the basin possess certain pastoral production functions, their dominant roles lie in ecological maintenance, water conservation, and carbon stock provision. Following the principle of prioritizing dominant functions, high-, medium-, and low-coverage grasslands were uniformly classified as grassland ecological space. Croplands and orchards, primarily serving agricultural production functions, were assigned to production space. Industrial and mining lands, as well as new energy facilities, mainly support resource extraction and industrial production, and were also included in the production space. Urban residential areas, commercial facilities, and rural settlements, which primarily accommodate population residence, public services, and social activities, were classified as living space [34]. Moreover, considering the extensive distribution of deserts, sandy lands, and bare lands under the cold-arid conditions of the Qinghai Lake Basin, although their ecological functions are relatively fragile, they play important roles in windbreak, sand fixation, and maintaining regional ecological barriers, and were therefore incorporated into other ecological spaces [35].

2.3. Methods

2.3.1. Land Use Transfer Matrix

The land use transfer matrix can reflect changes in land use structure and the conversion relationships among different land use types. By summing the rows and columns of the matrix, the transferred-out area and transferred-in area of each land use type can be obtained [36]. In this study, a land use transfer matrix for the period 2000–2020 was constructed. The ArcMap10.8.1(ESRI, Redlands, CA, USA) cross-tabulation tool was used to calculate the number of transferred land use pixels. Since the spatial resolution of the land use data was 30 m × 30 m, the area of each pixel was 0.09 ha (hectare; 1 ha = 10,000 m2 = 0.01 km2). The number of transferred pixels was multiplied by the area of a single pixel to convert the transferred pixel counts into actual areas (ha).
To ensure the validity and reliability of the transfer matrix results, two verification procedures were conducted: (1) the sum of all transferred pixels and unchanged pixels was checked against the total number of pixels in the study area to ensure that no omission or overlap occurred; (2) the final-year area of each land use type derived from the transfer matrix was compared with the actual land use statistical area for the corresponding year. The results confirmed the reliability of the transfer matrix. The mathematical expression is as follows:
S i j   =   S 11 S 12 S 1 n S 21 S 22 S 2 n S n 1 S n 2 S n n
where represents the area (ha) converted from land use type in the early period to land use type j in the final period, and n is the number of PLES land use types.

2.3.2. Land Use Dynamic Degree

The land use dynamic degree characterizes the intensity and dynamics of land use change. It complements the land use transfer matrix, which describes structural changes, and together they can provide a more extensive characterization of land use evolution within the study area [37]. The formula is expressed as follows:
K   = U y U x U x × 1 T × 100 %
where K represents the dynamic degree of a specific land—use type (%), U x is the area (ha) of a given land use type at the beginning of the study period, U y is the area (ha) at the end of the study period, and T is the study duration (years).

2.3.3. InVEST Model

The Carbon Stock module of the InVEST model is employed to estimate carbon stock in the study area. It assigns carbon density values to each land use type and calculates regional carbon stock and its spatial distribution through cell–by–cell aggregation [38]. This approach can be used to quantify changes in carbon stock under different land use scenarios. Carbon stock is quantified as follows:
C t o t a l   =   C a b o v e + C b e l o w + C s o i l + C d e a d
where C t o t a l is the total carbon stock (Mg·ha−1), C a b o v e is the aboveground carbon stock (Mg·ha−1), C b e l o w is the belowground carbon stock (Mg·ha−1), C s o i l is the soil carbon stock (Mg·ha−1), and C d e a d is the litter carbon stock (Mg·ha−1).
Carbon stock estimation results are jointly affected by carbon density variation and land use change. Considering that carbon density changes dynamically over time, this study adopted a dynamic carbon density adjustment method to improve estimation accuracy [39,40]. The baseline carbon density data used in this study were obtained from the studies of Ma, Y.J. et al. [41] and Li, J. [42] on the Qinghai Lake Basin and Qinghai Province. The carbon density data reported in previous studies were derived from field sampling, regional model estimation, and biomass carbon density correction methods based on annual mean temperature and therefore served as suitable baseline parameters for the Qinghai Lake Basin.
First, carbon density data from previous studies in the Qinghai Lake Basin were collected. Based on NDVI raster data and land use data from the same year, the mean NDVI value corresponding to each land-cover type was calculated. The carbon density values of each land-cover type were then paired with the corresponding mean NDVI values to obtain multiple datasets for analyzing the relationship between NDVI and carbon density. Pearson correlation analysis showed that carbon density was significantly positively correlated with NDVI across different land use types in the Qinghai Lake Basin (r = 0.78–0.91, p < 0.01). Therefore, the proportional variation in NDVI was used to dynamically adjust carbon density (Table 3). The correction formula is as follows:
C i , t   =   C i × N D V I t N D V I r e f
where C i , t is the corrected carbon density of land use type i in year t (Mg·ha−1), C i is the baseline carbon density (Mg·ha−1), N D V I t is the normalized difference vegetation index in year t , and N D V I r e f is the NDVI in the year 2000. The year 2000 was selected as the baseline year, as it represents the starting point of the dataset in this study and corresponds to a period with relatively weak human disturbance. To ensure the reliability of the correction method, the adjusted carbon density values for each land use type were compared with the contemporaneous observed or estimated values reported in previous studies [40] for the Qinghai Lake Basin. The relative errors were all within ±5%, indicating that the dynamic correction approach is reliable.
To investigate the influence of carbon density parameter uncertainty on regional total carbon stock estimation, this study used the corrected carbon density values of each land use type as the baseline and conducted a sensitivity analysis by applying ±5% and ±10% disturbance ranges while keeping the spatial distribution pattern unchanged. The results showed that when carbon density varied within ±5%, the relative variation in total carbon stock in the study area was less than 4.2%. Even when the disturbance range was expanded to ±10%, the relative variation in total carbon stock remained below 8.5%. These results indicate that parameter uncertainty has a limited impact on the study conclusions, and the carbon stock estimation results exhibit a certain degree of stability with respect to variations in carbon density parameters.

2.3.4. PLUS Model

The PLUS model is a land use change simulation model that simulates the spatial expansion processes of different land use types by analyzing the relationships between historical land use data and driving factors. The model mainly consists of two modules: the Land Expansion Analysis Strategy (LEAS) module and the Cellular Automata based on Random Seeds (CARS) module [43]. In this study, the PLES land use data of the Qinghai Lake Basin from 2000 and 2020 were used to predict the spatial distribution pattern of PLES land use in 2035. Under the LEAS module, the development probabilities of different PLES land use types were obtained. Subsequently, in the CARS module, the 2010 PLES land use data, together with key parameters such as land development probability, were used to simulate the PLES distribution of the Qinghai Lake Basin in 2020. The simulated results were then compared with the actual land use data of 2020 for validation. The confusion matrix results are presented in Table 4 shows that the model achieved an overall accuracy of 0.878, with a Kappa coefficient of 0.807 and a Figure of Merit (FOM) of 0.329. Therefore, the PLUS model was considered capable of meeting the requirements for simulating the PLES spatial pattern in the Qinghai Lake Basin and could be reliably applied for multi-scenario land use predictions in 2035.

2.3.5. Multi-Scenario Setting

This study refers to the Qinghai Provincial Territorial Spatial Planning and previous studies on land use change in the Qinghai–Tibet Plateau [44]. In combination with the ecological protection requirements of the Qinghai Lake Basin, spatial transition parameters were set by quantifying the spatial transformation rules and expansion potential of different land use types under various scenarios through two core parameters: the land use transition cost matrix and neighborhood weights. In the land use transition cost matrix, a value of 0 indicates that the conversion of a certain land use type is restricted, while a value of 1 indicates that the conversion is permitted [45]. Regarding scenario assumptions and constraints, four development scenarios were established:
Natural development scenario (NDS): No additional human interventions are applied, and the historical trends and patterns of land use change are extended to simulate the spontaneous evolution of land use in the basin. Based on the land use change characteristics from 2000 to 2020, the annual change rate of each land use type was calculated, and the trend extrapolation method was used to predict land use demand in 2035.
Ecological protection scenario (EPS): Prioritizing ecological protection, this scenario strictly controls the loss of ecological space. The conversion of core ecological lands, such as grassland and forest ecological space, into production or living spaces is prohibited, and these types are assigned a value of 0 in the cost matrix. Conversely, the conversion of production and living spaces into ecological space is permitted and assigned a value of 1. Human activity-induced disorderly expansion is strictly constrained.
Economic development scenario (EDS): This scenario balances regional socio-economic development needs and moderately relaxes restrictions on the expansion of urban, industrial, and transportation construction lands, while maintaining the basic farmland protection baseline and allowing reasonable expansion of production and living spaces. Conversions from grassland and other ecological spaces to urban living and industrial production spaces are permitted (value = 1). However, considering regional ecological security requirements, important ecological lands such as water bodies are still restricted from conversion to construction land (value = 0).
Sustainable development scenario (SDS): Following the principles of ecological priority and coordinated development, this scenario strengthens the protection of ecological space while ensuring regional economic development. The conversion probability of ecological lands such as forests, grasslands, and water bodies is moderately increased, and natural succession among ecological lands is still allowed (value = 1). Conversion of ecological land to construction land is appropriately restricted, and the expansion of urban and industrial land is reasonably controlled to achieve an optimized land use structure and enhanced regional carbon stock.
The values were determined based on the spatial evolution characteristics of land use and previous studies and were adjusted according to different scenarios [46] (Table 5). In the NDS, the grassland ecological space weight is set to 0.8 due to its strong spatial stability and expansion inertia. In the EPS, the neighborhood weights of grassland ecological space, forest ecological space, and other ecological spaces are significantly increased to 0.9, 0.8, and 0.7, respectively, while the weights of industrial and mining production spaces and urban living spaces are reduced to 0.3 to restrict the expansion of construction land and enhance ecological space stability. In the EDS, the weights of industrial and mining production spaces and urban living spaces are increased to 0.7 and 0.6, respectively, to enhance the expansion potential of construction land, while the weights of grassland and forest ecological spaces are reduced to meet economic development demands. In the SDS, both ecological protection and economic development are considered. Grassland ecological space maintains a relatively high weight of 0.8, while the weights of forest and water ecological spaces are moderately increased to 0.5, and the expansion of industrial, mining, and urban living spaces is controlled to achieve an optimized land use structure and improved ecological benefits.

3. Results

3.1. Characteristics of PLES Change in the Qinghai Lake Basin

3.1.1. Spatiotemporal Change in PLES from 2000 to 2020

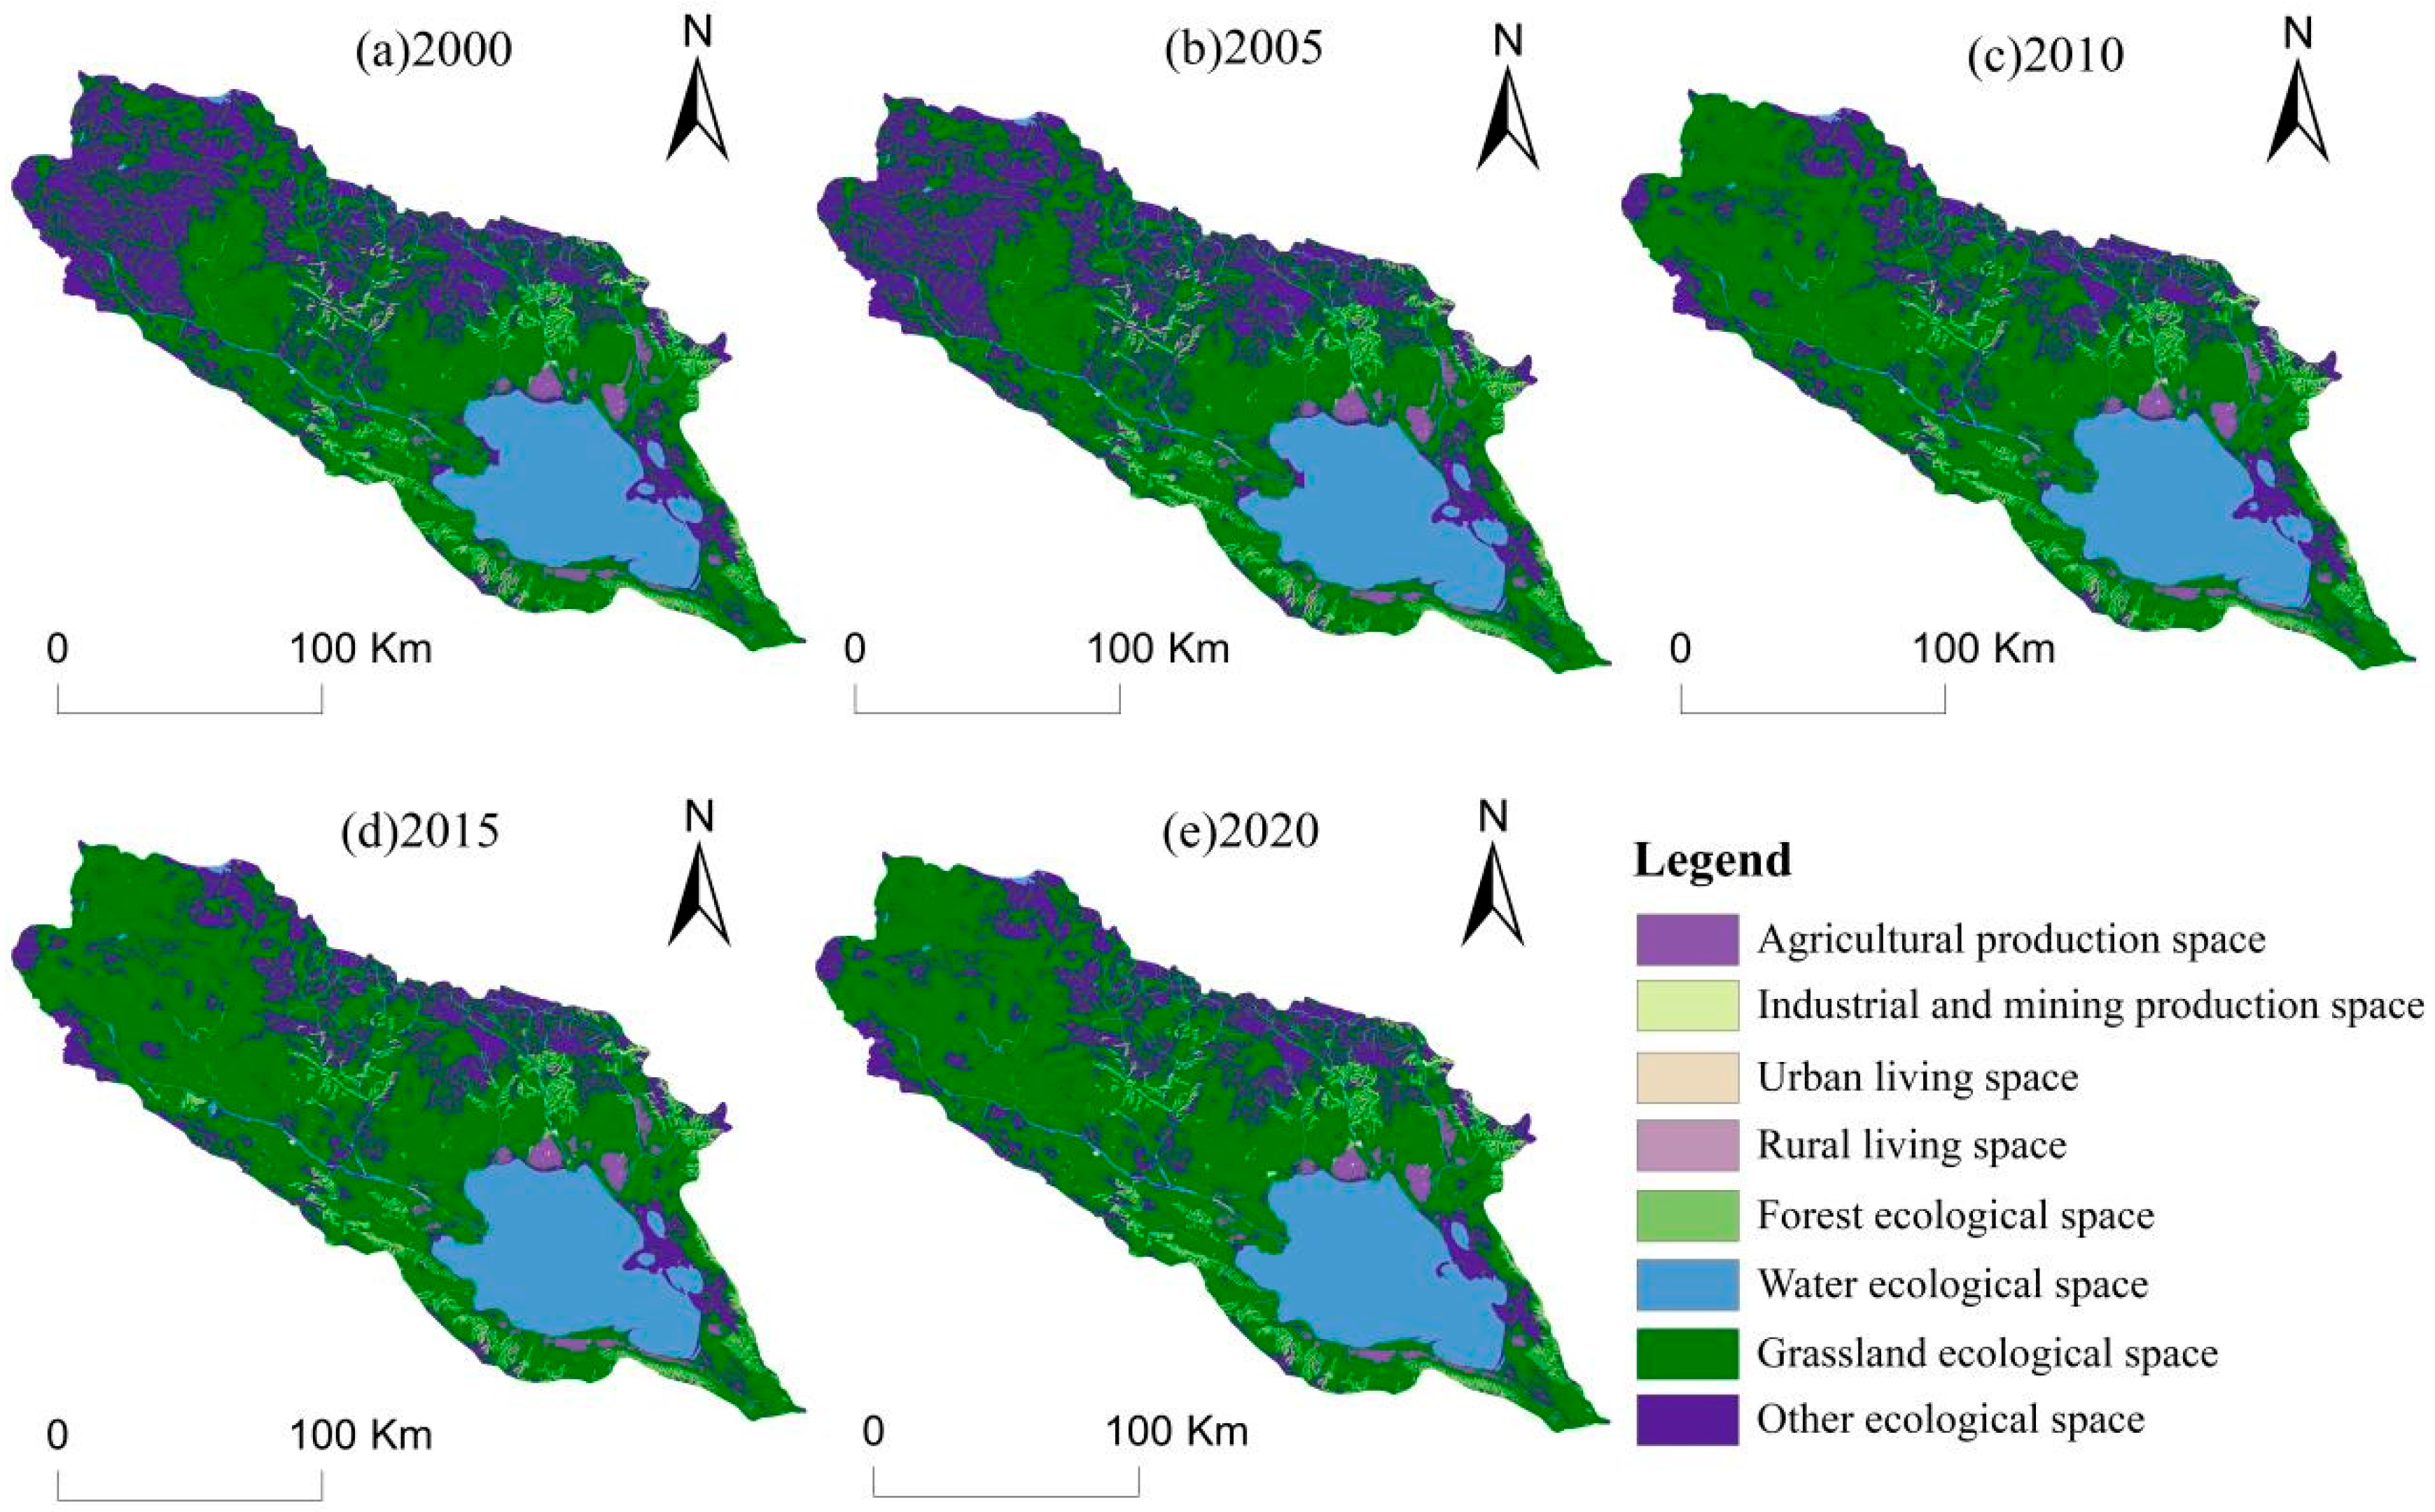
The spatial pattern and change features of PLES Land use changes in the Qinghai Lake Basin during 2000–2020 are shown in Figure 2 The land use types in the Qinghai Lake Basin underwent a certain degree of structural adjustment, while the overall pattern remained relatively stable. Ecological space consistently dominated as the leading land use type, with grassland ecological space representing more than 60.45% of the total study area. Production space occupied a relatively low proportion, while living space had the lowest proportion at only 10.05%. Production space was primarily arranged in the northern and southern areas around Qinghai Lake, where moisture conditions are relatively favorable, and increased by 3731.58 ha in total. Among them, agricultural production space was dominated by production space, mainly distributed in areas with better water resources around Qinghai Lake, increasing by 2250.18 ha over the study period, while industrial and mining production space showed relatively small changes overall. Living space was mainly distributed in pastoral areas surrounding Qinghai Lake, transportation nodes, and river-adjacent areas. Urban living space was mainly concentrated near transportation nodes, showing a strong spatial agglomeration pattern, while rural living space was mostly located in pastoral and riverine areas. Both urban and rural living spaces revealed a slow expansion tendency, with a total increase of 260.10 ha. Ecological space was predominantly located in the northwestern part of the Qinghai Lake Basin and surrounding high-altitude areas, showing a continuous and spatially clustered pattern. The overall area of ecological space declined by 3991.41 ha.
According to the land use transfer matrix (Table 6), the total area of land use change during the study period was 372,465.36 ha, accounting for 12.6% of the total basin area (2,963,333 ha). In terms of major transfer directions, the most significant land use conversion was from other ecological space to grassland ecological space, with a transfer area of 320,208.03 ha, accounting for 85.97% of the total changed area in the study region. This was the largest single conversion process during the study period, reflecting the dominant trend of regional ecological restoration and grassland recovery. The second largest conversion was from other ecological space to water ecological space, with a transfer area of 18,675.54 ha, accounting for 5.51% of the transferred-out area from other ecological space, indicating that some bare land, saline–alkali land, and low-coverage areas gradually evolved into water ecological spaces such as lakes and wetlands during the study period. In addition, the conversion from grassland ecological space to water ecological space reached 5752.89 ha, accounting for 24.25% of the transferred-out area of grassland ecological space, reflecting the increasing water level and wetland expansion trend in the Qinghai Lake Basin. In terms of transfer-out rates, other ecological spaces exhibited the highest transfer-out rate at 20.38%, while agricultural production space, industrial and mining production space, and forest ecological space showed transfer-out rates of approximately 2%. The transfer-out rate of living space was lower than 1.5%, whereas the transfer-out rates of water and grassland ecological spaces were both below 1%, indicating relatively strong overall stability.
Regarding production space, agricultural production space showed a transfer-in area of 4483.26 ha, exhibiting a slight increasing trend overall. Industrial and mining production space exhibited only minor changes, with a net growth of 1481.40 ha. From the viewpoint of living spaces, urban living space and rural living space increased by 117.45 ha and 142.65 ha, respectively, showing an overall slow expansion trend, but their proportions of the total area remain relatively low. The most substantial changes occurred in ecological spaces. Grassland ecological space had a transferred-in area of 328,233.24 ha and a net increase of 304,479.18 ha, mainly originating from the conversion of other ecological spaces; its transferred-out area was 23,754.06 ha, flowing into agricultural, industrial-mining, water, and other ecological spaces. Water ecological space had a net increase of 23,448.24 ha, primarily due to transfers from other ecological spaces. In contrast, forest ecological space decreased by 3778.02 ha, with the largest transferred-out area from other ecological spaces being 339,308.28 ha, leading to a net reduction of 328,141.08 ha.

3.1.2. Analysis of PLES Land Use Dynamic Degree

The dynamic degree analysis of land use under the PLES framework showed that land use changes during the study period exhibited clear stages—specific characteristics. Overall, production space and living space showed growth; vulnerable ecological space was mainly characterized by internal conversion (Table 7). From the perspective of stage-wise changes, during 2000–2005, the magnitude of land use change for all types was comparatively small, resulting in a low dynamic degree. Among them, the dynamic degrees of agricultural production space and rural living space showed slight increases. Forest ecological space exhibited a dynamic degree of −0.07%, while grassland, water, and other ecological spaces remained generally stable. During 2005–2010, all land use types exhibited markedly higher dynamic degrees. The dynamic degree of agricultural production space reached 0.62%, while that of industrial and mining production space was reaching 15.26%, making it the fastest-changing land use type. Between 2010 and 2015, the rate of land—use change slowed down, but urban living space and industrial and mining production space continued to grow, with dynamic degrees of 1.46% and 2.42%, respectively. The variation in agricultural production space became more moderate, and ecological space indicated relatively small variation, with the land use pattern gradually becoming more rational. During 2015–2020, the dynamic degrees of all land use types further declined. Urban living space still maintained some growth, but the expansion rate decreased significantly. Agricultural production space remained largely stable, ecological space showed only minor changes, and the land use structure tended toward maturity. Overall, from 2000 to 2020, industrial and mining production space and urban living space exhibited relatively high dynamic degrees. Land use change in the study area evolved from a slow transformation to rapid adjustment, and subsequently to stable advancement.

3.2. Spatiotemporal Dynamics of Carbon Stock in the Qinghai Lake Basin

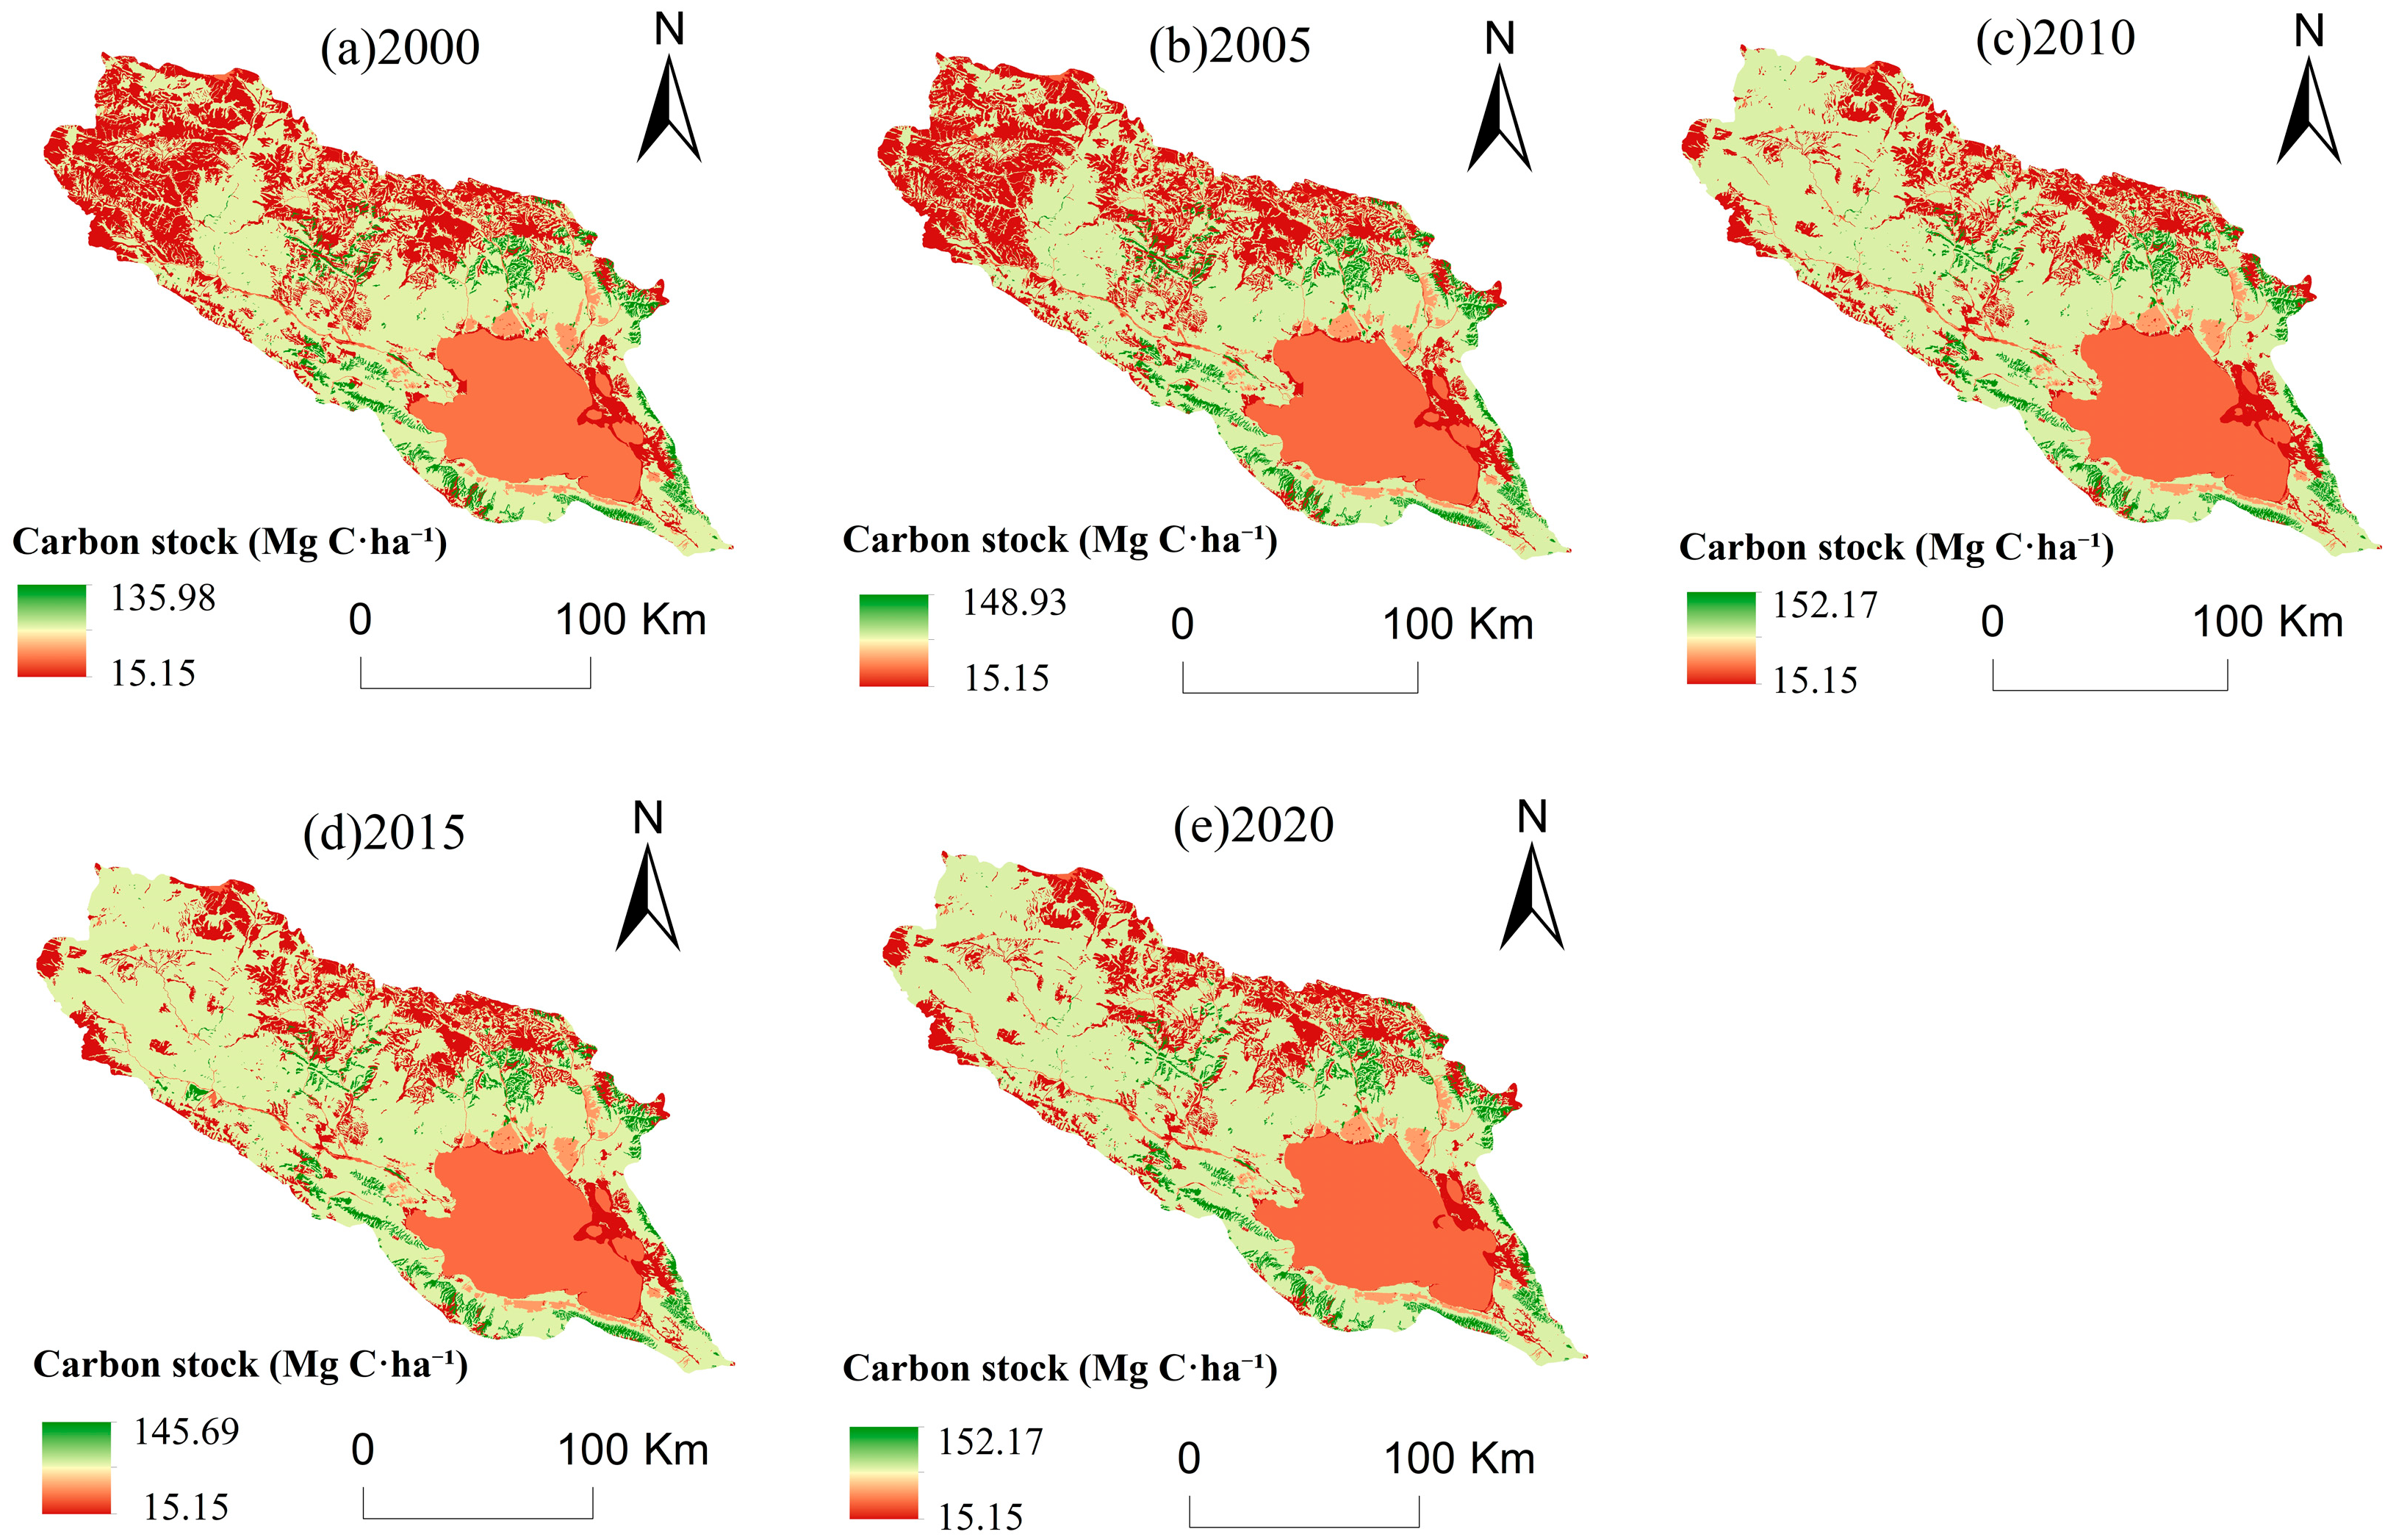
The carbon stock module of the InVEST model revealed that total carbon stock in the Qinghai Lake Basin fluctuated but generally increased during the study period. (Figure 3). Carbon stock was mainly contributed by grassland ecological space, followed by forest and water ecological spaces, while production and living spaces contributed relatively less. In 2000, the study area exhibited a total carbon stock of 214.73 × 10⁶ Mg. In 2005, the total carbon stock in the Qinghai Lake Basin exhibited a growing tendency, rising by 16.66 × 10⁶ Mg, mainly influenced by the rise in water level of Qinghai Lake and the expansion of ecological space. In 2010, carbon stock reached a peak of 264.64 × 10⁶ Mg. In 2015, it decreased by 8.7 × 10⁶ Mg, which may be related to the growth of production and living spaces. By 2020, it increased again to 264.70 × 10⁶ Mg. Carbon stock displayed a spatially heterogeneous pattern characterized by alternating high and low values. Low-value areas were mainly distributed in water ecological spaces and various production and living spaces, especially in areas with strong human activities, whereas high-value areas were mainly distributed within grassland and forest ecological spaces. Overall, during the study period, regional carbon stock increased by 49.97 × 10⁶ Mg, representing an increase of approximately 23.27% compared with the base year.

3.3. Characteristics of PLES Land Use Change Under Multiple Scenarios

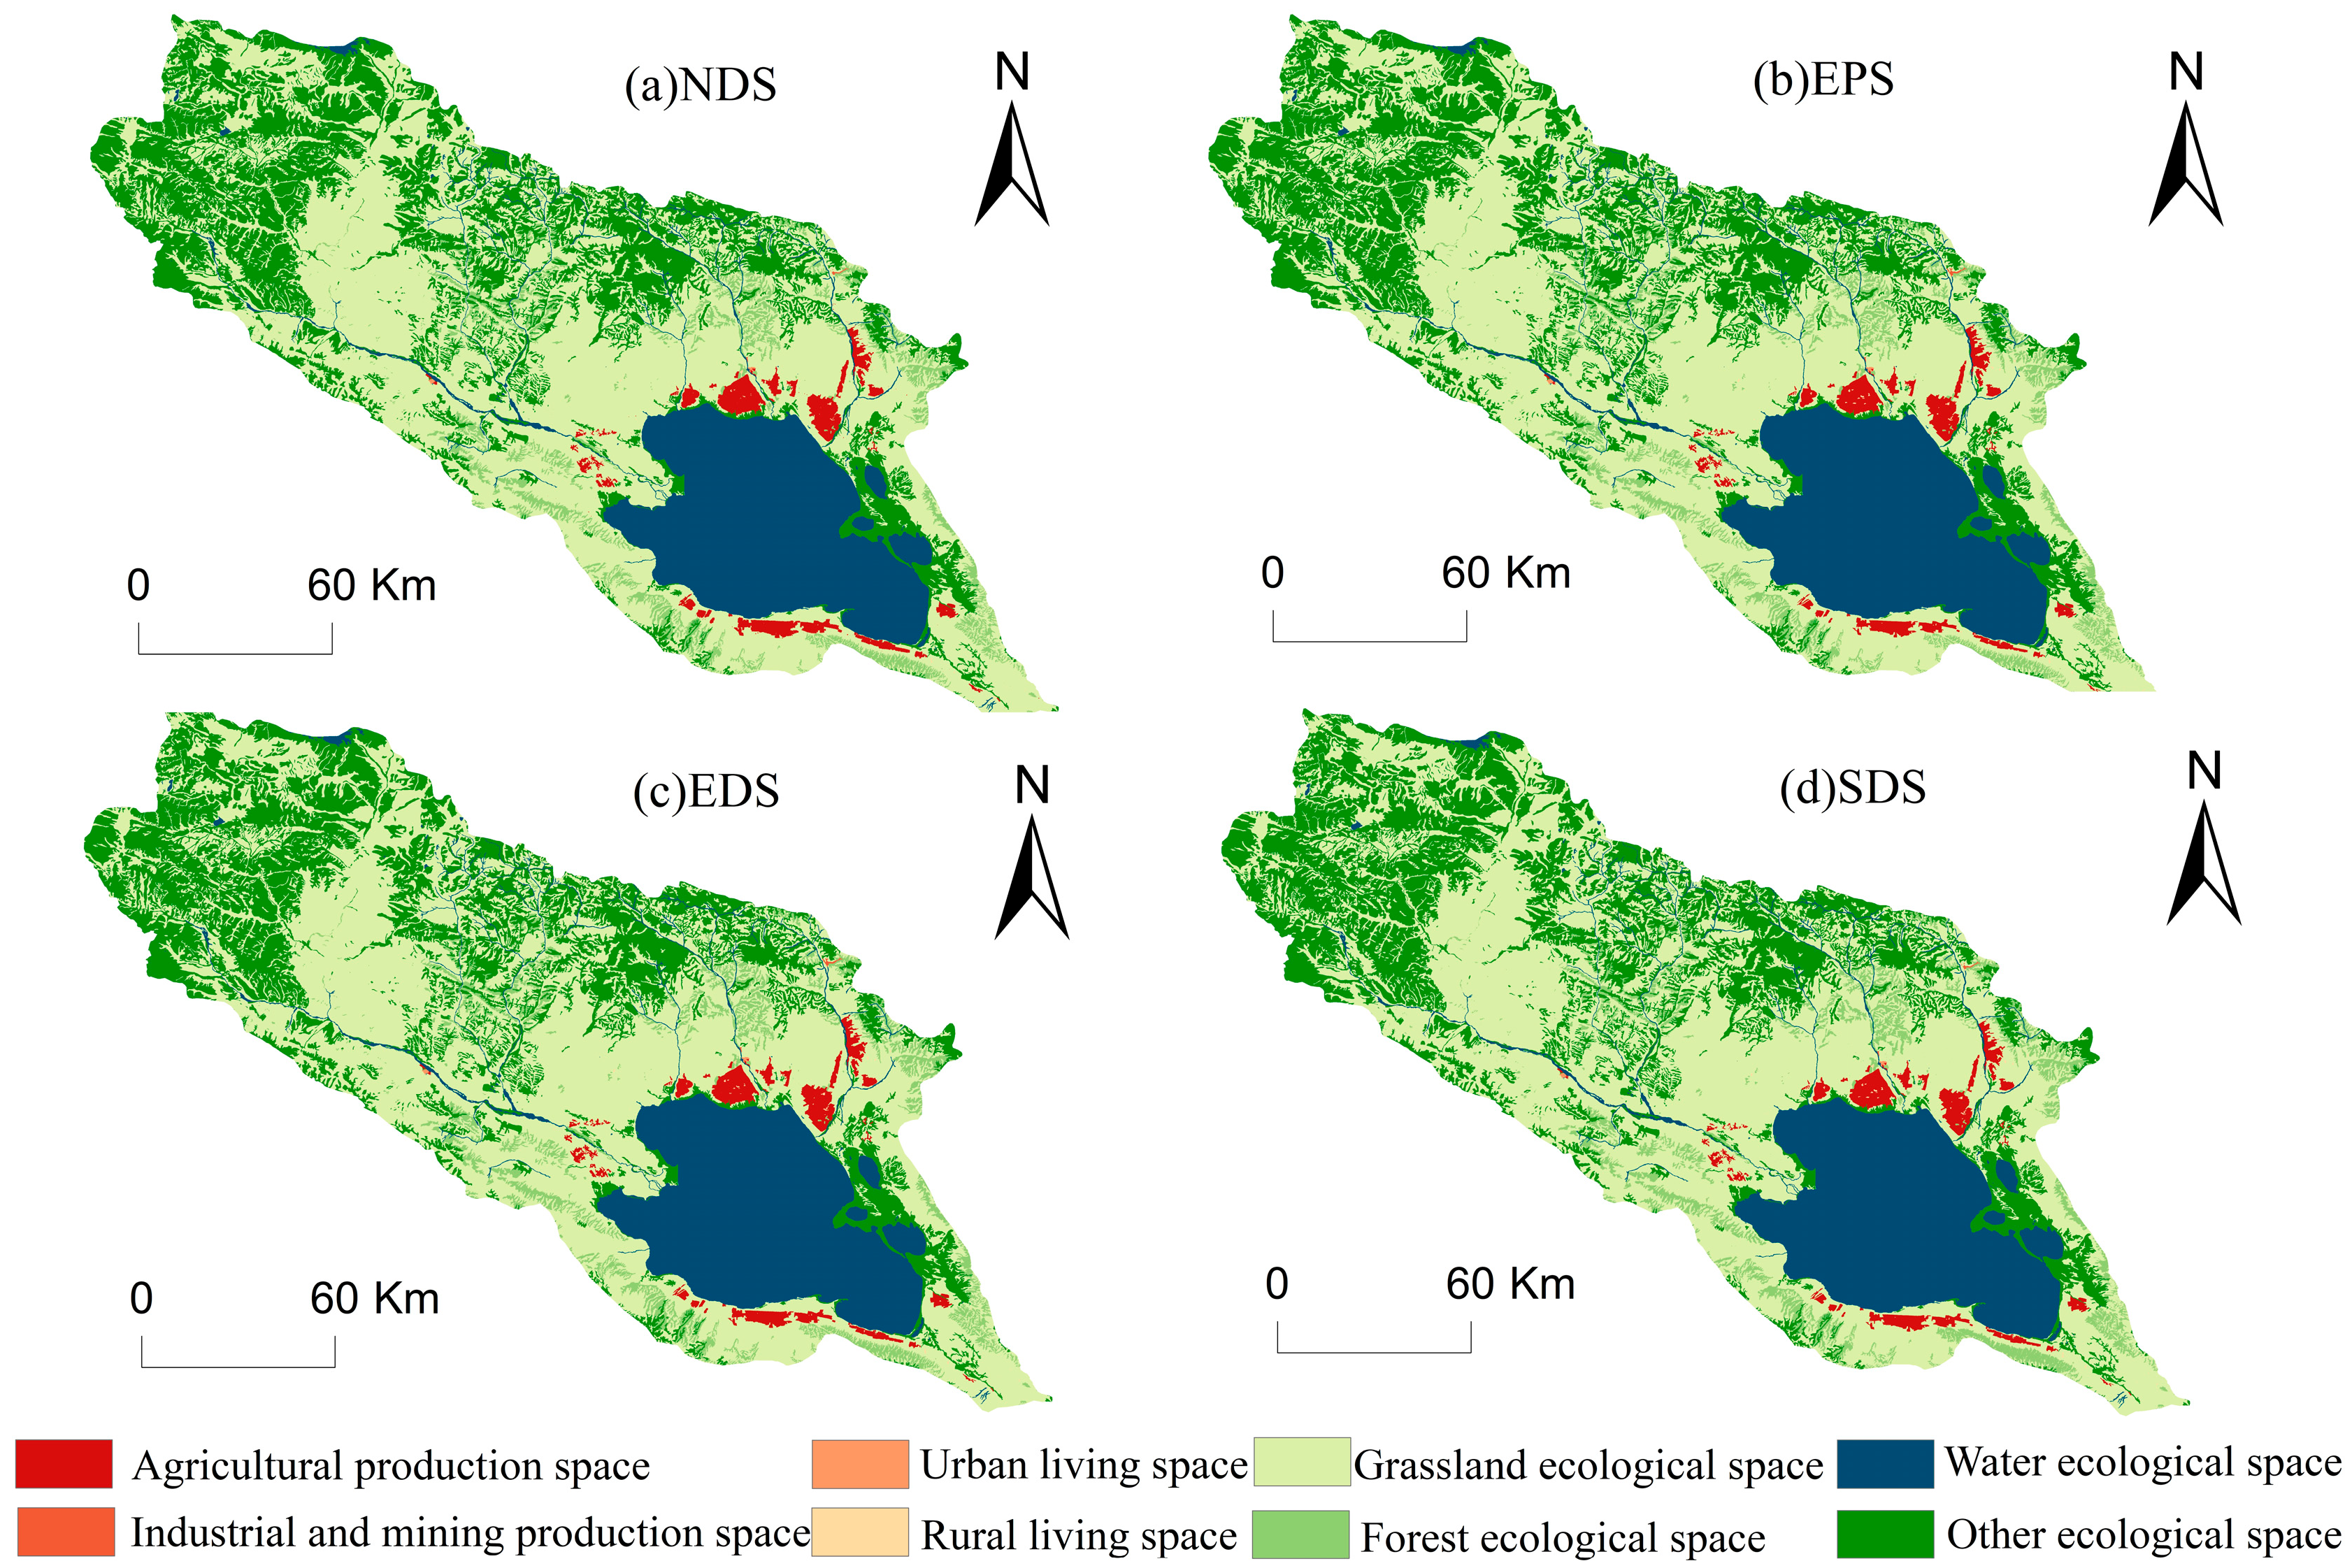
The multi-scenario simulation results indicated that the evolution of PLES in 2035 exhibits significant differences under different scenarios (Figure 4), while the dominance of grassland ecological space remains unchanged. Under the NDS, production space in the Qinghai Lake Basin will continue to expand, with agricultural production space and industrial and mining production space increasing by 4492.26 ha and 198.09 ha, respectively. The expansion areas are mainly located around Qinghai Lake. Living space remains relatively stable, while within ecological space, grassland ecological space and other ecological space show a decreasing tendency, whereas forest ecological space and water ecological space increase. Under the EPS, ecological space increases by 2075.01 ha, indicating a significant effect of ecological land protection. Grassland, forest, and water ecological spaces all show varying degrees of growth, primarily in the northwestern region of the research area. Agricultural production space and industrial and mining production space decreased by 2278.26 ha and 1483.11 ha, respectively, while living space also shows a certain degree of decline. On the contrary, under the EDS, production space exhibited the most pronounced increase. Agricultural production space increases by 1154.97 ha, while urban and rural living spaces together increase by 264.15 ha. Part of the ecological space is converted into construction land, resulting in a reduction in ecological space. Within the SDS, the evolution of various spaces shows relatively balanced characteristics. Production space maintains steady growth, living space exhibits an intensive expansion trend, and within ecological space, other ecological spaces are converted into other types of ecological land. A comparative analysis of different scenarios shows that the NDS mainly continues the historical land—use change trends, with relatively small overall adjustments and a gradual evolution of the spatial pattern. The EPS achieves the highest proportion of ecological space, reflecting a clear ecological priority in regional spatial development. Production and living spaces expanded most significantly under the EDS. Compared with the other three single-oriented scenarios, the SDS alleviated land use conflicts among different functional spaces to a certain extent. On the basis of ensuring the reasonable demands of regional production activities and residents’ living needs, it maintained the scale and integrity of ecological space and promoted the coordinated evolution of production, living, and ecological spaces.
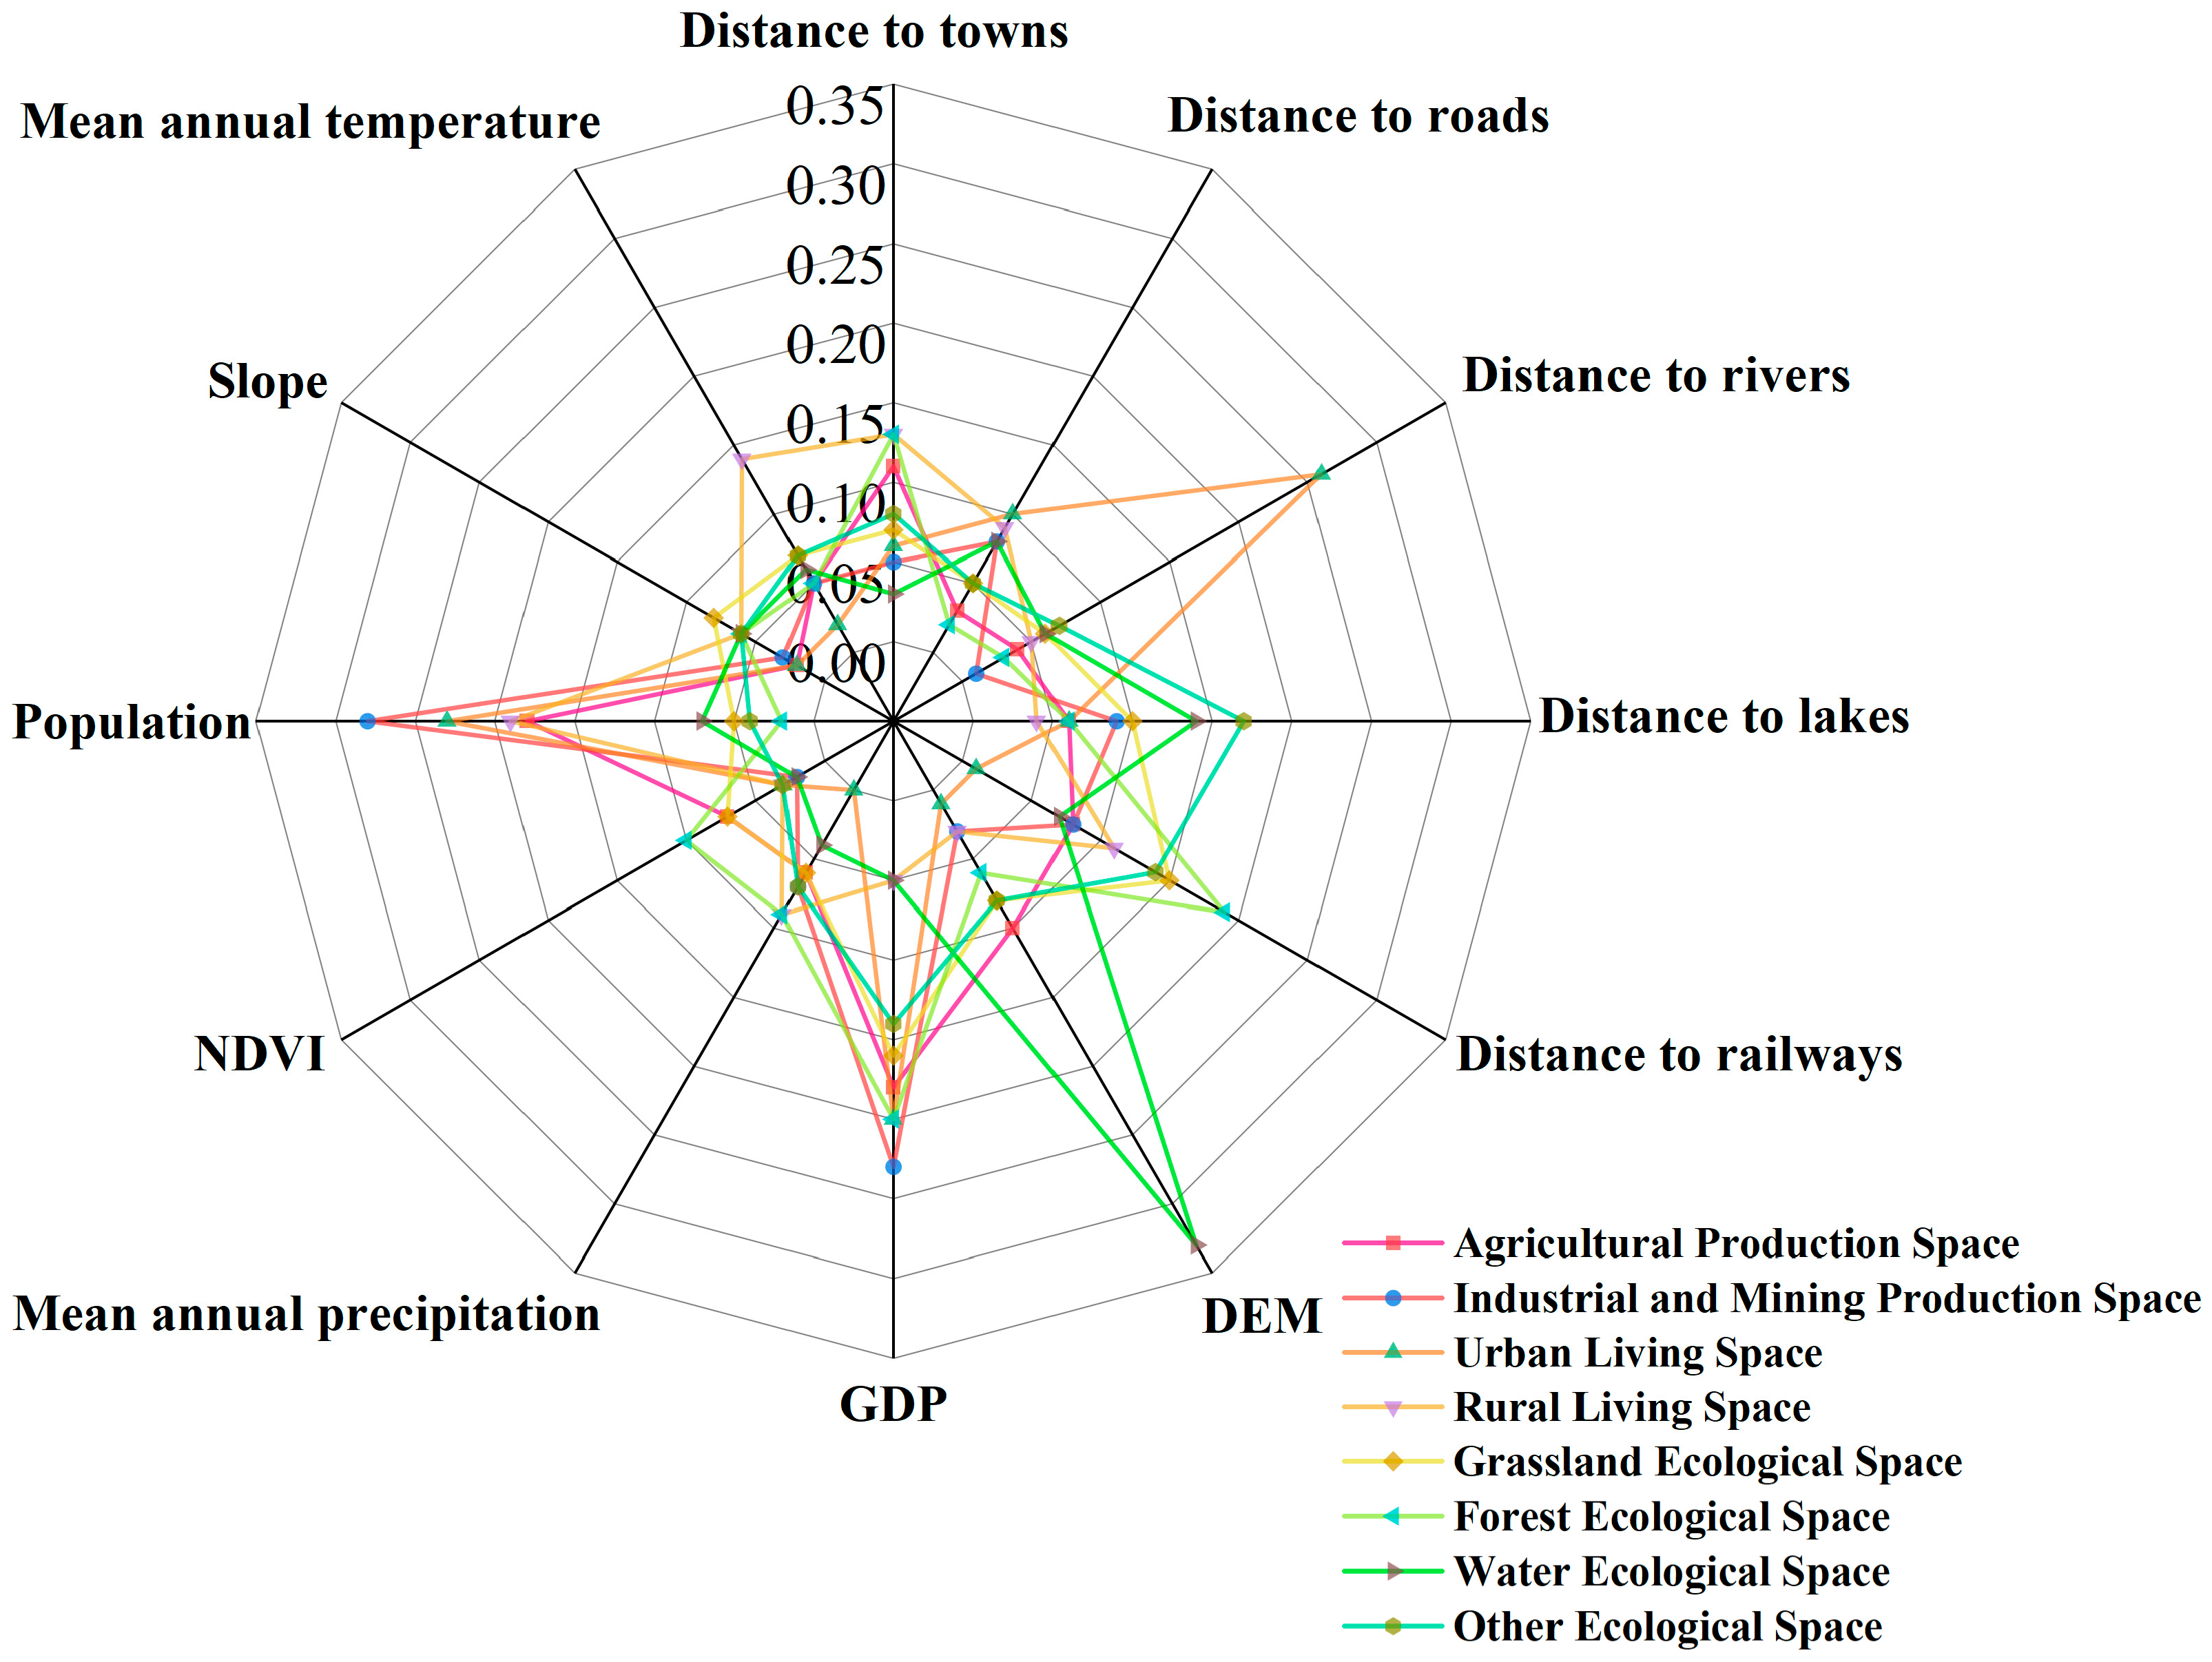
Based on the development trends of PLES from 2000 to 2020, Figure 5 shows the contribution of each driving factor in the random forest algorithm of the PLUS model. Population factors exhibit relatively high contributions to industrial and mining production space, agricultural production space, urban living space, and rural living space, with values of 0.28, 0.18, 0.23, and 0.19, respectively. Elevation has a relatively large contribution to water ecological space, indicating that topographic conditions are important natural driving factors influencing the spatial pattern of water areas in the study region. Ecological environmental factors such as precipitation and temperature also show certain contributions. The high contribution of GDP indicates that human activities are important driving forces for land use conversion or variations in carbon stock. From the perspective of locational conditions, distance to rivers, railways, and lakes contributes relatively highly. The closer the distance to transportation facilities, the higher the probability of land development and utilization.

3.4. Spatiotemporal Patterns and Changes in Carbon Stock Under Multiple PLES Scenarios

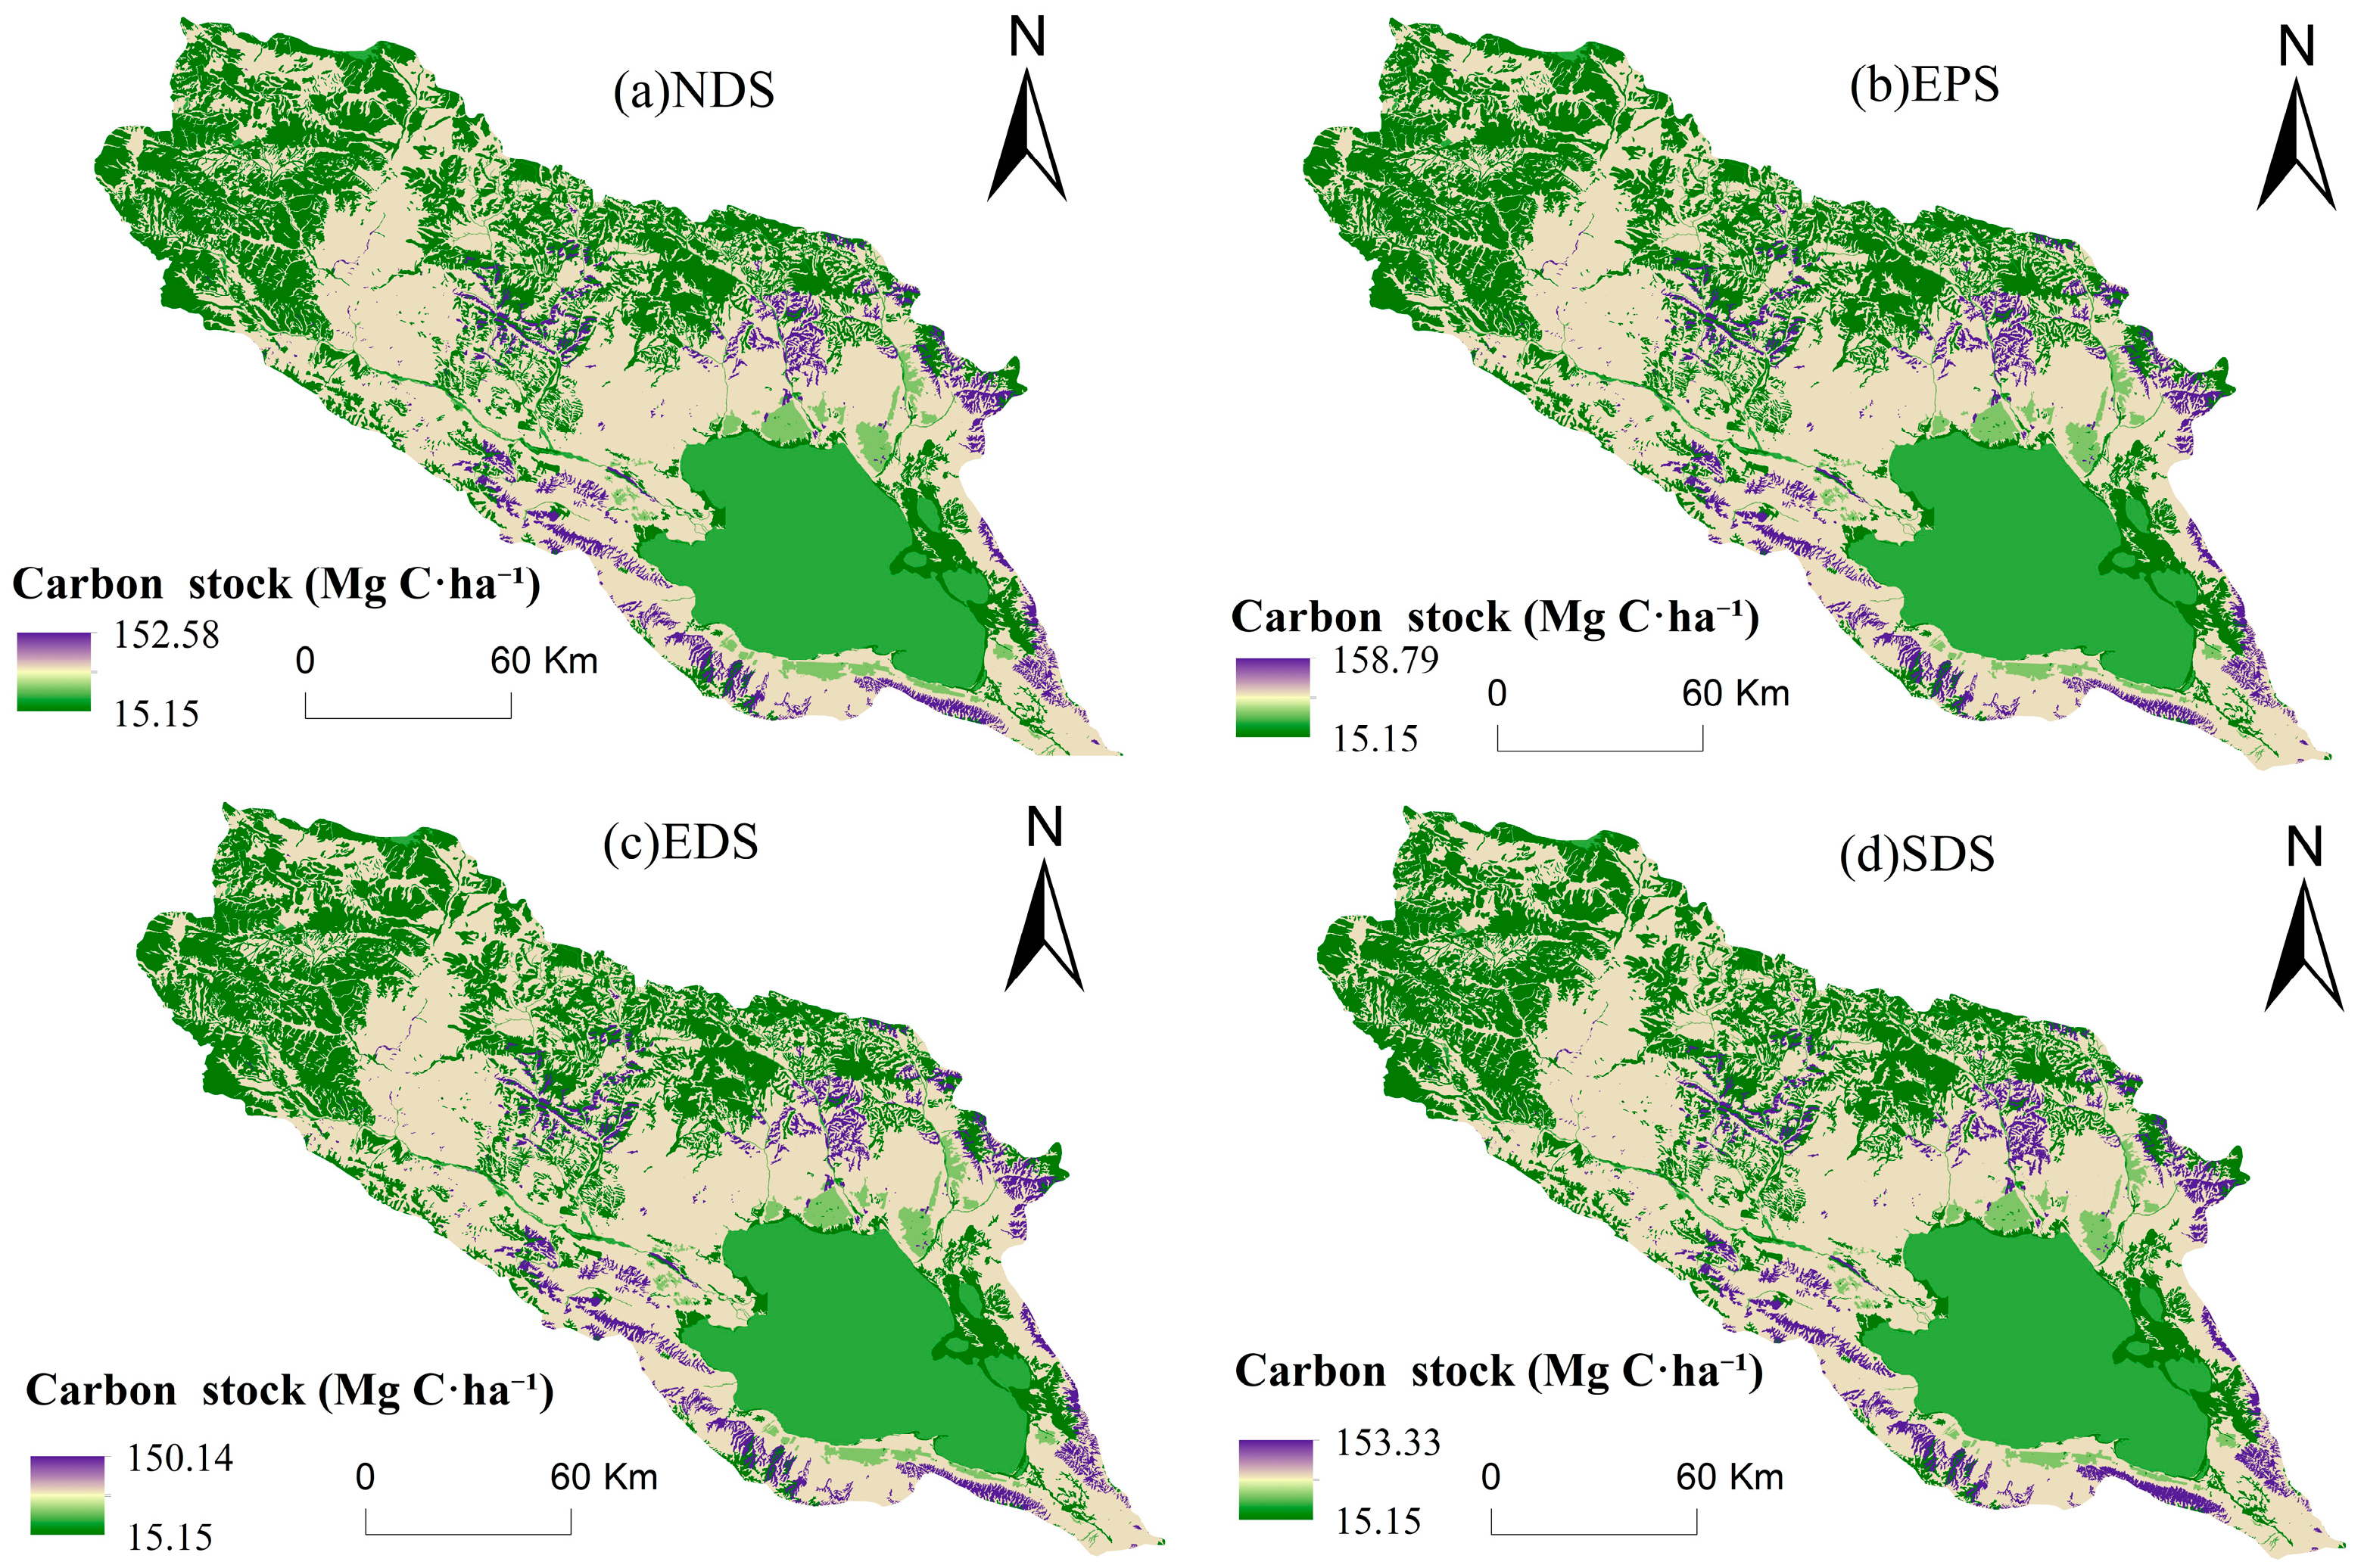
Using the carbon stock module of the InVEST model, the spatiotemporal distribution characteristics of carbon stock across distinct PLES scenarios in 2035 were analyzed. The results (Figure 6) show that carbon stock varies significantly among different development scenarios. Overall, across the NDS, the total carbon stock in the study region changes only slightly and shows a slow increasing trend, reaching 267.81 × 10⁶ Mg. Compared with 2020, carbon stock in 2035 is projected to increase by 3.11 × 10⁶ Mg. In the EPS, the degree of grassland and forest ecological spaces increases, and the total carbon stock rises to 274.80 × 10⁶ Mg, representing an escalation of 10.1 × 10⁶ Mg compared to 2020. Under the EDS, the expansion of urban living space and industrial and mining production space occupies part of the ecological space, resulting in a reduction in total carbon stock to 251.80 × 10⁶ Mg, a reduction amounting to 12.9 × 10⁶ Mg. In the SDS, the land use structure is optimized, and the regional carbon stock shows a slight overall increase, reaching 269.57 × 10⁶ Mg, a growth of 4.87 × 10⁶ Mg. In terms of spatial distribution, in 2035, areas with high carbon stock will be mainly concentrated in the northwestern Qinghai Lake Basin, where grassland and forest ecological spaces are concentrated, whereas low carbon stock areas will be predominantly distributed around Qinghai Lake, particularly in areas dominated by urban living space and industrial and mining production space. A comprehensive comparison of the four scenarios shows that the carbon stock capacity ranks as follows: EPS > SDS > NDS > EDS.
Based on the zonal statistics of spatial increases and decreases in carbon stock between 2035 and 2020 under the four development scenarios in the Qinghai Lake Basin (Table 8), the EPS exhibited the largest increase in carbon stock, whereas the EDS showed a pronounced carbon loss. Under the NDS, areas with significant increases in carbon stock were mainly located in grassland ecological space, increasing by 1.72 × 10⁶ Mg, followed by forest ecological space and other ecological space, which increased by 0.51 × 10⁶ Mg and 0.34 × 10⁶ Mg, respectively. Under the EPS, grassland ecological space and forest ecological space increased by 5.29 × 10⁶ Mg and 2.62 × 10⁶ Mg, respectively, representing the main contributors to regional carbon stock enhancement. Under the EDS, regional carbon stock showed an overall decreasing trend, with the most significant reductions occurring in grassland ecological space and forest ecological space, decreasing by 5.58 × 10⁶ Mg and 2.43 × 10⁶ Mg, respectively. Agricultural production space and industrial and mining production space also experienced substantial decreases. Under the SDS, carbon stock changes were generally intermediate between the NDS and EDS. Grassland ecological space remained the dominant contributor to carbon stock increase, rising by 2.67 × 10⁶ Mg. Water ecological space and other ecological space also showed moderate increases. Meanwhile, this scenario balanced economic development needs, resulting in an overall increase in regional carbon stock.

4. Discussion

4.1. Land Use Change in PLES and Its Carbon Stock Effects in the Qinghai Lake Basin

The most significant PLES transition in the Qinghai Lake Basin from 2000 to 2020 was the conversion of other ecological space into grassland ecological space, accounting for 85.97% of the total transferred area. This indicates an overall optimization of the regional ecological spatial structure and the restoration of grassland ecosystems. In terms of driving forces, on the one hand, the Qinghai–Tibet Plateau has experienced a general warming and wetting climate trend, with improved precipitation and thermal conditions, providing favorable background conditions for the natural succession of vegetation in sandy land, bare land, and low-coverage barren areas classified as other ecological space. On the other hand, ecological restoration programs implemented in Qinghai Province, such as sand control and desertification prevention projects, the Three-North Shelterbelt Program, grazing prohibition, and grass–livestock balance policies, have promoted the gradual restoration of degraded, sandy, and idle ecological lands into grassland. The second most prominent transition was the continuous expansion of water ecological space. From 2000 to 2020, the rising water level of Qinghai Lake led to an outward shift in the shoreline, and surrounding wetlands, low-coverage grasslands, and bare lands were submerged. This process directly drove the expansion of water ecological space in the basin.
The distribution pattern of PLES in the Qinghai Lake Basin determines the spatial characteristics of carbon stock. Ecological space dominates the PLES pattern in the basin, with grassland ecological space as the primary land type, accounting for over 60.45% of the total study area. From 2000 to 2020, grassland ecological space expanded significantly, and the high carbon stock areas were also mainly concentrated within this land type. J. A. Foley et al. [47] found that ecological space exhibits high vegetation biomass and soil organic carbon content, serving as the main contributor to regional carbon stock, which corroborates the results of this study. Areas with relatively low carbon stock are mainly located in production and living spaces where urban expansion and human activities around the lake are more intensive. Wang, Z. et al. [48] demonstrated a significant correlation between human activity intensity and carbon emissions, indicating that increased human activity further exacerbates regional carbon emissions, thereby reducing the carbon sink function of ecological space, which is consistent with the findings of this study. The underlying mechanisms of carbon sink decline can be summarized in two aspects: first, drastic changes in surface cover types, where construction land and hardened surfaces replace native vegetation, leading to a near-total loss of aboveground biomass and the almost complete disappearance of the vegetation carbon pool; second, damage to soil structure and carbon pools, where urban construction and agricultural activities disrupt the original soil profiles, altering soil aeration and organic matter preservation conditions, resulting in continuous soil organic carbon loss. Sun, Y. et al. [49] pointed out that the encroachment of construction land and the loss of cropland are the core mechanisms of carbon sink decline, which aligns closely with the results of this study.
Unlike plains, urban areas, and other river basins, the Qinghai Lake Basin, as a typical high-altitude, cold and ecologically vulnerable region, exhibits greater ecological sensitivity and more pronounced spatial coupling between PLES evolution and carbon stock responses. On the one hand, grassland ecosystems have a relatively high capacity for soil organic carbon stock, meaning that even small changes in ecological space can lead to significant fluctuations in regional carbon stock. On the other hand, ecological restoration in high-altitude, cold regions requires a long recovery period, and disturbances caused by construction land expansion are often highly persistent and difficult to reverse. This indicates that, in territorial spatial optimization within high-altitude, cold and ecologically fragile regions, greater emphasis should be placed on protecting the continuity of ecological space and promoting low-disturbance development patterns to achieve coordinated improvements in ecological security and regional sustainable development.

4.2. Scenario-Based Changes in PLES and Carbon Stock in the Qinghai Lake Basin

In 2035, the Qinghai Lake Basin’s PLES exhibits considerable variation under different scenarios, with each scenario reshaping the transformation relationships and spatial patterns among production, living, and ecological spaces, resulting in distinctly different development characteristics and ecological benefits. Under the NDS, land use evolution follows historical inertia, with no intensive human intervention or ecological regulation, displaying an overall evolution mechanism of “development-driven inertia and passive ecological degradation.” The EPS restricts the disorderly expansion of production and living spaces, promoting the conversion of degraded bare land, wasteland, and other ecological spaces into high-value ecological land such as grassland, forest, and water bodies, thereby achieving a substantial net gain in ecological space. The EDS prioritizes development, often at the expense of ecological spaces such as grassland and unused land, which easily intensifies land use conflicts among the three space types and leads to declines in regional carbon sequestration capacity and ecosystem service functions. The SDS moderately constrains the expansion of production spaces, effectively preventing large-scale encroachment of ecological spaces by construction land, while promoting the conversion of other ecological land into core ecological land such as grassland and forest, thereby ensuring steady growth of key ecological land.
By predicting the regional carbon stock under four scenarios in 2035, it was found that the basin’s carbon stock increased by 3.11 × 10⁶ Mg, 10.1 × 10⁶ Mg, and 4.87 × 10⁶ Mg under the NDS, EPS, and SDS, respectively, compared to 2020, whereas it decreased by 12.9 × 10⁶ Mg under the EDS. Although the NDS shows some encroachment of grassland and other ecological spaces by production spaces, the overall carbon stock still increased, similar to the findings of Li, W. et al. [50]. This is mainly because the continued warm and humid trend on the Qinghai–Tibet Plateau effectively enhanced the productivity of existing grassland vegetation and soil organic matter accumulation, and the rising lake levels strengthened sediment carbon sequestration and the carbon sink function of water bodies, which further compensated for carbon loss caused by the expansion of construction land. The economic development scenario exhibited a more significant decline, primarily due to drastic changes in land use structure and high-intensity human disturbances that encroached on high-carbon-density land types such as grassland and other ecological spaces. Additionally, the Qinghai Lake Basin is a high-altitude, cold region with fragile ecosystems, where recovery capacity is relatively limited. Under the ecological protection and sustainable development scenarios, carbon stock increased, as land use patterns guided by ecological priorities and green development effectively enhanced regional ecosystem carbon sequestration. Similarly, Li, D. et al. [51] found in the Bosten Lake Basin that the economic development scenario resulted in the smallest carbon stock gain, while ecological protection and sustainable development scenarios were more conducive to maintaining regional carbon sink functions.
In summary, the scenario-based differentiation of carbon stock in the Qinghai Lake Basin essentially reflects the trade-offs between territorial space development and ecological protection under different development modes. Future territorial space optimization in the Qinghai Lake Basin should place greater emphasis on the dynamic balance between “development and protection.” The General Planning of Sanjiangyuan National Park (2023–2030) [52] advocates for overall protection and systematic restoration, promoting the comprehensive preservation of headwater ecosystems and effectively facilitating the recovery of high-altitude grassland and wetland ecological functions. Strengthening ecological redline management and implementing ecological restoration projects provide favorable conditions for stabilizing ecological space and enhancing carbon stock in the Qinghai Lake Basin. Therefore, future efforts should focus on optimizing the PLES structure by strictly controlling the conversion of grassland ecological space, high-altitude wetlands, and other key ecological patches into construction or industrial–mining land, thereby reducing anthropogenic disturbances to the fragile high-altitude ecosystems. At the same time, the carbon sequestration benefits of grassland restoration, wetland protection, and ecological restoration projects should be fully leveraged to enhance regional ecosystem stability and carbon cycling regulation. Achieving coordinated improvement in land use efficiency and maintenance of ecosystem services under ecological constraints is essential to realize the synergistic goals of ecological security, carbon stock enhancement, and regional sustainable development.

4.3. Limitations of This Study

The carbon density parameters in the InVEST model were derived primarily from values reported in the literature. Although dynamic adjustments to carbon density were conducted during the study, uncertainties may still exist in the carbon stock estimation results. The PLUS model simulation results are influenced by the selection of driving factors and the accuracy of the underlying data. Future studies could further improve simulation accuracy by integrating field sampling data and climate change scenario data, while appropriately incorporating anthropogenic intervention factors, thereby enabling a more accurate characterization of the coupling relationship between PLES evolution and carbon stock changes.

5. Conclusions

From 2000 to 2020, the ecological space was consistently characterized by the PLES pattern in the Qinghai Lake Basin and served as the primary contributor to carbon stock. Throughout the analysis period, production space and living space largely resulted from the conversion of grassland, forest, and other ecological spaces. Land use transitions were dominated by conversions within ecological spaces, with the total transferred area reaching 372,465.36 ha. Carbon stock showed an overall fluctuating upward trend, increasing by approximately 23.27%, primarily driven by the expansion of grassland ecological space. The spatial distribution of carbon stock showed a substantial coupling correlation with the PLES pattern. Changes in grassland ecological space were a major contributor to regional carbon stock and were identified as the key factor affecting regional carbon sequestration capacity.
Across different 2035 development scenarios, the NDS generally continued the historical trend of PLES evolution, with carbon stock rising slightly by 3.11 × 10⁶ Mg. In the EPS, ecological space increased most significantly, leading to a rise of 10.1 × 10⁶ Mg in carbon stock. In contrast, the EDS was characterized by the obvious expansion of production and living spaces, resulting in a reduction of 12.9 × 10⁶ Mg in carbon stock. The SDS maintained a relatively high proportion of ecological space while balancing development demands, increasing total carbon stock to 269.57 × 10⁶ Mg. The pattern of carbon stock is as follows: EPS > SDS > NDS > EDS.
Overall, a development pathway driven solely by economic growth may intensify the imbalance of ecosystem functions, whereas strengthening ecological protection and optimizing territorial spatial structure can enhance the stability and overall benefits of regional ecosystem services. Thus, it is essential to coordinate production, living, and ecological functions, and optimize the configuration of PLES patterns to achieve the coordinated improvement of ecosystem services and regional sustainable development.

Author Contributions

Conceptualization, L.L. and K.C.; methodology, L.L.; software, L.L.; validation, X.L. and Z.Y.; formal analysis, Y.M.; investigation, Y.H.; resources, K.C.; data curation, C.W.; writing—original draft preparation, L.L.; writing—review and editing, L.L.; visualization, D.H.; supervision, K.C.; project administration, K.C.; funding acquisition, K.C. All authors have read and agreed to the published version of the manuscript.

Funding

This study was supported by the National Natural Science Foundation of China (Grant No. 42461018); the Central Government Guidance Fund for Local Science and Technology Development of Qinghai Province (Grant No. 2025-ZY-043); and the National Natural Science Foundation of China (Grant No. 42461064).

Institutional Review Board Statement

Not applicable.

Informed Consent Statement

Not applicable.

Data Availability Statement

Research data can be obtained from the corresponding author through email.

Conflicts of Interest

The authors declare no conflicts of interest.

References

  1. Wei, D.; Zhao, H.; Zhang, J.; Qi, Y.; Wang, X. Human Activities Alter Response of Alpine Grasslands on the Tibetan Plateau to Climate Change. J. Environ. Manag. 2020, 262, 110335. [Google Scholar] [CrossRef] [PubMed]
  2. IPCC. Climate Change 2021: The Physical Science Basis; Cambridge University Press: Cambridge, UK, 2021. [Google Scholar] [CrossRef]
  3. Li, R.J.; Li, H.M.; Wu, F.F.; Zhao, M.; Wang, S.; Sun, X. Spatial differentiation and driving forces of ecosystem services in Qinghai Lake Basin. J. Ecol. Environ. 2024, 33, 301–309. [Google Scholar] [CrossRef]
  4. Piao, S.; Tan, J.; Chen, A.; Fu, Y.H.; Ciais, P.; Liu, Q.; Janssens, I.A.; Vicca, S.; Zeng, Z.; Jeong, S.-J.; et al. Leaf onset in the northern hemisphere triggered by daytime temperature. Nat. Commun. 2015, 6, 6911. [Google Scholar] [CrossRef] [PubMed]
  5. Houghton, R.A. Revised estimates of the annual net flux of carbon to the atmosphere from changes in land use and land management 1850–2000. Tellus B Chem. Phys. Meteorol. 2003, 55, 378–390. [Google Scholar] [CrossRef]
  6. Huang, A.; Xu, Y.; Lu, L.; Liu, C.; Zhang, Y.; Hao, J.; Wang, H. Research progress of the identification and optimization of production–living–ecological spaces. Prog. Geogr. 2020, 39, 503–518. [Google Scholar] [CrossRef]
  7. He, Y.; Zhao, Z.; Mei, Z.; Bai, H. Spatiotemporal evolution of land use and habitat quality in the Three-River source region. Sci. Rep. 2025, 15, 37214. [Google Scholar] [CrossRef] [PubMed]
  8. Xia, M.; Jia, K.; Zhao, W.; Liu, S.; Wei, X.; Wang, B. Spatio-temporal changes of ecological vulnerability across the Qinghai-Tibetan Plateau. Ecol. Indic. 2021, 123, 107274. [Google Scholar] [CrossRef]
  9. Sun, J.; Ding, Y.; Wang, Y.; E, C. Vegetation Dynamics and Its Driving Force in the Qinghai Lake Basin, China. Front. Plant Sci. 2025, 16, 1691672. [Google Scholar] [CrossRef] [PubMed]
  10. Wang, Z.; Mae, M.; Matsuhashi, R. Low-energy miniature wearable air-conditioner with direct cold-air delivery: A novel water–electricity hybrid energy system. Build. Environ. 2026, 297, 114590. [Google Scholar] [CrossRef]
  11. Fu, J.; Gao, Q.; Jiang, D.; Li, X.; Lin, G. Spatial–temporal distribution of global production–living–ecological space during 2000–2020. Sci. Data 2023, 10, 589. [Google Scholar] [CrossRef] [PubMed]
  12. Lin, G.; Jiang, D.; Fu, J.; Zhao, Y. A Review on the Overall Optimization of Production–Living–Ecological Space: Theoretical Basis and Conceptual Framework. Land 2022, 11, 345. [Google Scholar] [CrossRef]
  13. Bu, Z.; Fu, J.; Jiang, D.; Lin, G. Production–living–ecological spatial function identification and pattern analysis based on multi-source geographic data and machine learning. Land 2023, 12, 2029. [Google Scholar] [CrossRef]
  14. Parton, W.J.; Schimel, D.S.; Cole, C.V.; Ojima, D.S. Analysis of factors controlling soil organic matter levels in Great Plains grasslands. Soil Sci. Soc. Am. J. 1987, 51, 1173–1179. [Google Scholar] [CrossRef]
  15. Running, S.W.; Hunt, E.R. Generalization of a forest ecosystem process model for other biomes, BIOME-BGC. In Scaling Physiological Processes: Leaf to Globe; Ehleringer, J.R., Field, C.B., Eds.; Academic Press: San Diego, CA, USA, 1993; pp. 141–158. [Google Scholar] [CrossRef]
  16. Potter, C.S.; Randerson, J.T.; Field, C.B.; Matson, P.A.; Vitousek, P.M.; Mooney, H.A.; Klooster, S.A. Terrestrial ecosystem production: A process model based on global satellite and surface data. Glob. Biogeochem. Cycles 1993, 7, 811–841. [Google Scholar] [CrossRef]
  17. Sharp, R.; Tallis, H.T.; Ricketts, T.; Guerry, A.D.; Wood, S.A.; Chaplin-Kramer, R.; Nelson, E.; Ennaanay, D.; Wolny, S.; Olwero, N.; et al. InVEST 3.2.0 User’s Guide; Natural Capital Project: Stanford, CA, USA, 2018; Available online: https://naturalcapitalproject.stanford.edu/software/invest (accessed on 5 June 2026).
  18. Nelson, E.; Mendoza, G.; Regetz, J.; Polasky, S.; Tallis, H.; Cameron, D.R.; Chan, K.M.A.; Daily, G.C.; Goldstein, J.; Kareiva, P.M.; et al. Modeling multiple ecosystem services, biodiversity conservation, commodity production, and tradeoffs at landscape scales. Front. Ecol. Environ. 2009, 7, 4–11. [Google Scholar] [CrossRef]
  19. Liang, X.; Guan, Q.; Clarke, K.C.; Liu, S.; Wang, B.; Yao, Y. Understanding the drivers of sustainable land expansion using a patch-generating land use simulation (PLUS) model: A case study in Wuhan, China. Comput. Environ. Urban Syst. 2021, 85, 101569. [Google Scholar] [CrossRef]
  20. Zhang, X.; Li, S.; Wang, H.; Zhao, Y.; Wang, H. Simulation and analysis of land-use change based on the PLUS model in the Fuxian Lake Basin. Land 2023, 12, 120. [Google Scholar] [CrossRef]
  21. Zhang, S.; Gao, Q.; Zhang, R.; Song, C.; Li, Z. Spatiotemporal evolution and driving factors of carbon storage based on the PLUS–InVEST model: A case study of the Napahai Basin. China Environ. Sci. 2024, 44, 5192–5201. [Google Scholar] [CrossRef]
  22. Xiao, Y. Spatiotemporal evolution and prediction of carbon storage in Hainan Tropical Rainforest National Park based on coupled PLUS–InVEST model. Soil Water Conserv. Bull. 2024, 44, 305–314. [Google Scholar] [CrossRef]
  23. Zhao, H.; Guo, B.; Wang, G. Spatial–temporal changes and prediction of carbon storage in the Tibetan Plateau based on the PLUS–InVEST model. Forests 2023, 14, 1352. [Google Scholar] [CrossRef]
  24. Gong, G. Ecological Protection Law of the Qinghai-Tibet Plateau and new development of environmental legislation. Environ. Prot. 2023, 51, 23–28. [Google Scholar] [CrossRef]
  25. Hua, T.; Zhao, W.; Cherubini, F.; Hu, X.; Pereira, P. Sensitivity and future exposure of ecosystem services to climate change on the Tibetan Plateau of China. Landsc. Ecol. 2021, 36, 3451–3471. [Google Scholar] [CrossRef] [PubMed]
  26. Wang, J.; Cao, S.K.; Liu, Z.M.; Lei, Y.; Hou, Y. Spatiotemporal dynamics of ecosystem carbon sink in the Qinghai Lake Basin. Acta Agrestia Sin. 2025, 33, 936–947. [Google Scholar] [CrossRef]
  27. Mei, Z.Y.; Zhang, Y.R.; Huang, X.Y.; Liu, Z.C. Ecological risk assessment and spatial heterogeneity of ecosystem services in the Qinghai Lake Basin. Acta Ecol. Sin. 2024, 44, 4973–4986. [Google Scholar] [CrossRef]
  28. Chen, Z.; Gao, X.; Liu, Z.; Sun, Y.; Chen, K. Spatiotemporal evolution and driving mechanisms of eco-environmental quality in Qinghai Lake Basin. Land 2025, 14, 1955. [Google Scholar] [CrossRef]
  29. Luo, Z.; Liu, J.; Zhang, S.; Shao, W.; Zhang, L. Research on climate change in Qinghai Lake Basin based on WRF and CMIP6. Remote Sens. 2023, 15, 4379. [Google Scholar] [CrossRef]
  30. Ling, X.; Tang, Z.; Gao, J.; Li, C.; Liu, W. Changes in Qinghai Lake area and their interactions with climatic factors. Remote Sens. 2024, 16, 129. [Google Scholar] [CrossRef]
  31. Li, X.; Zhang, T.; Yang, D.; Wang, G.; He, Z.; Li, L. Research on lake water level and its response to watershed climate change in Qinghai Lake from 1961 to 2019. Front. Environ. Sci. 2023, 11, 1130443. [Google Scholar] [CrossRef]
  32. Liu, J.; Liu, Y.; Li, Y. Classification Evaluation and Spatial–Temporal Analysis of “Production–Living–Ecological” Spaces in China. Acta Geogr. Sin. 2017, 72, 1290–1304. [Google Scholar] [CrossRef]
  33. Cheng, X.; Qu, L.; Wang, X. Characteristics of Land Use Transition in Production–Living–Ecological Space in Ecologically Fragile Areas: A Case Study of Datong County, Qinghai Province. Cent. South Agric. Sci. Technol. 2025, 46, 114–122. [Google Scholar]
  34. Li, J.; Sun, W.; Yu, J. Evolution and Regional Differences of Production–Living–Ecological Space in the Yellow River Basin: A Comparison between Resource-Based and Non-Resource-Based Cities. Resour. Sci. 2020, 42, 2285–2299. [Google Scholar] [CrossRef]
  35. He, F.; Hu, X.; Huang, L.; Wen, X.; Zhang, X.M.; Yue, Y.H.; Cao, X.M. Evolution of Production–Living–Ecological Space Conflict and Habitat Quality Response in Plateau Ecologically Fragile Areas: A Case Study of Qinghai Province. Environ. Sci. 2026, 47, 2393–2410. [Google Scholar] [CrossRef]
  36. Liao, C.M.; Wei, Y.Y.; Wang, R.; Tan, M.; Lu, Y.; Tan, Y. Land use transition and ecological effects in Guangxi. Hubei Agric. Sci. 2023, 62, 72–76. [Google Scholar] [CrossRef]
  37. Li, L.; Chen, F.Y.; Lin, A.W. Land use evolution based on SOM and dynamic degree method. Soil Water Conserv. Bull. 2018, 38, 129–134. [Google Scholar] [CrossRef]
  38. Niu, F.F.; Guo, J.; Luo, J.; Gou, X.; Liu, X.; Zhang, R. Land use change simulation and carbon storage prediction in Xinjiang based on GeoSOS-FLUS and InVEST. Arid Land Geogr. 2025, 48, 2169–2182. [Google Scholar] [CrossRef]
  39. Qi, X.; Li, X.; Chen, Y.; Zhang, H. Considering the joint impact of carbon density change and land use change in ecosystem carbon stock assessment. Forests 2023, 15, 55. [Google Scholar] [CrossRef]
  40. Zhang, L.; Li, X.; Lin, H.; Zhang, M. Vegetation carbon storage using NDVI and machine learning. Int. J. Appl. Earth Obs. Geoinf. 2021, 102, 102458. [Google Scholar] [CrossRef]
  41. Ma, Y.J.; Zhong, J.T.; Mi, W.B.; Shi, J.; Jiang, X. Carbon storage assessment and vulnerability analysis in Qinghai Lake Basin under multi-scenario simulation. Arid Land Resour. Environ. 2023, 37, 46–55. [Google Scholar] [CrossRef]
  42. Li, J.; Gong, J.; Guldmann, J.-M.; Li, S.; Zhu, J. Carbon Dynamics in the Northeastern Qinghai–Tibetan Plateau from 1990 to 2030 Using Landsat Land Use/Cover Change Data. Remote Sens. 2020, 12, 528. [Google Scholar] [CrossRef]
  43. Liu, Y.; Li, J.; Yang, Y. Strategic Adjustment of Land Use Policy under the Economic Transformation. Land Use Policy 2018, 74, 5–14. [Google Scholar] [CrossRef]
  44. Zhang, X.; Liu, Y.; Yin, J.; Shi, P.; Feng, H. Multi-scenario land use change and ecosystem services. J. Arid Land 2025, 17, 145–166. [Google Scholar] [CrossRef]
  45. Pan, W.; Liu, Y.; Wu, Z.; Liu, Z.; Han, W.; Yu, Z. Land use and biodiversity simulation in Qinghai Province. Biodivers. Sci. 2022, 30, 21425. [Google Scholar] [CrossRef]
  46. Yin, K.; Liao, S.Y. Carbon storage change in Three Gorges Reservoir based on PLUS-InVEST model. Yangtze River Sci. Res. Inst. J. 2024, 41, 60–69. [Google Scholar] [CrossRef]
  47. Foley, J.A.; DeFries, R.; Asner, G.P.; Barford, C.; Bonan, G.; Carpenter, S.R.; Chapin, F.S.; Coe, M.T.; Daily, G.C.; Gibbs, H.K.; et al. Global consequences of land use. Science 2005, 309, 570–574. [Google Scholar] [CrossRef] [PubMed]
  48. Wang, Z.; Mae, M.; Nishimura, S.; Matsuhashi, R. Vehicular Fuel Consumption and CO2 Emission Estimation Model Integrating Novel Driving Behavior Data Using Machine Learning. Energies 2024, 17, 1410. [Google Scholar] [CrossRef]
  49. Sun, Y.; Cai, J.; Wang, Z.; Tian, F.; Li, T. Spatiotemporal Evolution and Multi-Scenario Prediction of Carbon Storage around Hangzhou Bay Based on the InVEST-PLUS-GeoDetector Model. J. Nanjing For. Univ. Nat. Sci. Ed. 2025, 49, 19–28. [Google Scholar] [CrossRef]
  50. Li, W.; Yang, J.; Fu, B.; Zhao, Q.; Tan, Z.; Guan, X. Spatiotemporal Changes and Prediction of Ecosystem Carbon Storage in the Greater Khingan Mountains Based on the PLUS–InVEST Model. J. Environ. Eng. Technol. 2024, 14, 1892–1904. [Google Scholar] [CrossRef]
  51. Li, D.; Zhang, F.; Li, Q.; Zhou, H.; Li, J.; Zhou, X. Spatial and Temporal Evolution and Prediction of Carbon Stock in Bosten Lake Basin Based on PLUS–InVEST Model. J. Agric. Resour. Environ. 2025, 42, 1267–1276. [Google Scholar] [CrossRef]
  52. Qinghai Provincial People’s Government; Xizang Autonomous Region People’s Government. Sanjiangyuan National Park Master Plan (2023–2030); Qinghai Provincial People’s Government: Xining, China, 2023. Available online: https://www.gov.cn/yaowen/liebiao/202308/content_6899765.htm (accessed on 5 June 2026).
Figure 1. Location and topography of the study area. The main map shows the digital elevation model (DEM) of the Qinghai Lake Basin, with elevations ranging from 3165 to 5282 m a.s.l. The inset map (upper right) indicates the location of the study area within Qinghai Province, China. The map was projected using the WGS 1984 UTM Zone 47N coordinate system.
Sustainability 18 06199 g001
Figure 2. Spatial pattern of Production–Living–Ecological Space in the Qinghai Lake Basin in 2000, 2005, 2010, 2015 and 2020.
Sustainability 18 06199 g002
Figure 3. Spatial distribution of carbon stock in the Qinghai Lake Basin in 2000, 2005, 2010, 2015 and 2020.
Sustainability 18 06199 g003
Figure 4. Simulated spatial distribution of Production–Living–Ecological Space (PLES) under different scenarios: (a) Natural development scenario; (b) ecological protection scenario; (c) economic development scenario; (d) sustainable development scenario.
Sustainability 18 06199 g004
Figure 5. Contribution of driving factors.
Sustainability 18 06199 g005
Figure 6. Simulated spatial patterns of carbon stock in the Qinghai Lake Basin under different scenarios: (a) Natural development scenario; (b) ecological protection scenario; (c) economic development scenario; (d) sustainable development scenario.
Sustainability 18 06199 g006
Table 1. Data sources used in this study.
Data TypeData NameResolutionData Source
Land use dataLand use data for 2000, 2005, 2010, 2015, and 202030 mResource and Environment Science Data Center, Chinese Academy of Sciences (https://www.resdc.cn)
Natural dataDEM30 mSRTM Digital Elevation Data, NASA (https://earthdata.nasa.gov/)
SlopeDerived from DEM
NDVI1 kmMODIS Vegetation Index (https://ladsweb.modaps.eosdis.nasa.gov/)
Annual mean temperature1 kmNational Tibetan Plateau Data Center (https://data.tpdc.ac.cn)
Annual precipitation1 kmNational Tibetan Plateau Data Center (https://data.tpdc.ac.cn)
Socioeconomic dataGDP1 kmResource and Environment Science Data Center, Chinese Academy of Sciences (https://www.resdc.cn)
Population1 kmResource and Environment Science Data Center, Chinese Academy of Sciences (https://www.resdc.cn)
Accessibility factorsDistance to roads1 kmOpenStreetMap (https://www.openstreetmap.org/)
Distance to rivers1 km
Distance to lakes1 km
Distance to railways1 km
Distance to towns1 km
Table 2. Classification of Production–Living–Ecological Space.
Level 1Level 2Level 3
Production SpaceAgricultural Production SpaceFarmland, Orchards
Industrial and Mining Production SpaceFactories, Mines, Energy Facilities
Living SpaceUrban Living SpaceUrban Residential Area, Commercial Area, Public Facilities
Rural Living SpaceVillages, Town Residential Area, Community Facilities
Ecological SpaceForest Ecological SpaceForest, Shrubland
Grassland Ecological SpaceGrassland, Pasture
Water Ecological SpaceLakes, Rivers, Reservoirs
Other Ecological SpaceWetlands, Desert, Sandy Land
Table 3. Revised carbon density for different land use types during 2000–2020 (Units: Mg·ha−1).
YearCarbon DensitySpace Type
Agricultural Production SpaceIndustrial and Mining Production SpaceUrban Living SpaceRural Living SpaceGrassland Ecological SpaceForest Ecological SpaceWater Ecological SpaceOther Ecological Space
2000Cabove5.530000.4213.3600
Cbelow0.990002.6218.3102.1
Csoil42.7215.1524.1525.1379.58104.3139.3813.44
Cdead00000000
2005Cabove6.060000.4614.6300
Cbelow1.090002.8720.0502.1
Csoil46.7915.1524.1525.1387.16114.2539.3813.44
Cdead00000000
2010Cabove6.190000.4714.9500
Cbelow1.110002.9320.4902.1
Csoil47.8115.1524.1525.1389.05116.7339.3813.44
Cdead00000000
2015Cabove5.930000.4514.3100
Cbelow1.060002.8119.6202.1
Csoil45.7815.1524.1525.1385.26111.7639.3813.44
Cdead00000000
2020Cabove6.190000.4714.9500
Cbelow1.110002.9320.4902.1
Csoil47.8115.1524.1525.1389.05116.7339.3813.44
Cdead00000000
Table 4. Confusion Matrix.
Space TypeAPSIPSULSRLSGESFESWESOESTotal
APS28,0270436217011054630,398
IPS29243001237101467
ULS22024201312271
RLS110074243100788
GES159426548801,00841471211192,1121,000,151
FES300024272,97749073,316
WES10000162739262,3446007270,027
OES30106122331365264,197271,721
Total29,699269252826811,29777,411264,930462,4551,647,139
Abbreviations: APS, Agricultural Production Space; IPS, Industrial Production mining Space; ULS, Urban Living Space; RLS, Rural Living Space; GES, Grassland Ecological Space; FES, Forest Ecological Space; WES, Water Ecological Space; OES, Other Ecological Space.
Table 5. Neighborhood weights of different Space types in the PLUS model.
Space TypeNatural Development ScenarioEcological Protection Development ScenarioEconomic Development ScenarioSustainable Development Scenario
Agricultural production space0.40.50.50.5
Industrial and mining production space0.30.30.70.3
Urban living space0.20.30.60.2
Rural living space0.10.60.50.4
Grassland ecological space0.80.90.40.8
Forest ecological space0.20.80.30.5
Water ecological space0.40.40.40.5
Other ecological space0.50.70.50.6
Abbreviations: APS, Agricultural Production Space; IPS, Industrial Production mining Space; ULS, Urban Living Space; RLS, Rural Living Space; GES, Grassland Ecological Space; FES, Forest Ecological Space; WES, Water Ecological Space; OES, Other Ecological Space.
Table 6. Land use transfer matrix from 2000 to 2020 (Units: ha).
Space Type2020
APSIPSULSRLSGESFESWESOESTotal
2000APS51,361.8391.5350.8528.712040.932.704.6813.6853,594.91
IPS0.00455.310.000.0022.504.320.180.27482.58
ULS9.540.45425.880.000.630.000.000.09436.59
RLS24.210.000.001389.7815.300.720.000.451430.46
GES4192.921213.8311.61110.791,435,101.661846.805752.8910,625.221,458,855.72
FES234.36133.0253.6442.305368.32133,593.3036.90200.79139,662.63
WES9.8138.9711.160.00577.5357.78475,301.79326.70476,323.74
OES12.4230.870.901.53320,208.03378.9918,675.54493,238.16832,546.44
Total55,845.091963.98554.041573.111,763,334.90135,884.61499,771.98504,405.362,963,333.07
Table 7. Dynamic degree of different land use types (Units: %).
Space Type2000–20052005–20102010–20152015–20202000–2020
Agricultural Production Space0.250.62−0.070.030.21
Industrial and Mining Production Space0.0015.261.4623.0215.35
Urban Living Space0.051.822.620.521.35
Rural Living Space0.280.502.24−0.970.50
Grassland Ecological Space0.004.220.06−0.091.04
Forest Ecological Space−0.07−0.470.54−0.53−0.14
Water Ecological Space0.000.430.120.410.25
Other Ecological Space0.00−7.62−0.450.03−1.97
Table 8. Zonal statistics of carbon stock changes between 2020 and 2035 under different scenarios (Units: 106 Mg).
Space TypeNatural Development ScenarioEcological Protection Development ScenarioEconomic Development ScenarioSustainable Development Scenario
Agricultural production space0.210.17−0.760.28
Industrial and mining production space−0.19−0.08−1.57−0.11
Urban living space0.140.16−0.140.09
Rural living space0.160.15−0.370.08
Grassland ecological space1.725.29−5.582.67
Forest ecological space0.512.62−2.430.91
Water ecological space0.220.47−0.520.42
Other ecological space0.341.32−1.530.53
Total3.1110.1−12.94.87
Disclaimer/Publisher’s Note: The statements, opinions and data contained in all publications are solely those of the individual author(s) and contributor(s) and not of MDPI and/or the editor(s). MDPI and/or the editor(s) disclaim responsibility for any injury to people or property resulting from any ideas, methods, instructions or products referred to in the content.