Article

Geo-Environmental Insights for Sustainable Development: Assessing the Most Southern Part of the Red Sea Coast, Saudi Arabia

by
Abdullah M. Alanazi
Department of Civil Engineering, College of Engineering, King Saud University, P.O. Box 800, Riyadh 11421, Saudi Arabia
Sustainability 2026, 18(16), 8432; https://doi.org/10.3390/su18168432
Submission received: 3 June 2026 / Revised: 2 August 2026 / Accepted: 11 August 2026 / Published: 17 August 2026
(This article belongs to the Special Issue Geospatial Analysis for Sustainable Environmental Management)

Abstract

The southern Red Sea coastal zone of Jizan Province in Saudi Arabia is increasingly exposed to seismic hazards, soil erosion, flash flooding, and tectonically shaped landscape instability, raising challenges for sustainable development. This paper integrates high-resolution 12.5 m ALOS PALSAR digital elevation model data, morphometric analyses, geomorphic interpretations, and the Revised Universal Soil Loss Equation (RUSLE) model to assess soil erosion vulnerability and relative tectonic activity along 24 sub-basins. A total of 22 morphometric parameters were investigated, analyzed, and integrated into a weighted compound ranking key for prioritizing erosion-prone sub-basins. Geomorphic interpretation was assessed using the hypsometric integral, valley-floor width-to-height ratio, and basin shape, which were processed in the Relative Tectonic Activity (RTA) model. The results recognize sub-basins 8, 7, 22, 18, 23, 13, 3, and 9 as the highest-priority zones for soil conservation, while hypsometric integral values (0.04–0.48) reveal mature landscapes with geomorphic reactivation. High spatial correlation among morphometric prioritization, RTA interpretation, and the RUSLE model reveals that drainage characteristics, relief, lithology, and tectonic signatures indicate a significant spatial association with the soil erosion framework. The proposed model presents a reliable baseline key for sub-basin prioritization and climate-resilient mega-structure planning in data-poor settings, directly supporting SDG 9 and SDG 13.

1. Introduction

Worldwide, natural hazards are considered one of the most significant challenges to sustainable development, particularly in regions with expanding infrastructure, rapid urbanization, and rising climate variability [1,2,3]. Significant hazards, including flash flooding, soil loss, landslides, desertification, and land degradation, continuously modify different landscapes, threaten population settlements, reduce agricultural productivity, and destroy water resources [4,5]. The severity and frequency of several of these critical hazards are expected to increase under continuing climatic changes, where variations in rainfall severity and extreme atmospheric events impact geomorphic behaviors and change watershed responses [6]. Accordingly, investigating the spatial distribution and interactions among geomorphological, hydrological, geological, and climatic factors has become essential for understanding environmental management strategies and sustainable development planning [7,8]. These critical challenges are particularly pronounced in arid to semi-arid regions, where poor vegetation cover, steep terrain, and episodic heavy rainfall work together to create highly active landscapes that are highly sensitive to several geomorphic changes [9,10].
Recently, global research has progressively shifted from studying only individual geo-hazards toward developing geo-environmental assessments that can simultaneously evaluate several related events in basin systems [11,12]. This transition is reflective of the growing understanding that significant hazards such as flash flooding, tectonic activity, sediment transport, and soil erosion are closely linked through a precise knowledge framework including factors such as geomorphology, drainage systems, lithology, land use, and climatic changes [13,14,15]. Thus, basin-scale analyses have become indispensable for recognizing hazard-prone regions, prioritizing susceptible basins, improving land-use strategies, and aiding in disaster-risk reduction plans [16,17,18]. Such combined assessments help strategic decision-makers by providing critical and valuable information that can be used to develop major sustainable infrastructure plans, efficient watershed strategies, and climate management initiatives, while directly supporting critical United Nations Sustainable Development Goals (SDGs) including Clean Water and Sanitation (SDG 6), Industry, Innovation and Infrastructure (SDG 9), Sustainable Cities and Communities (SDG 11), and Climate Action (SDG 13) [19,20,21,22].
Due to these evolving natural challenges, important advances in crust observation methods and technologies have greatly improved geo-environmental studies and investigations [23,24,25,26]. High-spatial-resolution satellite remote sensing, digital elevation models (DEMs), geographic information systems (GISs), and geospatial modeling techniques now provide significant details of basin morphology, drainage systems, terrain characteristics, land-use attributes, and erosion events across inaccessible and large regions with high spatial accuracy [27,28,29]. Advanced geospatial analysis methods progressively apply multiple datasets and analytical models to understand environmental hazards, enhance predictive power, reduce field-observation costs, and assist in supporting evidence-based natural decision-making [30,31]. Rather than studying only geomorphological characteristics, modern basin studies integrate remote sensing, GIS, geomorphic interpretation, and morphometric analysis to produce understandable hazard assessments that capture both the underlying processes and the spatial distribution controlling landscape evolution [7,32]. This effective combined geospatial model has thus become one of the most valuable scientific frameworks for assessing natural geo-hazards in data-poor areas and for helping manage sustainable watershed plans in regions with different environmental conditions [33]. To avoid any limitations, recent studies have supported morphotectonic analysis models with geomorphic indices that present insights into the evolutionary state of drainage basins [34]. Geomorphic indices such as the hypsometric integral, valley-floor width-to-height ratio (VF), and basin shape (Bs) have been commonly applied to investigate landscape maturity, tectonic signatures, drainage behaviors, and evolution [35,36]. When integrated with lithological and tectonic information, these indices aid in distinguishing between relief variations shaped by tectonic activity and those governed mainly by climate or erosional characteristics, thus presenting a process-based model of basin evolution [36]. Simultaneously, soil erosion models have become important tools for quantifying soil erosion hazards. Accordingly, the Revised Universal Soil Loss Equation (RUSLE) model has become the most commonly applied empirical method due to its integration of factors including rainfall erosivity, soil erodibility, relief factors, and land-use characteristics within a GIS environment to investigate the distribution of annual soil erosion [37,38,39]. Accordingly, recent geo-environmental studies can be strengthened by applying models with integrated morphometric parameter analysis and geomorphic index interpretation, in addition to RUSLE modeling, to present more comprehensive and valuable assessments of basin susceptibility than any individual method. Such multi-disciplinary methods not only help in understanding the processes governing erosion but also present effective scientific evidence for basin prioritization, risk management, and sustainable development.
A critical comparison of previous catchment studies indicates three main scientific gaps. (1) Traditional models of morphometric prioritization, including equal-weighting frameworks, are affected by extreme statistical redundancy and multi-collinearity [40,41]. Thus, by applying morphometric parameters to control slope and relief aspects, these models discuss and address kinetic erosion processes [41,42]. (2) There is a basic morphometric gap between deep-seated tectonics and present-day surface soil erosion modeling. Regional evaluations mainly discuss superficial soil erodibility using individual RUSLE models without considering how active tectonic signals directly rejuvenate gradients and accelerate surface run-off flows [37,38]. (3) Relying on coarse 30 m spatial resolution SRTM DEMs in complex cliffs affects relief accuracy by reducing the resolution of fine-scale drainage systems and gradient characteristics [43,44]. In this study, the previously discussed gaps were addressed by integrating a high-resolution DEM dataset with coupled relative active-tectonics (RTA) and empirical erodibility (RUSLE) spatial models along the southernmost Red Sea margin. Additionally, the current study discusses this knowledge gap by combining these related analytical methods to provide a comprehensive natural assessment that investigates basin/sub-basin prioritization, assigning erosion hotspots, understands the geomorphic characteristics controlling soil erosion patterns, and presents significant information to support infrastructure planning and sustainable environmental plans.
Consequently, this work aims to understand and develop an integrated geomorphological and environmental assessment of the southernmost coastal region of the Red Sea in Jazan Province, Saudi Arabia, by integrating morphometric analysis, geomorphic interpretation, geospatial analysis, and RUSLE modeling. The paper aims to (1) characterize basin morphometry and geomorphic features; (2) assess the spatial distribution of soil erosion vulnerability; (3) prioritize sub-basins according to their soil loss vulnerability; and (4) investigate the geomorphological factors affecting erosion patterns to support sustainable basin management. Generally, in active geomorphic regions, differential structural tilting and tectonic uplift along steep relief promote vertical valley incision, directly enhancing drainage network density and driving landscape rejuvenation processes [45,46]. This mechanism reduces slope stability along fault-related fractures, which systematically increases soil erosion rates and mass-wasting vulnerability within prioritized sub-basins [34]. While the standalone geomorphic indices and empirical soil erosion models applied in this study rely on established mathematical formulations, the conceptual novelty of this study lies in its integrated geospatial framework that combines rift-related tectonic processes with surface erodibility and soil dynamics and hydro-morphometric prioritization in a data-poor active Red Sea rift margin [47]. Traditional soil loss assessments treat topographic relief as a static control factor, potentially overlooking the influence of tectonically controlled drainage gradients and runoff energy on spatial variations in erosion susceptibility. By integrating a cumulated relative tectonic activity (RTA) index derived from the 12.5 m spatial resolution ALOS PALSAR DEM with RUSLE soil loss modeling and an AHP-based ranking framework, this study presents a transferable spatial cross-validation framework. This framework advances the current state of knowledge by presenting a reproducible diagnostic framework for prioritizing soil erosion-prone sub-basins over active coastal zones globally, where high levels of tectonic fracturing and severe episodic rainfall jointly accelerate soil erosion rates [47,48].

2. Study Area

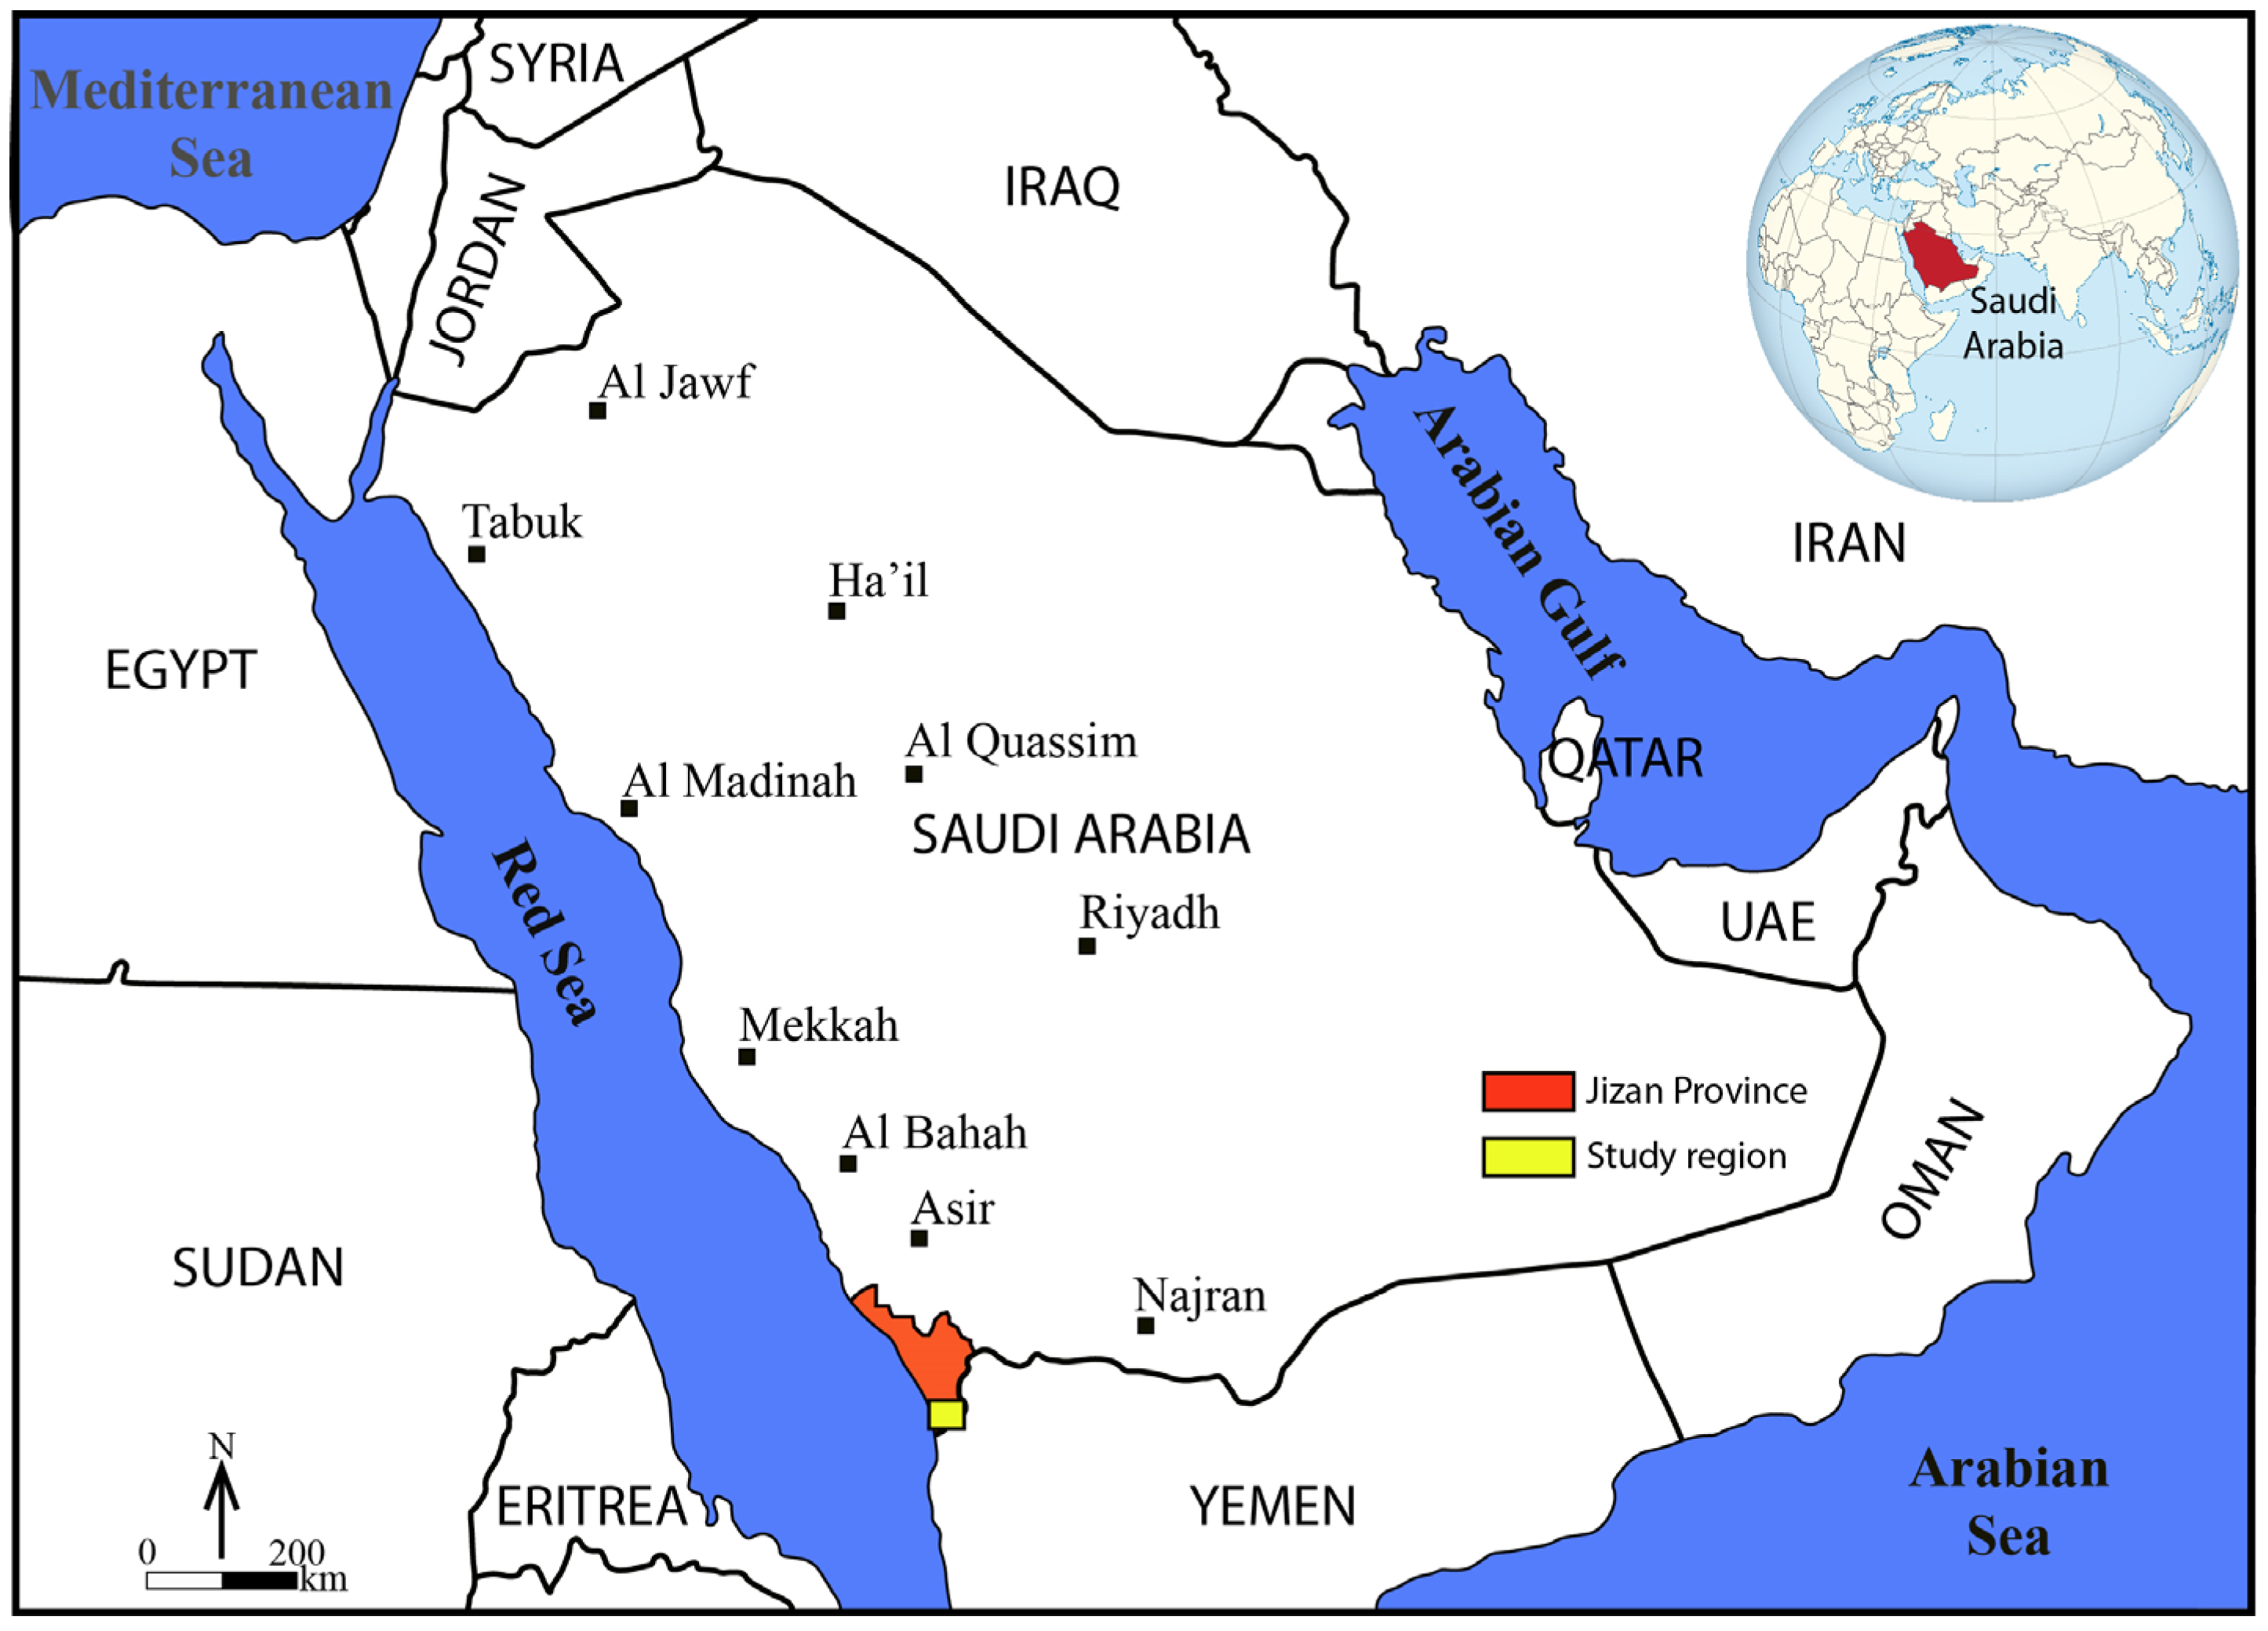
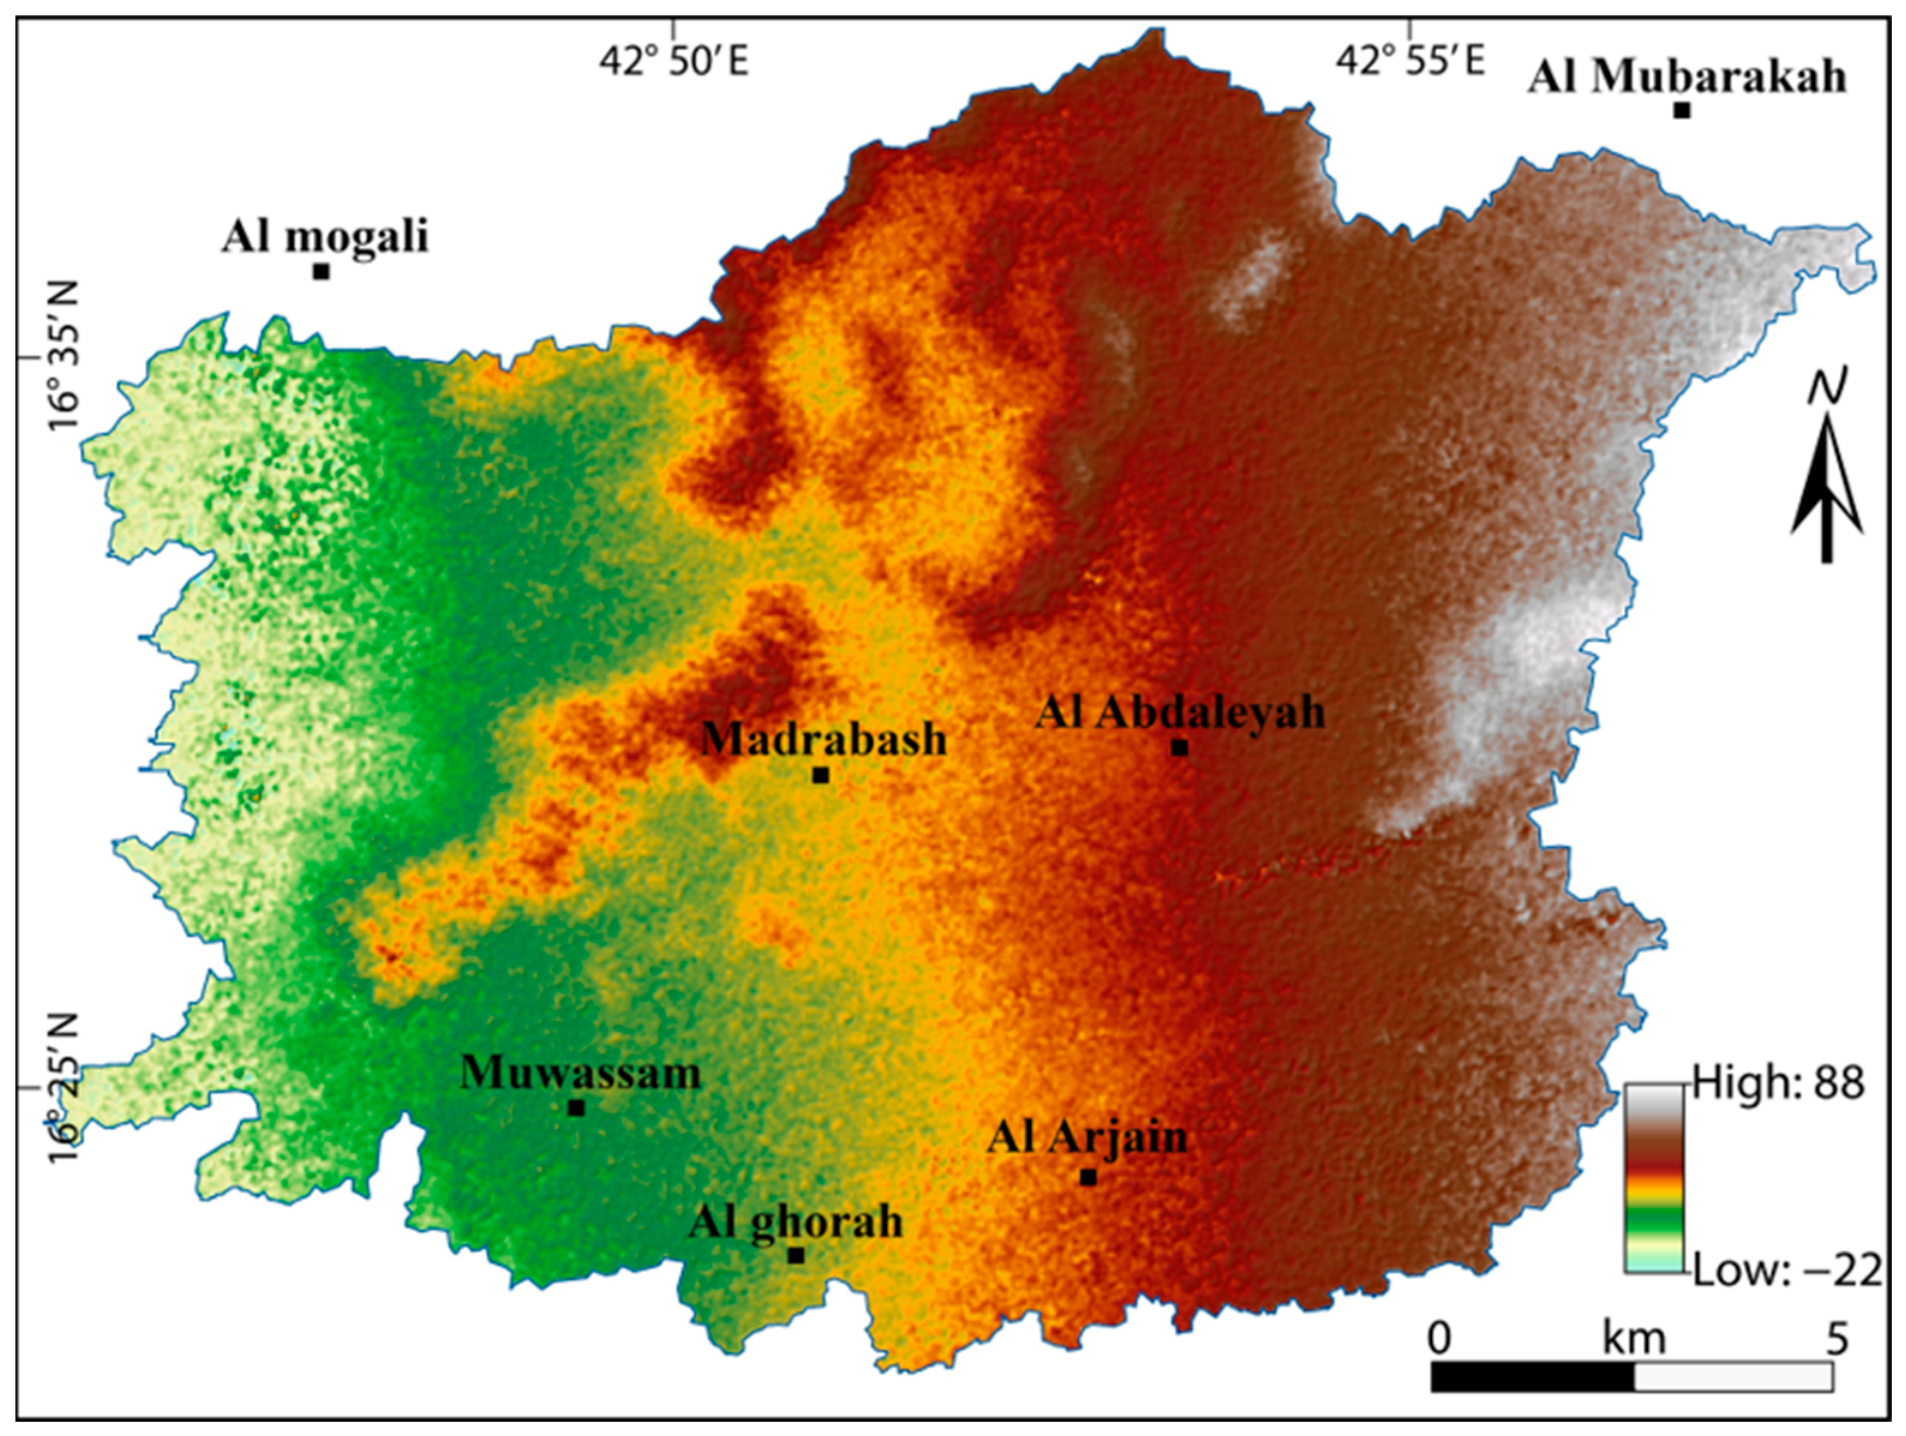
The study area is located in the southwestern part of the Jizan Province, along the eastern margin of the major Red Sea rift (Figure 1). The study area extends approximately between 16°22′ and 16°37′ N latitudes and 42°43′ and 43°00′ E longitudes, covering ~239.54 km2. This region encompasses several localities such as Muwassan, Al Mogali, Al Mubarakah, Madrabash, and Al Ghorah. The study landscape exhibits a distinct topographic variability with elevations from low-lying coastal plains (−22 m) to elevated terrain (88 m above mean sea level) (Figure 2). The study area lies within a significantly active tectonic zone related to the African–Arabian rift system, shaping part of the Red Sea coastal zone [49,50]. The tectonic evolution is primarily controlled by the continental rifting of the Cenozoic and the Red Sea opening, resulting from the divergence between the African and Arabian tectonic plates [49,51].
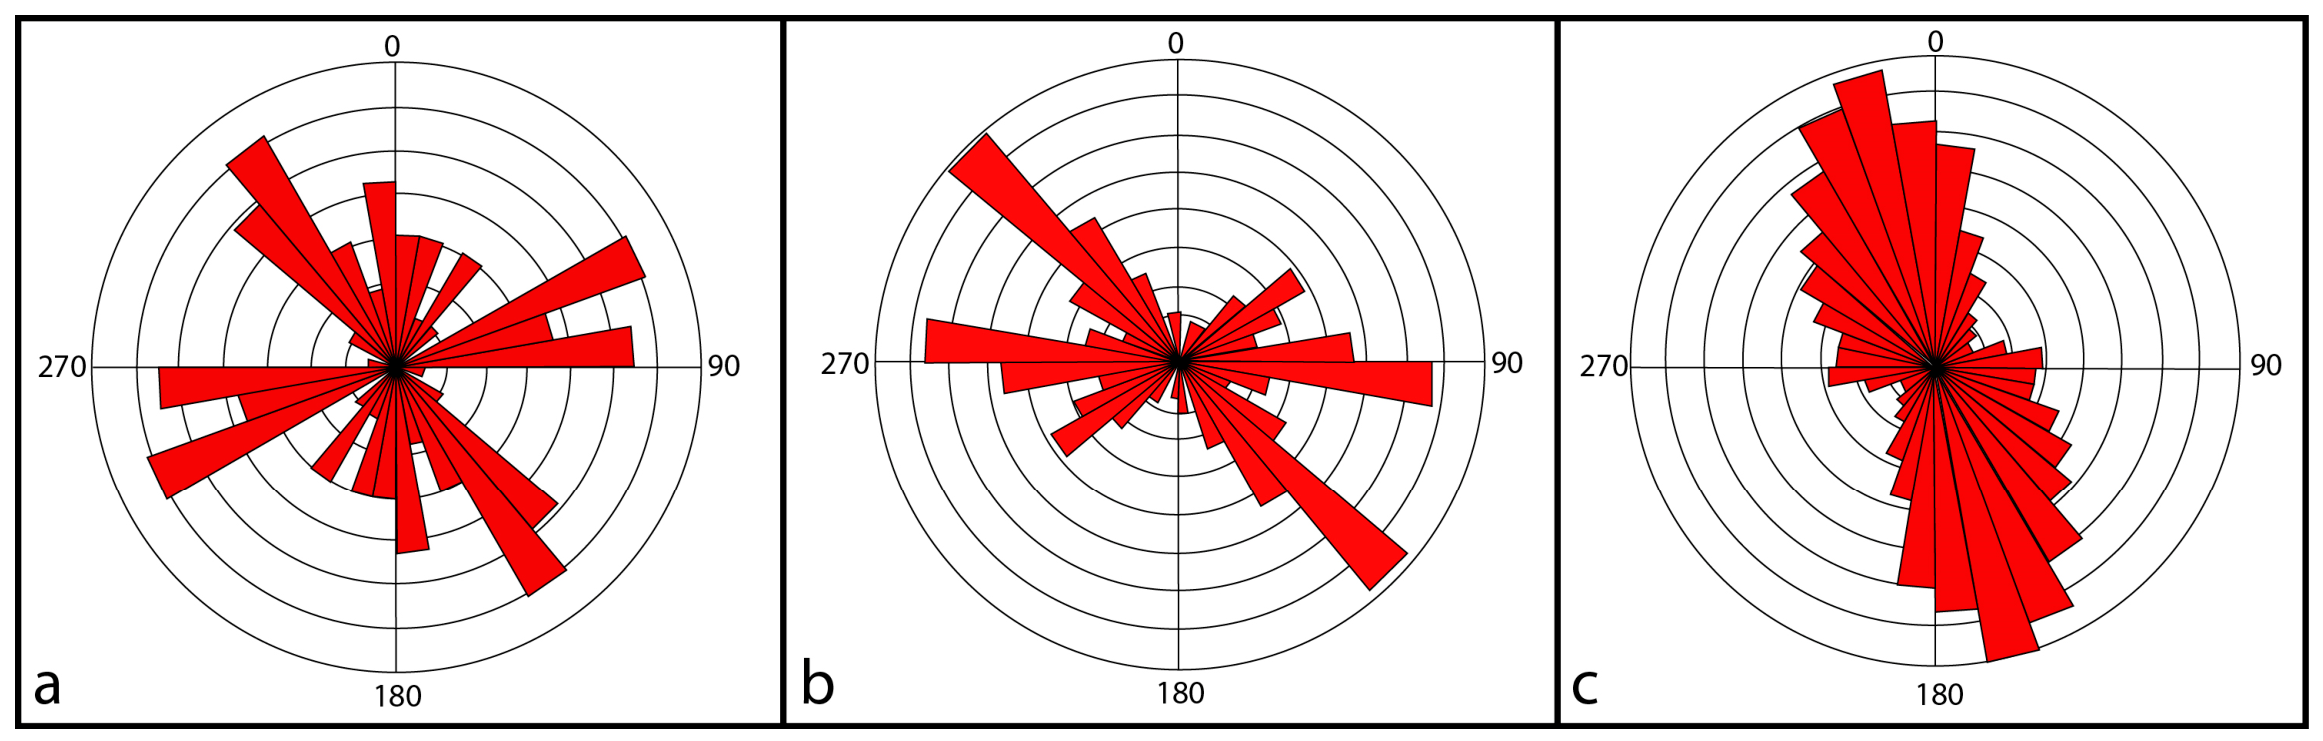
The regional tectonic framework impacting the study area is characterized by the transition from continental rifting to dynamic oceanic spreading of the rifting system of the Red Sea [52]. The study landscape is underlain by the Late Oligocene–Early Miocene Jizan Group (30–21 Ma), highly deformed and fractured volcanic rocks characterized by sheeted dikes and basaltic flows [48]. These formations and their overlying Quaternary sediments are highly sensitive to tectonic activity and soil erosional processes [51]. The observed tectonic framework is characterized by half-grabens which are controlled by NNW–SSE-trending gravitational faults with likely 140–160° N trending, parallel to the recorded axis of the rift system, with secondary ENE–WSW normal faults governing modern seismic activity and block tilting (Figure 3) [47]. Pervasive, high-density fracturing is revealed by outcrop photogrammetric data (P21 intensities reaching 54 m−1) [48]. This dense fracture network controls the modern drainage systems, stream gradients, and geometries of basins, providing a structural geological framework to support the active tectonics inferred from the geomorphic analyses.
The study region is characterized by a hot desert climate, with annual temperatures ranging from 31 to 35 °C and relatively high humidity (~60% in June to ~73% in January) [54]. Precipitation rate in the southern part of Jizan Province is low but occurs mainly as short-duration, intense rainfall events [48]. These flood events, together with the high erodibility of the soil, the nature of the fractured volcanic rocks and steep relief gradients, provide suitable conditions for the severe surface runoff generation [54]. Therefore, the drainage systems in the present study reflect ongoing relative activity including uplift and subsidence, which continue to affect the fluvial landscape evolution.

3. Materials and Methods

3.1. Data Used

The current study integrates remote sensing, GIS, digital elevation model (DEM) analyses, morphometric and geomorphic analysis, and erosion modeling to investigate basin characteristics, relative tectonic activity, and soil erosion vulnerability in southern Saudi Arabia. The main source of the processed topographic dataset for this study is the ALOS PALSAR digital elevation model (DEM) which has a spatial resolution of 12.5 m, acquired from the Alaska Satellite Facility website. This DEM was selected over the widely used 30 m Shuttle Radar Topography Mission (SRTM) DEM because of its superior performance in representing the complex escarpment topography of southern Jizan Province [55]. Accordingly, the DEM was used for basin/sub-basin delineation, drainage network extraction, morphometric analysis, calculation of geomorphic indices, and derivation of the LS factor for the Revised Universal Soil Loss Equation (RUSLE) model. The DEM was projected to the WGS 1984 UTM Zone 37N coordinate system and subjected to preprocessing, including sink filling to remove spurious depressions and ensure hydrological consistency.
Furthermore, spatial datasets were selected and integrated to implement the RUSLE soil erosion model. Rainfall data were obtained to estimate the rainfall erosivity factor (R), soil data were acquired to assign the soil erodibility factor (K), Sentinel-2 data were used to extract the land-use/land-cover (LULC) map for assigning the cover-management factor (C), while the support practice factor (P) was addressed based on the prevailing land-management conditions.

3.2. Drainage Network Extraction and Sub-Basin Delineation

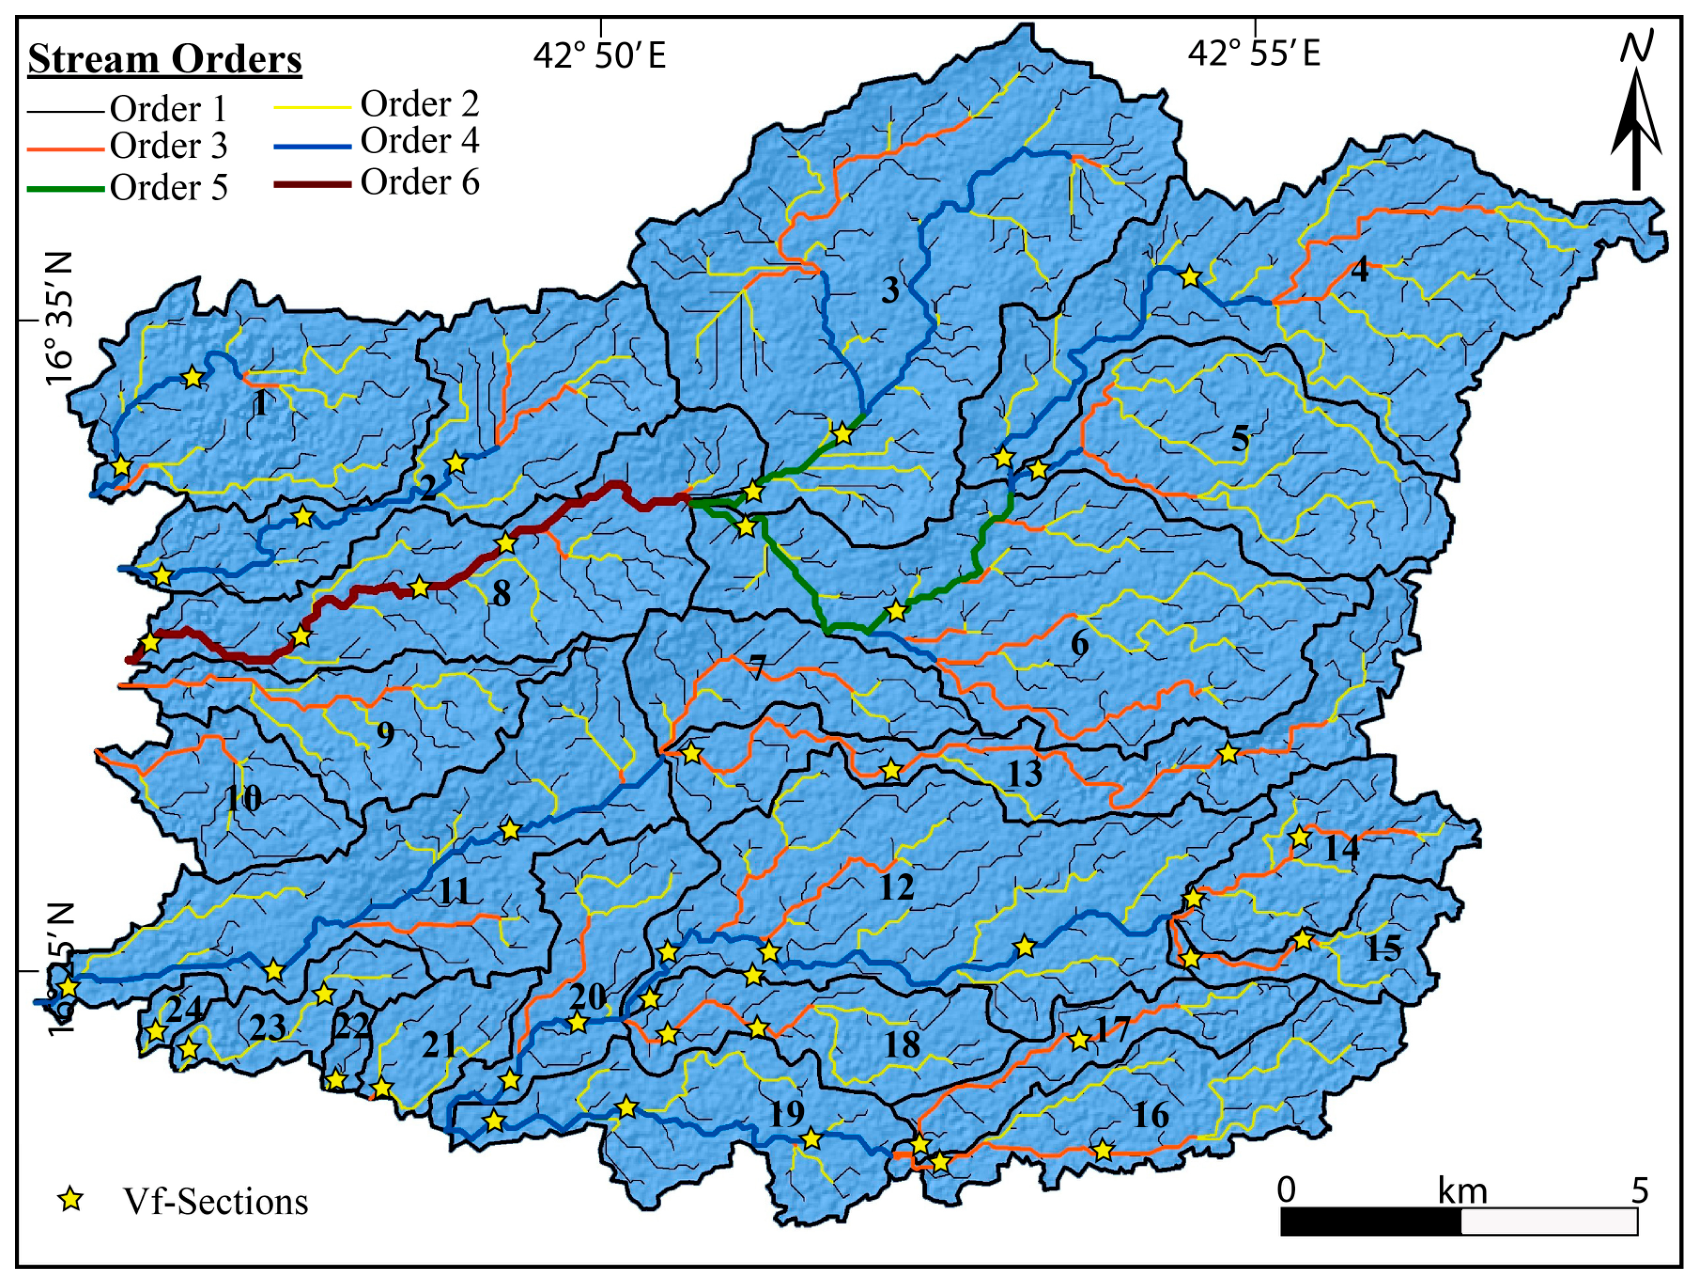
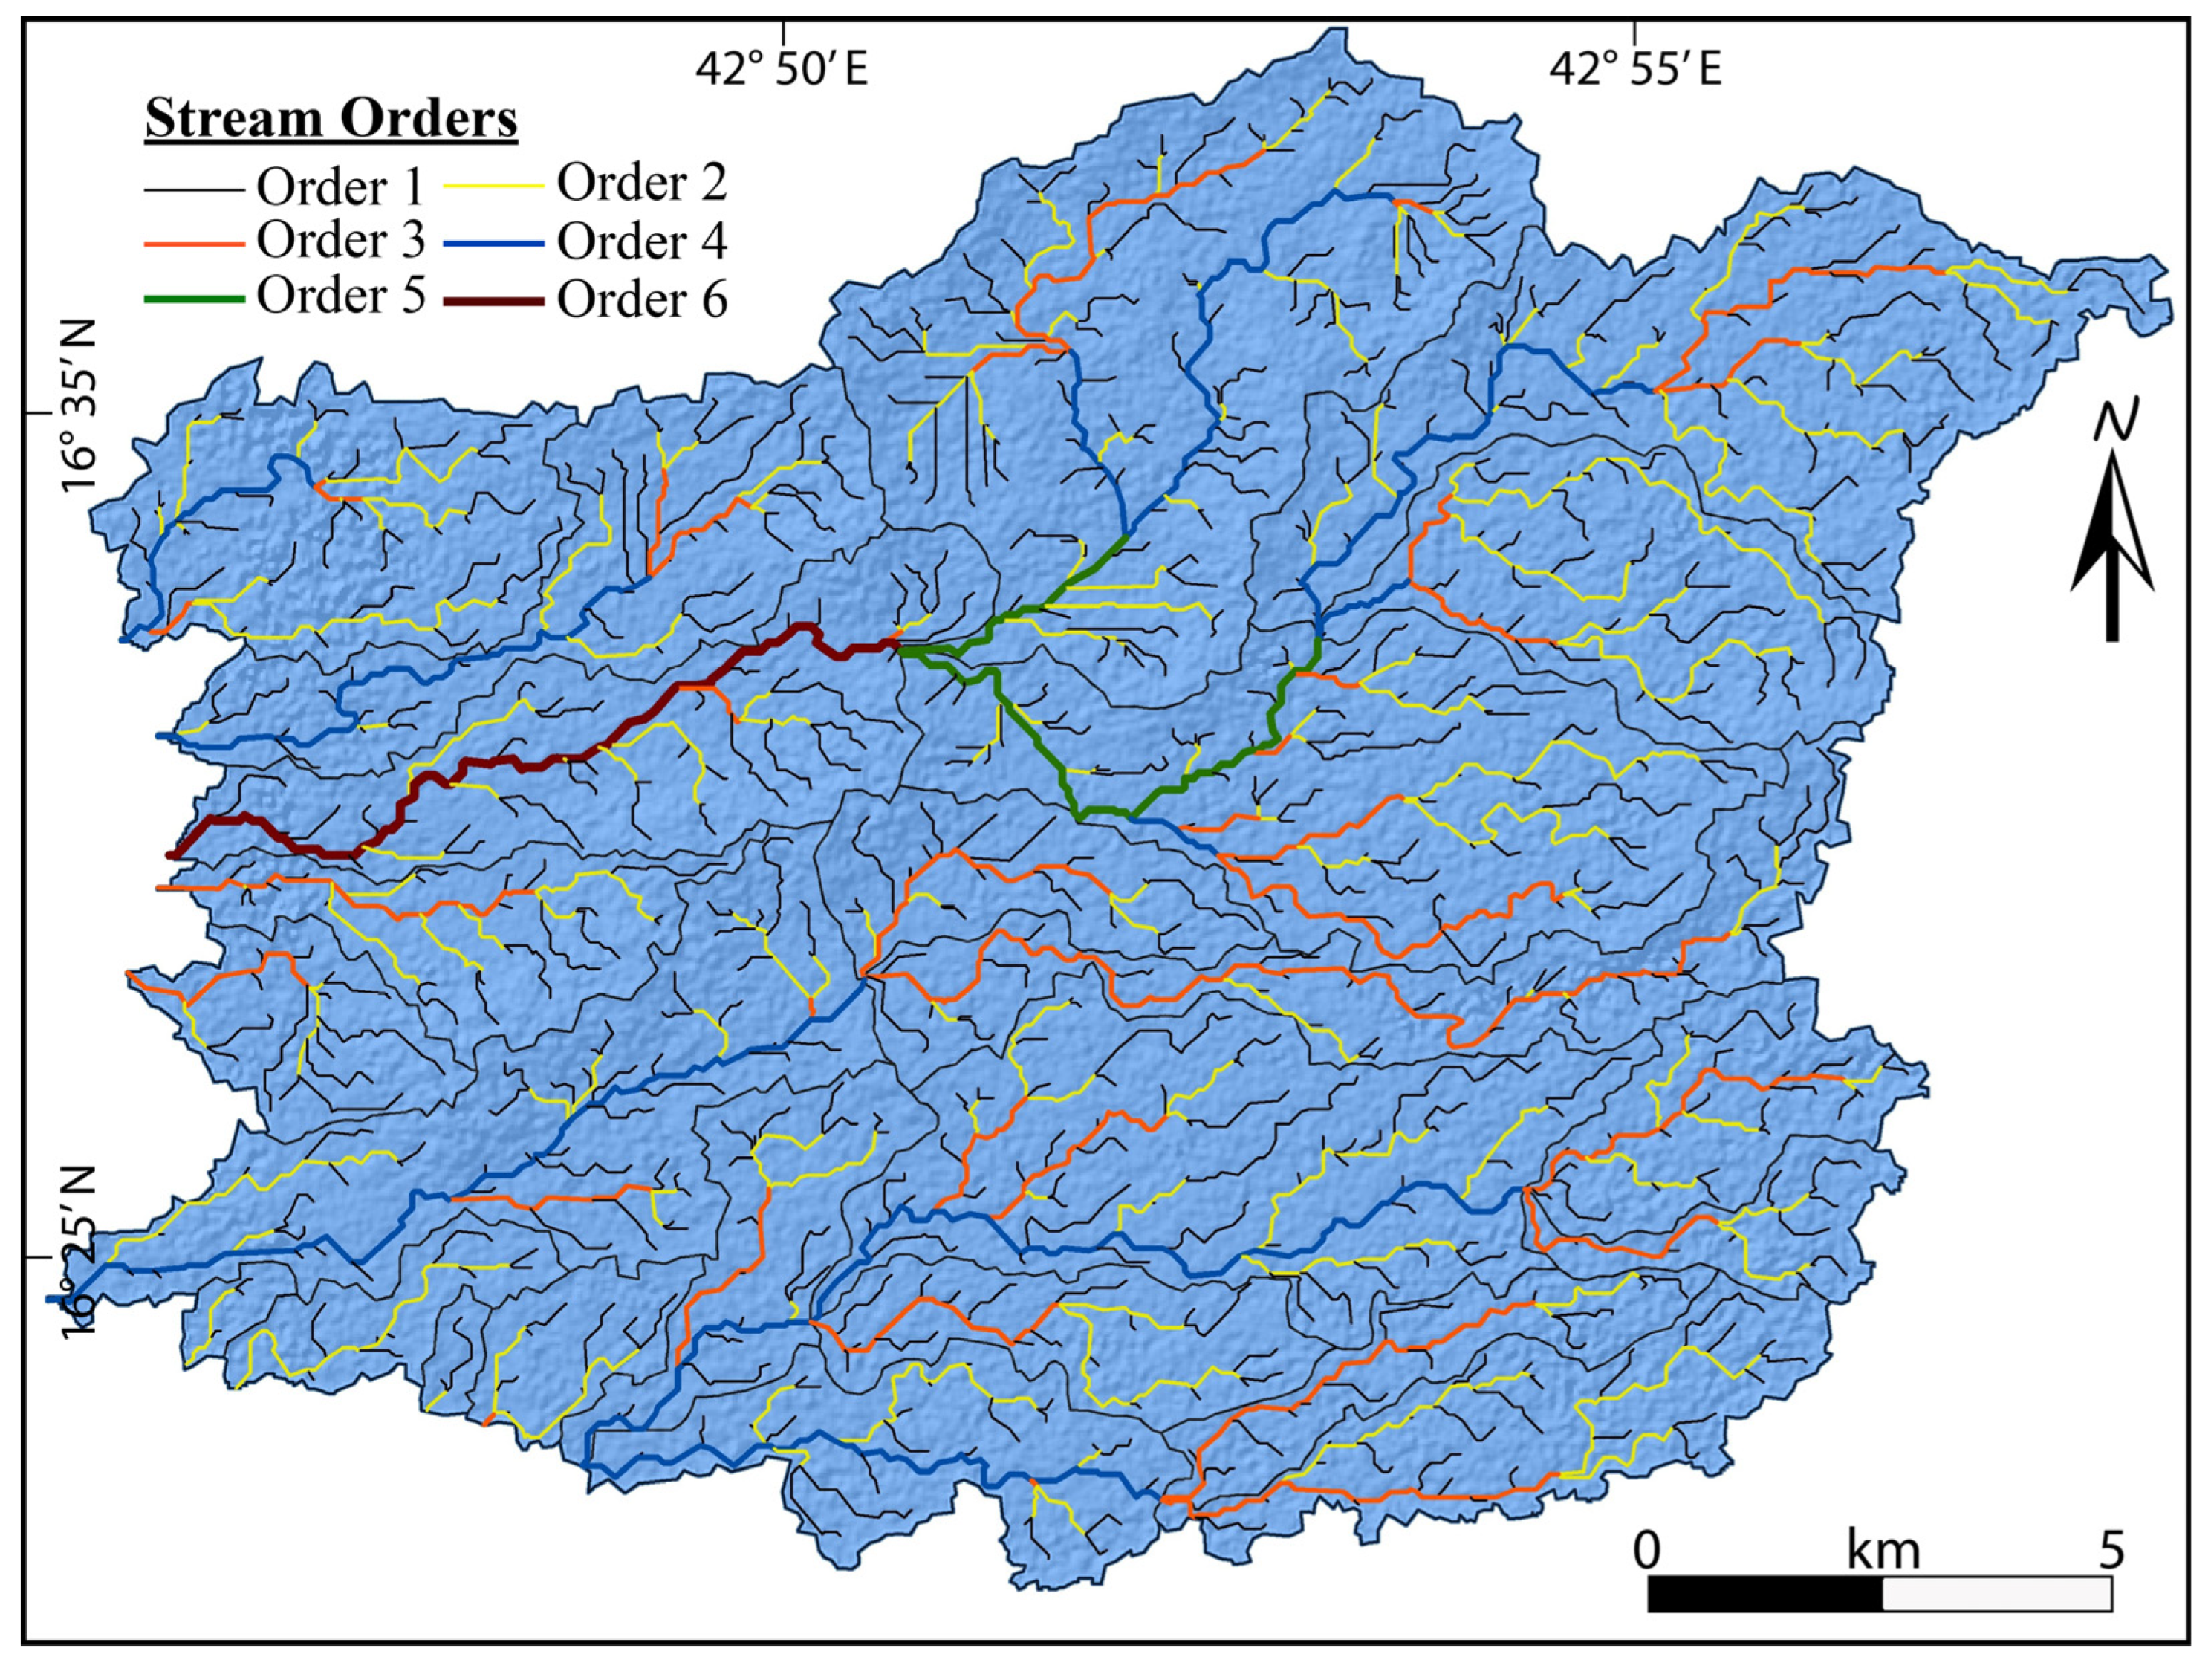
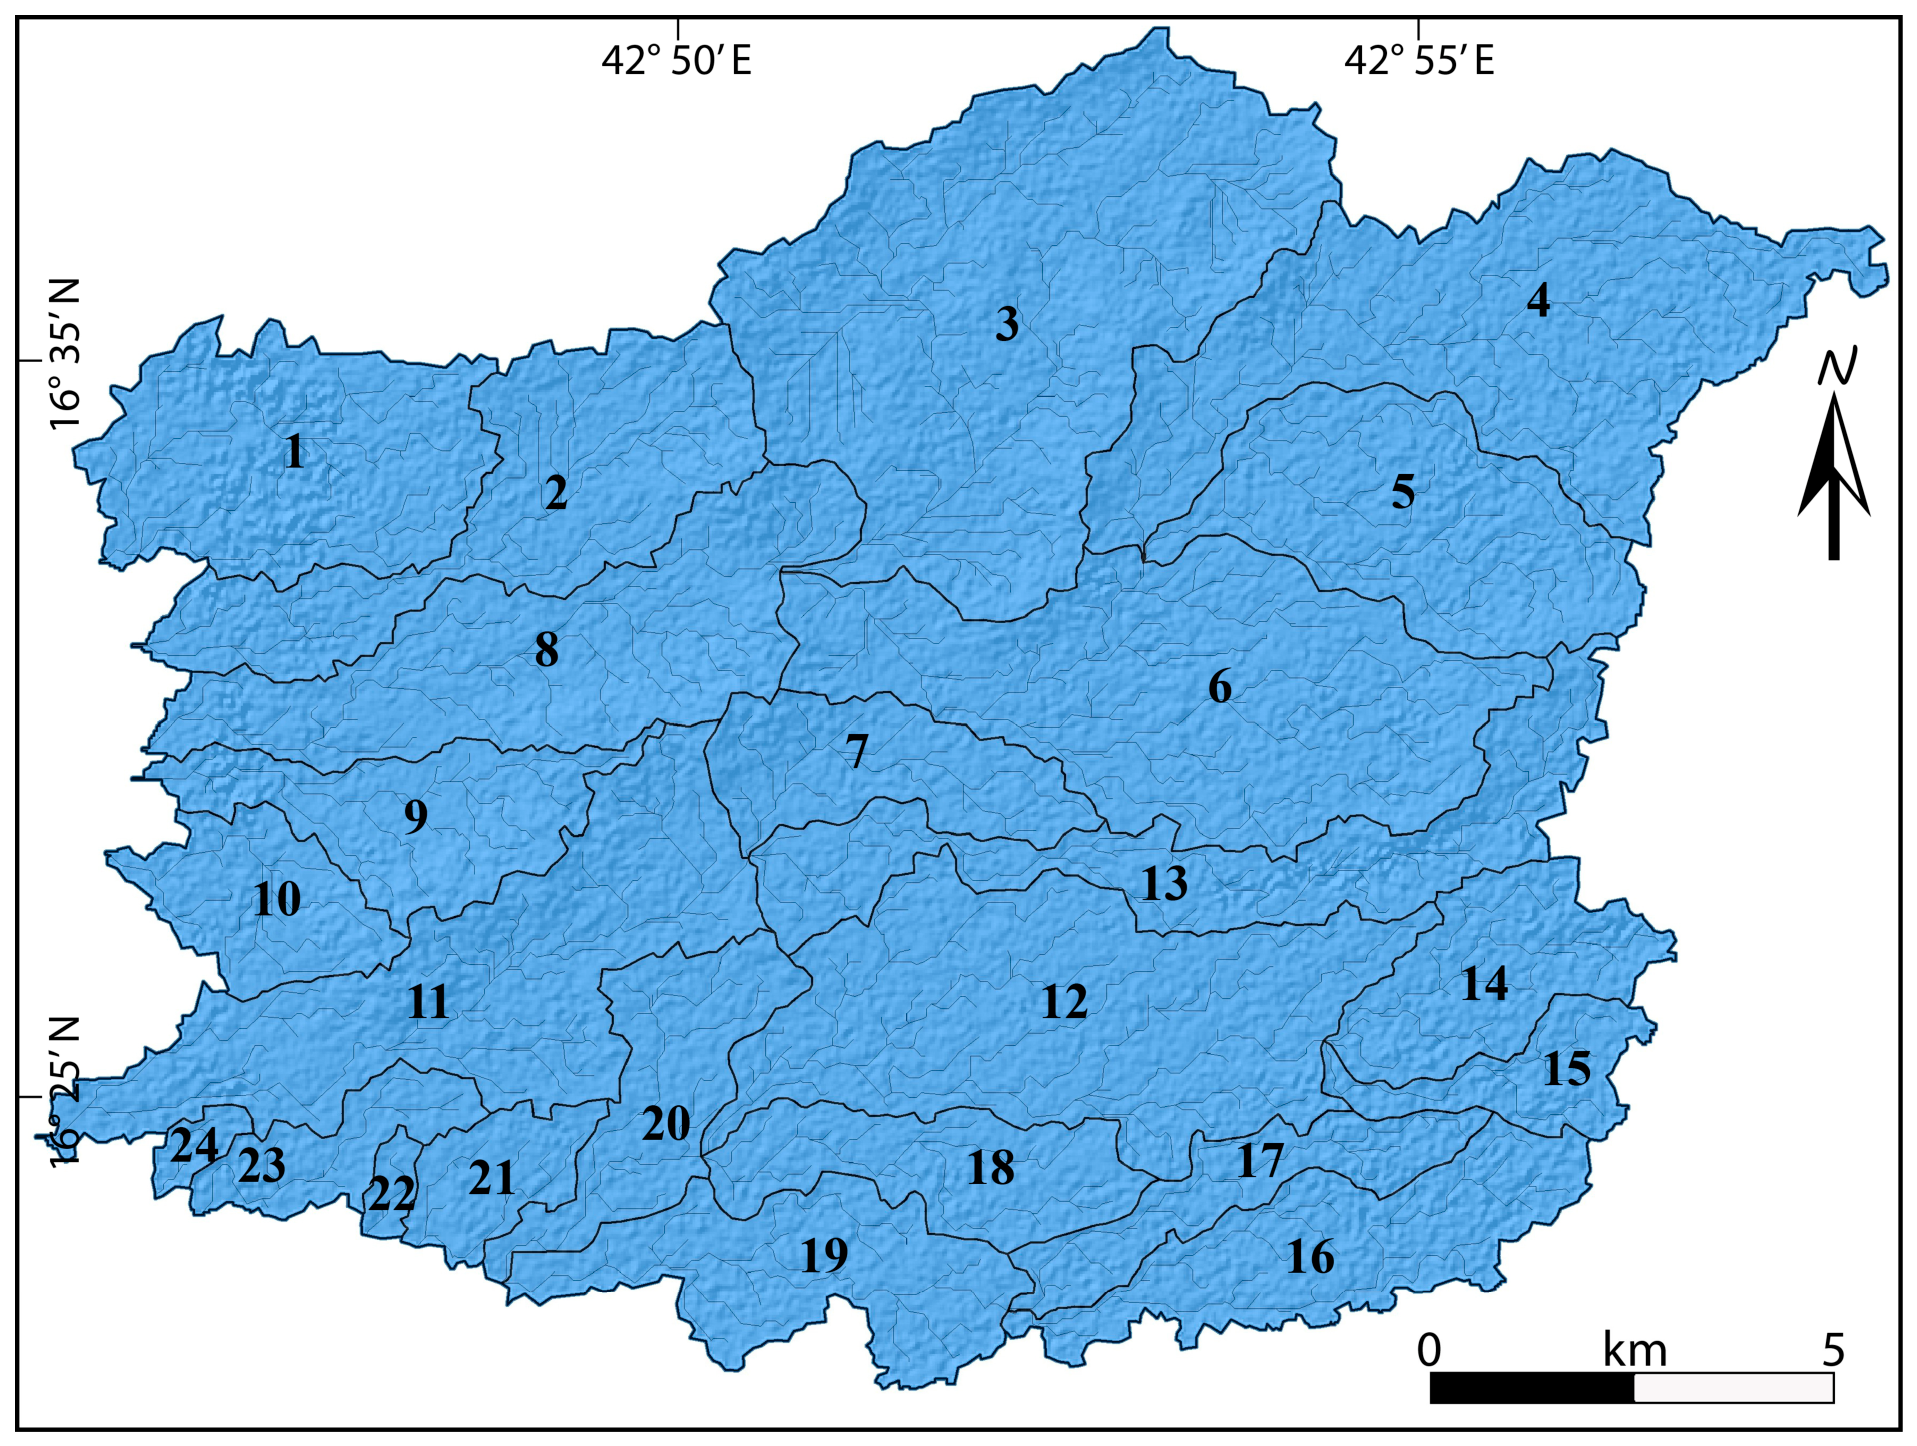
The drainage network and basin boundaries of the study area were extracted and delineated using the Hydrology tools in ArcGIS 10.4. The DEM scenes were subjected to a sink-filling process using the Fill function to remove artificial sinks and ensure correct and continuous and hydrologically consistent drainage network. The corrected data was subsequently used to assign flow direction using the eight-direction (D8) algorithm, which assigns the direction of steepest descent to each raster cell [7]. Then, a flow accumulation map was produced to identify upstream contributing areas and assign stream initiation points. Therefore, to select a suitable drainage threshold, a multi-scale analysis was conducted by examining several flow-accumulation thresholds and evaluating the obtaining drainage systems against the available high-resolution topographic data. The threshold that provided the closest consistence with the drainage system extracted from the topographic maps was selected. A threshold of 1000 flow-accumulation cells, corresponding to an area of approximately 0.16 km2, was selected because it reduced the generation of artificial first-order streams and presented a drainage system that closely matched the topographic maps. The drainage system was extracted using a comparison between topographic maps and a high-resolution DEM to ensure consistency with the channel distribution (Figure 4). Based on the extracted drainage systems, sub-basin boundaries were delineated, producing 24 sub-basins, which shaped the basic spatial units for the subsequent morphometric analysis, geomorphic evaluation, tectonic activity and RUSLE modeling (Figure 5).

3.3. Morphometric Parameters

In this study, morphometric analysis was conducted to quantify and describe the geometry, drainage characterization, and topographic attributes of the assigned sub-basins. Morphometric parameters provide an objective description of basin characteristics and have commonly been used to assess hydrological characteristics, soil erosion vulnerability, and landscape evolution controlling drainage development [17,56,57]. In the present work, all morphometric parameters were obtained from the ALOS PALSAR DEM using ArcGIS (10.4), thereby ensuring methodological reproducibility and reducing errors. Consequently, 24 sub-basins were examined individually, and the analyzed parameters were classified into three main groups due to their morphometric significance [58,59,60,61]:
(1)
Areal aspects, including the elongation ratio and form factor, drainage density, and circularity ratio, were applied to study geometric attributes, drainage behavior, and hydrological properties of each sub-basin.
(2)
Linear aspects, including stream length, length of overland flow, and bifurcation ratio were investigated to assess the hierarchical configurations, drainage system properties, and surface runoff concentration in the fluvial system.
(3)
Relief aspects, including the ruggedness number and relief ratio, were applied to characterize reliefs, slopes, and topographic variability, thus providing insights into soil erosion vulnerability and the morphometric response to tectonic controls.
By integrating these three measurable aspects, the current morphometric analysis provides a comprehensive quantitative assessment of basin characteristics and their potential impact on soil erosion vulnerability. This integrated model enables the systematic prioritization of sub-basins due to their relative erosion vulnerability and presents a basis for comparing morphometric analysis with geomorphic features, active tectonic signatures, and RUSLE model in the southern Red Sea coastal region. The morphometric parameters analyzed in the current study are tabulated in Table 1.

3.4. Soil Erosion Prioritization and Ranking Concept

A morphometric-based basin prioritization model was developed to recognize sub-basins presenting the greatest vulnerability to soil erosion [58,62]. Since each parameter affects soil erosion differently, a model of weighted multi-criteria ranking was designed to group the different morphometric characteristics into an individual prioritization index. In the current study, each parameter was first ranked due to its relation to soil erosion processes [61]. Morphometric parameters positively related to soil erosion vulnerability, including drainage density, bifurcation ratio, stream frequency, ruggedness number, basin relief, and relief ratio, were ordered in ascending order, where larger values indicate lower soil erosion ranks [61,63]. On the other hand, morphometric parameters inversely related to soil erosion vulnerability, including the elongation ratio, length of overland flow, circularity ratio, and form factor, were ordered in descending order so that units with higher soil erosion vulnerability consistently indicated lower ranks.
To avoid arbitrary weight selection and address key multi-collinearity, the dual comparison matrix was produced through expert judgment confirmed by published multi-criteria soil erosion literature in arid and semi-arid rift environments. Areal morphometric parameters which control the distribution channel network and flow accumulation were given a slightly higher priority over linear and relief characteristics, which control hydraulic power and surface runoff velocity. Using an analytic hierarchy process (AHP) key, the dual comparison matrix yielded standardized weights of W_Areal = 0.40, W_Linear = 0.30, and W_Relief = 0.30. The principal eigenvalue (λmax. = 3.00) produced a consistency index (=0.00) and a consistency ratio (=0.00) accepting the consistency threshold (<0.10). To assess the stability of the final ranks of the sub-basin prioritization under varying decision characteristics, an effective sensitivity analysis was conducted over four significant weighting models: (a) AHP Baseline: 40% areal, 30% relief, and 30% linear; (b) Equal Weighting: 33.3% areal, 33.3% relief, and 33.3% linear; (c) Relief-Dominant: 20% area, 50% relief, and 30% linear; and (d) Linear-Dominant: 20% area, 30% relief, and 50% linear. Additionally, non-parametric Spearman rank correlation analysis suggested exceptionally high consistency between the baseline AHP model and Scenario b (rs = 0.942, p < 0.001), Scenario c (rs = 0.915, p < 0.001), and Scenario d (rs = 0.928, p = 0.001) [64].
These findings indicate that sub-basin prioritization ranks remained insensitive to weight fluctuations, ensuring that high-priority sub-basins such as 8, 7, 22, 18, 23, 13, 3, and 9 reveal inherent geomorphic susceptibility rather than the weighting model [44,65,66].
According to the compound ranking index (CRI) results, the studied 24 sub-basins were ordered from 1 to 24 based on their relative vulnerability to erosion. For clearer interpretation and comparison, the ranked sub-basins were further classified into three priority groups:
(1)
High Priority (class 1, ranks between 1 and 8): higher soil erosion susceptibility.
(2)
Moderate Priority (class 2, ranks between 9 and 16): intermediate soil erosion susceptibility.
(3)
Low Priority (class 3, ranks between 17 and 24): lower soil erosion susceptibility.

In this study, the proposed classification is a relative model rather than absolute. The classification into three priority groups was developed to facilitate the presentation and interpretation of the ranking findings. Accordingly, sub-basins in different priority groups may still provide comparable levels of soil erosion vulnerability, while the CRI model presents a continuous ranking from the least to the most vulnerable basin. This combined model presents a transparent scale for prioritizing basins according to their relative soil erosion vulnerability and confirms the identification of zones requiring suitable soil conservation and sustainable management plans.
Table 1. Proposed morphometric parameters applied in this study.
Morphometric KeysFormula/DerivationRefs.
Basin total area (A in km2)Total area covered by basin boundary[67]
Basin perimeter (P in km)Outer boundary that covers the entire basin area[68]
Circularity ratio (Rc)=4πA/P2[68]
Elongation ratio (Re)=2/(basin length, L) × √A/π[69]
Compactness coefficient (Cc)=0.282 × P/√A[70]
Drainage density (Dd in km/km2)=Stream length/A[71]
Stream frequency (Fs)=Stream numbers/A[67]
Drainage texture (Dt)=Stream orders/P[68]
Infiltration number (Ifn)=Fs × Dd[72]
Length of overland flow (Lg)=1/2Dd[68]
Constant of channel maintenance (Ccm in km2/km)=1/Dd[73]
Form factor (Ff)=A/L2[68]
Shape index (Ish)=1/Fs[61]
Stream order number (Nso)=Nso1 + Nso2 + Nso3 + ………… + Nson[69]
Stream order length (Lso)=Lso1 + Lso2 + lso3 + …………… + Lson[68]
Bifurcation ratio (Rb)=Nso/Nso + 1[74]
Basin length (L in km)Length between outlet to outmost point on basin boundary[17]
Mean basin width (W in km)=A/L[75]
Basin main channel length (Lc in km)Length of longest main channel[69]
Fitness ratio (Rf)=Lc/P[76]
Maximum elevation (H)A maximum elevation value in a given basin[77]
Minimum elevation (h)A minimum elevation value in a given basin[77]
Basin relief (Z)=H − h[77]
Basin relief ratio (Rrb)=Z/L[78]
Basin relative relief ratio (Rrrb)=Z × 100/P[79]
Ruggedness number index (Irn)=Dd × Z∕1000[77]
Melton’s ruggedness number (Nmr)=Z/√A[69]

3.5. Geomorphic Indices

Three geomorphic indices were tested in this study to assess landscape evolution and the relative impact of tectonic activity on basin morphology. These geomorphic indices are widely used indicators for tectonic geomorphology; moreover, they should be discussed as effective keys of geomorphic signatures rather than direct indicators of tectonic offsets and movement [7,68].

3.5.1. Hypsometric Integral Index (HI)

The hypsometric integral index (HI) defines the spatial distribution of elevation distribution in a basin and indicates the proportion of the original landscapes preserved after soil erosional processes [35,80,81]. HI is defined as:
HI = Hmean − Hmin./Hmax. − Hmin.
where H m e a n , H m a x , and H m i n are the mean, maximum, and minimum elevations of a basin, respectively.
In this study, hypsometric curves (Hc) were produced for every sub-basin to confirm the HI values. Thus, high values of HI mainly indicate youthful basins with low soil erosion and higher tectonic uplift, while lower values of HI suggest mature to old landscapes characterized by long-term soil erosion [35,82,83].

3.5.2. Valley-Floor-Width-to-Valley-Height Ratio Index (Vf)

The Vf defines and assesses valley-floor morphology and the balance between landscape uplift and fluvial incision [81,84,85]. This geomorphic index is calculated as:
Vf = 2Vfw/(Eld − Esc) + (Erd − Esc)
where 2Vfw, Eld, Erd, and Esc are the valley-floor width, left and right valley divides, elevations of the left valley divides, and valley-floor height, respectively. In this study, several Vf values were calculated at selected cross-sections for each sub-basin of the study area (Figure 6).

3.5.3. Basin Shape Index (Bs)

The Bs is defined as a dimensionless geomorphic key that recognizes the geometry of a basin by testing its maximum length to its maximum width [86,87]. It is commonly applied in geomorphic studies to assess basin morphology and the relative impact of active tectonic controls on the development of a basin [88]. This index is calculated using the following equation:
Bs = Bi/Bw
where Bi and Bw describe the maximum basin length and width, respectively. Generally, higher values of this index indicate elongated landscapes mainly associated with high tectonic influence and youthful basins, while lower Bs values indicate more circular basins [86].

3.6. Relative Tectonic Activity (RTA) Model

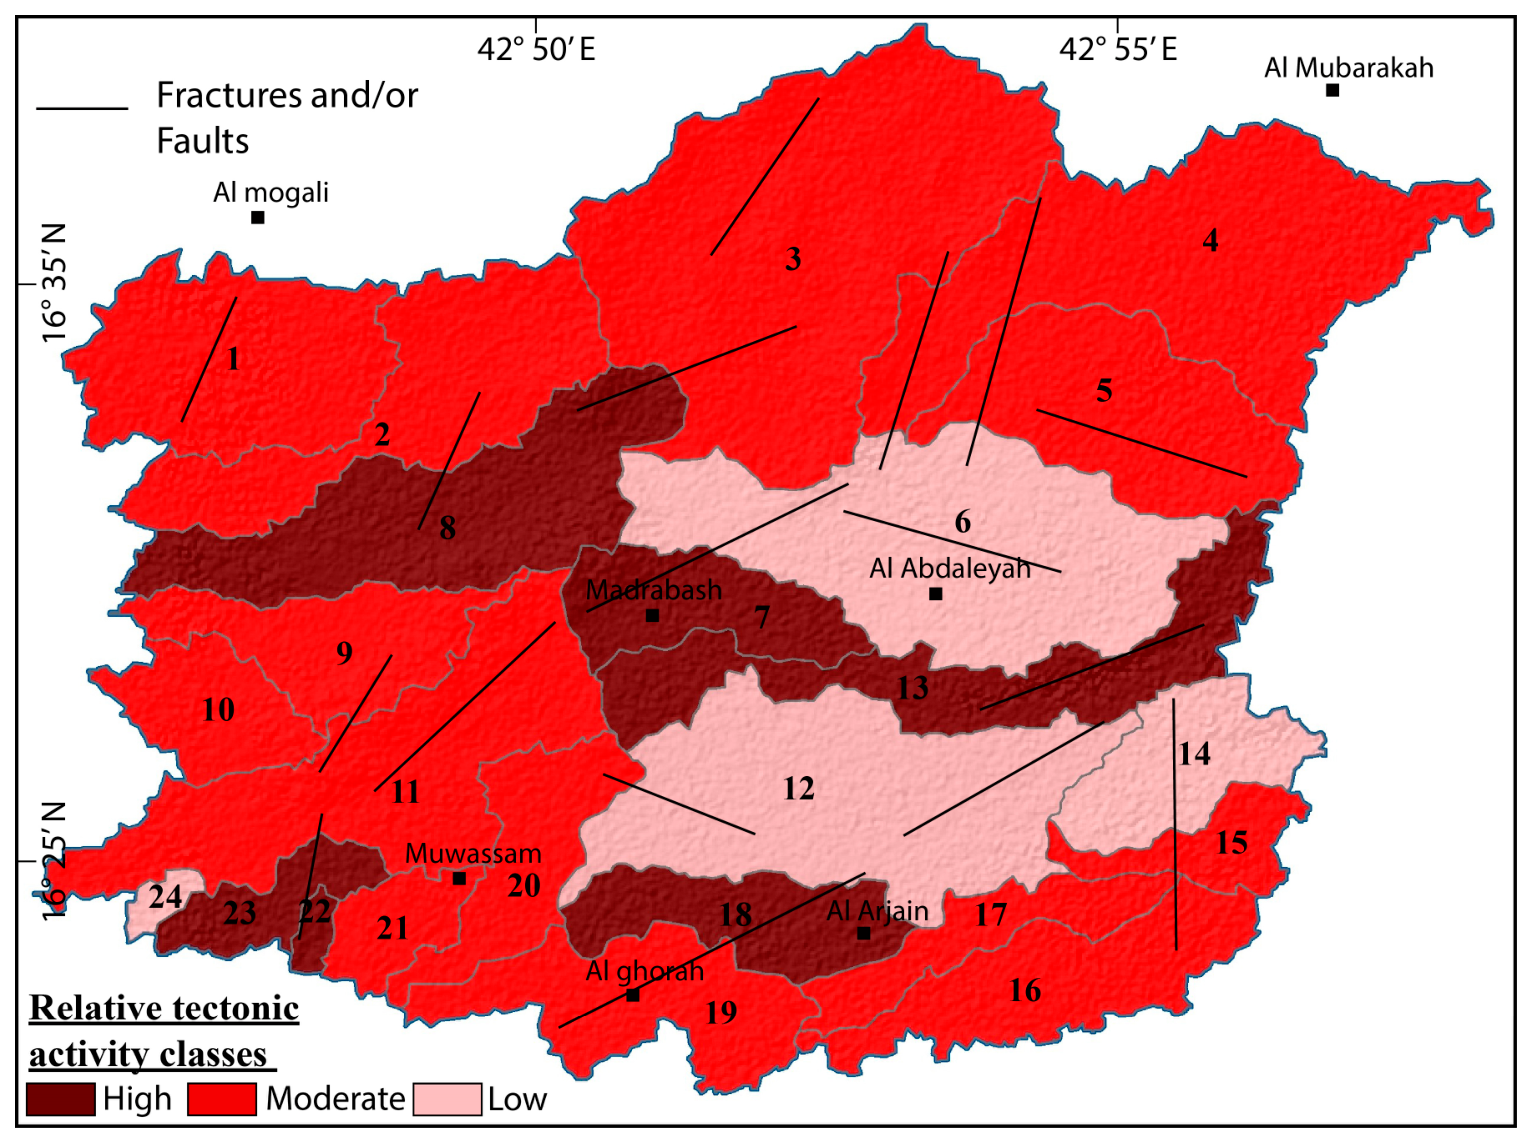
The relative tectonic activity (RTA) model was developed by combining the relative tectonic classes of the HI, Vf, and Bs geomorphic indices. Each geomorphic index was first assigned according to established geomorphic response describing relative classes of adjustment of the sub-basins. The individual classes were therefore integrated to assign an overall RTA value for each individual sub-basin. Accordingly, in this study, the RTA index was grouped into three distinct tectonic activity classes (low, moderate, and high).

3.7. RUSLE Model of Soil Erosion

In this study, the Revised Universal Soil Loss Equation (RUSLE) model, which represents a distinct quantitative assessment of erosion, acts as a validation approach for the morphometric prioritization results and was employed to investigate the distribution of annual soil loss over the study region. The RUSLE model is a widely used empirical models to predict average annual soil erosion and has been effectively used in catchment management studies under a wide range of geomorphological, hydrological, and climatic characteristic conditions [37,38,39].
The RUSLE model is expressed as:
A = R × K × Ls × C × P
where: A represents the annual soil loss rate (t ha−1 yr−1), R estimates rainfall erosivity, K represents soil erodibility, Ls represents the topographic altitudes defining slope characteristics, C provides the cover management factor, and, finally, P is the coefficient practice key.
The R factor was extracted from rainfall data using published empirical relationships for estimating rainfall erosivity in arid to semi-arid regions (European Soil Data Center (ESDAC); https://esdac.jrc.ec.europa.eu/content/global-rainfall-erosivity; accessed on 25 March 2026) [37]. The K factor was obtained from the soil database based on soil texture and associated physical characteristics (https://www.fao.org/soils-portal/data-hub/soil-maps-and-databases/en/; accessed on 12 March 2026) [37,85]. The Ls factor was extracted from the 12.5 m ALOS PALSAR DEM through both slope and flow-accumulation processes. The C factor was assigned from the Sentinel-obtained LULC patterns using recorded cover-management classes. The P factor was considered a constant value of (1) due to the absence of any recorded soil conservation in the study area.
In this study, all RUSLE factors were converted to raster layers with a unified projection and resolution before being combined to produce the final annual soil loss map. The soil erosion estimates were consequently compared with the resulting morphometric prioritization ranks and the RTA classes as a significant validator to assess the spatial consistency between the three applied models.

4. Results and Discussion

4.1. Morphometric Parameters

Analysis of morphometric parameters helps characterize the areal, linear, and relief attributes of different basins [39,89,90], which can support watershed management and planning decisions for the most critical mega-projects [91]. The results extracted from the 24 sub-basins in the southern part of Saudi Arabia suggest that the drainage pattern reaches 6th order streams created by 732, 157, 41, 15, and 4 for stream orders 1, 2, 3, 4, and 5, respectively (Table 2). The total stream length in the 24 sub-basins is 855.92 km with an average bifurcation ratio of 10.16 (Table 2). The bifurcation ratio generally describes the irregularities in the lithological pattern of the drainage basin [61]. Several workers such as [8,61] suggested that bifurcation ratio values between 3 and 5 reveal relatively natural drainage development in a homogenous lithology. Consequently, higher values of this index suggest a highly dissected drainage system in a basin, indicating greater chances of flash flood and soil erosion events [78]. In this study, the mean form factor parameter was recorded as 0.26, suggesting elongated basin shapes within the study area. The highest value of this parameter was recorded for sub-basin 10 as 0.42, indicating a circular shape [72]. Likewise, the elongation ratio parameter provided its lowest value for the same sub-basin, confirming the elongated characteristics of the sub-basins. Based on the classification suggested by the authors of Ref. [72], the elongation ratio values can classify basins into highly elongated (<0.5), elongated (0.5–0.7), semi-elongated (0.7–0.8), semi-circular (0.8–0.9), and circular basins (0.9–1.0). These basins can also be described by the circularity ratio, with high, moderate and low values reflecting young, mature, and old phases of a basin, respectively. The circularity ratio values of the studied sub-basins reveal that all sub-basins provide values less than 0.5 except sub-basins 22 and 23 (Table 3). This framework indicates that the majority of the study area exhibits a youthful phase and elongated characteristics. Additionally, the compactness coefficient parameter of the entire study area has an average value of 1.77. This morphometric parameter generally reflects basin shape rather than topographic slope. Several studies, including [8,17,92], classified the drainage textures into five distinct groups: very fine textures (>8), fine textures (6–8), medium textures (4–6), coarse textures (2–4), and very coarse textures (<2). The results of this parameter indicate that sub-basins 22 and 23 have a medium texture, while sub-basins 1, 6, 9, 11, 12, 15, and 24 provide coarse texture patterns. The remaining sub-basins are considered as having very coarse textures, with values less than 2. Accordingly, the same previous studies classified the stream frequency parameter into five groups. These classes are defined as very high stream frequencies (>20), high stream frequencies (15–20), moderate stream frequencies (10–15), low stream frequencies (5–10), and very low stream frequencies (<5). The results of this parameter indicate that all sub-basins exhibit very low stream frequencies, except sub-basin 23 (Fs = 5.47) (Table 2). Generally, high values of the drainage density parameter indicate a high hydrological response to rainfall while low values describe a slower hydrological response to rainfall events [93,94]. The average drainage density value calculated in this study is 3.23 km/km2. The author of Ref. [95] analyzed the constant of the channel maintenance parameter to study different landscapes. He used this parameter to classify the landforms into very poorly erodible landscapes (>0.5), poorly erodible landscapes (0.4–0.5), moderately erodible landscapes (0.2–0.4), and high-moderately erodible landscapes (<0.2). In this study, the constant of the channel maintenance parameter has an average value of 0.33 km2/km, indicating moderate erodibility across the entire study area. Consequently, the infiltration number parameter is a valuable key for assessing the surface runoff intensity of a given basin [78]. Generally, low infiltration values indicate low infiltration rate and rapid surface runoff. In this study, sub-basin 19, located in the southern part of the area, presents the highest value of this parameter (20.78) (Table 2). The values of the length of overland flow parameter in all 24 sub-basins are below 0.4 km, revealing short streams before runoff concentrates into proposed channels [96]. Morphometrically, this indicates a highly dissected landscape characterized by dense fracturing where surface runoff rapidly transitions from sheet wash to rapid, channelized flows [47]. This rapid transformation is helped by the high degree of fracturing within the underlying Cenozoic volcanics rocks, which accelerate valley incision and increase soil erosion susceptibility during severe rainfall events [96]. Interestingly, all sub-basins show values less than 0.4, indicating significant channel erosion over the entire study area. The relief ratio parameter mainly tests the overall slope steepness of a basin and describes the erosion rate intensity [8]. In the study area, the average value of the basin relief ratio parameter is 6.571. The study area provides an average value of the ruggedness number of 0.125, suggesting moderate risk of erosion events.

4.2. Soil Erosion Prioritization and Ranking Concept

All of the sub-basins delineated in this work are defined by 5th order drainage systems. In this study, sub-basins 3 and 22 are the largest and smallest, with areas of 30.33 km2 and 0.67 km2, respectively (Table 3). According to Ref. [61], several morphometric parameters, such as bifurcation ratio, drainage density, length of overland flow, stream frequency, and drainage texture, are directly related to soil erosion, whereas others, including elongation ratio, form factor, compactness coefficient, and circularity ratio, are inversely related to soil erosion. Accordingly, for morphometric parameters that have a positive link to soil erosion, higher morphometric parameter values exhibit higher priority ranks (lower ranking numbers). Similarly, the ruggedness number and relief ratio are also directly related to soil erosion susceptibility. Therefore, because sub-basin 10 (26.40) has the highest bifurcation ratio, it is considered more vulnerable to erosion than the other sub-basins. Accordingly, sub-basin 10 is assigned a moderate priority rank of 13. The remaining sub-basins were consequently ranked for all other parameters due to the characteristics of each morphometric parameter and impact on soil erosion susceptibility [8,97]. Based on this model, the 24 tributary sub-basins of the study area were prioritized as tabulated in Table 4.
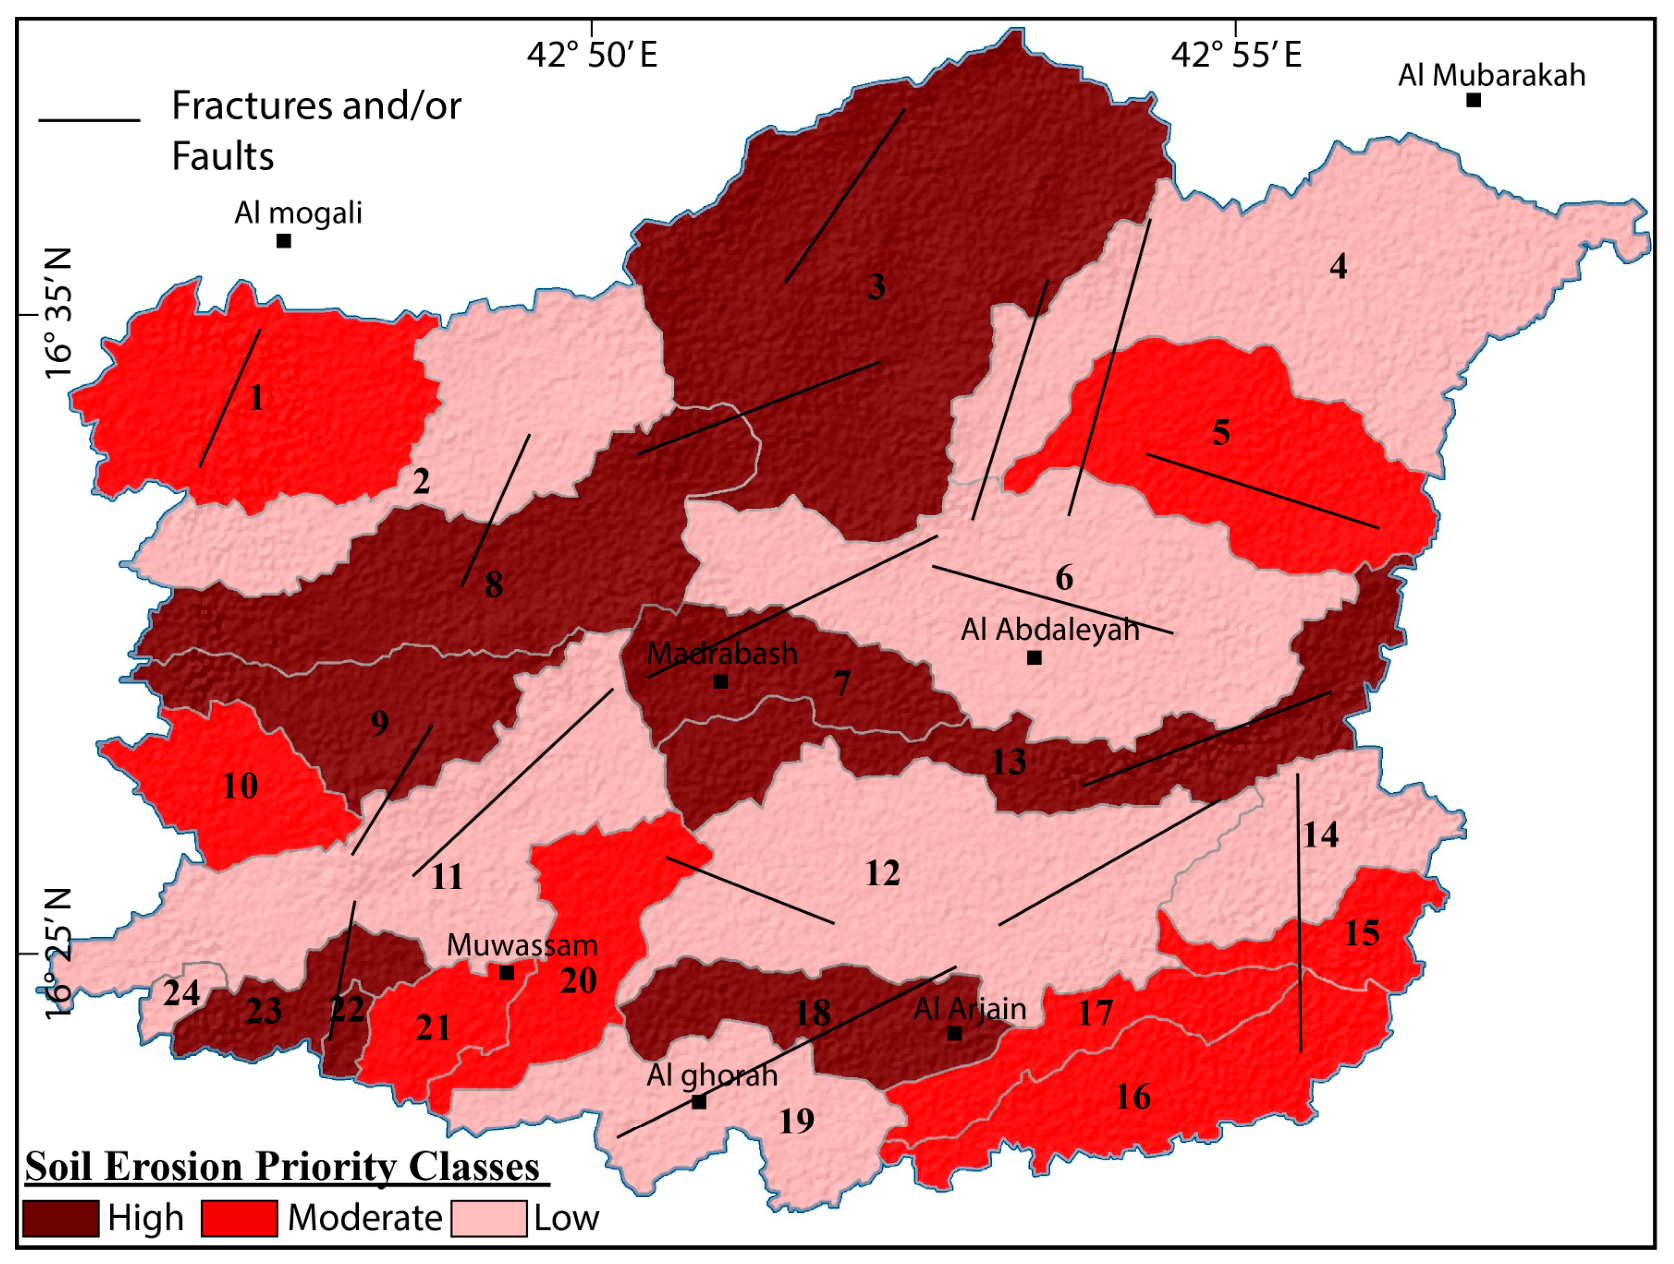
Sub-basin 10 is assigned rank 1 for the bifurcation ratio parameter, revealing the highest probability of erosion due to this particular parameter. Similar facts can be understood from the proposed rankings of the remaining morphometric parameters tabulated in Table 3. According to the compound ranking scale, the average priority ranking of the sub-basins ranges from sub-basin 8 to sub-basin 2 (Table 4). These findings indicate that sub-basin 10, despite being among the smallest sub-basins, is the most vulnerable to erosion processes and should thus be assigned the highest priority rank for erosion mitigation and management plans. On the other hand, sub-basin 2 is recognized as the least vulnerable to soil erosion and may be considered as having the lowest priority rank (Table 4). According to the extent of soil erosion in the study area, the construction of dams along the main stream, together with planting trees and other dense green cover on slopes, is highly recommended to minimize soil erosion processes. Consequently, the soil erosion prioritization model was further simplified by classifying the sub-basins into three major soil erosion groups; high soil priority class (ranks 1–8), moderate soil priority class (9–16), and low soil priority class (17–24) (Figure 7).
The conventional basin prioritization model requires precise procedures such as contour rectification from topographic data or extensive field observations, stream analysis for stream order patterns, precise estimation of stream lengths, total area, perimeter, and other effective morphometric keys.

4.3. Geomorphic Indices

4.3.1. Hypsometric Integral Index (HI)

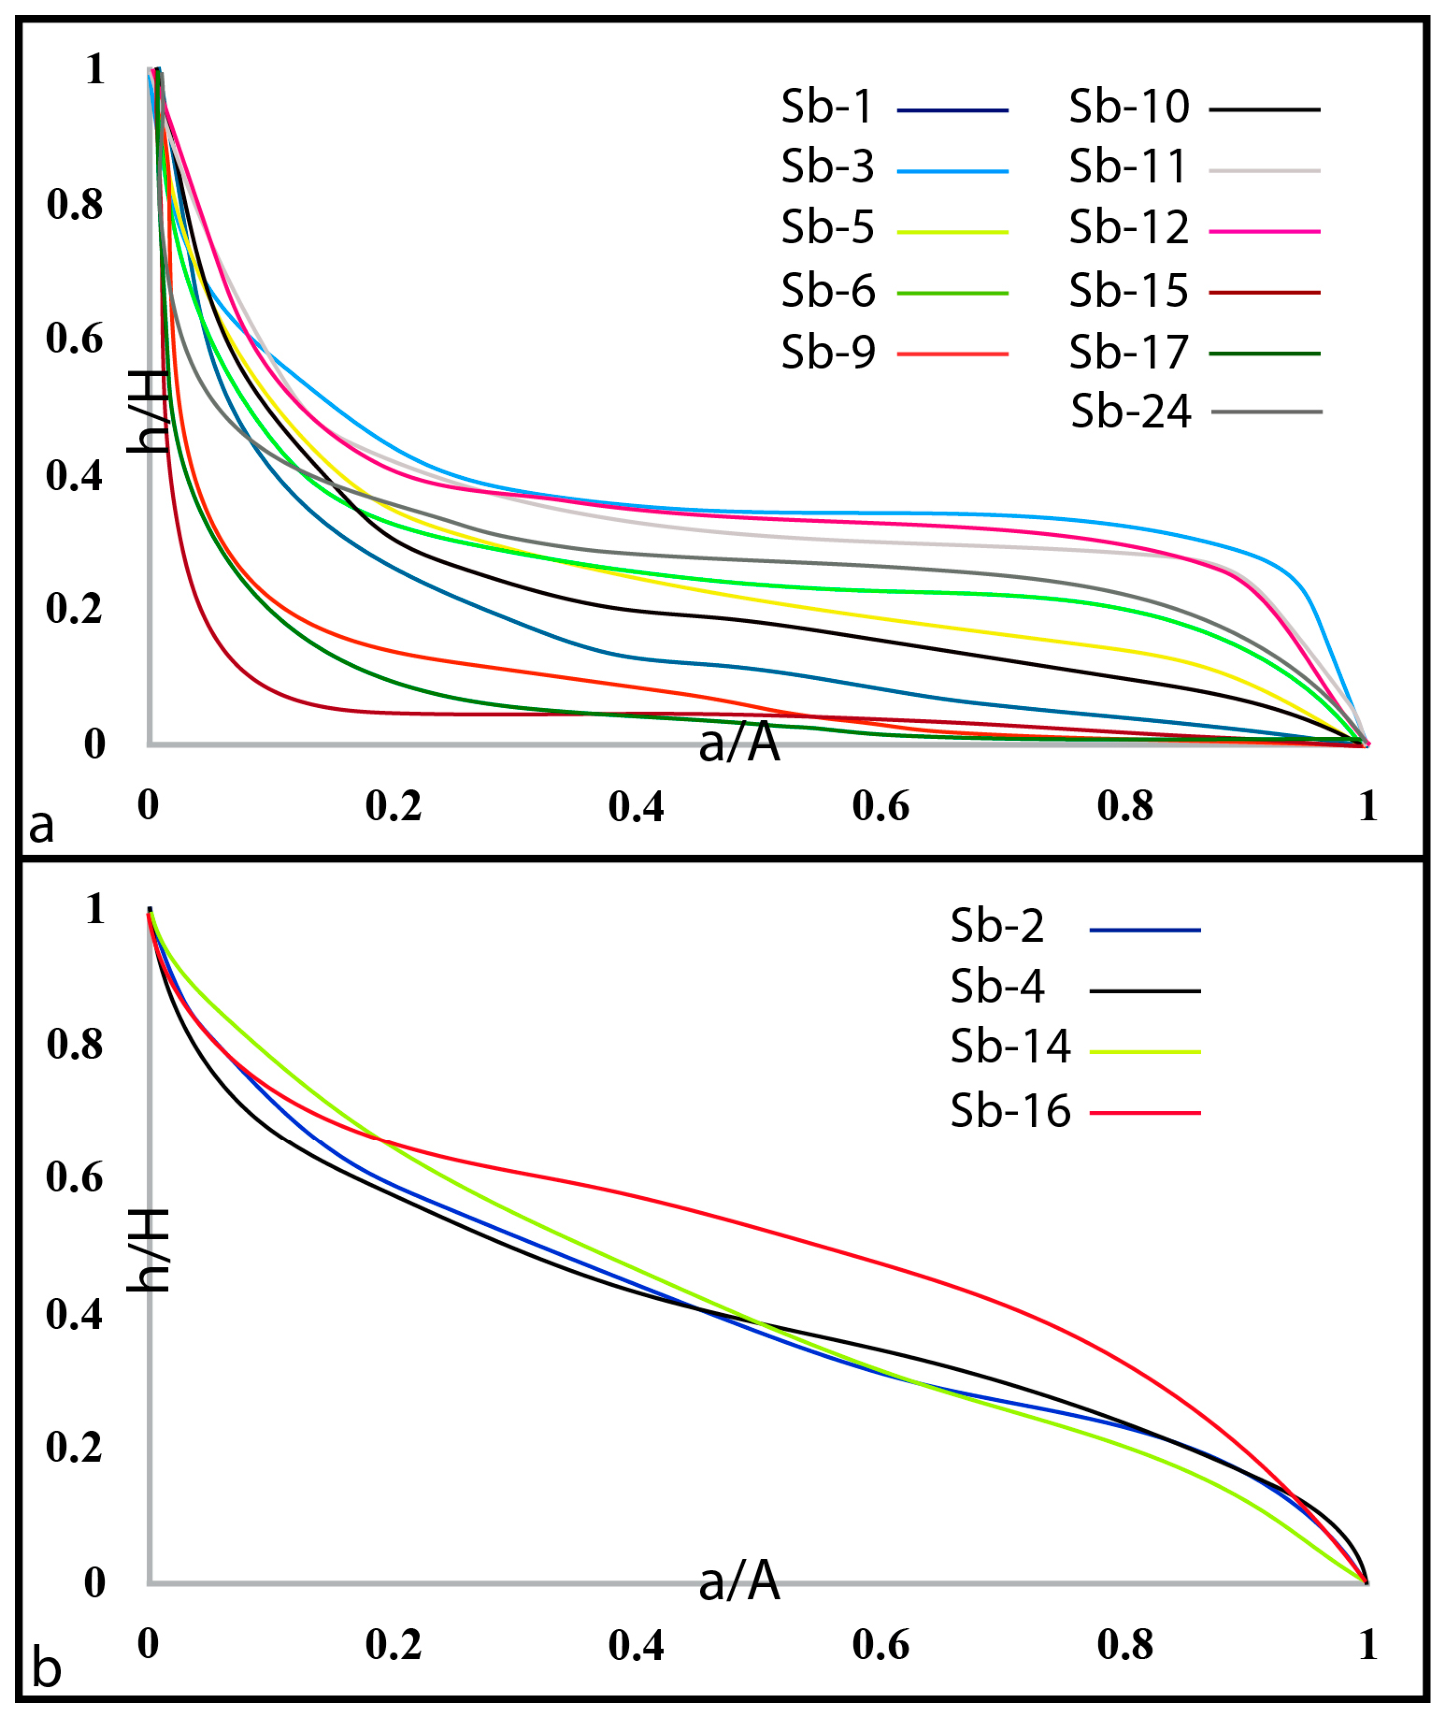
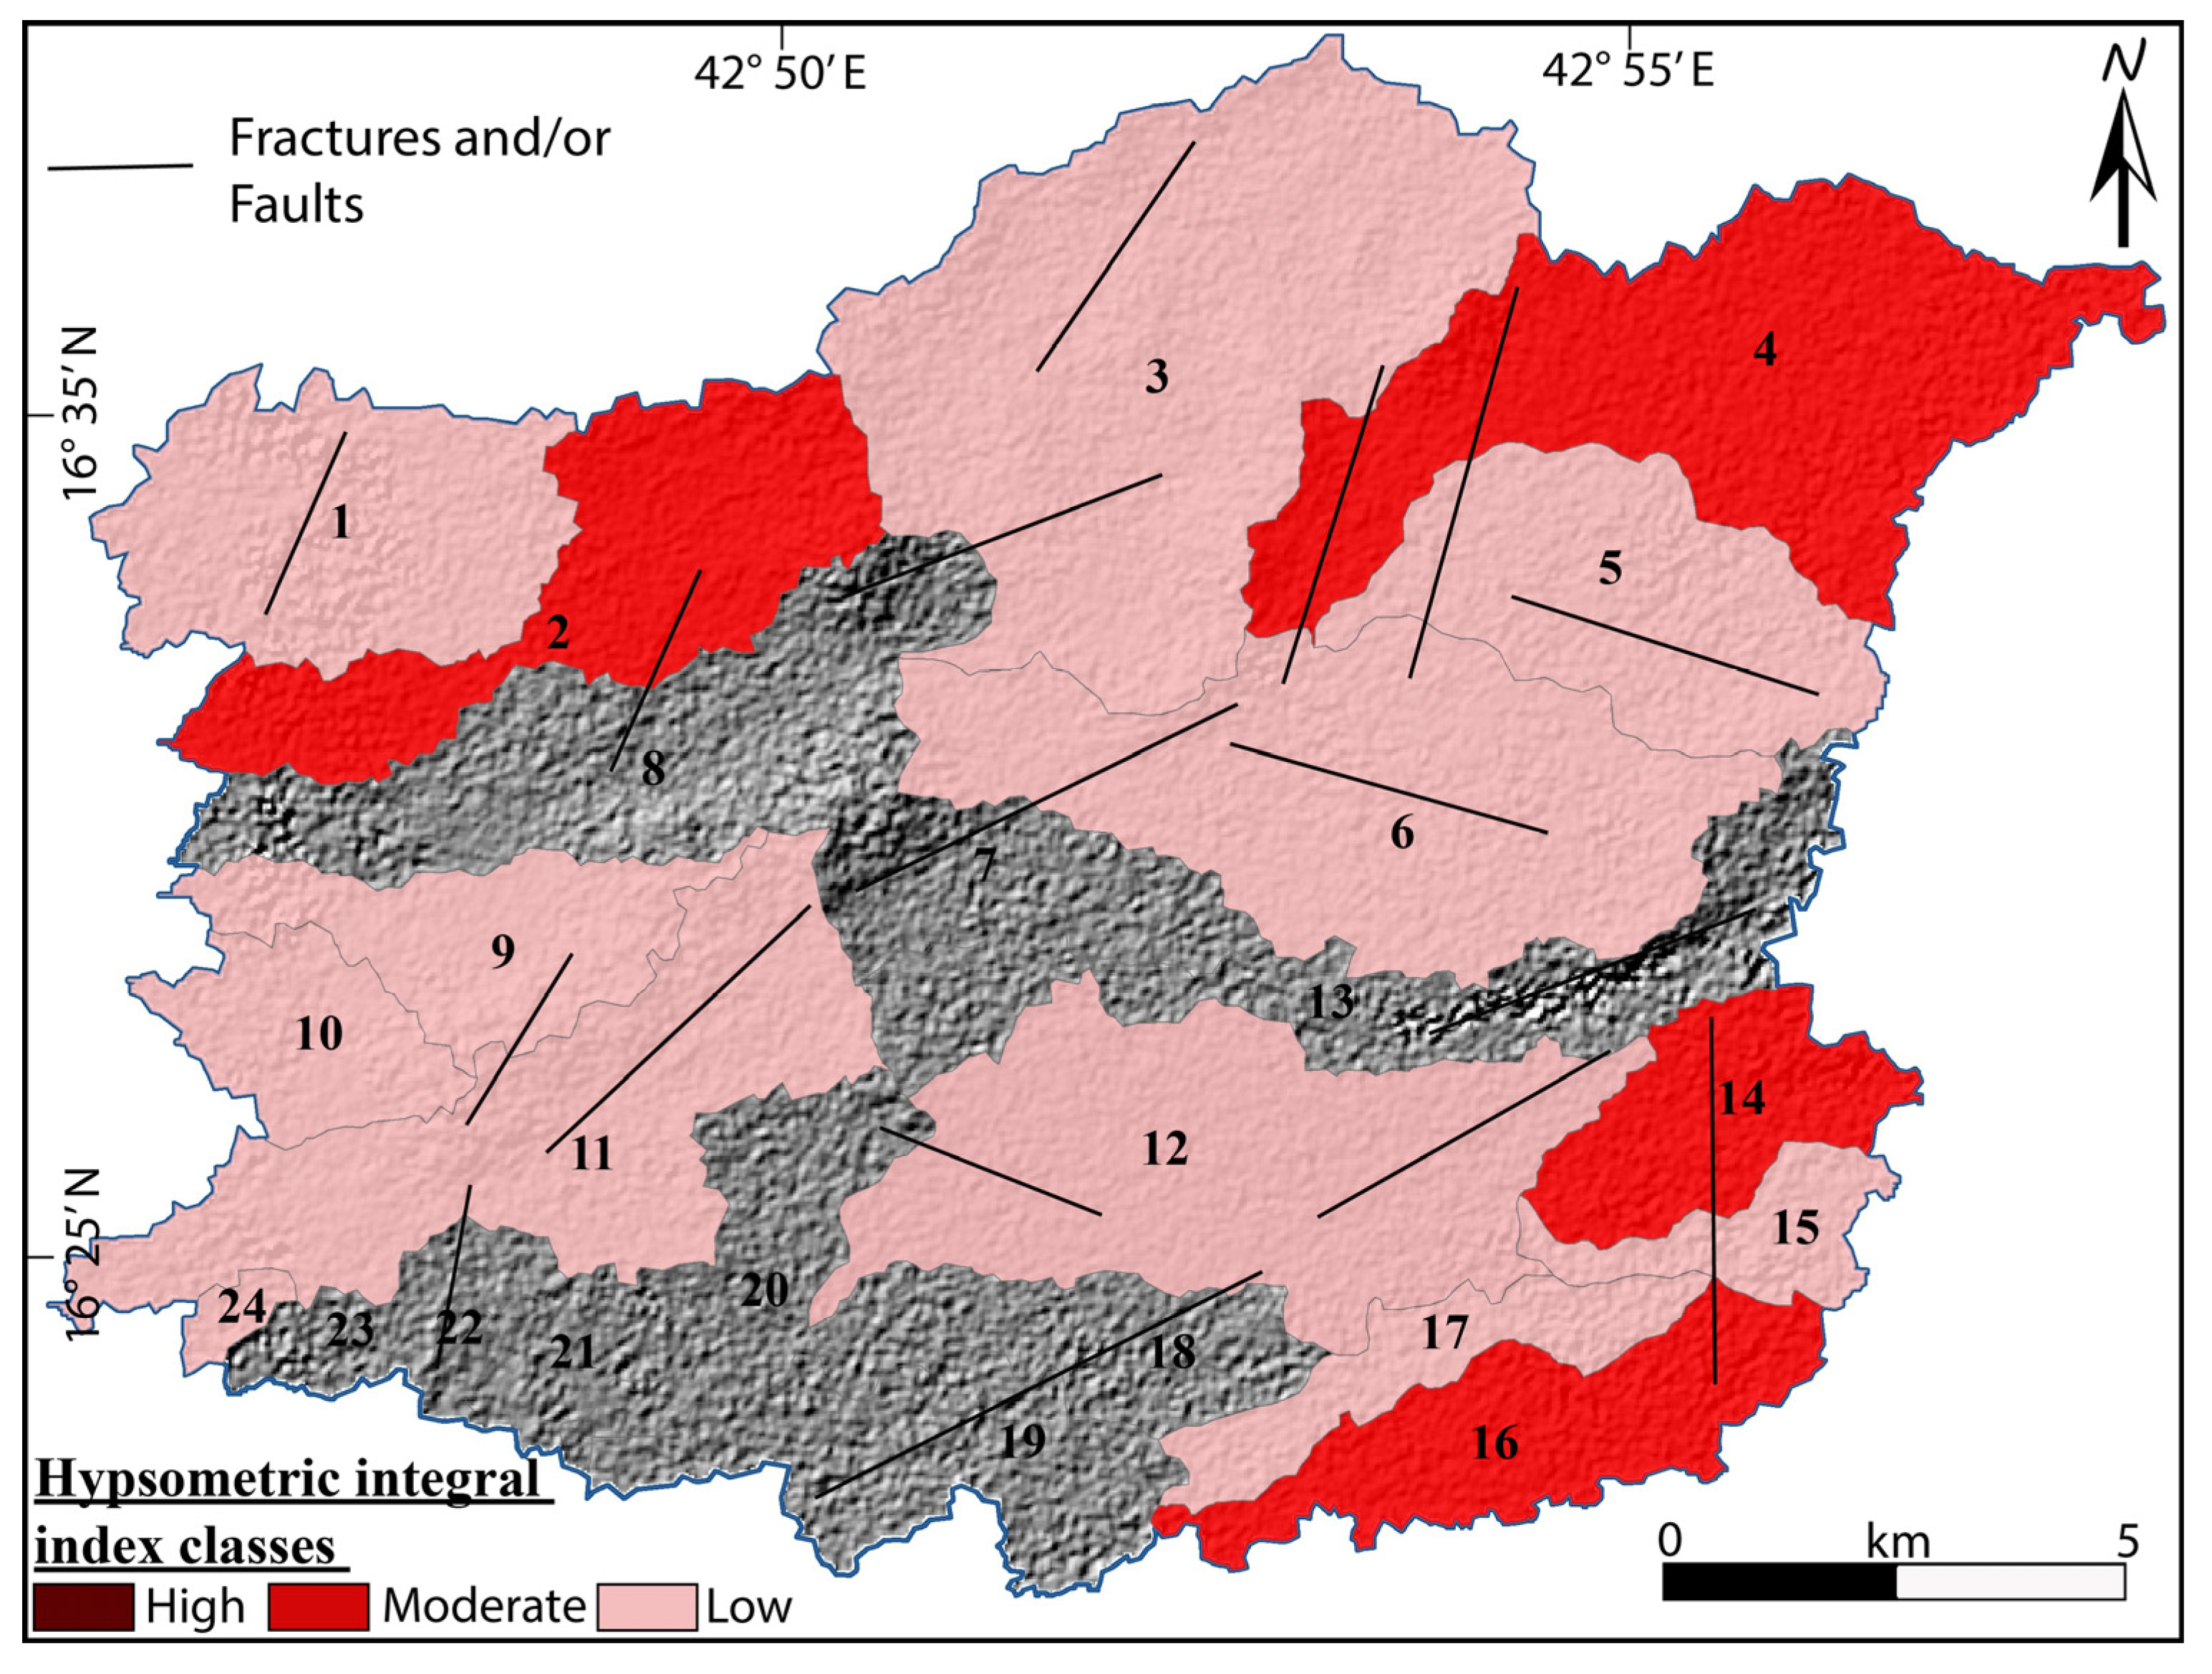
Geomorphic hypsometric analysis presents a quantitative key to assess the tectonic uplift history and landform maturity of a drainage basin [73,98]. The hypsometric integral index (HI), that describes the area below the hypsometric curve (Hc), is very valuable for studying the volume of rocks after long-term soil erosion [73]. In this study, the HI was assigned for each single sub-basin of the study area (Figure 8a,b). None of the examined sub-basins suggests a youthful landscape phase (HI > 0.60). The finding is consistent with observations from the coastal zone of the Red Sea rifting margin, where tectonic uplift is increased inland along the Arabian Escarpment [99]. Moreover, four sub-basins, including sub-basins 16, 2, 4, and 14 (HI = 0.48, 0.42, 0.40, 0.40), suggest a mature geomorphic phase providing S-shaped hypsometric curves (Figure 8b) with a moderate rank of the relative tectonic activity (Table 5). Analysis of the sub-basins having moderate HI conditions and S-shaped curves states that these specific landscapes are undergoing landscape reactivation [83]. This rejuvenation process is operated by block rotation and tectonic uplift along major tectonic lineaments parallel to the Red Sea rift, which continuously steepen the local channel and hillslope gradients and prevent the landscape from undergoing late geomorphic decline [48] (Figure 9).
On the other hand, several examined sub-basins, including 1, 5, 6, 10, 15, 24 (HI = 0.15, 0.26, 0.29, 0.19, 0.04, and 0.18), suggest low relative tectonic activity and exhibit hypsometric curves with concave shapes (Figure 6 and Figure 8a). These low HI values indicate highly eroded landscapes or tectonically subsiding depression bodies where crustal uplift is neglected or minimal, giving a major chance for soil erosion to dominate over vertical movement [83,100]. Hypsometric analysis serves as a distinct indicative key in this study, successfully assigning the subtle signals of dynamic tectonic faulting and geomorphic reactivation of tectonic blocks from the point of view of low-relief coastal zone deposits [7,101] (Figure 9).

4.3.2. Valley-Floor-Width-to-Valley-Height Ratio Index (Vf)

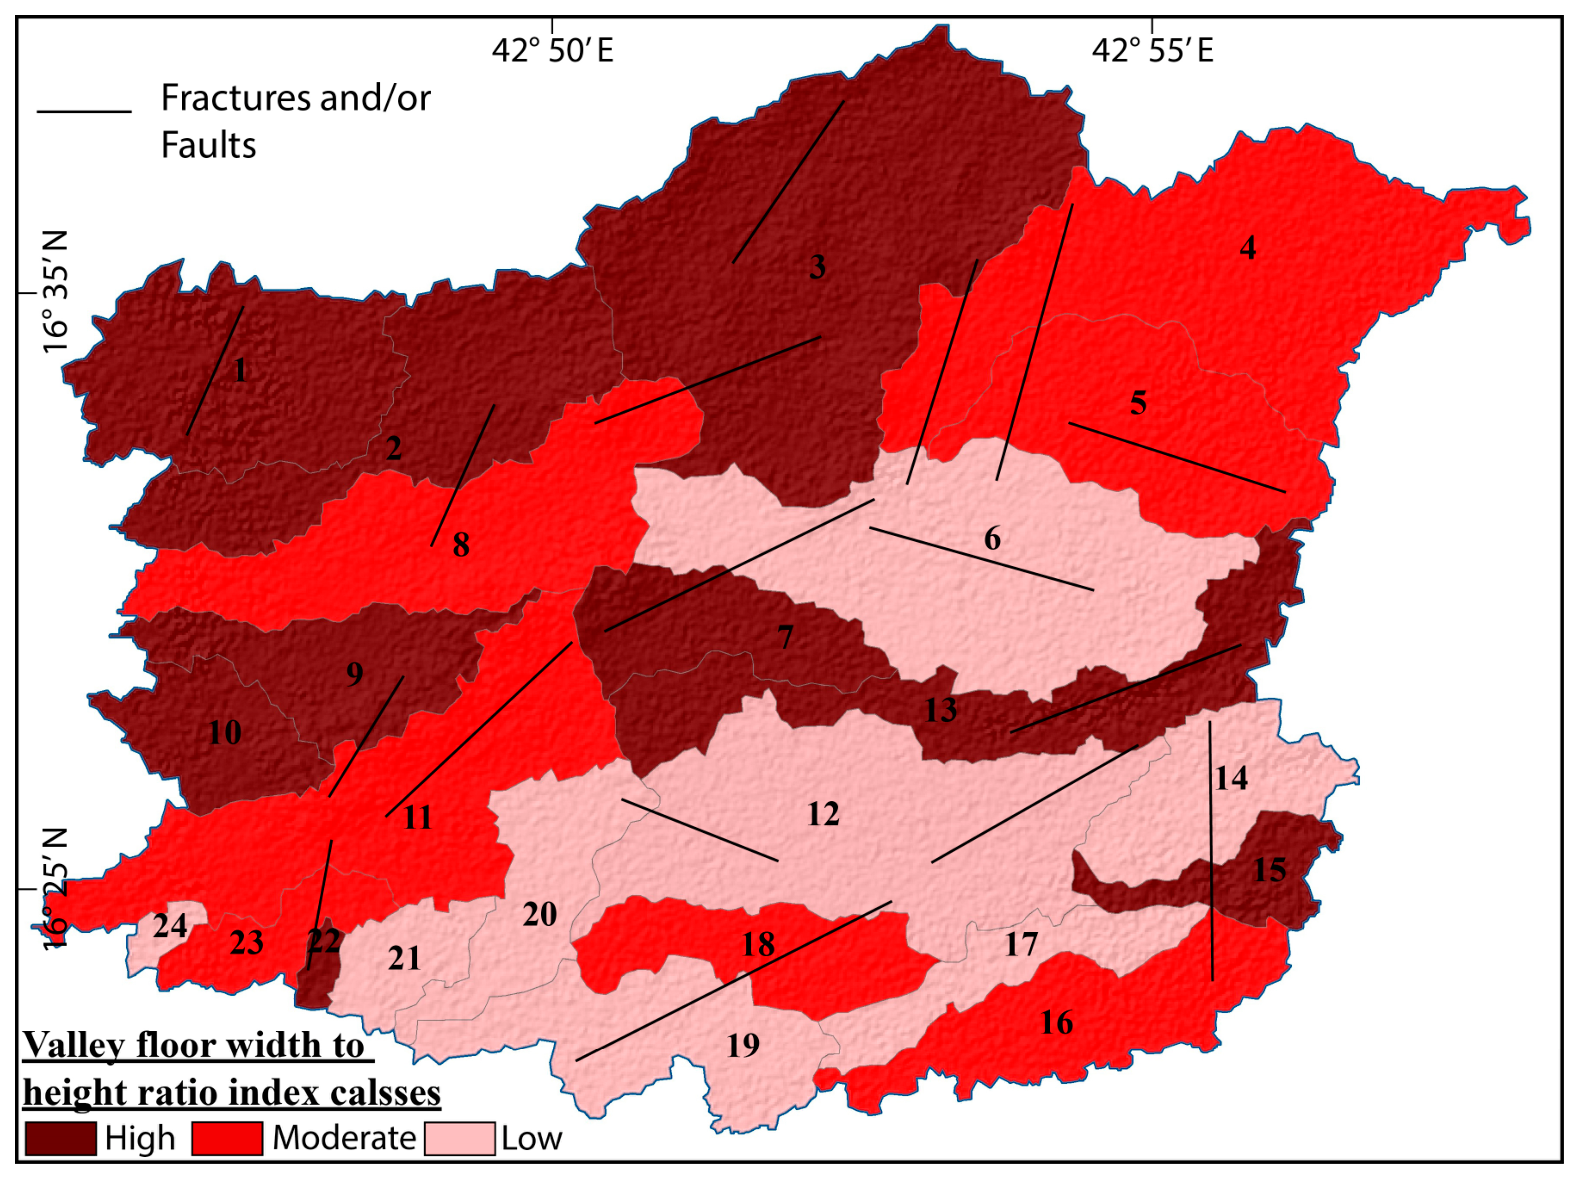
The Vf geomorphic index distinguishes between wide-floor valleys (U-shaped) and steep, narrow valleys (V-shaped) [7]. Wide valleys generally present high Vf values (Vf > 1, class 3) whereas steep and narrow valleys provide low values (Vf < 0.5, class 1). Because tectonic uplift is generally related to incision rates, this index acts as an indicator of relative tectonic activity. Consequently, low values of this index indicate higher rates of incision and uplift.
While this index is not a direct indicator of uplift, incision and uplift processes are considered balanced, thus low values (steep, V-shaped) mainly reveal tectonic uplift signals, whereas high values (wide, U-shaped) may indicate greater lateral erosion or tectonic stability [81]. In this study, values of the Vf index range between 0.23 and 1.31 (Table 5). Because these results are impacted by basin area, discharge rates, and lithology, they are most precisely compared to similar environmental conditions. In this study, dynamic incision seems to be prevalent in the study area due to the distribution of sub-basins belonging to classes 1 and 2 (Figure 10).

4.3.3. Basin Shape Index (Vf)

Significant geomorphic studies reveal that high values of the Bs index generally indicate elongated landscapes, which may suggest higher active tectonic signals [7,81]. Accordingly, low values of this index suggest more circular landscapes, mainly indicating lower active tectonic signals. Highly uplifted fronts tend to shape steep, elongated basins [84].
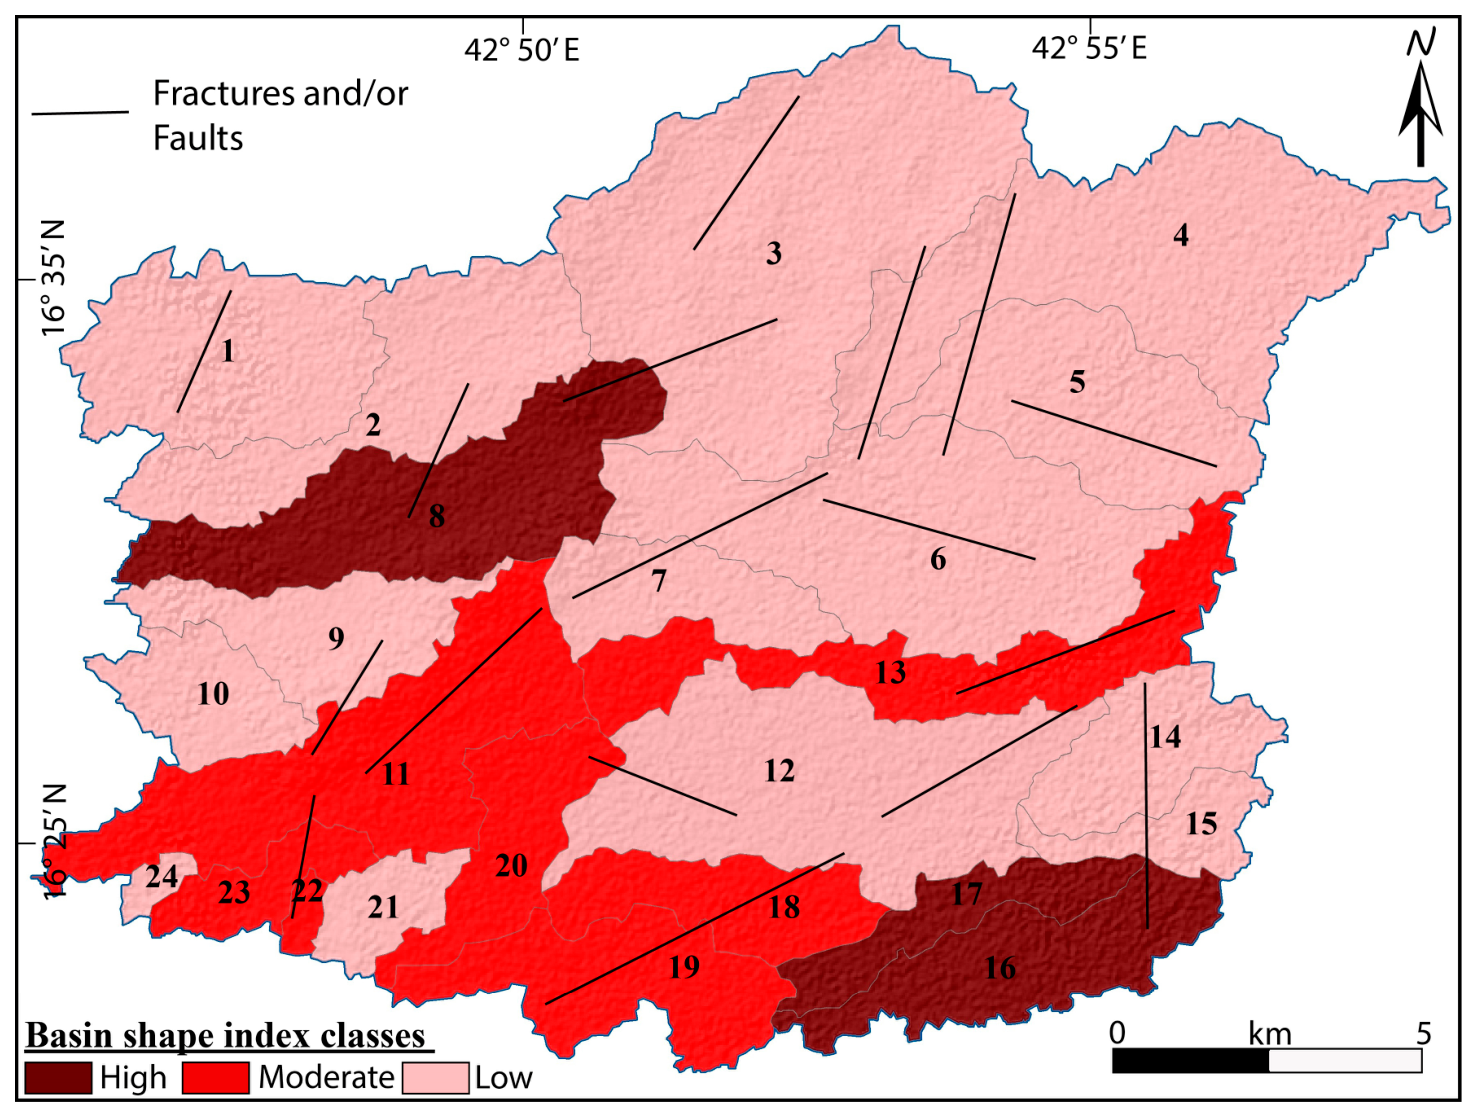
In the present study, this index is tested among the 24 sub-basins. The findings are arranged in Table 5, with values between 1.68 (sub-basin 1) and 5.22 (sub-basin 17). The resulting map indicates that class 1 (highest values of this index) is concentrated in the southern and western parts of the study area (particularly sub-basins 8, 16, and 17), indicating that these areas show the most significant active tectonic impact (Figure 11).

4.4. Relative Tectonic Activity (RTA) Model

The present study assesses and models the relative tectonic activity of 24 sub-basins by combining the hypsometric integral, valley-floor-width-to-height ratio, and basin shape indices. These effective indices act as geomorphically powerful keys where, in an equilibrium phase, particular signals reflect tectonic impact: low values of the Vf index indicate steep, V-shaped valleys produced by high rates of incision; high values of the Bs index exhibit elongated sub-basins characteristic of dynamic uplift signals; and values of HI present insight into the phase of geomorphic development. By grouping these indices into three distinct classes, where class 1 suggests relatively high tectonic signals and class 3 reveals low tectonic activity, the study extends beyond site-particular mountain front analysis to an overall regional-scale evaluation (Table 5; Figure 12). The integration of these findings allows for a spatially distributed map of active tectonic signals, emphasizing areas where particular geomorphic features indicate spatial variations in relative uplift and tectonic impact over the entire study area.

4.5. RUSLE Model of Soil Erosion

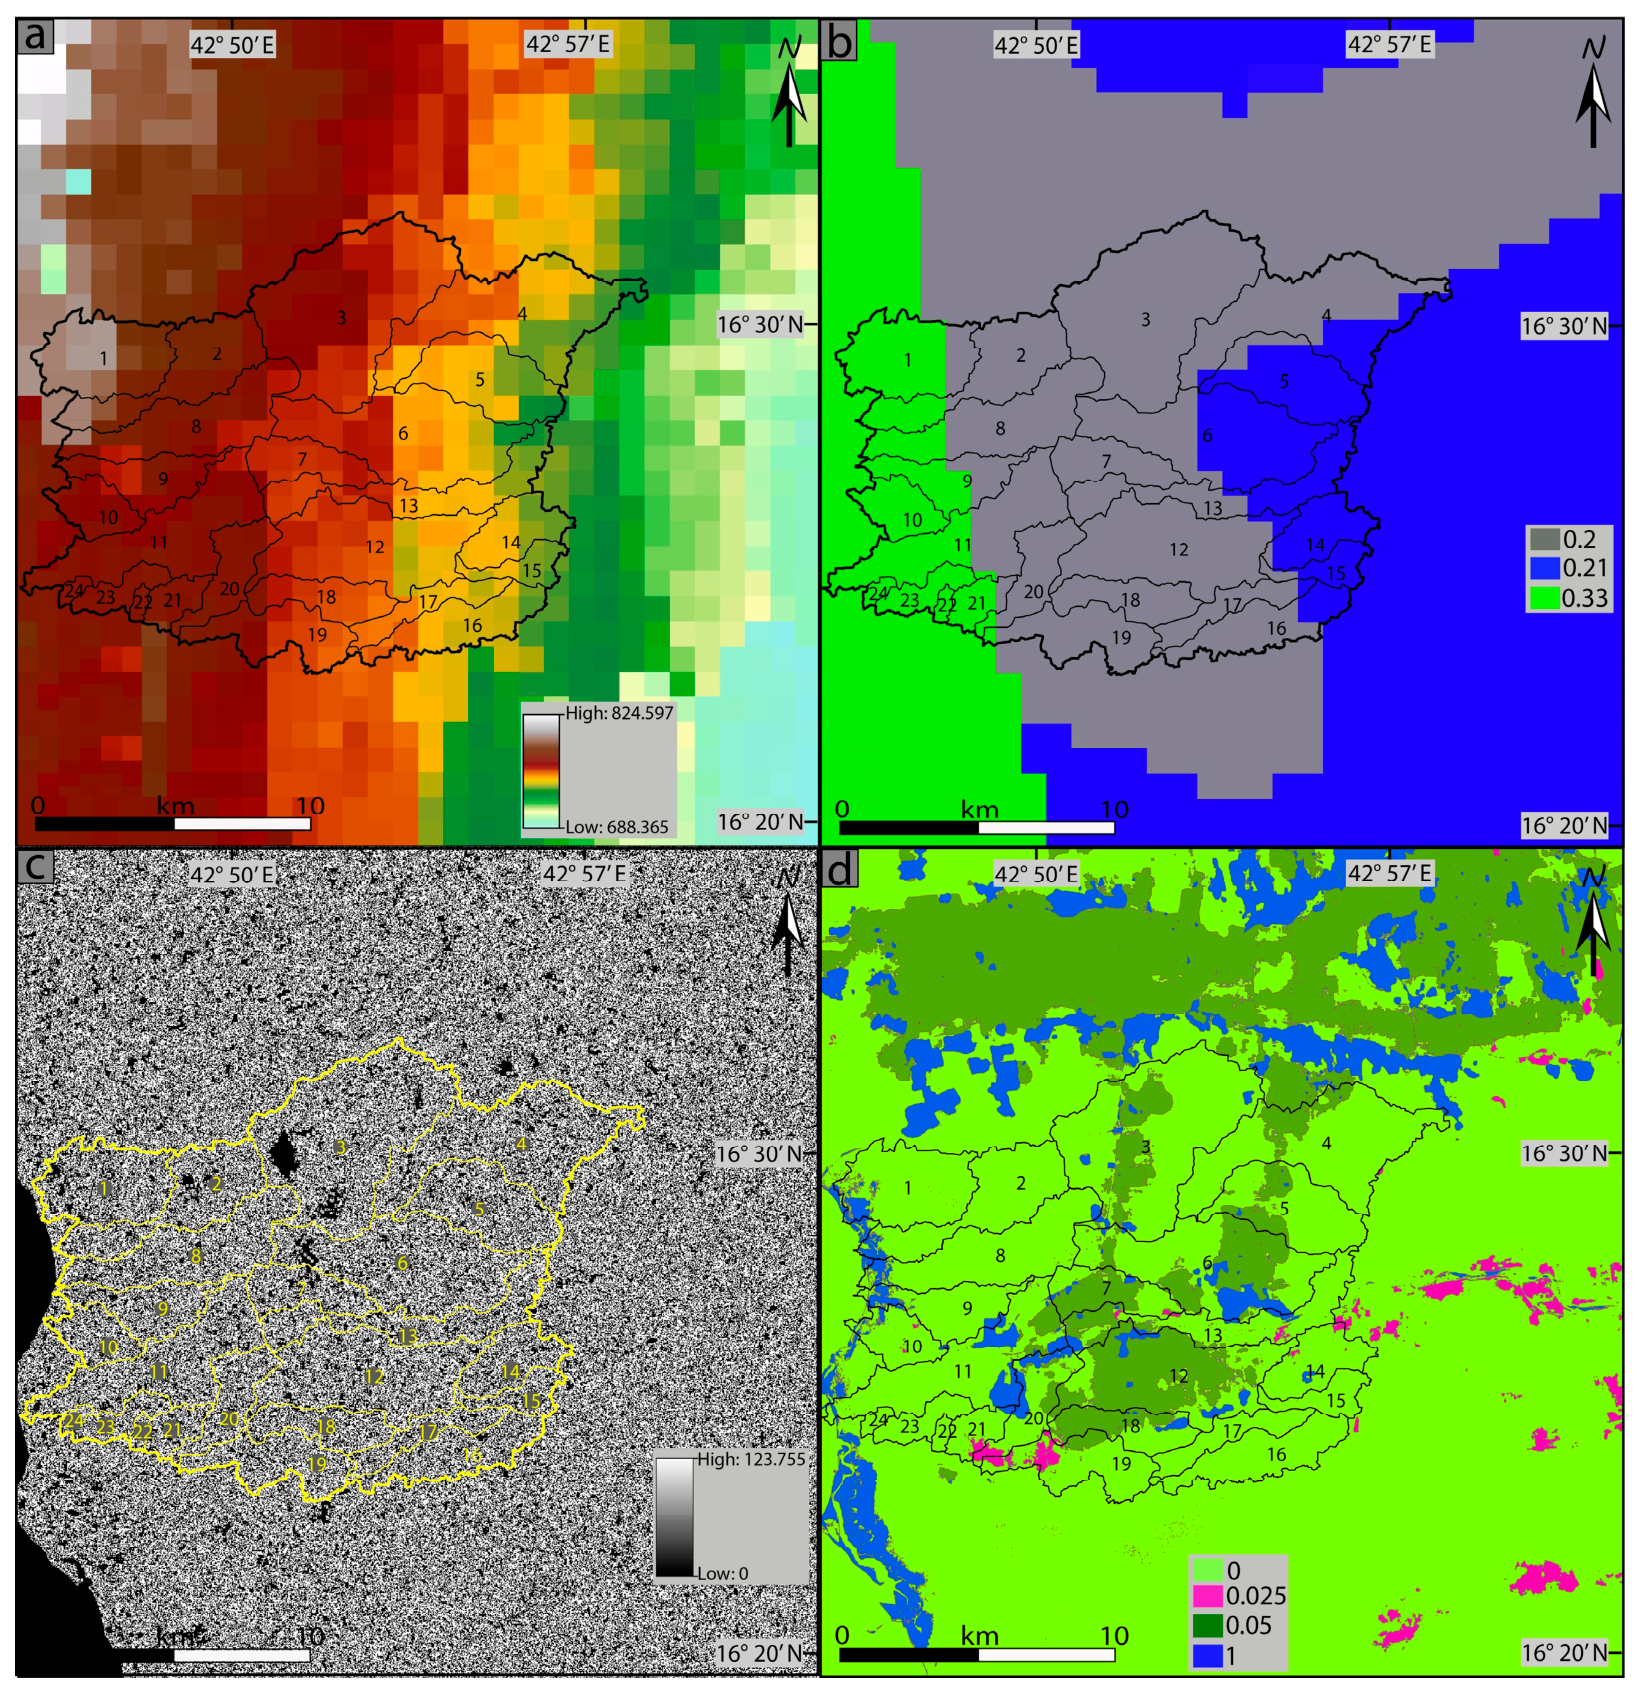
The RUSLE model was implemented using GIS software by combining five indicative factors including rainfall erosivity, soil erodibility, topographic factor, cover-management factor, and support practice to test and model the distribution of annual soil loss over the study area (Figure 13) [37,102]. The resulting soil erosion framework reflects the integrated impact of climatic, soil characteristics, relief, and land cover. The generated rainfall erosivity (R) map indicates obvious spatial variability over the study area, with high values distributed across the elevated mountainous areas and lower values concentrating in the low-terrain zones (Figure 13a). This spatial distribution indicates the variation in rainfall severity linked to elevation, reflecting that mountainous zones present higher rainfall intensity and accordingly higher erosion potential [38]. The soil erodibility factor reflects moderate variation governed mainly by physical properties and soil texture (Figure 13b). Higher values of soil erodibility are linked to fine-grained deposits and unconsolidated alluvial sediments, whereas lower k values reflect coarse-textured and resistant soils [102]. The LS factor suggests the dominant impact of terrain on soil erosion events (Figure 13c). High Ls values occurred along deeply incised basins, steep slopes, and drainage streams where both flow accumulation and slope gradient are relatively high, while low Ls values represent the low-slope alluvial zones. These findings confirm that relief/topography is the main key controlling soil erosion severity in the study sub-basins because increased slope steepness and length increase surface runoff velocity and sediment transport potentiality. The cropping management factor indicates the preventive role of plant cover (Figure 13d). Accordingly, areas covered by vegetation cover provide low values of the cropping management factor due to their high ability to trap rainfall and minimize runoff velocity [37]. On the other hand, sparsely vegetated zones exhibit high values of this factor, reflecting higher susceptibility to soil erosion.
Additionally, comparing this effective RUSLE model of the southern Jizan coastal sub-basins with published research over the Arabian Peninsula and international arid to semi-arid regions indicates significant geomorphic consistency and emphasizes regional physical keys [103]. The evaluated soil erosion rates (between <5–48 ha−1/yr−1) in coastal zones and steep upper lands, respectively, closely correlate with results from close Red Sea coastal sub-basins, including Wadi El Hayat in Jizan Province (36.1–40 t ha−1/yr), Wadi Yalamlam (40 t ha−1/yr), and Wadi Allith (0.3–15 t ha−1/yr) [103,104]. However, in this study, the mean soil loss value index is lower than that recorded for the major inland basin in the Wadi Baysh catchment (57.91 t ha−1/yr) [54,105]. This variation is directly interpreted by relief differences: Wadi Baysh drains high terrains defined by steep slopes (Ls > 15) and high rainfall intensity, whereas this study area provides low-altitude coastal transition zones where subdued topographic factors (Ls < 2.5) support overland flow velocities regardless of severe precipitation rates. Globally, the soil erodibility patterns correlate with active rift conditions in Morocco (57.91 t ha−1/yr) and Ethiopia, indicating that, in semi-arid rift margins, sparse vegetation cover, reflected by relatively high C factor values, and high fracture density of the bedrock combine to accelerate soil erosion during episodic storms [103,104].
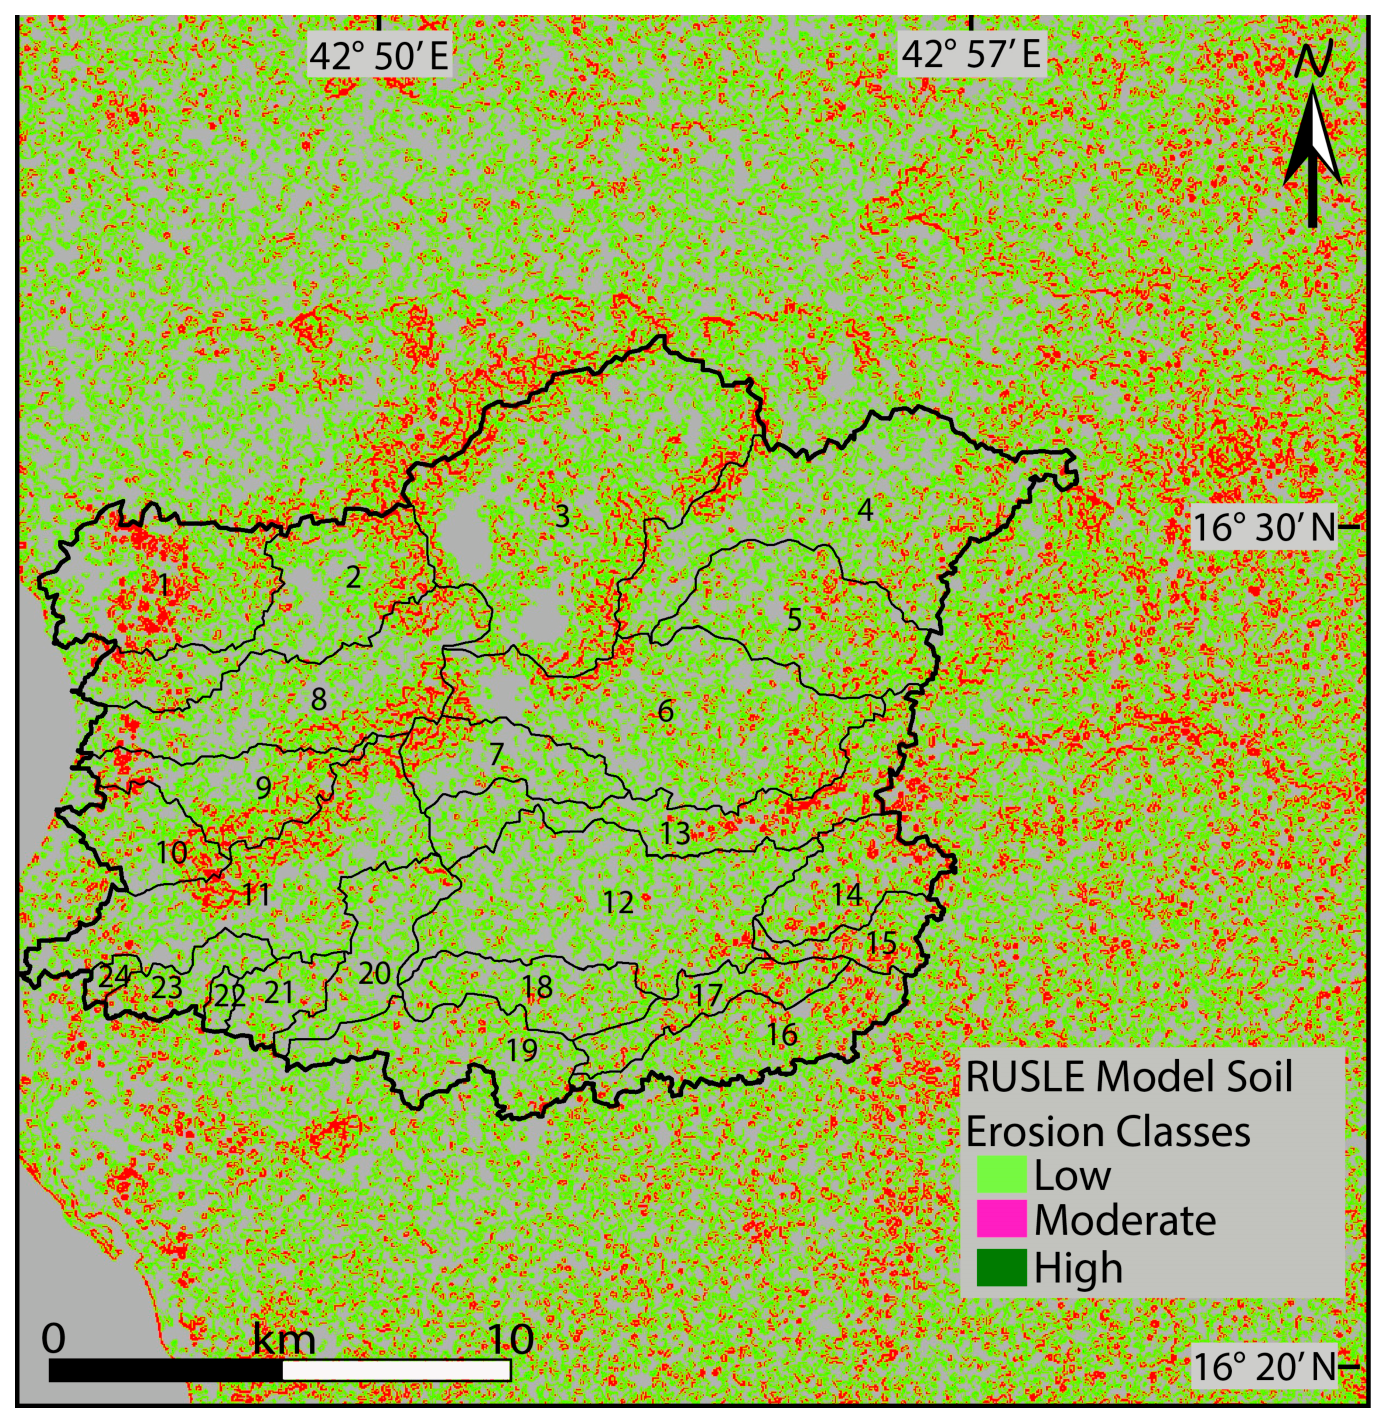
The final RUSLE model map indicates that low soil loss zones cover most of the study area, whereas moderate-to-high soil erosion rates are restricted to mountainous zones, especially along drainage systems and steep slopes (Figure 14). This soil erosion framework correlated with areas reflecting high values of Ls, emphasizing the main role of relief in governing soil loss. The spatial consistency of high soil erosion with steep topography, poor vegetation, and erodible soils indicates that erosion results from the integrated relationship between topography, land cover/land cover, and soil properties rather than being controlled by any individual factor. Therefore, the final findings reveal that the study sub-basins are dominated by low-moderate annual soil erosion rates, while only a few mountainous zones require higher-priority conservation plans.

4.6. Cross-Model Spatial Agreement and Statistical Correlation

It is critical to observe that the relationship between the morphometric, RTA, and RUSLE models acts as a spatial cross-validation of independent approaches, rather than direct field-based physical validation [44]. This strong spatial-related model reveals coherency and geomorphic consistency of the study sub-basins, but this particular model cannot provide its maximum effectiveness without field measurements and observations [44,65]. To quantitatively validate the particular spatial correlation between the applied models of this study, Spearman’s rank correlation coefficient (rs), a non-parametric measure, was assigned and applied for the 24 sub-basins [44]. In this study, the correlation between the resulting morphometric compound rank (CR) and the RUSLE model of the mean annual soil loss is highly direct and significant (rs = 0.785, p < 0.01), indicating that the morphometric analysis model acts as an effective and indicative spatial predictor model of erosion hazard [106]. In addition to this indicative model, the relative tectonic model considerably correlates with both morphometric analysis ranks (rs = 0.612, p < 0.05) and the erosion rate model (rs = 0.589, p < 0.05), quantitatively indicating that valley incision and structural lineaments produced by the Red Sea rifting show a statistically significant spatial link with localized soil erosion rates [44,48]. The correlation model is illustrated in Table 6.

4.7. Multi-Model Framework Uncertainties and Limitations

To quantify the uncertainty of the empirical RUSLE model in this study, a formal error propagation analysis was confirmed due to a first-order series expansion of the multiplicative framework (A = R × K × LS × C × P) [43,103]. The overall relative variance was estimated by integrating the relative standard deviations of single result layers. Uncertainties associated with input layers were produced from sensor characterizations and recorded regional error frameworks: coastal precipitation gauge interpolation variance; FAO soil unit generalizations; derived from the RMS vertical error of 1.71 m of the ALOS PALSAR DEM over steep relief; and seasonal Sentinel-2 NDVI [107]. The integrated mathematical development indicates an overall relative uncertainty of ±23.42% for the mean soil loss rates per year. Additionally, (1) despite being superior to 30 m spatial resolution SRTM datasets, particular vertical errors can raise through flow accumulation and depression-filling algorithms, providing minor anomalies in slope calculations and Ls factor maps; (2) the empirical presumptions of the RUSLE soil loss model assume land-cover and soil conditions remain constant annually. The support practice (P) factor must be adjusted to a constant value of 1.0 due to Jizan’s lack of active soil conservation activities, which may ignore specific agricultural regulations; (3) the uncertainty of the rainfall framework is still considerable because of the limited availability of high-density rainfall-gauge systems in the southern region of Saudi Arabia. Relying on global rainfall framework data such as ESDAC to calculate the R key may underestimate localized rainfall intensities and storm-event variability, possibly neglecting the erosive power of coastal storm events [43]; and, finally, (4) the priority ranking model must be presented as relative hazard zones despite being absolute physical scales since the model cannot be physically standardized or calibrated in the absence of surface runoff and observed sediment yield data [44,108].

4.8. Sustainable Development Goals

The quantitative results of both the morphometric analysis and relative tectonic activity models can be linked to practical objectives under SDG 9 and SDG 13 (Industry, Innovation, and Infrastructure and Climate Action, respectively) [44,109]. Particularly, for the sub-basins with high priority (sub-basins 8, 13, 22, and 23), which reflect very high relief ratios and class 1 of the relative tectonic activity model, civil engineering strategies must include multi-barrel culverts and structurally reinforced retaining walls in order to meet SDG target 9.1 (flexible infrastructure). To reduce the high sediment migration rates observed in sub-basin 3, sub-basin 7, and sub-basin 9 (Dd > 3.5 km/km2) the initiation of the construction of stepped dams is highly recommended [55]. Furthermore, to reach SDG aim 13.1 (climate resilience model), the localized biological reconquest of gradients using local halophytic plants is proposed for sub-basin 8 and sub-basin 18, presenting a measurable effective mechanism to reduce soil loss during intense episodic rainfall storms.

5. Conclusions

The present study developed a combined geospatial model integrating morphometric analysis, geomorphic interpretations, the relative tectonic activity (RTA), and the Revised Universal Soil Loss Equation model to test and assess soil erosion vulnerability and basin characteristics in the southern Red Sea coastal zone of Jizan Province in Saudi Arabia. The integration of these complementary models revealed a comprehensive and effective model of the geomorphic and tectonic signals controlling soil erosion in this coastal zone. Morphometric analysis of the 24 delineated sub-basins defined important spatial variations in basin geometry, topography, and surface runoff characteristics. The weighted prioritization framework defined sub-basins 8, 7, 22, 18, 23, 13, 3, and 9 as the highest-priority landscapes for soil preservation and basin management, whereas sub-basins 2, 4, 12, and 11 reflected lower erosion vulnerability ranks. In this study, effective geomorphic analysis revealed that the study area is mainly influenced by mature landscapes, with geomorphic reactivations linked to moderate relative tectonic activity in various sub-basins. The combined RTA analysis indicated that relative tectonic activity shows a spatial co-variance with soil erosion vulnerability by controlling basin geometry, channel gradient, and drainage reactivation systems.
The spatial consistency among the morphometric prioritization analysis, RTA, and RUSLE models indicates an internal geomorphometric link rather than physical model validation. Because this framework depends on satellite-produced elevation data and empirical regional keys in the absence of direct field-based sediment measurements, the results present a relative vulnerability ranking rather than absolute physical soil erosion predictions. To adjust this basic limitation and confirm physical model validation, field-based monitoring programs are highly recommended for ongoing studies. Additionally, recommended field validation activities include (a) multi-temporal UAV photogrammetric observation of slope erosion and active gullies along significant corridor transports; (b) localized rainfall-runoff computing to check and calibrate empirical K and R factors under hyper-arid to semi-arid coastal event regimes; and (c) the initiation of physical sediment trapping frameworks over high-priority sub-basins like sub-basins 7 and 8 to quantify ground-load and suspended sediment yields. In addition to the scientific contribution of this study, the proposed model presents a practical decision-support key for basin prioritization, soil maintenance, and sustainable land-cover/land-use strategies. The resulting prioritization models can help engineers and planners in defining zones requiring soil erosion-control studies, enhanced drainage patterns, slope adaptation, and other mitigation plans before upcoming mega-infrastructure development. Accordingly, the present study directly aids in developing sustainable basin management and climate-resilient infrastructure. Furthermore, this study can effectively contribute to Sustainable Development Goal 9 (Industry, Innovation and Infrastructure) and Sustainable Development Goal 13 (Climate Action). Because the current work is limited by the lack of historical measurements and sediment yield information, the present cross-model spatial consistency is still an experiential comparison/discussion. To overcome this basic limitation, field validation programs are highly recommended during ongoing work. These future studies in the study landscape could consider: (1) frequent UAV-based photogrammetry to observe active soil erosion along highway slopes; (2) localized rainfall-surface runoff recording to assess the empirical R and K keys under active Cenozoic rift system environments; and, finally, (3) installation of sediment traps particularly in high-priority sub-basins (sub-basins 7 and 8).

Funding

This research was supported by Ongoing Research Funding program (ORF-2026-1701), King Saud University, Riyadh, Saudi Arabia.

Institutional Review Board Statement

Not applicable.

Data Availability Statement

The original contributions presented in this study are included in the article. Further inquiries can be directed to the corresponding author.

Conflicts of Interest

The author declares no conflicts of interest.

References

  1. Riveros, A.; Gunaratne, C.; Martinelli, M.; Sperna Weiland, F.C. A single framework for assessing flash flood and landslide susceptibility: An application to the Mediterranean Liguria region, Italy. Nat. Hazards Earth Syst. Sci. 2026, 26, 2437–2459. [Google Scholar] [CrossRef] [Scilit]
  2. Abdelkareem, M. Targeting flash flood potential areas using remotely sensed data and GIS techniques. Nat. Hazards 2017, 85, 19–37. [Google Scholar] [CrossRef] [Scilit]
  3. Adnan, M.S.G.; Dewan, A.; Zannat, K.E.; Abdullah, A.Y.M. The use of watershed geomorphic data in flash flood susceptibility zoning: A case study of the Karnaphuli and Sangu river basins of Bangladesh. Nat. Hazards 2019, 99, 425–448. [Google Scholar] [CrossRef] [Scilit]
  4. Sherif, M.; Singh, V.P.; Sefelnasr, A.; Abrar, M. (Eds.) Water Resources Management and Sustainability Solutions for Arid Regions; Water Science and Technology Library: Cham, Switzerland; Springer: Cham, Switzerland, 2023; Available online: https://www.springer.com/gp/ (accessed on 16 March 2023).
  5. Al-Naeem, A.A. Monitoring of Groundwater Salinity for Water Resources Management in Irrigated Areas of Al-Jouf Region, Saudi Arabia. Res. J. Environ. Sci. 2015, 9, 256–269. [Google Scholar] [CrossRef] [Scilit]
  6. Patlakas, P.; Stathopoulos, C.; Flocas, H.; Bartsotas, N.S.; Kallos, G. Precipitation climatology for the arid region of the arabian peninsula—Variability, trends and extremes. Climate 2021, 9, 103. [Google Scholar] [CrossRef] [Scilit]
  7. Khalifa, A.; Çakir, Z.; Owen, L.A.; Kaya, Ş. Morphotectonic analysis of the East Anatolian Fault, Turkey. Turk. J. Earth Sci. 2018, 27, 110–126. [Google Scholar] [CrossRef] [Scilit]
  8. Dzwairo, R.; Singh, S.K.; Patel, A. Soil erosion susceptibility assessment through morphometric analysis and morphotectonic implications in Rietspruit sub-basin, South Africa. Environ. Dev. Sustain. 2024, 27, 16503–16524. [Google Scholar] [CrossRef] [Scilit]
  9. Li, Z.; Zhang, Y.; Wang, J.; Ge, W.; Li, W.; Song, H.; Guo, X.; Wang, T.; Jiao, Y. Impact evaluation of geomorphic changes caused by extreme floods on inundation area considering geomorphic variations and land use types. Sci. Total Environ. 2021, 754, 142424. [Google Scholar] [CrossRef] [Scilit] [PubMed]
  10. Simonneaux, V.; Cheggour, A.; Deschamps, C.; Mouillot, F.; Cerdan, O.; Le Bissonnais, Y. Land use and climate change effects on soil erosion in a semi-arid mountainous watershed (High Atlas, Morocco). J. Arid. Environ. 2015, 122, 64–75. [Google Scholar] [CrossRef] [Scilit]
  11. Durlević, U.; Srejić, T.; Valjarević, A.; Aleksova, B.; Deđanski, V.; Vujović, F.; Lukić, T. GIS-Based Spatial Modeling of Soil Erosion and Wildfire Susceptibility Using VIIRS and Sentinel-2 Data: A Case Study of Šar Mountains National Park, Serbia. Forests 2025, 16, 484. [Google Scholar] [CrossRef] [Scilit]
  12. Bashir, B.; Alsalman, A. Flash flood and erosion hazards in Wadi Al-Sirhan catchment, northern Saudi Arabia. Open Geosci. 2026, 18, 20250958. [Google Scholar] [CrossRef] [Scilit]
  13. Alarifi, S.S.; Abdelkareem, M.; Abdalla, F.; Alotaibi, M. Flash Flood Hazard Mapping Using Remote Sensing and GIS Techniques in Southwestern Saudi Arabia. Sustainability 2022, 14, 14145. [Google Scholar] [CrossRef] [Scilit]
  14. Al-Hantouli, F.; Awawdeh, M.; Obeidat, M. Soil Erosion Prioritization of Yarmouk River Basin, Jordan Using Multiple Approaches in a GIS Environment. In Water Resources Management and Sustainability; Springer: Cham, Switzerland, 2023; pp. 291–318. [Google Scholar] [CrossRef] [Scilit]
  15. Taib, H.; Hadji, R.; Hamed, Y.; Bensalem, M.S.; Amamria, S.; Houda, B. Evaluation of relative tectonic activity in a semiarid basin: Analysis of geomorphic indices and morphometric parameters in the Meskiana watershed. Euro-Mediterr. J. Environ. Integr. 2024, 9, 843–858. [Google Scholar] [CrossRef] [Scilit]
  16. Khalifa, A.; Bashir, B.; Alsalman, A.; Bachir, H. Morphometric-Hydro Characterization of the Coastal Line between El-Qussier and Marsa-Alam, Egypt: Preliminary Flood Risk Signatures. Appl. Sci. 2022, 12, 6264. [Google Scholar] [CrossRef] [Scilit]
  17. Saha, S.; Das, J.; Mandal, T. Investigation of the watershed hydro-morphologic characteristics through the morphometric analysis: A study on Rayeng basin in Darjeeling Himalaya. Environ. Chall. 2022, 7, 100463. [Google Scholar] [CrossRef] [Scilit]
  18. Vincent, L.T.; Eaton, B.C.; Leenman, A.S.; Jakob, M. Secondary Geomorphic Processes and Their Influence on Alluvial Fan Morphology, Channel Behavior and Flood Hazards. J. Geophys. Res. Earth Surf. 2022, 127, e2021JF006371. [Google Scholar] [CrossRef] [Scilit]
  19. Fernandes, J.N. Core Challenges for Sustainable River Flood Management. Sustainability 2025, 17, 10981. [Google Scholar] [CrossRef] [Scilit]
  20. Alhamid, A.A.; Alfayzi, S.A.; Hamadto, M.A. A Sustainable Water Resources Management Plan for Wadi Hanifa in Saudi Arabia. J. King Saud Univ.-Eng. Sci. 2007, 19, 209–221. [Google Scholar] [CrossRef] [Scilit]
  21. Alzahrani, A.J.; Alghamdi, A.G.; Ibrahim, H.M. Assessment of Soil Loss Due to Wind Erosion and Dust Deposition: Implications for Sustainable Management in Arid Regions. Appl. Sci. 2024, 14, 10822. [Google Scholar] [CrossRef] [Scilit]
  22. Dano, U.L.; Aboukorin, A.A.; Alshihri, F.S.; Alnaim, A.; Almutlaq, F.; Jamil, R.; Alqahtany, A.M.; Alshammari, M.S.; Almazroua, S.; Abdalla, E.M.E. Assessment of Flood Hazard and Infrastructure Vulnerability Under Sea-Level Rise in Eastern Saudi Arabia: Implications of UN SDGs for Sustainable Cities. Sustainability 2026, 18, 2510. [Google Scholar] [CrossRef] [Scilit]
  23. Peyghambari, S.; Zhang, Y. Hyperspectral remote sensing in lithological mapping, mineral exploration, and environmental geology: An updated review. J. Appl. Remote Sens. 2021, 15, 031501. [Google Scholar] [CrossRef] [Scilit]
  24. Hou, J.; Van Dijk, A.I.J.M.; Renzullo, L.J.; Vertessy, R.A.; Mueller, N. Hydromorphological attributes for all Australian river reaches derived from Landsat dynamic inundation remote sensing. Earth Syst. Sci. Data 2019, 11, 1003–1015. [Google Scholar] [CrossRef] [Scilit]
  25. Fahmy, W.; El-Desoky, H.M.; Elyaseer, M.H.; Kenne, P.A.; Shirazi, A.; Hezarkhani, A.; Shirazy, A.; El-Awny, H.; Abdel-Rahman, A.M.; Khalil, A.E.; et al. Petrological and Geochemical Data for Lithological Mapping in Wadi Kid, Southeast Sinai, Egypt. Minerals 2023, 13, 1160. [Google Scholar] [CrossRef] [Scilit]
  26. Khalifa, A.; Bashir, B.; Alsalman, A.; Naik, S.P.; Nappi, R. Remotely Sensed Data, Morpho-Metric Analysis, and Integrated Method Approach for Flood Risk Assessment: Case Study of Wadi Al-Arish Landscape, Sinai, Egypt. Water 2023, 15, 1797. [Google Scholar] [CrossRef] [Scilit]
  27. Singh, V.G.; Singh, S.K. Analysis of geo-morphometric and topo-hydrological indices using COP-DEM: A case study of Betwa River Basin, Central India. Geol. Ecol. Landsc. 2024, 8, 101–128. [Google Scholar] [CrossRef] [Scilit]
  28. El Sherbini, R.A.; Ghazala, H.H.; Ahmed, M.A.; Ibraheem, I.M.; Al Ajmi, H.F.; Genedi, M.A. Mapping Groundwater Potential Zones in the Widyan Basin, Al Qassim, KSA: Analytical Hierarchy Process-Based Analysis Using Sentinel-2, ASTER-DEM, and Conventional Data. Remote Sens. 2025, 17, 766. [Google Scholar] [CrossRef] [Scilit]
  29. Makrari, S.; Sharma, G.; Taloor, A.K.; Singh, M.S.; Sarma, K.K.; Aggarwal, S.P. Assessment of the geomorphic indices in relation to tectonics along selected sectors of Borpani River Basin, Assam using Cartosat DEM data. Geosystems Geoenvironment 2022, 1, 68. [Google Scholar] [CrossRef] [Scilit]
  30. Patidar, A.K.; Kothyari, G.C.; Kaushik, M.; Khanduri, S. Extraction of tectonic imprints using geospatial techniques: Evidence from Mandakini River basin, Uttarakhand, India. J. Mt. Sci. 2024, 21, 3720–3738. [Google Scholar] [CrossRef] [Scilit]
  31. El Brahimi, M.; Mastere, M.; Benzougagh, B.; El Fellah, B.; Fartas, N.; Ladel, L.; Sbihi, A.; Turyasingura, B.; Alsulamy, S.; Khedher, K.M.; et al. Assessing soil erosion vulnerability through geospatial morphometric analysis in the Oued Amter Basin (Northwest Morocco). Euro-Mediterr. J. Environ. Integr. 2024, 9, 1157–1180. [Google Scholar] [CrossRef] [Scilit]
  32. Elnobi, M.; Bashir, B.; Alsalman, A.; Bachir, H. Geospatial Analytics for Preliminarily Landscape Active Tectonic Assessment of the Wadi Araba Basin, Western Gulf of Suez, Egypt. Appl. Sci. 2022, 12, 12152. [Google Scholar] [CrossRef] [Scilit]
  33. Klinge, M.; Lehmkuhl, F. Geomorphology of the Tsetseg Nuur basin, Mongolian Altai-lake development, fluvial sedimentation and aeolian transport in a semi-arid environment. J. Maps 2013, 9, 361–366. [Google Scholar] [CrossRef] [Scilit]
  34. Bashir, B.; Alsalman, A. Geospatial Analysis for Tectonic Assessment and Soil Erosion Prioritization: A Case Study of Wadi Al-Lith, Red Sea Coast, Saudi Arabia. Appl. Sci. 2023, 13, 12523. [Google Scholar] [CrossRef] [Scilit]
  35. Kalifa, A.; Çakir, Z.; Owen, L.A.; Kaya, Ş. Evaluation of the relative tectonic activity of the adıyaman fault within the arabian-anatolian plate boundary (Eastern Turkey). Geol. Acta 2019, 17, 1–17. [Google Scholar] [CrossRef] [Scilit]
  36. Alipoor, R.; Poorkermani, M.; Zare, M.; El Hamdouni, R. Active tectonic assessment around Rudbar Lorestan dam site, High Zagros Belt (SW of Iran). Geomorphology 2011, 128, 1–14. [Google Scholar] [CrossRef] [Scilit]
  37. Ali, A.A.; Al-Abbadi, A.M.; Jabbar, F.K.; Alzahrani, H.; Hamad, S. Predicting Soil Erosion Rate at Transboundary Sub-Watersheds in Ali Al-Gharbi, Southern Iraq, Using RUSLE-Based GIS Model. Sustainability 2023, 15, 1776. [Google Scholar] [CrossRef] [Scilit]
  38. Alsaihani, M.; Alharbi, R. Mapping of Soil Erosion Vulnerability in Wadi Bin Abdullah, Saudi Arabia through RUSLE and Remote Sensing. Water 2024, 16, 2663. [Google Scholar] [CrossRef] [Scilit]
  39. Gela, A.G.; Mengistu, D.A.; Bekele, D.A. Watershed prioritization for conservation planning using RUSLE and morphometric methods, Northwestern Ethiopia. J. Mt. Sci. 2023, 20, 2242–2262. [Google Scholar] [CrossRef] [Scilit]
  40. Attar, M.I.; Naseer, S.; Pandey, Y.; Khan, J.N.; Bangroo, S.A.; Hasan, M.A.; Khan, Z.A.; Khan, A.H.; Tantray, A.M. Morphometric analysis for prioritizing critical areas of Urpash watershed in Sindh catchment of the lesser Himalayas using RS and GIS approach. PLoS ONE 2025, 20, e0330503. [Google Scholar] [CrossRef] [Scilit] [PubMed]
  41. El Abassi, M.; Ousmana, H.; Saouita, J.; El-Hmaidi, A.; Iallamen, Z.; Jaddi, H.; Aouragh, M.H.; Boufala, M.; Kasse, Z.; El Ouali, A.; et al. The combination of Multi-Criteria Decision-Making (MCDM) and morphometric parameters for prioritizing the erodibility of sub-watersheds in the Ouljet Es Soltane basin (North of Morocco). Heliyon 2024, 10, e38228. [Google Scholar] [CrossRef] [Scilit] [PubMed]
  42. Gajbhiye, S.; Mishra, S.K.; Pandey, A. Prioritizing erosion-prone area through morphometric analysis: An RS and GIS perspective. Appl. Water Sci. 2014, 4, 51–61. [Google Scholar] [CrossRef] [Scilit]
  43. Khal, M.; Algouti, A.; Algouti, A.; Akdim, N.; Stankevich, S.A.; Menenti, M. Evaluation of open Digital Elevation Models: Estimation of topographic indices relevant to erosion risk in the Wadi M’Goun watershed, Morocco. AIMS Geosci. 2020, 6, 231–257. [Google Scholar] [CrossRef] [Scilit]
  44. Ghimire, S.K.; Lu, Y.; Wang, Y. An improved framework to prioritize sub-watersheds: Construction of Watershed Morphometric Composite Index (WMCI) for mountain soil conservation. Ecol. Indic. 2025, 177, 113817. [Google Scholar] [CrossRef] [Scilit]
  45. Rockwell, T.K.; Keller, E.A.; Johnson Donald, L. Tectonic geomorphology of alluvial fans and mountain fronts near Ventura, California. In Tectonic Geomorphology. Proceedings of the 15th Annual Geomorphology Symposium; Allen & Unwin: Boston, MA, USA, 1985. [Google Scholar]
  46. Topal, S.; Keller, E.; Bufe, A.; Koçyiğit, A. Tectonic geomorphology of a large normal fault: Akşehir fault, SW Turkey. Geomorphology 2016, 259, 55–69. [Google Scholar] [CrossRef] [Scilit]
  47. Fedorik, J.; Delaunay, A.; Losi, G.; Panara, Y.; Menegoni, N.; Afifi, A.M.; Arkadakskiy, S.; Al Malallah, M.; Oelkers, E.; Gislason, S.R.; et al. Structure and fracture characterization of the Jizan group: Implications for subsurface CO2 basalt mineralization. Front. Earth Sci. 2023, 10, 946532. [Google Scholar] [CrossRef] [Scilit]
  48. Ouerghi, S.; Al-Mannai, A.A.M. The approach of automatic drainage anomalies extraction for active tectonic detection: Jizan coastal plain (Southwestern of Saudi Arabia). Geocarto Int. 2026, 41, 2600181. [Google Scholar] [CrossRef] [Scilit]
  49. Bosworth, W. Geological Evolution of the Red Sea: Historical Background, Review, and Synthesis. In The Red Sea; Springer: Berlin/Heidelberg, Germany, 2015; pp. 45–78. [Google Scholar] [CrossRef] [Scilit]
  50. Schmidt, D.L.; Hadley, D.G.; Stoeser, D.B. Late Proterozoic crustal history of the Arabian Shield, southern Najd Province, Kingdom of Saudi Arabia. Evol. Miner. Arab.–Nubian Shield 1979, 41–58. [Google Scholar] [CrossRef] [Scilit]
  51. Tramontini, C.; Davies, D. A Seismic Refraction Survey in The Red Sea. Geophys. J. Int. 1969, 17, 225–241. [Google Scholar] [CrossRef] [Scilit]
  52. Davison, I.; Al-Kadasi, M.; Al-Khirbash, S.; Al-Subbary, A.K.; Baker, J.; Blakey, S.; Bosence, D.; Dart, C.; Heaton, R.; McClay, K.; et al. Geological evolution of the southeastern Red Sea Rift margin, Republic of Yemen. Geol. Soc. Am. Bull. 1994, 106, 1474–1493. [Google Scholar] [CrossRef] [Scilit]
  53. Abdelfattah, A.K.; Al-Amri, A.; Abd el-aal, A.K.; Zaidi, F.K.; Fnais, M.; Almadani, S.; Al-Arifi, N. The 23 January 2014 Jizan earthquake and its tectonic implications in southwestern Saudi Arabia. Tectonophysics 2017, 712–713, 494–502. [Google Scholar] [CrossRef] [Scilit]
  54. Abu-Abdullah, M.M.; Youssef, A.M.; Maerz, N.H.; Abu-Alfadail, E.; Al-Harbi, H.M.; Al-Saadi, N.S. A flood riskmanagement programofwadi bayshdam on the downstream area: An integration of hydrologic and hydraulicmodels, Jizan region, KSA. Sustainability 2020, 12, 1069. [Google Scholar] [CrossRef] [Scilit]
  55. Oelkers, E.H.; Arkadakskiy, S.; Afifi, A.M.; Hoteit, H.; Richards, M.; Fedorik, J.; Delaunay, A.; Torres, J.E.; Ahmed, Z.T.; Kunnummal, N.; et al. The subsurface carbonation potential of basaltic rocks from the Jizan region of Southwest Saudi Arabia. Int. J. Greenh. Gas Control 2022, 120, 103772. [Google Scholar] [CrossRef] [Scilit]
  56. Ali, A.; Beg, F. Morphometric Toolbox: A New Technique in Basin Morphometric Analysis Using ArcGIS. 2015. Available online: http://www.arcgis.com/home/item.html?id=1953627829a64102a7183327b4727 (accessed on 2 June 2026).
  57. Godard, V.; Hippolyte, J.-C.; Cushing, E.; Espurt, N.; Fleury, J.; Bellier, O.; Ollivier, V.; ASTER Team. Hillslope denudation and morphologic response to a rock uplift gradient. Earth Surf. Dyn. 2020, 8, 221–243. [Google Scholar] [CrossRef] [Scilit]
  58. Borrelli, P.; Alewell, C.; Alvarez, P.; Anache, J.A.A.; Baartman, J.; Ballabio, C.; Bezak, N.; Biddoccu, M.; Cerdà, A.; Chalise, D.; et al. Soil erosion modelling: A global review and statistical analysis. Sci. Total Environ. 2021, 780, 146494. [Google Scholar] [CrossRef] [Scilit] [PubMed]
  59. Mishra, S.K.; Singh, V.P. Soil Conservation Service Curve Number (SCS-CN) Methodology, Volume 42; Springer: Dordrecht, The Netherlands, 2003. [Google Scholar] [CrossRef] [Scilit]
  60. Onyando, J.O.; Kisoyan, P.; Chemelil, M.C. Estimation of potential soil erosion for river Perkerra catchment in Kenya. Water Resour. Manag. 2005, 19, 133–143. [Google Scholar] [CrossRef] [Scilit]
  61. Singh, W.R.; Barman, S.; Tirkey, G. Morphometric analysis and watershed prioritization in relation to soil erosion in Dudhnai Watershed. Appl. Water Sci. 2021, 11, 151. [Google Scholar] [CrossRef] [Scilit]
  62. Al-Ghamdi, A.A.; Tadesse, Y.; Adgaba, N.; Alghamdi, A.G. Soil degradation and restoration in southwestern saudi arabia through investigation of soil physiochemical characteristics and nutrient status as indicators. Sustainability 2021, 13, 9169. [Google Scholar] [CrossRef] [Scilit]
  63. Choudhari, P.P.; Nigam, G.K.; Singh, S.K.; Thakur, S. Morphometric based prioritization of watershed for groundwater potential of Mula river basin, Maharashtra, India. Geol. Ecol. Landsc. 2018, 2, 256–267. [Google Scholar] [CrossRef] [Scilit]
  64. Alsharif, O.H.; Al-Juaidi, A.E.M.; Elmanadely, M.S. A GIS–MCDM Framework for Soil Erosion Risk Prioritization in Arid Watersheds: Evidence from Wadi Numan, Saudi Arabia. Land 2026, 15, 1157. [Google Scholar] [CrossRef] [Scilit]
  65. Thakkar, A.K.; Dhiman, S.D. Morphometric analysis and prioritization of miniwatersheds in Mohr watershed, Gujarat using remote sensing and GIS techniques. J. Indian Soc. Remote Sens. 2007, 35, 313–321. [Google Scholar] [CrossRef] [Scilit]
  66. Sarkar, P.; Kumar, P.; Vishwakarma, D.K.; Ashok, A.; Elbeltagi, A.; Gupta, S.; Kuriqi, A. Watershed prioritization using morphometric analysis by MCDM approaches. Ecol. Inform. 2022, 70, 101763. [Google Scholar] [CrossRef] [Scilit]
  67. Bashir, B.; Alsalman, A. Morpho-Hydrological Analysis and Preliminary Flash Flood Hazard Mapping of Neom City, Northwestern Saudi Arabia, Using Geospatial Techniques. Sustainability 2024, 16, 23. [Google Scholar] [CrossRef] [Scilit]
  68. Khalifa, A.; Bashir, B.; Alsalman, A.; Öğretmen, N. Morpho-tectonic assessment of the abu-dabbab area, eastern desert, egypt: Insights from remote sensing and geospatial analysis. ISPRS Int. J. Geoinf. 2021, 10, 784. [Google Scholar] [CrossRef] [Scilit]
  69. Singh, P.; Gupta, A.; Singh, M. Hydrological inferences from watershed analysis for water resource management using remote sensing and GIS techniques. Egypt. J. Remote Sens. Space Sci. 2014, 17, 111–121. [Google Scholar] [CrossRef] [Scilit]
  70. Horton, R.C.; Horton, R.E. 1945: Erosional development of streams and their drainage basins: Hydrophysical approach to quantitative morphology. Bulletin of the Geological Society of America 56, 275–370. Prog. Phys. Geogr. 1995, 19, 533–554. [Google Scholar] [CrossRef] [Scilit]
  71. Michel, C.; Andréassian, V.; Perrin, C. Soil Conservation Service Curve Number method: How to mend a wrong soil moisture accounting procedure? Water Resour. Res. 2005, 41, 1–6. [Google Scholar] [CrossRef] [Scilit]
  72. Pareta, K.; Pareta, U. Quantitative Geomorphological Analysis of a Watershed of Ravi River Basin, H.P. India. Int. J. Remote Sens. GIS 2012, 1, 47–62. [Google Scholar]
  73. Strahler, A.N. Hypsometric (area-altitude) analysis of erosional topography. Bull. Geol. Soc. Am. 1952, 63, 1117–1142. [Google Scholar] [CrossRef] [Scilit]
  74. Patton, P.C.; Baker, V.R. Morphometry and floods in small drainage basins subject to diverse hydrogeomorphic controls. Water Resour. Res. 1976, 12, 941–952. [Google Scholar] [CrossRef] [Scilit]
  75. Miller, V.C. A Quantitative Geomorphic Study of Drainage Basin Characteristics in the Clinch Mountain Area, Virginia and Tennessee; Department of Geology Columbia University: New York, NY, USA, 1953. [Google Scholar]
  76. Kumar, A.; Singh, S.; Pramanik, M.; Chaudhary, S.; Maurya, A.K.; Ku, M. Watershed prioritization for soil erosion mapping in the Lesser Himalayan Indian basin using PCA and WSA methods in conjunction with morphometric parameters and GIS-based approach. Environ. Dev. Sustain. 2022, 24, 3723–3761. [Google Scholar] [CrossRef] [Scilit]
  77. Bashir, B. Morphometric Parameters and Geospatial Analysis for Flash Flood Susceptibility Assessment: A Case Study of Jeddah City along the Red Sea Coast, Saudi Arabia. Water 2023, 15, 870. [Google Scholar] [CrossRef] [Scilit]
  78. Kumar, A.; Kumar Rana, N.; Nath Sharma, V. Soil Erosion-based Sub-basin Prioritization in an Intermittent River Basin Using Morphometric Analysis: A Case Study of Jirgo River Basin, Central India. Asian J. Geogr. Res. 2026, 9, 43–66. [Google Scholar] [CrossRef] [Scilit]
  79. Roy, R.; Saha, K.; Sarkar, A. Hack’s law in a drainage network model: A Brownian web approach. Ann. Appl. Probab. 2016, 26, 1807–1836. [Google Scholar] [CrossRef] [Scilit]
  80. Amine, A.; El Ouardi, H.; Zebari, M.; El Makrini, H.; Habibi, M. Relative landscape maturity in the South Rifian Ridges (NW Morocco): Inferences from DEM-based surface indices analysis. Appl. Comput. Geosci. 2020, 6, 100027. [Google Scholar] [CrossRef] [Scilit]
  81. El Hamdouni, R.; Irigaray, C.; Fernández, T.; Chacón, J.; Keller, E.A. Assessment of relative active tectonics, southwest border of the Sierra Nevada (southern Spain). Geomorphology 2008, 96, 150–173. [Google Scholar] [CrossRef] [Scilit]
  82. Sağlam Selçuk, A. Evaluation of the relative tectonic activity in the eastern Lake Van basin, East Turkey. Geomorphology 2016, 270, 9–21. [Google Scholar] [CrossRef] [Scilit]
  83. Bashir, B.; Alsalman, A. Application of Geomorphic Signatures in Relative Tectonic Activity Assessment of a Red Sea Coastal Basin between Al Farrah and Heelan, Saudi Arabia. Appl. Sci. 2024, 14, 4980. [Google Scholar] [CrossRef] [Scilit]
  84. Ramírez-Herrera, M.T. Geomorphic assessment of active tectonics in the acambay graben, Mexican volcanic belt. Earth Surf. Process. Landf. 1998, 23, 317–332. [Google Scholar] [CrossRef]
  85. Mahmood, S.A.; Gloaguen, R. Appraisal of active tectonics in Hindu Kush: Insights from DEM derived geomorphic indices and drainage analysis. Geosci. Front. 2012, 3, 407–428. [Google Scholar] [CrossRef] [Scilit]
  86. Bramhankar, G.W.; Hire, P.S. Geomorphic Signatures of Active Tectonics in the Mahi Basin, Western India. J. Indian Geomorphol. 2024, 12. [Google Scholar]
  87. Zhang, T.; Fan, S.; Chen, S.; Li, S.; Lu, Y. Geomorphic evolution and neotectonics of the Qianhe River Basin on the southwest margin of the Ordos Block, North China. J. Asian Earth Sci. 2019, 176, 184–195. [Google Scholar] [CrossRef] [Scilit]
  88. Buczek, K.; Górnik, M. Evaluation of tectonic activity using morphometric indices: Case study of the Tatra Mts. (Western Carpathians, Poland). Environ. Earth Sci. 2020, 79, 176. [Google Scholar] [CrossRef] [Scilit]
  89. Mesa, L.M. Morphometric analysis of a subtropical Andean basin (Tucumán, Argentina). Environ. Geol. 2006, 50, 1235–1242. [Google Scholar] [CrossRef] [Scilit]
  90. Gudu Tufa, F. Morphometric Analysis of Kito and Awetu Sub Basins Jimma, Ethiopia. Am. J. Water Sci. Eng. 2018, 4, 80. [Google Scholar] [CrossRef] [Scilit]
  91. Yawar Ali Khan, M.; ElKashouty, M. Watershed prioritization and hydro-morphometric analysis for the potential development of Tabuk Basin, Saudi Arabia using multivariate statistical analysis and coupled RS-GIS approach. Ecol. Indic. 2023, 154, 110766. [Google Scholar] [CrossRef] [Scilit]
  92. Waikar, M.L.; Nilawar, A.P. Morphometric Analysis of a Drainage Basin Using Geographical Information System: A Case study. Int. J. Multidiscip. Curr. Res. 2014, 2, 179–184. [Google Scholar]
  93. Saha, S.; Gayen, A.; Pourghasemi, H.R.; Tiefenbacher, J.P. Identification of soil erosion-susceptible areas using fuzzy logic and analytical hierarchy process modeling in an agricultural watershed of Burdwan district, India. Environ. Earth Sci. 2019, 78, 649. [Google Scholar] [CrossRef] [Scilit]
  94. Arabameri, A.; Saha, S.; Chen, W.; Roy, J.; Pradhan, B.; Bui, D.T. Flash flood susceptibility modelling using functional tree and hybrid ensemble techniques. J. Hydrol. 2020, 587, 125007. [Google Scholar] [CrossRef] [Scilit]
  95. Schumm, S.A. Evolution of drainage systems and slopes in badlands at Perth Amboy, New Jersey. Bull. Geol. Soc. Am. 1956, 67, 597–646. [Google Scholar] [CrossRef] [Scilit]
  96. Halder, S.; Banerjee, S.; Youssef, Y.M.; Chandel, A.; Alarifi, N.; Bhandari, G.; Abd-Elmaboud, M.E. Ground–Surface Water Assessment for Agricultural Land Prioritization in the Upper Kansai Basin, India: An Integrated SWAT-VIKOR Framework Approach. Water 2025, 17, 880. [Google Scholar] [CrossRef] [Scilit]
  97. Benzougagh, B.; Meshram, S.G.; Dridri, A.; Boudad, L.; Baamar, B.; Sadkaoui, D.; Khedher, K.M. Identification of critical watershed at risk of soil erosion using morphometric and geographic information system analysis. Appl. Water Sci. 2022, 12, 8. [Google Scholar] [CrossRef] [Scilit]
  98. Pike, R.J.; Wilson, S.E. Elevation-relief ratio, hypsometric integral, and geomorphic area-altitude analysis. Bull. Geol. Soc. Am. 1971, 82, 1079–1084. [Google Scholar] [CrossRef] [Scilit]
  99. Sakellariou, D.; Rousakis, G.; Panagiotopoulos, I.; Morfis, I.; Bailey, G.N. Geological structure and late quaternary geomorphological evolution of the Farasan Islands Continental Shelf, South Red Sea, SW Saudi Arabia. In Geological Setting, Palaeoenvironment and Archaeology of the Red Sea; Springer International Publishing: Berlin/Heidelberg, Germany, 2018; pp. 629–652. [Google Scholar] [CrossRef] [Scilit]
  100. De Reu, J.; Bourgeois, J.; Bats, M.; Zwertvaegher, A.; Gelorini, V.; De Smedt, P.; Chu, W.; Antrop, M.; De Maeyer, P.; Finke, P.; et al. Application of the topographic position index to heterogeneous landscapes. Geomorphology 2013, 186, 39–49. [Google Scholar] [CrossRef] [Scilit]
  101. Alabbasi, S.; Khan, S.D.; Tirmizi, O. Understand Surface Deformation of Midyan Peninsula, Northwestern Saudi Arabia Using Differential Interferometry and Hypsometric Index. Earth Syst. Environ. 2026. [Google Scholar] [CrossRef] [Scilit]
  102. Efthimiou, N.; Lykoudi, E.; Karavitis, C. Soil erosion assessment using the RUSLE model and GIS. Eur. Water 2014, 43, 15–30. [Google Scholar]
  103. Ahmed, M.M.; Awadallah, A.G.; Awadallah, N.A.; Ahmed, W.T. Assessment of Various Empirical Soil Loss Estimation Equations in Arid Regions. J. Geosci. Environ. Prot. 2022, 10, 109–122. [Google Scholar] [CrossRef]
  104. Elhag, M.; Hamza, M.H.; Ouerghi, S.; Elsheikh, R.; Zhang, L.; Diani, K. Spatiotemporal assessment of soil erosion risk using integrated RUSLE-GIS in Wadi Allith Basin, Saudi Arabia. Open Geosci. 2026, 18, 20250966. [Google Scholar] [CrossRef] [Scilit]
  105. Manjare, B.S.; Khan, S.; Jawadand, S.A.; Padhye, M.A. Watershed Prioritization of Wardha River Basin, Maharashtra, India Using Morphometric Parameters: A Remote Sensing and GIS-Based Approach. In Hydrologic Modeling; Springer: Berlin/Heidelberg, Germany, 2018; pp. 353–366. [Google Scholar] [CrossRef] [Scilit]
  106. Shomre, M.W.; Anticho, L.A.; Meskele, D.Y. Coupled RUSLE-SWPT morphometric characterization of soil erosion under land use change and climate projections in the Upper OMO Gibe Basin. Discov. Soil 2026, 3, 117. [Google Scholar] [CrossRef] [Scilit]
  107. Biswas, S.; Sudhakar, S.; Desai, V.R. Prioritisation of Subwatersheds Based on Morphometric Analysis of Drainage Basin: A Remote Sensing and GIS Approach. J. Indian Soc. Remote Sens. 1999, 27, 155–166. [Google Scholar] [CrossRef] [Scilit]
  108. Aytekin, M.; Ediş, S.; Kaya, İ. A Hybrid PCA-TOPSIS and Machine Learning Approach to Basin Prioritization for Sustainable Land and Water Management. Water 2026, 18, 5. [Google Scholar] [CrossRef] [Scilit]
  109. Khan, M.Y.A.; ElKashouty, M.; Subyani, A.M.; Tian, F. Morphometric Determination and Digital Geological Mapping by RS and GIS Techniques in Aseer–Jazan Contact, Southwest Saudi Arabia. Water 2023, 15, 2438. [Google Scholar] [CrossRef] [Scilit]
Figure 1. Location map of the major Provinces in Saudi Arabia, showing the study area in Jizan Province.
Sustainability 18 08432 g001
Figure 2. Digital elevation model map showing the elevation distribution of the study area.
Sustainability 18 08432 g002
Figure 3. Fault trends of Jizan Province in southern Saudi Arabia: (a) faults inferred from gravity data, (b) faults inferred from magnetic data, and (c) surface faults; modified after authors in references [48,53].
Sustainability 18 08432 g003
Figure 4. Spatial distribution of the extracted drainage network showing stream orders (1–6).
Sustainability 18 08432 g004
Figure 5. Spatial distribution of the delineated sub-basins ordered from 1 to 24.
Sustainability 18 08432 g005
Figure 6. Location of the Vf sections calculated in the study area. Numbers in this figure indicate the sub-basin numbers.
Sustainability 18 08432 g006
Figure 7. Soil erosion prioritization model based on the morphometric analysis. Numbers in this figure indicate the sub-basin numbers.
Sustainability 18 08432 g007
Figure 8. (a) Hypsometric concave curves, and (b) hypsometric S-shaped curves.
Sustainability 18 08432 g008
Figure 9. Distribution of the relative tectonic activity based on the hypsometric integral index. Numbers in this figure indicate the sub-basin numbers.
Sustainability 18 08432 g009
Figure 10. Distribution of the relative tectonic activity based on the valley-floor-width-to-valley-height ratio index. Numbers in this figure indicate the sub-basin numbers.
Sustainability 18 08432 g010
Figure 11. Distribution of the relative tectonic activity based on the basin shape index. Numbers in this figure indicate the sub-basin numbers.
Sustainability 18 08432 g011
Figure 12. Relative tectonic activity model based on the geomorphic analysis. Numbers in this figure indicate the sub-basin numbers.
Sustainability 18 08432 g012
Figure 13. (a) Rainfall erosivity, (b) soil erodibility factor, (c) topographic factor, and (d) cropping management factor. Numbers in this figure indicate the sub-basin numbers.
Sustainability 18 08432 g013
Figure 14. Final soil erosion map based on RUSLE model. Numbers in this figure indicate the sub-basin numbers.
Sustainability 18 08432 g014
Table 2. Results of stream orders, stream numbers, and bifurcation ratio.
Sub-BasinsStream OrdersNsLsRb
123456
1381131005349.3413.25
235921004749.9311.75
3401021003539.6413.25
423710003120.5310.33
514310001814.146.00
654921006653.3816.50
7910000107.585.00
8821001126.833.67
9531021006666.2316.50
1099255210132117.8326.40
116814321088100.0317.60
12691652109380.5818.60
1318410002314.817.67
1434610004130.7513.67
1523510002916.799.67
161021000139.044.33
1726310003024.1810.00
1819210002215.937.33
1917321002333.695.75
2013210001613.135.33
2124632103636.187.20
2221000031.501.50
2331000041.572.00
2433521004152.3010.25
Table 3. Results extracted for the applied morphometric parameters; symbols are cited in Table 1.
Sub-BasinsAPRcReCcDdFsDtIfnLgCcmFfIshLWLcRfZRrbRrrbIrnNmr
112.1119.000.420.421.544.084.382.7917.842.040.250.430.235.332.276.710.3541.007.69215.810.176.77
212.3124.840.250.272.004.063.821.8915.482.030.250.170.268.421.4624.751.0065.007.72261.630.2610.56
330.3329.020.290.301.872.722.401.386.531.360.370.230.427.991.829.800.3957.007.13225.420.167.82
421.5720.020.260.311.962.884.351.6712.541.440.350.230.235.521.296.010.3259.0010.69318.690.1716.57
511.7917.150.450.371.502.913.701.5410.751.450.340.340.273.801.284.390.3848.0012.63410.380.1419.73
621.2727.390.210.282.163.244.002.1312.941.620.310.200.259.181.8020.920.6750.005.45160.990.166.06
76.1213.500.320.301.782.413.180.897.651.200.420.220.313.790.834.960.4419.005.01169.710.0512.07
814.5825.280.470.371.462.313.731.248.621.160.430.340.272.941.003.080.3517.005.78190.990.0411.52
97.1218.510.320.351.773.353.342.3611.191.680.300.300.308.112.4420.920.7541.005.06146.820.144.15
104.8611.690.450.411.493.884.354.5516.911.940.260.420.238.483.5814.080.4944.005.19151.600.172.90
1116.4931.050.250.342.014.604.052.6518.602.300.220.290.258.662.5126.800.8148.005.54144.370.224.41
1219.7627.920.360.331.673.774.353.3916.411.890.270.270.238.872.417.040.2651.005.75186.160.194.77
1311.0033.600.420.291.542.423.751.709.071.210.410.210.275.421.135.770.4324.004.43177.710.067.83
146.2813.030.120.222.862.793.731.2210.411.400.360.110.279.821.1214.580.4358.005.91172.590.1610.54
153.2712.130.470.371.472.674.612.2312.311.330.370.330.224.341.455.350.4135.008.06268.540.0911.13
168.5721.760.280.301.892.763.971.0710.961.380.360.220.253.840.854.500.3726.006.77214.280.0715.89
174.6216.020.230.272.102.823.501.389.871.410.350.180.296.861.258.670.4037.005.39170.020.108.63
186.2214.580.370.291.652.563.541.519.061.280.390.210.285.391.156.300.4324.004.45164.590.067.72
198.7220.150.310.291.795.523.771.4620.782.760.180.200.275.481.1120.921.3325.004.56159.000.148.19
206.1015.720.230.222.102.843.461.009.841.420.350.110.296.350.737.020.4430.004.72187.220.0912.99
212.958.900.270.301.924.154.121.7917.102.070.240.230.246.181.4120.921.0430.004.85148.830.126.87
220.673.800.580.401.312.264.500.7910.161.130.440.390.221.300.511.600.4211.008.46289.110.0233.01
233.1411.190.550.351.352.145.470.9811.721.070.470.310.181.540.481.750.4315.009.74366.240.0341.01
240.734.090.500.341.414.433.482.3915.412.220.230.290.296.411.8428.201.6443.006.71250.710.197.29
Table 4. Sub-basin compound ranks due to the morphometric parameter classification in this study.
Sub-BasinsRbLgDdDtFsFfReRcCcRrbNmrCRRank
117202022211191618613.7316
216191916132222196191516.9124
318889114141510171011.277
415131313201212187232115.1823
58141412855718242212.4511
62015151715202023210514.7320
754422161613126188.912
83337104442113178.091
92116161938812137211.368
102418182418226198112.7313
1122232321169920511314.7321
1223171723191111111412414.7322
1311551411181881711110.826
14191010692424241141414.0918
151277182366520201612.7314
164995141515169162012.009
1713111186212121491312.5512
181066117171710152910.004
197242410121919141131214.0919
206121244232322341912.0010
2192121151713131785713.2715
221221223312421239.363
2321132477223222410.555
24142222205101032215813.7317
Table 5. Distribution and classification of the relative tectonic activity (RTA) index in the study area.
BasinsHIHI ClassVfVf ClassBlBwBsBs ClassAverageRTA Class
10.1530.4515.33.161.6832.332
20.4220.4918.282.832.9332.002
30.3330.2318.124.441.8332.332
40.420.84210.264.422.3232.332
50.2630.9725.382.791.9332.672
60.2931.3138.363.852.1733.003
7-00.4414.561.622.8131.331
8-00.8429.112.024.5111.001
90.1430.4114.942.092.3632.332
100.1930.3513.852.131.8132.332
110.2730.9429.272.693.4522.332
120.3131.0239.043.052.9633.003
13-00.47111.413.013.7921.001
140.421.2234.32.161.9932.673
150.0430.413.441.62.1532.332
160.4820.9227.081.724.1211.672
170.0931.2335.91.135.2212.332
18-00.8325.311.553.4321.331
19-01.2236.191.873.3121.672
20-01.2935.451.493.6621.672
21-01.0932.821.262.2432.002
22-00.4611.50.53.0021.001
23-00.8923.641.163.1421.331
240.1831.2731.650.612.7033.003
Table 6. Correlation Matrix of Spearman’s Rank for the applied distinct spatial models. * and ** indicate statistical significance at the 0.05 and 0.01 levels, respectively (two-tailed).
Spatial ModelMorphometric Compound Rank (CR)Relative Tectonic Activity (RTA)RUSLE Mean Soil Loss
Morphometric Compound Rank (CR)10000.612 *0.785 **
Relative Tectonic Activity (RTA)0.612 *10000.589 *
RUSLE Soil Loss Model 0.785 **0.589 *1000
Disclaimer/Publisher’s Note: The statements, opinions and data contained in all publications are solely those of the individual author(s) and contributor(s) and not of MDPI and/or the editor(s). MDPI and/or the editor(s) disclaim responsibility for any injury to people or property resulting from any ideas, methods, instructions or products referred to in the content.