Review

Understanding Pedestrian–Vehicle Conflicts at Signalized Intersections: A Structured Review and Conceptual Framework for Right-Turning Interactions in Sustainable Urban Mobility

Department of Transport Infrastructure and Water Resources Engineering, Széchenyi István University, Egyetem tér 1, 9026 Győr, Hungary
*
Author to whom correspondence should be addressed.
Sustainability 2026, 18(12), 6133; https://doi.org/10.3390/su18126133
Submission received: 7 May 2026 / Revised: 2 June 2026 / Accepted: 7 June 2026 / Published: 15 June 2026
(This article belongs to the Special Issue Sustainable Urban Mobility: Road Safety and Traffic Engineering)

Abstract

Pedestrian safety at signalized intersections is a key component of sustainable urban mobility, as safer walking environments support active transportation, reduce crash risk, and improve the inclusiveness of urban transport systems. This study presents a structured review of pedestrian–vehicle conflicts based on a systematic PRISMA-guided literature search, synthesizing 60 studies with emphasis on operational conditions, behavioral factors, infrastructural characteristics, and surrogate safety measures. The review examines the application of surrogate safety measures (SSMs), including Time-to-Collision (TTC), Post-Encroachment Time (PET), Pedestrian Path Deviation (PPD), and Deceleration-to-Safety Time (DST). The findings reveal significant variability in threshold definitions and methodological approaches, which limits the comparability and transferability of results across different traffic contexts. Building on this synthesis, the paper proposes an integrated conceptual framework linking behavioral, operational, and infrastructural determinants to conflict occurrence and severity. The analysis shows that existing studies often treat these factors in isolation, reducing the generalizability of current models. Overall, this review identifies key methodological inconsistencies in surrogate safety indicators and emphasizes the need for standardized yet context-sensitive thresholds and locally validated conflict models to improve the comparability and transferability of pedestrian–vehicle conflict assessments.

1. Introduction

Growing traffic volumes substantially increase the risk of pedestrian–vehicle conflicts at signalized intersections, particularly during turning movements, which calls for improved pedestrian safety measures [1]. Such interactions often lead to safety risks, operational inefficiencies, and delays affecting both pedestrians and vehicles. These conflicts are frequently associated with roadway design limitations, inadequate traffic management, and unsafe pedestrian crossing behaviors [2]. Recent studies have therefore explored strategies to better balance pedestrian and vehicular movements, including the implementation of exclusive right-turn phases and improved signal control strategies [3,4,5].
Road traffic crashes remain a major global public health concern, causing substantial mortality and non-fatal injuries worldwide [6]. According to the World Health Organization’s Global Status Report on Road Safety 2023, road traffic crashes cause approximately 1.19 million deaths annually and 20–50 million non-fatal injuries worldwide [7]. As a result, improving pedestrian safety has become an important priority in traffic engineering and urban transportation planning. In recent years, proactive safety assessment based on surrogate safety measures (SSMs) has gained increasing attention as an alternative to traditional crash-based analysis. Indicators such as Post-Encroachment Time (PET), Time-to-Collision (TTC), and Pedestrian Path Deviation (PPD) allow researchers to evaluate near-conflict interactions between pedestrians and vehicles before actual crashes occur [8,9,10,11]. These indicators have been widely used to examine the behavioral, operational, and geometric factors influencing pedestrian–vehicle conflicts at intersections.
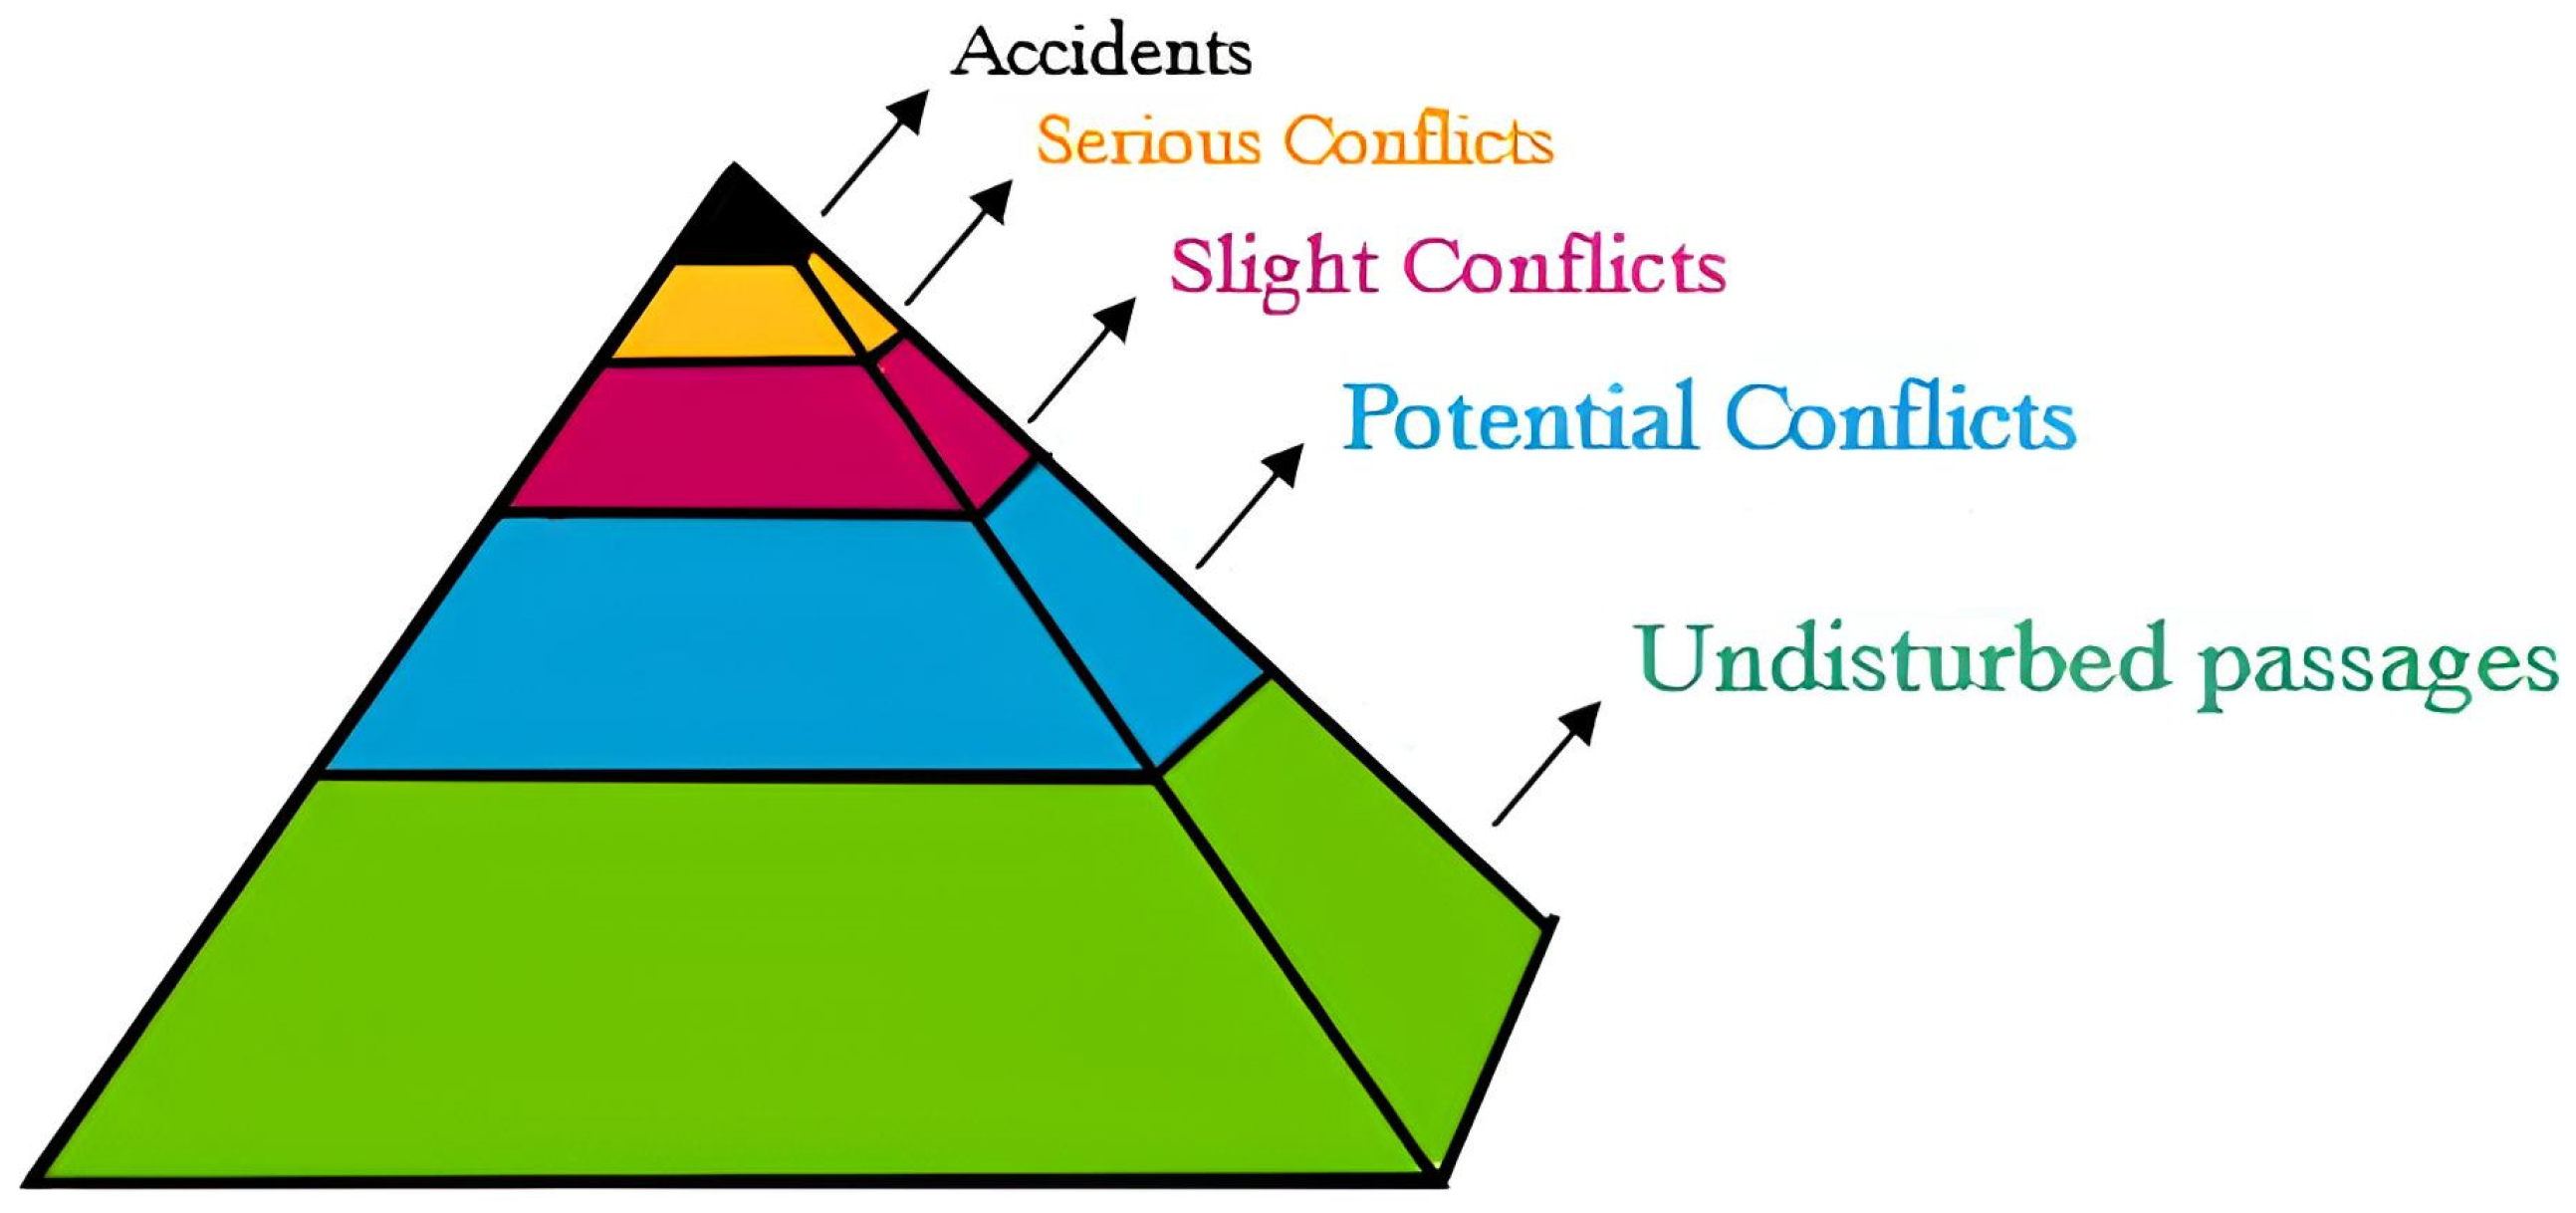
Traffic conflicts can be classified by severity into potential, slight, and serious. Potential conflicts occur when road users’ paths intersect, but the interaction remains smooth and controlled. Slight conflicts involve observable avoidance behavior, while serious conflicts occur when evasive action is delayed or insufficient, increasing the risk of a crash (Figure 1) [10].
A growing body of literature has examined pedestrian–vehicle interactions at signalized intersections. However, existing studies often focus on isolated indicators or specific methodological approaches, limiting a comprehensive understanding of conflict mechanisms. Therefore, a systematic synthesis of existing evidence is required to identify key determinants and methodological inconsistencies.
This review synthesizes recent research on pedestrian–vehicle conflicts at signalized intersections, with a specific focus on interactions involving right-turning vehicles. The article consolidates evidence regarding the determinants, measures, and analytical methods used to examine these conflicts. First, it identifies the principal behavioral, operational, and geometric factors contributing to pedestrian–vehicle conflicts. Second, it compares commonly used surrogate safety measures, discussing their distinctions and applications. Third, the review evaluates analytical methods employed in previous research, including statistical and simulation-based approaches. Finally, it highlights key research gaps and proposes directions for future studies.

2. Literature Search Methodology

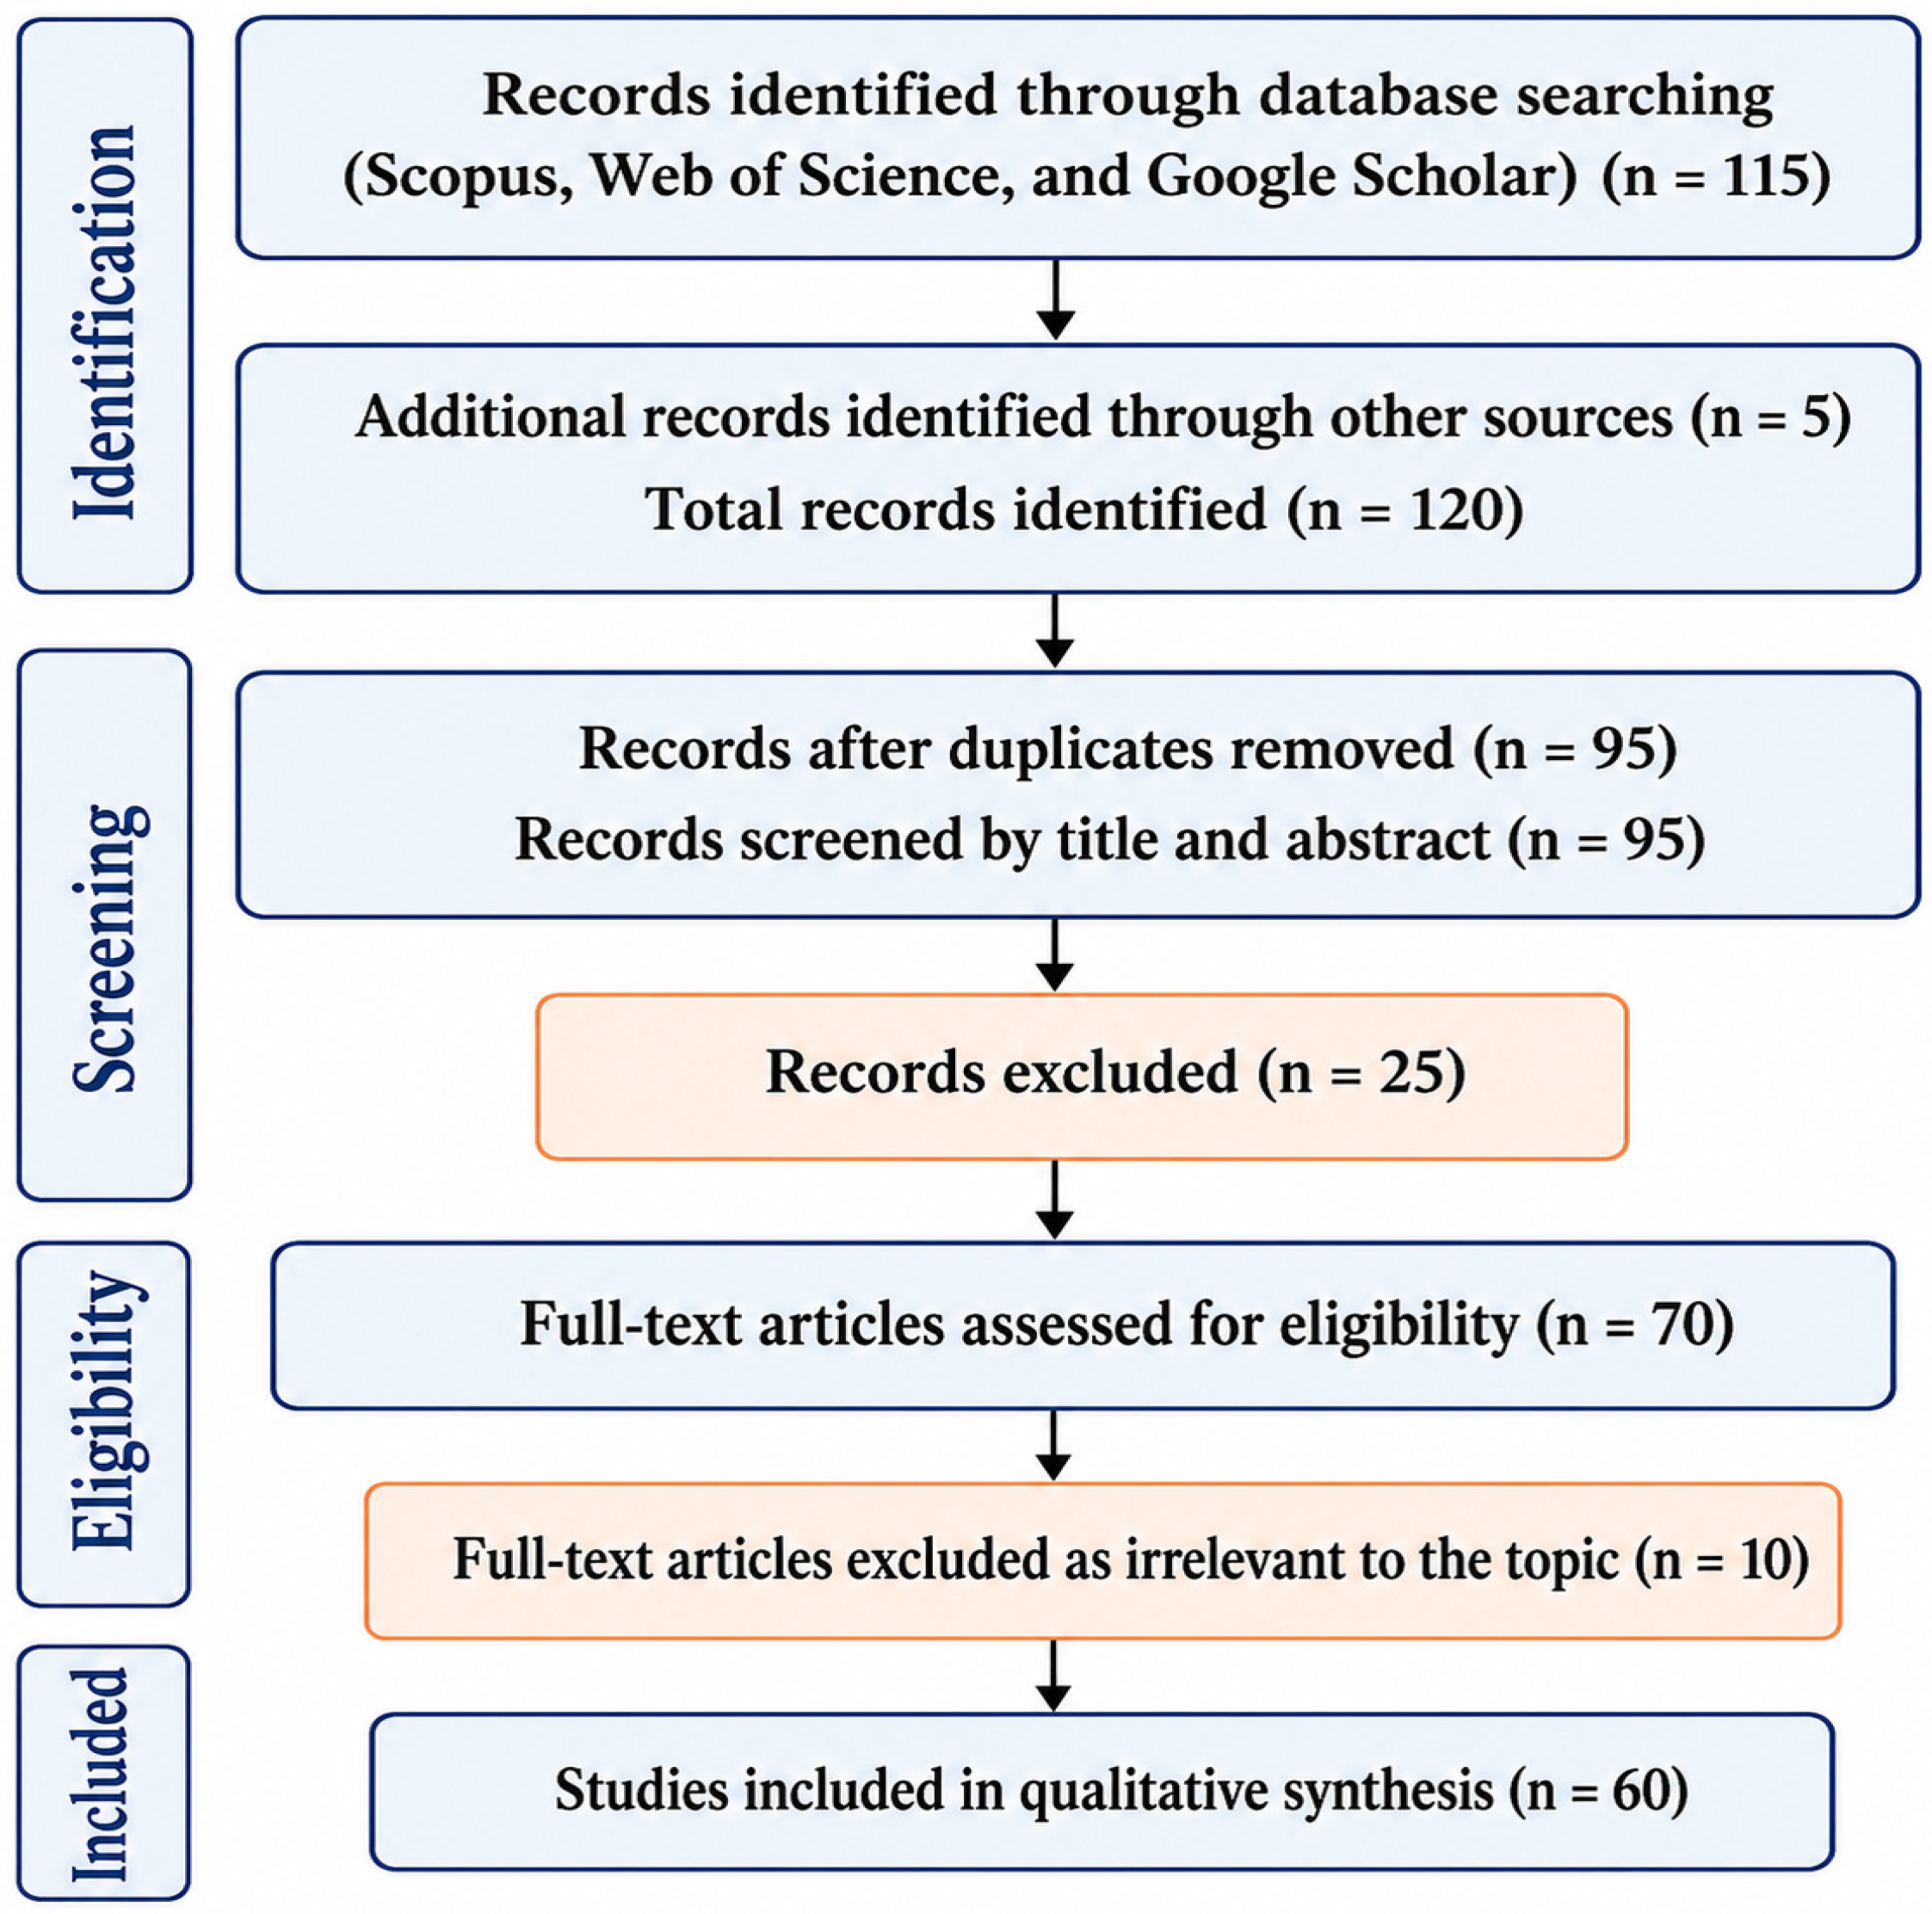
This review followed a PRISMA-guided structured search strategy. Searches were conducted in Scopus, Web of Science, and Google Scholar for studies published between 2000 and 2026. The final search was conducted in April 2026. At that time, the search retrieved 79 records from Scopus, 12 from Web of Science, and 24 from Google Scholar, for a total of 115 records identified through database searching. In addition, 5 records were identified through citation searching, bringing the total to 120 before duplicate removal. The exact search string used in Scopus and Web of Science was: pedestrian* AND (“right-turn*” OR “right-turning vehicle*” OR “turning vehicle*”) AND (“signalized intersection*” OR intersection* OR crosswalk*) AND (“traffic conflict*” OR “surrogate safety measure*” OR TTC OR PET OR PPD OR DST). For Google Scholar, simplified combinations of the same terms were used. Studies were included if they examined pedestrian–vehicle or vulnerable road user conflicts at intersections using conflict analysis, surrogate safety measures, statistical modeling, behavioral analysis, or simulation. Studies were excluded if they focused only on highways, mid-block crossings, vehicle–vehicle conflicts, non-peer-reviewed sources, or unavailable full texts. Duplicate records were removed through manual scanning to identify entries with minor differences in titles or metadata. After duplicates were removed, 95 records were screened by title and abstract. Twenty-five records were excluded as irrelevant. Seventy full-text articles were then assessed for eligibility. Screening was conducted by one reviewer, and uncertain cases were resolved through discussion. Ten full-text articles were excluded because they were not directly related to pedestrian–vehicle conflicts at intersections, did not use conflict-based or surrogate safety analysis, or lacked sufficient methodological detail. Finally, 60 studies were included in the qualitative synthesis. The study selection process is summarized in Figure 2. A basic methodological appraisal was conducted to assess the reliability and relevance of the included studies. The appraisal considered whether each study clearly reported its study context, data source, conflict definition, surrogate safety indicators, threshold justification, and model calibration or validation, where applicable. This appraisal was used to support qualitative synthesis rather than to exclude studies.
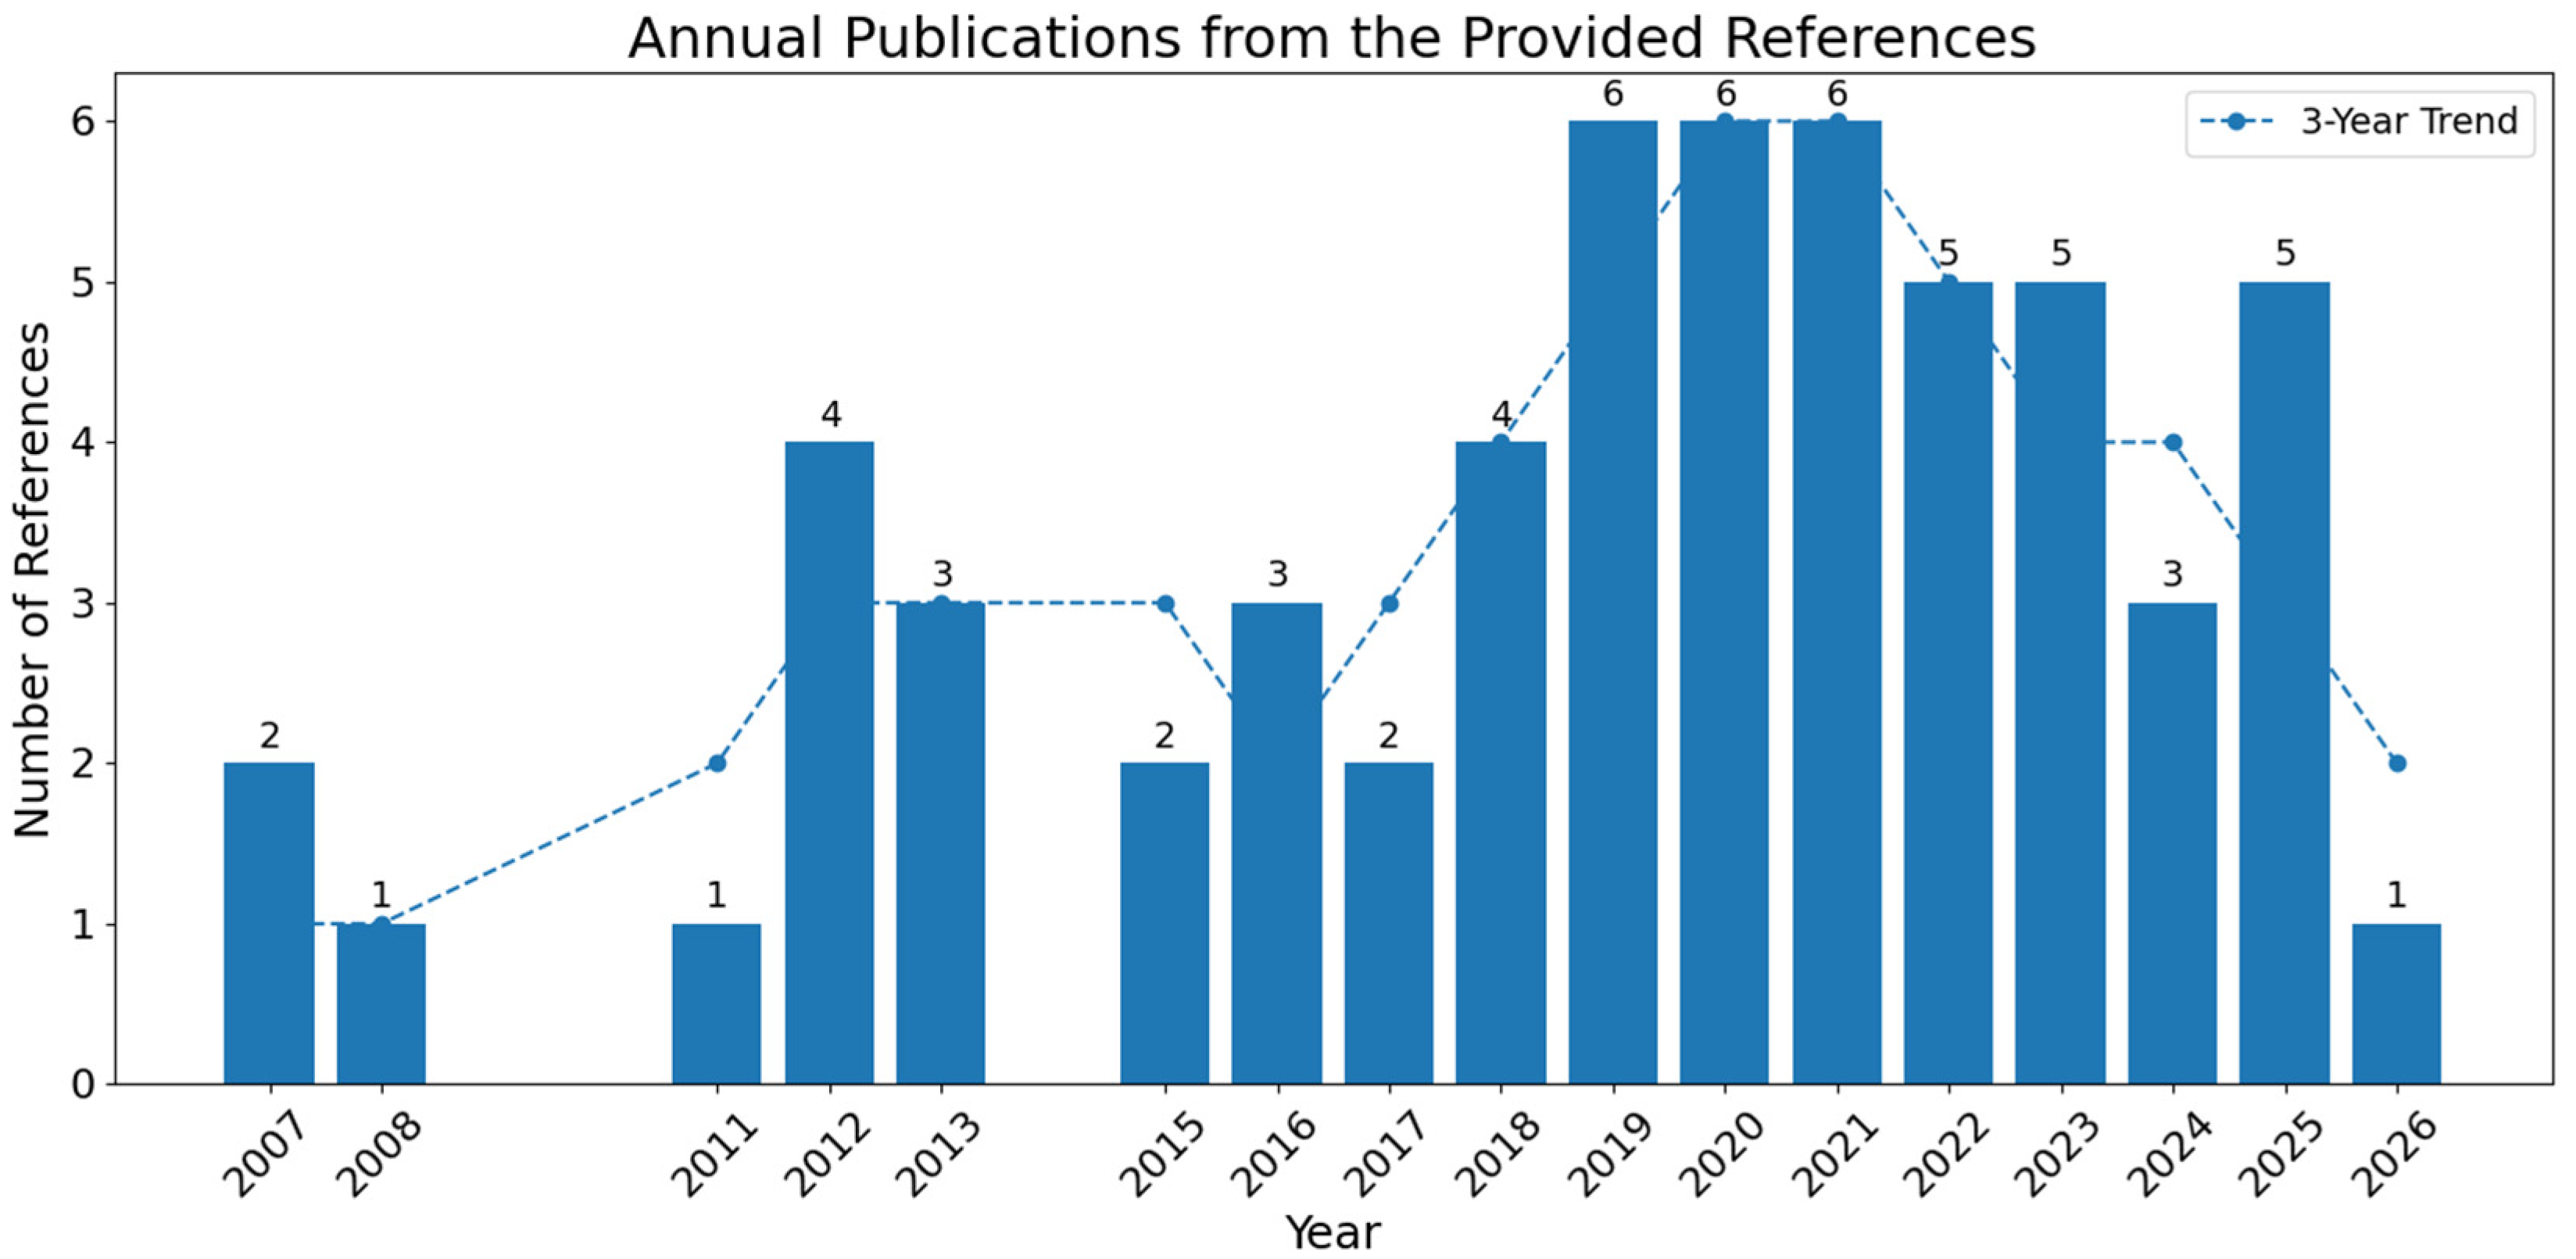
The distribution of studies over time indicates a clear increase in research activity after 2015, with a noticeable peak between 2019 and 2026. This trend indicates growing interest in pedestrian safety and conflict analysis, particularly in light of advances in simulation techniques and data-driven approaches. Figure 3 presents the annual distribution of the studies included in this review.
The trend depicted in Figure 3 reflects both increased academic interest and a methodological shift toward data-driven and simulation-based approaches after 2019. This transition indicates that recent studies are utilizing advanced computational tools, which can enhance the accuracy of conflict detection but also present new challenges regarding model validation and data quality. Therefore, the lower number of studies in 2026 should not be interpreted as a decline in research activity, because 2026 represents only a partial publication year.
This trend demonstrates that the analysis of pedestrian–vehicle conflicts, especially those involving right-turning vehicles at signalized intersections, has become a well-established and rapidly expanding research area. The rising number of studies also signifies the broader adoption of surrogate safety measures and advanced modeling techniques in recent years.

3. Conceptual Framework

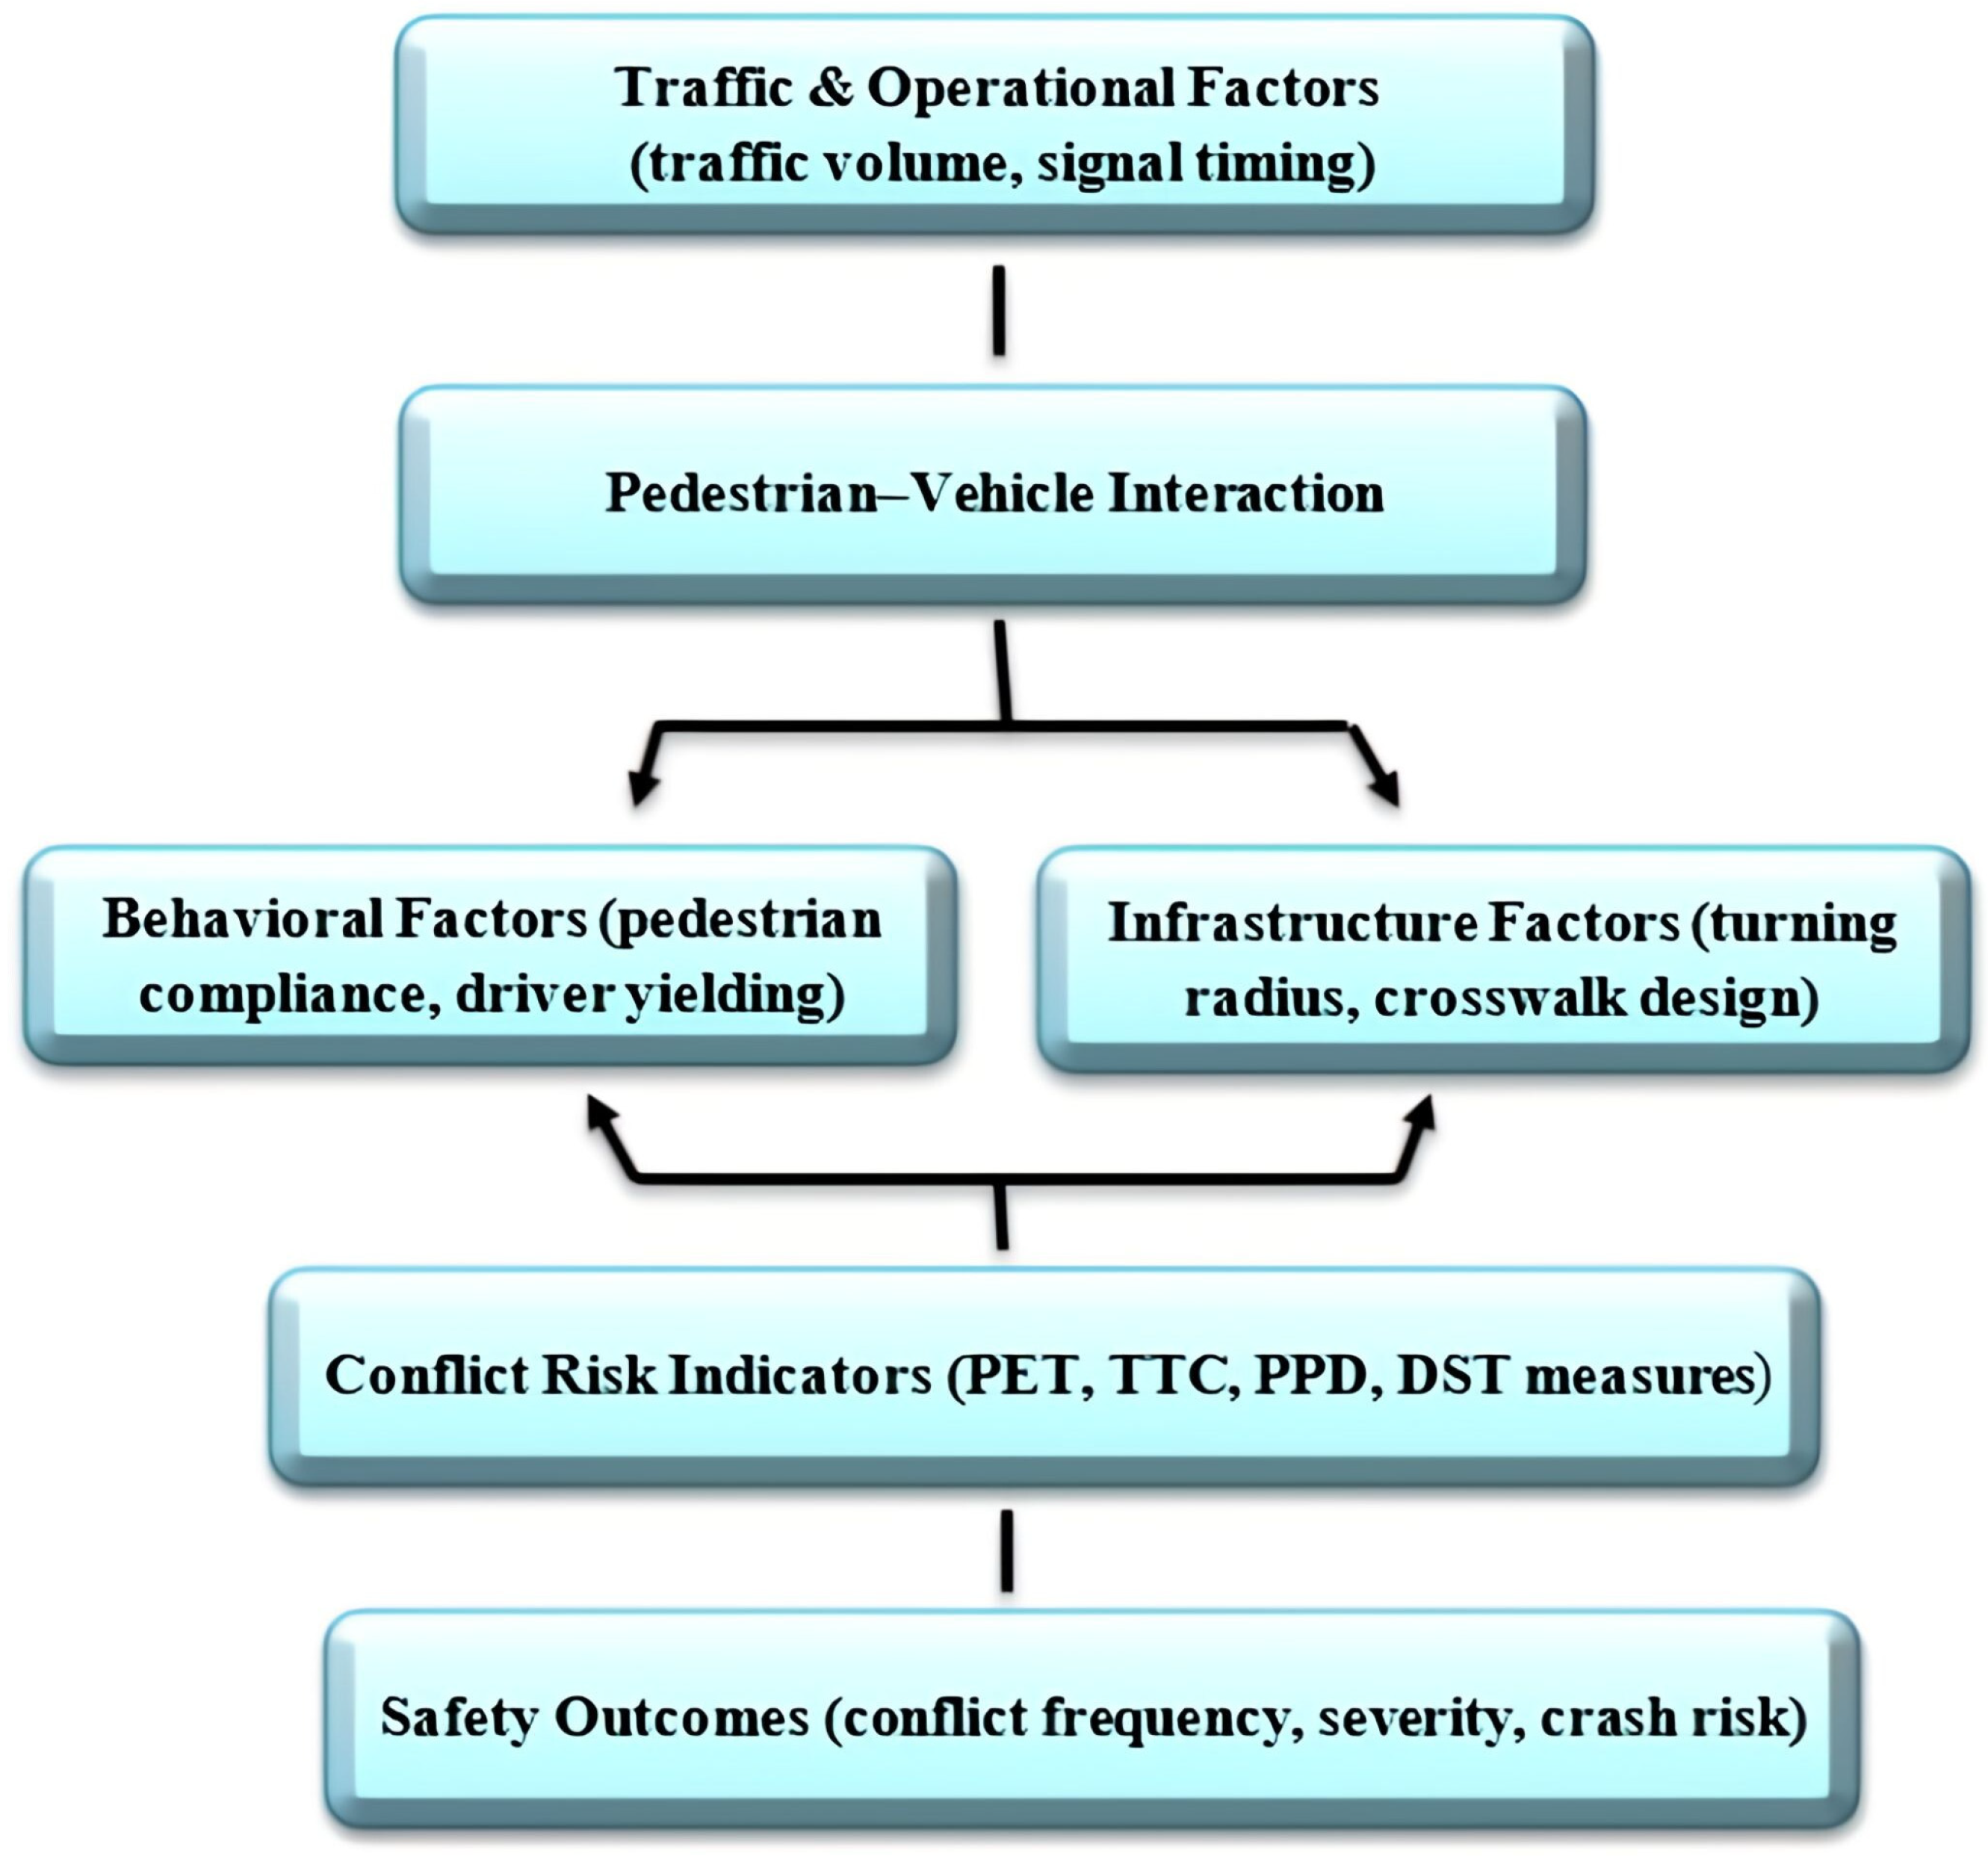
This conceptual framework outlines the core dimensions influencing pedestrian–vehicle conflicts at signalized intersections. It identifies the dynamic interplay between operational, behavioral, and infrastructural factors and connects these to safety outcomes assessed through advanced analytical and modeling tools.
This framework provides a foundation for interpreting empirical findings in the following literature review and clarifies how diverse methodological approaches contribute to understanding the mechanisms of pedestrian–vehicle conflict. To the authors’ knowledge, relatively few reviews have explicitly organized behavioral, operational, infrastructural, and surrogate-safety dimensions within a unified structure for pedestrian interactions with right-turning vehicles at signalized intersections. Therefore, the proposed framework is presented as a synthesis-oriented structure rather than as a claim of complete novelty, as illustrated in Figure 4.
The framework assumes that operational conditions, behavioral responses, and infrastructural characteristics jointly influence both conflict occurrence and conflict severity. Operational factors such as turning volume, pedestrian flow, signal timing, and vehicle speed affect exposure and available gaps. Behavioral factors, including pedestrian compliance, walking speed, path deviation, and driver yielding, determine how road users respond during interaction. Infrastructural factors such as crosswalk location, turning radius, visibility, and lane configuration shape trajectories and conflict points. These determinants are linked to surrogate safety measures such as PET, TTC, PPD, and DST, which provide measurable indicators of temporal, spatial, and evasive aspects of conflict risk.
Table 1 shows the most important surrogate safety measures used in pedestrian–vehicle conflict analysis.

4. Approaches Used to Analyze Pedestrian–Vehicle Conflicts

4.1. Behavioral and Operational Determinants in Empirical Studies

Recent studies have examined pedestrian service quality and safety using complementary analytical approaches that combine objective infrastructure characteristics with user perceptions [12,13,14,15]. While level-of-service frameworks primarily emphasize physical design and safety-related factors, perception-based models extend this evaluation by incorporating pedestrian experience and perceived comfort. This indicates a shift toward more user-centered assessments of pedestrian environments.
In parallel, regression-based analyses have been used to identify the influence of intersection characteristics on accident occurrence. For example, Mansell et al. employed cross-sectional regression models to examine how geometric and operational features contribute to right-turn-related accidents [16]. Taken together, these findings suggest that pedestrian safety cannot be adequately explained by either physical design or user perception alone but rather requires an integrated approach that captures both measurable infrastructure conditions and behavioral responses.
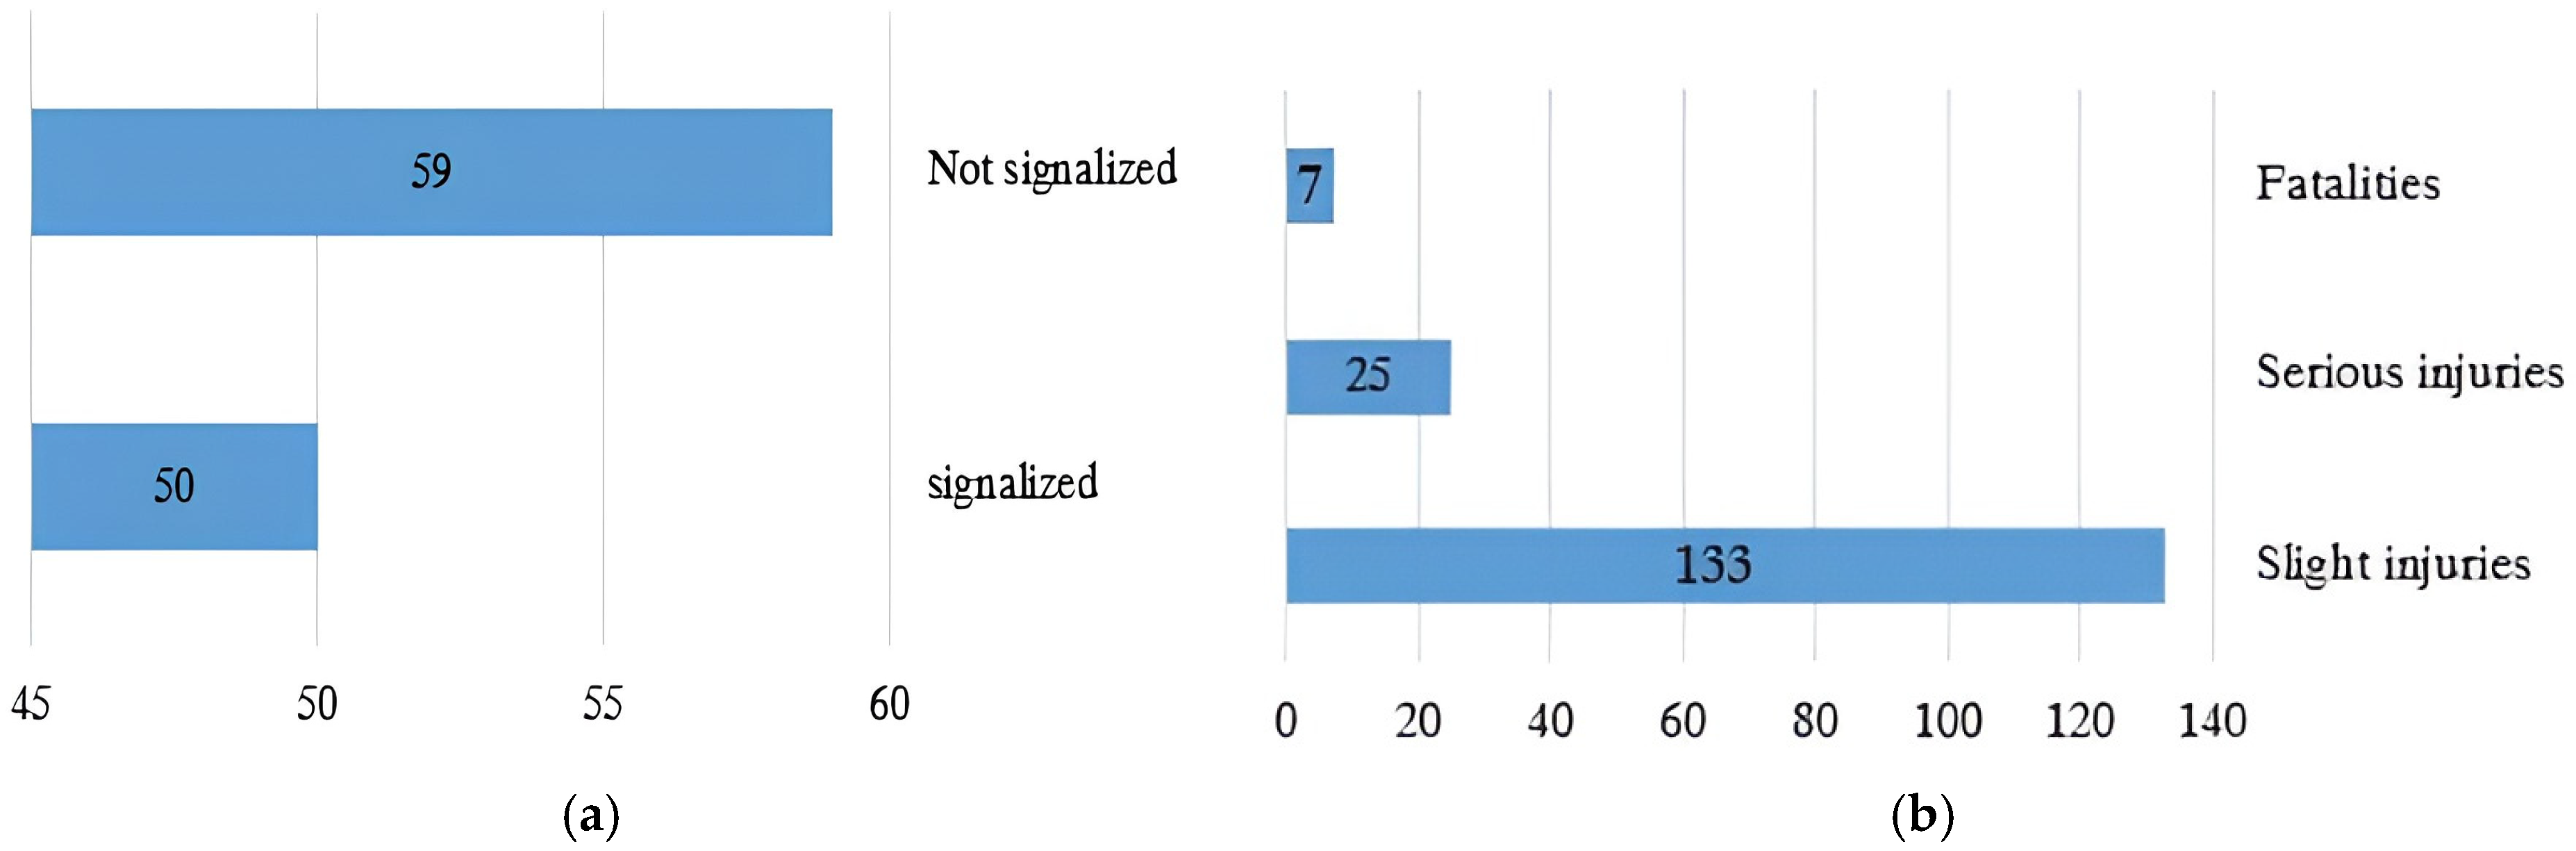
Locations with a higher likelihood of pedestrian accidents have also been identified using empirical safety evaluations. In order to identify areas where pedestrian accidents are more likely to occur, Oskarbski et al. conducted traffic safety evaluations at signalized crossings using conflict detection techniques [17]. Figure 5 shows that 109 pedestrian collisions occurred, resulting in 133 slight injuries, 25 serious injuries, and 7 fatalities. The number of injuries exceeds the number of collisions because a single collision may involve more than one injured pedestrian. Although this case does not specifically isolate right-turning movements, it illustrates how intersection control type influences pedestrian safety outcomes and provides contextual evidence for the importance of signalized crossing environments.
Empirical studies consistently show that pedestrian–vehicle conflicts at signalized intersections are influenced by a combination of behavioral, operational, and geometric factors rather than a single dominant variable. Traffic demand variables, including pedestrian volume, vehicle volume, turning movements, and pedestrian delay, have been widely identified as important predictors of conflict occurrence and pedestrian service conditions [18,19]. In addition, several studies have demonstrated that vehicle speed and intersection characteristics significantly affect both pedestrian behavior and conflict severity [19,20]. For example, higher vehicle speeds have been associated with increased pedestrian stress and reduced walking stability, indicating a strong relationship between speed and perceived safety [20].
However, the relative importance of these factors varies across studies. While some research emphasizes traffic demand and pedestrian delay as the primary determinants of conflict occurrence [18], other studies highlight visibility conditions and driver behavior—such as gap acceptance and yielding decisions—as more critical contributors to safety outcomes [21]. This variation suggests that pedestrian–vehicle conflicts are highly context-dependent and influenced by local traffic and environmental conditions.
Behavioral factors further complicate this relationship. Pedestrian crossing compliance, walking speed, and path deviation have been identified as key variables affecting interaction dynamics. In particular, studies using pedestrian path deviation (PPD) indicate that deviations from the intended crossing path are associated with a higher probability of conflict [22,23]. Pedestrian characteristics may also influence conflict mechanisms. Elderly pedestrians often have lower walking speeds and longer reaction times, while children may show less predictable crossing behavior and limited risk perception. However, most reviewed studies treat pedestrians as a homogeneous group. Future research should therefore examine differences across age groups and mobility abilities. At the same time, driver behavior, especially under reduced visibility conditions, plays a decisive role in determining whether a potential interaction escalates into a serious conflict [21].
Infrastructure design and traffic control strategies also contribute to the mechanisms of conflict. Studies evaluating right-turn treatments and signal control strategies have shown that measures such as exclusive right-turn phases and improved intersection design can reduce conflict exposure [24]. Similarly, research on cyclist–vehicle interactions suggests that signal timing and pavement markings influence road user positioning and behavior during conflict situations [25].
While a large number of studies have examined pedestrian–vehicle conflicts at signalized intersections, their findings are not entirely consistent. Empirical studies based on field observations tend to emphasize the role of traffic demand variables—such as pedestrian and vehicle volumes and turning movements—as primary determinants of conflict frequency. In contrast, simulation-based studies often highlight the importance of control strategies and geometric configurations, suggesting that infrastructure design and signal timing play a more decisive role. Furthermore, trajectory-based analyses using high-resolution data place greater emphasis on behavioral factors, such as pedestrian gap acceptance and driver yielding behavior. These differences indicate that the relative importance of conflict determinants depends strongly on the methodological approach and data source used.
Overall, the reviewed studies show that conflict determinants vary according to the method and data source used. Field studies mainly emphasize pedestrian behavior, driver yielding, and traffic exposure, while simulation studies focus more on signal timing, right-turn control, and geometric design. These differences can be explained by variations in data resolution, site geometry, sample size, traffic composition, and local driving culture. Statistical and machine-learning models improve prediction but often require large datasets and may reduce interpretability. Therefore, pedestrian–vehicle conflicts should be understood as the combined result of behavioral, operational, and infrastructural factors rather than as the effect of a single variable.

4.2. Surrogate Safety Measures Used in Conflict Analysis

Surrogate Safety Measures (SSMs) have been widely adopted to assess pedestrian–vehicle conflicts at signalized intersections, particularly in situations where crash data are limited or unavailable. Commonly used indicators include Post-Encroachment Time (PET), Time-to-Collision (TTC), Pedestrian Path Deviation (PPD), and Deceleration-to-Safety Time (DST), each capturing different dimensions of conflict dynamics [23,26].
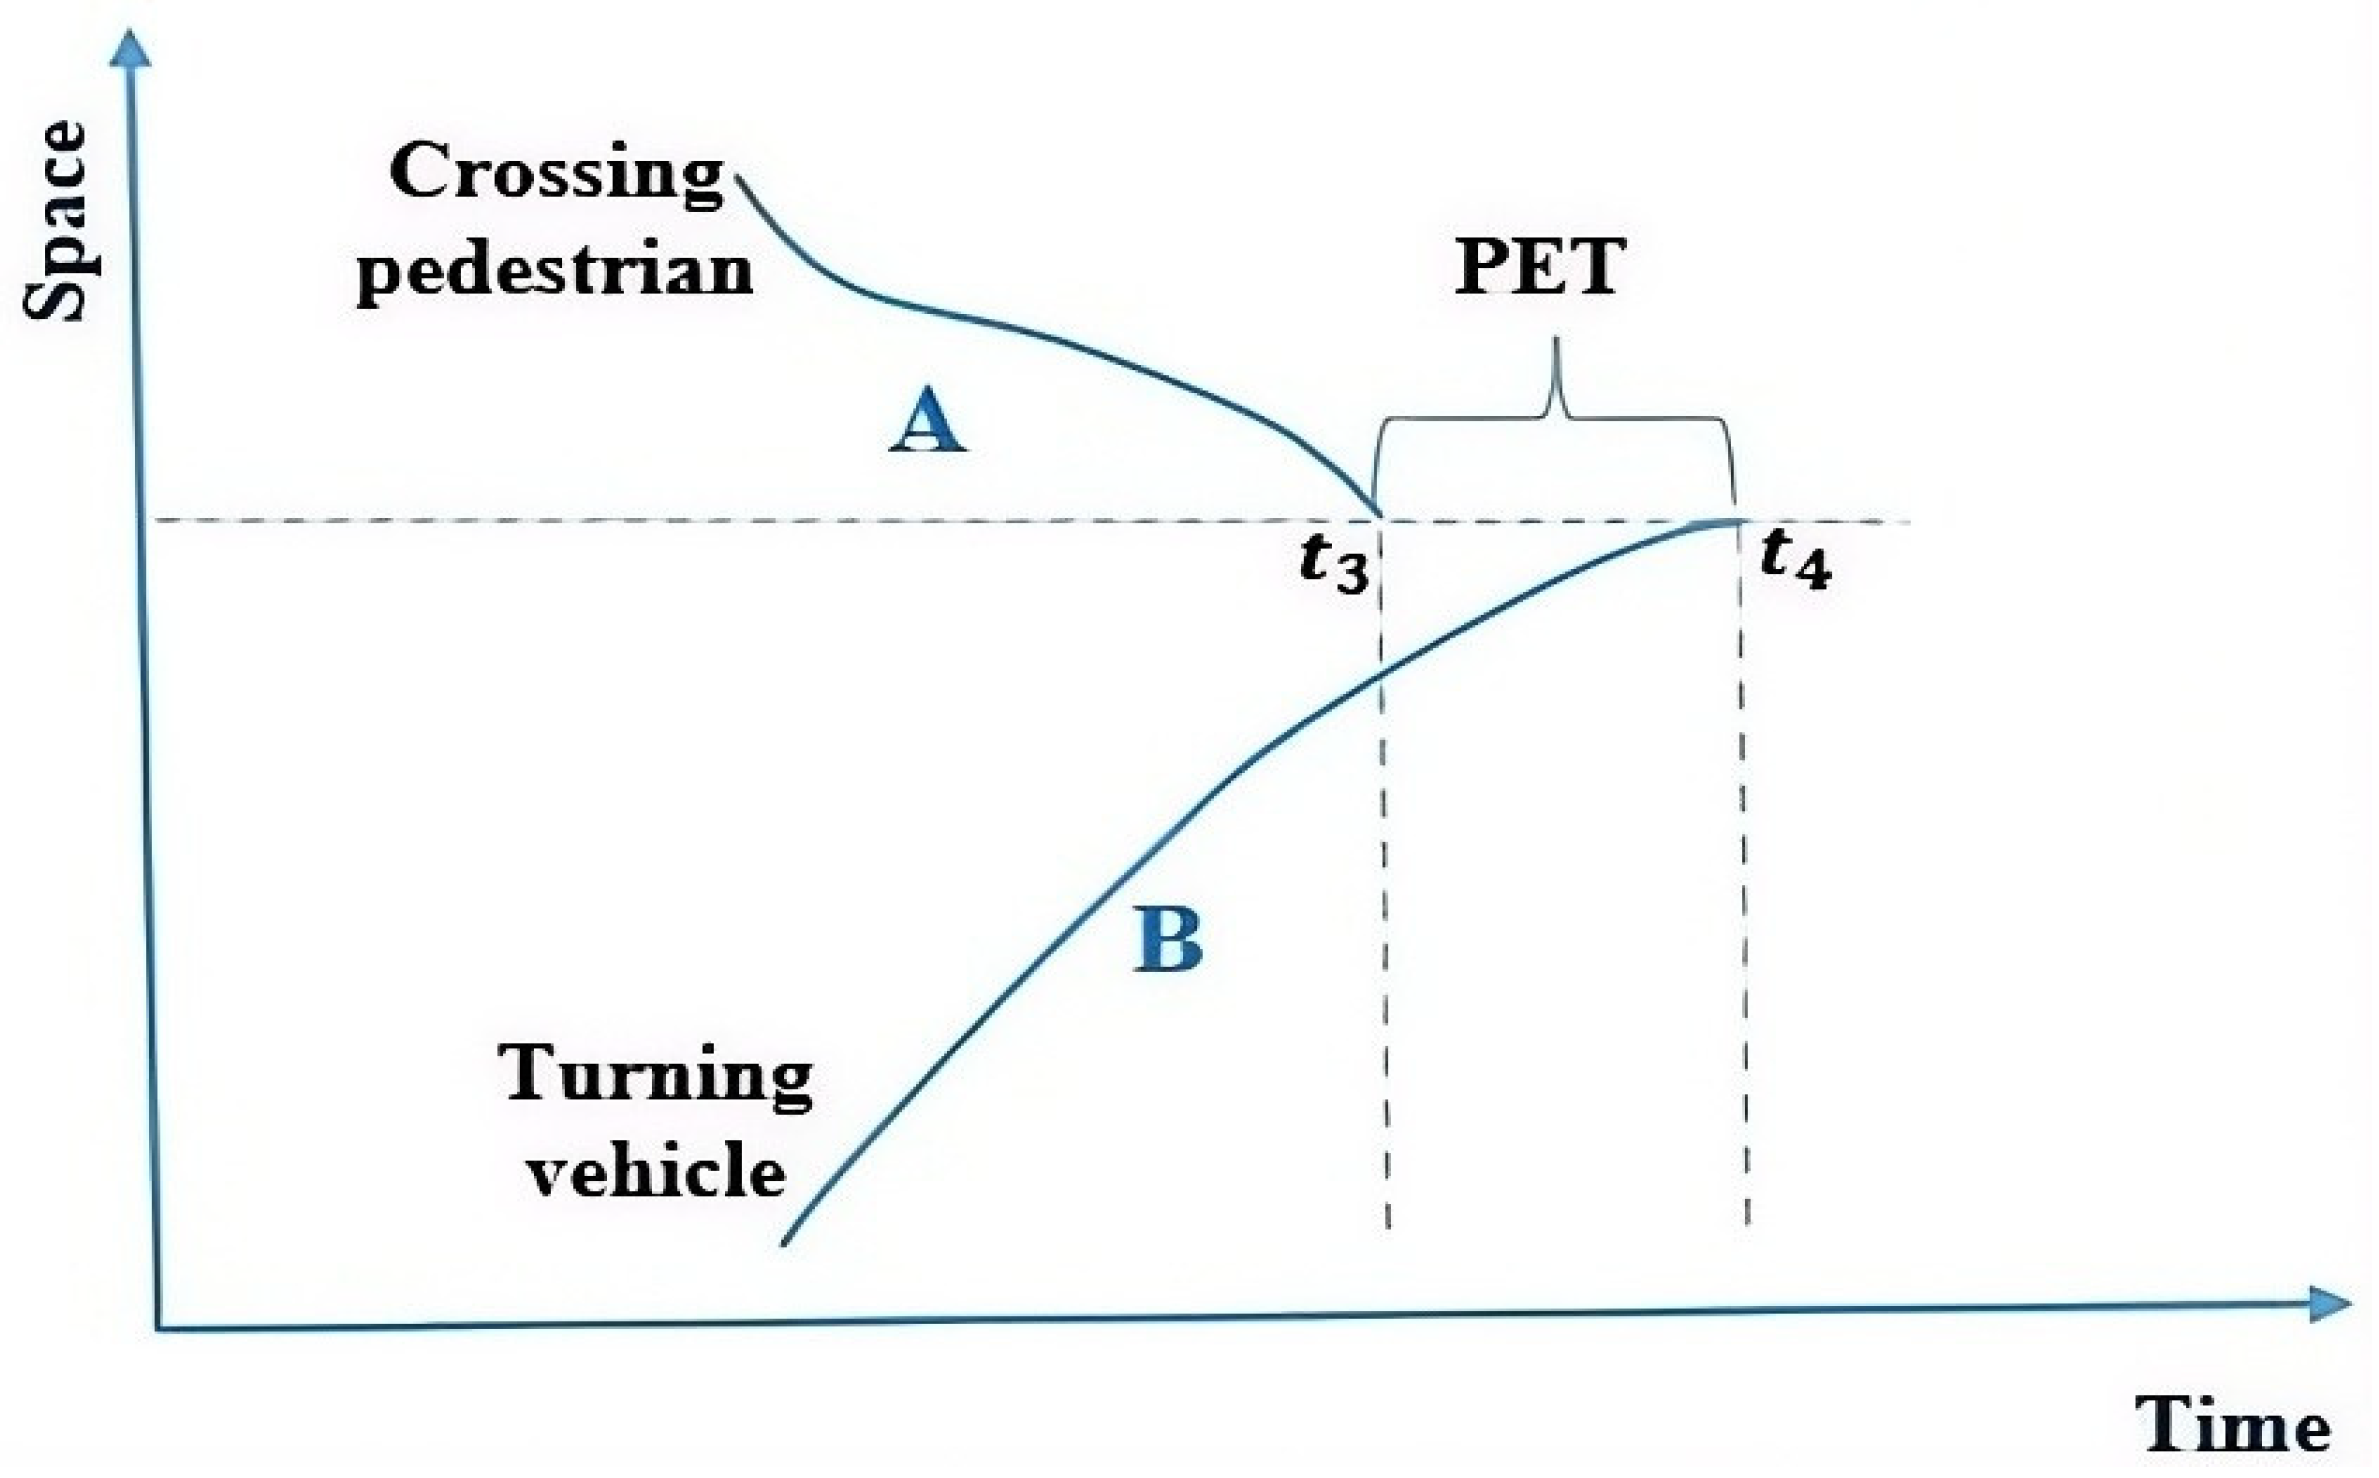
Among these indicators, PET is one of the most frequently used measures to evaluate pedestrian–vehicle conflicts. PET is defined as the time gap between the moment the first road user leaves the conflict point and the moment the second road user arrives at the same conflict point. As illustrated in Figure 6, the trajectories of the crossing pedestrian and the turning vehicle can be represented by curves A and B in a time–space diagram [1]. The PET value can be calculated as:
P E T = t 4 t 3
where t 3 represents the encroachment end time when the pedestrian leaves the conflict point, and t 4 represents the arrival time of the turning vehicle at that same location.
Figure 6 illustrates the temporal relationship between the pedestrian and vehicle trajectories, highlighting the time gap that determines the potential severity of the interaction.
Beyond PET, several studies have proposed additional time-based indicators to better capture conflict dynamics. Kumar et al. expanded the SSM framework by introducing five indicators—PET, TTV, DSTped, TTA, and DSTveh—to evaluate how demographic and behavioral characteristics influence conflict risk [27].
Time-based indicators have also been integrated into statistical safety models. Essa and Sayed developed Safety Performance Functions (SPFs) for signalized intersections at the signal cycle level, relating rear-end conflicts to traffic volume, queue length, shock wave characteristics, and vehicle composition. In this context, the Time-to-Collision (TTC) indicator was used to quantify the temporal proximity between interacting vehicles [26].
For pedestrian–vehicle conflicts at intersections, TTC should be interpreted with respect to a shared conflict point rather than a vehicle-following situation. In this context, TTC represents the expected time until a pedestrian and a turning vehicle would reach a collision or conflict point if they continued along their current trajectories and speeds. This conflict-point-based interpretation is more appropriate for intersecting pedestrian–vehicle paths than a car-following formulation. Because TTC formulations vary depending on trajectory assumptions and conflict geometry, this review does not adopt a single universal TTC equation. Instead, it discusses TTC as a surrogate indicator whose interpretation and threshold selection should be adapted to the specific pedestrian–vehicle interaction context.
Recent studies have also integrated SSMs with advanced analytical approaches, including machine learning and probabilistic modeling techniques. For example, simulation-based analyses combined with machine-learning models have been used to identify key factors influencing conflict risk, highlighting the importance of pedestrian behavior and vehicle dynamics in right-turn scenarios [4]. While these approaches improve predictive capabilities, they also introduce additional complexity and data requirements.
In general, the literature indicates that no single surrogate safety measure can fully capture the complexity of pedestrian–vehicle conflicts. A comprehensive assessment requires a combination of temporal, spatial, and behavioral indicators. Additionally, there is a critical need for standardized or context-sensitive threshold definitions to enhance the consistency and practical applicability of SSM-based safety analyses.

4.3. Statistical Modeling Approaches

Statistical modeling approaches have been widely used to quantify the relationship between pedestrian–vehicle conflicts and their contributing factors. Regression-based models, including Poisson and logistic regression, are among the most commonly applied techniques for analyzing conflict frequency and severity. For example, Poisson regression models have been used to examine the influence of geometric characteristics, such as turning radius and intersection layout, on conflict occurrence [28]. Similarly, logit-based models combined with propensity score techniques have been employed to assess the impact of explanatory variables on conflict severity [29].
In addition to traditional regression models, more advanced statistical approaches have been introduced to better capture variability in pedestrian behavior and interaction patterns. For instance, modeling techniques, including Gaussian models, have been applied to estimate pedestrian delay distributions using high-resolution traffic data [30]. These approaches provide greater flexibility in representing heterogeneous behaviors compared to conventional single-distribution models.
However, despite their widespread use, traditional statistical models exhibit several limitations when applied to pedestrian–vehicle conflict analysis. Many regression-based approaches assume independence among observations, which may not hold in real-world traffic environments where interactions are influenced by site-specific conditions and temporal dependencies. As a result, such models may oversimplify the complex and dynamic nature of pedestrian–vehicle interactions. Furthermore, conventional models often rely on aggregated variables and may fail to capture micro-level behavioral dynamics, such as real-time decision-making, gap acceptance, and interaction timing between pedestrians and drivers. This limitation limits their ability to accurately represent the mechanisms underlying conflict formation.
To address these challenges, recent studies have explored more advanced modeling frameworks, including hierarchical and Bayesian approaches. These methods allow for incorporating uncertainty and separating site-level and observation-level effects, providing more robust and transferable estimates in multi-site analyses. In particular, Bayesian hierarchical models have shown strong potential to improve the reliability of conflict-based safety assessments by accounting for heterogeneity across intersections. Nevertheless, the application of advanced statistical models often requires large datasets and careful model calibration, which may limit their practical implementation in data-scarce environments. Therefore, while advanced modeling approaches offer improved analytical capabilities, their adoption should be balanced with data availability and practical applicability. However, many Bayesian hierarchical applications in traffic conflict analysis have been developed mainly for vehicle-conflict or crash-estimation contexts. Their direct transfer to pedestrian–vehicle right-turn conflicts, therefore, requires caution and further empirical validation using pedestrian-specific datasets.
In summary, statistical modeling remains a valuable approach for understanding pedestrian–vehicle conflicts; however, its effectiveness relies on adequately addressing behavioral complexity, spatial variability, and data limitations. Future research should prioritize integrating traditional statistical models with emerging data-driven methods to improve both predictive accuracy and interpretability.

4.4. Simulation and Computational Approaches

Simulation-based approaches have become an essential tool for analyzing pedestrian–vehicle conflicts at signalized intersections, particularly due to their ability to model complex interactions under controlled conditions. Microscopic simulation models are widely used to examine how pedestrians and right-turning vehicles interact under varying traffic conditions, enabling the evaluation of alternative intersection designs and signal control strategies [1,3].
Several studies have demonstrated the usefulness of simulation in assessing operational and safety performance. For instance, simulation frameworks incorporating behavioral models have been used to analyze pedestrian–vehicle conflicts at crossings, while other studies have evaluated the impact of exclusive right-turn phases on delay and conflict reduction [1,3]. In addition, simulation tools such as VISSIM have been used to investigate how different crossing layouts and signal strategies affect pedestrian safety and traffic efficiency [2].
More advanced computational approaches have further extended the capabilities of simulation-based analysis. For example, probabilistic trajectory prediction models have been developed to identify real-time conflict risk with higher accuracy than traditional time-based indicators [8]. Similarly, simulation outputs have been integrated with machine-learning techniques to capture nonlinear relationships between behavioral, operational, and environmental factors affecting conflict risk [4].
In pedestrian–right-turn vehicle conflict analysis, microsimulation tools provide useful support for evaluating alternative designs and signal-control strategies; however, their outputs remain sensitive to how pedestrian and driver behaviors are represented. In particular, estimates derived from VISSIM- or SSAM-based analyses require careful calibration and validation against field-observed conditions [2]. Therefore, the reliability of simulation-based conflict estimates depends not only on the modeling platform, but also on input data quality, calibration procedures, and the representativeness of the study context.
Despite these advantages, simulation-based approaches have several important limitations. A key challenge lies in the reliance on behavioral assumptions embedded within simulation models. Pedestrian and driver behaviors are often simplified or calibrated using limited datasets, which may not fully represent real-world variability. As a result, simulation outcomes may differ from observed traffic conditions, particularly in environments with complex or unpredictable human behavior. In addition, the validity of simulation results depends heavily on the calibration and validation procedures used. Without adequate validation using field data, the reliability of simulated conflict estimates remains uncertain. This limitation is particularly critical when simulation results inform safety-related decisions or infrastructure design.
A further limitation is that simulation models may not sufficiently represent context-specific factors, including cultural differences in pedestrian behavior, enforcement practices, or local traffic norms. This limitation reduces the transferability of simulation results across various geographic regions and traffic environments. While simulation and computational approaches offer a robust framework for analyzing pedestrian–vehicle interactions and evaluating alternative traffic management strategies, their effectiveness depends on the accuracy of behavioral assumptions and the availability of high-quality calibration data. Future research should aim to integrate simulation models with empirical observations and real-time data sources to enhance their realism, reliability, and practical applicability in traffic engineering.

4.5. Research Gaps and Methodological Limitations

Despite the growing body of research on pedestrian–vehicle conflicts at signalized intersections, several methodological limitations remain. A key issue is that many studies focus on isolated behavioral interactions without integrating pedestrian and driver behaviors within a unified analytical framework. For example, Sheykhfard et al. demonstrated that aggressive pedestrian behavior and delayed driver perception significantly reduce yielding probability [31]. However, such models typically incorporate only a limited set of variables, limiting their ability to capture the full complexity of real-world interactions.
This limitation reflects a broader methodological challenge in the literature, where interaction dynamics are often simplified and modeled independently rather than as interdependent processes. As a result, the combined effects of pedestrian behavior, driver response, and operational conditions remain insufficiently captured, potentially leading to biased or incomplete safety assessments.
Another critical constraint concerns the geographic concentration of existing studies. A large proportion of empirical research has been conducted in South and East Asia, where traffic conditions, pedestrian behavior, and regulatory environments differ significantly from those in other regions. Consequently, the transferability of surrogate safety thresholds and modeling outcomes across different contexts is limited. This raises concerns about the generalizability of commonly used indicators, such as TTC and PET, when applied outside their original study environments.
These challenges are further exacerbated by the widespread use of traditional regression-based models, which often assume independence among observations and fail to account for hierarchical data structures and site-specific variability. Such assumptions may not hold in real-world traffic environments, where interactions are influenced by location-specific characteristics and temporal dependencies. In contrast, hierarchical and Bayesian modeling approaches provide a more robust framework for conflict analysis by explicitly accounting for uncertainty and separating site-level and observation-level effects [32,33,34,35]. These models enable more flexible, context-sensitive estimation, improving the accuracy and transferability of safety assessments across multiple locations.
Overall, the literature indicates a clear need for integrated and probabilistic modeling approaches that better capture the dynamic and context-dependent nature of pedestrian–vehicle interactions. Future research should prioritize the development of unified frameworks that combine behavioral, operational, and infrastructural variables while also ensuring validation across diverse traffic environments [31,32,33,34,35].

5. Synthesis of Methods and Consolidated Research Gaps

Previous studies have used behavioral, statistical, machine-learning, trajectory-based, and simulation approaches to analyze pedestrian–vehicle conflicts [31,36,37,38,39,40]. However, these approaches differ in the type of determinants they capture and in their data requirements, assumptions, and transferability [41,42,43,44]. Table 2 provides a comparative synthesis of their strengths and limitations.
The primary research gaps include limited transferability of findings across locations, inadequate representation of pedestrian heterogeneity, absence of standardized SSM thresholds, and insufficient validation of simulation and machine-learning models with independent field data.
In addition, several studies have emphasized the need to connect conflict analysis with traffic management practice, including signal control, intersection geometry, visibility improvement, and pedestrian warning systems [45,46,47,48,49,50,51]. To compare threshold practices, Table 3 summarizes PET and TTC values reported in right-turn pedestrian–vehicle studies and closely related intersection conflict studies.
The table includes right-turn pedestrian–vehicle (Ped-veh, meaning conflicts between pedestrians and vehicles) studies and related intersection conflict studies, because PET and TTC thresholds are often transferred across turning-conflict contexts. Studies involving left-turn or vehicle–vehicle (Veh-veh, meaning conflicts between vehicles) conflicts were retained only for threshold comparison and are not interpreted as direct evidence for right-turn pedestrian–vehicle conflicts.
The variation in PET and TTC thresholds can be attributed to specific factors such as intersection geometry, signal phasing, pedestrian behavior, vehicle approach speed, data resolution, and the use of field or simulation data. Higher-speed locations may require more conservative TTC thresholds, while low-speed urban intersections may produce larger PET values without necessarily indicating severe conflicts. Therefore, threshold selection should consider both traffic context and trajectory extraction methods. The variability observed in Table 3 highlights a fundamental limitation in current conflict analysis approaches. Despite their widespread use, SSM applications reveal significant inconsistencies across studies. For example, PET thresholds reported in the literature range from approximately 1 s to 5 s, depending on the study context and methodology. Simulation-based studies often adopt lower threshold values, whereas field-based observations tend to apply higher thresholds [1,4,48,52]. Similarly, TTC thresholds vary considerably, with some studies defining critical conflicts at values below 1.5 s, while others adopt more conservative limits [53,55].
This variation reflects differences in data sources, traffic environments, and analytical assumptions. For instance, simulation models may not fully capture real-world behavioral variability, leading to differences in estimated conflict severity compared to field observations. In addition, variations in data resolution, such as video-based versus trajectory-based data, further contribute to inconsistencies in the SSM application.
Consequently, identical pedestrian–vehicle interactions may be classified inconsistently across studies due to varying threshold values. This lack of standardization restricts the comparability and transferability of findings and raises concerns about the reliability of surrogate safety indicators as universal measures of conflict severity.

6. Discussion and Recommendations

This paper reviewed and synthesized the existing literature on pedestrian–vehicle conflicts involving right-turning vehicles at signalized intersections, with the aim of identifying the main determinants of conflict occurrence, the analytical methods used to study these interactions, and the limitations of current approaches.
The review demonstrates that pedestrian–vehicle conflicts are influenced by the combined effects of operational traffic conditions, behavioral interactions between road users, and infrastructure design characteristics. Turning vehicle speeds, traffic volumes, and signal timing factors are repeatedly found to be important operational predictors of conflict exposure. The results of pedestrian–vehicle interactions are also greatly influenced by behavioral factors, including group crossing dynamics, driver yielding behavior, and pedestrian compliance with signal indications. Intersection geometry, crosswalk placement, and visibility conditions also affect these dynamics by influencing both vehicle trajectories and pedestrian movement patterns.
The analysis further highlights the increasing use of surrogate safety measures, particularly time-to-collision (TTC) and post-encroachment time (PET), to assess near-collision scenarios at crossings. These indicators facilitate the investigation of potential safety hazards even in the absence of crash data. However, substantial variation in threshold settings and modeling techniques across studies limits the transferability and comparability of results in different traffic environments. A major limitation is the lack of standardization in defining conflict severity, which undermines the comparability of findings and underscores the need for unified evaluation frameworks. To balance standardization with context sensitivity, future research should implement a tiered threshold approach. A baseline PET/TTC range can serve as a basis for initial cross-study comparisons, while site-specific thresholds should be calibrated based on factors such as site type, vehicle speed, signal control, data resolution, and road–user pairing. For instance, high-speed, complex turning environments may require more conservative TTC thresholds, whereas low-speed urban intersections may require locally validated PET values. This approach would enhance comparability while accommodating local traffic conditions.
Several research gaps were identified. The adaptive behavior of pedestrians and drivers during interactions is not fully captured by current conflict models, which frequently rely on oversimplified behavioral assumptions. Furthermore, many studies are based on data gathered in certain geographic contexts, which raises concerns about the suitability of modeling frameworks and surrogate safety levels in other areas. Finally, although conflict-based safety analysis has advanced considerably in recent years, its integration into practical intersection design guidelines and signal control strategies remains limited.
The reviewed studies suggest that pedestrian–vehicle conflicts cannot be explained by a single dominant factor; rather, they emerge from the dynamic interaction of operational conditions, human behavior, and infrastructure design. However, most existing studies analyze these dimensions in isolation, which limits the ability to capture the full complexity of real-world interactions. This fragmentation highlights the need for integrative frameworks that combine behavioral, operational, and geometric variables within a unified analytical structure. Future studies may benefit from applying hierarchical or mixed-effects modeling approaches to account for spatial heterogeneity across sites and improve the transferability of surrogate safety measures.
This review has several limitations. First, the synthesis is qualitative and does not include a meta-analysis due to heterogeneity across study contexts, indicators, and threshold definitions. Second, although a basic methodological appraisal was conducted, no formal risk-of-bias assessment was performed. Third, the search was limited to selected databases and English-language publications, potentially introducing selection bias. These limitations should be considered when interpreting the findings.
In summary, this review offers a structured synthesis of current research on pedestrian–vehicle conflicts involving right-turning vehicles and identifies key methodological and conceptual challenges for future investigation. Advancing behavioral modeling, validating surrogate safety indicators across diverse traffic environments, and reinforcing the integration of conflict analysis with traffic engineering practice are essential directions for future research to enhance pedestrian safety at signalized intersections. Accordingly, future studies should adopt integrated, data-driven, and context-sensitive approaches to improve the reliability and applicability of conflict-based safety assessments in real-world traffic environments.

Author Contributions

Conceptualization, H.A. and E.M.; methodology, H.A.; validation, H.A. and E.M.; formal analysis, H.A.; investigation, H.A.; resources, H.A.; data curation, H.A.; writing—original draft preparation, H.A.; writing—review and editing, H.A. and E.M.; visualization, H.A.; supervision, E.M.; project administration, E.M.; All authors have read and agreed to the published version of the manuscript.

Funding

This research received no external funding.

Institutional Review Board Statement

Not applicable.

Informed Consent Statement

Not applicable.

Data Availability Statement

Data is available based on a request from the corresponding author.

Acknowledgments

During the preparation of this manuscript, the authors used ChatGPT-Open AI 5.5 and Grammarly for the purposes of improving the language of this research. The authors have reviewed and edited the output and take full responsibility for the content of this publication.

Conflicts of Interest

The authors declare no conflicts of interest.

References

  1. Chen, P.; Zeng, W.; Yu, G. Assessing right-turning vehicle pedestrian conflicts at intersections using an integrated microscopic simulation model. Accid. Anal. Prev. 2019, 129, 211–224. [Google Scholar] [CrossRef]
  2. Fu, C. Research on Organization and Optimization for Pedestrians Crossing Street Intersection in Cities Based on Vissim. In Proceedings of the 3rd International Conference on Judicial, Administrative and Humanitarian Problems of State Structures and Economic Subjects (JAHP 2018), Domodedovo, Russia, 1–4 April 2018. [Google Scholar] [CrossRef][Green Version]
  3. Su, Y.; Yao, D.; Zhang, Y.; Li, L.; Wei, Z. Vehicle/pedestrian conflict analysis and exclusive right-turn phase setting study. In Proceedings of the 2008 IEEE Intelligent Vehicles Symposium, Eindhoven, The Netherlands, 4–6 June 2008. [Google Scholar] [CrossRef]
  4. Feng, M.; Zhao, J.; Hou, C.; Nie, C.; Hou, J. Investigating the safety influence path of right-turn configurations on vehicle–pedestrian conflict risk at signalized intersections. Accid. Anal. Prev. 2025, 211, 107910. [Google Scholar] [CrossRef] [PubMed]
  5. Liang, S.; Zhao, T.; Zhao, J. Pedestrian–Vehicle Interaction Analysis Based on Concept of Dynamic Straight-Right Lane at Signalized Intersection. IEEE Trans. Intel. Transp. Syst. 2025, 26, 6017–6041. [Google Scholar] [CrossRef]
  6. Jamal, A.; Rahman, M.T.; Al-Ahmadi, H.M.; Mansoor, U. The dilemma of road safety in the eastern province of Saudi Arabia: Consequences and prevention strategies. Int. J. Environ. Res. Public Health 2020, 17, 157. [Google Scholar] [CrossRef]
  7. World Health Organization. New WHO Manual Aims to Strengthen Pedestrian Safety. Available online: https://www.who.int/news/item/03-05-2023-new-who-manual-aims-to-strengthen-pedestrian-safety (accessed on 3 May 2023).
  8. Li, P.; Guo, H.; Bao, S.; Kusari, A. A probabilistic framework for estimating the risk of pedestrian-vehicle conflicts at intersections. IEEE Trans. Intel. Transp. Syst. 2023, 24, 14111–14120. [Google Scholar] [CrossRef]
  9. Hydén, C. The Development of a Method for Traffic Safety Evaluation: The Swedish Traffic Conflicts Technique; Bulletin Lund Institute of Technology, Department of Traffic Planning and Engineering: Lund, Sweden, 1987; Available online: https://trid.trb.org/View/239059 (accessed on 6 June 2026).
  10. Kim, W.; Kim, G.J.; Lee, D. Estimating potential conflicts between right-turn-on-red vehicles and pedestrians at crosswalks. Int. J. Urban Sci. 2016, 20, 226–240. [Google Scholar] [CrossRef]
  11. Anarkooli, A.J.; Persaud, B.; Milligan, C.; Penner, J.; Saleem, T. Incorporating speed in a traffic conflict severity index to estimate left turn opposed crashes at signalized intersections. Transp. Res. Rec. 2021, 2675, 214–225. [Google Scholar] [CrossRef]
  12. Anciaes, P.R.; Jones, P. Estimating preferences for different types of pedestrian crossing facilities. Transp. Res. F-Traf. 2018, 52, 222–237. [Google Scholar] [CrossRef]
  13. Ujjwal, A.B.; Bandyopadhyaya, R. Development of pedestrian level of service assessment guidelines for mixed land use areas considering quality of service parameters. Transp. Dev. Econ. 2021, 7, 7. [Google Scholar] [CrossRef]
  14. Ahmed, T.; Moeinaddini, M.; Almoshaogeh, M.; Jamal, A.; Nawaz, I.; Alharbi, F. A new pedestrian crossing level of service (PCLOS) method for promoting safe pedestrian crossing in urban areas. Int. J. Environ. Res. Public Health 2021, 18, 8813. [Google Scholar] [CrossRef] [PubMed]
  15. Ujjwal, J.; Bandyopadhyaya, R. Development of Pedestrian Level of Service (PLOS) model and satisfaction perception rating models for pedestrian infrastructure for mixed land-use urban areas. Transportation 2023, 50, 355–381. [Google Scholar] [CrossRef]
  16. Mansell, R.; Persaud, B.; Milligan, C.; Pushka, A. Investigating factors that affect conflicts between bicyclists and right turning vehicles at signalized intersections. Traffic Saf. Res. 2024, 6, e000040. [Google Scholar] [CrossRef]
  17. Oskarbski, J.; Guminska, L.; Miszewski, M.; Oskarbska, I. Analysis of signalized intersections in the context of pedestrian traffic. Transp. Res. Procedia 2016, 14, 2138–2147. [Google Scholar] [CrossRef]
  18. Wahane, R. Pedestrian Level of Service at Intersections in Bhopal City. IJEDR-Int. J. Eng. Dev. Res. 2017, 5, 161–167. Available online: https://rjwave.org/ijedr/viewpaperforall.php?paper=IJEDR1701025 (accessed on 6 June 2026).
  19. Kumar, A.; Ghosh, I. Analysis of spontaneous order of pedestrian–vehicle conflicts at signalized intersections. Transp. Res. Rec. 2020, 2674, 214–225. [Google Scholar] [CrossRef]
  20. Li, T.; Fu, Z.; Sun, Z.; Ding, H.; Wang, R.; Ji, A. Effects of vehicle speed on pedestrian movement at crosswalks: A case study using empirical data. Phys. A Stat. Mech. Its Appl. 2025, 660, 130377. [Google Scholar] [CrossRef]
  21. Yan, X.; Radwan, E. Effect of restricted sight distances on driver behaviors during unprotected left-turn phase at signalized intersections. Transp. Res. Part F Traffic Psychol. Behav. 2007, 10, 330–344. [Google Scholar] [CrossRef]
  22. Bai, Y.; Luo, W. A Coordinated Allocation Method for Right-Turn Strategy at Signalized Intersections with Optimal Pedestrian and Vehicle Delays. J. Adv. Transp. 2023, 2023, 2816407. [Google Scholar] [CrossRef]
  23. Chen, X.; Chen, Z.; Yang, J.; Pan, F.; Wang, R. Analysis of Path Distribution Characteristics and Safety Impact of Pedestrians Crossing in the Advance Right-Turn Lane. J. Adv. Transp. 2022, 2022, 2924008. [Google Scholar] [CrossRef]
  24. Guo, Y.; Liu, B.; Wu, Y.; Chen, J. Evaluating how right-turn treatments affect right-turn-on-red conflicts at signalized intersections. J. Transp. Saf. Secur. 2020, 12, 419–440. [Google Scholar] [CrossRef]
  25. Ghodrat Abadi, M.; Hurwitz, D.S. Operational impacts of protected-permitted right-turn phasing and pavement markings on bicyclist performance during conflicts with right-turning vehicles. Transp. Res. Rec. 2019, 2673, 789–799. [Google Scholar] [CrossRef]
  26. Essa, M.; Sayed, T. Traffic conflict models to evaluate the safety of signalized intersections at the cycle level. Transp. Res. Part C Emerg. Technol. 2018, 89, 289–302. [Google Scholar] [CrossRef]
  27. Kumar, A.; Paul, M.; Ghosh, I. Analysis of pedestrian conflict with right-turning vehicles at signalized intersections in India. J. Transp. Eng. Part A Syst. 2019, 145, 04019018. [Google Scholar] [CrossRef]
  28. Zhao, Y.; Bai, Y.; Yang, X. Modeling Conflicts between Right-Turn Vehicles and Pedestrians at Signalized Intersection. In Proceedings of the ICTIS 2011: Multimodal Approach to Sustained Transportation System Development: Information, Technology, Implementation, Wuhan, China, 30 June–2 July 2011. [Google Scholar] [CrossRef]
  29. Zhao, C. Analysis of the impact of conflicts between right-turning vehicles and pedestrians at signalized intersections. In Proceedings of the International Conference on Smart Transportation and City Engineering (STCE 2024), Chongqing, China, 28 April 2025; pp. 853–859. [Google Scholar] [CrossRef]
  30. Karimpour, A.; Anderson, J.C.; Kothuri, S.; Wu, Y.J. Estimating pedestrian delay at signalized intersections using high-resolution event-based data: A finite mixture modeling method. J. Intell. Transp. Syst. 2022, 26, 511–528. [Google Scholar] [CrossRef]
  31. Sheykhfard, A.; Haghighi, F.; Papadimitriou, E.; Van Gelder, P. Analysis of the occurrence and severity of vehicle-pedestrian conflicts in marked and unmarked crosswalks through naturalistic driving study. Transp. Res. Part F Traffic Psychol. Behav. 2021, 76, 178–192. [Google Scholar] [CrossRef]
  32. Zheng, L.; Sayed, T.; Essa, M. Bayesian hierarchical modeling of traffic conflict extremes for crash estimation. Anal. Meth. Accid. Res. 2019, 23, 100100. [Google Scholar] [CrossRef]
  33. Fu, C.; Sayed, T.; Zheng, L. multi-type Bayesian hierarchical model for traffic conflict-based crash estimation. Accid. Anal. Prev. 2021, 160, 106309. [Google Scholar] [CrossRef] [PubMed]
  34. Guo, Y.; Sayed, T.; Zheng, L. A hierarchical Bayesian peak-over-threshold approach for conflict-based before–after safety evaluation of leading pedestrian intervals. Accid. Anal. Prev. 2020, 147, 105772. [Google Scholar] [CrossRef]
  35. Fu, C.; Sayed, T. Random-Parameter Bayesian Hierarchical Extreme Value Modeling Approach with Heterogeneity in Means and Variances for Traffic Conflict–Based Crash Estimation. J. Transp. Eng. Part A Syst. 2022, 148, 04022056. [Google Scholar] [CrossRef]
  36. Chen, Z.; Chen, X.; Wang, R.; Gao, M. Characterization of pedestrian crossing spatial violations and safety impact analysis in advance right-turn lane. Int. J. Environ. Res. Public Health 2022, 19, 9134. [Google Scholar] [CrossRef]
  37. Ling, Z.; Ni, Y.; Li, K. Modeling interactions between pedestrians and right-turn vehicles at signalized intersections. In Proceedings of the CICTP 2012: Multimodal Transportation Systems—Convenient, Safe, Cost-Effective, Efficient, Beijing, China, 3–6 August 2012; pp. 2072–2084. [Google Scholar] [CrossRef]
  38. Gang, R.E.N.; Cheng, G.U.; Lili, L.U.; Zhuping, Z.H.O.U.; Chenzi, D.I.N.G. Modeling risk degree of conflicts between crossing pedestrians and vehicles at signalized intersections. J. Transp. Syst. Eng. Inf. Technol. 2012, 12, 76–81. [Google Scholar] [CrossRef]
  39. Ni, Y.; Wang, M.; Sun, J.; Li, K. Evaluation of pedestrian safety at intersections: A theoretical framework based on pedestrian-vehicle interaction patterns. Accid. Anal. Prev. 2016, 96, 118–129. [Google Scholar] [CrossRef]
  40. Sheykhfard, A.; Haghighi, F.; Zadeh, A.A.; Das, S.; Oshanreh, M.M.; Shaaban, K.; Soltani, A. Evaluating U-left turn and direct left turn movements at signalized intersections using traffic conflict indices. J. Traffic Transp. Eng. 2025, 12, 812–830. [Google Scholar] [CrossRef]
  41. Jashami, H.; Anderson, J.C.; Mohammed, H.A.; Cobb, D.P.; Hurwitz, D.S. Contributing factors to right-turn crash severity at signalized intersections: An application of econometric modeling. Int. J. Transp. Sci. Technol. 2024, 13, 243–257. [Google Scholar] [CrossRef]
  42. Ihssian, A.; Ismail, K. Modelling pedestrian safety at urban intersections using user perception. Accid. Anal. Prev. 2023, 180, 106912. [Google Scholar] [CrossRef]
  43. Yoshitake, H.; Shino, M. Risk assessment based on driving behavior for preventing collisions with pedestrians when making across-traffic turns at intersections. IATSS Res. 2018, 42, 240–247. [Google Scholar] [CrossRef]
  44. Akin, D.; Sisiopiku, V.P. Modeling Interactions Between Pedestrians and Turning Vehicles at Signalized Crosswalks Operating Under Combined Pedestrian–Vehicle Interval. In Proceedings of the 86th Annual Meeting of the Transportation Research Board, Washington, DC, USA, 21–25 January 2007; Available online: https://www.trb.org/Main/Blurbs/157123.aspx (accessed on 6 June 2026).
  45. Fitzpatrick, K.; Pratt, M.P.; Avelar, R. Speeds of right-turning vehicles at signalized intersections during green or yellow phase. Transp. Res. Rec. 2021, 2675, 503–515. [Google Scholar] [CrossRef]
  46. Sobhani, A.; Young, W.; Bahrololoom, S.; Sarvi, M. Calculating time-to-collision for analyzing right turning behavior at signalized intersections. Road Transp. Res. 2013, 22, 49–61. Available online: https://search.informit.org/doi/epdf/10.3316/informit.729129353853839 (accessed on 6 June 2026).
  47. Gaca, S.; Kiec, M. Assessment of pedestrian risk at crossings with kinematic-probabilistic model. Transp. Res. Rec. 2015, 2514, 129–137. [Google Scholar] [CrossRef]
  48. Alhajyaseen, W.K.; Asano, M.; Nakamura, H. Estimation of left-turning vehicle maneuvers for the assessment of pedestrian safety at intersections. IATSS Res. 2012, 36, 66–74. [Google Scholar] [CrossRef]
  49. Sitao, H.; Qiaojun, X.; Huihui, X.; Gang, X. Safety impact analysis of large vehicles’ right-turn on pedestrians and non-motorized vehicle at signalized intersection. In Proceedings of the World Automation Congress 2012, Puerto Vallarta, Mexico, 24–28 June 2012; Available online: https://ieeexplore.ieee.org/abstract/document/6321635 (accessed on 6 June 2026).
  50. González-Gómez, K.; Castro, M. Evaluating pedestrians’ safety on Urban intersections: A visibility analysis. Sustainability 2019, 11, 6630. [Google Scholar] [CrossRef]
  51. Sacchi, E.; Sayed, T.; Deleur, P. A comparison of collision-based and conflict-based safety evaluations: The case of right-turn smart channels. Accid. Anal. Prev. 2013, 59, 260–266. [Google Scholar] [CrossRef]
  52. Chen, P.; Zeng, W.; Yu, G.; Wang, Y. Surrogate safety analysis of pedestrian-vehicle conflict at intersections using unmanned aerial vehicle videos. J. Adv. Transp. 2017, 2017, 5202150. [Google Scholar] [CrossRef]
  53. Huang, F.; Liu, P.; Yu, H.; Wang, W. Identifying if VISSIM simulation model and SSAM provide reasonable estimates for field measured traffic conflicts at signalized intersections. Accid. Anal. Prev. 2013, 50, 1014–1024. [Google Scholar] [CrossRef] [PubMed]
  54. Kathuria, A.; Vedagiri, P. Evaluating pedestrian vehicle interaction dynamics at un-signalized intersections: A proactive approach for safety analysis. Accid. Anal. Prev. 2020, 134, 105316. [Google Scholar] [CrossRef]
  55. Hasanpour, M.; Persaud, B. Using microsimulation to investigate the optimal deployment of leading pedestrian intervals at signalized intersections. Traffic Saf. Res. 2022, 3, 000022. [Google Scholar] [CrossRef]
  56. Gavric, S.; Erdagi, I.G.; Stevanovic, A. Surrogate safety evaluation of incorrect pedestrian detection at signalized intersections. Traffic Saf. Res. 2024, 6, e000073. [Google Scholar] [CrossRef]
  57. Zorba, V.; Anagnostopoulos, A.; Michopoulos, K.; Lemonakis, P.; Grizos, K.; Kehagia, F. Left-Turn Conflict Predictive Modeling Using Surrogate Safety Measures at Urban Intersections: The Case Study of Thessaloniki. Future Transp. 2026, 6, 36. [Google Scholar] [CrossRef]
  58. Shahdah, U.; Saccomanno, F.; Persaud, B. Application of traffic microsimulation for evaluating safety performance of urban signalized intersections. Transp. Res. Part C 2015, 60, 96–104. [Google Scholar] [CrossRef]
  59. Molan, A.M.; Hummer, J.E.; Ksaibati, K. Modeling safety performance of the new super DDI design in terms of vehicular traffic and pedestrian. Accid. Anal. Prev. 2019, 127, 198–209. [Google Scholar] [CrossRef]
  60. Appiah, J.; King, F.A.; Fontaine, M.D.; Cottrell, B.H. Left turn crash risk analysis: Development of a microsimulation modeling approach. Accid. Anal. Prev. 2020, 144, 105591. [Google Scholar] [CrossRef]
Figure 1. Continuum of traffic conflicts (adapted from [9]).
Sustainability 18 06133 g001
Figure 2. PRISMA (Preferred Reporting Items for Systematic Reviews and Meta-Analyses) diagram of the study selection process.
Sustainability 18 06133 g002
Figure 3. Distribution of studies by publication year.
Sustainability 18 06133 g003
Figure 4. Integrated Pedestrian–Vehicle Conflict Framework (IPVCF).
Sustainability 18 06133 g004
Figure 5. Pedestrian accidents at intersections in Gdynia (2010–2014): (a) distribution by intersection control type and (b) severity of pedestrian casualties (redrawn based on [17]).
Sustainability 18 06133 g005
Figure 6. Time–space representation of PET in pedestrian–vehicle conflicts (concept based on [1]).
Sustainability 18 06133 g006
Table 1. Comparison of surrogate safety measures used in pedestrian–vehicle conflict analysis.
MeasureDefinitionAdvantagesData
Requirements
Typical
Applications
Limitations
TTC (Time to Collision)Time remaining until two road users collide if current speeds are maintainedSimple to compute; widely usedContinuous trajectories, speed, position, road–user dimensionsReal-time conflict detectionLess stable when speeds are low or trajectories change suddenly
PET (Post Encroachment Time)Time gap between the first road user leaving and the second road user arriving at the conflict point.Effective for near-collision analysisConflict point, arrival/departure times, video or trajectory dataIntersection safety studiesDoes not capture evasive action before reaching the conflict point
PPD (Pedestrian Path Deviation)Spatial deviation from intended crossing pathCaptures pedestrian behaviorPedestrian trajectory and intended pathBehavioral studiesRequires detailed trajectory extraction
DST (Deceleration to Safety Time)Required deceleration to avoid collisionReflects driver reactionSpeed, distance, acceleration/deceleration profilesAdvanced safety analysisSensitive to assumptions about reaction and braking
Table 2. Comparative synthesis of methods and research gaps in pedestrian–vehicle conflict studies.
MethodData
Requirements
Main StrengthsMain Limitations/
Research Gaps
Behavioral studiesField/video observationsCaptures pedestrian and driver responsesLimited transferability across sites and pedestrian groups
Statistical modelsConflict and explanatory variablesIdentifies significant predictorsMay oversimplify dynamic interactions
Trajectory-based analysisHigh-resolution movement dataCaptures speed, gap acceptance, PET/TTC, and path deviationRequires accurate tracking and standardized thresholds
Simulation modelsCalibrated traffic and behavioral inputsTests signal and geometric scenariosSensitive to calibration and weak in representing negotiation behavior
Machine-learning modelsLarge conflict datasetsCaptures nonlinear relationshipsLower interpretability and limited external validation
Table 3. Reported PET and TTC thresholds in pedestrian–vehicle and related intersection conflict studies.
StudyIndicatorThreshold
(s)
Context/
Location
Data Resolution/
Sample Size
Turn/Conflict Type
Chen et al. [1]PET3Urban intersection
Beijing, China
Simulation-based/2 hRight
Ped-veh
Feng et al. [4]PET1.5Signalized intersection
China
SimulationRight
Ped-veh
Sheykhfard et al. [40]PET
TTC
2.5
4
Signalized intersection
Babol/Iran
video analysisLeft
Veh-veh
Alhajyaseen et al. [48]PET2Signalized intersection
Nagoya, Japan
Monte Carlo simulation/2 hLeft
Ped-veh
Chen et al. [52]PET3Signalized intersection
Beijing, China
unmanned
aerial vehicle
videos/1 h
Ped-veh
Huang et al. [53]TTC1.5Signalized intersection
Nanjing, China
VISSIM Simulation/80 hLeft
Veh-veh
Kathuria and Vedagiri [54]PET1Un-Signalized intersection/IndiaVideo cameras/
1.5 h
Ped-veh
Persaud and Hasanpour [55]PET
TTC
1.5
1.5
Signalized intersection
Toronto, ON, Canada
VISSIM
Simulation
Right
Ped-veh
Gavric et al. [56]PET
TTC
5
1.5
Signalized intersection
USA
Video data
20 h
Ped-veh
Zorba et al. [57]PET5Urban intersection
Thessaloniki, Greece
field video observations/2 hLeft
ped-veh
Shahdah et al. [58]TTC0.5
1.5
Signalized intersection
Toronto, ON, Canada
Traffic Control CentreLeft
Veh-veh
Molan et al. [59]TTC1diverging
diamond interchange
VISSIM
simulation
Veh-veh
Appiah et al. [60]PET
TTC
5
1.5
Signalized
intersection
VISSIM-SSAMLeft
Veh-veh
Disclaimer/Publisher’s Note: The statements, opinions and data contained in all publications are solely those of the individual author(s) and contributor(s) and not of MDPI and/or the editor(s). MDPI and/or the editor(s) disclaim responsibility for any injury to people or property resulting from any ideas, methods, instructions or products referred to in the content.