1. Introduction
1.1. University Cafeteria Food Waste as a Responsible Consumption Challenge
Food waste remains a major sustainability concern because it links food security, environmental burden, and resource efficiency. Approximately one-third of food produced globally is lost or wasted annually, generating roughly 3.3 Gt CO
2eq of greenhouse gas emissions [
1,
2,
3]. In China, food organic waste accounts for 61.2% of municipal solid waste by weight—substantially exceeding global averages [
4,
5]. Reducing food waste has become a priority in national sustainability governance, exemplified by China’s “Dual Carbon” objectives and the “Clean Plate” campaign.
The relevance of this issue to sustainability is both environmental and managerial. At the global level, food-waste reduction is directly connected to responsible consumption and production, particularly Sustainable Development Goal 12.3, which calls for halving per-capita food waste and reducing food losses along supply chains [
6]. At the institutional level, university cafeterias are not only places of consumption but also managed socio-technical systems in which procurement, portioning, serving rules, dining infrastructure, and student behavior jointly shape resource efficiency and avoidable environmental burdens. Understanding plate waste in this setting therefore contributes to sustainability scholarship by connecting behavioral evidence with campus sustainability management, low-carbon operations, and practical governance of everyday consumption.
University cafeterias provide a useful institutional setting for examining responsible food consumption under standardized dining conditions. These institutional dining environments serve large populations daily under standardized conditions that differ in several operational respects from household or restaurant settings [
7,
8,
9]. In cafeterias, portion sizes are determined by staff rather than diners, menu options are standardized, dining periods are time-constrained, and the physical environment is not under individual control. These structural constraints mean that observed waste behavior reflects not only individual dispositions but also environmental affordances that limit behavioral autonomy [
10,
11].
Prior research documents that plate waste in institutional settings ranges from 15% to 45% depending on meal type and conditions, with large-scale Chinese university surveys reporting 74% of students generate plate waste averaging 61 g per meal [
12,
13,
14]. However, the psychological mechanisms driving this waste—and their relative importance in constrained institutional environments—remain insufficiently understood. This gap makes it difficult to identify which behavioral levers should be prioritized in cafeteria-based interventions, which often default to motivation-centered campaigns.
1.2. The MOA Framework: Potential and Limitations
The Motivation–Opportunity–Ability (MOA) framework provides a theoretically grounded lens for understanding food waste behavior [
15,
16,
17]. The framework posits that behavior is jointly determined by: (1) Motivation—the desire or willingness to act; (2) Opportunity—the environmental conditions that enable or constrain action; and (3) Ability—the skills and capacity to perform the behavior [
18].
MOA is not the only behavioral framework used in food waste research. The Theory of Planned Behavior emphasizes attitudes, subjective norms, and perceived behavioral control as antecedents of intention and behavior [
19]; Norm Activation Theory foregrounds personal norms, awareness of consequences, and responsibility attribution [
20]; and COM-B conceptualizes behavior as a function of capability, opportunity, and motivation [
21]. In food-waste studies, TPB-based applications have commonly emphasized intention formation, perceived behavioral control, and subjective norms [
22,
23], whereas norm- and emotion-oriented approaches highlight moral obligation, guilt, responsibility attribution, and competing household routines [
24,
25,
26,
27]. COM-B is particularly useful for connecting individual capability and environmental opportunity to intervention design. These approaches overlap with MOA but differ in emphasis: TPB and Norm Activation Theory are especially useful for intention and moral-norm pathways, whereas COM-B and MOA place greater analytical weight on capability and opportunity. The present study therefore does not claim that MOA is theoretically superior to these alternatives; rather, it asks whether a more granular MOA operationalization can provide useful exploratory evidence in a constrained cafeteria setting.
Empirical applications of MOA to food waste have produced valuable insights [
22,
25,
28]. However, conventional operationalizations of the framework face an important measurement limitation: they typically treat Opportunity and Ability as unitary, aggregate constructs. In the context of institutional dining, this aggregation may obscure distinct mechanisms that differentially influence waste outcomes. Specifically:
Opportunity is conventionally measured via perceived social norms and convenience, but cafeteria environments also present physical constraints (portion flexibility, serving autonomy, disposal infrastructure) that may operate independently of social perceptions. Ability is typically assessed as self-reported behavioral confidence, yet food waste reduction also requires cognitive capacities (portion estimation knowledge, food management skills) that may be poorly captured by general agency measures.
This measurement coarseness has led to inconsistent findings. Some studies report significant MOA effects on self-reported waste intentions [
24,
29], while others find weak or null associations with objectively measured waste [
8,
17]. These inconsistencies may partly reflect limitations in how MOA dimensions have been operationalized; the framework’s explanatory power may have been underestimated due to insufficient dimensional granularity.
1.3. Research Gap: From Aggregate MOA to Refined Dimensions
Building on these observations, two interrelated gaps motivate the present study.
First, prior research has tended to focus more on motivational factors than on distinctions within opportunity and ability. Survey-based food waste studies frequently find that attitudes and intentions explain substantial variance in self-reported behavior, leading to intervention recommendations focused on awareness campaigns and moral appeals [
30,
31]. Yet these motivation-centered approaches may have limited efficacy in institutional dining, where structural constraints override individual preferences. The relative importance of different MOA dimensions in such constrained environments remains empirically unresolved.
Second, the distinct roles of physical opportunity and cognition-related capacity remain less explicitly theorized and measured. Physical opportunity—environmental affordances such as portion adjustability, serving autonomy, and disposal convenience—represents a separate pathway from social opportunity (norms, peer influence). Similarly, cognition-related capacity—knowledge and skills for food management—differs from behavioral ability (general confidence and assertiveness). Conflating these sub-dimensions into aggregate scales may produce misleading conclusions about which intervention targets are most impactful.
We therefore advance the following proposition: in institutional dining contexts, decomposing MOA into finer-grained dimensions—specifically distinguishing physical from social opportunity, and cognitive from behavioral ability—may improve explanatory power for objectively measured plate waste. This proposed refinement is treated as preliminary and sample-specific rather than as a definitive reformulation of MOA theory. It shifts the analytical focus from “whether MOA matters” to “which components of MOA matter under structural constraints.”
1.4. Research Objectives and Hypotheses
This study aims to refine the MOA framework for university cafeteria food waste by decomposing Opportunity and Ability into theoretically meaningful sub-dimensions and testing their relative predictive power against objectively measured behavioral outcomes within the present two-campus sample. To provide structural context, we first establish macro-level evidence on national waste composition patterns using global open data, then focus analytical attention on the micro-level MOA mechanisms. By doing so, the study positions university cafeteria plate waste as a sustainability problem of responsible consumption, institutional resource governance, and behaviorally informed waste reduction rather than only as an individual attitude problem.
Research Questions:
- RQ1
To what extent do economic development, infrastructure, and governance explain cross-national variation in organic waste composition, providing contextual grounding for institutional food waste research?
- RQ2
Does a refined five-dimensional MOA operationalization (Motivation, Social Opportunity, Physical Opportunity, Behavioral Ability, and a two-item cognitive-capacity proxy) explain objectively measured cafeteria plate waste better than the conventional three-dimensional aggregate model in this sample?
- RQ3
Which MOA sub-dimensions or proxy indicators contribute most to plate-waste variance, and what do the patterns tentatively imply for intervention design in institutional dining?
Hypotheses:
Hypothesis 1. The baseline aggregate MOA model will explain limited variance in objectively measured plate waste (), consistent with prior null findings in institutional settings.
Hypothesis 2. Decomposing Opportunity into Social and Physical components, and Ability into Behavioral Ability and a two-item cognitive-capacity proxy, will significantly improve model fit (, ).
Hypothesis 3. Physical Opportunity and cognition-related indicators are expected to account for a large share of explained plate-waste variance in the refined model.
Hypothesis 4. The associations of Physical Opportunity and the cognition-related indicators will remain robust across alternative model specifications (raw waste, log-transformed, winsorized, logistic, and quantile regression).
1.5. Contributions
This study makes three contributions to the responsible consumption and sustainability literature. First, it provides preliminary evidence that dimensional refinement—specifically distinguishing physical opportunity and cognition-related capacity—can improve MOA’s empirical performance in this two-campus setting. This finding qualifies previous concerns about the limited performance of aggregate MOA measures in institutional settings and redirects theoretical attention toward measurement granularity, while remaining subject to replication. Second, it provides evidence using objectively weighed plate waste as the behavioral outcome, addressing a persistent limitation of self-report-based food waste research and supporting more reliable sustainability assessment in institutional dining. Third, it offers exploratory implications for intervention design: physical-environment redesign and cognition-related capacity development are framed as candidate directions for future testing, not as established causal interventions. These directions are relevant to sustainable campus management because they target avoidable waste, resource inefficiency, and the translation of sustainability awareness into everyday consumption practice. The weak incremental role of motivation in this sample is interpreted as a ceiling-effect pattern rather than as evidence that motivation is generally unimportant.
1.6. Theoretical Framework
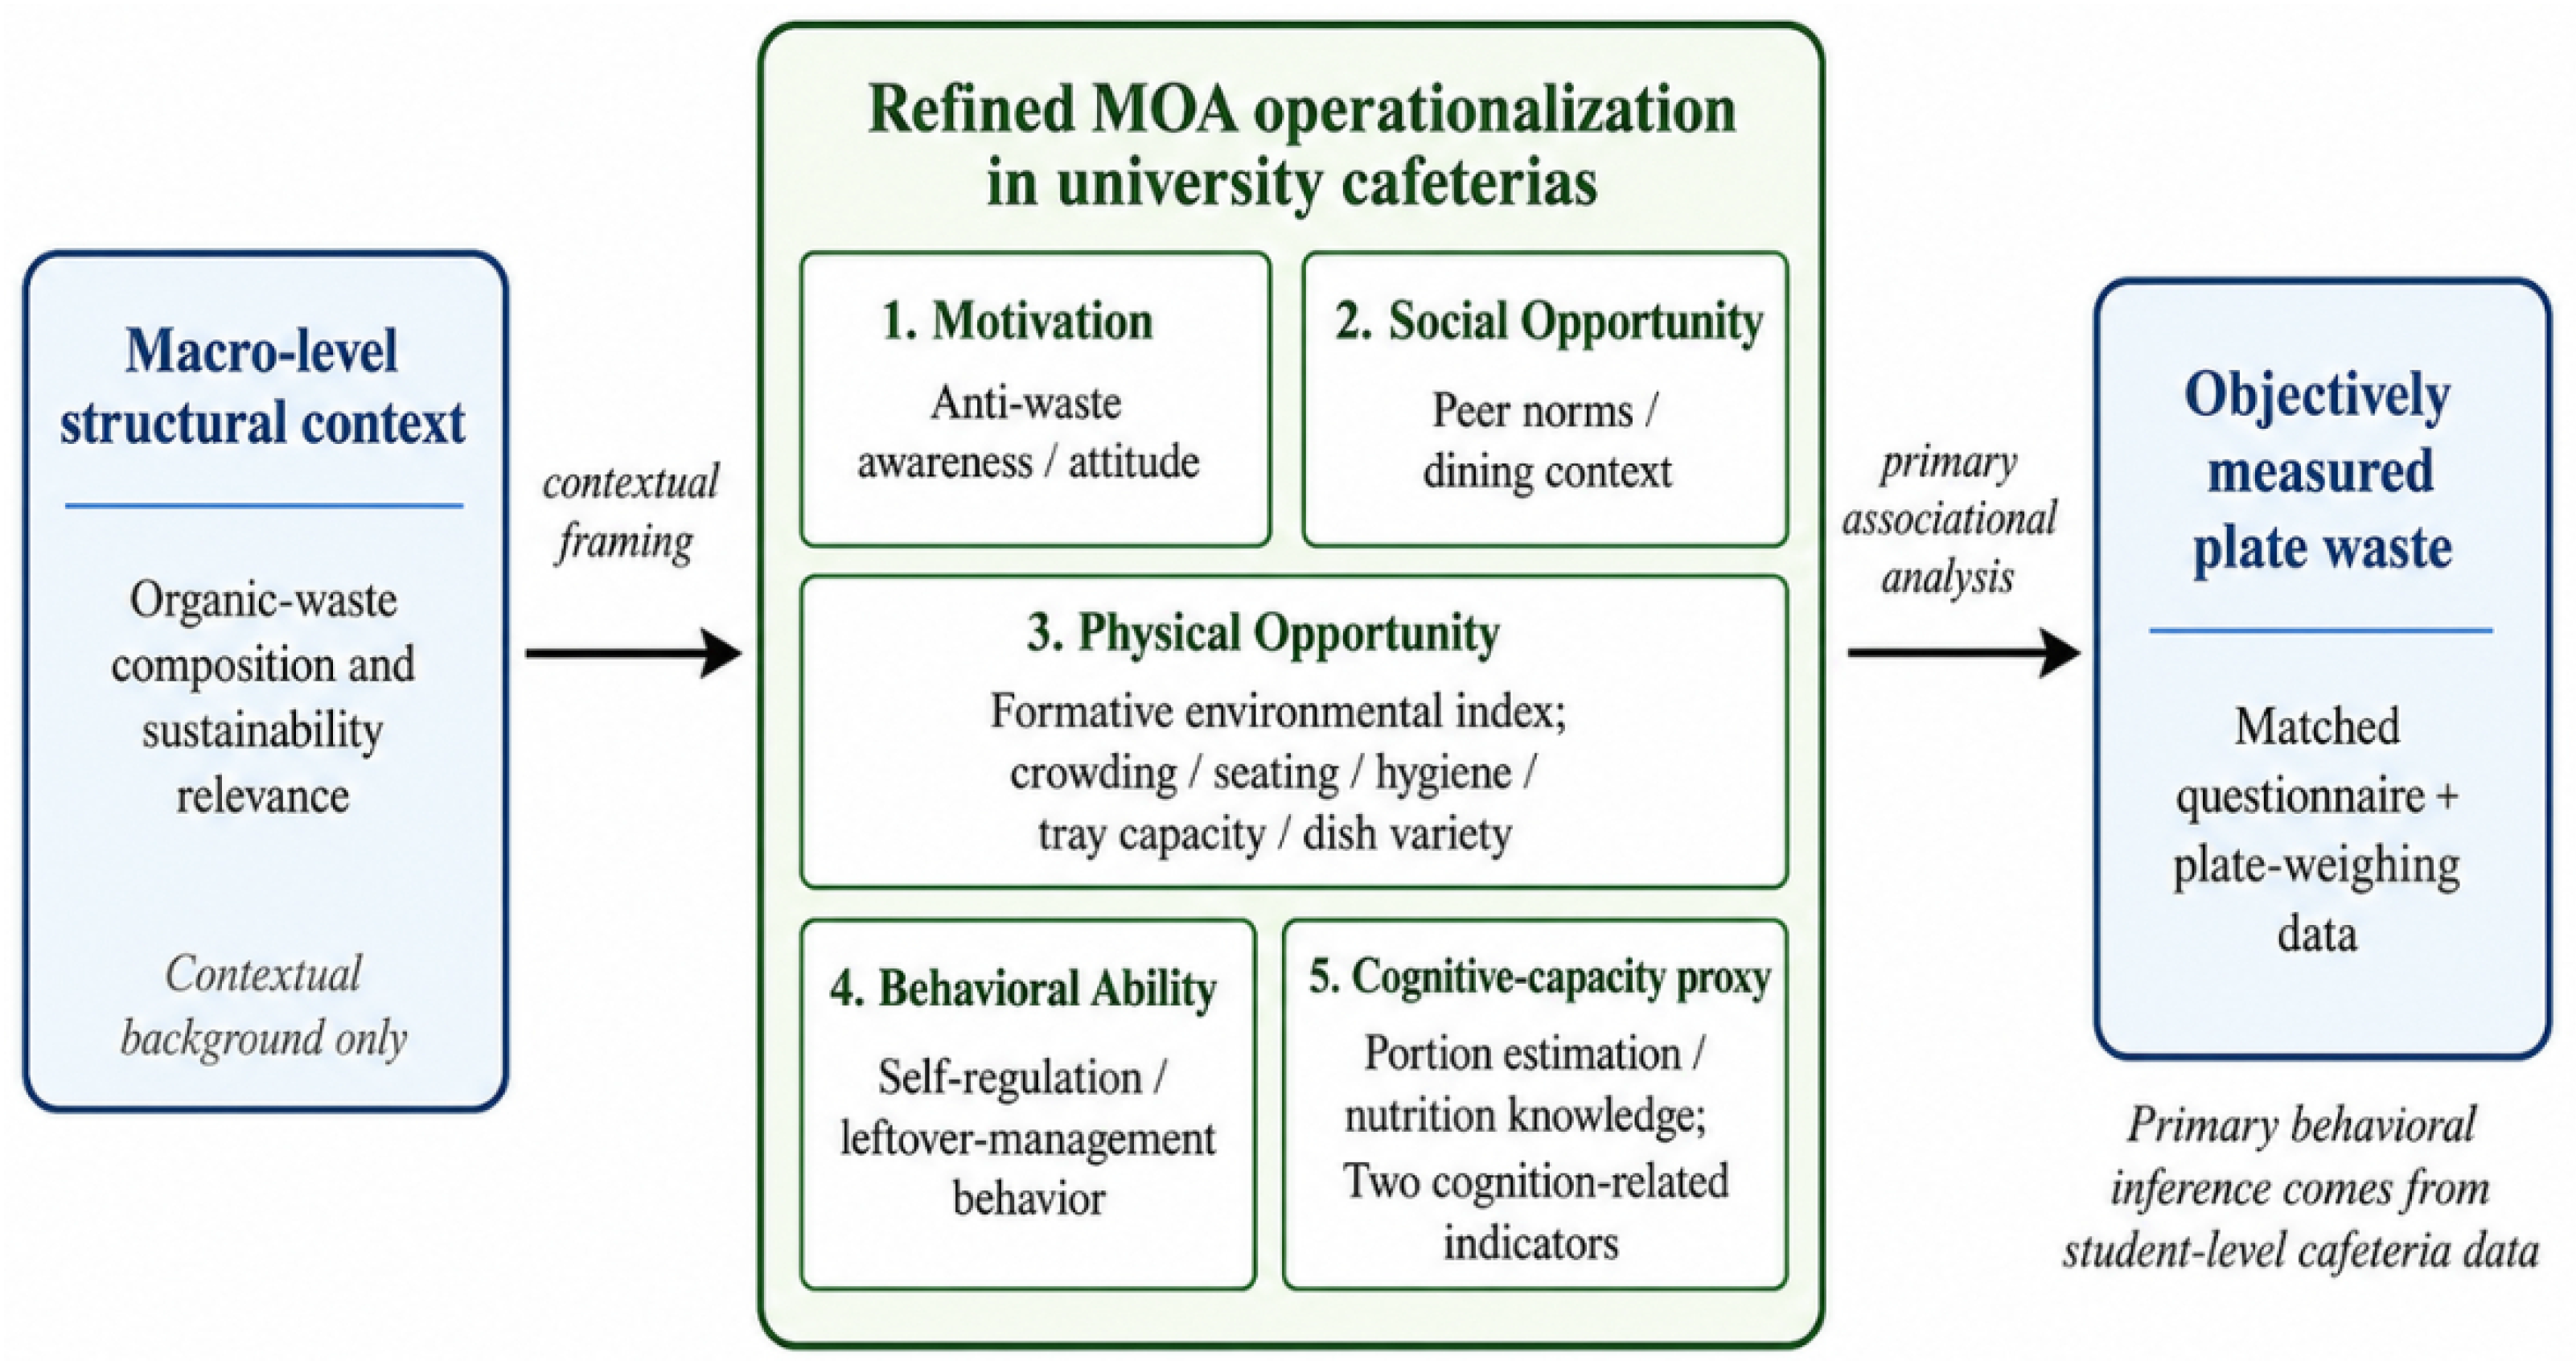
Figure 1 presents a simplified framework guiding this study. The figure separates the macro contextual layer from the micro behavioral layer to make clear that the main behavioral inference is based on the student-level cafeteria data. Conventional three-dimensional MOA provides the baseline specification, while the refined model decomposes Opportunity into Social Opportunity and Physical Opportunity and represents the Ability extension through Behavioral Ability and a two-item cognitive-capacity proxy. Physical Opportunity and cognition-related indicators are treated as candidate predictors whose associations require replication and future intervention testing.
3. Results
This section reports findings from the dual-layer analytical framework. Consistent with the macro-contextual, micro-primary design, Part 1 (cross-national open-data analysis) provides structural context on correlates of national organic waste composition. Part 2 (campus cafeteria study) constitutes the primary inferential analysis, testing whether the refined MOA model improves explanatory power for objectively measured plate waste.
3.1. Part 1: Structural Drivers of Food Waste Composition (Contextual Analysis)
3.1.1. Descriptive Overview
Table 2 presents summary statistics for the macro-level sample. Across 176 countries, organic waste constituted a mean of 41.78% of total MSW (SD = 17.87), ranging from 3.10% (highly industrialized economies with advanced source separation) to 87.60% (low-income economies where organics dominate unsorted waste streams). Per capita GDP averaged
$25,191 (SD =
$23,464), reflecting substantial global inequality in economic development.
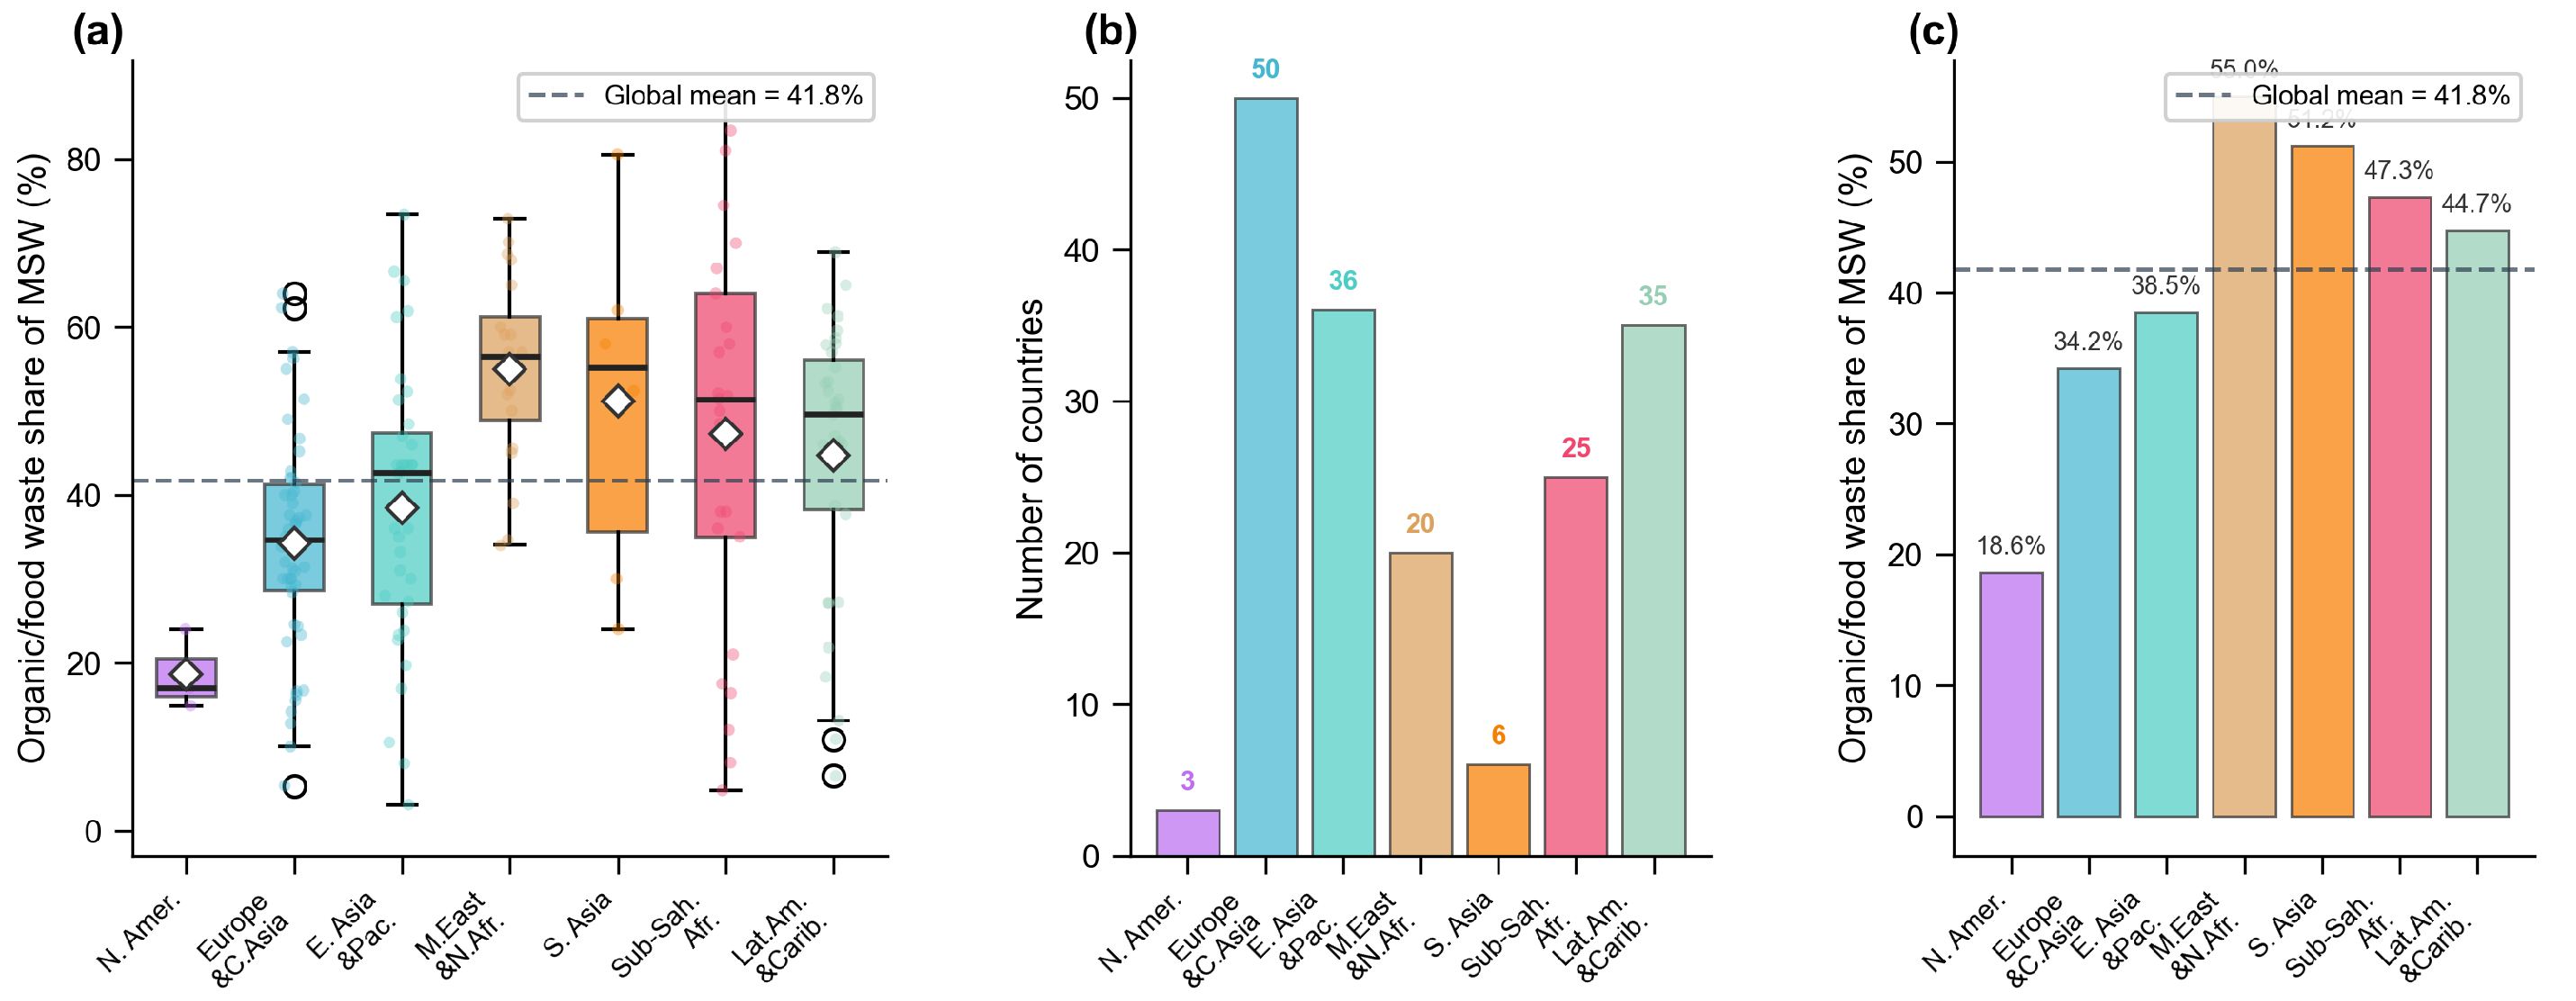
Figure 2 visualizes the regional distribution of organic waste shares, revealing pronounced heterogeneity across World Bank regions.
Figure 2 presents the regional distribution of organic waste shares. Pronounced heterogeneity across World Bank regions motivates the macro-level contextual grounding analysis below.
3.1.2. Macro-Level Bivariate Associations
Bivariate correlations among core macro variables (
Table 3) revealed a theoretically consistent pattern: per capita GDP was negatively correlated with organic waste share (
,
), indicating that economically developed nations exhibit lower proportional organic waste. This association is consistent with the possibility that higher-income countries have more developed waste-sorting systems. GDP was also positively associated with collection coverage (
) and recycling rate (
).
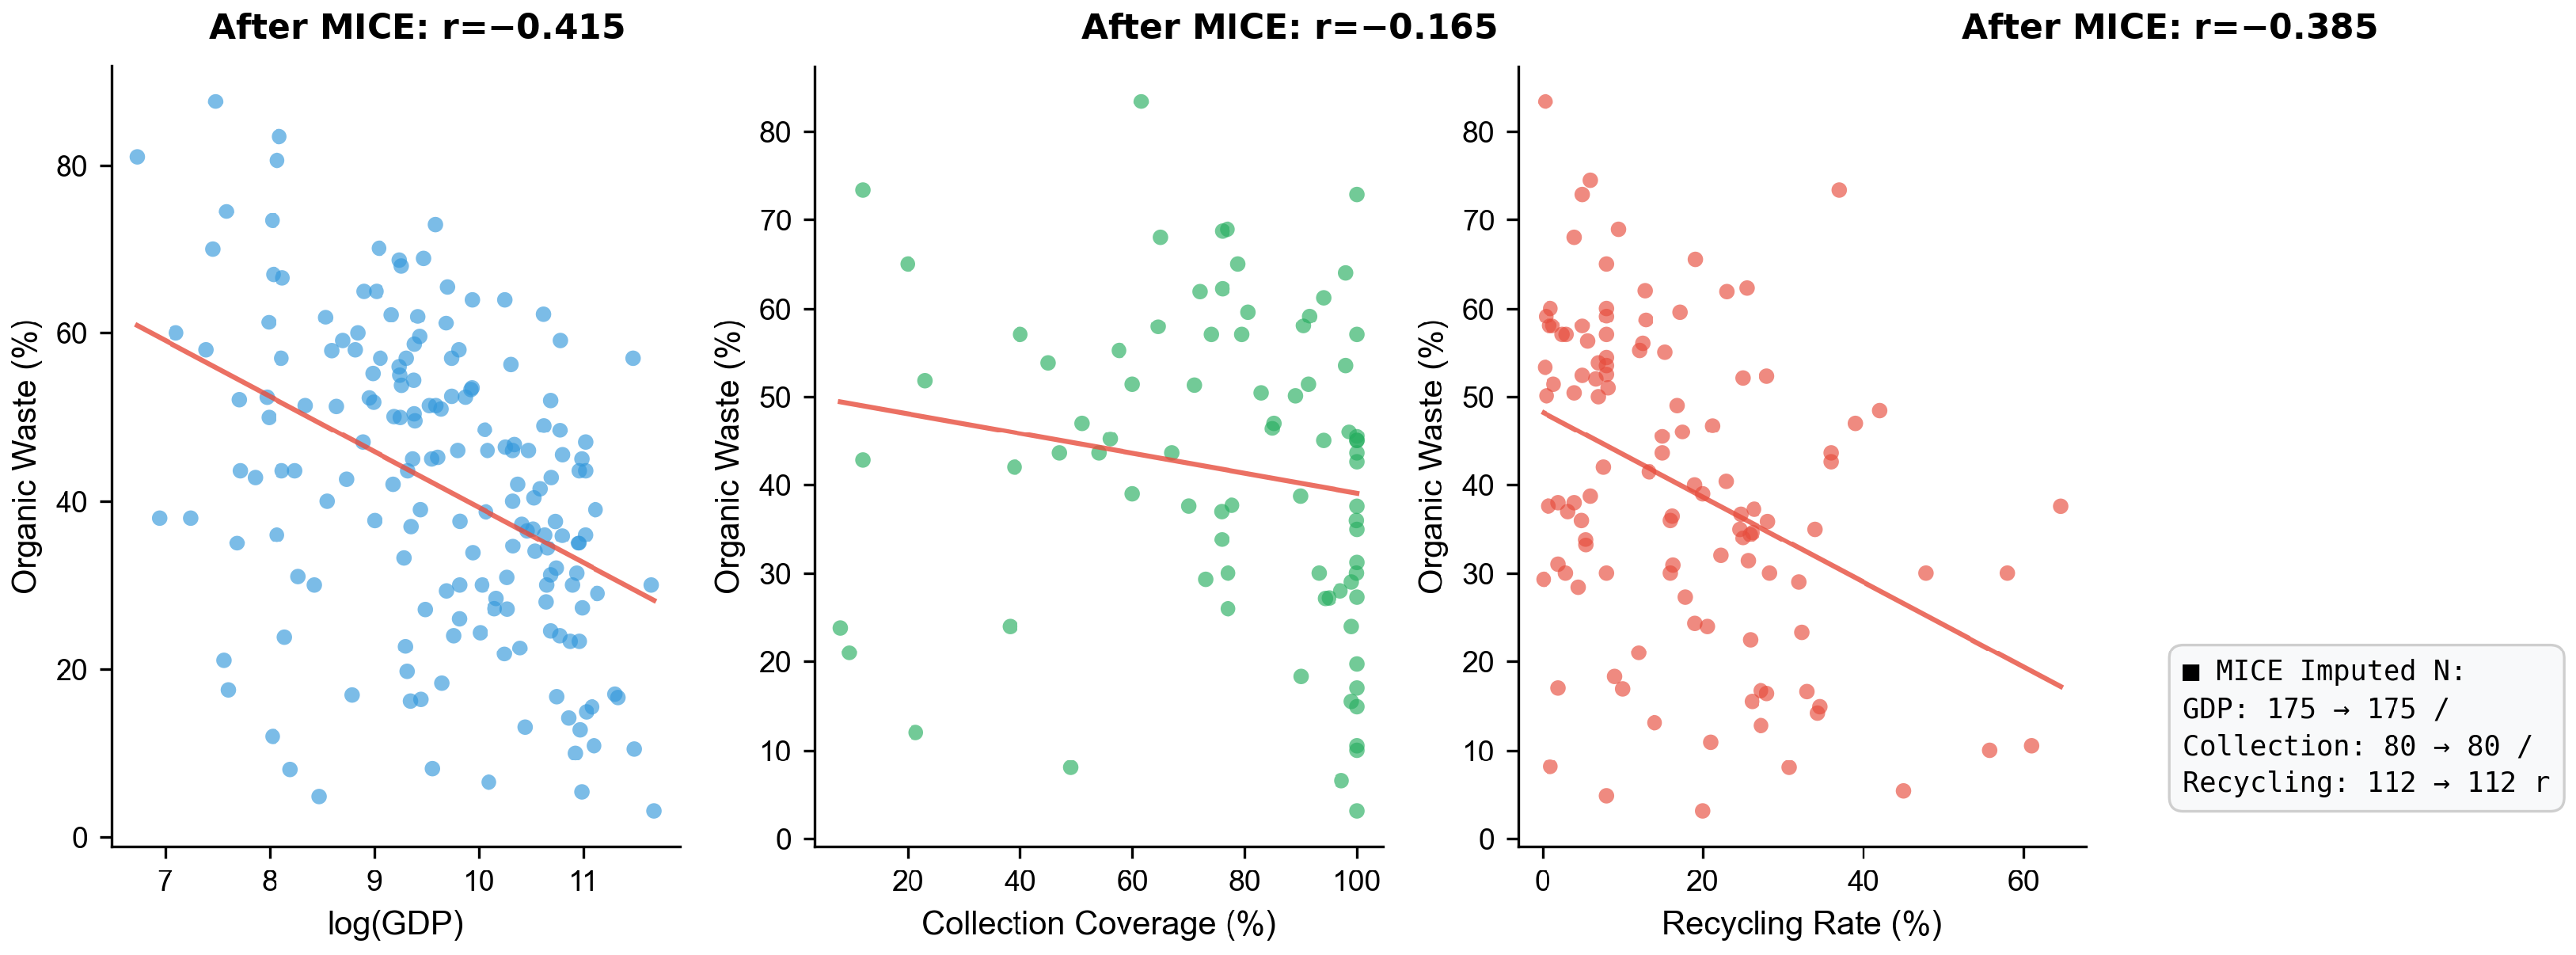
The bivariate relationship between economic development (log GDP per capita) and organic waste share was negative (, ), representing the most robust structural finding in the macro-level analysis. Additional bivariate associations for collection coverage and recycling rate were examined as descriptive diagnostics.
The correlation between organic waste share and collection coverage was modestly negative (), suggesting that infrastructure expansion alone does not fully explain cross-national variation—other factors such as dietary patterns, urbanization, and cultural norms around food likely contribute additional explanatory power.
3.1.3. Governance Indicators (WGI) Results
We obtained the Worldwide Governance Indicators (WGI) 2024 dataset, which provides six nuanced governance dimensions for 210–215 countries.
Table 4 reports correlations between WGI dimensions and organic waste percentage.
All six WGI dimensions exhibit significant negative correlations with organic waste share (
;
Table 4), suggesting that governance quality is consistently associated with organic waste share. Rule of Law (RL) and Control of Corruption (CC) show the strongest effects (
). WGI dimensions are also positively correlated with collection coverage and recycling rate, indicating that governance enables waste management infrastructure, which in turn reduces organic waste shares.
3.1.4. Pre-Imputation Exploratory Analysis
Before addressing missing data, we examined hierarchical OLS regression on available complete cases. Log-transformed GDP per capita showed a consistent negative coefficient across specifications (
to
,
), while collection coverage and recycling rate showed unstable coefficients as
N attrited from 175 to 46 due to missing data—consistent with selection bias rather than true null effects. Full results for the complete-case exploratory models are reported in
Supplementary Table S2.
3.1.5. Primary Results: MICE-Imputed Structural Model
To address severe
N-attrition (collection coverage: 54% missing; recycling rate: 36% missing), we employed MICE imputation, increasing effective
N from 80–112 to 175. Imputation diagnostics are provided in
Appendix A Figure A1.
Table 5 reports hierarchical regression results.
After MICE, GDP shows the largest and most stable association, while recycling rate reaches marginal significance (, ). Region dummies increase from 20.3% to 35.8%, indicating regional heterogeneity. A complete-case robustness check () confirmed GDP as the strongest predictor (, ), providing mutual validation with the MICE estimates.
3.1.6. WGI Governance Regression Results
A supplementary regression incorporating the six WGI governance dimensions confirmed that Control of Corruption exhibits the strongest negative coefficient (
,
), while Government Effectiveness shows a positive coefficient likely due to multicollinearity with GDP (
). The WGI model explains 26.7% of variance, improving on GDP alone (
). Detailed estimates are reported in
Supplementary Table S1.
3.1.7. Exploratory Regional Heterogeneity
A one-way ANOVA revealed significant regional differences (
,
), with MEA exhibiting the highest mean organic waste share (55.0%) and NAC the lowest (18.6%). GDP–waste correlations varied across regions: LCN and MEA showed the strongest effects (
to
,
); EAS was weaker and marginally significant (
,
). These patterns suggest context-specific structural profiles warranting region-sensitive policy approaches. Detailed regional results are reported in
Supplementary Table S3.
The macro-level findings establish that structural context—economic development, infrastructure quality, governance capacity, and regional location—is associated with aggregate waste composition. Because these variables were not measured at the campus level, the macro analysis is treated as contextual background rather than as covariates in the micro-level model. The remaining question is whether individual-level MOA constructs are associated with plate waste within the institutional cafeteria setting highlighted by the macro-contextual analysis.
3.2. Part 2: Refined MOA Predictors of Observed Plate Waste (Primary Analysis)
We now turn to the campus-level data () collected from two ordinary higher education institutions located in northern and southern China. The micro-level survey began with a preparatory pilot stage in November 2024, followed by formal data collection from January to May 2026. Building on the macro-level structural context established in Part 1, this layer tests whether the refined five-dimensional MOA specification—distinguishing Physical Opportunity and the cognitive-capacity proxy from their traditional aggregate counterparts—is associated with objectively measured plate waste in real-world institutional dining settings.
3.2.1. Sample and Dependent Variable Characteristics
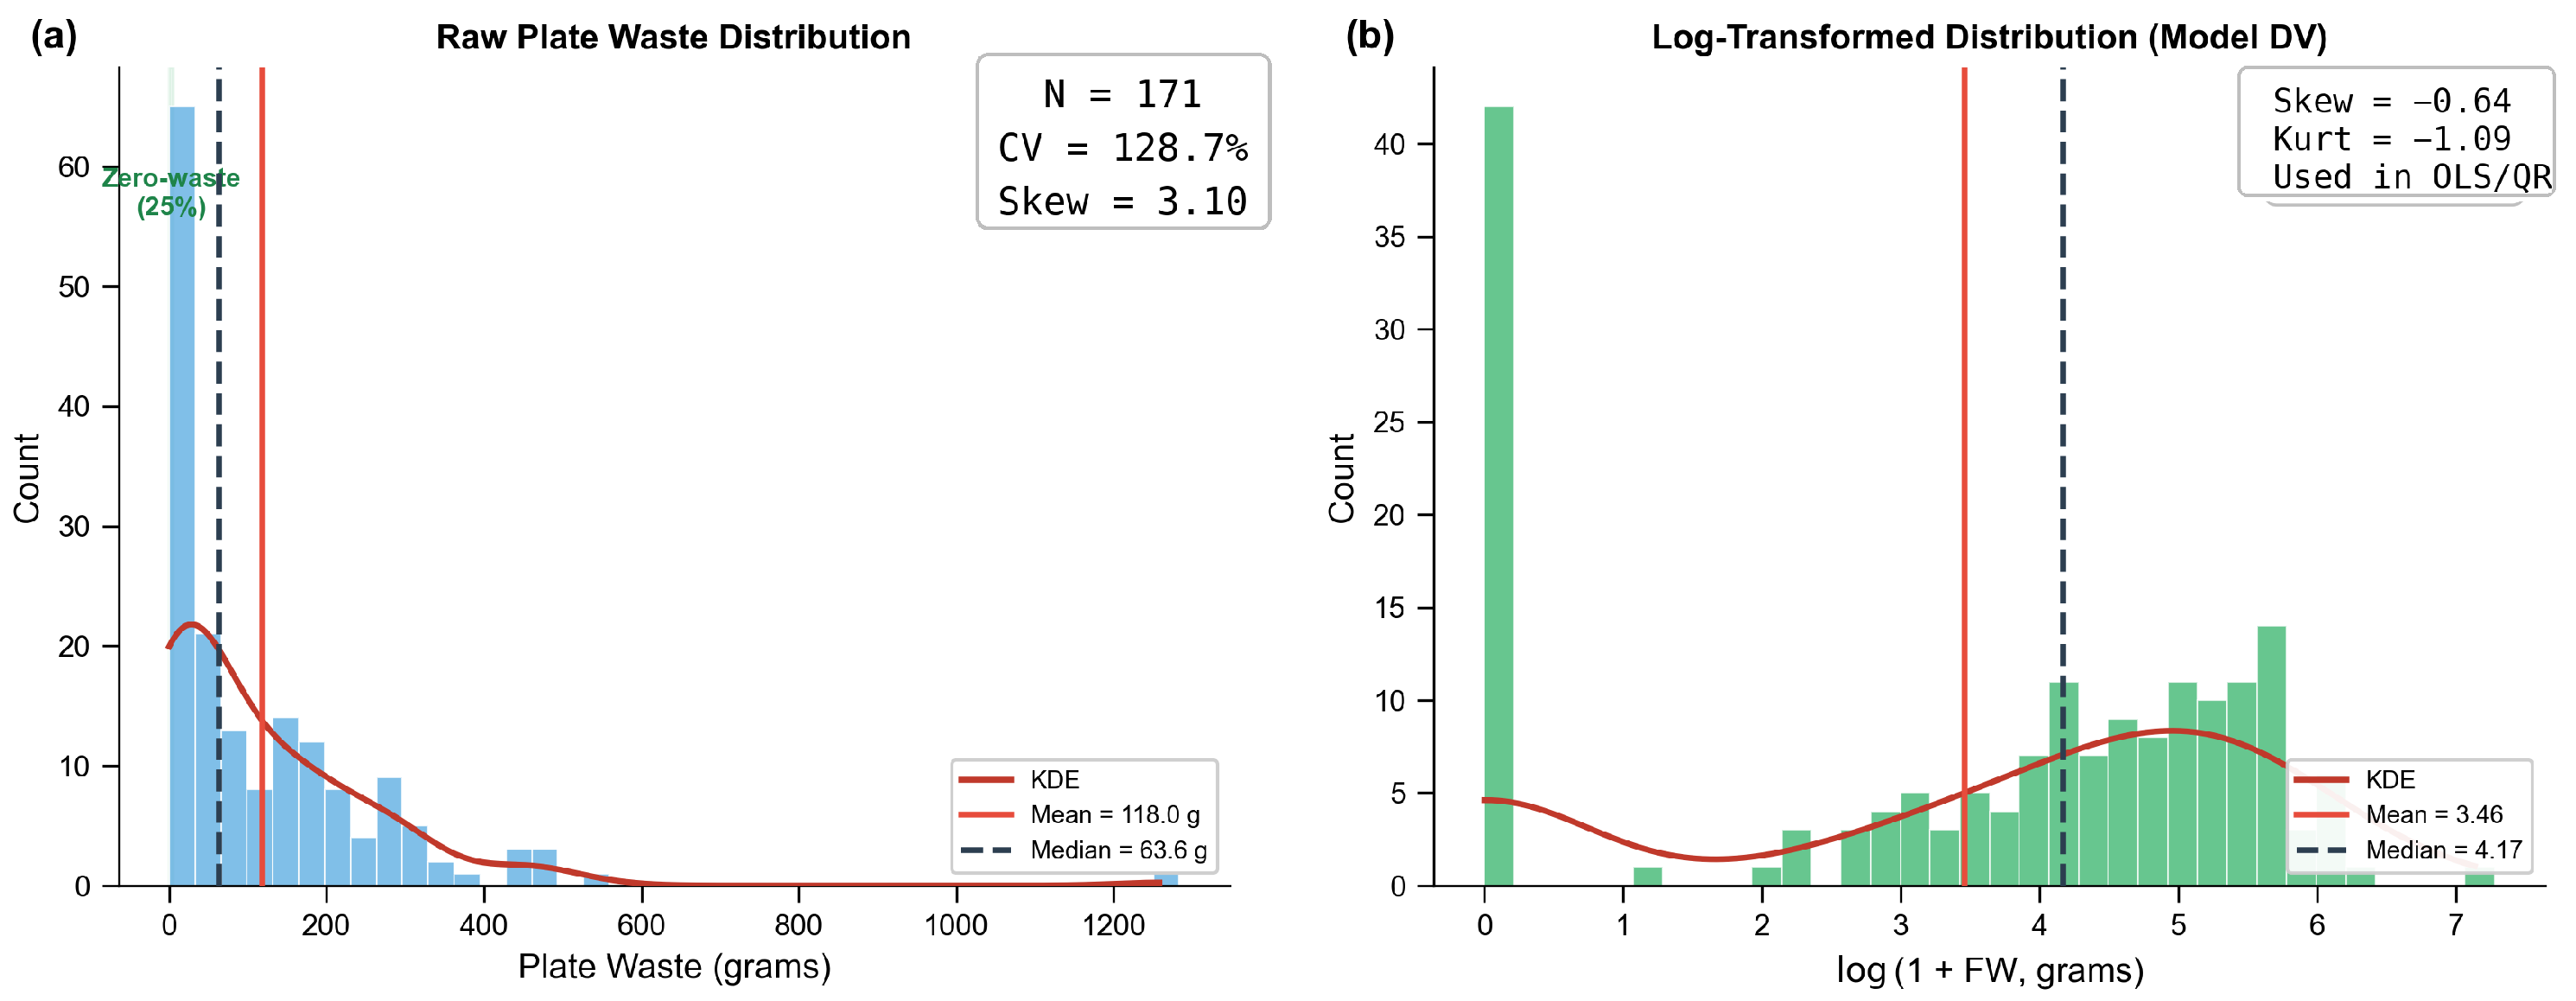
During data collection, 216 weighing observations and 204 questionnaire responses were obtained. After data verification, matching, and screening against the source files, the final analytic sample comprised 170 valid respondents with measured food waste and five MOA dimension scores. The dependent variable—plate waste weighed immediately after each meal—exhibited extreme dispersion: mean = 118.0 g, SD = 151.9 g (CV = 128.7%); skewness = 3.12; kurtosis = 18.12. A quarter of respondents left no measurable waste (≤5 g), and 43.5% wasted less than 50 g, producing a zero-inflated distribution. Following established practice, we used as the primary DV in parametric analyses.
Table 6 presents descriptive statistics for all 20 measurement items across five MOA dimensions.
Three measurement features merit note. Motivation ceiling effect: four of five motivation items exhibited means above 4.0 on a 5-point scale, compressing the variance available for regression; at the scale level, 55.3% of respondents scored at or above 4.0, 25.9% scored at or above 4.5, and 15.3% scored at or above 4.8. Physical Opportunity formative structure: the five physical environment items (
) capture distinct, non-interchangeable affordances (crowding ≠ seating ≠ hygiene); low internal consistency is theoretically expected for a formative index but does not by itself validate the construct [
37,
39,
40]. Cognitive-capacity proxy: the two items capture complementary capacities (portion estimation vs. nutrition knowledge;
) and are retained in the five-dimensional model for comparability, while substantive interpretation relies primarily on item-level cognition-related indicators.
Figure 3 displays the distribution of objectively measured plate waste, which motivates the log-transformation strategy adopted for parametric models.
3.2.2. Correlation Structure
Table 7 reports zero-order correlations among the five MOA dimension scores and food waste. The pattern reveals theoretically meaningful but counterintuitive suppressor relationships.
At the zero-order level, Physical Opportunity shows the strongest positive correlation with waste (, ): students perceiving more constrained physical environments waste more. The cognitive-capacity proxy shows the strongest negative correlation (, ): students with greater nutritional knowledge waste less. These two important predictors are strongly negatively correlated with each other (): students in more physically constrained environments report lower cognitive capacity. This collinearity structure indicates that the two predictors share variance and should be interpreted jointly in multivariate models.
The full correlation structure across all five dimensions showed a strong negative association between Physical Opportunity and the cognitive-capacity proxy (), signaling shared variance in multivariate models.
3.2.3. Hierarchical Regression: From Aggregate to Refined MOA
Table 8 reports the hierarchical regression sequence testing whether dimensional refinement improves explanatory power. All models used
as the dependent variable with HC1 robust standard errors. Model C is treated as the primary micro-level specification because it directly corresponds to the hypothesized refined MOA operationalization while remaining more parsimonious than the 20-item disaggregation and interaction models. Model D and Model E are therefore interpreted as sensitivity checks rather than replacement primary models.
Model A (Baseline): The conventional three-dimensional aggregate MOA model—Motivation, Opportunity (social only), and Ability (behavioral only)—produced (, ), failing to reach statistical significance. None of the three baseline MOA dimensions reached significance. This baseline result is consistent with H1 and replicates the weak effects commonly reported when MOA is applied to objectively measured waste behavior in institutional settings.
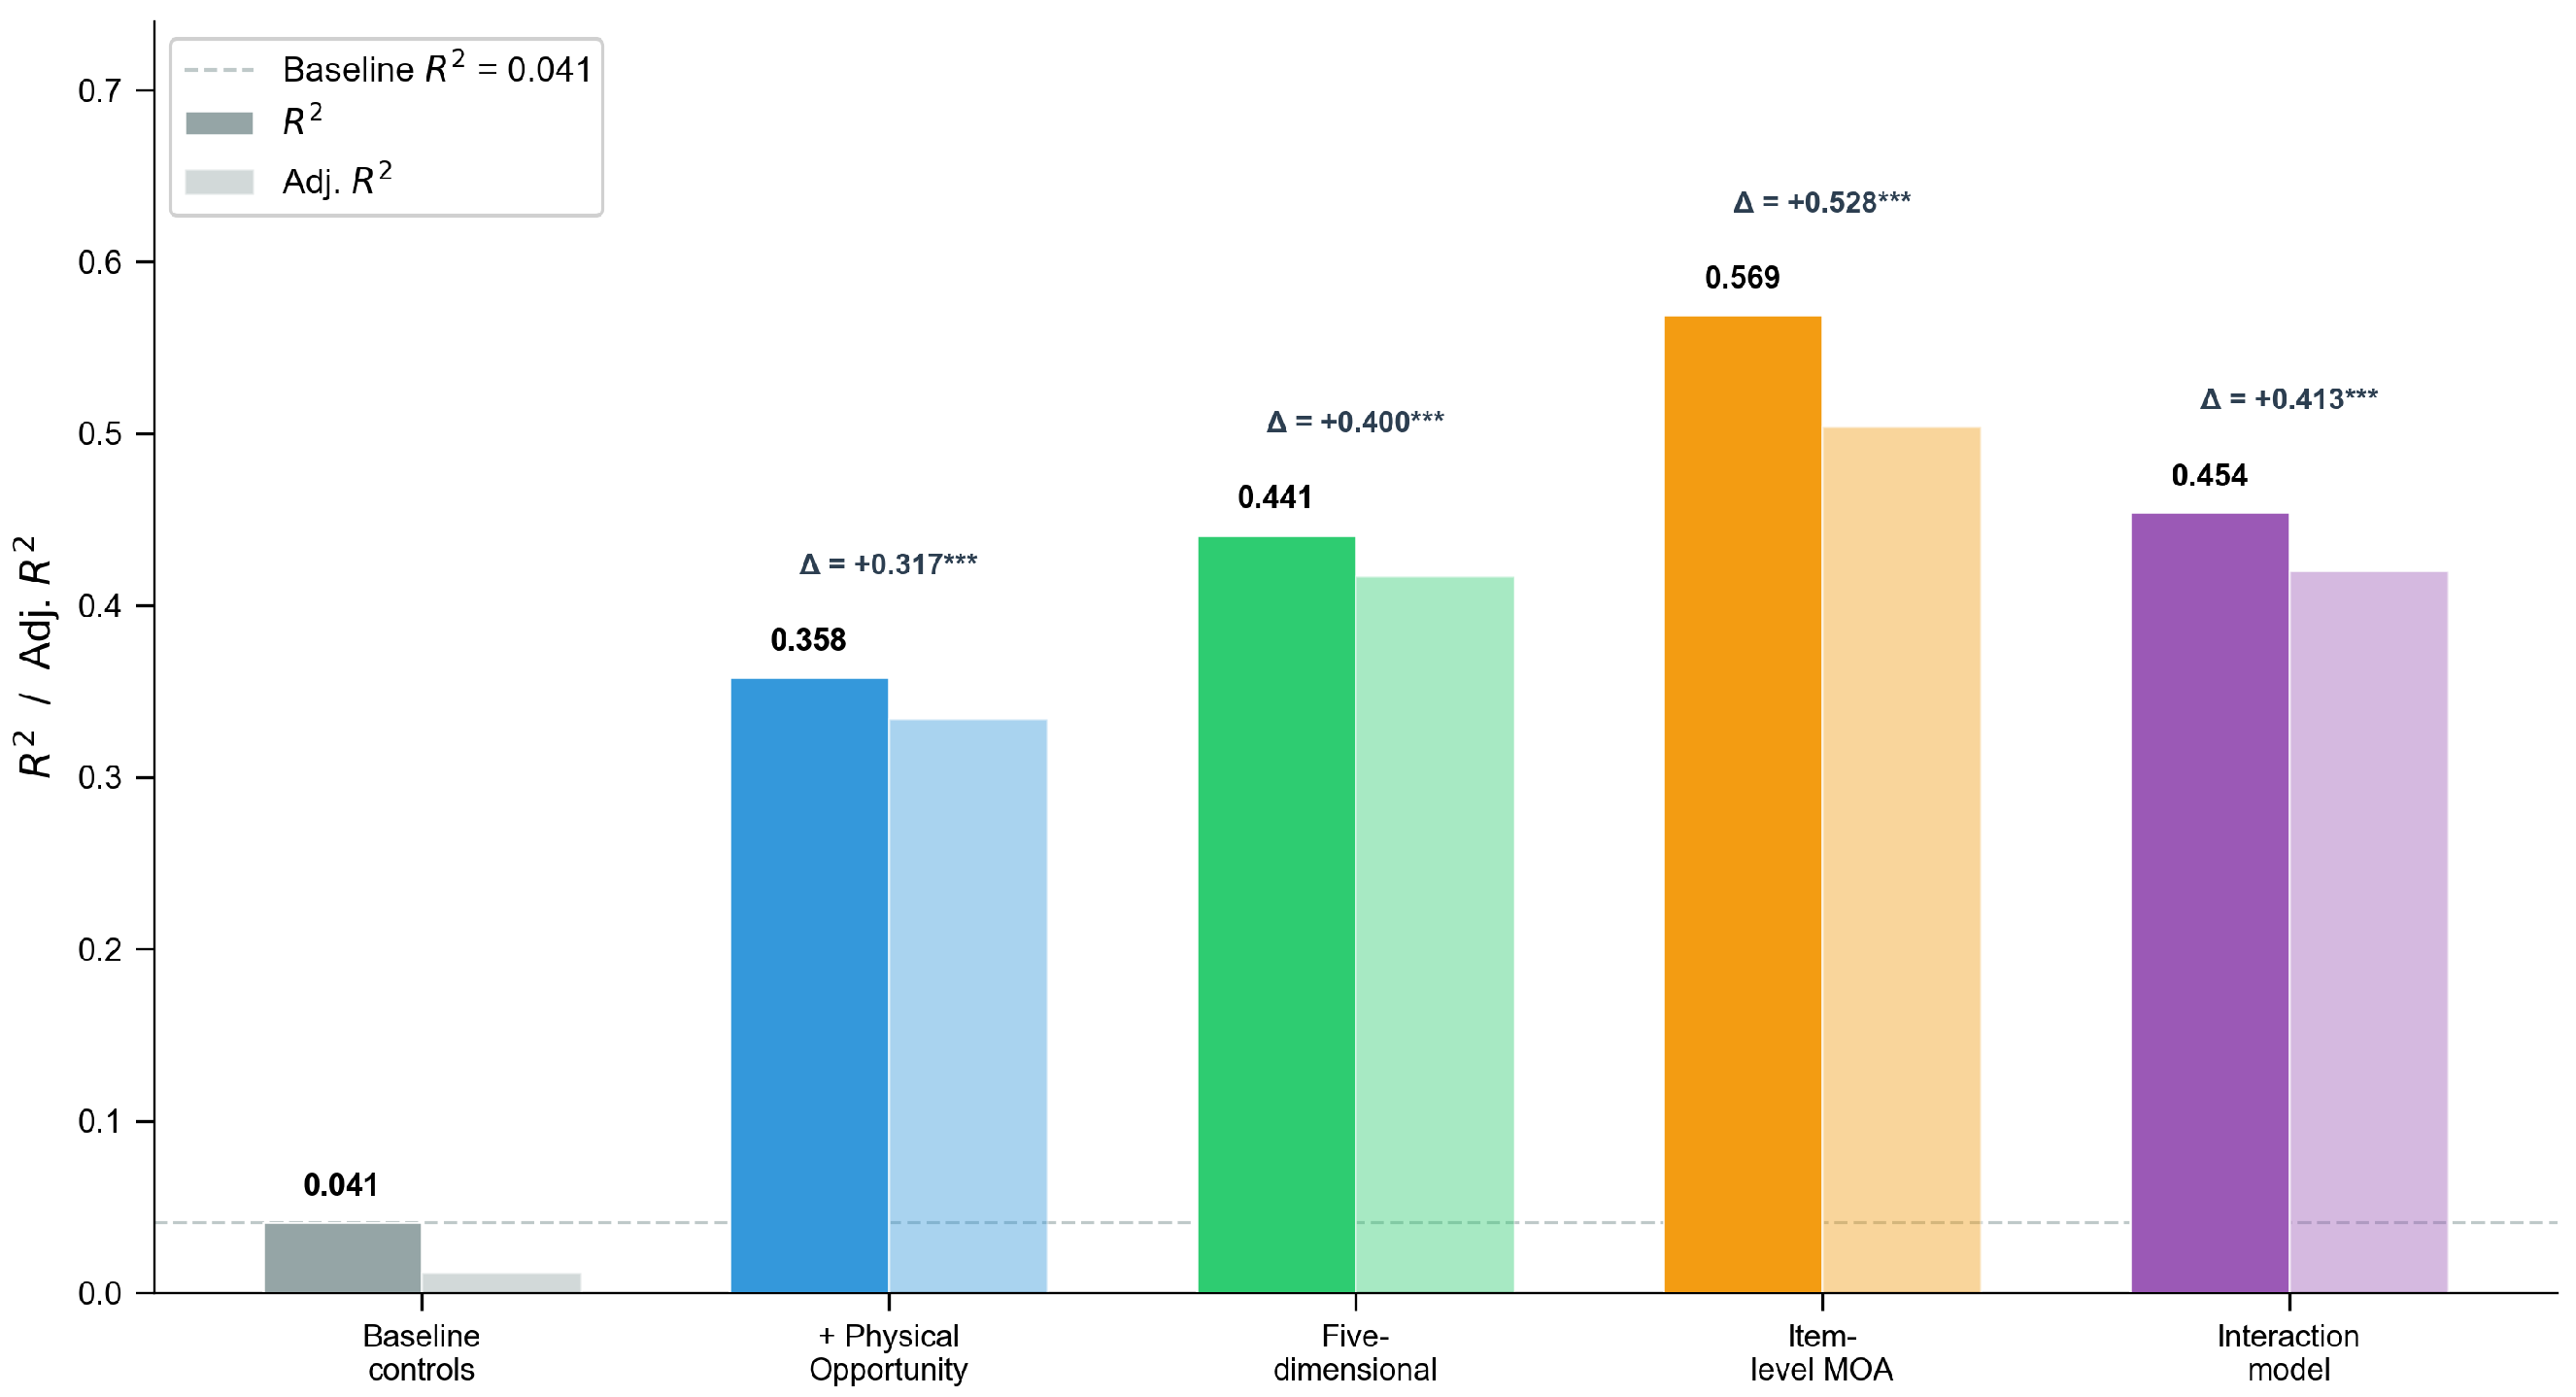
Model B (+Physical Opportunity): Adding the Physical Opportunity dimension was associated with a marked increase in model fit: jumped from 0.041 to 0.358 (, , ). The overall model became highly significant (, ), and Physical Opportunity showed a positive coefficient (, ).
Model C (Full Five-Dimensional): Adding the two-item cognitive-capacity proxy further improved model fit to (Adj. ; vs. Model A = 0.400, ). The full five-dimensional model explained 44.1% of the variance, compared with 4.1% in the aggregate baseline. Physical Opportunity showed a positive association (, ), while the cognitive-capacity proxy showed a negative association (, ). Motivation, Social Opportunity, and Behavioral Ability were not significant. VIFs remained below 1.50, indicating that the dimension-level model did not exhibit severe multicollinearity. These results are consistent with H2, but they should be interpreted as exploratory associational evidence rather than theoretical validation.
Model D (Item-Level): Entering all 20 individual items as predictors achieved
(Adj.
), indicating that dimensional aggregation loses some predictive information but also increasing overfitting risk. At the item level, A3c (portion estimation;
,
), A4c (nutrition knowledge;
,
), and O9p (dish variety;
,
) were significant. Accordingly, Model D is used for sensitivity and construct-disaggregation interpretation, not as the primary model.
Appendix A Table A4 reports AIC, BIC, and 5-fold cross-validation diagnostics; the parsimonious two-predictor model shows the best cross-validated RMSE, whereas the 20-item model has higher overfitting risk despite its larger in-sample
.
Model E (Interactions): Adding two-way interaction terms (Motivation × Social Opportunity, Motivation × cognitive-capacity proxy, Physical Opportunity × cognitive-capacity proxy) yielded negligible improvement (), indicating that the five-dimensional main effects model captures the core predictive structure. H4 is therefore tested primarily through the multi-specification robustness checks below.
Figure 4 visualizes the progressive improvement in explained variance across the five model specifications. Model D has the highest model fit, whereas the interaction model does not further improve explanatory power, suggesting that the main-effect specification provides a more parsimonious representation in this sample.
3.2.4. Collinearity, Shared Variance, and Coefficient Interpretation
A notable feature of the revised results is the strong negative association between Physical Opportunity and the cognitive-capacity proxy (). At the zero-order level, Physical Opportunity correlates positively with waste (), while the cognitive-capacity proxy correlates negatively with waste (). In Model C, both associations remain in the same substantive directions: Physical Opportunity is positive (, ), and the cognitive-capacity proxy is negative (, ). Motivation has a near-zero zero-order correlation () and remains non-significant in the multivariate model.
The correlation between Physical Opportunity and the cognitive-capacity proxy nonetheless requires cautious interpretation because partial regression coefficients can redistribute shared variance when predictors are conceptually or empirically related [
42,
43]. We therefore do not interpret Model C as separating clean causal pathways. Instead, the results indicate that students reporting more constrained physical conditions tend to waste more, whereas students with stronger cognition-related capacity tend to waste less, within this sample and after adjustment for the other MOA dimensions.
For this reason, the results are interpreted jointly across zero-order correlations, partial regression coefficients, relative weights, item-level checks, complete-case/MICE comparisons, and quantile regressions. These estimates address complementary associational quantities and are not treated as causal evidence. The quantile regression results below further support the negative association of the cognition-related indicators and the positive association of Physical Opportunity across the distribution of plate waste.
3.2.5. Relative Weight Analysis: Decomposing Explained Variance
To provide a multicollinearity-robust decomposition of each dimension’s contribution, we conducted Johnson Relative Weights Analysis (RWA; Tonidandel and LeBreton [
41]). RWA partitions
into proportions attributable to each predictor, accounting for shared variance through a variable transformation approach.
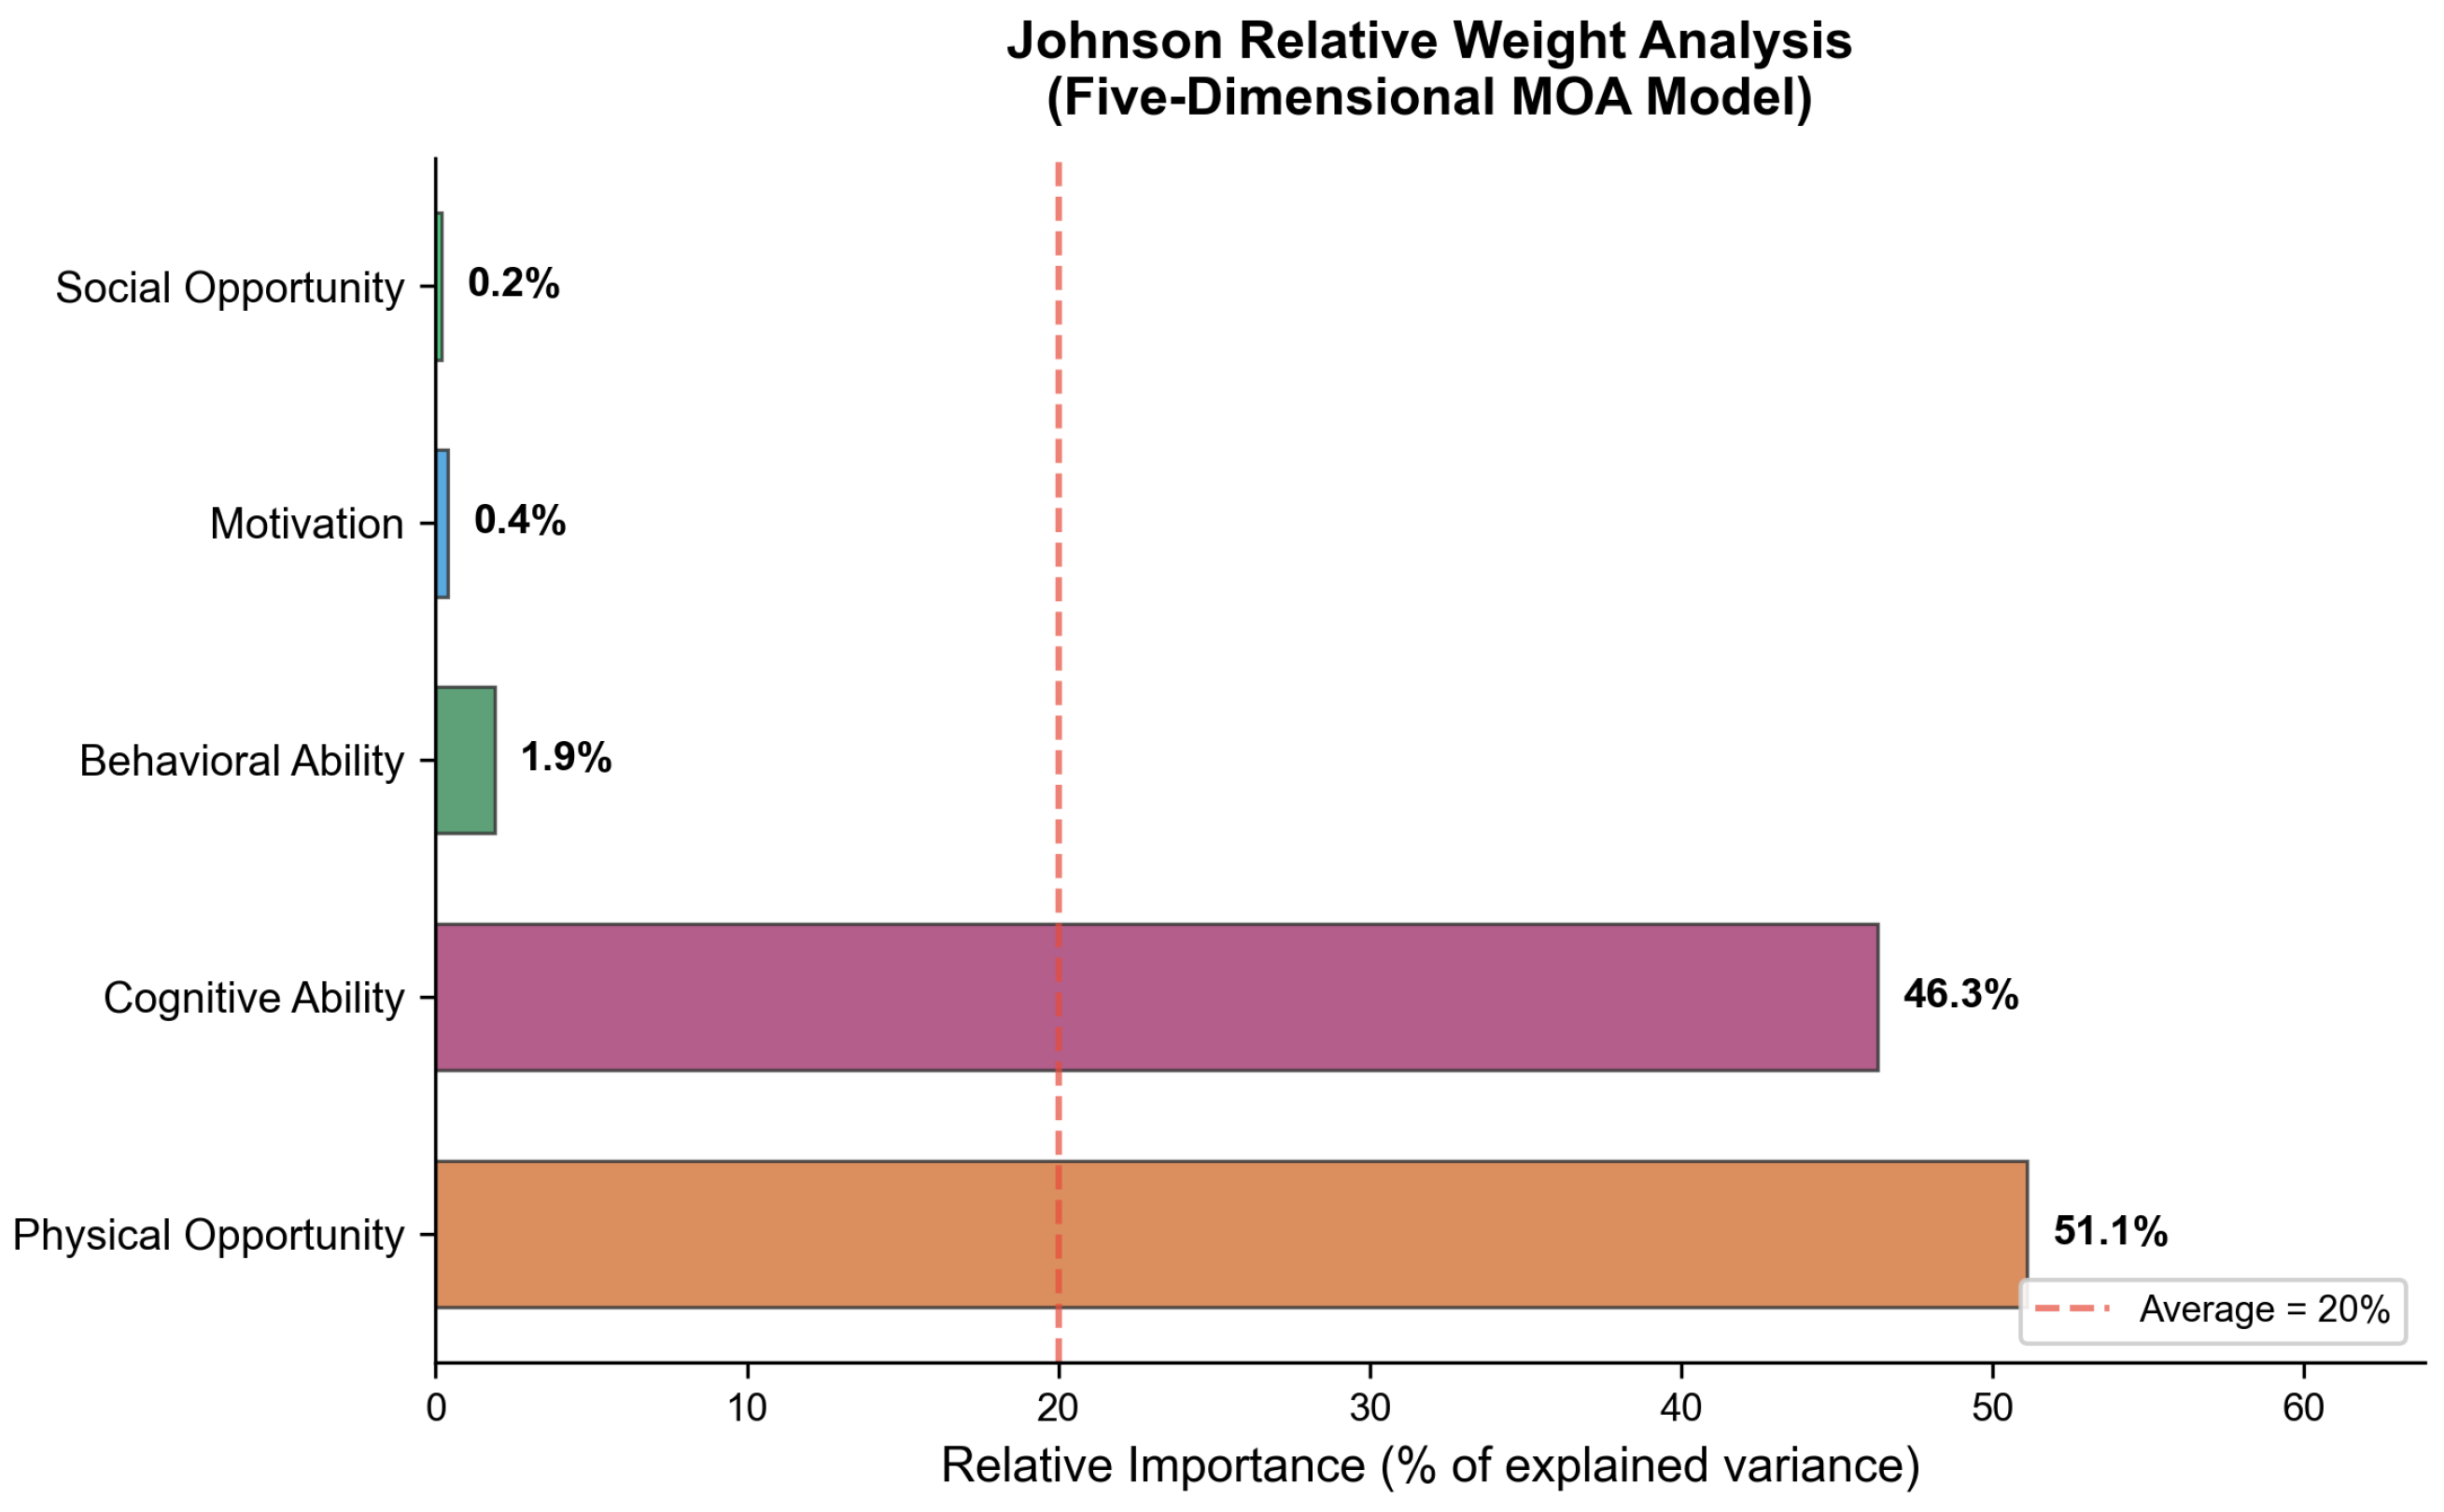
Physical Opportunity and the cognitive-capacity proxy jointly account for 97.4% of explained MOA variance in the Johnson RWA decomposition (
Table 9), providing evidence consistent with H3 but also underscoring that the remaining dimensions contribute little incremental predictive signal in this sample. Motivation—the primary target of many food waste interventions—contributes less than 1% of explained MOA variance in this decomposition. This asymmetry suggests that part of the limited predictive performance observed in prior MOA applications may be attributable to the dimensional granularity of measurement, while also raising the need for replication to rule out sample-specific over-concentration.
Figure 5 visualizes the RWA decomposition. Relative weights indicate each predictor’s contribution to explained variance rather than causal effects.
3.2.6. Robustness and Sensitivity Analyses
Multi-specification robustness.
Table 10 reports Model C estimates across four DV transformations. Physical Opportunity and the cognitive-capacity proxy remain the only consistent predictors across all specifications: Physical Opportunity is significant in raw and winsorized specifications, while the cognitive-capacity proxy is significant in all four specifications (
in three of four).
Quantile regression.
Table 11 reports quantile regression estimates for the five-dimensional model across five quantiles. Physical Opportunity remained significant across all examined quantiles (
). The cognitive-capacity proxy was significant from
to
(
) and remained marginally significant at
(
). This pattern demonstrates that their effects are not localized to specific distributional regions, though the cognitive-capacity proxy weakens at the upper tail.
The quantile regression coefficient trajectories showed that the cognitive-capacity proxy exhibited consistently negative coefficients across all quantiles (aligning with its zero-order correlation of
), while Physical Opportunity showed consistently positive coefficients throughout the distributional range. This distributional consistency supports interpreting these as consistent associations across the distribution rather than dependence on a single parametric specification. Coefficient estimates are reported in
Table 11.
Sensitivity analyses. Six alternative specifications tested the robustness of the cognitive-capacity coefficient: (1) full five-dimensional model, (2) omitting Motivation, (3) omitting Social Opportunity, (4) omitting Physical Opportunity, (5) omitting Behavioral Ability, and (6) a parsimonious two-predictor model (Physical Opportunity + cognitive-capacity proxy only). In all six specifications, the cognitive-capacity proxy remained significant at . The most notable result is specification (6): Physical Opportunity and the cognitive-capacity proxy alone achieved , accounting for nearly all of the variance explained by the full model.
Coefficient-stability interpretation. The OLS, raw-waste, winsorized, logistic, and quantile specifications all point in the same substantive direction: higher Physical Opportunity constraint is associated with more plate waste, while higher cognition-related capacity is associated with less plate waste. This convergence addresses the reviewer concern that Model C coefficients should not be presented as straightforward evidence. We therefore treat the pattern as robust association in this sample, not as a causal demonstration of direct mechanisms.
3.3. Cross-Level Synthesis: Structural Context and Refined Individual Mechanisms
Structural embeddedness (from Part 1). At the cross-national level, economic development, infrastructure quality, and regional location systematically differentiate organic waste composition. The strong bivariate correlations (, ) and significant regional ANOVA (, ) establish that structural factors shape aggregate waste patterns, providing contextual framing for interpreting individual-level behavior.
Enhanced MOA predictive power (from Part 2). Within the constrained environment of a university cafeteria, the refined five-dimensional MOA model explained 44.1% of variance in objectively measured plate waste (, Adj. ), compared to a non-significant 4.1% for the conventional three-dimensional model. This improvement is attributable primarily to the addition of Physical Opportunity and the cognitive-capacity proxy, which jointly account for most explained MOA variance in the Johnson RWA decomposition. The two cognition-related indicators demonstrated robust negative associations across specifications, but they should be interpreted as separate indicators rather than as a validated latent cognitive-ability scale.
Cross-level synthesis: structural context and individual-level mechanisms. Both layers point to the relevance of structural and environmental factors, but they are not integrated in a formal multilevel model. Part 1 shows that macro-level structural variables (GDP, governance, infrastructure) have the strongest associations with aggregate waste outcomes and therefore provide contextual grounding. Part 2 reveals that the micro-level predictors accounting for the most variance are Physical Opportunity (environmental constraints) and cognition-related indicators (knowledge-related capacities). Motivation, despite being the primary target of many food waste interventions, is compromised by ceiling effects that render it ineffective for differentiation. Taken together, the evidence supports a cautious structure-oriented interpretation: food waste in institutional dining appears to be associated with structural conditions, within which individual cognitive-related capacity retains meaningful predictive validity.
4. Discussion
4.1. Summary of Findings
The dual-layer evidence indicates that dimensional refinement can substantially improve the empirical performance of the MOA framework for food waste behavior in this context, while remaining exploratory. At the macro level, structural factors—economic development (), governance quality (–), and regional location (, )—differentiate national organic waste composition and provide contextual grounding rather than direct micro-level predictors. The main behavioral inference therefore comes from the micro-level cafeteria data. At this level, the conventional three-dimensional aggregate MOA model failed to reach significance (, ), while the refined five-dimensional model explained 44.1% of variance in objectively measured plate waste (, Adj. , , ). The improvement was driven primarily by Physical Opportunity and cognition-related indicators, but this pattern is interpreted as preliminary association rather than validation of a new MOA structure.
4.2. From “MOA Fails” to “MOA Was Under-Specified” (Theory Layer)
Prior applications of MOA to food waste have yielded inconsistent results, with some studies reporting significant effects on self-reported intentions [
24,
29] and others finding weak or null associations with objectively measured behavior [
8,
17]. These findings have sometimes been interpreted as evidence that aggregate MOA measures perform poorly in institutional settings where structural constraints override individual dispositions [
30].
Our results qualify this interpretation. The framework’s limited explanatory power may reflect under-specification in measurement rather than a limitation of the framework itself. When Opportunity was decomposed into Social and Physical components, and Ability into Behavioral Ability and a two-item cognitive-capacity proxy, the model’s explanatory power increased substantially. This finding redirects theoretical attention from whether MOA applies to institutional food waste, to which components of MOA matter under structural constraints. It should nevertheless be read as preliminary evidence from two campuses rather than as definitive theoretical validation.
The theoretical implication is that Physical Opportunity and cognition-related indicators may represent mechanisms that are conflated—and thus obscured—in conventional aggregate MOA measurement. Physical Opportunity captures perceived environmental affordances (crowding, seating, serving infrastructure) that may enable or constrain waste reduction behavior, independent of social norms. The two cognition-related indicators capture information-processing capacities (nutritional knowledge, portion estimation) that may help individuals translate motivation into effective action. Because the present design is observational and cross-sectional, these mechanisms are interpreted as plausible pathways rather than demonstrated causal processes.
4.3. Collinearity, Measurement Overlap, and Coefficient Interpretation (Measurement Layer)
The revised regression results show no positive cognitive-capacity coefficient in Model C. The cognitive-capacity proxy is negatively correlated with waste at the zero-order level () and remains negative in the five-dimensional OLS model (, ).
Nevertheless, reviewer concerns about suppression and conceptual overlap remain important. Physical Opportunity and the cognitive-capacity proxy are strongly negatively correlated (), meaning that the two constructs are empirically entangled. The OLS estimates, complete-case sensitivity analyses, MICE sensitivity analysis, and quantile regressions all retain the same substantive signs: Physical Opportunity is positively associated with waste, while the cognitive-capacity proxy is negatively associated with waste.
The item-level Model D provides additional nuance: A4c (nutrition knowledge) shows a strong negative coefficient (, ), and A3c (portion estimation) also shows a smaller negative coefficient (, ). This supports the decision to retain the composite only for comparability with the five-dimensional MOA specification while interpreting the two cognition-related indicators separately.
The strong negative correlation between Physical Opportunity and the cognitive-capacity proxy itself warrants theoretical attention. It may reflect: (a) a genuine contextual pattern in which constrained dining settings inhibit the use of knowledge; (b) a compositional effect where students with different characteristics self-select into different dining environments; (c) overlap in the way respondents evaluate their cafeteria experience; or (d) limitations in the two-item cognitive-capacity proxy measure. Disentangling these explanations requires longitudinal, experimental, or multilevel designs.
The implication for interpretation is that Model C coefficients should be treated as associational estimates within a small, cross-sectional sample. They are useful for identifying stable predictive patterns, but they do not establish that physical opportunity or cognition-related capacity causally drives plate waste.
4.4. Physical Opportunity as a Formative Construct: Theoretical and Methodological Implications
The low internal consistency of Physical Opportunity (
) raises legitimate concerns about construct validity. However, this low reliability is theoretically expected for a formative index [
37,
38]. The five physical environment items—crowding, seating availability, hygiene conditions, tray capacity, and dish variety—represent distinct, non-interchangeable environmental affordances. Expecting high inter-item correlation is equivalent to expecting that a crowded cafeteria will necessarily have poor hygiene or inappropriate tray sizes—a conflation of distinct structural features.
The formative treatment has two important consequences. First, traditional scale purification procedures (dropping items that reduce
) are inappropriate for formative indices, as each item captures a unique aspect of the construct. Second, the predictive validity of Physical Opportunity (RWA = 51.1% of explained MOA variance; zero-order
with waste) provides nomological evidence, but it does not replace content validation. We therefore added a content-domain mapping audit (
Appendix A Table A2) to make the theoretical coverage explicit, while acknowledging that formal independent expert CVI was not conducted. Future research should consider alternative validation strategies for formative constructs, including: (a) expert-judged content validity, (b) convergent validity with objective environmental measures, and (c) structural equation modeling with formative measurement specifications.
4.5. Motivation Ceiling Effects: Attitudinal Saturation in Chinese University Contexts
Four of five Motivation items exhibited severe ceiling effects (means on a 5-point scale), reflecting a substantively important phenomenon: China’s extensive “Clean Plate” campaigns may have contributed to high stated anti-waste attitudes, while actual waste behavior remains variable. This attitudinal saturation is not merely a measurement nuisance—it represents a genuine ceiling in the effectiveness of motivation-centered interventions.
The RWA finding that Motivation contributes less than 1% of explained MOA variance, despite its theoretical centrality in the MOA framework, is consistent with this interpretation. At the scale level, 55.3% of respondents scored at or above 4.0 and 25.9% at or above 4.5, while motivation showed near-zero correlation with waste (, ) and no significant difference across motivation groups (Kruskal–Wallis ). When most students agree that wasting food is wrong, additional moral appeals may yield limited marginal gains in this particular high-awareness sample. This pattern should not be read as evidence that motivation is generally unimportant; in populations with lower baseline awareness or wider motivational variation, motivation may play a stronger differentiating role.
4.6. Tentative Implications for Intervention Design
The micro-level evidence suggests three potential intervention directions for future testing in comparable cafeteria settings. Because the study is cross-sectional, these directions should be interpreted as hypotheses for intervention trials rather than as demonstrated causal effects.
Physical-environment redesign. Physical Opportunity is the largest contributor to explained MOA variance (RWA = 51.1%) and shows the strongest zero-order correlation with waste (
). The specific items in this dimension—crowding, seating, and serving infrastructure—suggest candidate intervention entry points: reducing peak-hour crowding, ensuring adequate seating, and redesigning serving systems to allow portion flexibility. These directions are consistent with field experimental evidence that portion-size changes can reduce waste [
44], but they still require direct testing in the present type of university cafeteria setting.
Cognitive-capacity support. The cognition-related indicators show consistent negative associations across specifications. Their two constituent items—portion estimation and nutrition knowledge—suggest that educational tools targeting accurate self-assessment of food needs and nutritional literacy are plausible candidates for future testing. The two-item composite is interpreted as a cognitive-capacity proxy rather than a validated reflective construct, given its two-item structure and low inter-item correlation ().
Motivation as a necessary but saturated condition in this sample. The ceiling effects and very small RWA contribution suggest that motivation functions as a background precondition rather than an active differentiator in this sample. Students are already highly motivated; what varies is their Physical Opportunity to act on that motivation and their cognitive-capacity proxy. Future intervention studies in similar high-awareness settings may therefore test motivation maintenance as a baseline component while focusing experimental variation on physical-environment and cognitive-capacity supports.
4.7. Alternative Explanations and Unmeasured Contextual Factors
Several alternative explanations should be considered before translating these associations into interventions. First, hunger level, prior snacking, meal price, food palatability, and menu-specific preferences may affect both portion choice and leftovers but were not directly measured. Second, meal period and time pressure may confound perceived crowding with students’ ability to finish meals. Third, campus-specific serving practices, portion defaults, and cafeteria pricing rules may shape both Physical Opportunity perceptions and observed waste. Because these variables were not measured in the present protocol, we do not introduce post hoc analyses without observed measures; instead, we explicitly frame the findings as context-specific associations and identify these omitted variables as priorities for future cafeteria-level research.
4.8. Limitations
Five limitations warrant explicit acknowledgment.
Two-institution, cross-sectional design. Data were collected from two ordinary higher education institutions in one northern and one southern Chinese province (), with a single plate-waste measurement per student. This design cannot separate trait-like dispositional effects from state-like situational fluctuations and cannot support national or cross-cultural generalization. Broader multi-institution replication with repeated measures is essential before generalizing beyond this context.
Construct overlap and coefficient interpretation. Although Model C does not show a cognitive-capacity-proxy sign reversal, the strong correlation between Physical Opportunity and the cognitive-capacity proxy introduces uncertainty about conceptual overlap and shared variance. Definitive separation of direct and indirect effects requires SEM, path modeling, experimental manipulation, or instrumental variable approaches.
Formative construct validation. The low for Physical Opportunity, while theoretically expected for a formative index, limits the strength of claims about this dimension. The added content-domain mapping audit improves transparency about item coverage, but it is not equivalent to external validation through formal independent expert CVI or objective cafeteria-environment measures. Future research should validate the formative structure using objective environmental observation, expert content-validity ratings, and structural equation modeling with formative indicators.
Cognitive-capacity proxy indicator. The two items forming the cognitive-capacity proxy showed near-zero correlation (), indicating they capture distinct cognitive domains rather than a unitary construct. The composite score may obscure differential mechanisms even though both items were negatively associated with waste in Model D. Future research should use comprehensive, objective cognitive assessments.
Missing campus-level structural variables. Although Physical Opportunity captures perceived environmental constraints, the study did not measure objective cafeteria-level variables (portion sizes, menu design, serving systems, pricing mechanisms). This limits the precision of structural intervention recommendations, which would benefit from direct observation of the environmental features that Physical Opportunity items proxy.
Additionally, the macro-level estimates remain associational; MICE does not transform correlation into causation, and WGI dimensions are highly correlated with GDP (), introducing multicollinearity in multivariate models.
5. Conclusions
This study employed a dual-layer analytical framework to examine food waste as a sustainability challenge of responsible consumption and institutional resource governance, combining cross-national structural analysis (Part 1, ) with campus-level primary MOA analysis (Part 2, across two ordinary higher education institutions in northern and southern China). The main empirical pattern is that a more granular MOA operationalization performs better than the conventional aggregate specification in this sample: the conventional three-dimensional aggregate model explained a non-significant 4.1% of variance in objectively measured plate waste, while the refined five-dimensional model—distinguishing Physical Opportunity and a two-item cognitive-capacity proxy from their aggregate counterparts—explained 44.1%.
5.1. Theoretical Contributions
The study makes three cautious theoretical contributions. First, it suggests that the limited performance reported in some institutional food waste studies may reflect measurement under-specification rather than theoretical inadequacy. When Physical Opportunity and a cognitive-capacity proxy are added to the model, explanatory power increases substantially—a finding that qualifies the interpretation that aggregate MOA measures perform poorly in structurally constrained settings, but does not by itself validate a new theoretical structure.
Second, it identifies Physical Opportunity and cognition-related indicators as the largest contributors to explained MOA variance in the RWA decomposition, while Motivation contributes little once ceiling effects are considered in this high-motivation sample. This asymmetry redirects theoretical attention from attitudinal variables to environmental design and capability development as candidate behavioral levers in institutional dining, but it does not imply that motivation is generally unimportant across populations or contexts.
Third, it documents a strong association between Physical Opportunity and the cognitive-capacity proxy that has both methodological and substantive implications. The zero-order correlation for the proxy () and the partial coefficient () both indicate that students with greater cognitive-related capacity waste less overall. This finding cautions against interpreting any single model coefficient in isolation when predictors are substantially correlated.
5.2. Practical Implications
The evidence suggests three tentative directions for future intervention testing in comparable cafeteria settings. Physical-environment redesign—addressing crowding, seating, and serving infrastructure—is a candidate pathway suggested by the micro-level Physical Opportunity associations. Cognition-related capability development—nutrition education and portion-estimation training—is also suggested by the large relative-weight contribution of the cognition-related indicators, but should be tested with more comprehensive and objective measures. Motivation maintenance, rather than additional motivation enhancement alone, may be appropriate in high-awareness student populations; this conclusion should not be generalized to contexts with lower baseline anti-waste motivation. From a sustainability perspective, these implications indicate that university food-waste reduction may require coordinated changes in infrastructure, behavioral capability, and operational governance, rather than relying only on awareness campaigns.
5.3. Limitations and Future Directions
Five limitations warrant emphasis. Two-institution, cross-sectional design: the micro-level study covered two purposively selected ordinary higher education institutions (), with one observation per student; it cannot separate trait from state effects or support national or cross-cultural generalization. Macro–micro linkage: the cross-national analysis provides structural context but is not statistically linked to the student-level model; the main behavioral inference is therefore micro-level and context-specific. Construct-overlap ambiguity: the strong correlation between Physical Opportunity and the cognitive-capacity proxy introduces interpretive uncertainty; SEM, path modeling, or experimental manipulation is needed for definitive separation of pathways. Formative construct validation: Physical Opportunity’s low (0.101) is expected for a formative index; the added content-domain mapping audit improves transparency but formal expert CVI and objective environmental validation remain necessary. Cognitive-capacity proxy: the two items measure distinct domains (portion estimation vs. nutrition knowledge); future research should employ comprehensive objective assessments. No campus structural variables: portion sizes, menu design, and serving systems were not directly measured, limiting the precision of structural intervention recommendations.
Future research should pursue three directions. Enhanced measurement: expand the cognitive-capacity battery with objective tests, validate Physical Opportunity against observational measures, and replace self-report Motivation with behavioral indicators. Repeated behavioral measures: collect multiple plate-waste observations per participant to reduce situational noise (CV = 128.7%). Formal multilevel design: collect institution-level variables (cafeteria type, meal plan structure, serving systems) and model them as Level-2 predictors, thereby moving beyond the contextual linking used in the present study.
5.4. Closing
Food waste in institutional dining may be better understood as a structurally conditioned behavior, within which cognition-related indicators retain meaningful predictive validity in this sample. The findings suggest that future intervention studies should test whether motivation-based messages can be complemented by environmental design and capacity-building approaches that help students act on the motivation they already possess. In this sense, the study contributes to the sustainability agenda by translating food-waste reduction from a general normative goal into measurable, behaviorally informed, and institutionally actionable pathways for reducing avoidable resource loss in campus dining systems.